Embed Size (px)
Citation preview
ENERGY EFFICIENCY BENCHMARKING STUDY OF FOOD
MANUFACTURING PLANTS IN SINGAPORE
March 2016
Acknowledgements
LJ Energy Pte Ltd would like to thank the ten food manufacturing
companies for participating in this study and for all the assistance provided
during the site data collection process. We also gratefully acknowledge the
guidance, support and leadership provided by the Energy Efficiency and
Conservation Department of the National Environment Agency (NEA).
© Copyright is jointly owned by The National Environment Agency and LJ
Energy Pte Ltd. No part of this publication may be reproduced or
distributed in any form or by any means without the prior written
permission of the copyright owners.
March 2016
For:
Energy Efficiency and Conservation Department
National Environment Agency
Singapore
By:
Block 194 Pandan Loop #06-09 Pantech Business Hub Singapore 128383
i
EXECUTIVE SUMMARY
Project Information
LJ Energy Pte Ltd was appointed by the National Environment Agency
(NEA) Singapore to conduct an Energy Efficiency Benchmarking Study of
Food Manufacturing Plants in Singapore.
Ten food manufacturing plants located in various parts of Singapore
participated in the benchmarking study.
The study involved developing an assessment framework to evaluate the
energy efficiency of major systems and equipment installed in food
manufacturing plants and thereafter conducting level 3 audits for each
individual plant. The audits included on-site measurement of each major
system and equipment to obtain the data and other information required
for execution of the assessment framework.
On conclusion of the level 3 audits, each plant received a customised report.
It included the energy consumption profile for the major systems,
recommendations for energy efficiency improvement, associated savings,
implementation cost for each recommendation, comparison of the energy
performance of major systems with established benchmarks and
assessment of maintenance practices and maturity level of energy
management system.
Main Findings
Natural gas, electricity, diesel and biomass were the main energy sources of
the ten food manufacturing plants. Natural gas accounted for 47% while
electricity, diesel and biomass accounted for 32%, 12% and 9% of the total
energy consumption of the ten plants respectively.
Fuels such as natural gas, diesel and biomass were used by boilers and
process heating systems such as roaster. Electricity was mainly used by
production equipment motors, chilled water systems, refrigeration systems,
compressed air systems and lighting systems.
The energy consumption profile of the ten plants is as follows:
Boilers (59%)
Production equipment motors (15.5%)
Process heating systems (8.5%)
Chilled water systems (3.8%)
Refrigeration systems (2.7%)
ii
Compressed air systems (2.3%)
Lighting (1.7%)
Majority of the boilers were steam boilers, which operated at pressures
ranging from 7 to 16 bar. Most boilers (63%) use natural gas as the fuel,
while diesel (25%) and town gas (12%) were used by the remaining
boilers. The operating thermal efficiency of steam boilers varied from 75 to
83%. The efficiencies of most steam boilers were within the benchmark
range of 79 to 81% except for boilers that operated at relatively low loading
of about 40%.
The operating COPs (coefficient of performance) of chillers varied from 2.61
to 5.27, which were all poorer than the benchmark value of 6.9. This was
mainly due to the age and low cooling capacity of the chillers, low operating
supply temperature and the use of air-cooled chillers. Old and low cooling
capacity (<300 RT) chillers usually have lower efficiencies.
Similarly, the chilled water system efficiency (COP) was also found to be
much lower than the benchmark value due to inefficient chillers, pumps and
cooling towers.
The COPs of refrigeration systems, except for those that were air-cooled or
operating at part-load condition, ranged from 1.2 to 4.0 and were close to
the benchmark values for the respective operating temperatures.
Compressed air systems provided air at 5.5 to 7.5 bar for applications such
as pneumatic controls and actuators while air at 39 bar was supplied for
bottle blowing. Air compressors were mainly the oil-injected type. Some oil-
free compressors were used to avoid product contamination. The specific
power consumption of most oil-injected air compressors were within the
recommended band of benchmark values.
More than 90% of motors used for production equipment were rated at the
IE1 and IE2 efficiency level. Some motors were found to be operating at low
loading.
Lighting illuminance levels were generally higher than the recommended
values. Similarly, the associated lighting power density values were also
higher than the recommended values.
Improvement Measures
Many energy saving opportunities have been identified. If implemented,
these opportunities will yield an annual energy savings of 103.1TJ or 8.2%
of total annual energy consumption. Of the total annual energy savings, 16.4
iii
million kWh (or 59 TJ) of electricity and 44 TJ of fuel savings per year were
identified.
Based on the electricity tariffs and fuel charges incurred by the ten plants,
the potential savings work out to be about $3.5 million of energy cost
savings a year, with an average payback period of 2.9 years.
A summary of the main energy saving opportunities identified are listed
below:
Boiler systems
Reduce amount of excess air supplied to the boiler
Recover heat from flue gas
Reduce boiler operating pressure
Recover condensate
Adopt automatic blowdown system for boilers
Reduce heat losses from boilers and heating equipment
Improve boiler loading
Use heat pumps and solar heaters for hot water applications
Chilled water systems
Increase supply temperature for chillers
Replace air-cooled chillers with water-cooled chillers
Replace chillers with new equipment sized to match the load
Replace inefficient pumps and reduce capacity of pumps
Use variable speed drives (VSD) for cooling tower fans and pumps
Refrigeration systems
Increase suction pressure and reduce condensing pressure for
refrigeration systems
Replace defective refrigeration system controls
Use VSD compressors
Replace inefficient refrigeration systems
Minimise refrigeration load
Use variable speed evaporator fans
Compressed air systems
Rectify compressed air leaks
Reduce compressed air usage
Replace air compressors
Recover compressed air from high pressure bottle blowing process
Production systems
Replace IE1 and IE2 motors with IE3 or IE4 motors
Replace motors operating at low loading with smaller motors
iv
Lighting systems
Replace inefficient lamps
Reduce illuminance levels
Measures have also been identified to improve the energy management and maintenance practices in the ten plants. In addition, the following recommendations were provided:
Facilitate interaction among energy managers to share best practices within the food manufacturing sector;
Prioritise energy management and improve motivation of staff involved in energy management through rewards and recognition;
Develop ability of energy management team to convince top management to invest in energy efficient technologies;
Consider newer technologies and more efficient designs when replacing old equipment; and
Invest resources to identify energy saving opportunities from process
equipment and systems, which account for a significant portion of the
plant’s total energy usage.
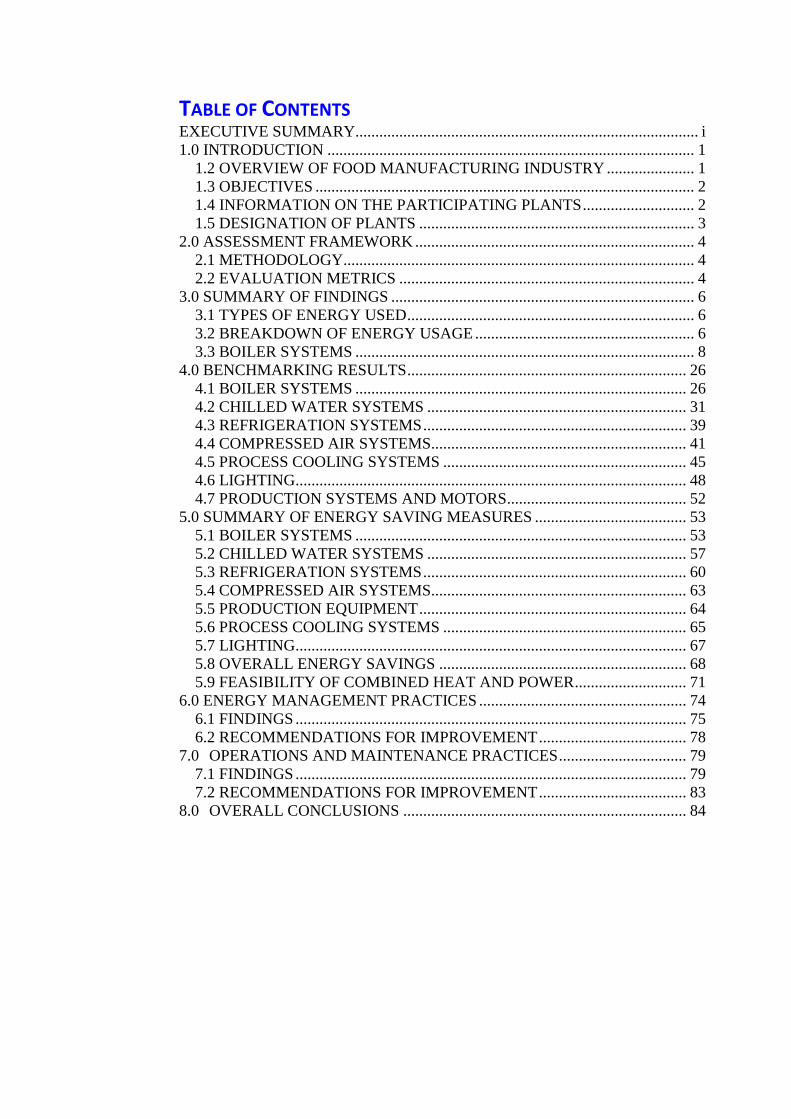
TABLE OF CONTENTS EXECUTIVE SUMMARY...................................................................................... i
1.0 INTRODUCTION ............................................................................................ 1
1.2 OVERVIEW OF FOOD MANUFACTURING INDUSTRY ...................... 1
1.3 OBJECTIVES ............................................................................................... 2
1.4 INFORMATION ON THE PARTICIPATING PLANTS ............................ 2
1.5 DESIGNATION OF PLANTS ..................................................................... 3
2.0 ASSESSMENT FRAMEWORK ...................................................................... 4
2.1 METHODOLOGY........................................................................................ 4
2.2 EVALUATION METRICS .......................................................................... 4
3.0 SUMMARY OF FINDINGS ............................................................................ 6
3.1 TYPES OF ENERGY USED ........................................................................ 6
3.2 BREAKDOWN OF ENERGY USAGE ....................................................... 6
3.3 BOILER SYSTEMS ..................................................................................... 8
4.0 BENCHMARKING RESULTS ...................................................................... 26
4.1 BOILER SYSTEMS ................................................................................... 26
4.2 CHILLED WATER SYSTEMS ................................................................. 31
4.3 REFRIGERATION SYSTEMS .................................................................. 39
4.4 COMPRESSED AIR SYSTEMS................................................................ 41
4.5 PROCESS COOLING SYSTEMS ............................................................. 45
4.6 LIGHTING.................................................................................................. 48
4.7 PRODUCTION SYSTEMS AND MOTORS............................................. 52
5.0 SUMMARY OF ENERGY SAVING MEASURES ...................................... 53
5.1 BOILER SYSTEMS ................................................................................... 53
5.2 CHILLED WATER SYSTEMS ................................................................. 57
5.3 REFRIGERATION SYSTEMS .................................................................. 60
5.4 COMPRESSED AIR SYSTEMS................................................................ 63
5.5 PRODUCTION EQUIPMENT ................................................................... 64
5.6 PROCESS COOLING SYSTEMS ............................................................. 65
5.7 LIGHTING.................................................................................................. 67
5.8 OVERALL ENERGY SAVINGS .............................................................. 68
5.9 FEASIBILITY OF COMBINED HEAT AND POWER ............................ 71
6.0 ENERGY MANAGEMENT PRACTICES .................................................... 74
6.1 FINDINGS .................................................................................................. 75
6.2 RECOMMENDATIONS FOR IMPROVEMENT ..................................... 78
7.0 OPERATIONS AND MAINTENANCE PRACTICES ................................ 79
7.1 FINDINGS .................................................................................................. 79
7.2 RECOMMENDATIONS FOR IMPROVEMENT ..................................... 83
8.0 OVERALL CONCLUSIONS ....................................................................... 84
ENERGY EFFICIENCY BENCHMARKING STUDY OF FOOD MANUFACTURING PLANTS
LJ ENERGY PTE LTD Page 1
1.0 INTRODUCTION
1.1 PROJECT BACKGROUND
LJ Energy Pte Ltd was appointed by National Environment Agency (NEA)
Singapore to conduct an Energy Efficiency Benchmarking Study of Food
Manufacturing Plants in Singapore.
Ten food manufacturing plants are located in various parts of Singapore
participated in the benchmarking study.
The study involved developing an assessment framework to evaluate the
energy efficiency of major systems and equipment installed in food
manufacturing plants and thereafter conducting level 3 audits for each
individual plant. The audits included on-site measurement of each major
system and equipment to obtain the data and other information required
for execution of the assessment framework.
On conclusion of the level 3 audits, each respective plant received a
customised report. The reports included the energy consumption profile for
the main systems, areas identified for improvement of energy efficiency,
associated savings, implementation cost for each recommendation,
comparison of the energy performance of key equipment and systems with
established benchmarks and assessment of maintenance practices and
maturity level of energy management system.
This final report is an aggregation of the main findings and benchmarking
results for all the ten plants. This report also includes a summary of
effective measures to improve energy efficiency in the participating plants,
including identifying major systems and equipment that have a greater
scope for energy efficiency improvement and an assessment of the quantum
of financial investment required to implement the recommendations.
1.2 OVERVIEW OF FOOD MANUFACTURING INDUSTRY
Singapore’s food and beverage manufacturing industry has made great
strides since the country’s independence 50 years ago when food
manufacturers were predominantly domestic-oriented and comprised a
majority of small and medium enterprises (SMEs) as well as family-run
businesses.
Over time, with investment and R&D, these businesses modernised to
increase productivity and produce higher end food products. Now, the food
manufacturing sector is a major contributor to the Singapore economy with
ENERGY EFFICIENCY BENCHMARKING STUDY OF FOOD MANUFACTURING PLANTS
LJ ENERGY PTE LTD Page 2
more than 840 establishments accounting for a value-add of more than $2.8
billion which is a 0.7% of the GDP (ref. Economic Development Board and
Spring Singapore).
Food manufacturing plants are energy-intensive plants and a significant
portion of their operating cost is due to energy use. Therefore, improving
energy efficiency has great potential to reduce the operating cost and
thereby improve the profitability of food manufacturing plants in
Singapore.
To enhance business competitiveness, some food manufacturing plants are
undergoing restructuring. Cost savings achieved through energy efficiency
measures would play a key role in enhancing the competitiveness of the
industry in Singapore.
1.3 OBJECTIVES
The main objectives of the Study were to:
a) develop an energy consumption profile of the food manufacturing
industry by studying the major systems and equipment of each
participating plant
b) identify suitable metrics to assess and benchmark the energy
efficiency of major systems and equipment;
c) assess and benchmark the energy efficiency of major systems and
equipment of participating plants; and
d) identify effective measures to improve the energy efficiency of major
systems and equipment, taking into account factors such as improvement
potential of energy efficiency measures identified and implementation
feasibility and cost.
1.4 INFORMATION ON THE PARTICIPATING PLANTS
To ensure that the findings of the study provide an accurate representation
of food manufacturing plants in Singapore, the participating plants were
selected based on their overall energy consumption and type of energy
consuming equipment and systems installed in their facilities.
Out of the ten plants selected, nine plants have a minimum energy
consumption of 30 TJ per year while the remaining plant has a minimum
energy consumption of 15 TJ per year.
The ten participating plants are involved in manufacturing of either
finished food products or ingredients used in other food manufacturing
ENERGY EFFICIENCY BENCHMARKING STUDY OF FOOD MANUFACTURING PLANTS
LJ ENERGY PTE LTD Page 3
processes. The final food products manufactured by these plants can be
further categorised as beverage, dairy, noodle, cooked food and frozen food.
1.5 DESIGNATION OF PLANTS
To protect the confidentiality of the data, each participating plant has been
assigned an identification number and are denoted as plant-1 to plant-10 in
this report.
The assigned number for each plant is used throughout the report such that
a particular plant denoted as plant-1 is referred to as plant-1 in all charts
and analysis in the report. The assigning of plant numbers is random and
does not infer a ranking of the performance of the plants.
The ten participating food manufacturing plants do not have the same
energy consuming systems. Therefore, the charts only show comparison of
same systems or equipment against the benchmarks. For plants which have
more than one of the same system or equipment and are vastly different
such that the findings cannot be combined, they have been separately
designated (e.g. plant-7(a) and plant-7(b)) in the analysis.
ENERGY EFFICIENCY BENCHMARKING STUDY OF FOOD MANUFACTURING PLANTS
LJ ENERGY PTE LTD Page 4
2.0 ASSESSMENT FRAMEWORK
An Assessment Framework (“AF”) was developed to evaluate the energy
efficiency of major systems and equipment of the plants. The main
objectives of the AF are to:
a) identify major energy consuming systems and equipment that
account for at least 80% of the total primary energy consumption of
each participating plant;
b) identify suitable Energy Performance Indicators (“EnPIs”) for
assessing the energy efficiency of the major energy consuming
systems and equipment;
c) develop suitable methodologies for measuring the identified EnPIs
for the various equipment and systems; and
d) benchmark the performance of the equipment and systems using the
measured EnPIs with industry established values or standards.
2.1 METHODOLOGY
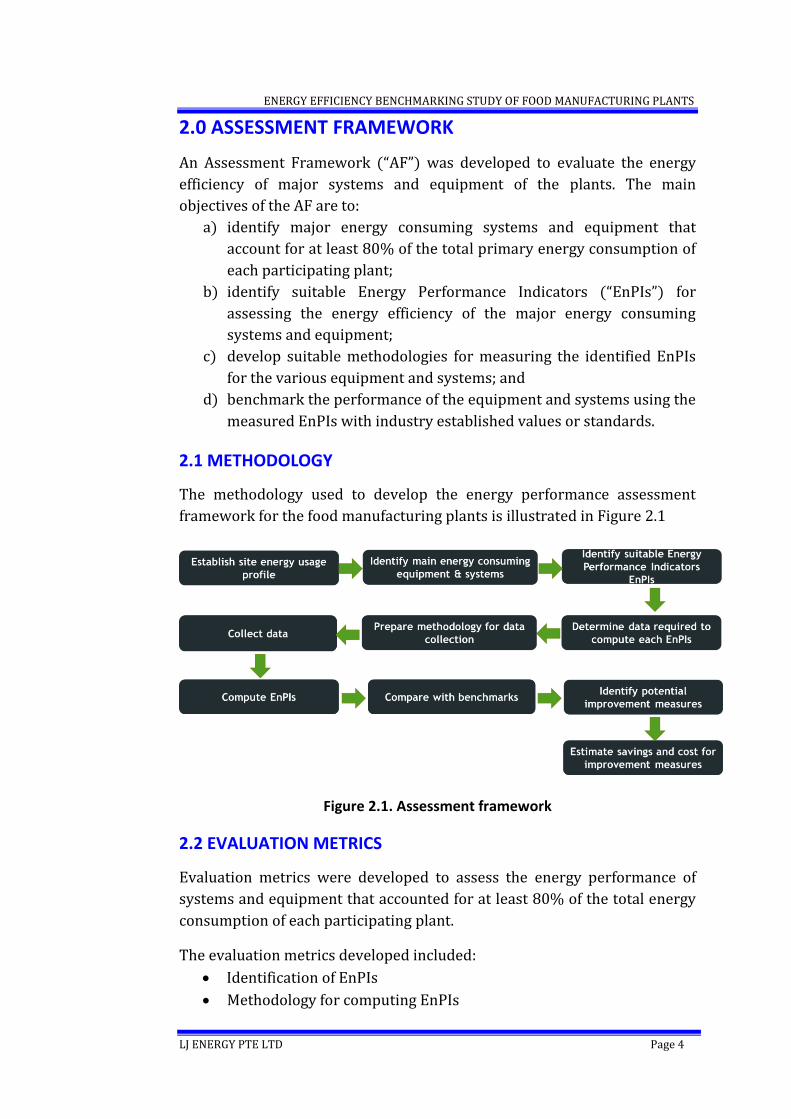
The methodology used to develop the energy performance assessment
framework for the food manufacturing plants is illustrated in Figure 2.1
Figure 2.1. Assessment framework
2.2 EVALUATION METRICS
Evaluation metrics were developed to assess the energy performance of
systems and equipment that accounted for at least 80% of the total energy
consumption of each participating plant.
The evaluation metrics developed included:
Identification of EnPIs
Methodology for computing EnPIs

ENERGY EFFICIENCY BENCHMARKING STUDY OF FOOD MANUFACTURING PLANTS
LJ ENERGY PTE LTD Page 5
Methodology for measurements
Instruments to be used
Accuracy of instruments
Duration of measurements
The detailed Assessment Framework used for the study is published as a
separate document.
ENERGY EFFICIENCY BENCHMARKING STUDY OF FOOD MANUFACTURING PLANTS
LJ ENERGY PTE LTD Page 6
3.0 SUMMARY OF FINDINGS
3.1 TYPES OF ENERGY USED
Food manufacturing plants use energy in the form of electricity, natural gas,
diesel and biomass. Natural gas, diesel and biomass are used by boilers
which produce steam for process requirements. Natural gas is also used by
some process heating systems. Electricity is used mainly by systems such as
production machine motors, chillers, pumps, cooling towers, compressed
air systems and refrigeration systems.
3.2 BREAKDOWN OF ENERGY USAGE
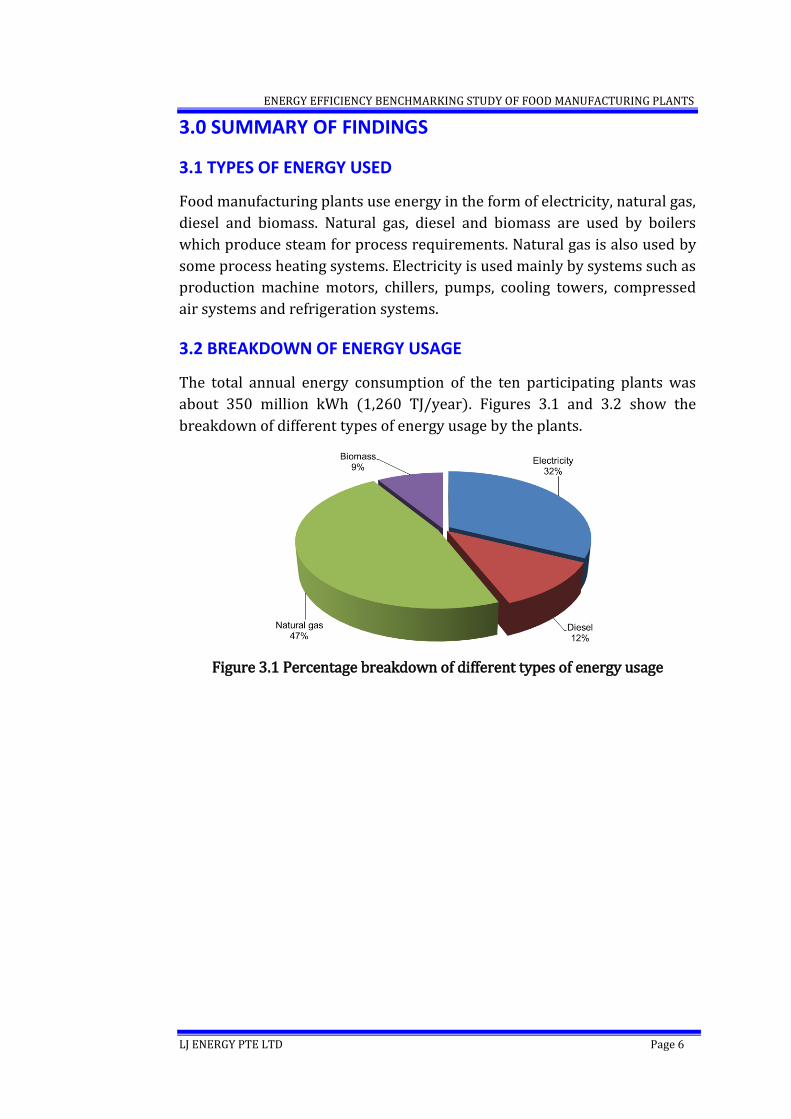
The total annual energy consumption of the ten participating plants was
about 350 million kWh (1,260 TJ/year). Figures 3.1 and 3.2 show the
breakdown of different types of energy usage by the plants.
Figure 3.1 Percentage breakdown of different types of energy usage
ENERGY EFFICIENCY BENCHMARKING STUDY OF FOOD MANUFACTURING PLANTS
LJ ENERGY PTE LTD Page 7
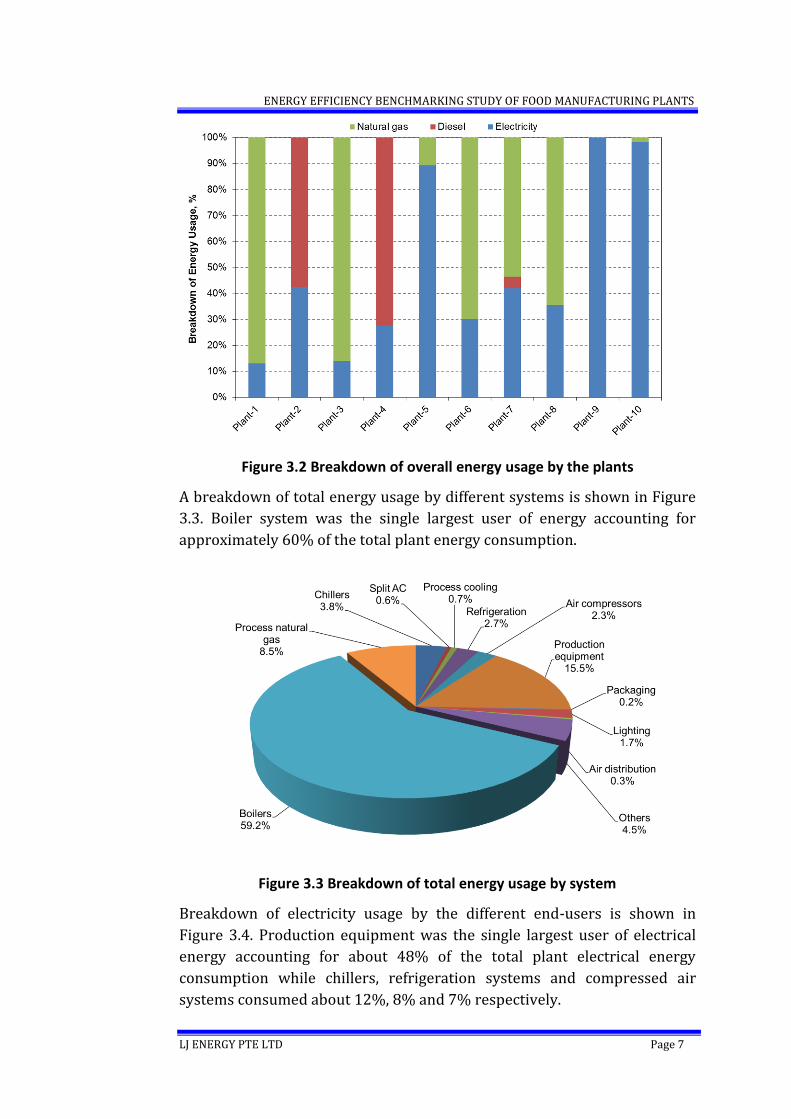
Figure 3.2 Breakdown of overall energy usage by the plants
A breakdown of total energy usage by different systems is shown in Figure
3.3. Boiler system was the single largest user of energy accounting for
approximately 60% of the total plant energy consumption.
Figure 3.3 Breakdown of total energy usage by system
Breakdown of electricity usage by the different end-users is shown in
Figure 3.4. Production equipment was the single largest user of electrical
energy accounting for about 48% of the total plant electrical energy
consumption while chillers, refrigeration systems and compressed air
systems consumed about 12%, 8% and 7% respectively.
ENERGY EFFICIENCY BENCHMARKING STUDY OF FOOD MANUFACTURING PLANTS
LJ ENERGY PTE LTD Page 8
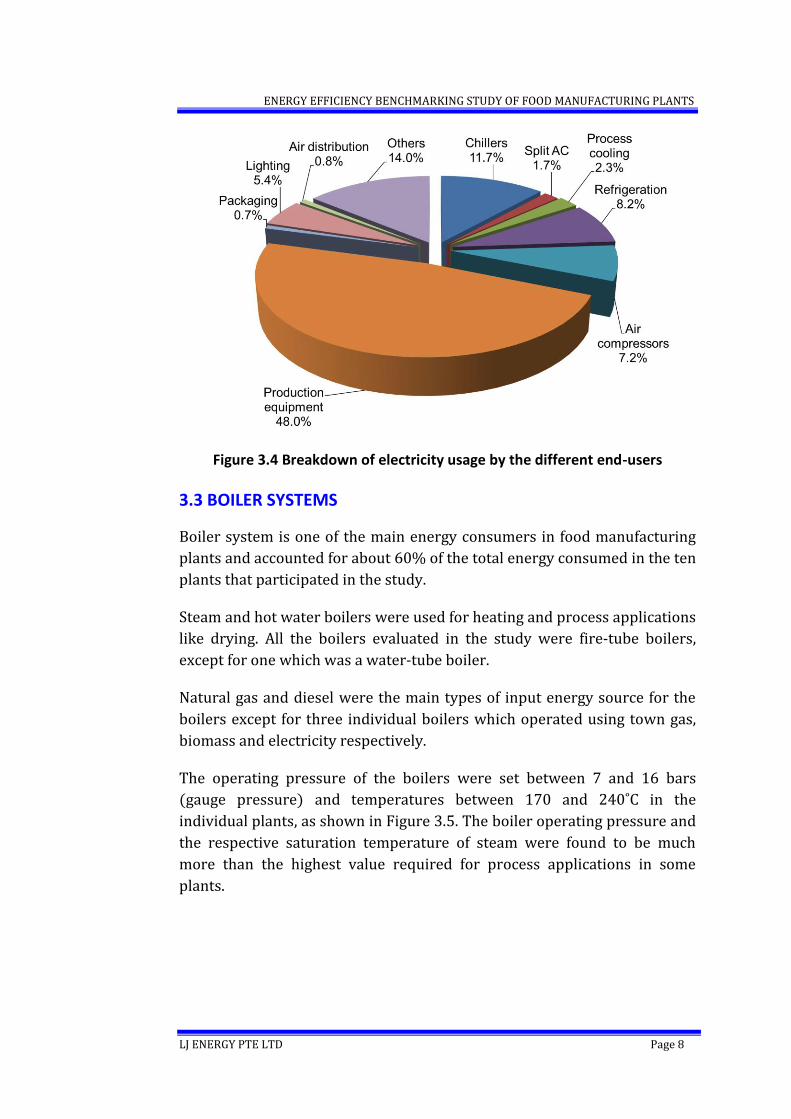
Figure 3.4 Breakdown of electricity usage by the different end-users
3.3 BOILER SYSTEMS
Boiler system is one of the main energy consumers in food manufacturing
plants and accounted for about 60% of the total energy consumed in the ten
plants that participated in the study.
Steam and hot water boilers were used for heating and process applications
like drying. All the boilers evaluated in the study were fire-tube boilers,
except for one which was a water-tube boiler.
Natural gas and diesel were the main types of input energy source for the
boilers except for three individual boilers which operated using town gas,
biomass and electricity respectively.
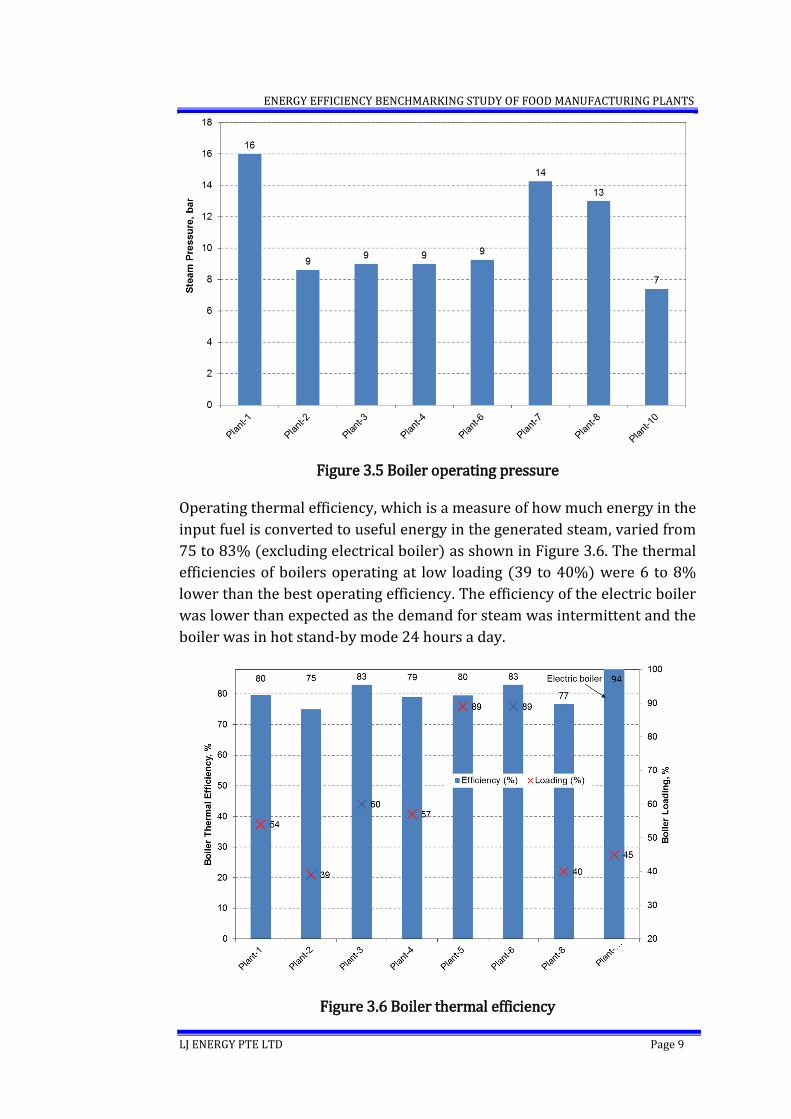
The operating pressure of the boilers were set between 7 and 16 bars
(gauge pressure) and temperatures between 170 and 240˚C in the
individual plants, as shown in Figure 3.5. The boiler operating pressure and
the respective saturation temperature of steam were found to be much
more than the highest value required for process applications in some
plants.
ENERGY EFFICIENCY BENCHMARKING STUDY OF FOOD MANUFACTURING PLANTS
LJ ENERGY PTE LTD Page 9
Figure 3.5 Boiler operating pressure
Operating thermal efficiency, which is a measure of how much energy in the
input fuel is converted to useful energy in the generated steam, varied from
75 to 83% (excluding electrical boiler) as shown in Figure 3.6. The thermal
efficiencies of boilers operating at low loading (39 to 40%) were 6 to 8%
lower than the best operating efficiency. The efficiency of the electric boiler
was lower than expected as the demand for steam was intermittent and the
boiler was in hot stand-by mode 24 hours a day.
Figure 3.6 Boiler thermal efficiency
ENERGY EFFICIENCY BENCHMARKING STUDY OF FOOD MANUFACTURING PLANTS
LJ ENERGY PTE LTD Page 10
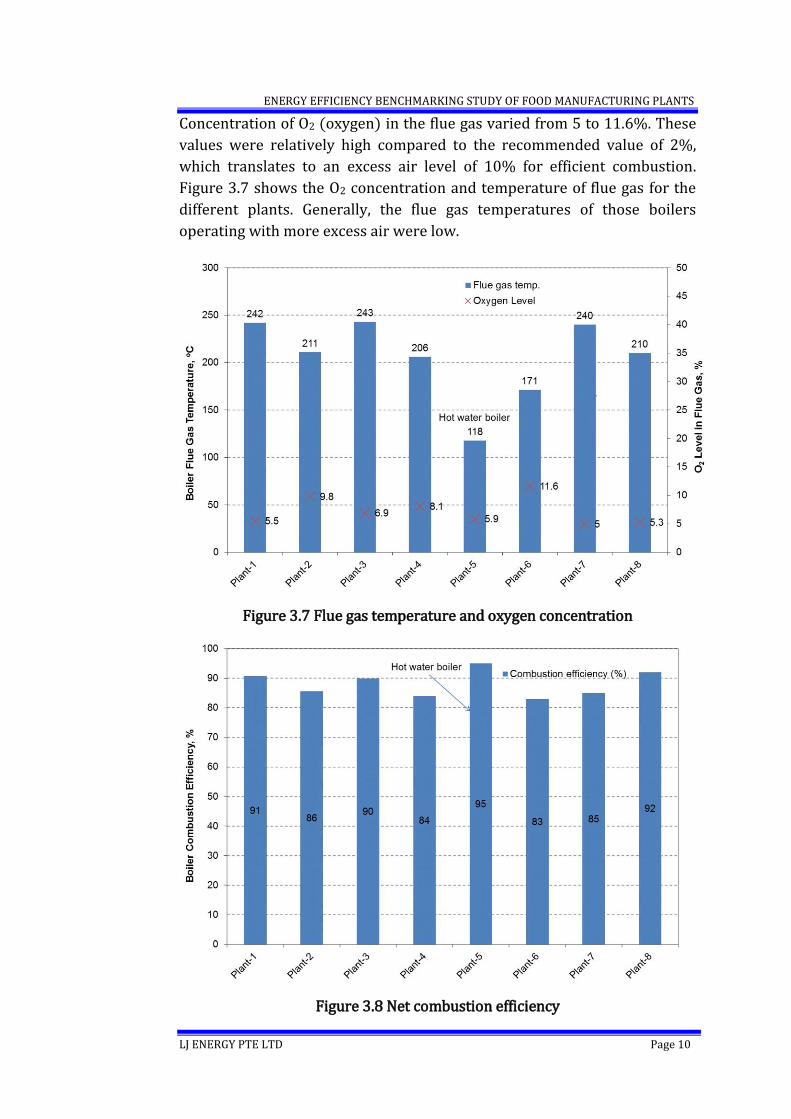
Concentration of O2 (oxygen) in the flue gas varied from 5 to 11.6%. These
values were relatively high compared to the recommended value of 2%,
which translates to an excess air level of 10% for efficient combustion.
Figure 3.7 shows the O2 concentration and temperature of flue gas for the
different plants. Generally, the flue gas temperatures of those boilers
operating with more excess air were low.
Figure 3.7 Flue gas temperature and oxygen concentration
Figure 3.8 Net combustion efficiency
ENERGY EFFICIENCY BENCHMARKING STUDY OF FOOD MANUFACTURING PLANTS
LJ ENERGY PTE LTD Page 11
Only three plants (plants 1, 3 and 4) used economizers to recover heat from
the exhaust flue gas. The net combustion efficiency is a measure of how
much excess air is required by the burner for complete combustion (i.e.
highest efficiency at no excess O2). The combustion efficiencies of the steam
boilers varied from 83 to 92% as shown in Figure 3.8. As expected, the hot
water boiler operated at a better combustion efficiency of 95%.
Only one plant (plant 1) used an automatic blowdown system to maintain
the boiler TDS (total dissolved solids) while all the other plants relied on
periodic manual blowdowns.
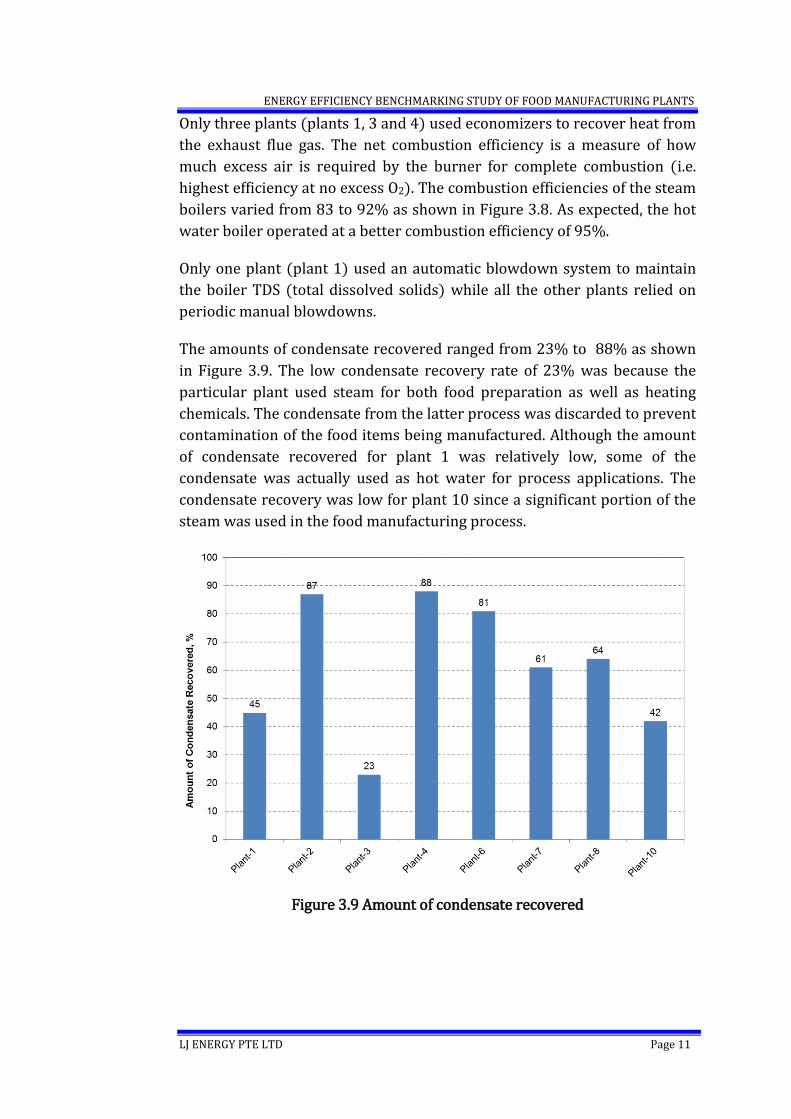
The amounts of condensate recovered ranged from 23% to 88% as shown
in Figure 3.9. The low condensate recovery rate of 23% was because the
particular plant used steam for both food preparation as well as heating
chemicals. The condensate from the latter process was discarded to prevent
contamination of the food items being manufactured. Although the amount
of condensate recovered for plant 1 was relatively low, some of the
condensate was actually used as hot water for process applications. The
condensate recovery was low for plant 10 since a significant portion of the
steam was used in the food manufacturing process.
Figure 3.9 Amount of condensate recovered
ENERGY EFFICIENCY BENCHMARKING STUDY OF FOOD MANUFACTURING PLANTS
LJ ENERGY PTE LTD Page 12
3.4 CHILLED WATER SYSTEMS
Chilled water systems, which accounted for close to 4% of the total energy
consumption and 12% of the electricity consumption, were used in most
plants. Chilled water systems operated 24 hours a day and were used
mainly for process cooling. They were generally more than 10 years old.
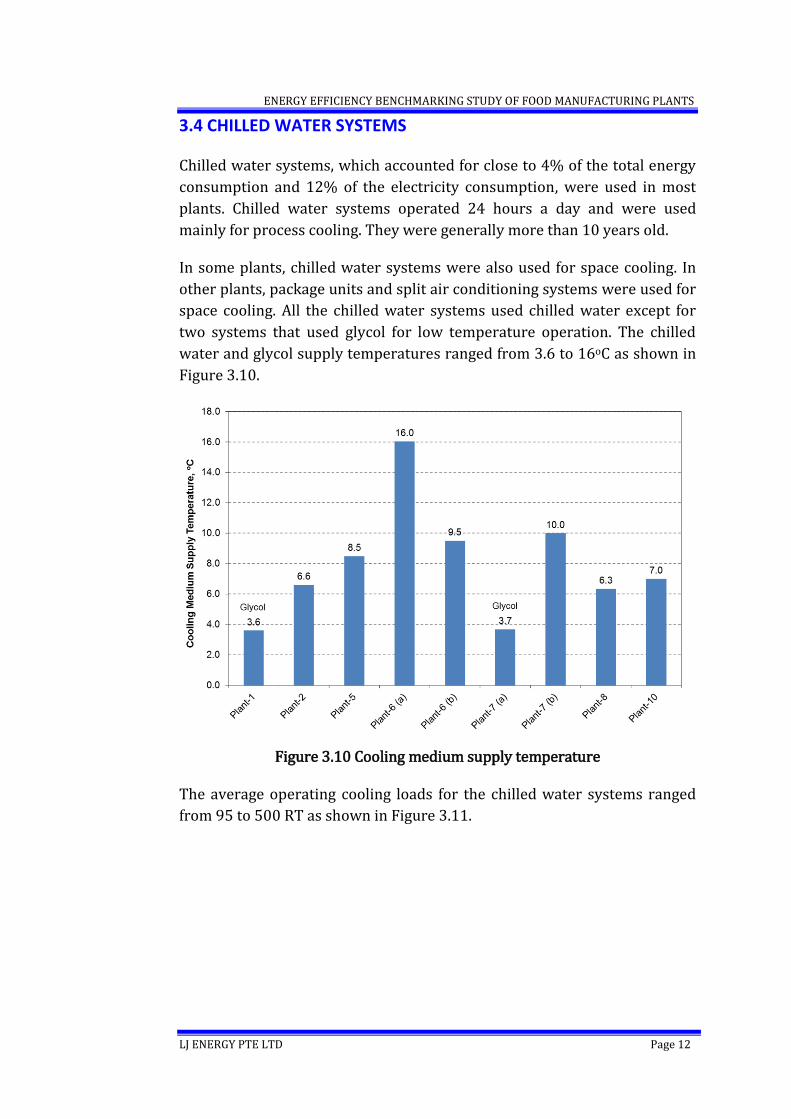
In some plants, chilled water systems were also used for space cooling. In
other plants, package units and split air conditioning systems were used for
space cooling. All the chilled water systems used chilled water except for
two systems that used glycol for low temperature operation. The chilled
water and glycol supply temperatures ranged from 3.6 to 16oC as shown in
Figure 3.10.
Figure 3.10 Cooling medium supply temperature
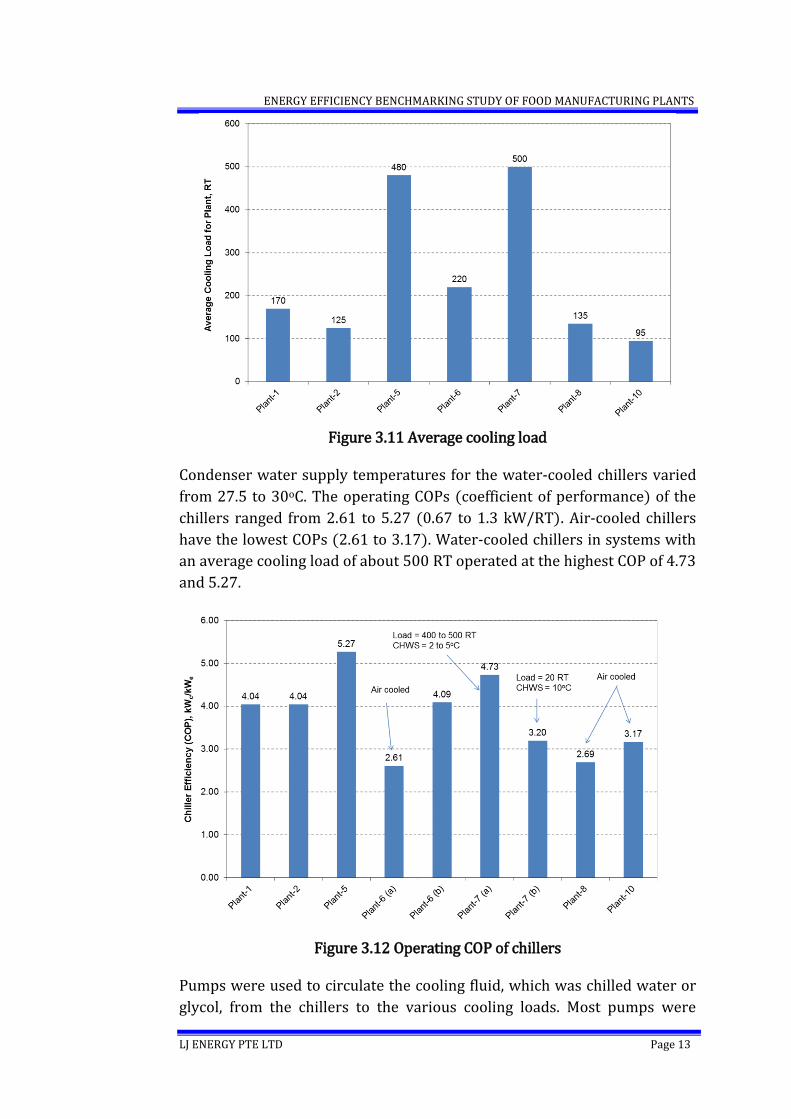
The average operating cooling loads for the chilled water systems ranged
from 95 to 500 RT as shown in Figure 3.11.
ENERGY EFFICIENCY BENCHMARKING STUDY OF FOOD MANUFACTURING PLANTS
LJ ENERGY PTE LTD Page 13
Figure 3.11 Average cooling load
Condenser water supply temperatures for the water-cooled chillers varied
from 27.5 to 30oC. The operating COPs (coefficient of performance) of the
chillers ranged from 2.61 to 5.27 (0.67 to 1.3 kW/RT). Air-cooled chillers
have the lowest COPs (2.61 to 3.17). Water-cooled chillers in systems with
an average cooling load of about 500 RT operated at the highest COP of 4.73
and 5.27.
Figure 3.12 Operating COP of chillers
Pumps were used to circulate the cooling fluid, which was chilled water or
glycol, from the chillers to the various cooling loads. Most pumps were
ENERGY EFFICIENCY BENCHMARKING STUDY OF FOOD MANUFACTURING PLANTS
LJ ENERGY PTE LTD Page 14
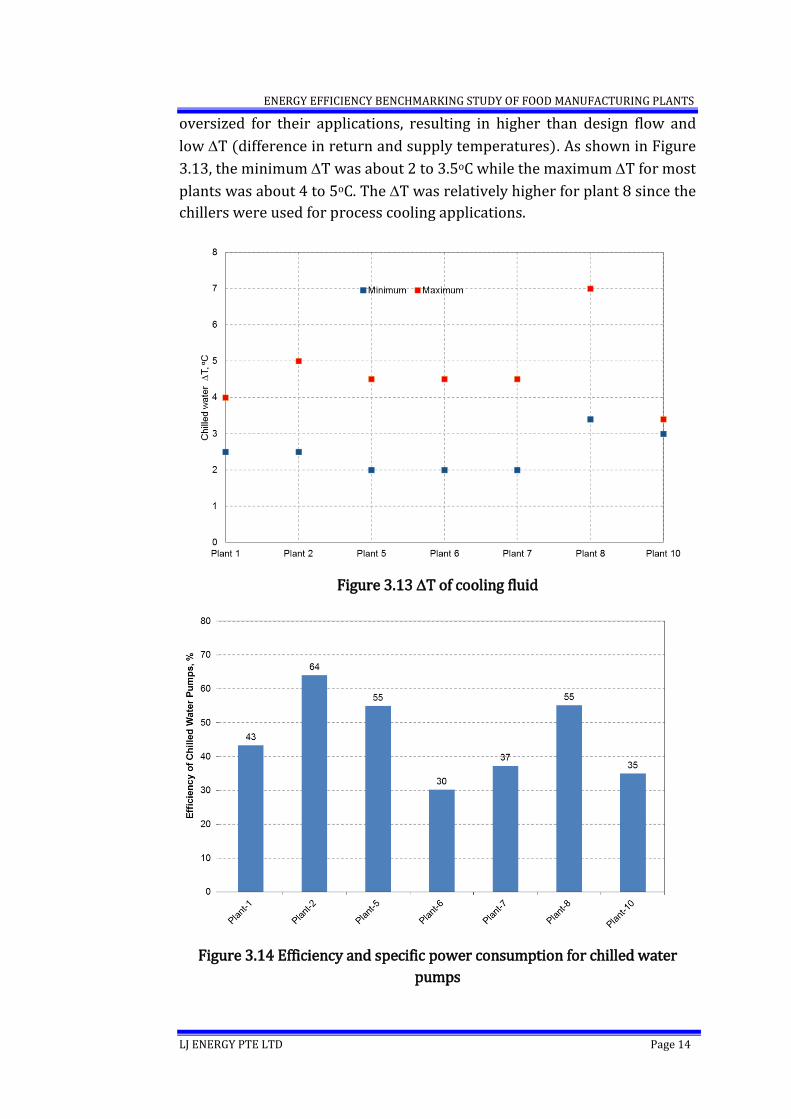
oversized for their applications, resulting in higher than design flow and
low T (difference in return and supply temperatures). As shown in Figure
3.13, the minimum T was about 2 to 3.5oC while the maximum T for most
plants was about 4 to 5oC. The T was relatively higher for plant 8 since the
chillers were used for process cooling applications.
Figure 3.13 T of cooling fluid
Figure 3.14 Efficiency and specific power consumption for chilled water
pumps
ENERGY EFFICIENCY BENCHMARKING STUDY OF FOOD MANUFACTURING PLANTS
LJ ENERGY PTE LTD Page 15
All chilled water pumps operated at constant speed while some pumping
systems have throttling valves to reduce flow. The pump efficiencies
(mechanical output of pump/electrical input to motor) varied from 30 to
64%, as shown in Figure 3.14.
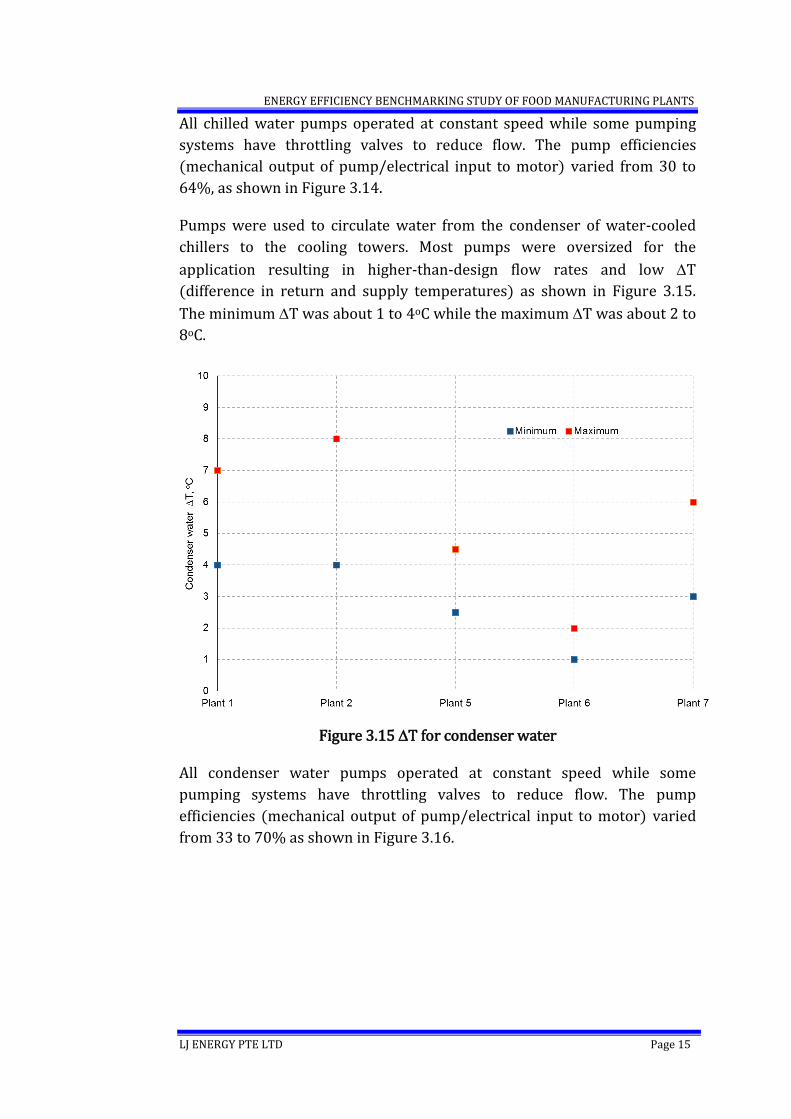
Pumps were used to circulate water from the condenser of water-cooled
chillers to the cooling towers. Most pumps were oversized for the
application resulting in higher-than-design flow rates and low T
(difference in return and supply temperatures) as shown in Figure 3.15.
The minimum T was about 1 to 4oC while the maximum T was about 2 to
8oC.
Figure 3.15 T for condenser water
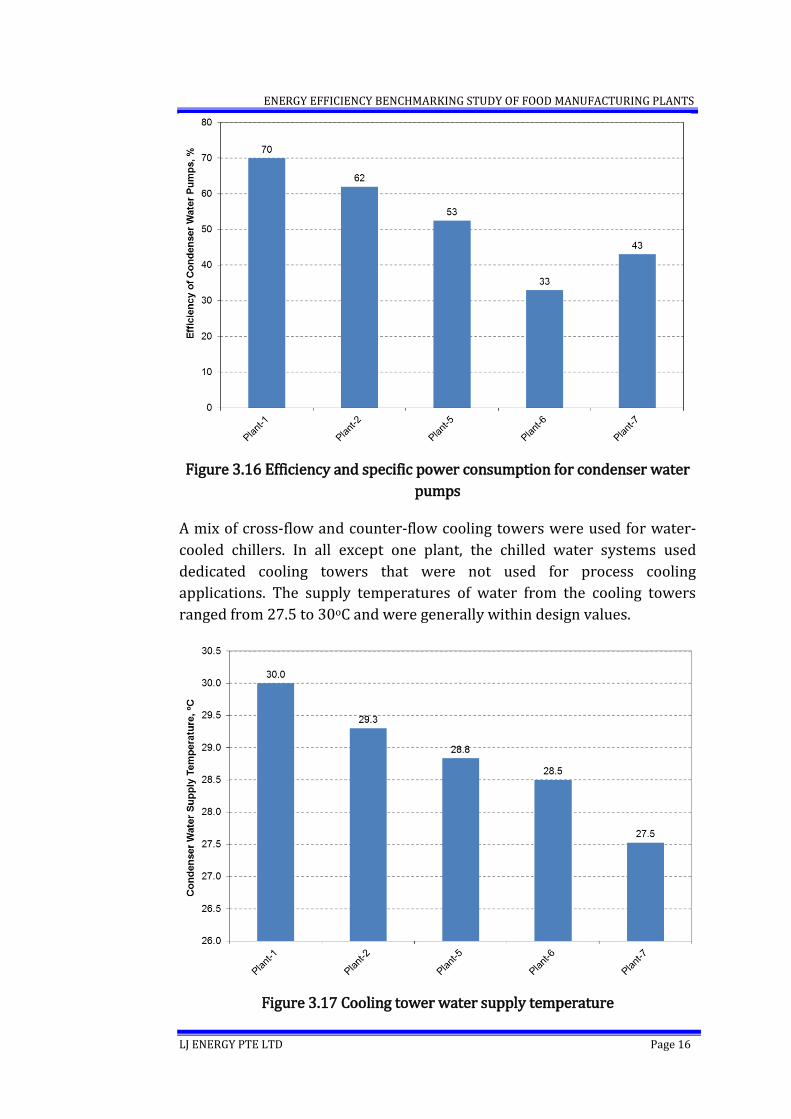
All condenser water pumps operated at constant speed while some
pumping systems have throttling valves to reduce flow. The pump
efficiencies (mechanical output of pump/electrical input to motor) varied
from 33 to 70% as shown in Figure 3.16.
ENERGY EFFICIENCY BENCHMARKING STUDY OF FOOD MANUFACTURING PLANTS
LJ ENERGY PTE LTD Page 16
Figure 3.16 Efficiency and specific power consumption for condenser water
pumps
A mix of cross-flow and counter-flow cooling towers were used for water-
cooled chillers. In all except one plant, the chilled water systems used
dedicated cooling towers that were not used for process cooling
applications. The supply temperatures of water from the cooling towers
ranged from 27.5 to 30oC and were generally within design values.
Figure 3.17 Cooling tower water supply temperature
ENERGY EFFICIENCY BENCHMARKING STUDY OF FOOD MANUFACTURING PLANTS
LJ ENERGY PTE LTD Page 17
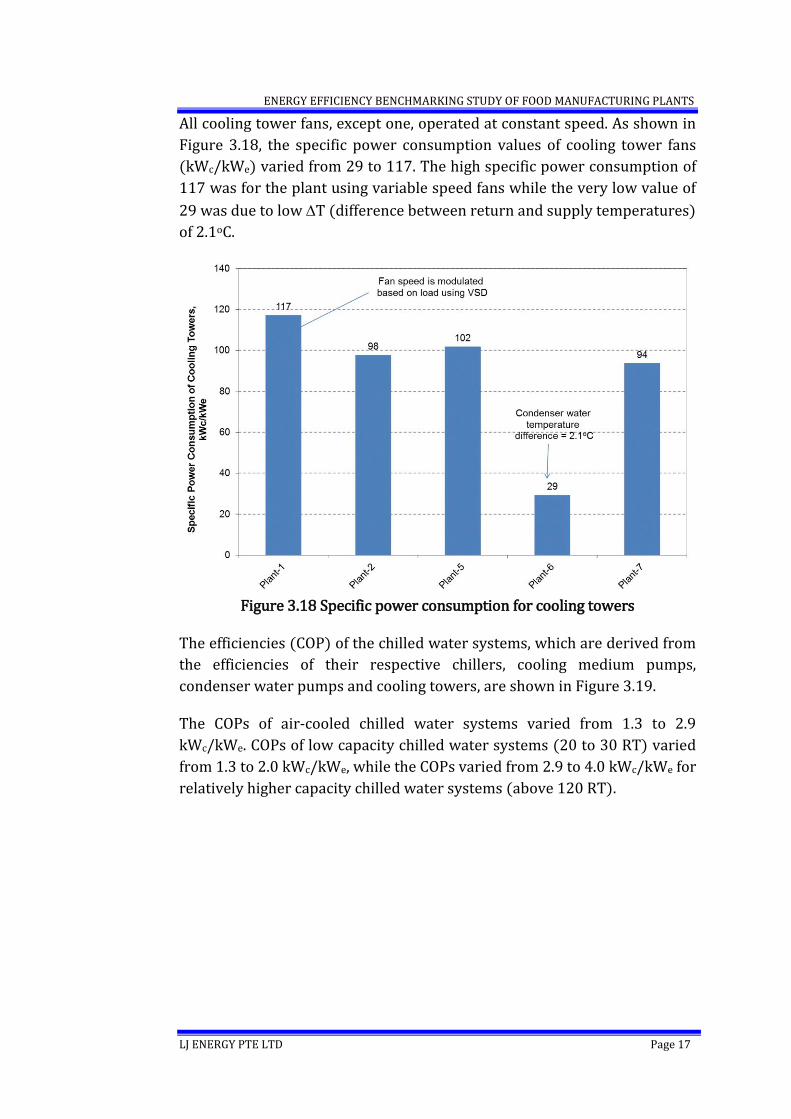
All cooling tower fans, except one, operated at constant speed. As shown in
Figure 3.18, the specific power consumption values of cooling tower fans
(kWc/kWe) varied from 29 to 117. The high specific power consumption of
117 was for the plant using variable speed fans while the very low value of
29 was due to low T (difference between return and supply temperatures)
of 2.1oC.
Figure 3.18 Specific power consumption for cooling towers
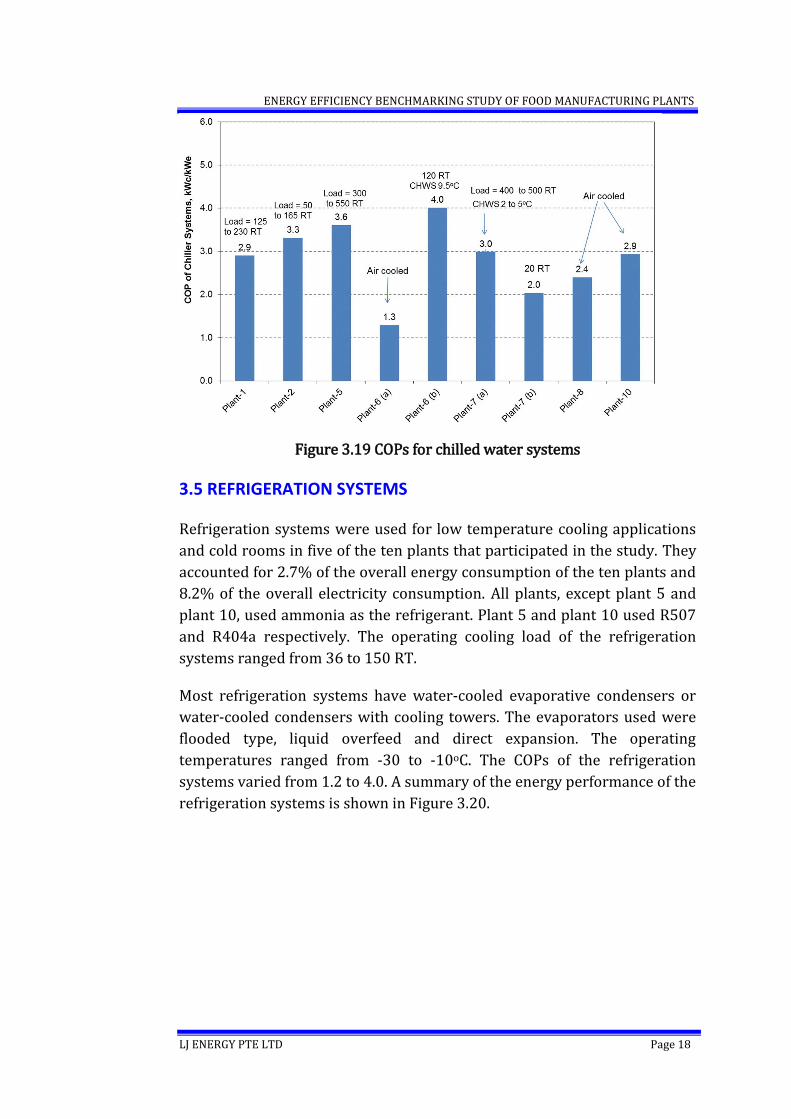
The efficiencies (COP) of the chilled water systems, which are derived from
the efficiencies of their respective chillers, cooling medium pumps,
condenser water pumps and cooling towers, are shown in Figure 3.19.
The COPs of air-cooled chilled water systems varied from 1.3 to 2.9
kWc/kWe. COPs of low capacity chilled water systems (20 to 30 RT) varied
from 1.3 to 2.0 kWc/kWe, while the COPs varied from 2.9 to 4.0 kWc/kWe for
relatively higher capacity chilled water systems (above 120 RT).
ENERGY EFFICIENCY BENCHMARKING STUDY OF FOOD MANUFACTURING PLANTS
LJ ENERGY PTE LTD Page 18
Figure 3.19 COPs for chilled water systems
3.5 REFRIGERATION SYSTEMS
Refrigeration systems were used for low temperature cooling applications
and cold rooms in five of the ten plants that participated in the study. They
accounted for 2.7% of the overall energy consumption of the ten plants and
8.2% of the overall electricity consumption. All plants, except plant 5 and
plant 10, used ammonia as the refrigerant. Plant 5 and plant 10 used R507
and R404a respectively. The operating cooling load of the refrigeration
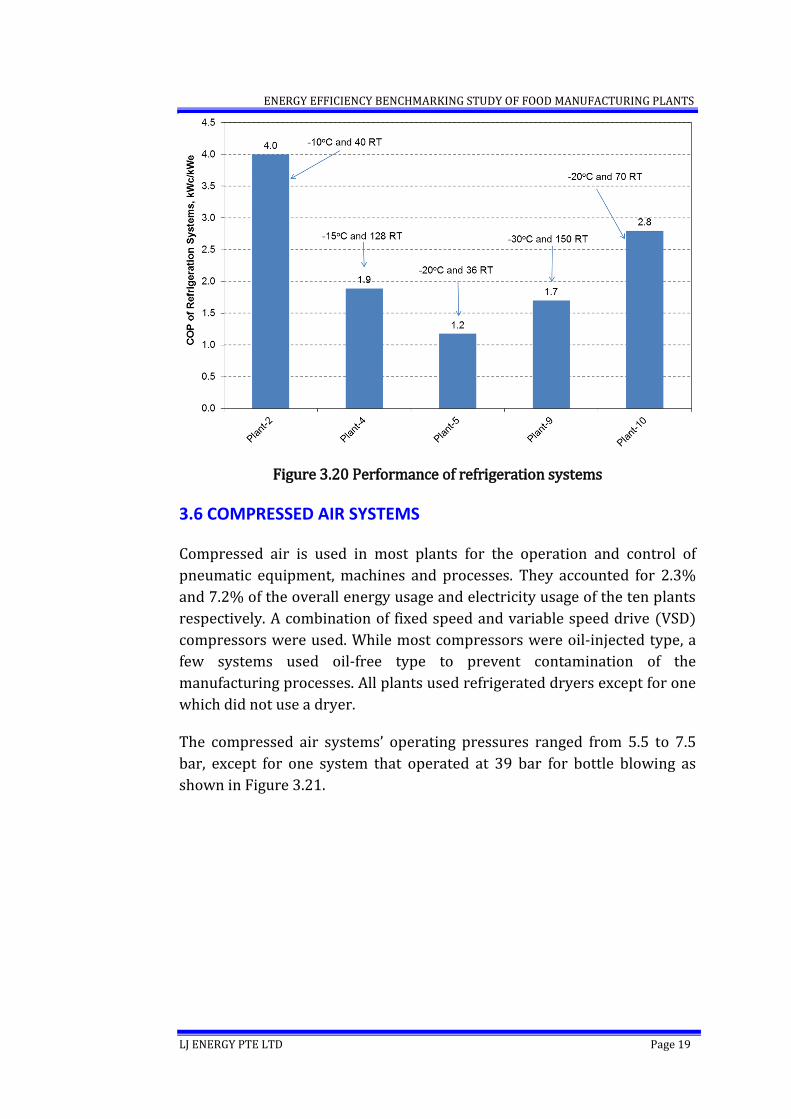
systems ranged from 36 to 150 RT.
Most refrigeration systems have water-cooled evaporative condensers or
water-cooled condensers with cooling towers. The evaporators used were
flooded type, liquid overfeed and direct expansion. The operating
temperatures ranged from -30 to -10oC. The COPs of the refrigeration
systems varied from 1.2 to 4.0. A summary of the energy performance of the
refrigeration systems is shown in Figure 3.20.
ENERGY EFFICIENCY BENCHMARKING STUDY OF FOOD MANUFACTURING PLANTS
LJ ENERGY PTE LTD Page 19
Figure 3.20 Performance of refrigeration systems
3.6 COMPRESSED AIR SYSTEMS
Compressed air is used in most plants for the operation and control of
pneumatic equipment, machines and processes. They accounted for 2.3%
and 7.2% of the overall energy usage and electricity usage of the ten plants
respectively. A combination of fixed speed and variable speed drive (VSD)
compressors were used. While most compressors were oil-injected type, a
few systems used oil-free type to prevent contamination of the
manufacturing processes. All plants used refrigerated dryers except for one
which did not use a dryer.
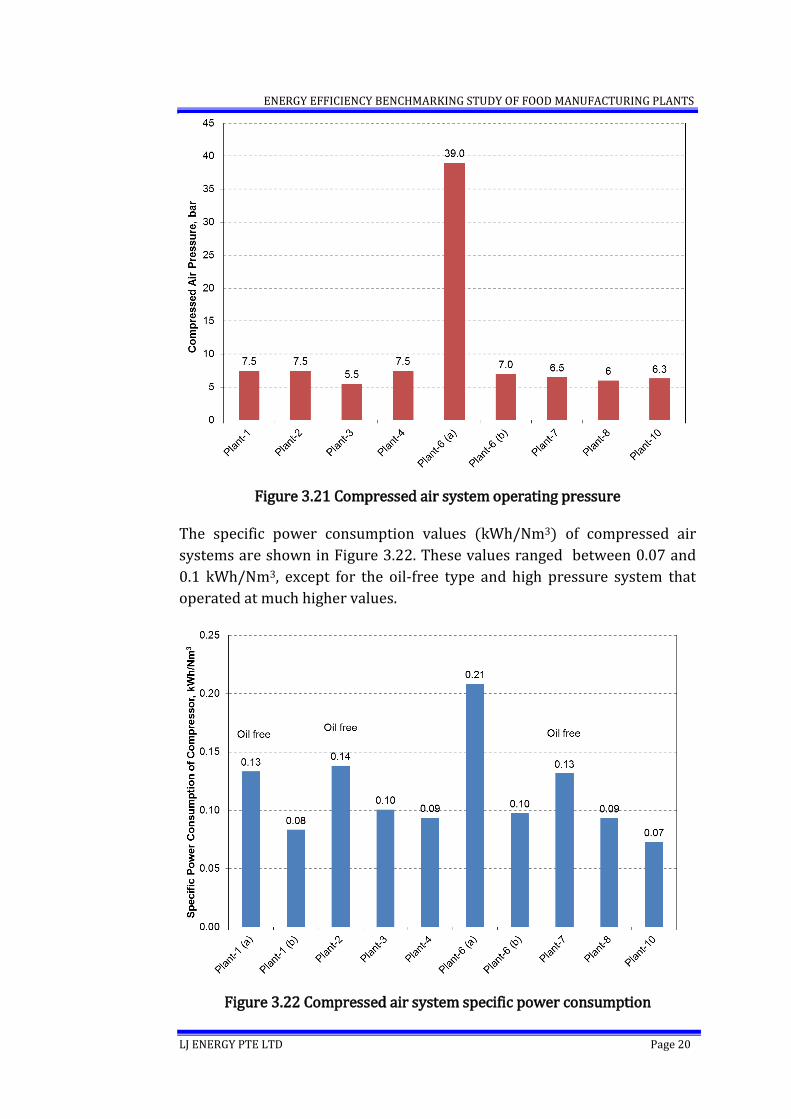
The compressed air systems’ operating pressures ranged from 5.5 to 7.5
bar, except for one system that operated at 39 bar for bottle blowing as
shown in Figure 3.21.
ENERGY EFFICIENCY BENCHMARKING STUDY OF FOOD MANUFACTURING PLANTS
LJ ENERGY PTE LTD Page 20
Figure 3.21 Compressed air system operating pressure
The specific power consumption values (kWh/Nm3) of compressed air
systems are shown in Figure 3.22. These values ranged between 0.07 and
0.1 kWh/Nm3, except for the oil-free type and high pressure system that
operated at much higher values.
Figure 3.22 Compressed air system specific power consumption
ENERGY EFFICIENCY BENCHMARKING STUDY OF FOOD MANUFACTURING PLANTS
LJ ENERGY PTE LTD Page 21
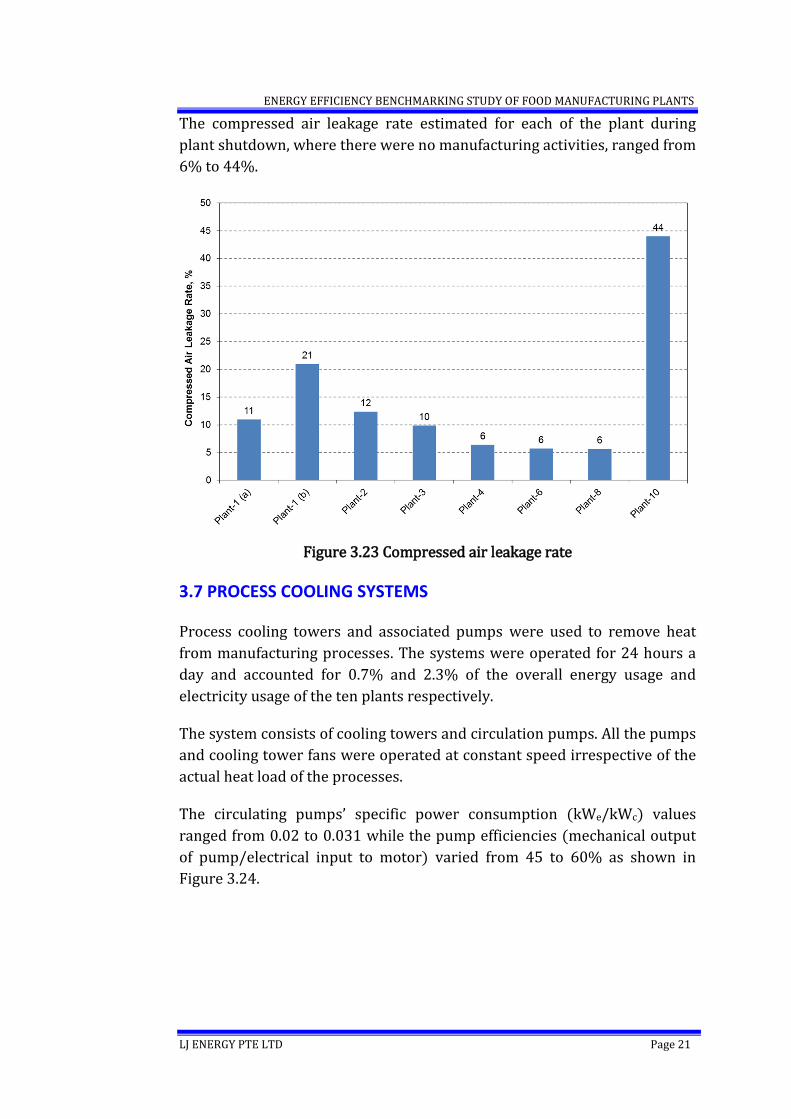
The compressed air leakage rate estimated for each of the plant during
plant shutdown, where there were no manufacturing activities, ranged from
6% to 44%.
Figure 3.23 Compressed air leakage rate
3.7 PROCESS COOLING SYSTEMS
Process cooling towers and associated pumps were used to remove heat
from manufacturing processes. The systems were operated for 24 hours a
day and accounted for 0.7% and 2.3% of the overall energy usage and
electricity usage of the ten plants respectively.
The system consists of cooling towers and circulation pumps. All the pumps
and cooling tower fans were operated at constant speed irrespective of the
actual heat load of the processes.
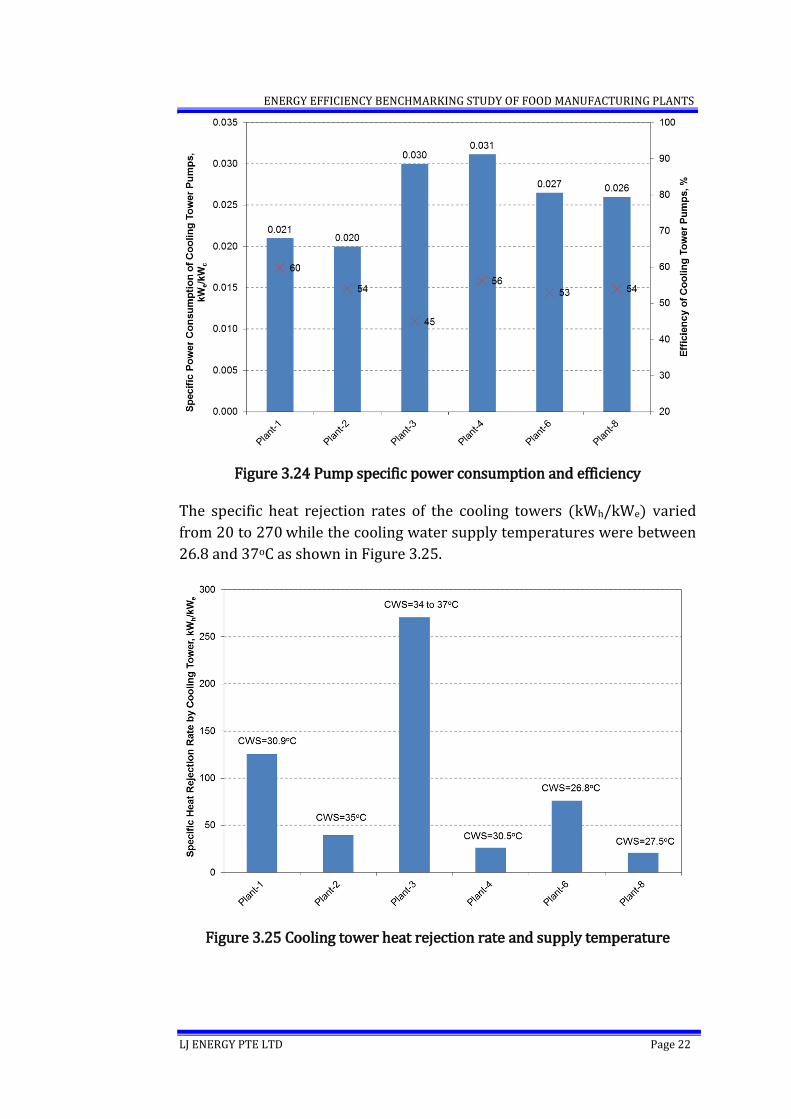
The circulating pumps’ specific power consumption (kWe/kWc) values
ranged from 0.02 to 0.031 while the pump efficiencies (mechanical output
of pump/electrical input to motor) varied from 45 to 60% as shown in
Figure 3.24.
ENERGY EFFICIENCY BENCHMARKING STUDY OF FOOD MANUFACTURING PLANTS
LJ ENERGY PTE LTD Page 22
Figure 3.24 Pump specific power consumption and efficiency
The specific heat rejection rates of the cooling towers (kWh/kWe) varied
from 20 to 270 while the cooling water supply temperatures were between
26.8 and 37oC as shown in Figure 3.25.
Figure 3.25 Cooling tower heat rejection rate and supply temperature
ENERGY EFFICIENCY BENCHMARKING STUDY OF FOOD MANUFACTURING PLANTS
LJ ENERGY PTE LTD Page 23
3.8 PRODUCTION SYSTEMS AND MOTORS
Motor-driven equipment such as mills, rollers, grinders, pulverizers and
refiners were used in various production processes. They accounted for
15.5% and 48% of the overall energy consumption and electricity
consumption respectively.
Motors of different capacities were used to operate the equipment. The
efficiency ratings of majority of the motors (more than 90%) were IE1 and
IE2. Measured power consumption showed that loading of some motors
were below 40%.
Motors of smaller capacities between 0.25 and 1.5 kW were used for
packaging and filling machines for bottling and packing of different
products. The average energy consumption of the packaging systems was
only 0.2% of the overall energy consumption of the plants and 0.7% of the
electricity consumption of the plants.
3.9 LIGHTING
Artificial lighting was provided for production areas, warehouses (storage
areas), offices and common areas. Although a combination of the T8
fluorescent lamps, PLC downlight, LED, mercury vapor, sodium vapor and
halogen lamps was used, the majority of lamps used was T8-type
fluorescent lamps.
Lighting systems accounted for 1.7% of the overall energy consumption and
5.4% of the electrical consumption.
Lighting illuminance levels (lux) and lighting power density (W/m2) for
production areas, warehouse storage areas and offices are shown in Figures
3.26 to 3.28.
ENERGY EFFICIENCY BENCHMARKING STUDY OF FOOD MANUFACTURING PLANTS
LJ ENERGY PTE LTD Page 24
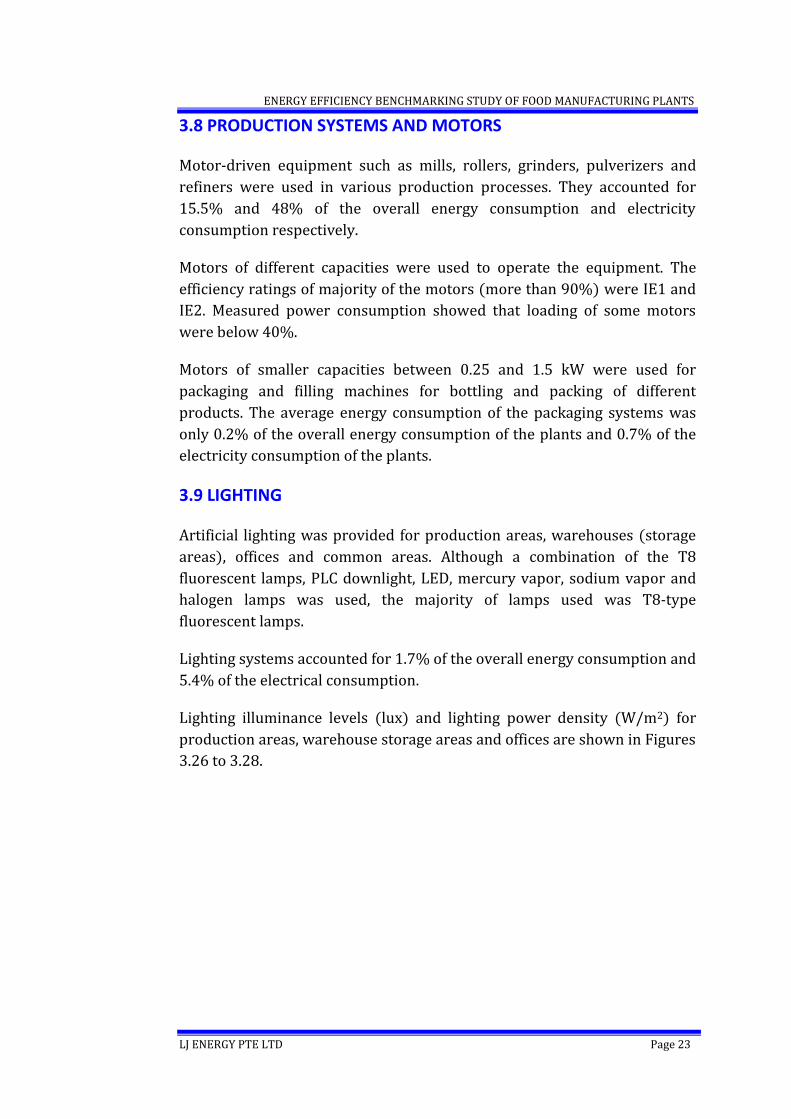
Figure 3.26 Illuminance levels and power density – production areas
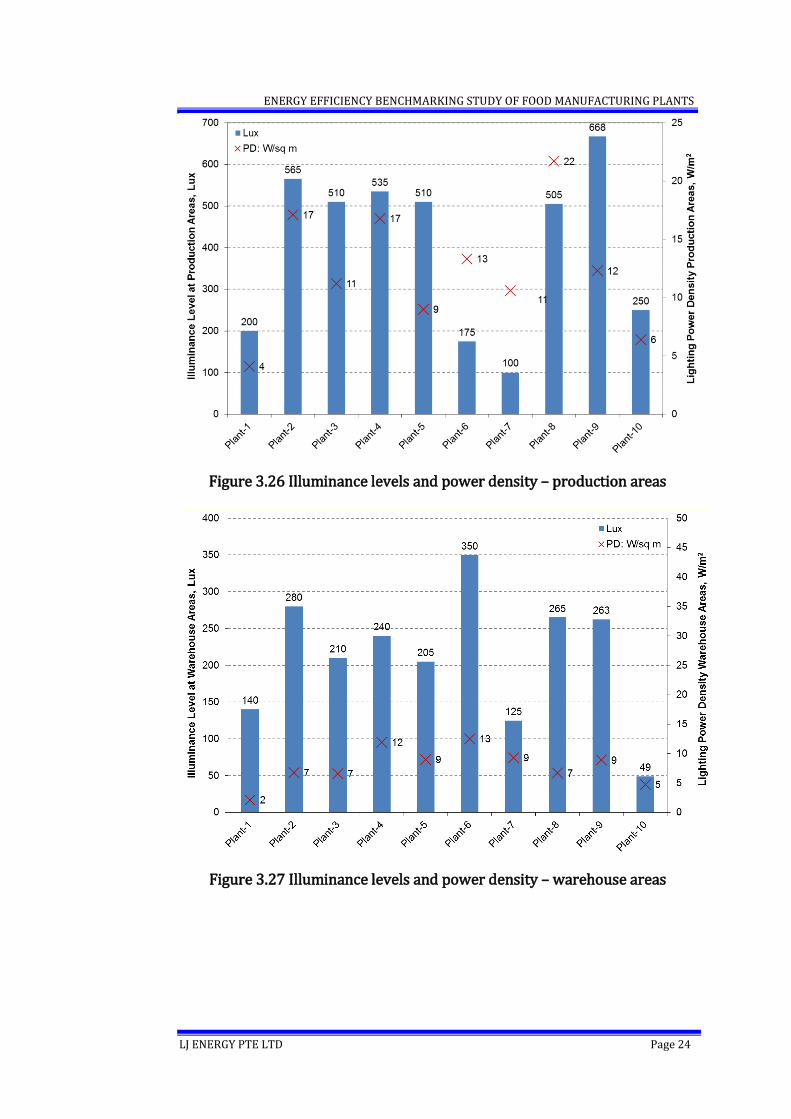
Figure 3.27 Illuminance levels and power density – warehouse areas
ENERGY EFFICIENCY BENCHMARKING STUDY OF FOOD MANUFACTURING PLANTS
LJ ENERGY PTE LTD Page 25
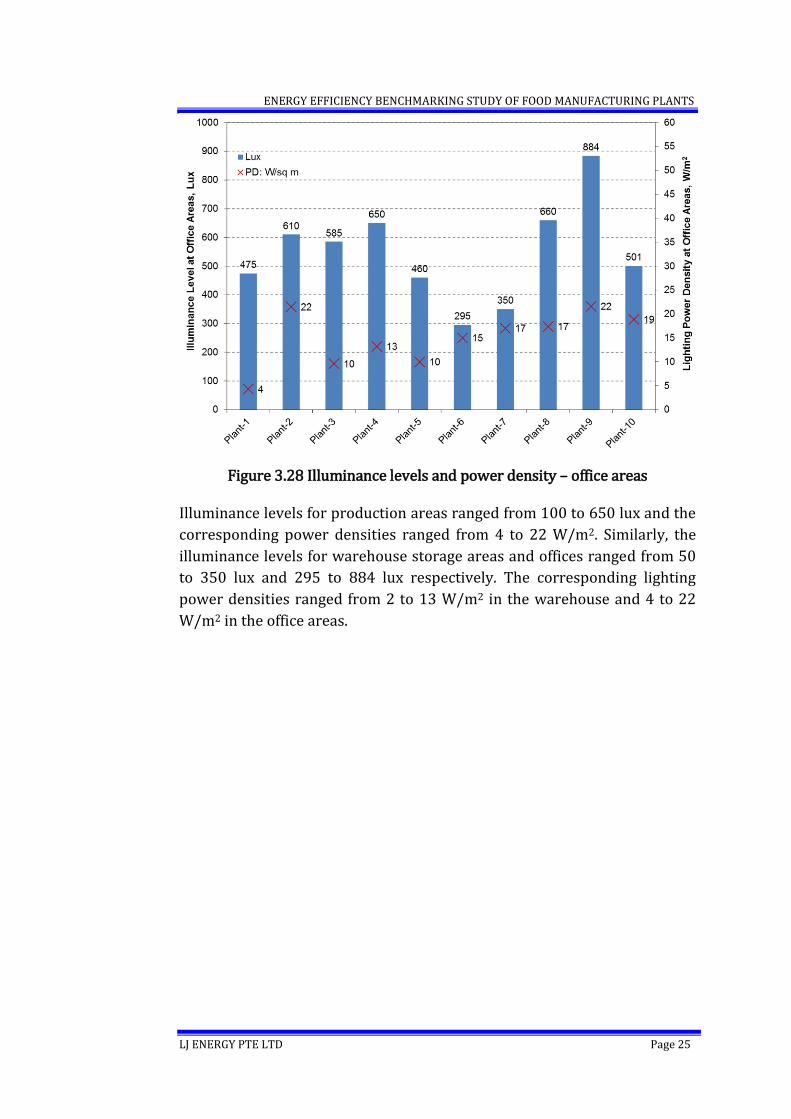
Figure 3.28 Illuminance levels and power density – office areas
Illuminance levels for production areas ranged from 100 to 650 lux and the
corresponding power densities ranged from 4 to 22 W/m2. Similarly, the
illuminance levels for warehouse storage areas and offices ranged from 50
to 350 lux and 295 to 884 lux respectively. The corresponding lighting
power densities ranged from 2 to 13 W/m2 in the warehouse and 4 to 22
W/m2 in the office areas.
ENERGY EFFICIENCY BENCHMARKING STUDY OF FOOD MANUFACTURING PLANTS
LJ ENERGY PTE LTD Page 26
4.0 BENCHMARKING RESULTS
The performance of the various systems was evaluated using the EnPIs
(energy performance indicators) and benchmark values listed in the
Assessment Framework. Assessment of the performance of the energy
consuming systems in the ten plants against the benchmark values is
described in this section of the report.
4.1 BOILER SYSTEMS
4.1.1 BENCHMARKS
The EnPIs selected for assessing the performance of boiler systems are:
(a) Boiler thermal efficiency; and
(b) Condensate recovery factor.
Boiler thermal efficiency
The boiler thermal efficiency is defined as:
h
h
kW of fuel, Heat input
steam, kWt toHeat outpuficiencythermal efBoiler
Heat output to steam = heat content of steam (kW) – heat content of
feedwater (kW)
Heat input of fuel = mass flow rate of fuel (kg/s) x calorific value of fuel
(kJ/kg)
Benchmark value of boiler thermal efficiency: 79%
Condensate recovery factor
Condensate recovery factor is defined as the fraction of the condensate
recovered from the generated steam and returned back to the boiler. The
condensate recovery factor is expressed as:
/daym rate, flow waterFeed
/daym recoverd, Condensate of Amountfactorrecovery Condensate
3
3
Benchmark value of condensate recovery factor: Since this value is process
dependent, there is no established benchmark value. However, based on the
findings of the study, for general heating applications, the recommended
industry benchmark is 80%.
ENERGY EFFICIENCY BENCHMARKING STUDY OF FOOD MANUFACTURING PLANTS
LJ ENERGY PTE LTD Page 27
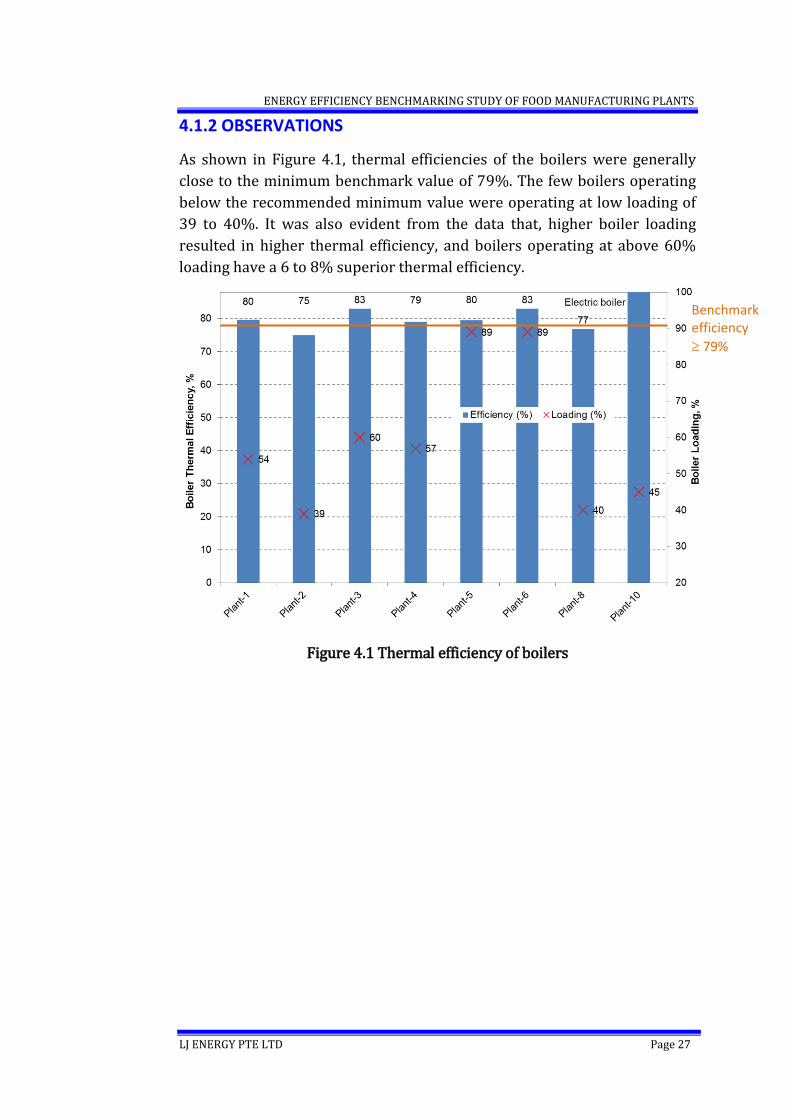
4.1.2 OBSERVATIONS
As shown in Figure 4.1, thermal efficiencies of the boilers were generally
close to the minimum benchmark value of 79%. The few boilers operating
below the recommended minimum value were operating at low loading of
39 to 40%. It was also evident from the data that, higher boiler loading
resulted in higher thermal efficiency, and boilers operating at above 60%
loading have a 6 to 8% superior thermal efficiency.
Figure 4.1 Thermal efficiency of boilers
Benchmark efficiency
79%
ENERGY EFFICIENCY BENCHMARKING STUDY OF FOOD MANUFACTURING PLANTS
LJ ENERGY PTE LTD Page 28
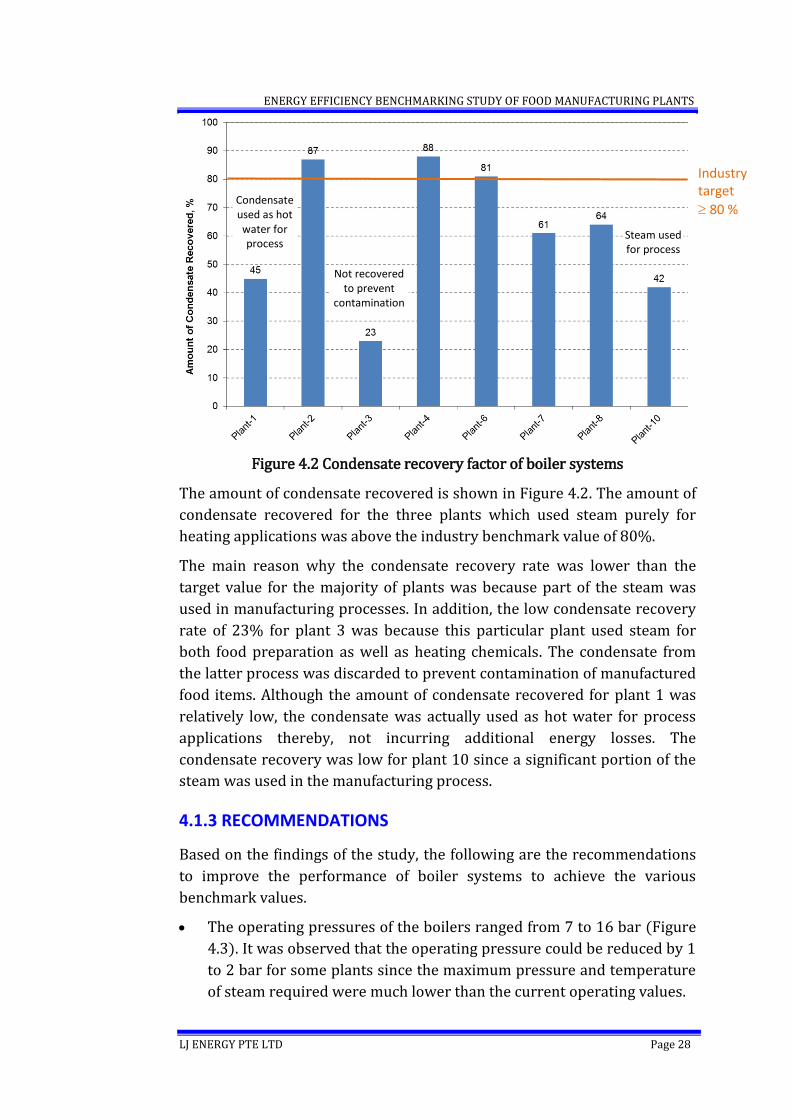
Figure 4.2 Condensate recovery factor of boiler systems
The amount of condensate recovered is shown in Figure 4.2. The amount of
condensate recovered for the three plants which used steam purely for
heating applications was above the industry benchmark value of 80%.
The main reason why the condensate recovery rate was lower than the
target value for the majority of plants was because part of the steam was
used in manufacturing processes. In addition, the low condensate recovery
rate of 23% for plant 3 was because this particular plant used steam for
both food preparation as well as heating chemicals. The condensate from
the latter process was discarded to prevent contamination of manufactured
food items. Although the amount of condensate recovered for plant 1 was
relatively low, the condensate was actually used as hot water for process
applications thereby, not incurring additional energy losses. The
condensate recovery was low for plant 10 since a significant portion of the
steam was used in the manufacturing process.
4.1.3 RECOMMENDATIONS
Based on the findings of the study, the following are the recommendations
to improve the performance of boiler systems to achieve the various
benchmark values.
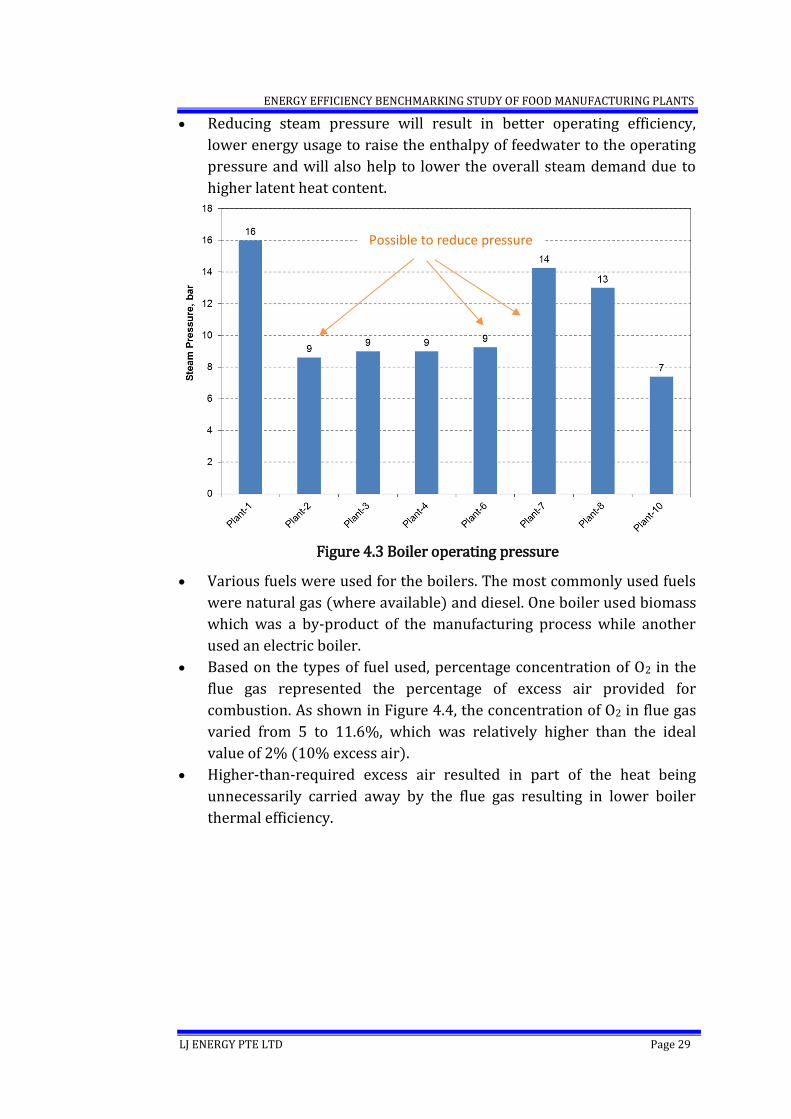
The operating pressures of the boilers ranged from 7 to 16 bar (Figure
4.3). It was observed that the operating pressure could be reduced by 1
to 2 bar for some plants since the maximum pressure and temperature
of steam required were much lower than the current operating values.
Industry target
80 % Condensate used as hot water for process
Not recovered to prevent
contamination
Steam used for process
ENERGY EFFICIENCY BENCHMARKING STUDY OF FOOD MANUFACTURING PLANTS
LJ ENERGY PTE LTD Page 29
Reducing steam pressure will result in better operating efficiency,
lower energy usage to raise the enthalpy of feedwater to the operating
pressure and will also help to lower the overall steam demand due to
higher latent heat content.
Figure 4.3 Boiler operating pressure
Various fuels were used for the boilers. The most commonly used fuels
were natural gas (where available) and diesel. One boiler used biomass
which was a by-product of the manufacturing process while another
used an electric boiler.
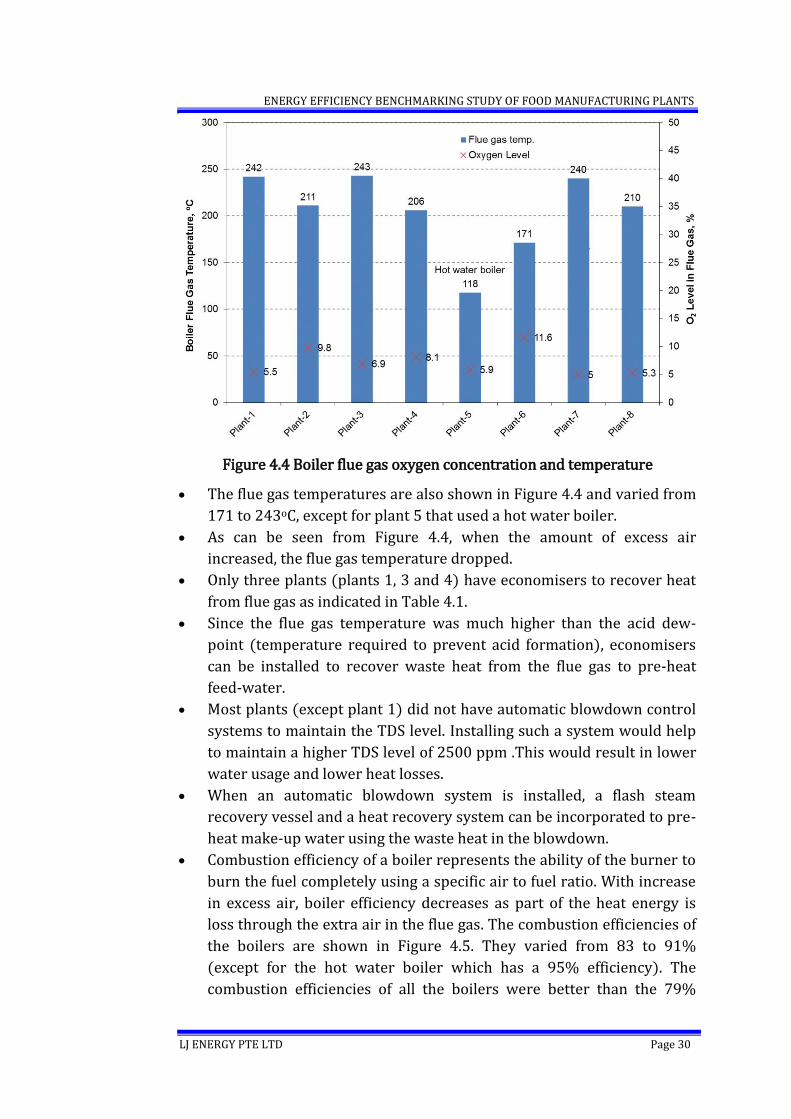
Based on the types of fuel used, percentage concentration of O2 in the
flue gas represented the percentage of excess air provided for
combustion. As shown in Figure 4.4, the concentration of O2 in flue gas
varied from 5 to 11.6%, which was relatively higher than the ideal
value of 2% (10% excess air).
Higher-than-required excess air resulted in part of the heat being
unnecessarily carried away by the flue gas resulting in lower boiler
thermal efficiency.
Possible to reduce pressure
ENERGY EFFICIENCY BENCHMARKING STUDY OF FOOD MANUFACTURING PLANTS
LJ ENERGY PTE LTD Page 30
Figure 4.4 Boiler flue gas oxygen concentration and temperature
The flue gas temperatures are also shown in Figure 4.4 and varied from
171 to 243oC, except for plant 5 that used a hot water boiler.
As can be seen from Figure 4.4, when the amount of excess air
increased, the flue gas temperature dropped.
Only three plants (plants 1, 3 and 4) have economisers to recover heat
from flue gas as indicated in Table 4.1.
Since the flue gas temperature was much higher than the acid dew-
point (temperature required to prevent acid formation), economisers
can be installed to recover waste heat from the flue gas to pre-heat
feed-water.
Most plants (except plant 1) did not have automatic blowdown control
systems to maintain the TDS level. Installing such a system would help
to maintain a higher TDS level of 2500 ppm .This would result in lower
water usage and lower heat losses.
When an automatic blowdown system is installed, a flash steam
recovery vessel and a heat recovery system can be incorporated to pre-
heat make-up water using the waste heat in the blowdown.
Combustion efficiency of a boiler represents the ability of the burner to
burn the fuel completely using a specific air to fuel ratio. With increase
in excess air, boiler efficiency decreases as part of the heat energy is
loss through the extra air in the flue gas. The combustion efficiencies of
the boilers are shown in Figure 4.5. They varied from 83 to 91%
(except for the hot water boiler which has a 95% efficiency). The
combustion efficiencies of all the boilers were better than the 79%
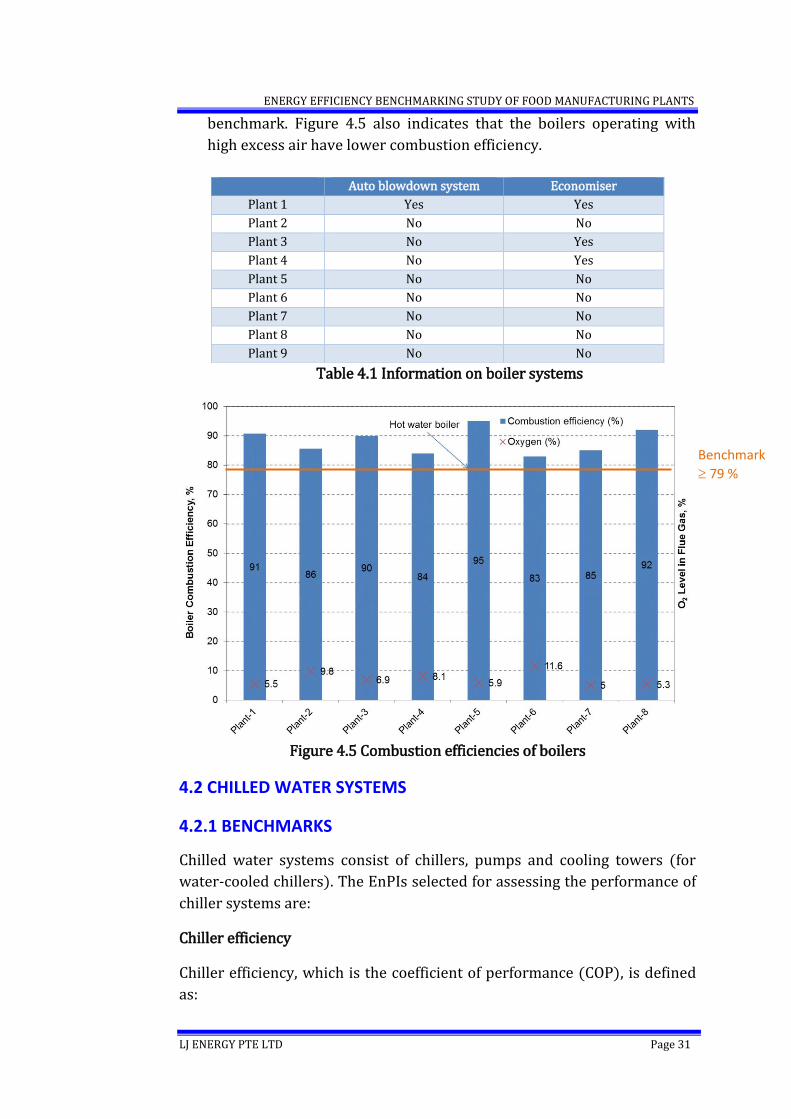
ENERGY EFFICIENCY BENCHMARKING STUDY OF FOOD MANUFACTURING PLANTS
LJ ENERGY PTE LTD Page 31
benchmark. Figure 4.5 also indicates that the boilers operating with
high excess air have lower combustion efficiency.
Table 4.1 Information on boiler systems
Figure 4.5 Combustion efficiencies of boilers
4.2 CHILLED WATER SYSTEMS
4.2.1 BENCHMARKS
Chilled water systems consist of chillers, pumps and cooling towers (for
water-cooled chillers). The EnPIs selected for assessing the performance of
chiller systems are:
Chiller efficiency
Chiller efficiency, which is the coefficient of performance (COP), is defined
as:
Auto blowdown system Economiser
Plant 1 Yes Yes
Plant 2 No No
Plant 3 No Yes
Plant 4 No Yes
Plant 5 No No
Plant 6 No No
Plant 7 No No
Plant 8 No No
Plant 9 No No
Benchmark
79 %
ENERGY EFFICIENCY BENCHMARKING STUDY OF FOOD MANUFACTURING PLANTS
LJ ENERGY PTE LTD Page 32
e
c
kWchiller, mption of ower consuElectric p
Woduced, kCooling pr or COP Efficiency
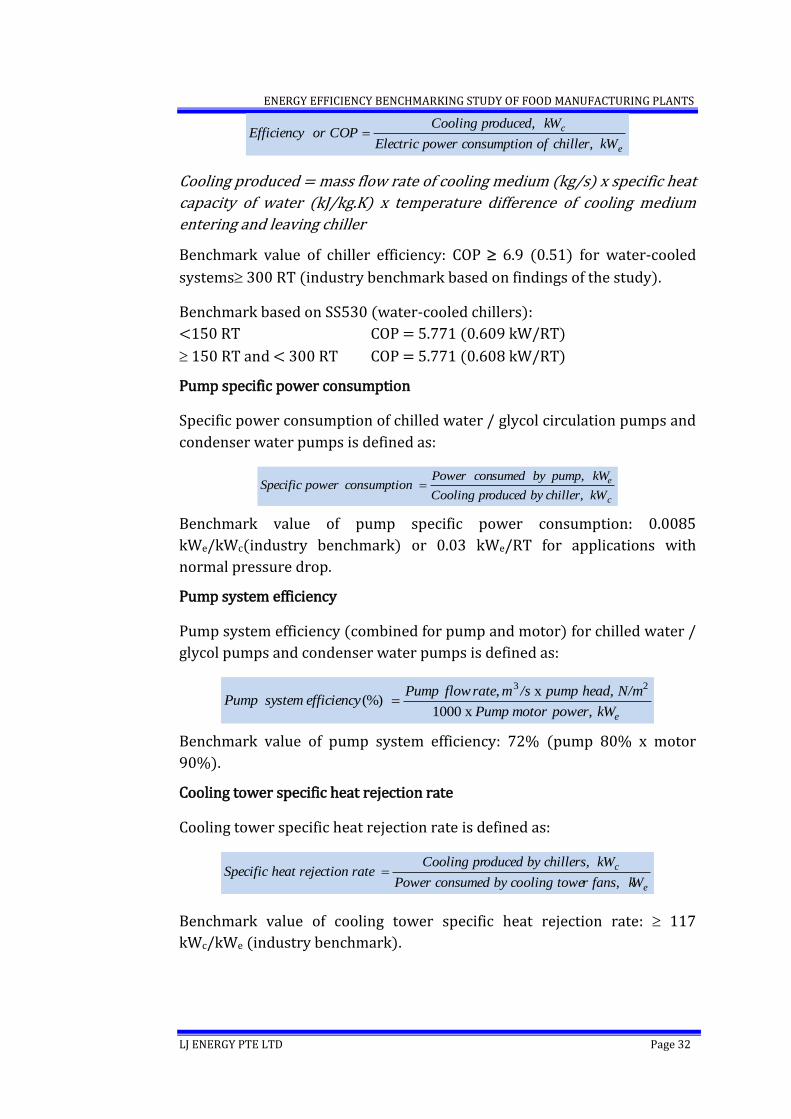
Cooling produced = mass flow rate of cooling medium (kg/s) x specific heat
capacity of water (kJ/kg.K) x temperature difference of cooling medium
entering and leaving chiller
Benchmark value of chiller efficiency: COP 6.9 (0.51) for water-cooled
systems 300 RT (industry benchmark based on findings of the study).
Benchmark based on SS530 (water-cooled chillers):
<150 RT COP = 5.771 (0.609 kW/RT)
150 RT and < 300 RT COP = 5.771 (0.608 kW/RT)
Pump specific power consumption
Specific power consumption of chilled water / glycol circulation pumps and
condenser water pumps is defined as:
c
e
kWchiller, byoducedCooling pr
pump, kWsumed by Power conn consumptioowerSpecific p
Benchmark value of pump specific power consumption: 0.0085
kWe/kWc(industry benchmark) or 0.03 kWe/RT for applications with
normal pressure drop.
Pump system efficiency
Pump system efficiency (combined for pump and motor) for chilled water /
glycol pumps and condenser water pumps is defined as:
epower, kWmotorPump
N/mpump head,/smrateflowPump efficiencysystemPump
x 1000
x , (%)
23
Benchmark value of pump system efficiency: 72% (pump 80% x motor
90%).
Cooling tower specific heat rejection rate
Cooling tower specific heat rejection rate is defined as:
e
c
Wr fans, koling toweumed by coPower cons
kWchillers, oduced by Cooling prrate rejectioneatSpecific h
Benchmark value of cooling tower specific heat rejection rate: 117
kWc/kWe (industry benchmark).
ENERGY EFFICIENCY BENCHMARKING STUDY OF FOOD MANUFACTURING PLANTS
LJ ENERGY PTE LTD Page 33
Chiller system efficiency
Chilled water system efficiency, which is the system coefficient of
performance (COP), is defined as:
e
c
ystem, kWmption ofower consuElectric p
oduced, kWCooling pr or COP EfficiencySystem
s
Cooling produced = sum of cooling produced by all chillers in operation
Electrical power consumption of system = power consumed by chillers,
pumps and cooling towers
Benchmark value of chilled water system efficiency: COP 5.85 or 0.6
kWe/RT for water-cooled chillers (industry benchmark).
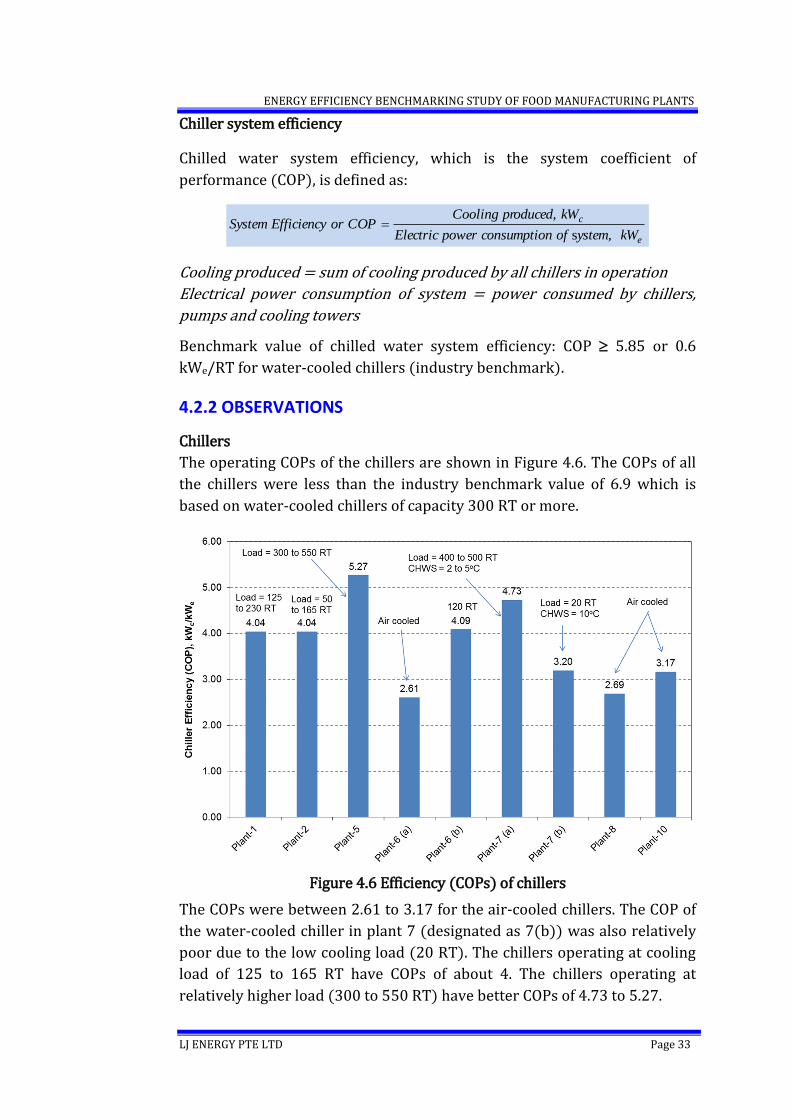
4.2.2 OBSERVATIONS
Chillers
The operating COPs of the chillers are shown in Figure 4.6. The COPs of all
the chillers were less than the industry benchmark value of 6.9 which is
based on water-cooled chillers of capacity 300 RT or more.
Figure 4.6 Efficiency (COPs) of chillers
The COPs were between 2.61 to 3.17 for the air-cooled chillers. The COP of
the water-cooled chiller in plant 7 (designated as 7(b)) was also relatively
poor due to the low cooling load (20 RT). The chillers operating at cooling
load of 125 to 165 RT have COPs of about 4. The chillers operating at
relatively higher load (300 to 550 RT) have better COPs of 4.73 to 5.27.
ENERGY EFFICIENCY BENCHMARKING STUDY OF FOOD MANUFACTURING PLANTS
LJ ENERGY PTE LTD Page 34
Some of the reasons for the low COPs are listed below.
a) Chillers used in three of the plants are air-cooled
b) All chillers except for some in plant 5 and plant 7 have rated capacities
less than 300 RT
c) The supply temperature of the cooling liquid is less than 6.7oC for plant
1 and plant 7.
d) Age of the chillers are more than 10 years
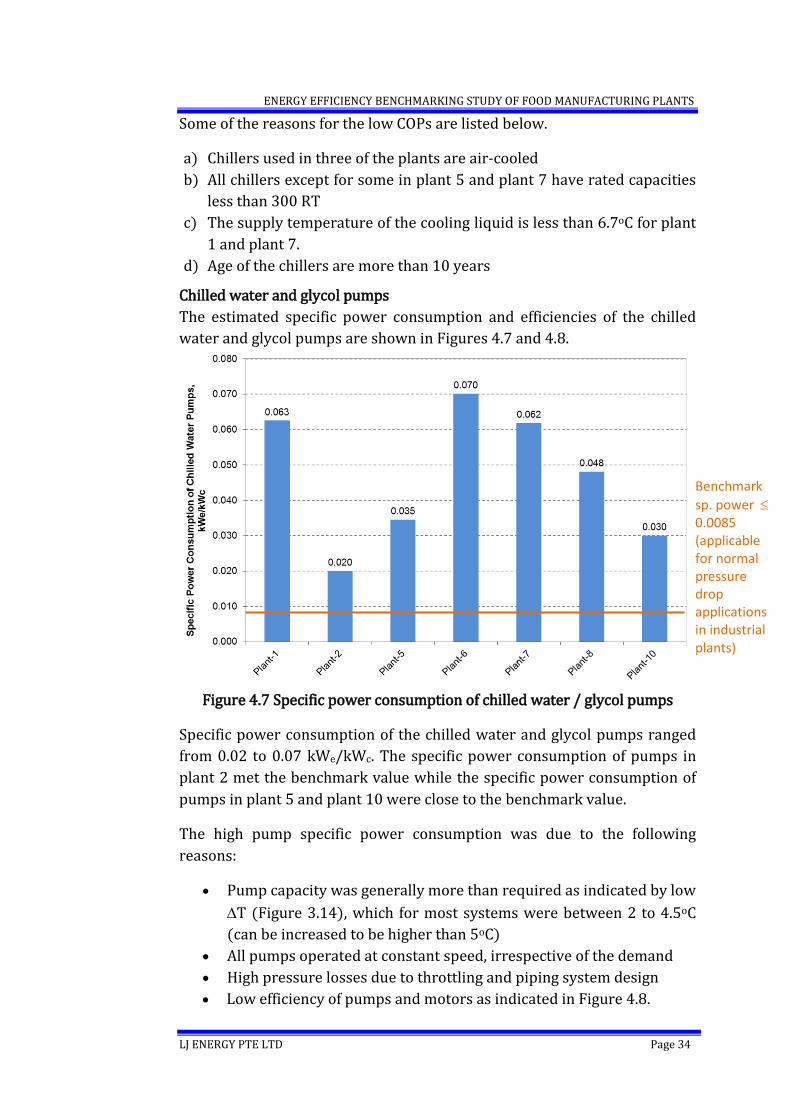
Chilled water and glycol pumps
The estimated specific power consumption and efficiencies of the chilled
water and glycol pumps are shown in Figures 4.7 and 4.8.
Figure 4.7 Specific power consumption of chilled water / glycol pumps
Specific power consumption of the chilled water and glycol pumps ranged
from 0.02 to 0.07 kWe/kWc. The specific power consumption of pumps in
plant 2 met the benchmark value while the specific power consumption of
pumps in plant 5 and plant 10 were close to the benchmark value.
The high pump specific power consumption was due to the following
reasons:
Pump capacity was generally more than required as indicated by low
T (Figure 3.14), which for most systems were between 2 to 4.5oC
(can be increased to be higher than 5oC)
All pumps operated at constant speed, irrespective of the demand
High pressure losses due to throttling and piping system design
Low efficiency of pumps and motors as indicated in Figure 4.8.
Benchmark
sp. power 0.0085 (applicable for normal pressure drop applications in industrial plants)
ENERGY EFFICIENCY BENCHMARKING STUDY OF FOOD MANUFACTURING PLANTS
LJ ENERGY PTE LTD Page 35
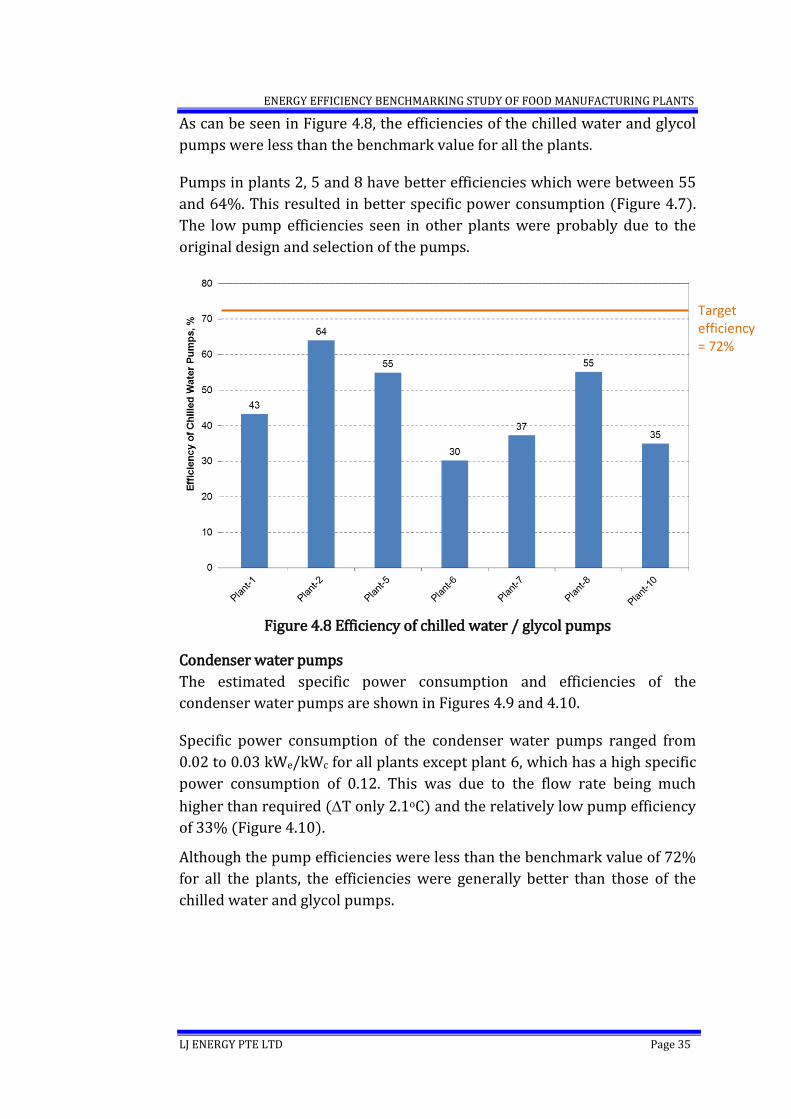
As can be seen in Figure 4.8, the efficiencies of the chilled water and glycol
pumps were less than the benchmark value for all the plants.
Pumps in plants 2, 5 and 8 have better efficiencies which were between 55
and 64%. This resulted in better specific power consumption (Figure 4.7).
The low pump efficiencies seen in other plants were probably due to the
original design and selection of the pumps.
Figure 4.8 Efficiency of chilled water / glycol pumps
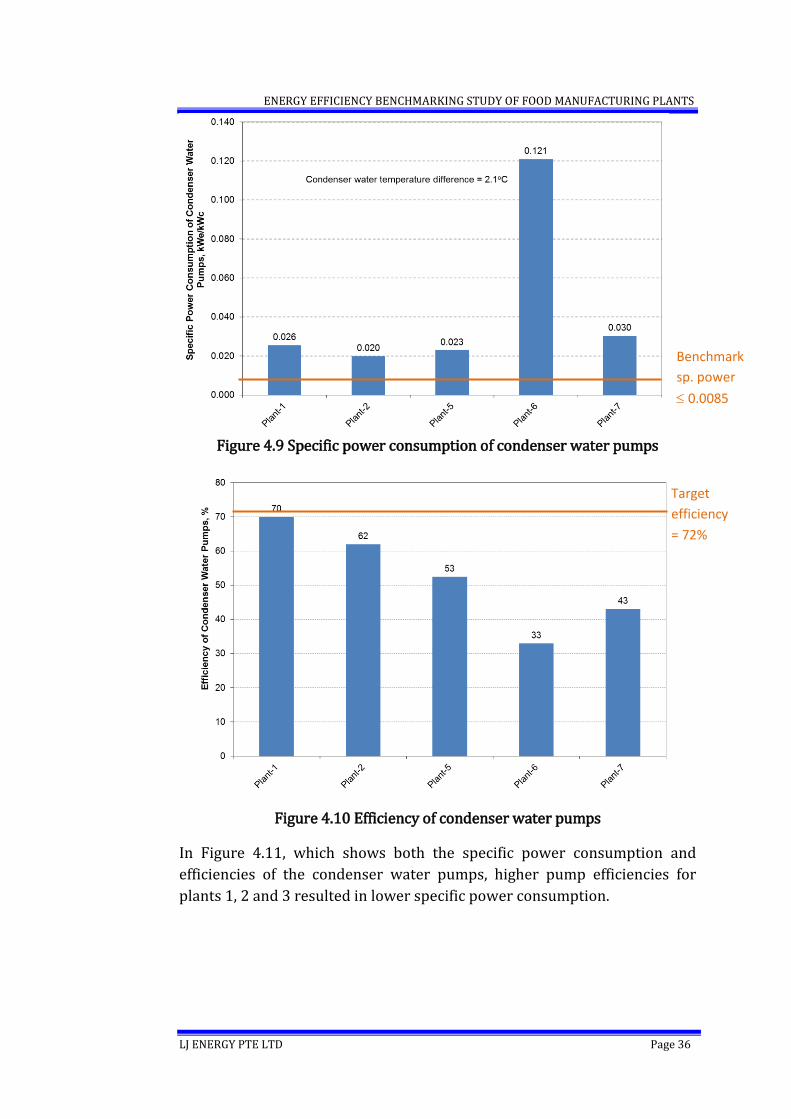
Condenser water pumps
The estimated specific power consumption and efficiencies of the
condenser water pumps are shown in Figures 4.9 and 4.10.
Specific power consumption of the condenser water pumps ranged from
0.02 to 0.03 kWe/kWc for all plants except plant 6, which has a high specific
power consumption of 0.12. This was due to the flow rate being much
higher than required (T only 2.1oC) and the relatively low pump efficiency
of 33% (Figure 4.10).
Although the pump efficiencies were less than the benchmark value of 72%
for all the plants, the efficiencies were generally better than those of the
chilled water and glycol pumps.
Target efficiency = 72%
ENERGY EFFICIENCY BENCHMARKING STUDY OF FOOD MANUFACTURING PLANTS
LJ ENERGY PTE LTD Page 36
Figure 4.9 Specific power consumption of condenser water pumps
Figure 4.10 Efficiency of condenser water pumps
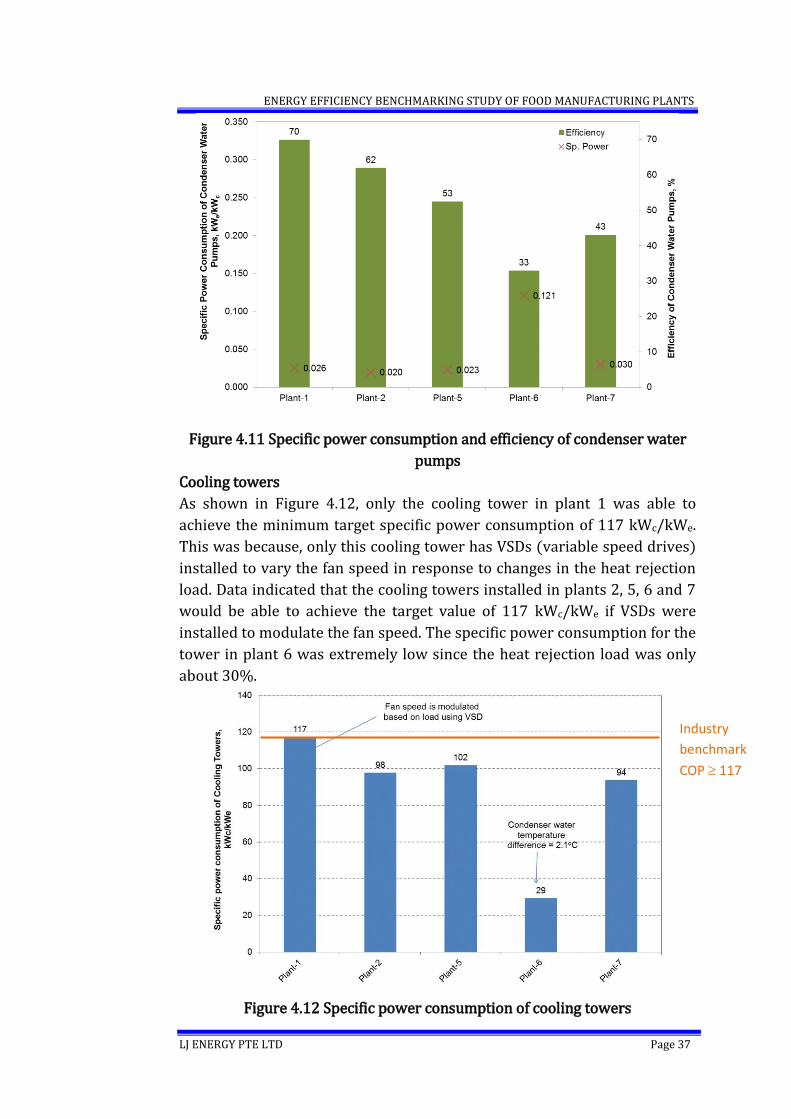
In Figure 4.11, which shows both the specific power consumption and
efficiencies of the condenser water pumps, higher pump efficiencies for
plants 1, 2 and 3 resulted in lower specific power consumption.
Benchmark
sp. power
0.0085
Target
efficiency
= 72%
ENERGY EFFICIENCY BENCHMARKING STUDY OF FOOD MANUFACTURING PLANTS
LJ ENERGY PTE LTD Page 37
Figure 4.11 Specific power consumption and efficiency of condenser water
pumps
Cooling towers
As shown in Figure 4.12, only the cooling tower in plant 1 was able to
achieve the minimum target specific power consumption of 117 kWc/kWe.
This was because, only this cooling tower has VSDs (variable speed drives)
installed to vary the fan speed in response to changes in the heat rejection
load. Data indicated that the cooling towers installed in plants 2, 5, 6 and 7
would be able to achieve the target value of 117 kWc/kWe if VSDs were
installed to modulate the fan speed. The specific power consumption for the
tower in plant 6 was extremely low since the heat rejection load was only
about 30%.
Figure 4.12 Specific power consumption of cooling towers
Industry
benchmark
COP 117
ENERGY EFFICIENCY BENCHMARKING STUDY OF FOOD MANUFACTURING PLANTS
LJ ENERGY PTE LTD Page 38
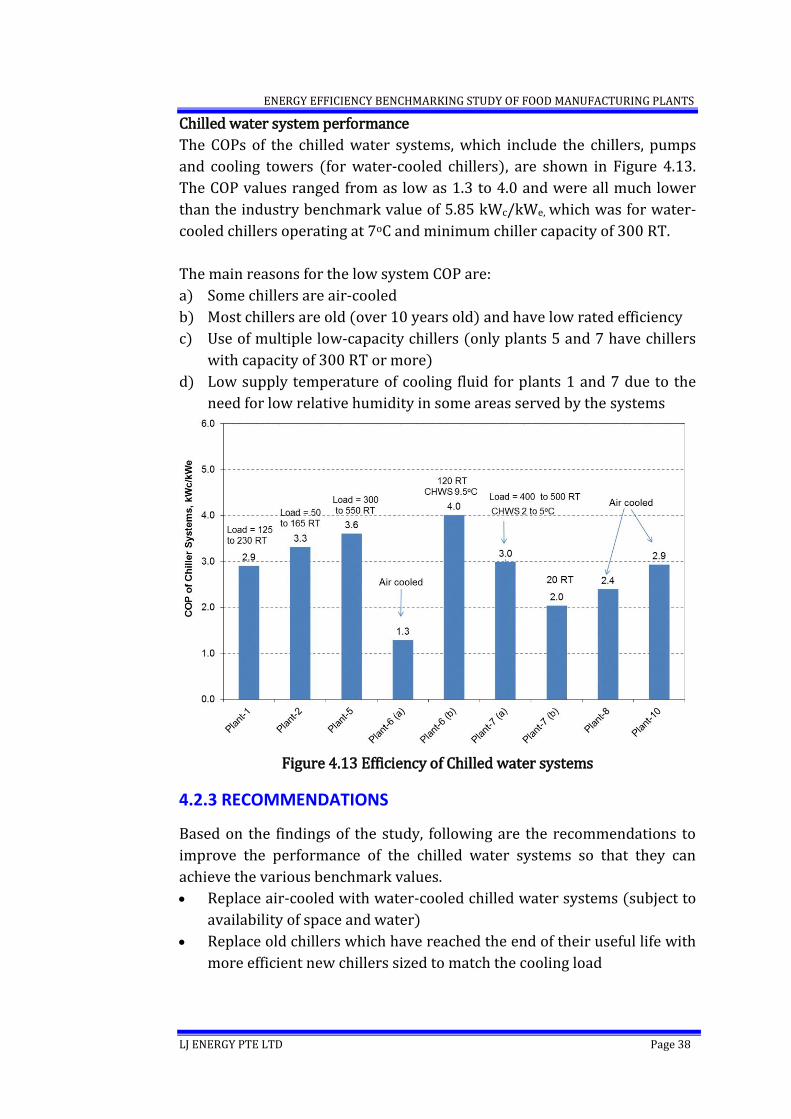
Chilled water system performance
The COPs of the chilled water systems, which include the chillers, pumps
and cooling towers (for water-cooled chillers), are shown in Figure 4.13.
The COP values ranged from as low as 1.3 to 4.0 and were all much lower
than the industry benchmark value of 5.85 kWc/kWe, which was for water-
cooled chillers operating at 7oC and minimum chiller capacity of 300 RT.
The main reasons for the low system COP are:
a) Some chillers are air-cooled
b) Most chillers are old (over 10 years old) and have low rated efficiency
c) Use of multiple low-capacity chillers (only plants 5 and 7 have chillers
with capacity of 300 RT or more)
d) Low supply temperature of cooling fluid for plants 1 and 7 due to the
need for low relative humidity in some areas served by the systems
Figure 4.13 Efficiency of Chilled water systems
4.2.3 RECOMMENDATIONS
Based on the findings of the study, following are the recommendations to
improve the performance of the chilled water systems so that they can
achieve the various benchmark values.
Replace air-cooled with water-cooled chilled water systems (subject to
availability of space and water)
Replace old chillers which have reached the end of their useful life with
more efficient new chillers sized to match the cooling load
ENERGY EFFICIENCY BENCHMARKING STUDY OF FOOD MANUFACTURING PLANTS
LJ ENERGY PTE LTD Page 39
Consolidate multiple chilled water systems into a single system as it can
operate at better efficiency due to improved loading from demand
aggregation
Increase the supply temperature of chilled water where possible
Install standalone dehumidification / cooing systems for areas that
require low relative humidity so the chilled water system can be
operated at a higher temperature
Convert glycol cooling systems into chilled water systems for better
heat transfer characteristics.
Replace oversized pumps with pumps sized to match load
requirements
Select pumps and motors to have best efficiency at the expected
operating point
Increase the T for both the cooling fluid as well as condenser water to
minimise pumping power
Install VSDs with suitable controls where applicable to vary pump
speed in response to load variations
Remove throttling valves and improve piping design to reduce pressure
losses
Install VSDs with suitable controls for cooling tower fans to modulate
speed in response to changes in the load
4.3 REFRIGERATION SYSTEMS
4.3.1 BENCHMARKS
The EnPI selected for assessing the performance of refrigeration systems is
the coefficient of performance (COP) which is a measure of the system
efficiency.
COP is defined as:
e
c
,kWion systemrefrigeratmption of ower consuElectric p
kWion systemrefrigeratoducedCooling pr COP
,
Electric power consumption of refrigeration system = power consumed by
compressor + power consumed by heat rejection system pumps and fans
(where applicable)
Benchmark value of COP based on screw compressors using evaporative
condensers (industry benchmark):
ENERGY EFFICIENCY BENCHMARKING STUDY OF FOOD MANUFACTURING PLANTS
LJ ENERGY PTE LTD Page 40
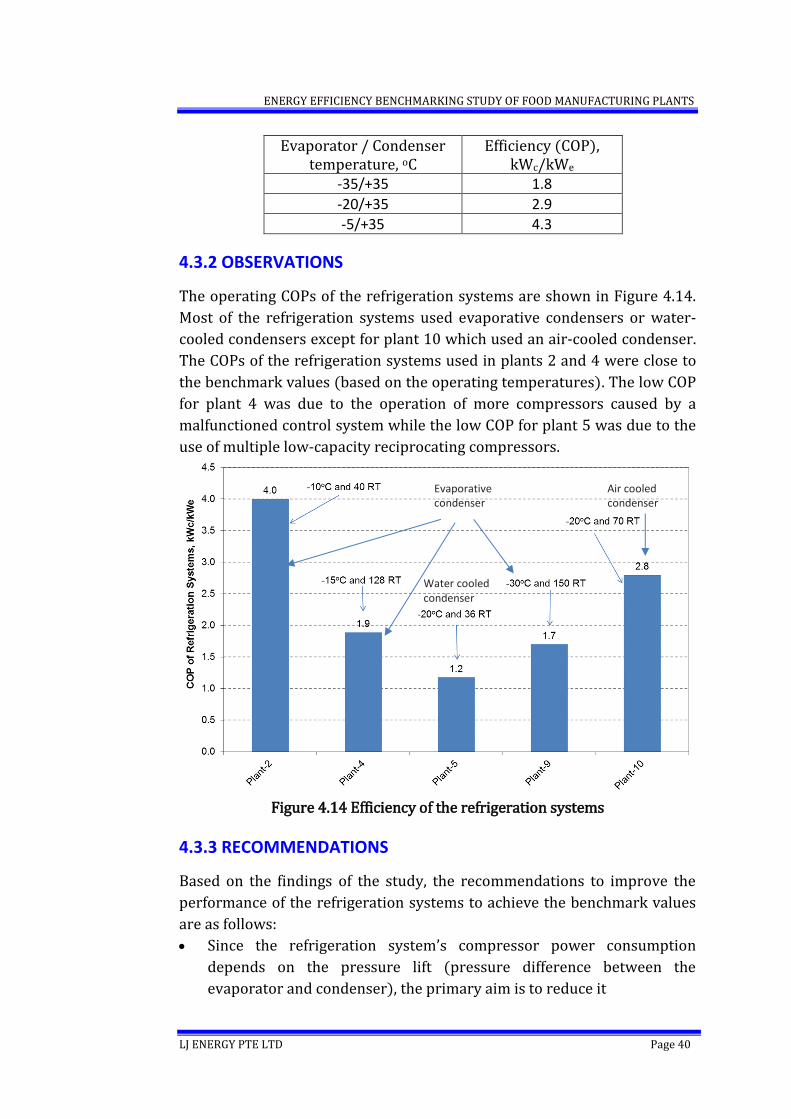
Evaporator / Condenser temperature, oC
Efficiency (COP), kWc/kWe
-35/+35 1.8
-20/+35 2.9
-5/+35 4.3
4.3.2 OBSERVATIONS
The operating COPs of the refrigeration systems are shown in Figure 4.14.
Most of the refrigeration systems used evaporative condensers or water-
cooled condensers except for plant 10 which used an air-cooled condenser.
The COPs of the refrigeration systems used in plants 2 and 4 were close to
the benchmark values (based on the operating temperatures). The low COP
for plant 4 was due to the operation of more compressors caused by a
malfunctioned control system while the low COP for plant 5 was due to the
use of multiple low-capacity reciprocating compressors.
Figure 4.14 Efficiency of the refrigeration systems
4.3.3 RECOMMENDATIONS
Based on the findings of the study, the recommendations to improve the
performance of the refrigeration systems to achieve the benchmark values
are as follows:
Since the refrigeration system’s compressor power consumption
depends on the pressure lift (pressure difference between the
evaporator and condenser), the primary aim is to reduce it
Evaporative condenser
Water cooled condenser
Air cooled condenser
ENERGY EFFICIENCY BENCHMARKING STUDY OF FOOD MANUFACTURING PLANTS
LJ ENERGY PTE LTD Page 41
Evaporator temperature should be set based on maximum allowable
temperature of the process cooling or cold room requirement
The compressor suction pressure should be set so that the saturation
temperature is not higher than 10oC below the temperature of the
refrigerated space or process.
Air-cooled condensers should be replaced with evaporative condensers
to lower the condensing pressure
If the condensing pressure is high when using evaporative condensers,
check the heat rejection capacity of the condenser and install additional
capacity or if available, operate spare condensers in parallel with the
one normally in operation
Check sensors and controls to ensure that only the minimum number of
compressors required to satisfy the load is in operation
Use variable speed compressors where possible
For systems that need not operate below 0oC, chilled water or glycol
systems should be used.
Reduce the refrigeration load by minimizing heat gain into the
refrigerated space by means such as sealing openings, improving
insulation, minimizing lighting usage within the refrigerated space and
using energy efficient lighting such as LEDs.
4.4 COMPRESSED AIR SYSTEMS
4.4.1 BENCHMARKS
The EnPIs selected for assessing the performance of compressed air
systems are:
(a) Specific power consumption
(b) Leakage rate
Specific power consumption
Compressed air system specific power consumption is defined as:
3
ivery, Nmee air delAverage fr
, kWhair systemcompressedmption of ergy consuAverage en n consumptioowerSpecific p
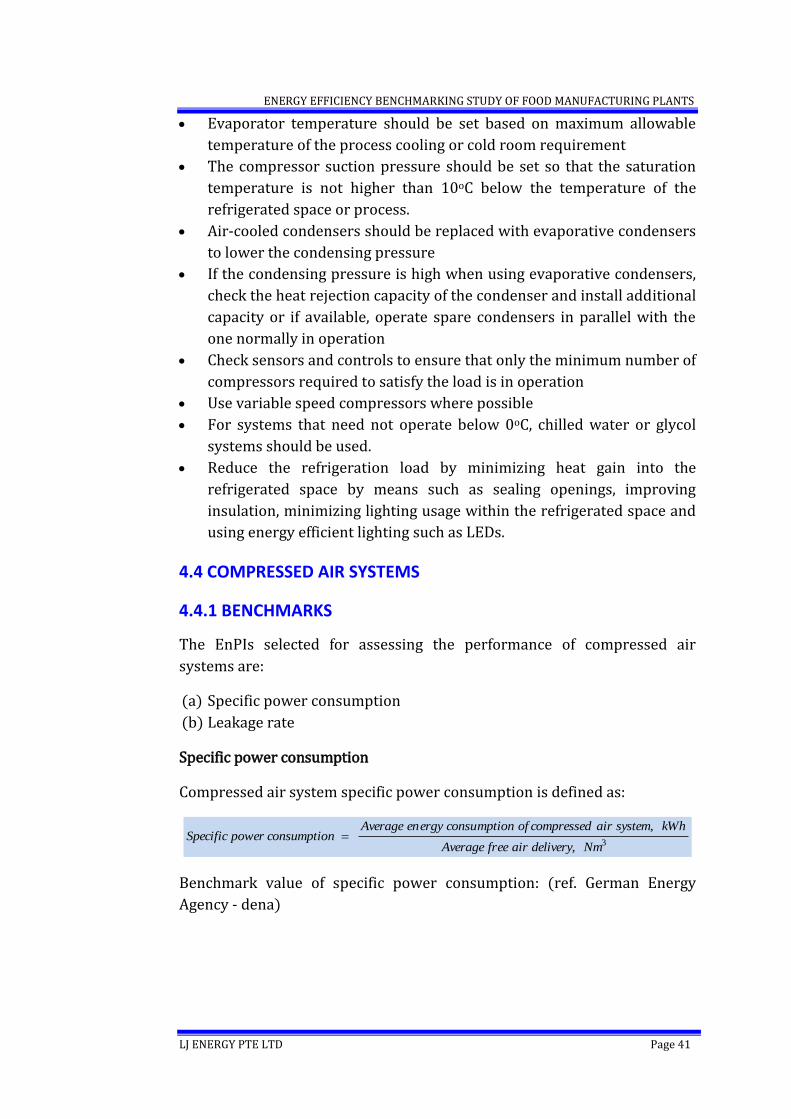
Benchmark value of specific power consumption: (ref. German Energy
Agency - dena)
ENERGY EFFICIENCY BENCHMARKING STUDY OF FOOD MANUFACTURING PLANTS
LJ ENERGY PTE LTD Page 42
Pressure ratio*
Specific power
consumption,
kWh/Nm3
4 0.05 – 0.073
5 0.058 – 0.083
6 0.067 – 0. 097
7 0.073 – 1.07
8 0.08 – 0.117
9 0.087 – 0.127
10 0.092 – 0.135
20 0.113 – 0.192
*Pressure Ratio PR = Ratio of outlet to inlet pressure of compressor
Leakage rate
Compressed air leakage rate was determined by switching off equipment
which normally used compressed air (during plant shut-down) and
recording the load and unload times of the compressor.
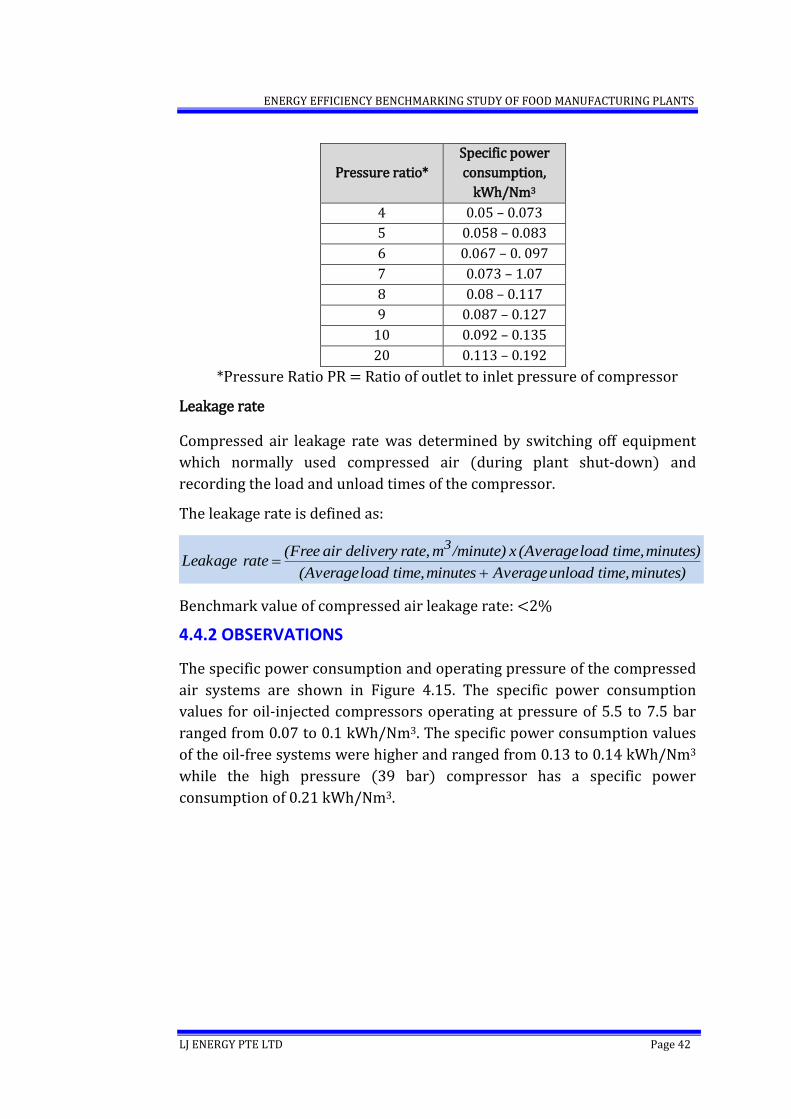
The leakage rate is defined as:
minutes) time, unload Average minutes time, load (Average
minutes) time, load (Average x /minute)m rate,delivery air (Free rate Leakage
3
Benchmark value of compressed air leakage rate: <2%
4.4.2 OBSERVATIONS
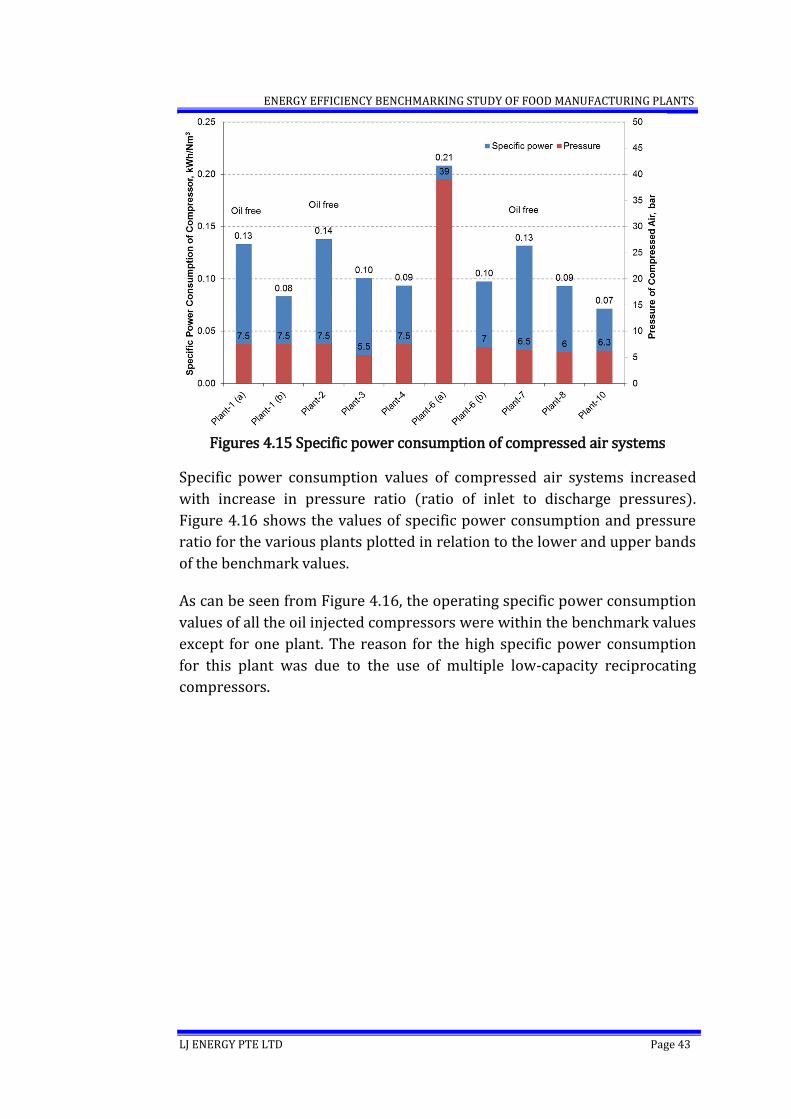
The specific power consumption and operating pressure of the compressed
air systems are shown in Figure 4.15. The specific power consumption
values for oil-injected compressors operating at pressure of 5.5 to 7.5 bar
ranged from 0.07 to 0.1 kWh/Nm3. The specific power consumption values
of the oil-free systems were higher and ranged from 0.13 to 0.14 kWh/Nm3
while the high pressure (39 bar) compressor has a specific power
consumption of 0.21 kWh/Nm3.
ENERGY EFFICIENCY BENCHMARKING STUDY OF FOOD MANUFACTURING PLANTS
LJ ENERGY PTE LTD Page 43
Figures 4.15 Specific power consumption of compressed air systems
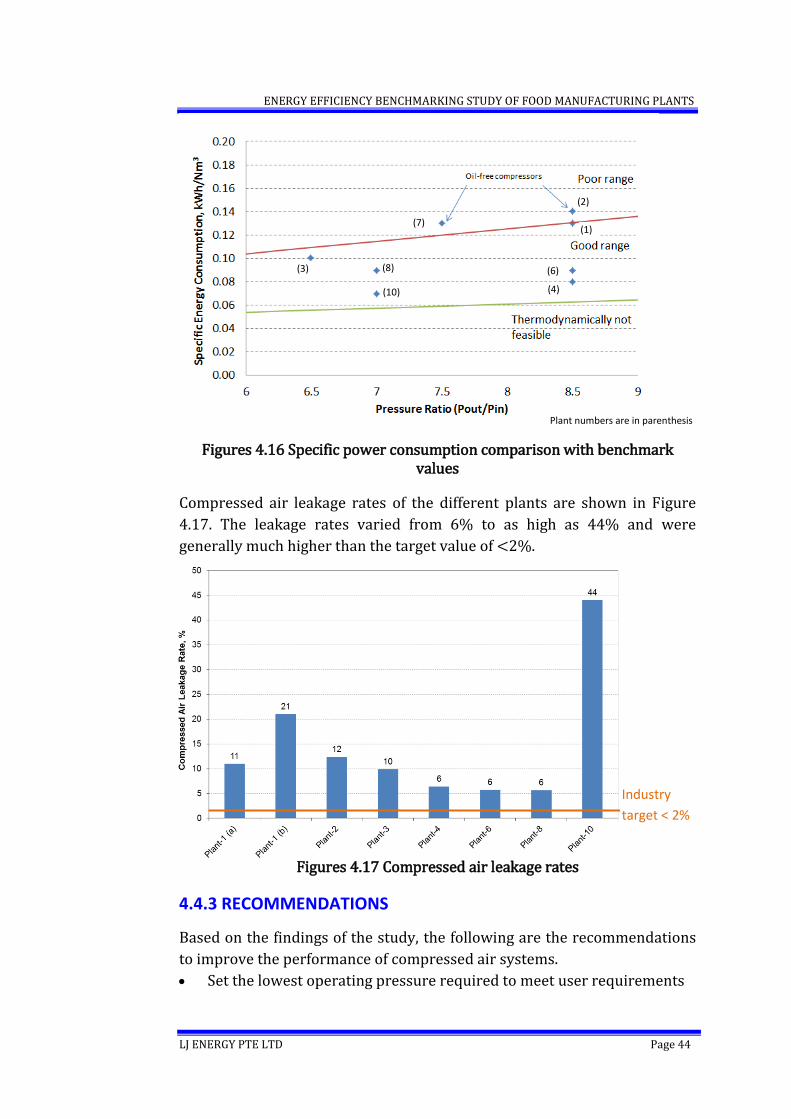
Specific power consumption values of compressed air systems increased
with increase in pressure ratio (ratio of inlet to discharge pressures).
Figure 4.16 shows the values of specific power consumption and pressure
ratio for the various plants plotted in relation to the lower and upper bands
of the benchmark values.
As can be seen from Figure 4.16, the operating specific power consumption
values of all the oil injected compressors were within the benchmark values
except for one plant. The reason for the high specific power consumption
for this plant was due to the use of multiple low-capacity reciprocating
compressors.
ENERGY EFFICIENCY BENCHMARKING STUDY OF FOOD MANUFACTURING PLANTS
LJ ENERGY PTE LTD Page 44
Figures 4.16 Specific power consumption comparison with benchmark
values
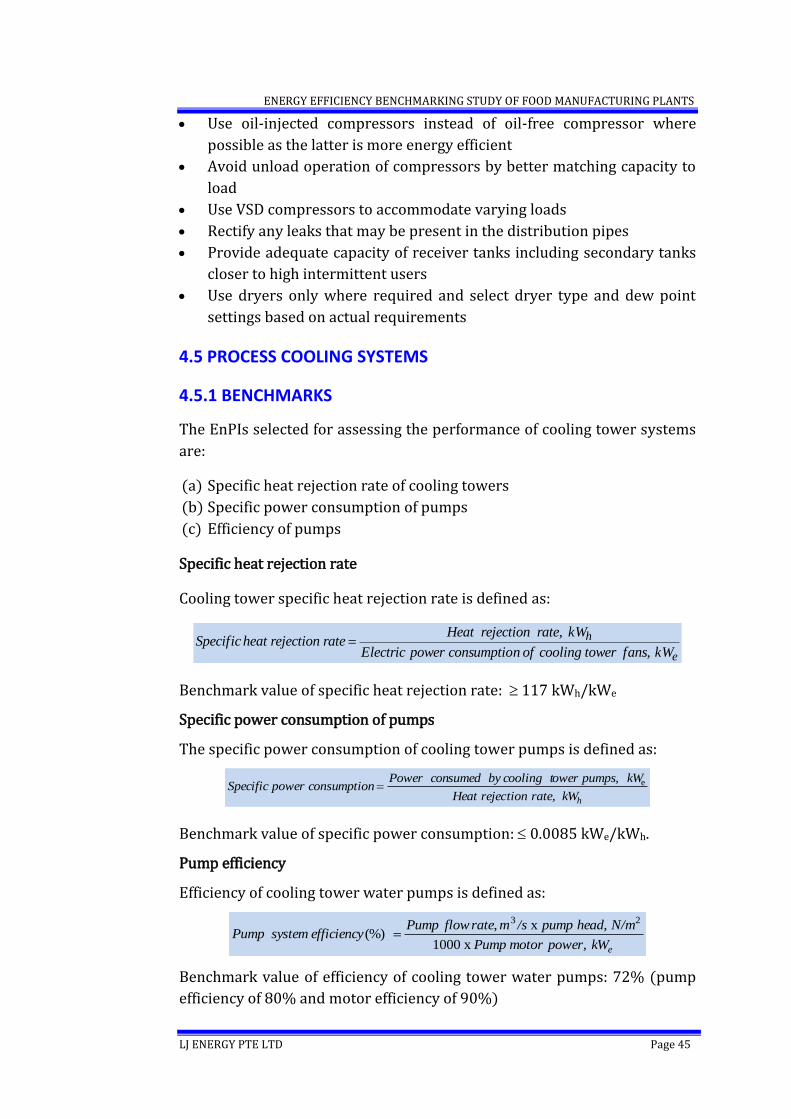
Compressed air leakage rates of the different plants are shown in Figure
4.17. The leakage rates varied from 6% to as high as 44% and were
generally much higher than the target value of <2%.
Figures 4.17 Compressed air leakage rates
4.4.3 RECOMMENDATIONS
Based on the findings of the study, the following are the recommendations
to improve the performance of compressed air systems.
Set the lowest operating pressure required to meet user requirements
Industry
target < 2%
(10)
(8) (3) (6)
Plant numbers are in parenthesis
(4)
(1)
(2)
(7)
ENERGY EFFICIENCY BENCHMARKING STUDY OF FOOD MANUFACTURING PLANTS
LJ ENERGY PTE LTD Page 45
Use oil-injected compressors instead of oil-free compressor where
possible as the latter is more energy efficient
Avoid unload operation of compressors by better matching capacity to
load
Use VSD compressors to accommodate varying loads
Rectify any leaks that may be present in the distribution pipes
Provide adequate capacity of receiver tanks including secondary tanks
closer to high intermittent users
Use dryers only where required and select dryer type and dew point
settings based on actual requirements
4.5 PROCESS COOLING SYSTEMS
4.5.1 BENCHMARKS
The EnPIs selected for assessing the performance of cooling tower systems
are:
(a) Specific heat rejection rate of cooling towers
(b) Specific power consumption of pumps
(c) Efficiency of pumps
Specific heat rejection rate
Cooling tower specific heat rejection rate is defined as:
e
h
kW fans, tower cooling of nconsumptio power Electric
kW rate, rejection Heat rate rejection heat Specific
Benchmark value of specific heat rejection rate: 117 kWh/kWe
Specific power consumption of pumps
The specific power consumption of cooling tower pumps is defined as:
h kWtion rate,Heat rejec
, kWower pumpscooling tsumed by Power conmptionower consuSpecific p e
Benchmark value of specific power consumption: 0.0085 kWe/kWh.
Pump efficiency
Efficiency of cooling tower water pumps is defined as:
epower, kWmotorPump
N/mpump head,/smrateflowPump efficiencysystemPump
x 1000
x , (%)
23
Benchmark value of efficiency of cooling tower water pumps: 72% (pump
efficiency of 80% and motor efficiency of 90%)
ENERGY EFFICIENCY BENCHMARKING STUDY OF FOOD MANUFACTURING PLANTS
LJ ENERGY PTE LTD Page 46
4.5.2 OBSERVATIONS
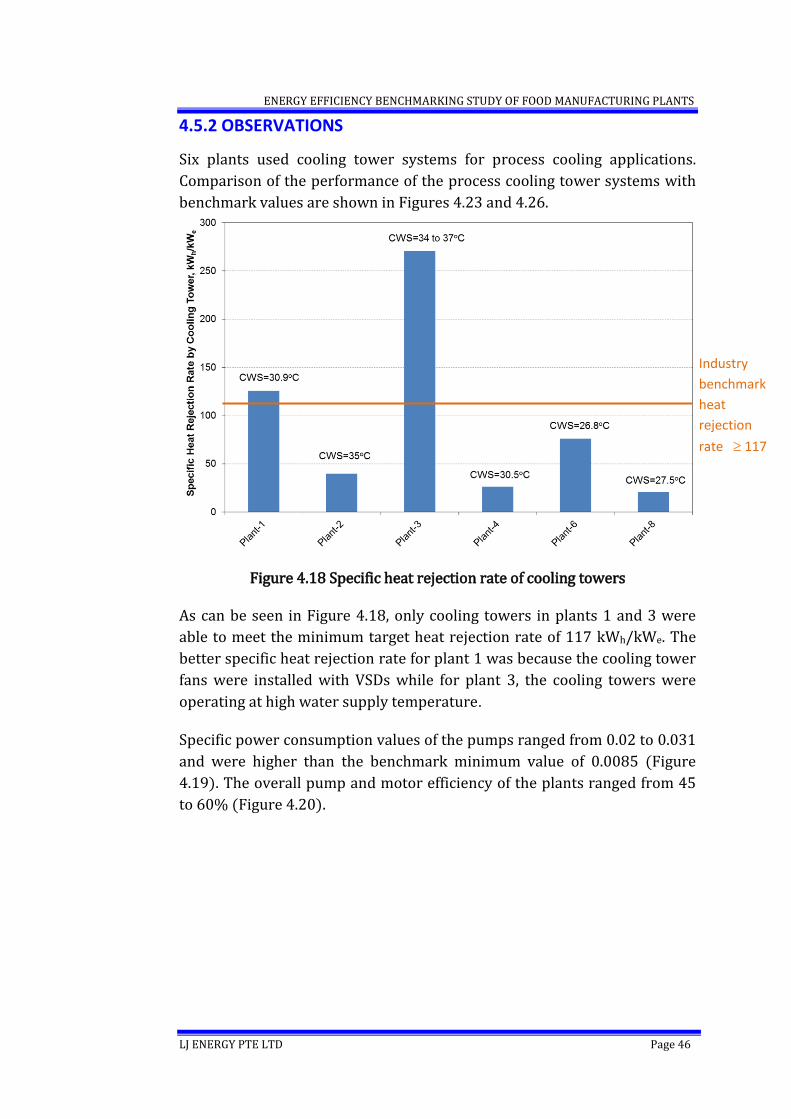
Six plants used cooling tower systems for process cooling applications.
Comparison of the performance of the process cooling tower systems with
benchmark values are shown in Figures 4.23 and 4.26.
Figure 4.18 Specific heat rejection rate of cooling towers
As can be seen in Figure 4.18, only cooling towers in plants 1 and 3 were
able to meet the minimum target heat rejection rate of 117 kWh/kWe. The
better specific heat rejection rate for plant 1 was because the cooling tower
fans were installed with VSDs while for plant 3, the cooling towers were
operating at high water supply temperature.
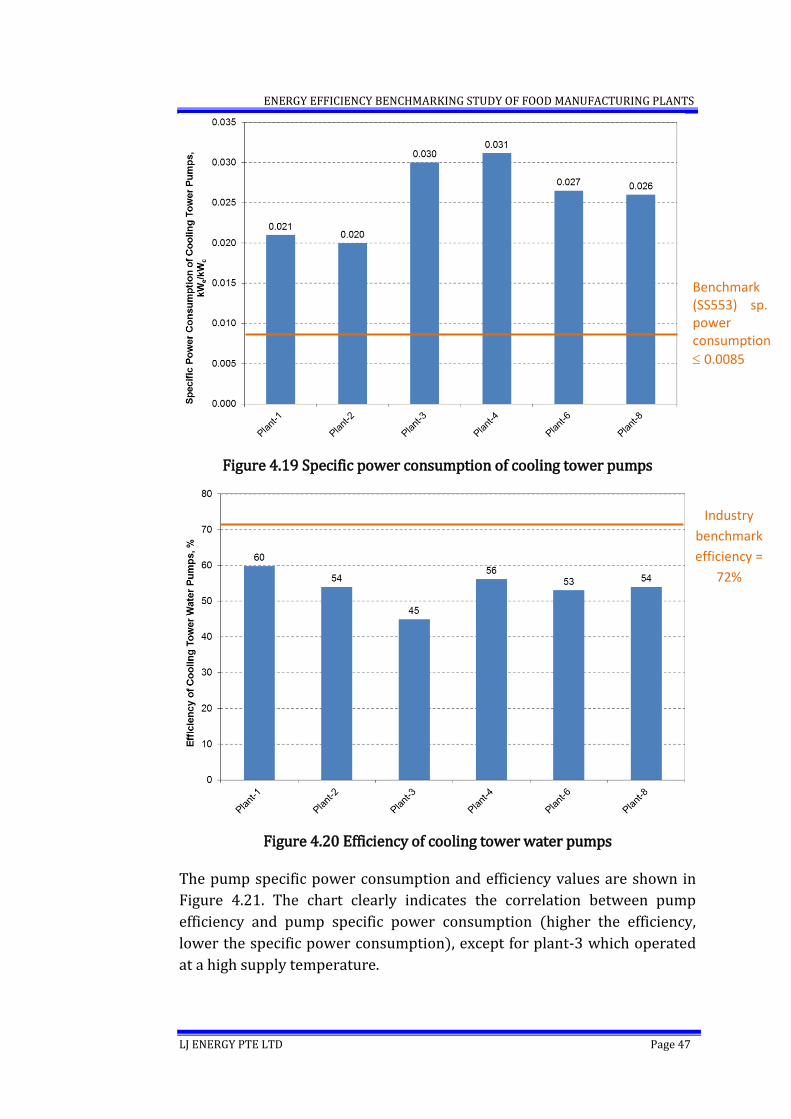
Specific power consumption values of the pumps ranged from 0.02 to 0.031
and were higher than the benchmark minimum value of 0.0085 (Figure
4.19). The overall pump and motor efficiency of the plants ranged from 45
to 60% (Figure 4.20).
Industry
benchmark
heat
rejection
rate 117
ENERGY EFFICIENCY BENCHMARKING STUDY OF FOOD MANUFACTURING PLANTS
LJ ENERGY PTE LTD Page 47
Figure 4.19 Specific power consumption of cooling tower pumps
Figure 4.20 Efficiency of cooling tower water pumps
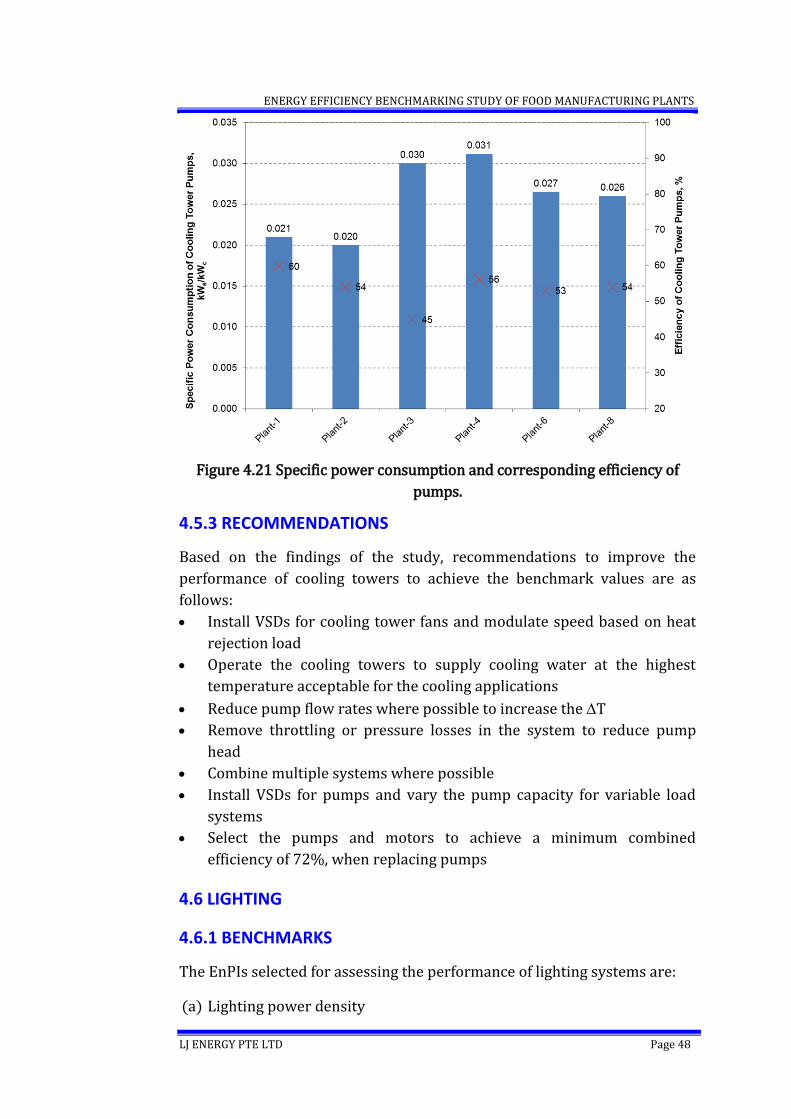
The pump specific power consumption and efficiency values are shown in
Figure 4.21. The chart clearly indicates the correlation between pump
efficiency and pump specific power consumption (higher the efficiency,
lower the specific power consumption), except for plant-3 which operated
at a high supply temperature.
Benchmark (SS553) sp. power consumption
0.0085
Industry
benchmark
efficiency =
72%
ENERGY EFFICIENCY BENCHMARKING STUDY OF FOOD MANUFACTURING PLANTS
LJ ENERGY PTE LTD Page 48
Figure 4.21 Specific power consumption and corresponding efficiency of
pumps.
4.5.3 RECOMMENDATIONS
Based on the findings of the study, recommendations to improve the
performance of cooling towers to achieve the benchmark values are as
follows:
Install VSDs for cooling tower fans and modulate speed based on heat
rejection load
Operate the cooling towers to supply cooling water at the highest
temperature acceptable for the cooling applications
Reduce pump flow rates where possible to increase the T
Remove throttling or pressure losses in the system to reduce pump
head
Combine multiple systems where possible
Install VSDs for pumps and vary the pump capacity for variable load
systems
Select the pumps and motors to achieve a minimum combined
efficiency of 72%, when replacing pumps
4.6 LIGHTING
4.6.1 BENCHMARKS
The EnPIs selected for assessing the performance of lighting systems are:
(a) Lighting power density
ENERGY EFFICIENCY BENCHMARKING STUDY OF FOOD MANUFACTURING PLANTS
LJ ENERGY PTE LTD Page 49
(b) Illuminance level
Lighting power density
The lighting power density is defined as:
2e
m area, Floor
W ballast, or gear including lamps of Power density power Lighting
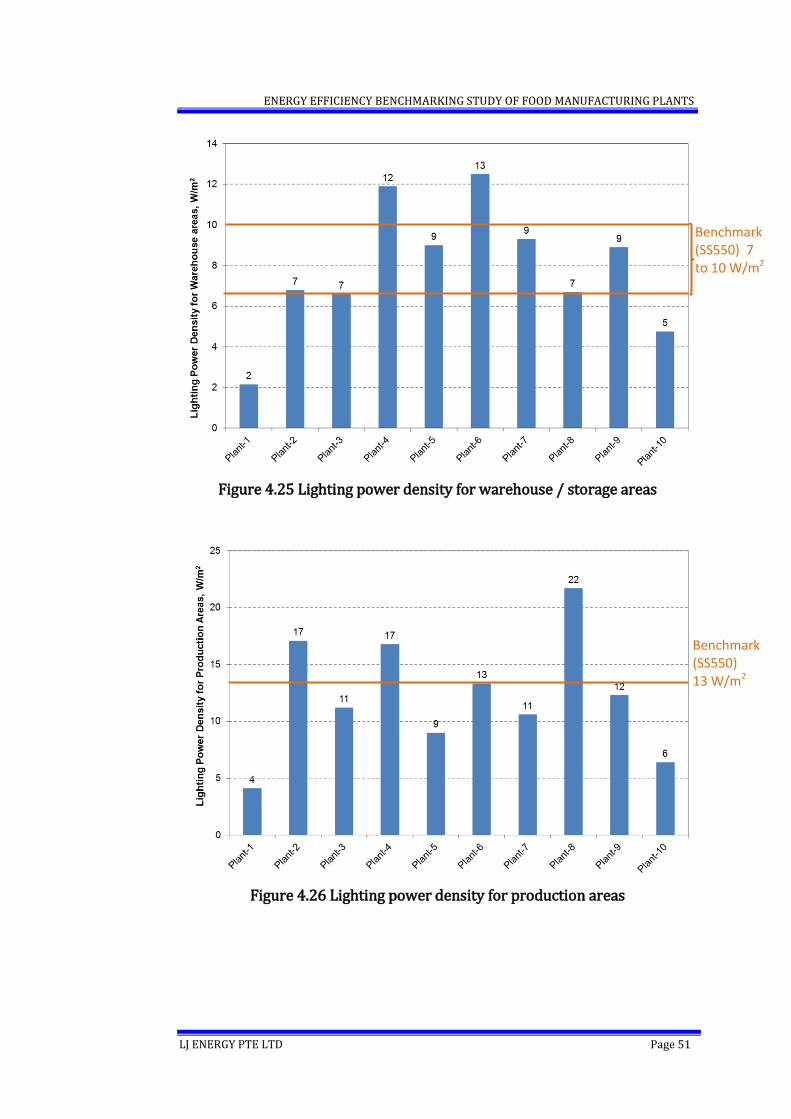
Benchmark values of lighting power density (SS530): 7 W/m2 for warehouses
10 W/m2 for storage areas
12 W/m2 for office areas
13 W/m2 for production areas
Illuminance level
Illuminance level or Lux level is the luminous flux incident on a surface of
unit area.
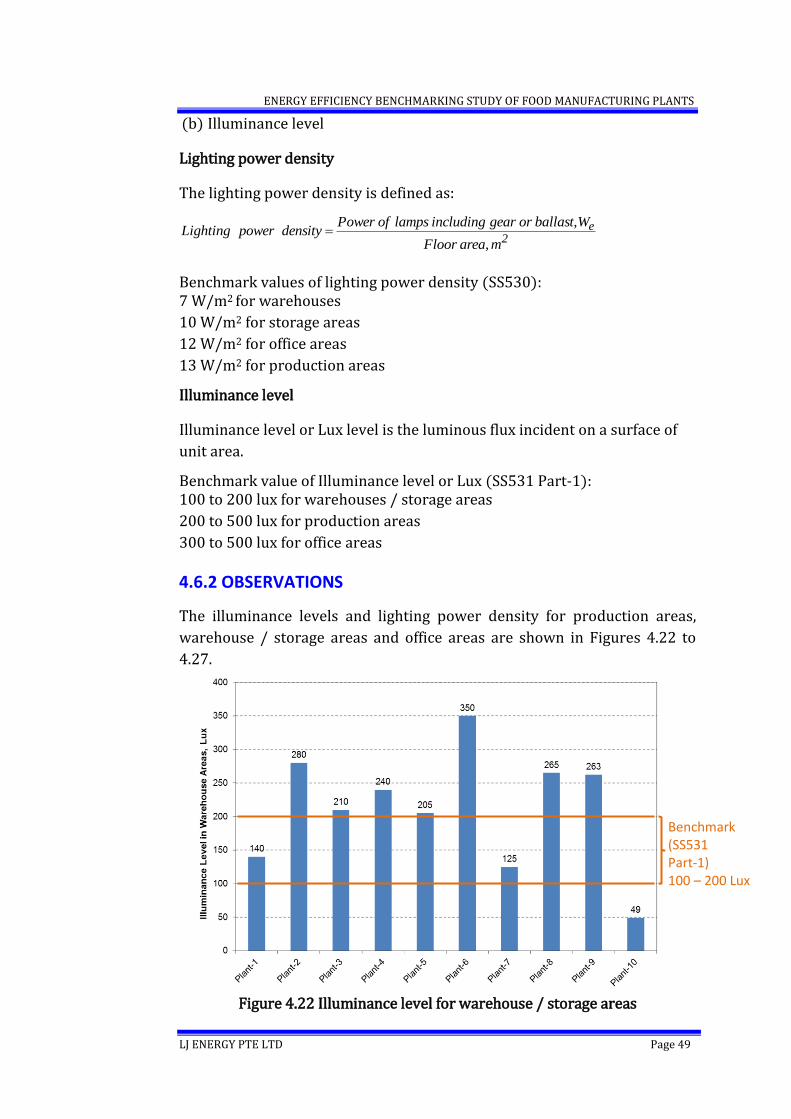
Benchmark value of Illuminance level or Lux (SS531 Part-1): 100 to 200 lux for warehouses / storage areas
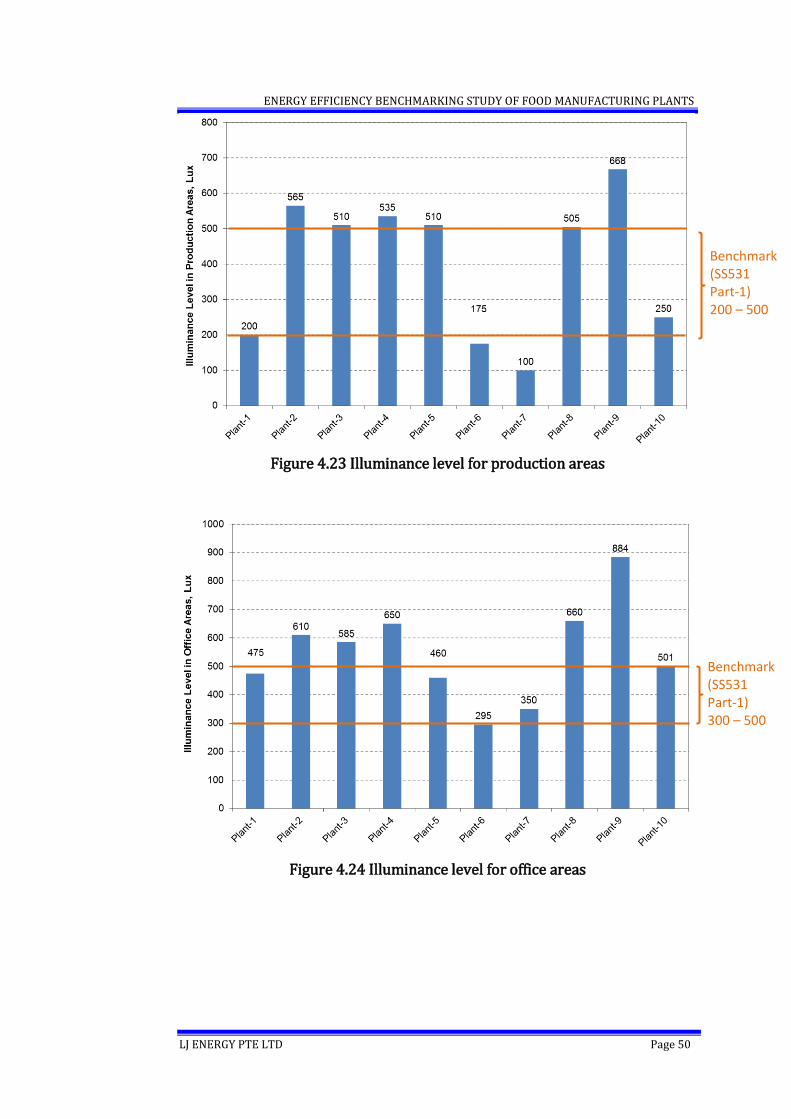
200 to 500 lux for production areas
300 to 500 lux for office areas
4.6.2 OBSERVATIONS
The illuminance levels and lighting power density for production areas,
warehouse / storage areas and office areas are shown in Figures 4.22 to
4.27.
Figure 4.22 Illuminance level for warehouse / storage areas
Benchmark (SS531 Part-1) 100 – 200 Lux
ENERGY EFFICIENCY BENCHMARKING STUDY OF FOOD MANUFACTURING PLANTS
LJ ENERGY PTE LTD Page 50
Figure 4.23 Illuminance level for production areas
Figure 4.24 Illuminance level for office areas
Benchmark (SS531 Part-1) 300 – 500 Lux
Benchmark (SS531 Part-1) 200 – 500 Lux
ENERGY EFFICIENCY BENCHMARKING STUDY OF FOOD MANUFACTURING PLANTS
LJ ENERGY PTE LTD Page 51
Figure 4.25 Lighting power density for warehouse / storage areas
Figure 4.26 Lighting power density for production areas
Benchmark (SS550) 7 to 10 W/m2
Benchmark (SS550) 13 W/m2
ENERGY EFFICIENCY BENCHMARKING STUDY OF FOOD MANUFACTURING PLANTS
LJ ENERGY PTE LTD Page 52
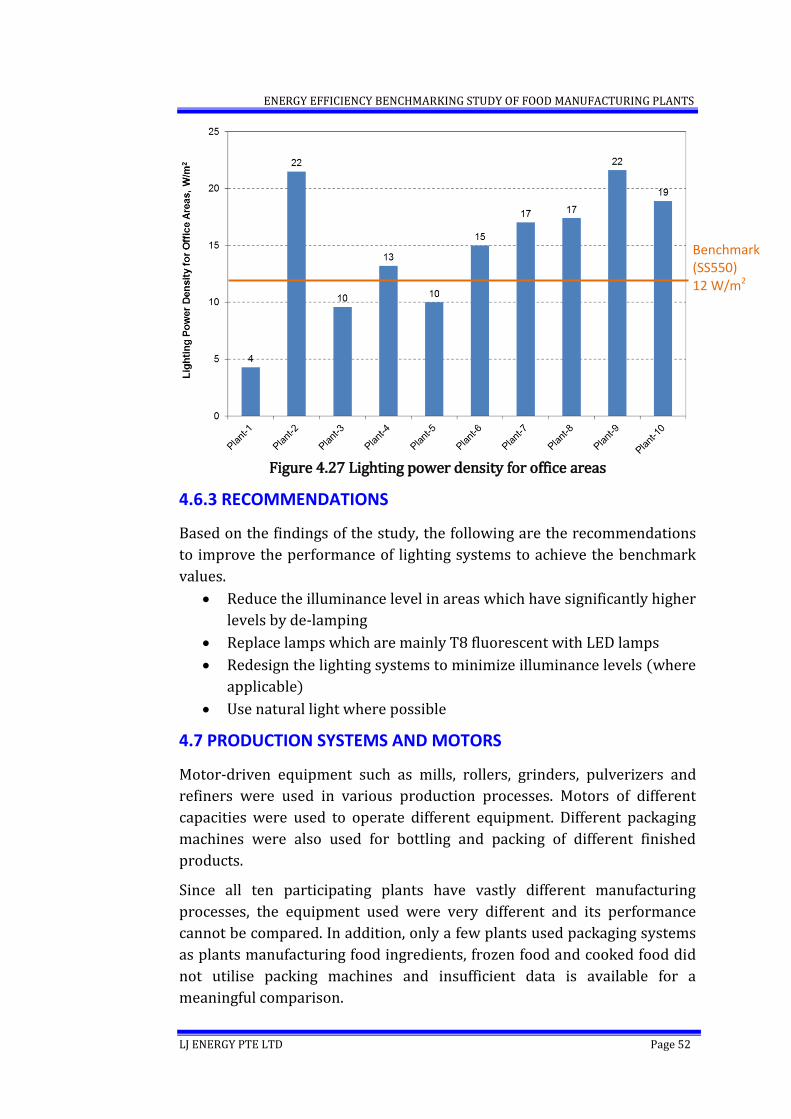
Figure 4.27 Lighting power density for office areas
4.6.3 RECOMMENDATIONS
Based on the findings of the study, the following are the recommendations
to improve the performance of lighting systems to achieve the benchmark
values.
Reduce the illuminance level in areas which have significantly higher
levels by de-lamping
Replace lamps which are mainly T8 fluorescent with LED lamps
Redesign the lighting systems to minimize illuminance levels (where
applicable)
Use natural light where possible
4.7 PRODUCTION SYSTEMS AND MOTORS
Motor-driven equipment such as mills, rollers, grinders, pulverizers and
refiners were used in various production processes. Motors of different
capacities were used to operate different equipment. Different packaging
machines were also used for bottling and packing of different finished
products.
Since all ten participating plants have vastly different manufacturing
processes, the equipment used were very different and its performance
cannot be compared. In addition, only a few plants used packaging systems
as plants manufacturing food ingredients, frozen food and cooked food did
not utilise packing machines and insufficient data is available for a
meaningful comparison.
Benchmark (SS550) 12 W/m2
ENERGY EFFICIENCY BENCHMARKING STUDY OF FOOD MANUFACTURING PLANTS
LJ ENERGY PTE LTD Page 53
5.0 SUMMARY OF ENERGY SAVING MEASURES
5.1 BOILER SYSTEMS
Improving combustion efficiency
A major loss in boiler systems is due to the hot gases discharged through
the chimney. If there is a lot of excess air, the increased quantity of exhaust
gas will lead to higher heat losses. Similarly, insufficient air for combustion
results in wastage of fuel due to incomplete combustion and reduces the
heat transfer efficiency due to soot buildup on heat transfer surfaces.
The amount of excess air required depends on the type of fuel and, in
general, a minimum of about 10 to 15% excess air is required for complete
combustion. This translates to about 2 to 3% excess oxygen.
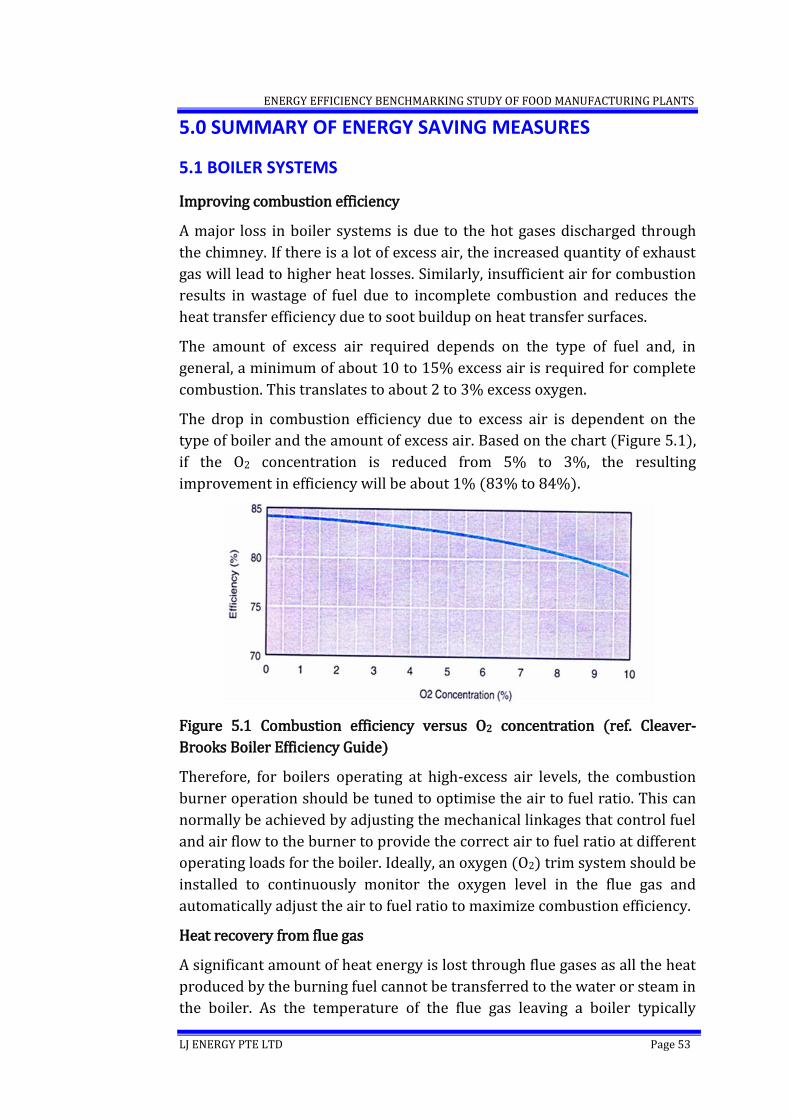
The drop in combustion efficiency due to excess air is dependent on the
type of boiler and the amount of excess air. Based on the chart (Figure 5.1),
if the O2 concentration is reduced from 5% to 3%, the resulting
improvement in efficiency will be about 1% (83% to 84%).
Figure 5.1 Combustion efficiency versus O2 concentration (ref. Cleaver-
Brooks Boiler Efficiency Guide)
Therefore, for boilers operating at high-excess air levels, the combustion
burner operation should be tuned to optimise the air to fuel ratio. This can
normally be achieved by adjusting the mechanical linkages that control fuel
and air flow to the burner to provide the correct air to fuel ratio at different
operating loads for the boiler. Ideally, an oxygen (O2) trim system should be
installed to continuously monitor the oxygen level in the flue gas and
automatically adjust the air to fuel ratio to maximize combustion efficiency.
Heat recovery from flue gas
A significant amount of heat energy is lost through flue gases as all the heat
produced by the burning fuel cannot be transferred to the water or steam in
the boiler. As the temperature of the flue gas leaving a boiler typically
ENERGY EFFICIENCY BENCHMARKING STUDY OF FOOD MANUFACTURING PLANTS
LJ ENERGY PTE LTD Page 54
ranges from 150 to 250oC, about 10 to 20% of the heat energy is lost
through it. Therefore, recovering part of the heat from flue gas can help to
improve the efficiency of the boiler.
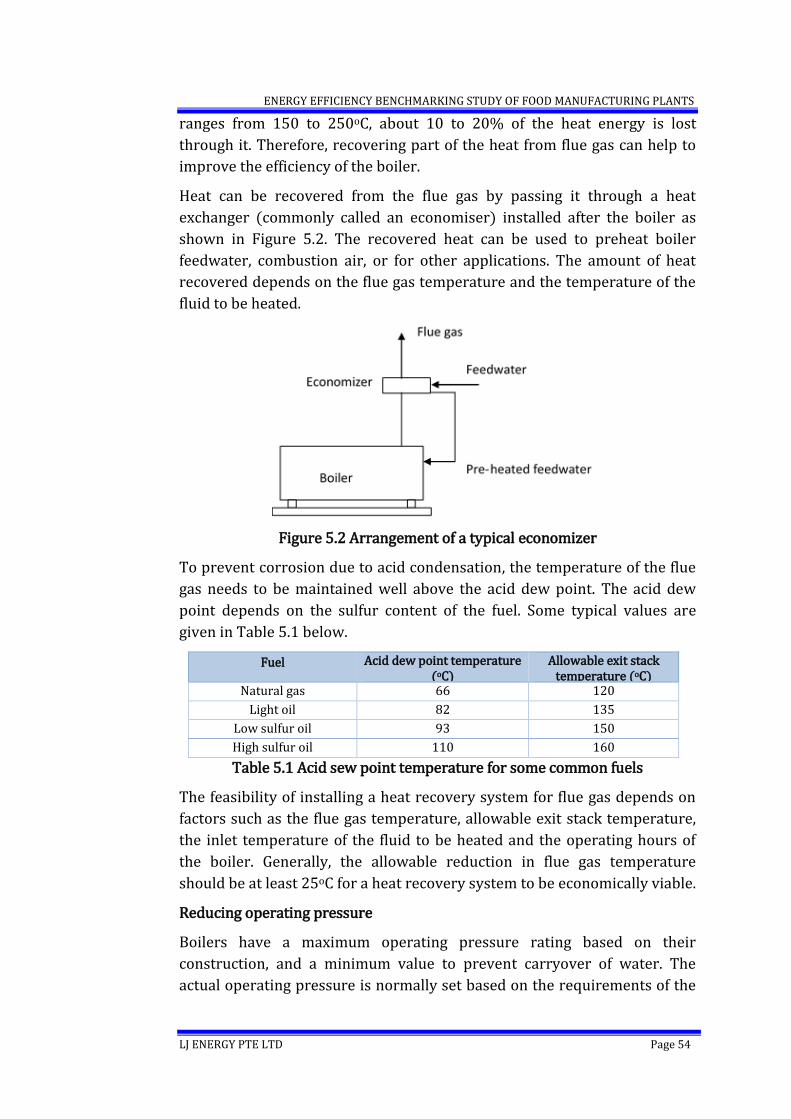
Heat can be recovered from the flue gas by passing it through a heat
exchanger (commonly called an economiser) installed after the boiler as
shown in Figure 5.2. The recovered heat can be used to preheat boiler
feedwater, combustion air, or for other applications. The amount of heat
recovered depends on the flue gas temperature and the temperature of the
fluid to be heated.
Figure 5.2 Arrangement of a typical economizer
To prevent corrosion due to acid condensation, the temperature of the flue
gas needs to be maintained well above the acid dew point. The acid dew
point depends on the sulfur content of the fuel. Some typical values are
given in Table 5.1 below.
Fuel Acid dew point temperature (oC)
Allowable exit stack temperature (oC)
Natural gas 66 120
Light oil 82 135
Low sulfur oil 93 150
High sulfur oil 110 160
Table 5.1 Acid sew point temperature for some common fuels
The feasibility of installing a heat recovery system for flue gas depends on
factors such as the flue gas temperature, allowable exit stack temperature,
the inlet temperature of the fluid to be heated and the operating hours of
the boiler. Generally, the allowable reduction in flue gas temperature
should be at least 25oC for a heat recovery system to be economically viable.
Reducing operating pressure
Boilers have a maximum operating pressure rating based on their
construction, and a minimum value to prevent carryover of water. The
actual operating pressure is normally set based on the requirements of the
ENERGY EFFICIENCY BENCHMARKING STUDY OF FOOD MANUFACTURING PLANTS
LJ ENERGY PTE LTD Page 55
end-users, while ensuring it is within the specified maximum and minimum
values.
Since boiler efficiency depends on the operating pressure, if the operating
pressure is set higher than required, energy savings can be achieved by
reducing it to match the actual requirements.
When the boiler pressure is reduced, more latent heat is available for
heating applications (lower the pressure, higher the latent heat), as a result
of which, less steam is required for a particular heating load. In addition,
the heat input required to raise feed-water to the saturation temperature
also reduces with lowering of steam pressure. Hence, for the same heating
load, the total heat input to the boiler will reduce.
Therefore, the required steam pressure and temperature should be
reviewed and the boiler operating pressure set to the lowest possible value
while ensuring that it is within the boiler operating specifications.
Condensate recovery
In most steam systems, steam is used mainly for heating by extracting its
latent heat. The resulting condensate is at steam temperature and still
contains a considerable amount of heat. Therefore, returning condensate to
the boiler feed-water tank will result in significant fuel energy savings.
Since condensate is distilled water, it is ideal for use as boiler feed-water.
Condensate recovery will help to reduce water consumption, water
treatment cost, and frequency of boiler blowdown.
Usually, a low feed-water temperature or high make-up water flow
indicates that less condensate is recovered. If the make-up water flow is
metered, the difference between the amount of steam produced and make-
up water flow will give an indication of the amount of condensate that is not
recovered. This is especially relevant for applications which do not
consume live steam (such as open sparge coils and direct steam injection
systems)
For applications where condensate cannot be recovered due to possible
contamination, heat can be recovered to pre-heat make-up or feed-water by
means of a heat exchanger.
Automatic blowdown control
Boiler blowdown is part of the water treatment process and involves
removal of sludge and solids from the boiler. Makeup water used for boilers
contains various impurities. As water is converted to steam, the
concentration of the impurities that remain in the boiler increases. If this
concentration is allowed to increase, it will lead to accelerated corrosion,
scaling and fouling of the heat transfer surfaces of the boiler. Therefore, it is
ENERGY EFFICIENCY BENCHMARKING STUDY OF FOOD MANUFACTURING PLANTS
LJ ENERGY PTE LTD Page 56
necessary to remove part of the water with high concentration of impurities
from the boiler through boiler blowdown and replace it with fresh water.
Boiler blowdown is often performed manually, where a fixed quantity of
water is drained periodically to maintain the water within acceptable TDS
limits.
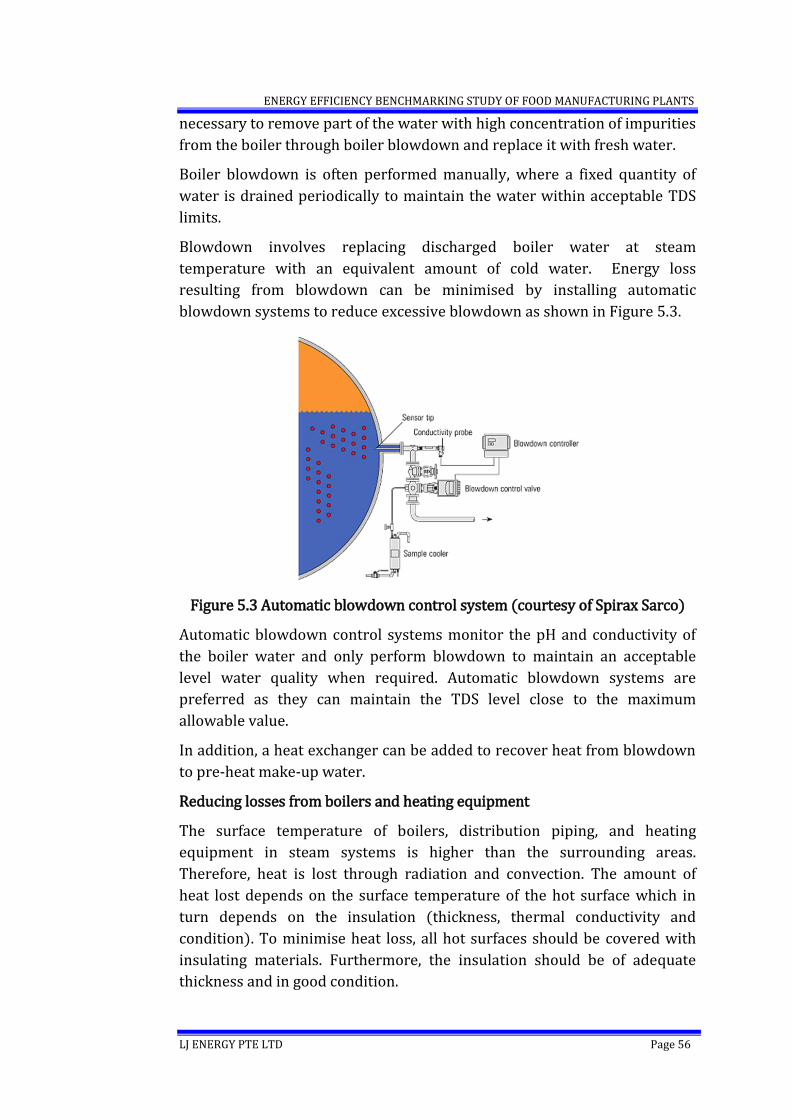
Blowdown involves replacing discharged boiler water at steam
temperature with an equivalent amount of cold water. Energy loss
resulting from blowdown can be minimised by installing automatic
blowdown systems to reduce excessive blowdown as shown in Figure 5.3.
Figure 5.3 Automatic blowdown control system (courtesy of Spirax Sarco)
Automatic blowdown control systems monitor the pH and conductivity of
the boiler water and only perform blowdown to maintain an acceptable
level water quality when required. Automatic blowdown systems are
preferred as they can maintain the TDS level close to the maximum
allowable value.
In addition, a heat exchanger can be added to recover heat from blowdown
to pre-heat make-up water.
Reducing losses from boilers and heating equipment
The surface temperature of boilers, distribution piping, and heating
equipment in steam systems is higher than the surrounding areas.
Therefore, heat is lost through radiation and convection. The amount of
heat lost depends on the surface temperature of the hot surface which in
turn depends on the insulation (thickness, thermal conductivity and
condition). To minimise heat loss, all hot surfaces should be covered with
insulating materials. Furthermore, the insulation should be of adequate
thickness and in good condition.
ENERGY EFFICIENCY BENCHMARKING STUDY OF FOOD MANUFACTURING PLANTS
LJ ENERGY PTE LTD Page 57
Based on experience of boilers operating at normal conditions, heat loss
due to radiation and convection is about 0.5 to 1% for a boiler operating at
full load. Since the radiation and convective losses remain the same
irrespective of boiler loading, a 1% loss at full load can increase to 4% when
the boiler is operating at 25% load.
Improving boiler loading
Generally, the thermal efficiency of boilers operating at full load (design
capacity) is comparable. However, boilers operating at low load will be
inefficient. If a boiler is operated at below 40% of its rated capacity, the
losses can account for a significant percentage of the heat input from the
fuel resulting in low boiler efficiency (about 5% lower). In such situations,
it may be financially justifiable to replace the existing boiler or install a new
boiler which is sized to match the required operating load conditions.
Use of heat pumps and solar heaters
For hot water systems, heat pumps can be used instead of hot water boilers.
Heat pumps operate based on the vapour compression cycle and can
operate at COP (coefficient of performance) of greater than 5.0, which
means that 5 units of heat can be produced using 1 unit of electrical input.
Since heat pumps also produce cooling at the evaporator, this “cold energy”
produced can be further utilised to provide air conditioning which can
further improve the COP to above 8.0.
Most heat pumps can produce a maximum water temperature of about
60oC. Some heat pumps are able to operate at even higher temperatures but
have other constraints such as the need for a minimum loading.
Due to their superior energy efficiency, heat pumps should be considered
for hot water applications. In addition, where space is available, solar hot
water heaters can be used to pre-heat makeup water to reduce the heating
load of the heat pumps.
5.2 CHILLED WATER SYSTEMS
Increasing supply temperature
In chillers, the compressor lift which is the pressure difference between the
condenser and evaporator pressures can be reduced by increasing the
evaporator pressure (by increasing the evaporator temperature).
Based on experience, efficiency of chillers improves by about 2 to 4% for
every 1oC increase in the set-point of the cooling fluid supply temperature.
Hence, the evaporator pressure can be maximised by operating the system
to produce cooling fluid at the highest temperature acceptable for heat
removal.
ENERGY EFFICIENCY BENCHMARKING STUDY OF FOOD MANUFACTURING PLANTS
LJ ENERGY PTE LTD Page 58
In manufacturing processes which require the cooling fluid to be at vastly
different temperatures, instead of operating one chilled water system at a
particular temperature to suit the lowest value required, two or more
chilled water systems can be operated at different temperatures.
If only one particular load requires a low cooling fluid temperature, a
separate standalone system can be used to serve only that load so that the
main chilled water system can operate at a higher temperature.
Similarly, if a low operating temperature is set to increase dehumidification
(low relative humidity), alternative dehumidification systems such as
desiccant wheels and run-around coils can be used so that the main cooling
system can operate at a higher temperature.
For low temperature system using brine / glycol solutions, once the
operating temperature is increased, it may be possible to change the
cooling fluid to chilled water which has better heat transfer characteristics.
Use of water-cooled chillers
In chillers, heat is rejected in the condenser normally to either water or
ambient air during condensing and chillers are categorised according to
whether the condenser is water-cooled or air-cooled.
In air-cooled chillers, a single fan or a number of fans are used to blow
ambient air through the condenser which is normally a finned heat
exchanger. Water-cooled chillers have shell and tube heat exchangers
where the heat is rejected to the condenser water. This warm condenser
water is then pumped to cooling towers where heat is rejected to the
environment. Heat transfer at the cooling towers takes place mainly by
latent cooling where some of the warm condenser water evaporates
absorbing the latent heat of evaporation from the condenser water, thereby
cooling it.
Water-cooled chillers operate at a lower condensing pressure than air-
cooled chillers. The lower condensing pressure is due to the rejection of
heat to condenser water which is first cooled to a temperature a few
degrees above the wet-bulb temperature of the ambient air by the cooling
towers. In air-cooled chillers, heat is directly rejected to the ambient air and
the heat transfer is dependent on the dry-bulb temperature of the air.
Further, the heat transfer in the water-cooled shell and tube heat
exchangers is better than in finned-type air-cooled condensers.
The lower condensing pressure leads to a lower pressure differential
between the evaporator and condenser which results in lower power
consumption by the compressor. Therefore, water-cooled chillers are far
more efficient than air-cooled chillers and should be used where possible.
ENERGY EFFICIENCY BENCHMARKING STUDY OF FOOD MANUFACTURING PLANTS
LJ ENERGY PTE LTD Page 59
Sizing of chillers and chiller replacement
The operating efficiency of chillers depends on their loading and generally,
the chiller efficiency is best when operating in the range 60% to 100% of
the capacity (VSD chillers have different characteristics).
Therefore, chillers should be sized so that they can operate most efficiently
at the cooling load. If the cooling load is highly variable, VSD chillers or
multiple chillers can be considered to optimise the operating efficiency.
Old and inefficient chillers should be replaced. When selecting new chillers,
the cooling demand profile and the part-load performance of the new
chillers should be taken into consideration.
Replacing inefficient pumps
In situations where the pump efficiency is low due to the use of an
inefficient pump or incorrect pump selection (pump is not operating at the
selected duty point), the actual pump operating point (flow rate and
pressure head) should be assessed and a new high efficiency pump selected
for the required duty.
Reducing capacity of pumps
Pumps are sized to provide the design flow requirements while overcoming
the various resistances in the system. Friction losses in piping, across valves
and fittings are normally estimated using specification and research data.
Due to the uncertainty of these estimated values and provision for possible
changes during installation to suit site constraints, safety factors are added
to the design. As a result, a pump can end up being over-sized for its
intended application.
When the capacity of a pump is more than the required value, it will result
in a higher than required liquid flow rate and greater energy consumption
by the pump. Sometimes, when the flow rate is high, valves are used to
throttle the flow to achieve the required flow rate. This too results in energy
wastage.
Therefore, if a pump’s capacity is more than required, the capacity should
be reduced to match the demand by reducing the pump speed, trimming the
impeller or replacing the pump with a suitably sized pump.
Capacity control of cooling towers
Capacity of cooling towers is dependent on the air flow through them.
Therefore, the operating capacity can be reduced by lowering the air flow
rate which would result in lower fan energy consumption.
ENERGY EFFICIENCY BENCHMARKING STUDY OF FOOD MANUFACTURING PLANTS
LJ ENERGY PTE LTD Page 60
The best means of achieving this is by using variable speed drives (VSDs) to
control cooling tower fan speed. The speed of the cooling tower fans in
operation can be modulated to maintain a set temperature.
Theoretically the power consumed by fans is proportional to the cube of the
fan speed. When the cooling load drops to 80%, the speed of cooling tower
fans can also be reduced accordingly resulting in a drop in power
consumption of about 50% (0.83 = 0.51).
Operating extra cooling towers
Almost all installations have one or more stand-by cooling towers to allow
servicing and repair of the operating cooling towers. In such cases, the
stand-by cooling towers can be run in parallel with the cooling towers
already operating so that all operating cooling tower fan speed can be
reduced to provide the same amount of heat rejection. Theoretically, two
cooling towers operating at 50% speed can provide the same heat rejection
as one at 100% speed.
5.3 REFRIGERATION SYSTEMS
Increasing compressor suction pressure
The operating efficiency of a compressor in refrigeration systems improves
when the suction pressure (and temperature) is increased. Based on
experience, an increase in 1oC in suction temperature improves the
compressor operating efficiency by about 3 to 4%. Therefore, refrigeration
systems should be operated at the maximum possible operating
temperature.
In applications where a refrigerated space is used for storing different
products at different times, then ideally, the operating temperature should
be changed every time the product being stored is changed. For instance, if
a cold room used normally to store poultry at -2oC is used to store beef,
then the temperature can be set at 1oC which will improve the compressor
efficiency by about 10%.
In systems serving multiple applications with wide range of operating
temperatures, having separate systems to serve low temperature and high
temperature applications can improve compressor efficiency.
Reducing condenser pressure
Condensers used for refrigeration systems can be air-cooled or water-
cooled with cooling towers and evaporative condensers. Air-cooled
condensers consist of refrigerant coils with circulation fans and the
ENERGY EFFICIENCY BENCHMARKING STUDY OF FOOD MANUFACTURING PLANTS
LJ ENERGY PTE LTD Page 61
condensing pressure and therefore the temperature is dependent on the
dry bulb temperature of air.
Water-cooled condenser consists of shell and tube condensers or plate heat
exchangers where the refrigerant is condensed into liquid using water from
cooling towers which can reach close to the wet-bulb temperature of
ambient air. Evaporative condensers are also commonly used in industrial
refrigeration systems. They are essentially a combination of a cooling tower
and refrigerant condenser and can operate at a relatively lower condenser
pressure.
The operating efficiency of compressors is dependent on the compressor
lift which is the difference between the suction and discharge pressures,
and can be improved by reducing the condensing pressure. The refrigerant
condensing pressure is dependent on the condensing temperature of the
cooling fluid. Hence, water-cooled condensers and evaporative condensers
which reject heat at condensing temperatures close to the wet-bulb
temperature of air result in lower condensing pressures compared to air-
cooled condensers.
The efficiency gain when using water-cooled systems instead of air-cooled
condensers is dependent on the dry bulb and wet-bulb temperature of
ambient air. In general, improvement in compressor efficiency of 10 to 20%
can be achieved by using water-cooled systems.
Repair / replace controls
In refrigeration systems, the compressor operation is controlled to
maintain the required temperature in the refrigerated space. This is
achieved by monitoring the suction pressure at the compressor and varying
the compressor capacity by loading / unloading, speed variation or slide
valve. In systems with multiple compressors, suction pressure is also used
to control the number of compressors in operation.
If the suction pressure sensor or controller is defective, compressors would
be loaded unnecessarily resulting in energy wastage. Therefore, the
functionality of the sensor and controller should be regularly checked to
ensure optimum system operation.
Replacing inefficient systems
Some old refrigeration systems operate inefficiently due to factors such as
older technology, wear and tear, and capacity mismatch.
When systems are due for replacement, they should be replaced with new
equipment sized to match the actual demand. Variable speed compressors
should be used where the load is expected to vary significantly.
ENERGY EFFICIENCY BENCHMARKING STUDY OF FOOD MANUFACTURING PLANTS
LJ ENERGY PTE LTD Page 62
The type of compressors should also be selected to better match load
characteristics keeping in mind that reciprocating compressors operate at
lower loading while screw compressors operate at high loading.
Using alternative systems
Since refrigeration systems can be significant energy users, alternative
cooling systems can be explored to provide full or partial cooling. For
cooling applications from about 0 to 10oC, chillers with glycol or chilled
water can be considered.
If the temperature of the product is high when reaching the refrigeration
system, alternative cooling systems can be used to pre-cool the product
before refrigeration. Such alternative cooling systems can be ambient
cooling or using other less energy intensive cooling fluids such as cooling
tower water or chilled water.
Varying speed of evaporator fans
Evaporators consist of coils where the liquid refrigerant evaporates by
absorbing latent heat of vaporization and changes to vapour state, thereby
providing cooling. In addition to the coil, evaporators have fans to circulate
air between the coil and the cooled space.
Although the rated capacity of evaporator fans is relatively low compared
to the compressor power, since they operate 24 hours a day, they can
account for a significant amount of energy consumption. To reduce energy
consumption during operation, variable frequency drives (VFDs) can be
installed together with a suitable temperature sensor and controller to
reduce the fan speed or completely switch them off when the desired space
temperature is reached.
Reducing load
During storage of products in a cold room, the heat gain is dependent on
many factors like the storage temperature, insulation of the storage space,
air leakages between the cold space and external environment and heat
added by lighting installed inside the storage space.
Once the product being stored reaches the storage temperature, the
refrigeration system operates continuously only to remove heat gain from
external and internal sources of heat. The main internal source of heat is
lighting. Therefore, energy efficient lighting like LEDs which emit less heat
should be used while the usage of lighting should be minimized by
switching them off when not required. Occupancy sensors can be used to
switch off most of the lighting leaving a few to be controlled manually.
ENERGY EFFICIENCY BENCHMARKING STUDY OF FOOD MANUFACTURING PLANTS
LJ ENERGY PTE LTD Page 63
Due to the large temperature gradient between the refrigerated space and
the ambient, good insulation should be used to minimize heat gain through
the exterior surfaces of the storage space and refrigerant pipes. In addition,
air leakage between the cold space and the exterior should be minimized by
replacing ineffective door seals regularly and only opening the doors when
required. In applications where the doors need to be frequently opened,
automatic doors or strip curtains should be installed.
5.4 COMPRESSED AIR SYSTEMS
Rectifying leaks
Since compressed air is produced, stored, distributed and used at a much
higher pressure than the surrounding air, compressed air will leak through
even the smallest openings resulting in energy wastage. In many
compressed air systems, leaks account for about 5 to 20% of the total
compressed air usage.
Common sources of leaks are pipe fittings, flexible tubes, couplings,
pressure regulators, condensate traps and pipe joints.
Since compressed air systems are highly energy intensive, a regular leak
detection program should be implemented and leaks rectified as soon as
possible.
Using alternative sources
Often compressed air is used for applications that can be served by
alternative systems which consume less energy to perform the same task.
For example, high pressure blowers can be used for tank agitation, cleaning
and product drying.
Replacing inefficient compressors
Where multiple small compressors are used, they can be replaced with a
single large capacity compressor which can operate more efficiently. In
addition, when replacing compressors, the capacity of the new compressors
should be determined by measuring the actual load to minimize unloading
of compressors.
If the compressed air demand is highly variable, a variable speed
compressor can be considered. Since oil-free compressors are less efficient
than oil-injected type, they should be used only for applications which may
have potential for product contamination.
Compressed air recovery
Typically compressed air at 40 bar is used for bottle blowing applications.
Since the same bottle blowing machines also require low pressure air for
ENERGY EFFICIENCY BENCHMARKING STUDY OF FOOD MANUFACTURING PLANTS
LJ ENERGY PTE LTD Page 64
operation of actuators and controls, part of the high pressure compressed
air can be recovered as low pressure air after the bottle blowing process.
Such compressed air recovery systems are available for most types of bottle
blowing machines and part of the used high pressure air can be recovered
at various stages of the blowing process.
Reduction in pressure ratio
The system pressure, which is the pressure at which compressed air is
supplied, depends on factors such as the pressure requirements of the end
users, pressure losses in the system, storage capacity and variation in
demand.
A higher discharge pressure results in a higher compressor power as the
compressor has to work against a higher back pressure. The rule-of-thumb
used in industry is a 7 to 8% increase in compressor power for every 1 bar
increase in compressor discharge pressure.
Therefore, the system pressure should be set to the minimum value
required to satisfy the various uses while minimizing pressure losses in the
system.
Dryers
For applications where it is not necessary to provide dry compressed air,
the system can be operated without a dryer. Where drying is necessary,
refrigerated dryers should be used unless very low dew-points are
required.
5.5 PRODUCTION EQUIPMENT
Replace old motors with more efficient motors
Most motors used for production equipment are rated to be IE1 or IE2.
These motors can be replaced with more efficient IE3 motors and where
feasible, with IE4 motors.
Changing from IE1 to IE2 motors improves efficiency by about 1 to 2%; IE1
to IE3 by about 2 to 4%.
Replace under-loaded motors with lower capacity motors
Motors used for production equipment are often oversized for the
application and hence operate at low loading. The motor operating
efficiency is related to the loading and the efficiency drops significantly
from the rated value generally when the loading is below about 40% of the
rated capacity.
ENERGY EFFICIENCY BENCHMARKING STUDY OF FOOD MANUFACTURING PLANTS
LJ ENERGY PTE LTD Page 65
Therefore, the loading of high capacity motors should be evaluated and
where possible, replaced with lower capacity motors. When replacing these
motors, IE3 or if feasible, IE4 motors should be considered.
If motor loading is artificially increased for fans and pumps by throttling
dampers or valves, the possibility of eliminating the throttle should be
considered when selecting a new motor.
Improving surface insulation
Production equipment such as ovens, heaters and roasters consume
electricity, town gas or natural gas to heat products. Part of the heat input is
lost to the surroundings by convection and radiation at the outer surface of
the equipment. Since the amount of heat loss is dependent on the surface
temperature, losses can be minimized by providing adequate insulation to
reduce the surface temperature.
Heat recovery
In production equipment where waste heat is discharged to the
environment, heat recovery systems should be considered to recover part
of the waste heat which can be used for pre-heating the incoming stream of
air or product. In applications where waste heat cannot be used for the
same process due to the possibility of contamination, the waste heat can be
used for other applications such as producing hot water or pre-heating
boiler make-up water by means of a heat exchanger.
5.6 PROCESS COOLING SYSTEMS
Cooling tower sizing and fan control
Capacity of cooling towers is dependent on the air flow through them.
Therefore, when the heat rejection load is lower than the design value (such
as when only part of the plant is in operation), it is not necessary to run the
cooling towers at full capacity. The cooling tower capacity can be reduced
by reducing the air flow which would result in lower fan energy
consumption.
One way of achieving this is by cooling tower fan cycling where some fans
are switched On/Off to control the supply water temperature. However,
this can result in a swing in water temperature and can cause premature
wear and tear of the cooling tower fan motor drives.
A better way is to use variable frequency drives (VFDs) to control the
cooling tower fan speed. The speed of the cooling tower fans in operation
can be modulated to maintain a set supply temperature. The easiest control
strategy is to maintain the water supply temperature at the design value.
ENERGY EFFICIENCY BENCHMARKING STUDY OF FOOD MANUFACTURING PLANTS
LJ ENERGY PTE LTD Page 66
Alternatively, the set-point can be adjusted to maintain a cooling tower
approach temperature (difference between water supply and wet-bulb
temperatures) so that the water supply temperature is always at a fixed
number of degrees higher than the wet-bulb temperature.
Theoretically, the power consumed by fans is proportional to the cube of
the fan speed. When the cooling load drops to 80%, the speed of cooling
tower fans can also be reduced accordingly, resulting in a drop in power
consumption of about 50% (0.83 = 0.51). Therefore, this control strategy
can lead to significant savings from the cooling tower fans at part-load. Use
of VFDs to control cooling tower capacity rather than fan staging also leads
to reduction in wear tear of the drives due to lower fan speed and less drift
losses (water losses) due to lower air velocity.
Cooling water pump sizing and control
Energy consumed by the pumps can be reduced by minimising losses in the
piping system, selecting pumps to operate at the highest efficiency and
reducing the circulating flow rate to meet the minimum required for the
cooling process.
In most plants, cooling tower water cooling systems serve numerous heat
exchangers serving various production processes. Batch production are
used in most plants and cooling is only required at specific times during
each production cycle. However, in most cases, the cooling water is allowed
to flow through the heat exchangers even when cooling is not required. As a
result, energy is wasted in the pumps.
In such situations, motorised valves should be installed to shut off the flow
to the respective heat exchangers when cooling is not required. The
circulating pumps may also be fitted with variable speed drives and a
control system to maintain a minimum set pressure. In addition,
temperature controls should be installed whereby the valves automatically
adjust to attain the minimum flow rate for the desired rate of cooling.
Cooling water supply temperature and range
The amount of energy consumed by cooling towers is dependent on the
supply water temperature. The lowest achievable water supply
temperature is the wet-bulb temperature. To achieve that, a large surface
area and air flow rate is required.
To minimize energy consumption, cooling towers should be designed and
operated to provide cooling water at the maximum temperature acceptable
by the process cooling system.
ENERGY EFFICIENCY BENCHMARKING STUDY OF FOOD MANUFACTURING PLANTS
LJ ENERGY PTE LTD Page 67
The “range” for cooling towers is the difference in temperatures between
the return and supply streams of water. This range should be maximised
where possible to reduce pumping energy consumption.
5.7 LIGHTING
Replacing inefficient lamps
The amount of light emitted by a lamp per unit of electrical power
consumed is the luminous efficacy of a lamp (lumens/Watt). Higher
luminous efficacy represents better energy efficiency of the lamp. Since
different types of lamps have different efficacies, lamps with low efficacy
can be replaced with those having higher efficacy.
Lighting for most office and manufacturing area can be provided by LED
lamps. For high bay applications, LEDs and metal halides can be considered.
LEDs and high pressure sodium lamps can be considered for outdoor
lighting.
Reducing illuminance levels
The lighting level or lux level required depends on the type of space, tasks
performed in the space and other visual requirements. General illuminance
guidelines used for design of lighting systems for different applications are
available in lighting reference books and codes of practice.
Generally, higher lighting levels lead to higher lighting energy consumption.
Therefore, lighting levels should be minimised and maintained based on the
recommended values and actual requirements.
For new installations, this can be achieved through good lighting design by
optimising factors such as lamp wattage, number of lamps and lamp
spacing. Similarly, for existing installations where it is not cost effective to
redesign lighting systems, other means such as de-lamping, use of task
lighting and replacement of inefficient lamps can be considered to reduce
energy consumption.
Lighting controls
Energy consumed by lighting can also be reduced by minimising their usage
by better matching operations demand through lighting controls. Various
systems such as timers, occupancy sensors and light sensors can be used to
control lighting operations.
Simple timers can be used to switch-on and off all or some lighting circuits
at pre-determined times based on occupancy schedules. Provision for
manual override can be incorporated into the controls so that occupants
can extend the operating hours of lighting circuits based on individual
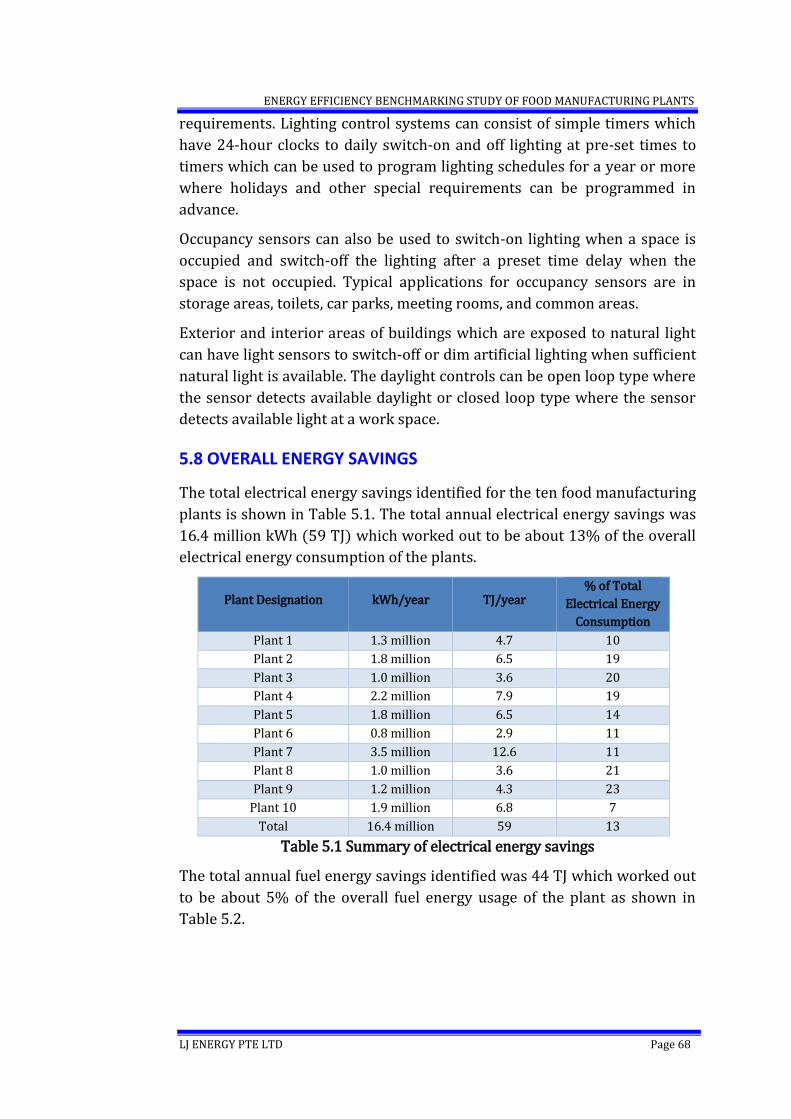
ENERGY EFFICIENCY BENCHMARKING STUDY OF FOOD MANUFACTURING PLANTS
LJ ENERGY PTE LTD Page 68
requirements. Lighting control systems can consist of simple timers which
have 24-hour clocks to daily switch-on and off lighting at pre-set times to
timers which can be used to program lighting schedules for a year or more
where holidays and other special requirements can be programmed in
advance.
Occupancy sensors can also be used to switch-on lighting when a space is
occupied and switch-off the lighting after a preset time delay when the
space is not occupied. Typical applications for occupancy sensors are in
storage areas, toilets, car parks, meeting rooms, and common areas.
Exterior and interior areas of buildings which are exposed to natural light
can have light sensors to switch-off or dim artificial lighting when sufficient
natural light is available. The daylight controls can be open loop type where
the sensor detects available daylight or closed loop type where the sensor
detects available light at a work space.
5.8 OVERALL ENERGY SAVINGS
The total electrical energy savings identified for the ten food manufacturing
plants is shown in Table 5.1. The total annual electrical energy savings was
16.4 million kWh (59 TJ) which worked out to be about 13% of the overall
electrical energy consumption of the plants.
Plant Designation kWh/year TJ/year % of Total
Electrical Energy
Consumption
Plant 1 1.3 million 4.7 10
Plant 2 1.8 million 6.5 19
Plant 3 1.0 million 3.6 20
Plant 4 2.2 million 7.9 19
Plant 5 1.8 million 6.5 14
Plant 6 0.8 million 2.9 11
Plant 7 3.5 million 12.6 11
Plant 8 1.0 million 3.6 21
Plant 9 1.2 million 4.3 23
Plant 10 1.9 million 6.8 7
Total 16.4 million 59 13
Table 5.1 Summary of electrical energy savings
The total annual fuel energy savings identified was 44 TJ which worked out
to be about 5% of the overall fuel energy usage of the plant as shown in
Table 5.2.
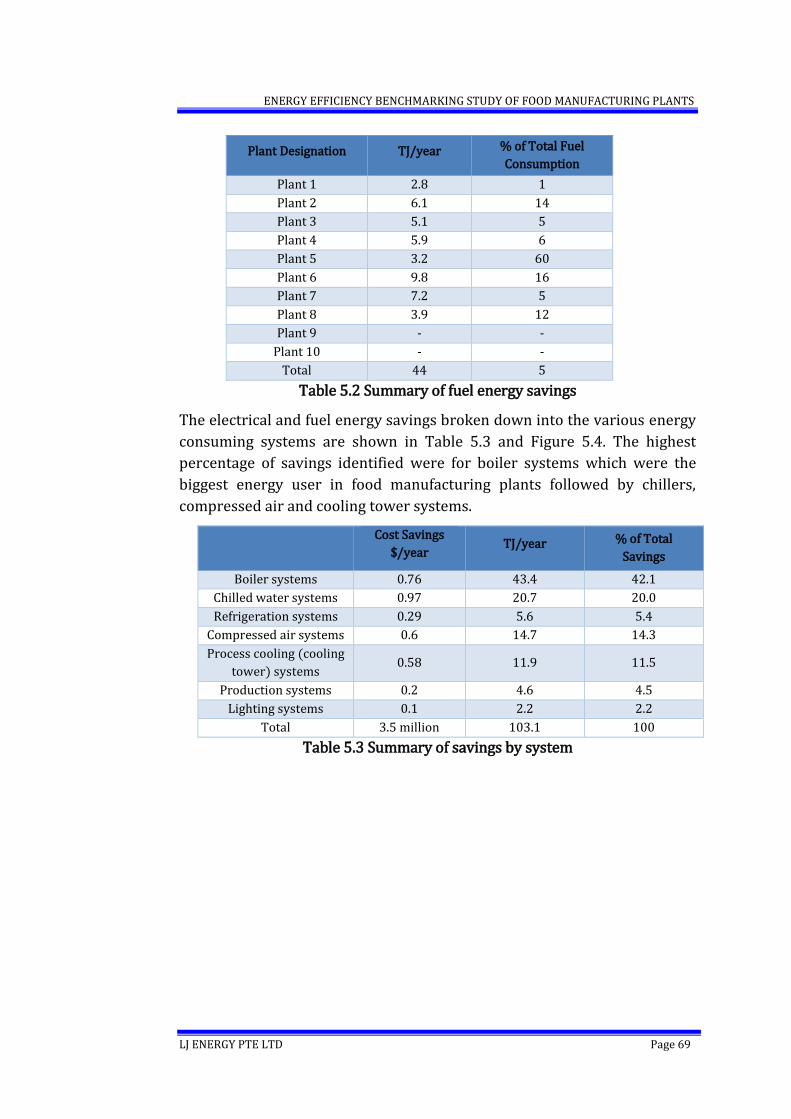
ENERGY EFFICIENCY BENCHMARKING STUDY OF FOOD MANUFACTURING PLANTS
LJ ENERGY PTE LTD Page 69
Plant Designation TJ/year % of Total Fuel
Consumption
Plant 1 2.8 1
Plant 2 6.1 14
Plant 3 5.1 5
Plant 4 5.9 6
Plant 5 3.2 60
Plant 6 9.8 16
Plant 7 7.2 5
Plant 8 3.9 12
Plant 9 - -
Plant 10 - -
Total 44 5
Table 5.2 Summary of fuel energy savings
The electrical and fuel energy savings broken down into the various energy
consuming systems are shown in Table 5.3 and Figure 5.4. The highest
percentage of savings identified were for boiler systems which were the
biggest energy user in food manufacturing plants followed by chillers,
compressed air and cooling tower systems.
Cost Savings
$/year TJ/year % of Total
Savings
Boiler systems 0.76 43.4 42.1
Chilled water systems 0.97 20.7 20.0
Refrigeration systems 0.29 5.6 5.4
Compressed air systems 0.6 14.7 14.3
Process cooling (cooling
tower) systems 0.58 11.9 11.5
Production systems 0.2 4.6 4.5
Lighting systems 0.1 2.2 2.2
Total 3.5 million 103.1 100
Table 5.3 Summary of savings by system
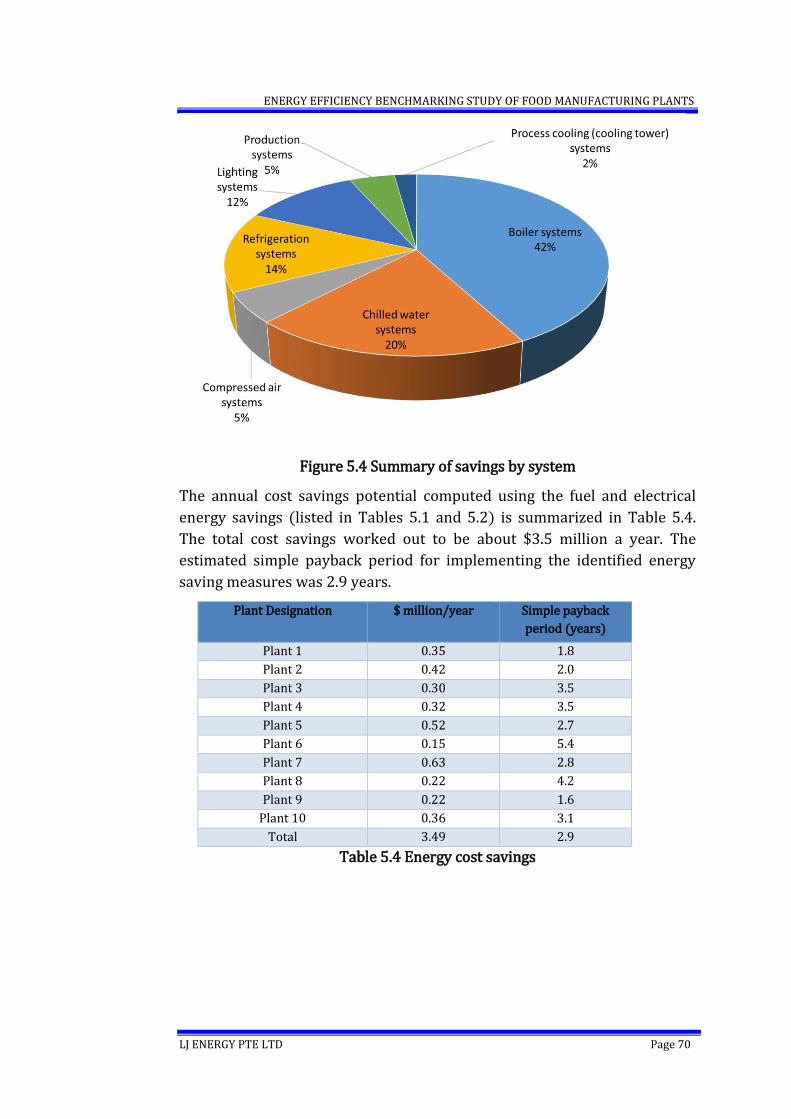
ENERGY EFFICIENCY BENCHMARKING STUDY OF FOOD MANUFACTURING PLANTS
LJ ENERGY PTE LTD Page 70
Figure 5.4 Summary of savings by system
The annual cost savings potential computed using the fuel and electrical
energy savings (listed in Tables 5.1 and 5.2) is summarized in Table 5.4.
The total cost savings worked out to be about $3.5 million a year. The
estimated simple payback period for implementing the identified energy
saving measures was 2.9 years.
Plant Designation $ million/year Simple payback
period (years)
Plant 1 0.35 1.8
Plant 2 0.42 2.0
Plant 3 0.30 3.5
Plant 4 0.32 3.5
Plant 5 0.52 2.7
Plant 6 0.15 5.4
Plant 7 0.63 2.8
Plant 8 0.22 4.2
Plant 9 0.22 1.6
Plant 10 0.36 3.1
Total 3.49 2.9
Table 5.4 Energy cost savings
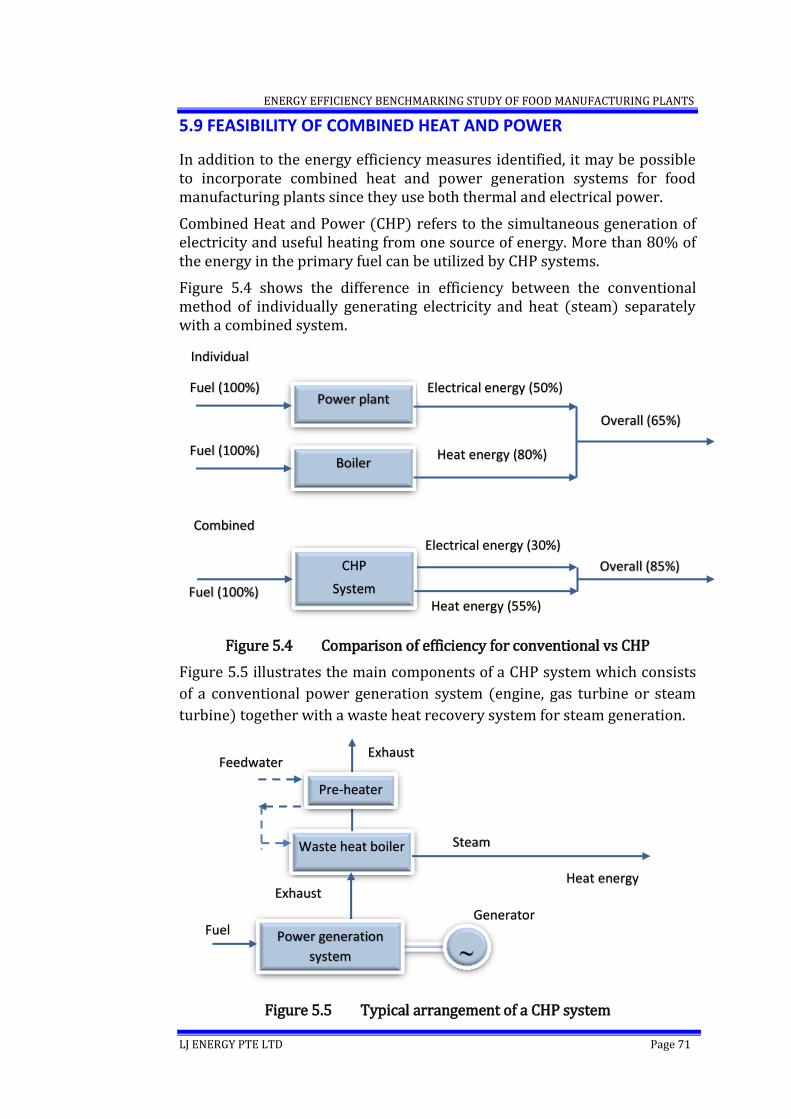
ENERGY EFFICIENCY BENCHMARKING STUDY OF FOOD MANUFACTURING PLANTS
LJ ENERGY PTE LTD Page 71
5.9 FEASIBILITY OF COMBINED HEAT AND POWER
In addition to the energy efficiency measures identified, it may be possible to incorporate combined heat and power generation systems for food manufacturing plants since they use both thermal and electrical power.
Combined Heat and Power (CHP) refers to the simultaneous generation of electricity and useful heating from one source of energy. More than 80% of the energy in the primary fuel can be utilized by CHP systems.
Figure 5.4 shows the difference in efficiency between the conventional method of individually generating electricity and heat (steam) separately with a combined system.
Figure 5.4 Comparison of efficiency for conventional vs CHP
Figure 5.5 illustrates the main components of a CHP system which consists
of a conventional power generation system (engine, gas turbine or steam
turbine) together with a waste heat recovery system for steam generation.
Figure 5.5 Typical arrangement of a CHP system
Steam
Feedwater
Waste heat boiler
Exhaust
Generator Fuel
Power generation
system
Exhaust
Heat energy
Pre-heater
Fuel (100%) Power plant
Overall (65%)
Electrical energy (50%)
Individual
Fuel (100%) Boiler
Heat energy (80%)
Fuel (100%)
Overall (85%)
Electrical energy (30%)
CHP
System Heat energy (55%)
Combined
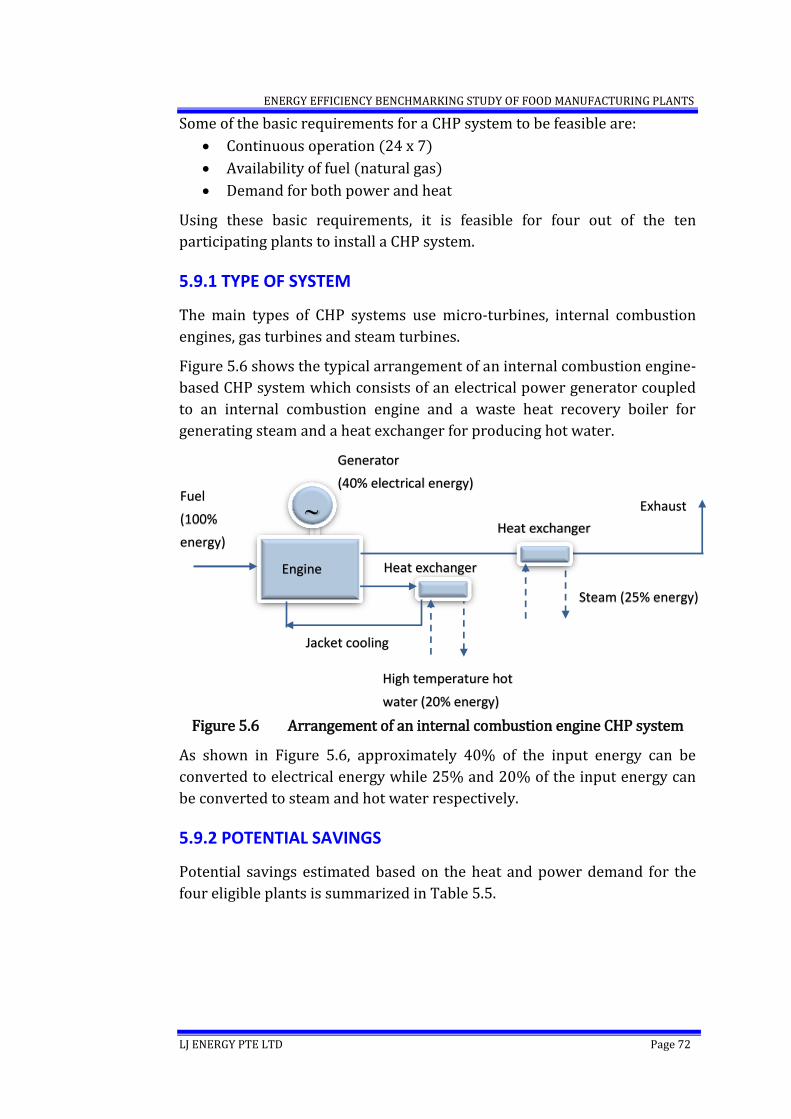
ENERGY EFFICIENCY BENCHMARKING STUDY OF FOOD MANUFACTURING PLANTS
LJ ENERGY PTE LTD Page 72
Some of the basic requirements for a CHP system to be feasible are:
Continuous operation (24 x 7)
Availability of fuel (natural gas)
Demand for both power and heat
Using these basic requirements, it is feasible for four out of the ten
participating plants to install a CHP system.
5.9.1 TYPE OF SYSTEM
The main types of CHP systems use micro-turbines, internal combustion
engines, gas turbines and steam turbines.
Figure 5.6 shows the typical arrangement of an internal combustion engine-
based CHP system which consists of an electrical power generator coupled
to an internal combustion engine and a waste heat recovery boiler for
generating steam and a heat exchanger for producing hot water.
Figure 5.6 Arrangement of an internal combustion engine CHP system
As shown in Figure 5.6, approximately 40% of the input energy can be
converted to electrical energy while 25% and 20% of the input energy can
be converted to steam and hot water respectively.
5.9.2 POTENTIAL SAVINGS
Potential savings estimated based on the heat and power demand for the
four eligible plants is summarized in Table 5.5.
Exhaust Fuel
(100%
energy) Heat exchanger
Engine Heat exchanger
Steam (25% energy)
Generator
(40% electrical energy)
Jacket cooling
water High temperature hot
water (20% energy)
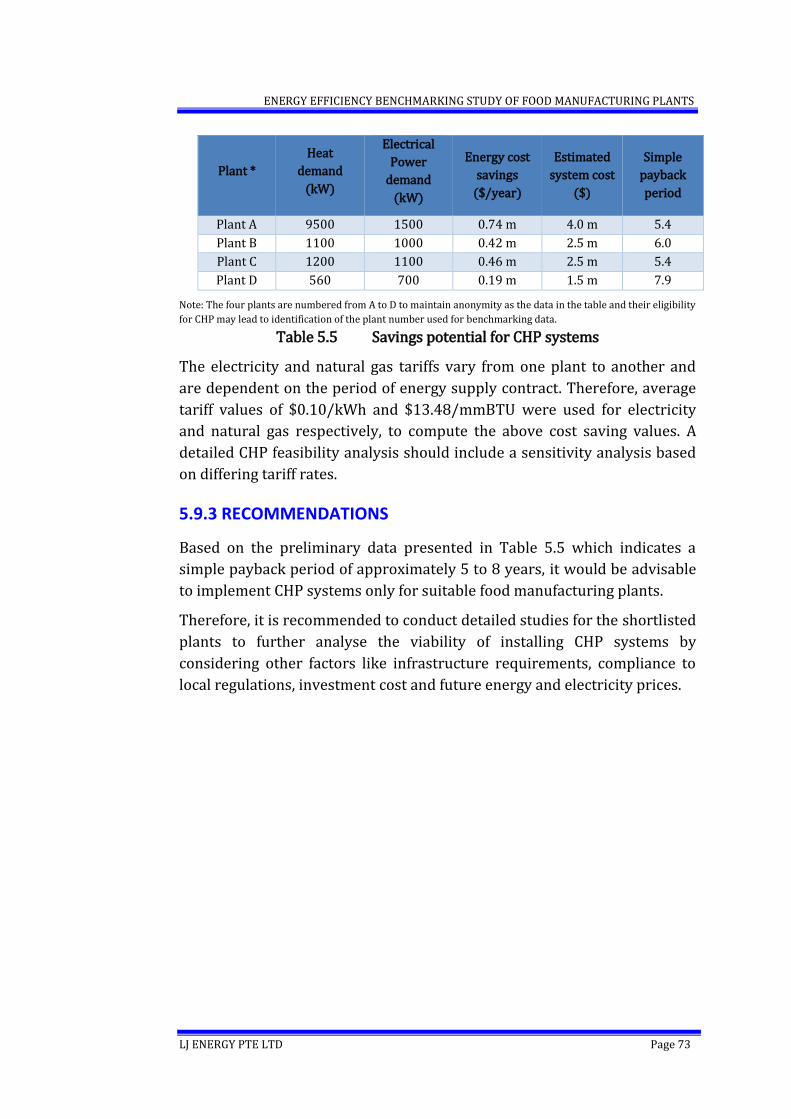
ENERGY EFFICIENCY BENCHMARKING STUDY OF FOOD MANUFACTURING PLANTS
LJ ENERGY PTE LTD Page 73
Plant *
Heat
demand
(kW)
Electrical
Power
demand
(kW)
Energy cost
savings
($/year)
Estimated
system cost
($)
Simple
payback
period
Plant A 9500 1500 0.74 m 4.0 m 5.4
Plant B 1100 1000 0.42 m 2.5 m 6.0
Plant C 1200 1100 0.46 m 2.5 m 5.4
Plant D 560 700 0.19 m 1.5 m 7.9
Note: The four plants are numbered from A to D to maintain anonymity as the data in the table and their eligibility
for CHP may lead to identification of the plant number used for benchmarking data.
Table 5.5 Savings potential for CHP systems
The electricity and natural gas tariffs vary from one plant to another and
are dependent on the period of energy supply contract. Therefore, average
tariff values of $0.10/kWh and $13.48/mmBTU were used for electricity
and natural gas respectively, to compute the above cost saving values. A
detailed CHP feasibility analysis should include a sensitivity analysis based
on differing tariff rates.
5.9.3 RECOMMENDATIONS
Based on the preliminary data presented in Table 5.5 which indicates a
simple payback period of approximately 5 to 8 years, it would be advisable
to implement CHP systems only for suitable food manufacturing plants.
Therefore, it is recommended to conduct detailed studies for the shortlisted
plants to further analyse the viability of installing CHP systems by
considering other factors like infrastructure requirements, compliance to
local regulations, investment cost and future energy and electricity prices.
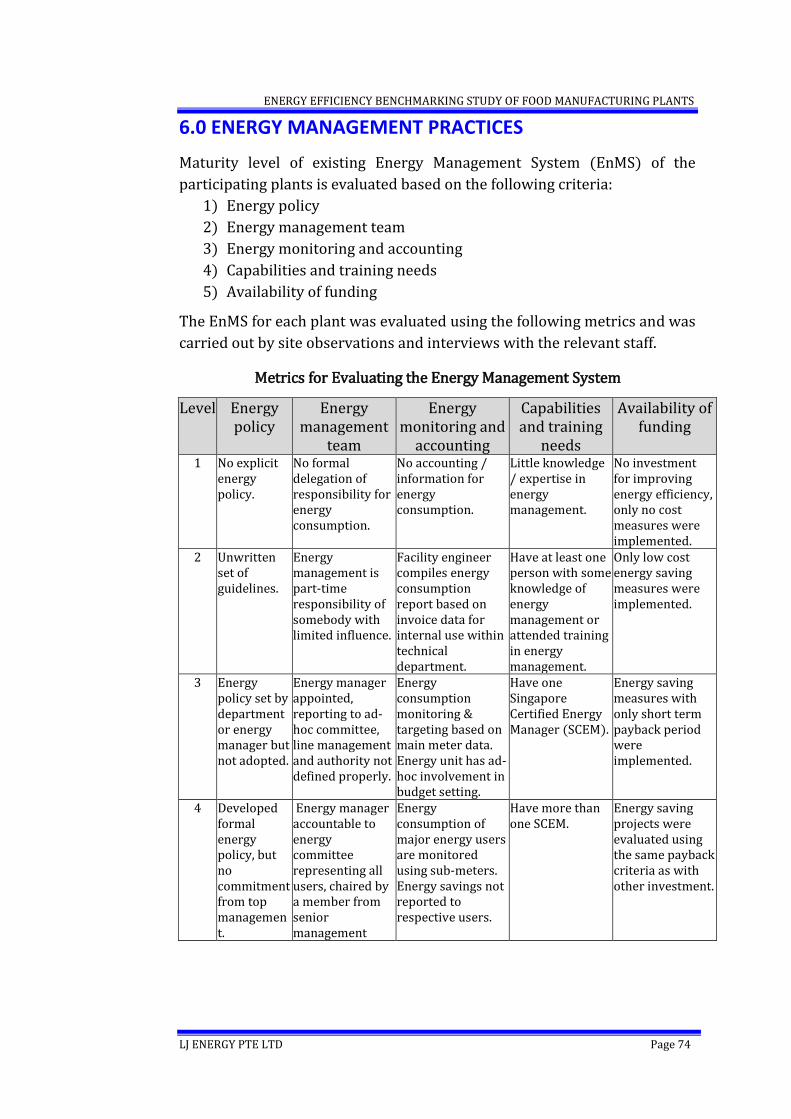
ENERGY EFFICIENCY BENCHMARKING STUDY OF FOOD MANUFACTURING PLANTS
LJ ENERGY PTE LTD Page 74
6.0 ENERGY MANAGEMENT PRACTICES
Maturity level of existing Energy Management System (EnMS) of the
participating plants is evaluated based on the following criteria:
1) Energy policy
2) Energy management team
3) Energy monitoring and accounting
4) Capabilities and training needs
5) Availability of funding
The EnMS for each plant was evaluated using the following metrics and was
carried out by site observations and interviews with the relevant staff.
Metrics for Evaluating the Energy Management System
Level Energy policy
Energy management
team
Energy monitoring and
accounting
Capabilities and training
needs
Availability of funding
1 No explicit energy policy.
No formal delegation of responsibility for energy consumption.
No accounting / information for energy consumption.
Little knowledge / expertise in energy management.
No investment for improving energy efficiency, only no cost measures were implemented.
2 Unwritten set of guidelines.
Energy management is part-time responsibility of somebody with limited influence.
Facility engineer compiles energy consumption report based on invoice data for internal use within technical department.
Have at least one person with some knowledge of energy management or attended training in energy management.
Only low cost energy saving measures were implemented.
3 Energy policy set by department or energy manager but not adopted.
Energy manager appointed, reporting to ad-hoc committee, line management and authority not defined properly.
Energy consumption monitoring & targeting based on main meter data. Energy unit has ad-hoc involvement in budget setting.
Have one Singapore Certified Energy Manager (SCEM).
Energy saving measures with only short term payback period were implemented.
4 Developed formal energy policy, but no commitment from top management.
Energy manager accountable to energy committee representing all users, chaired by a member from senior management
Energy consumption of major energy users are monitored using sub-meters. Energy savings not reported to respective users.
Have more than one SCEM.
Energy saving projects were evaluated using the same payback criteria as with other investment.
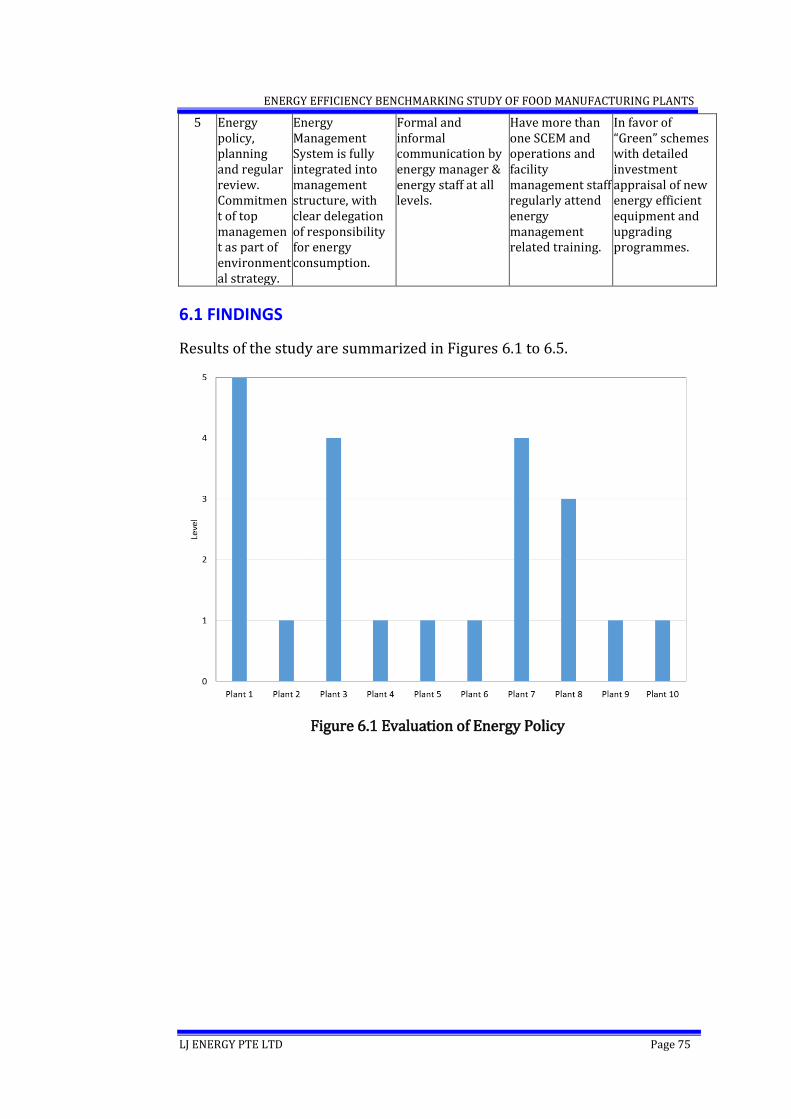
ENERGY EFFICIENCY BENCHMARKING STUDY OF FOOD MANUFACTURING PLANTS
LJ ENERGY PTE LTD Page 75
5 Energy policy, planning and regular review. Commitment of top management as part of environmental strategy.
Energy Management System is fully integrated into management structure, with clear delegation of responsibility for energy consumption.
Formal and informal communication by energy manager & energy staff at all levels.
Have more than one SCEM and operations and facility management staff regularly attend energy management related training.
In favor of “Green” schemes with detailed investment appraisal of new energy efficient equipment and upgrading programmes.
6.1 FINDINGS
Results of the study are summarized in Figures 6.1 to 6.5.
Figure 6.1 Evaluation of Energy Policy
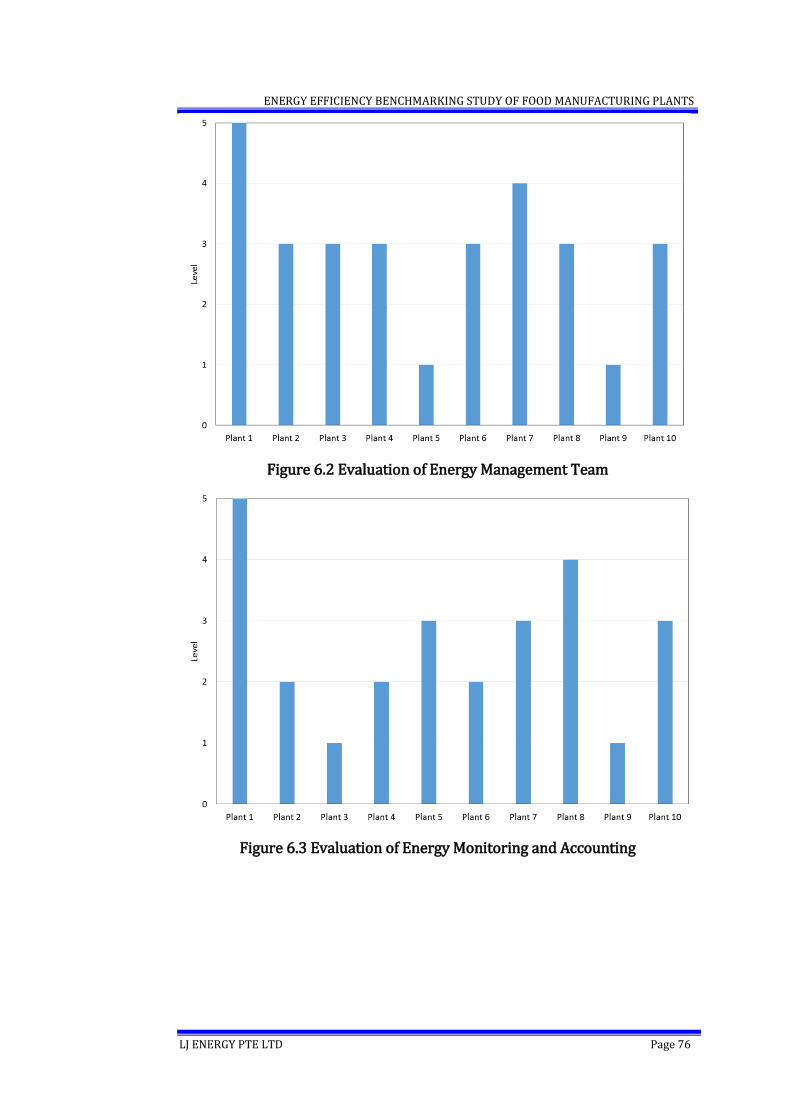
ENERGY EFFICIENCY BENCHMARKING STUDY OF FOOD MANUFACTURING PLANTS
LJ ENERGY PTE LTD Page 76
Figure 6.2 Evaluation of Energy Management Team
Figure 6.3 Evaluation of Energy Monitoring and Accounting
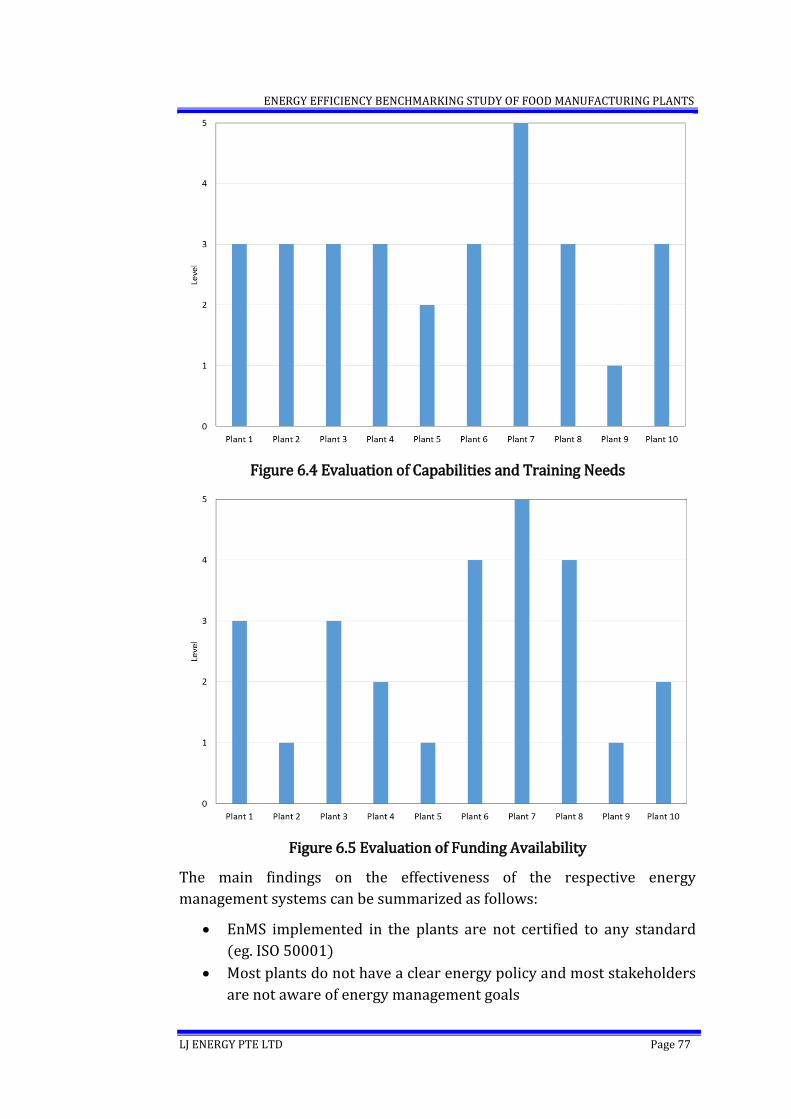
ENERGY EFFICIENCY BENCHMARKING STUDY OF FOOD MANUFACTURING PLANTS
LJ ENERGY PTE LTD Page 77
Figure 6.4 Evaluation of Capabilities and Training Needs
Figure 6.5 Evaluation of Funding Availability
The main findings on the effectiveness of the respective energy
management systems can be summarized as follows:
EnMS implemented in the plants are not certified to any standard
(eg. ISO 50001)
Most plants do not have a clear energy policy and most stakeholders
are not aware of energy management goals
ENERGY EFFICIENCY BENCHMARKING STUDY OF FOOD MANUFACTURING PLANTS
LJ ENERGY PTE LTD Page 78
Energy management is generally the responsibility of the energy
manager and only one plant has a formal energy management team
Energy managers’ role in energy management is mainly part-time
In most plants, only the total energy consumption is tracked and
there are no key Energy Accounting Centres (EACs)
There are only a few permanent monitoring systems installed in the
plants and as such, no regular tracking of EnPIs (energy
performance indicators)
With a maximum of only one SCEM per plant, the availability of
trained personnel required for a sustainable energy management
programme is considered to be inadequate
Since specific budget provisions are not available for energy
management, funding is secured on a case-by-case basis for energy
saving projects
6.2 RECOMMENDATIONS FOR IMPROVEMENT
Based on the findings of the study, the following are the main general
recommendations to improve the energy management systems in the
plants:
Put in place clear energy policy with targets
Establish a formal energy management team with representative
from all stakeholders
Appoint a dedicated energy manager
Identify main EACs
Install monitoring systems for the EACs and energy sub-meters
Set EnPIs for the EACs and regularly track performance
Recognise and reward staff based on achieving targets
Implement ISO 50001 compliant EnMS
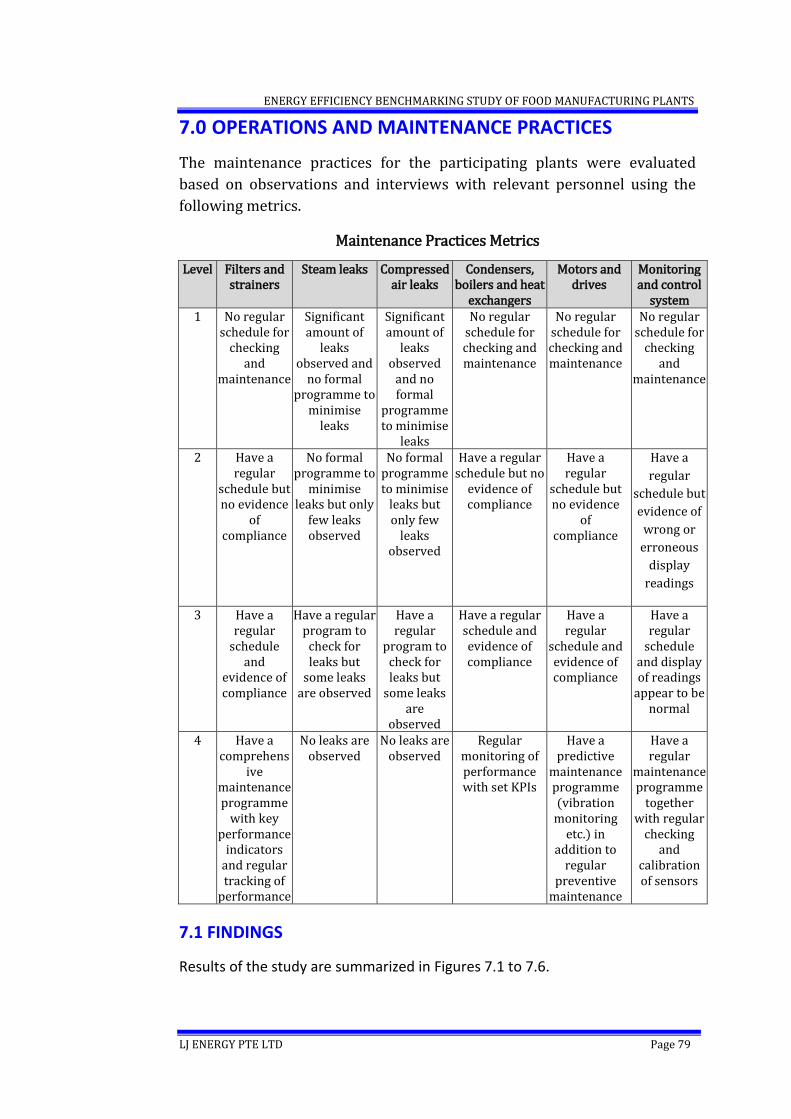
ENERGY EFFICIENCY BENCHMARKING STUDY OF FOOD MANUFACTURING PLANTS
LJ ENERGY PTE LTD Page 79
7.0 OPERATIONS AND MAINTENANCE PRACTICES
The maintenance practices for the participating plants were evaluated
based on observations and interviews with relevant personnel using the
following metrics.
Maintenance Practices Metrics
Level Filters and strainers
Steam leaks Compressed air leaks
Condensers, boilers and heat
exchangers
Motors and drives
Monitoring and control
system 1 No regular
schedule for checking
and maintenance
Significant amount of
leaks observed and
no formal programme to
minimise leaks
Significant amount of
leaks observed
and no formal
programme to minimise
leaks
No regular schedule for checking and maintenance
No regular schedule for checking and maintenance
No regular schedule for
checking and
maintenance
2 Have a regular
schedule but no evidence
of compliance
No formal programme to
minimise leaks but only
few leaks observed
No formal programme to minimise
leaks but only few
leaks observed
Have a regular schedule but no
evidence of compliance
Have a regular
schedule but no evidence
of compliance
Have a
regular
schedule but
evidence of
wrong or
erroneous
display
readings
3 Have a regular
schedule and
evidence of compliance
Have a regular program to
check for leaks but
some leaks are observed
Have a regular
program to check for leaks but
some leaks are
observed
Have a regular schedule and evidence of compliance
Have a regular
schedule and evidence of compliance
Have a regular
schedule and display of readings
appear to be normal
4 Have a comprehens
ive maintenance programme
with key performance
indicators and regular tracking of
performance
No leaks are observed
No leaks are observed
Regular monitoring of performance with set KPIs
Have a predictive
maintenance programme (vibration
monitoring etc.) in
addition to regular
preventive maintenance
Have a regular
maintenance programme
together with regular
checking and
calibration of sensors
7.1 FINDINGS
Results of the study are summarized in Figures 7.1 to 7.6.
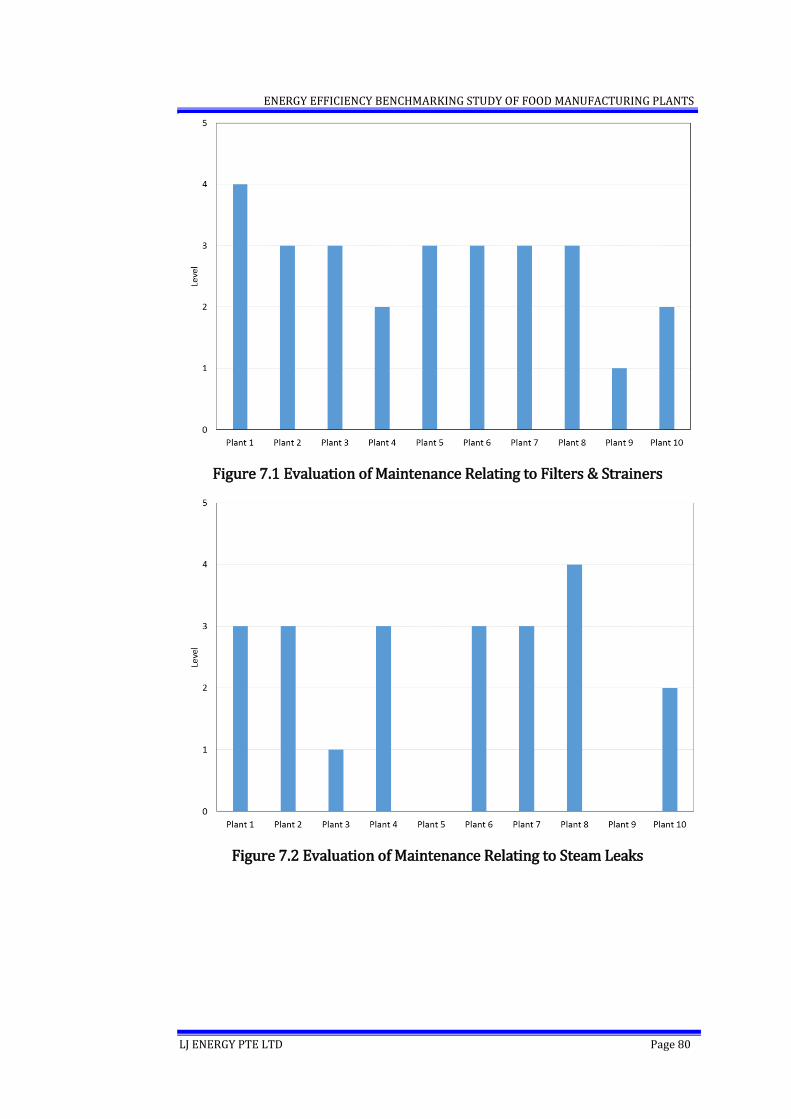
ENERGY EFFICIENCY BENCHMARKING STUDY OF FOOD MANUFACTURING PLANTS
LJ ENERGY PTE LTD Page 80
Figure 7.1 Evaluation of Maintenance Relating to Filters & Strainers
Figure 7.2 Evaluation of Maintenance Relating to Steam Leaks
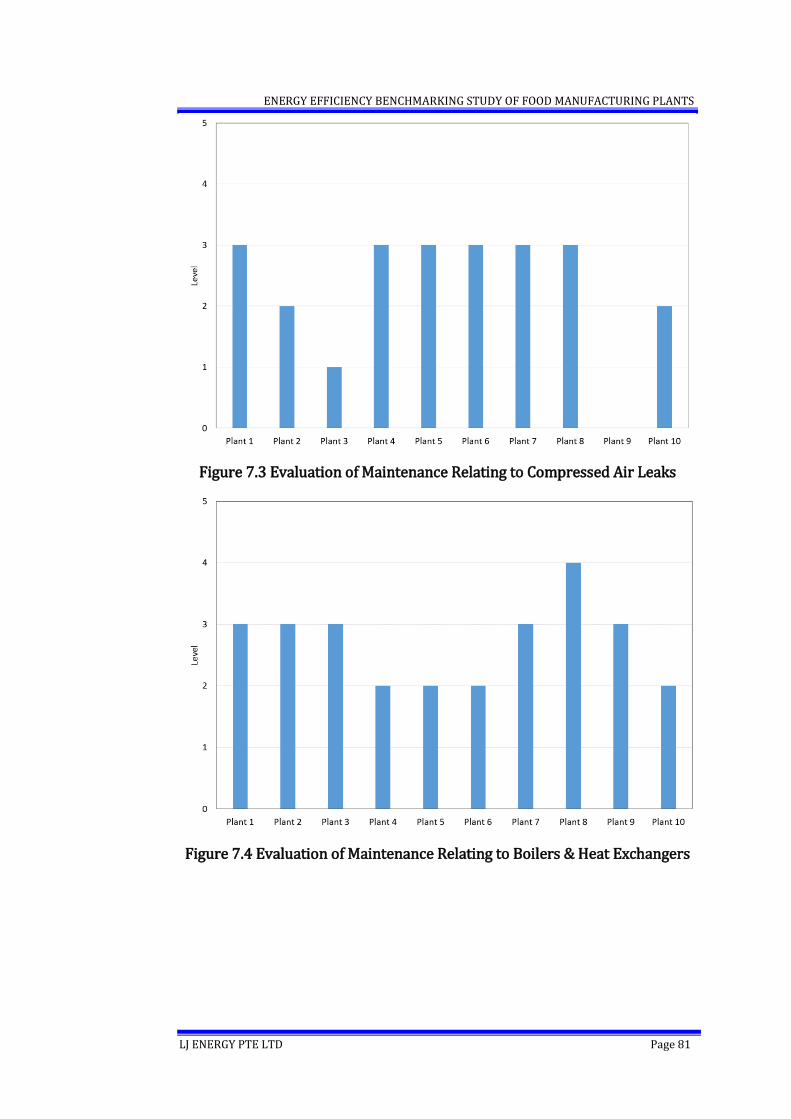
ENERGY EFFICIENCY BENCHMARKING STUDY OF FOOD MANUFACTURING PLANTS
LJ ENERGY PTE LTD Page 81
Figure 7.3 Evaluation of Maintenance Relating to Compressed Air Leaks
Figure 7.4 Evaluation of Maintenance Relating to Boilers & Heat Exchangers
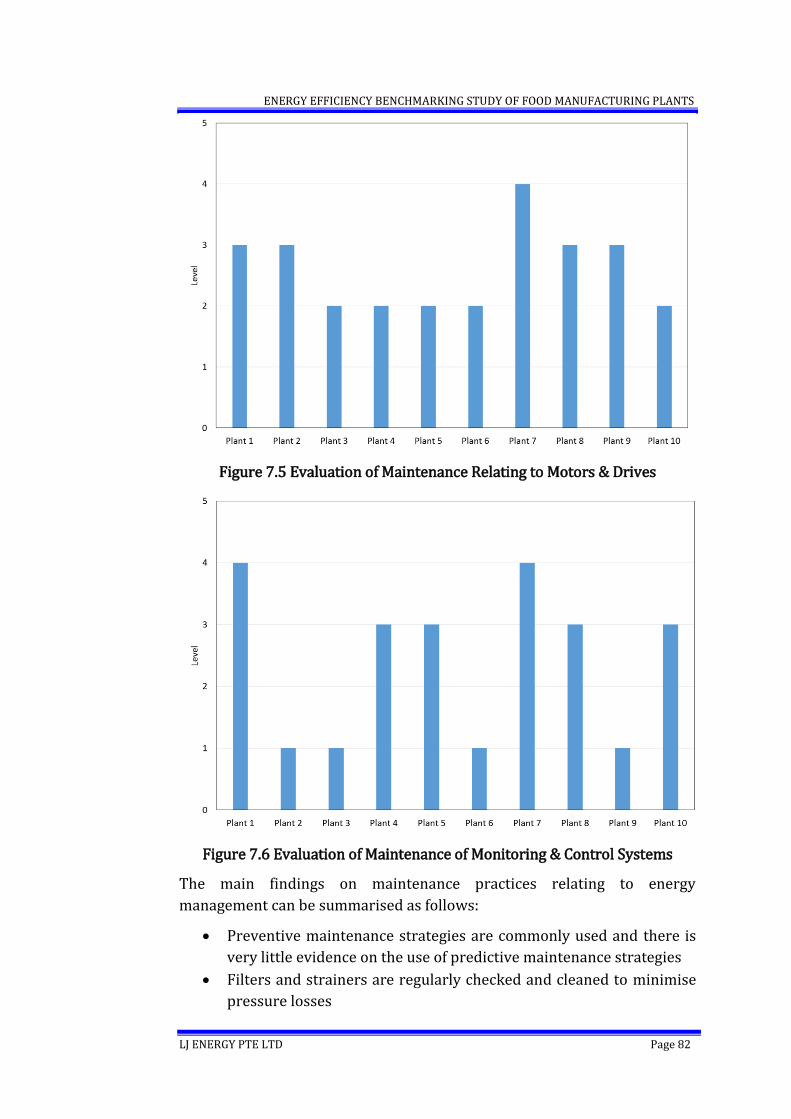
ENERGY EFFICIENCY BENCHMARKING STUDY OF FOOD MANUFACTURING PLANTS
LJ ENERGY PTE LTD Page 82
Figure 7.5 Evaluation of Maintenance Relating to Motors & Drives
Figure 7.6 Evaluation of Maintenance of Monitoring & Control Systems
The main findings on maintenance practices relating to energy
management can be summarised as follows:
Preventive maintenance strategies are commonly used and there is
very little evidence on the use of predictive maintenance strategies
Filters and strainers are regularly checked and cleaned to minimise
pressure losses
ENERGY EFFICIENCY BENCHMARKING STUDY OF FOOD MANUFACTURING PLANTS
LJ ENERGY PTE LTD Page 83
Steam leaks are generally rectified (no significant steam leaks were
observed)
Steam traps are regularly checked and defective ones are repaired or
replaced
Relatively high compressed air leakage in a number of plants
indicates no regular leak rectification programmes are in place
No regular fine-tuning boiler burners to adjust air to fuel ratio as
indicated by high excess air in most plants
There is no regular checking and calibration of sensors and
instruments used for monitoring as many were observed to be
inaccurate or not in operation
7.2 RECOMMENDATIONS FOR IMPROVEMENT
Based on the findings of the study, the following are the main
recommendations to improve maintenance practices relating to energy
management for the various plants:
Regularly check and calibrate monitoring sensors and control systems so that the performance of key EACs and EnPIs can be closely monitored
Supplement the current preventive maintenance programs with predictive maintenance strategies such as ultrasonic leak testing for compressed air and steam traps
Regularly conduct compressed air leak tests to minimise energy wastage due to leaks
Install permanent systems to monitor boiler flue gas composition and temperature so that the air to fuel ratio can be adjusted and the combustion efficiency optimised
ENERGY EFFICIENCY BENCHMARKING STUDY OF FOOD MANUFACTURING PLANTS
LJ ENERGY PTE LTD Page 84
8.0 OVERALL CONCLUSIONS
Following are the main findings and conclusions:
Ten plants participated in the energy efficiency benchmarking study of food manufacturing plants
The main energy consuming systems were identified and a suitable assessment framework was developed
Comparison of the performance of individual systems with benchmark values indicate significant potential for improvement
Many energy saving opportunities have been identified and savings have been quantified
Total energy savings of 103.1TJ/year have been identified for the participating plants
Measures have also been identified to improve energy management and maintenance practices in the plants
Recommended follow-up action:
Facilitate interaction among energy managers to share best practices within the food manufacturing sector
Prioritise energy management and improve motivation of staff involved in energy management through rewards and recognition
Develop ability to convince top management and secure commitment and funding for energy management
Consider current technology and more efficient designs when replacing old equipment
Invest resources to identify energy savings from process equipment and systems which account for a significant portion of the energy usage


![[PPT]Mobile Networks: Energy Efficiency Benchmarking KPIs · Web viewInclude new participants; refine results June. Issue final 2009 benchmarking report July onwards. Collect data](https://img.pdfslide.us/doc/110x75/5ab87c247f8b9aa6018cb4a5/pptmobile-networks-energy-efficiency-benchmarking-kpis-viewinclude-new-participants.jpg)