Embed Size (px)
Citation preview
April 2015
Assessment Framework for Energy Efficiency
Benchmarking Study of Food Manufacturing Plants

ASSESSMENT FRAMEWORK FOR FOOD MANUFACTURING PLANTS
1. INTRODUCTION
LJ Energy Pte Ltd was appointed by National Environment Agency (NEA)
Singapore to conduct an Energy Efficiency Benchmarking Study of Food
Manufacturing Plants in Singapore.
The benchmarking study is to cover ten food manufacturing plants
(“Plants”), out of which, eight of the Plants should have a minimum energy
consumption of 30 TJ per year while the remaining two Plants should have
a minimum energy consumption of 15 TJ per year.
The main objectives of the Study are to:
a) Develop an energy consumption profile of the food manufacturing
industry by studying the major systems and equipment of each
participating Plant
b) Identify suitable metrics to assess and benchmark the energy
efficiency of major systems and equipment;
c) Assess and benchmark the energy efficiency of major systems and
equipment of participating Plants; and
d) Identify effective measures to improve the energy efficiency of major
systems and equipment, taking into account factors such as
improvement potential of energy efficiency measures identified and
implementation feasibility and cost.
Therefore, to facilitate the Study, an Assessment Framework (“AF”) was
developed to assess the energy efficiency of major systems and equipment
of the Plants. The main objectives of the AF are to:
a) Identify major energy consuming systems and equipment that
account for at least 80% of the total primary energy consumption of
each participating Plant;
b) Identify suitable Energy Performance Indicators (“EnPIs”) for
assessing the energy efficiency of the major energy consuming
systems and equipment;
c) Develop suitable methodologies for measuring the identified EnPIs
for the various equipment and systems; and
d) Benchmark the performance of the equipment and systems using the
measured EnPIs with industry established values or standards.

ASSESSMENT FRAMEWORK FOR FOOD MANUFACTURING PLANTS
The proposed approach for the study is illustrated in Figure 1.1
Figure 1.1. Proposed Approach
The subsequent sections of this document provide a detailed description of
the AF to be used for the proposed study.

ASSESSMENT FRAMEWORK FOR FOOD MANUFACTURING PLANTS
2. SITE ENERGY USAGE PROFILE
The first step in the AF is to establish the energy usage profile of each Plant.
This will involve identifying the types of primary energy used and
establishing the annual usage for each type of primary energy as well as the
total energy usage from historic data as shown in Figures 2.1 to 2.4.
Figure 2.1. Monthly electrical energy usage
Figure 2.2. Monthly natural gas usage
ASSESSMENT FRAMEWORK FOR FOOD MANUFACTURING PLANTS
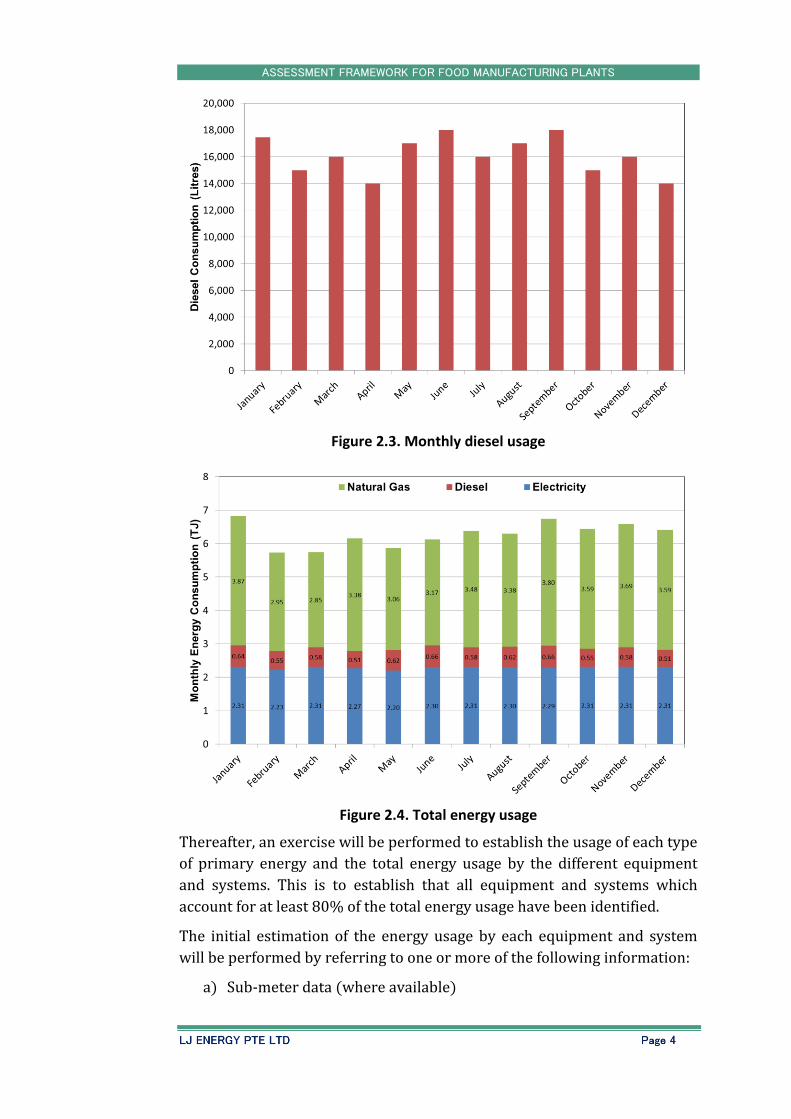
Figure 2.3. Monthly diesel usage
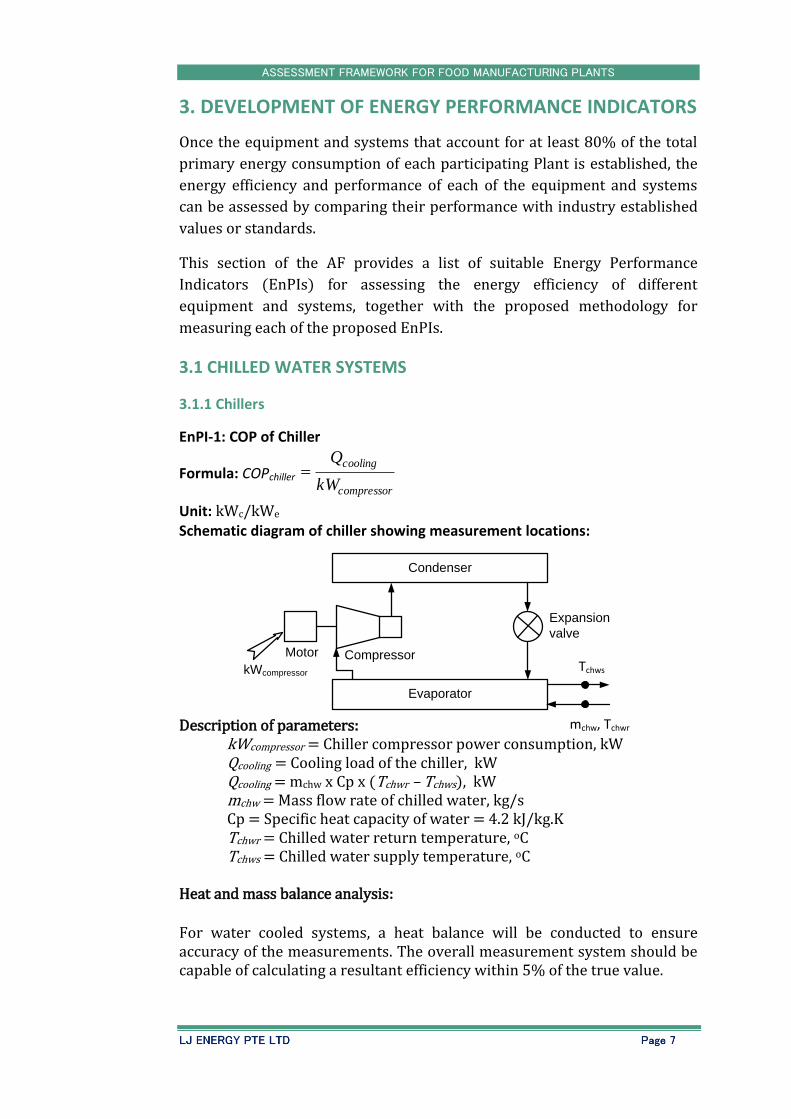
Figure 2.4. Total energy usage
Thereafter, an exercise will be performed to establish the usage of each type
of primary energy and the total energy usage by the different equipment
and systems. This is to establish that all equipment and systems which
account for at least 80% of the total energy usage have been identified.
The initial estimation of the energy usage by each equipment and system
will be performed by referring to one or more of the following information:
a) Sub-meter data (where available)

ASSESSMENT FRAMEWORK FOR FOOD MANUFACTURING PLANTS
b) Previous measurements from audits, ECA submissions etc. (if
available)
c) Equipment specifications and operating hours
Typical energy breakdown charts are illustrated in Figures 2.5 to 2.7
Figure 2.5. Breakdown of electrical energy usage
Figure 2.6. Breakdown of natural gas usage

ASSESSMENT FRAMEWORK FOR FOOD MANUFACTURING PLANTS
Figure 2.7 Breakdown of total energy usage
Once the equipment and systems that account for at least 80% of the total
primary energy consumption of each participating Plant is identified, the
energy efficiency and performance of each of the equipment and systems
will be assessed using the framework described in the following section.
During the actual assessment of each Plant, the breakdown of total energy
usage will be re-computed to check whether the equipment and systems
identified account for at least 80% of the total usage of the Plant. Additional
equipment and systems will be included in the assessment to make up any
shortfall.
ASSESSMENT FRAMEWORK FOR FOOD MANUFACTURING PLANTS
Compressor
Condenser
Expansion
valve
Motor
kWcompressor
Evaporator
Vch, Tch,return
Tch,supply
3. DEVELOPMENT OF ENERGY PERFORMANCE INDICATORS
Once the equipment and systems that account for at least 80% of the total
primary energy consumption of each participating Plant is established, the
energy efficiency and performance of each of the equipment and systems
can be assessed by comparing their performance with industry established
values or standards.
This section of the AF provides a list of suitable Energy Performance
Indicators (EnPIs) for assessing the energy efficiency of different
equipment and systems, together with the proposed methodology for
measuring each of the proposed EnPIs.
3.1 CHILLED WATER SYSTEMS
3.1.1 Chillers
EnPI-1: COP of Chiller
Formula: COPchiller compressor
cooling
kW
Q
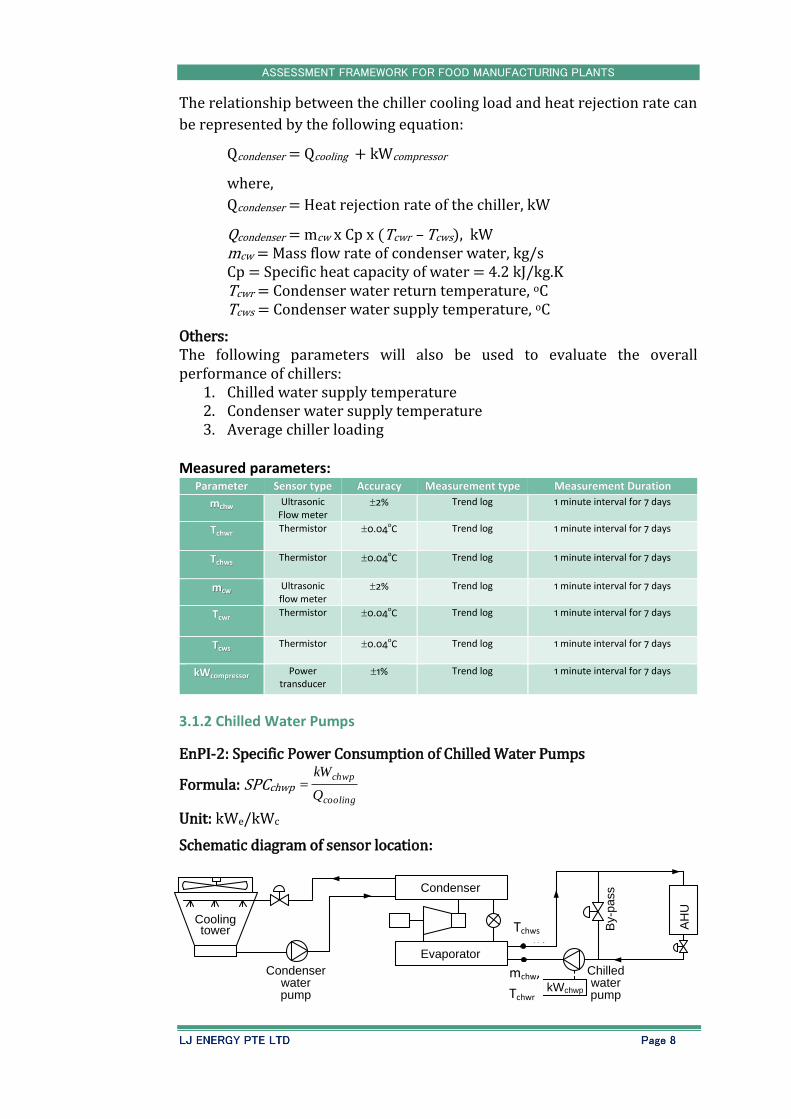
Unit: kWc/kWe Schematic diagram of chiller showing measurement locations: Description of parameters:
kWcompressor = Chiller compressor power consumption, kW Qcooling = Cooling load of the chiller, kW Qcooling = mchw x Cp x (Tchwr – Tchws), kW mchw = Mass flow rate of chilled water, kg/s Cp = Specific heat capacity of water = 4.2 kJ/kg.K Tchwr = Chilled water return temperature, oC Tchws = Chilled water supply temperature, oC
Heat and mass balance analysis: For water cooled systems, a heat balance will be conducted to ensure accuracy of the measurements. The overall measurement system should be capable of calculating a resultant efficiency within 5% of the true value.
mchw, Tchwr
Tchws
ASSESSMENT FRAMEWORK FOR FOOD MANUFACTURING PLANTS
By-p
assCondenser
Evaporator
Cooling tower A
HU
kWchwp
Vch, Tch,return
Chilled water pump
Tch,supply
Condenser water pump
The relationship between the chiller cooling load and heat rejection rate can
be represented by the following equation:
Qcondenser = Qcooling + kWcompressor
where,
Qcondenser = Heat rejection rate of the chiller, kW
Qcondenser = mcw x Cp x (Tcwr – Tcws), kW mcw = Mass flow rate of condenser water, kg/s Cp = Specific heat capacity of water = 4.2 kJ/kg.K Tcwr = Condenser water return temperature, oC Tcws = Condenser water supply temperature, oC
Others: The following parameters will also be used to evaluate the overall performance of chillers:
1. Chilled water supply temperature 2. Condenser water supply temperature 3. Average chiller loading
Measured parameters:
Parameter Sensor type Accuracy Measurement type Measurement Duration
mchw Ultrasonic Flow meter
2% Trend log 1 minute interval for 7 days
Tchwr Thermistor 0.04oC Trend log 1 minute interval for 7 days
Tchws Thermistor 0.04oC Trend log 1 minute interval for 7 days
mcw Ultrasonic flow meter
2% Trend log 1 minute interval for 7 days
Tcwr Thermistor 0.04oC Trend log 1 minute interval for 7 days
Tcws Thermistor 0.04oC Trend log 1 minute interval for 7 days
kWcompressor Power transducer
1% Trend log 1 minute interval for 7 days
3.1.2 Chilled Water Pumps
EnPI-2: Specific Power Consumption of Chilled Water Pumps
Formula: SPCchwp cooling
chwp
Q
kW
Unit: kWe/kWc
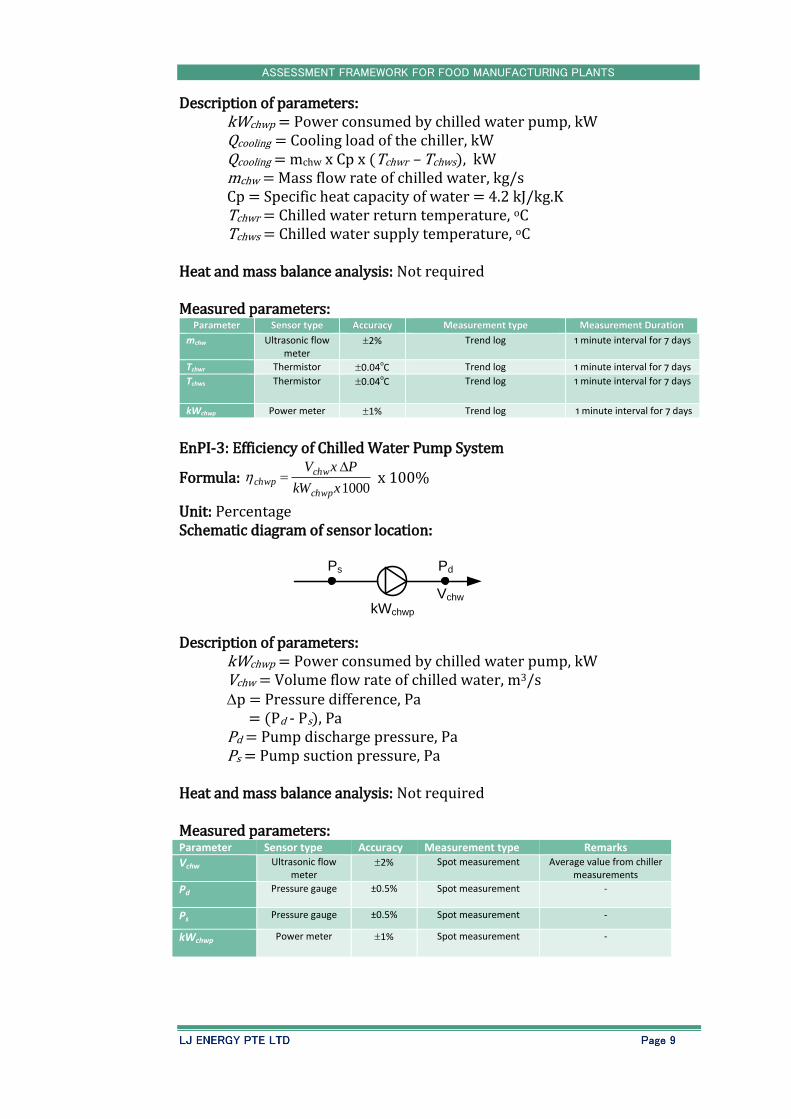
Schematic diagram of sensor location:
Tchws
mchw,
Tchwr
ASSESSMENT FRAMEWORK FOR FOOD MANUFACTURING PLANTS
Vchw
Pd
kWchwp
Ps
Description of parameters: kWchwp = Power consumed by chilled water pump, kW Qcooling = Cooling load of the chiller, kW Qcooling = mchw x Cp x (Tchwr – Tchws), kW mchw = Mass flow rate of chilled water, kg/s Cp = Specific heat capacity of water = 4.2 kJ/kg.K Tchwr = Chilled water return temperature, oC Tchws = Chilled water supply temperature, oC
Heat and mass balance analysis: Not required Measured parameters:
Parameter Sensor type Accuracy Measurement type Measurement Duration
mchw Ultrasonic flow meter
2% Trend log 1 minute interval for 7 days
Tchwr Thermistor 0.04oC Trend log 1 minute interval for 7 days
Tchws Thermistor 0.04oC Trend log 1 minute interval for 7 days
kWchwp Power meter 1% Trend log 1 minute interval for 7 days
EnPI-3: Efficiency of Chilled Water Pump System
Formula: 1000 xkW
P xV
chwp
chwchwp
x 100%
Unit: Percentage Schematic diagram of sensor location: Description of parameters:
kWchwp = Power consumed by chilled water pump, kW Vchw = Volume flow rate of chilled water, m3/s p = Pressure difference, Pa
= (Pd - Ps), Pa Pd = Pump discharge pressure, Pa Ps = Pump suction pressure, Pa
Heat and mass balance analysis: Not required Measured parameters: Parameter Sensor type Accuracy Measurement type Remarks
Vchw Ultrasonic flow meter
2% Spot measurement Average value from chiller measurements
Pd Pressure gauge ±0.5% Spot measurement -
Ps Pressure gauge ±0.5% Spot measurement -
kWchwp Power meter 1% Spot measurement -

ASSESSMENT FRAMEWORK FOR FOOD MANUFACTURING PLANTS
By-p
assCondenser
Evaporator
Cooling tower A
HU
kWcwp
Vch, Tch,return
Chilled water pump
Tch,supply
Condenser water pump
3.1.3 Condenser Water Pumps
EnPI-4: Specific Power Consumption of Condenser Water Pumps
Formula: SPCcwp cooling
cwp
Q
kW
Unit: kWe/kWc Schematic diagram of chiller showing sensor location: Description of parameters:
kWcwp = Power consumed by condenser water pump, kW Qcooling = Cooling load of the chiller, kW Qcooling = mchw x Cp x (Tchwr – Tchws) , kW mchw = Mass flow rate of chilled water, kg/s Cp = Specific heat capacity of water = 4.2 kJ/kg.K Tchwr = Chilled water return temperature, oC Tchws = Chilled water supply temperature, oC
Heat and mass balance analysis: Not required Measured parameters: Parameter Sensor type Accuracy Measurement type Measurement Duration
mchw Ultrasonic flow meter
2% Trend log 1 minute interval for 7 days
(From chiller)
Tchwr Thermistor 0.04oC Trend log 1 minute interval for 7 days
(From chiller)
Tchws Thermistor 0.04oC Trend log 1 minute interval for 7 days
(From chiller)
kWcwp Power meter 1% Spot measurement for constant speed or logging for
variable speed
Spot measurement for
constant speed or logging
at 1 minute interval for 7
days for variable speed
EnPI-5: Efficiency of Condenser Water Pump System
Formula: 1000 xkW
P xV
cwp
cwchwp
x 100%
Unit: Percentage
mchw,
Tchwr
Tchws
ASSESSMENT FRAMEWORK FOR FOOD MANUFACTURING PLANTS
By-p
assCondenser
Evaporator
Cooling tower A
HU
kWct
Chilled water pump
Condenser water pump Vch,
Tch,return
Tch,supply
Vcw
Pd
kWcwp
Ps
Schematic diagram of sensor location: Description of parameters:
kWcwp = Power consumed by condenser water pump, kW Vcw = Volume flow rate of condenser water, m3/s p = Pressure difference, Pa
= (Pd - Ps), Pa Pd = Pump discharge pressure, Pa Ps = Pump suction pressure, Pa
Heat and mass balance analysis: Not required Measured parameters: Parameter Sensor type Accuracy Measurement type Remarks
Vcw Ultrasonic flow meter
2% Spot measurement Average value from chiller measurements
Pd Pressure gauge ±0.5% Spot measurement -
Ps Pressure gauge ±0.5% Spot measurement -
kWchwp Power meter 1% Spot measurement -
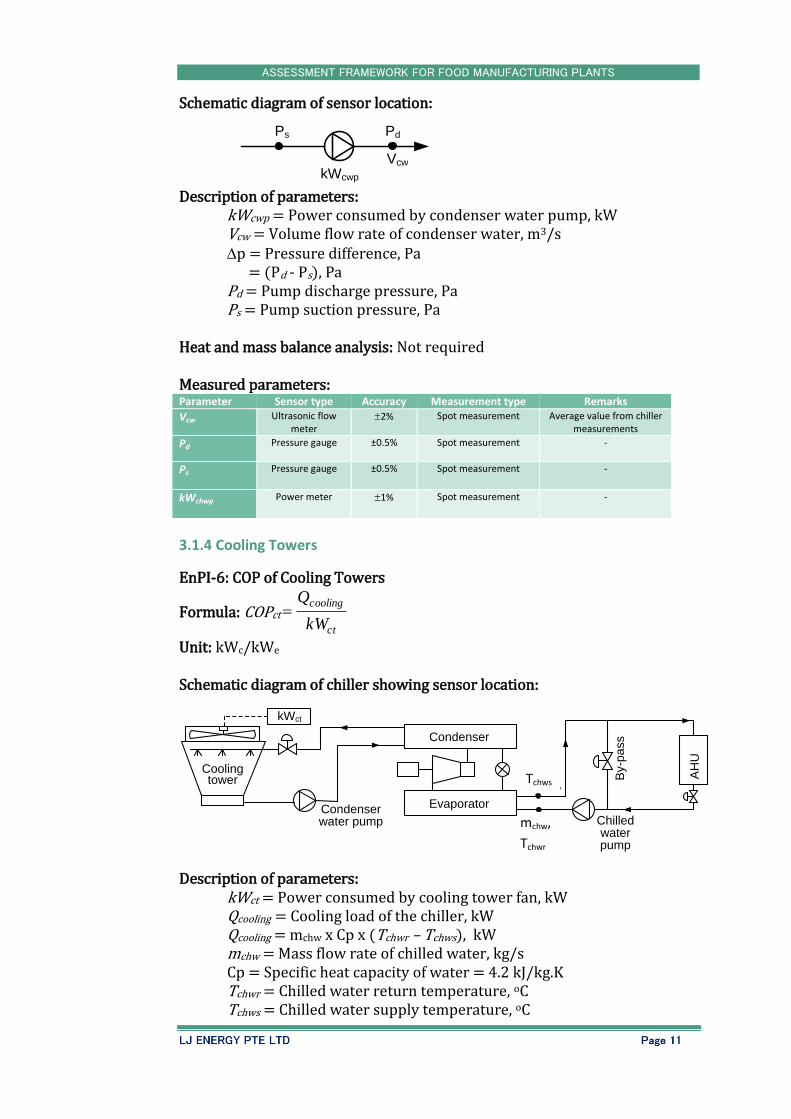
3.1.4 Cooling Towers
EnPI-6: COP of Cooling Towers
Formula: COPct
ct
cooling
kW
Q
Unit: kWc/kWe Schematic diagram of chiller showing sensor location: Description of parameters:
kWct = Power consumed by cooling tower fan, kW Qcooling = Cooling load of the chiller, kW Qcooling = mchw x Cp x (Tchwr – Tchws), kW mchw = Mass flow rate of chilled water, kg/s Cp = Specific heat capacity of water = 4.2 kJ/kg.K Tchwr = Chilled water return temperature, oC Tchws = Chilled water supply temperature, oC
Tchws
mchw,
Tchwr

ASSESSMENT FRAMEWORK FOR FOOD MANUFACTURING PLANTS
Heat and mass balance analysis: Not required Others:
1. Approach temperature (difference between condenser water supply temperature, Tcws and wet bulb temperature, Twb) would be compared with the cooling tower design specification to assess the performance of the cooling tower system. Wet bulb temperature will be determined from the Psychrometric chart using measured dry bulb temperature and relative humidity of ambient air.
Measured parameters: Parameter Sensor type Accuracy Measurement type Measurement Duration
mchw Ultrasonic flow meter
2% Trend log 1 minute interval for 7 days
(From chiller)
Tchwr Thermistor 0.04oC Trend log 1 minute interval for 7 days
(From chiller)
Tchws Thermistor 0.04oC Trend log 1 minute interval for 7 days
(From chiller)
Tcws Thermistor 0.04oC Trend log 1 minute interval for 7 days
(From chiller)
Twb Ambient temperature & RH
sensor
0.5oC and 3% RH
Trend log 1 minute interval for 2 days
kWcwp Power meter 1% Spot measurement for constant speed or logging for
variable speed
Spot measurement for
constant speed or logging
at 1 minute interval for 7
days for variable speed
3.1.5 Chilled Water System
EnPI-7: COP of Chilled Water System Formula: COPchilled water system = Qcooling/kWcompressor + Qcooling/kWchwp + Qcooling/kWcwp + Qcooling/kWct Unit: kWc/kWe Others:
1. Cooling load histogram will be produced to determine if the chillers are sized properly.
2. Chilled water flow rate will be compared with system cooling load requirements to assess the pumping system performance.
Measured parameters: Refer to sections 3.1.1 to 3.1.5

ASSESSMENT FRAMEWORK FOR FOOD MANUFACTURING PLANTS
Cooling tower
Condenser water pump
Vprocess, Tprocess,supply
Tprocess,return
kWct
3.2 PROCESS COOLING (COOLING TOWER) SYSTEMS
EnPI-1: Specific Heat Rejection Rate by Cooling Tower
Formula: COPct = ct
heat
kW
Q
Unit: kWc/kWe
Schematic diagram of cooling tower showing sensor location: Description of parameters:
kWct = Power consumed by fan of cooling tower, kW Qheat = Heat rejection rate, kW Qheat = mcw x Cp x (Tcwr – Tcws) mcw = Mass flow rate of cooling tower water, kg/s Cp = Specific heat capacity of water = 4.2 kJ/kg.K Tcwr = Cooling tower water return temperature, oC Tcws = Cooling tower water supply temperature, oC
Heat and mass balance analysis: Not required Measured parameters: Parameter Sensor type Accuracy Measurement type Measurement Duration
mcw Ultrasonic flow meter
2% Trend log Logging at 1 minute
interval for 1 to 2 days
Tcwr Thermistor 0.04oC Trend log Logging at 1 minute
interval for 1 to 2 days
Tcws Thermistor 0.04oC Trend log Logging at 1 minute
interval for 1 to 2 days
Twb Ambient temperature & RH
sensor
0.5oC and 3% RH
Trend log 1 minute interval for 2 days
kWct Power meter 1% Spot measurement for constant speed or logging for
variable speed
Spot measurement for
constant speed or logging
at 1 minute interval for 1 to
2 days for variable speed
EnPI-2: Efficiency of Cooling Tower Water Pump System
Formula: 1000 xkW
P xV
cwp
cwchwp
x 100%
Unit: Percentage
Tcwr
mcw, Tcws
Cooling tower pump

ASSESSMENT FRAMEWORK FOR FOOD MANUFACTURING PLANTS
Vcw
Pd
kWcwp
Ps
Schematic diagram of sensor location: Description of parameters:
kWcwp = Power consumed by cooling tower water pump, kW Vcw = Volume flow rate of cooling tower water, m3/s p = Pressure difference, Pa
= (Pd - Ps), Pa Pd = Pump discharge pressure, Pa Ps = Pump suction pressure, Pa
Heat and mass balance analysis: Not required Measured parameters:
Parameter Sensor type Accuracy Measurement type Remarks
Vcw Ultrasonic flow meter
2% Spot measurement
Pd Pressure gauge ±0.5% Spot measurement -
Ps Pressure gauge ±0.5% Spot measurement -
kWcwp Power meter 1% Spot measurement -
Others: The following parameters will also be used to evaluate the overall performance of cooling tower systems:
1. Cooling tower water supply temperature (comparison with design values)
2. Temperature difference between cooling tower return and supply water streams
3. Approach temperature (difference between cooling tower water supply and wet bulb temperatures) will be compared with the cooling tower design specification to assess the performance of the cooling tower system. Wet bulb temperature will be determined from the Psychrometric chart using measured dry bulb temperature and relative humidity of ambient air.
3.3 REFRIGERATION SYSTEMS
EnPI-1: Specific Energy Consumption
Formula: spaceedrefrigerat inside material of Weight
kWh/day system,ionRefrigerat of nconsumptioEnergy and
spaceedrefrigerat of Volume
kWh/day system,ionRefrigerat of nconsumptioEnergy
Unit: Description of parameters:
Volume of refrigeration space will be determined from specification / drawing

ASSESSMENT FRAMEWORK FOR FOOD MANUFACTURING PLANTS
Compressor
Condenser
Expansion
valve
Motor
kWcompressor
Evaporator
Vch, Tch,return
Tch,supply
Average weight of materials stored inside the refrigerated space will be determined from records
Average daily energy consumption of refrigeration system compressor will be measured
Heat and Mass Balance Analysis: Not required Measured Parameters:
Parameter Sensor type Accuracy Measurement type Measurement Duration
Power consumption of refrigeration compressor
Power transducer
1% Trend log 1 minute interval for 7days
EnPI-2: COP of Refrigeration System Case-1: Water cooled condenser
Formula: COPrs =kW *,compressor ionrefrigerat of nconsumptio Power
kW system,ionrefrigerat theby produced Cooling
* Power consumption of cooling tower fans and pumps to be included for those with dedicated cooling systems Unit: kWc/kWe Formula to Compute Refrigeration Load: Refrigeration load, kW = Heat rejection rate of cooling tower, kW - Input power to motor of compressor, kW Description of parameters:
kWcompressor = Refrigeration system compressor power, kW Qcooling = Refrigeration load , kW
= (Qheat - kWcompressor x F) Qheat = heat rejection rate of refrigeration system
= mcw x Cp x (Tcwr – Tcws), kW mcw = Mass flow rate of condenser water, kg/s Cp = Specific heat capacity of water = 4.2 kJ/kg.K Tcwr = Condenser water return temperature, oC Tcws = Condenser water supply temperature, oC
mcw, Tcws
Tcwr
ASSESSMENT FRAMEWORK FOR FOOD MANUFACTURING PLANTS
Compressor
Condenser
Expansion
valve
Motor
Winput
Fan
Pump
Evaporator coil in refrigeration space
Vw
Tw
F = 1.0 for hermetically sealed systems = motor efficiency /100 for open drive
Heat and Mass Balance Analysis: Not required Measured Parameters:
Parameter Sensor type Accuracy Measurement type Measurement Duration
mcw Ultrasonic flow meter
2% Trend log 1 minute interval for 7
days s
Tcwr Thermistor 0.04oC Trend log 1 minute interval for 7
days
Tcws Thermistor 0.04oC Trend log 1 minute interval for 7
days
kWcompressor Power transducer 1% Trend log 1 minute interval for 7
days
kWfan Power meter 1% Spot measurement -
kWpump Power meter 1% Spot measurement -
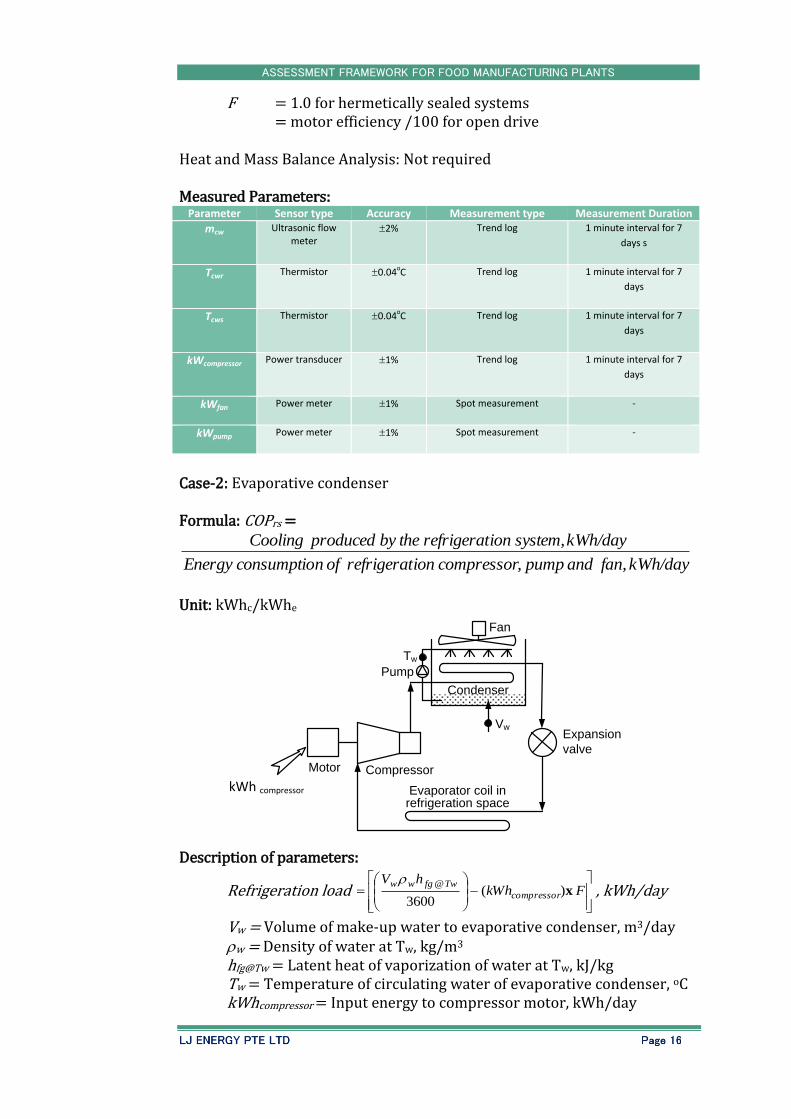
Case-2: Evaporative condenser Formula: COPrs =
kWh/day fan, and pump ,compressor ionrefrigerat of nconsumptioEnergy
kWh/day system,ionrefrigerat theby produced Cooling
Unit: kWhc/kWhe Description of parameters:
Refrigeration load
FkWh
hVcompressor
Twfgwwx )(
3600
@, kWh/day
Vw = Volume of make-up water to evaporative condenser, m3/day w = Density of water at Tw, kg/m3 hfg@Tw = Latent heat of vaporization of water at Tw, kJ/kg Tw = Temperature of circulating water of evaporative condenser, oC kWhcompressor = Input energy to compressor motor, kWh/day
kWh compressor

ASSESSMENT FRAMEWORK FOR FOOD MANUFACTURING PLANTS
Compressor
Condenser
Expansion
valve
Motor
Winput
Fan
Pump
Vch, Tch,in
Tch,out
Thermal storage tank
kWhpump = pump energy consumption, kWh/day kWhfan = fan energy consumption, kWh/day F = 1.0 for hermetically sealed systems
= motor efficiency /100, for open drive Formula to Compute Refrigeration Load: Refrigeration load, kW = Heat rejection rate of evaporative condenser, kW - Input power to motor of compressor, kW. Heat and Mass Balance Analysis: Not required Measured Parameters:
Parameter Sensor type Accuracy Measurement type Measurement Duration
Vw Water meter 2% Daily readings 7 days
Tw Thermistor 0.04oC Trend log 1 minute interval for 7 days
kWhpump Power meter 1% Spot measurement of kW -
kWhfan Power meter 1% Spot measurement of kW -
kWhcompressor Power transducer
1% Trend log 1 minute interval for 7 days
Case-3: Evaporator coil severing heat exchanger or thermal storage tank Formula: COPrs =
kW fan, and pump ,compressor ionrefrigerat of nconsumptio Power
kW system,ionrefrigerat theby produced Cooling
Unit: kWc/kWe
Description of parameters:
kWc inchoutchchpchch TTCV ,,, , kW
Vch = Volume flow rate of chilled water, m3/s ch = Density of cooling water at Tch,in, kg/m3 Cp,ch = Specific heat capacity of cooling water, kJ/kg K Tch,in = Inlet temperature of cooling water, oC
Heat exchanger or tank
kW compressor

ASSESSMENT FRAMEWORK FOR FOOD MANUFACTURING PLANTS
Compressor
Condenser
Expansion
valveMotorkWcompressor
Fan
Air
Evaporator coil in refrigeration space
Pr,in, Tr,in
hr,in
Vr
Receiver
Pr,out, Tr,out
hr,out
Tch,out = Outlet temperature of cooling water, oC Heat and Mass Balance Analysis: Not required Measured Parameters:
Parameter Sensor type Accuracy Measurement type Measurement Duration
Vch Ultrasonic flow meter
2% Trend log 1 minute interval for 7 days
Tch,in Thermistor 0.04oC Trend log 1 minute interval for 7 days
Tch,out Thermistor 0.04oC Trend log 1 minute interval for 7 days
kWcompressor Power transducer
1% Trend log 1 minute interval for 7 days
kWfan Power meter 1% Spot measurement -
kWpump Power meter 1% Spot measurement -
Case-4: Direct expansion type Scenario-1: Refrigerant flow rate can be measured Formula: COPrs =
kW fan, and compressor ionrefrigerat of nconsumptio Power
kW system,ionrefrigerat theby produced Cooling
Unit: kWc/kWe
Description of parameters:
Cooling produced by the refrigeration system inr,outrr h hm , , kW
Mass flow rate of refrigerant rrr Vm , kg/s
mr = Mass flow rate of refrigerant, kg/s Vr = Volume flow rate of liquid refrigerant, m3/s r = Density of liquid refrigerant, kg/m3 kWcompressor = Input power to motor of compressor, kW kWfan = Input power to fan, kW hr,in = Enthalpy of refrigerant at Pr,in and Tr,in, kJ/kg hr,out = Enthalpy of refrigerant at Pr,out and Tr,out, kJ/kg

ASSESSMENT FRAMEWORK FOR FOOD MANUFACTURING PLANTS
Compressor
Condenser
Expansion
valve
Motor
Winput
Fan
Air
Pr,in, Tr,in
Pr,out, Tr,out
Evaporator coil in refrigeration space
Pr,ev, Tr,ev
Pr,in = Pressure of refrigerant at inlet of evaporator, kPa Tr,in = Temperature of refrigerant at inlet of evaporator, oC Pr,out = Pressure of refrigerant at outlet of evaporator, kPa Tr,out = Temperature of refrigerant at outlet of evaporator, oC
If it is not possible to measure refrigerant temperature and pressure continuously and convert to enthalpy, it is proposed to take average readings for a number of sample periods of time (1-hour each). Heat and Mass Balance Analysis: Not required Measured Parameters:
Parameter Sensor type Accuracy Measurement type Measurement Duration
Vr Ultrasonic flowmeter
2% Trend log 1 minute interval for 3 days
Pr,in Pressure gauge Based on installed sensor
Spot measurement / Trend log (if
permanent sensor is available)
Average for one hour
Pr,out Pressure gauge Based on installed sensor
Spot measurement / Trend log (if
permanent sensor is available)
Average for one hour
Tr,in Surface temperature
sensor
1oC Trend log Average for one hour
Tr,out Surface temperature
sensor
1oC Trend log Average for one hour
kWcompressor Power transducer 1% Trend log 1 minute interval for 3 days
kWfan Power meter 1% Spot measurement -
Scenario-2: Refrigerant flow rate can be calculated Formula: COPrs =
kW fan, and compressor ionrefrigerat of nconsumptio Power
kW system,ionrefrigerat theby produced Cooling
Unit: kWc/kWe
Description of parameters:
kW compressor
h r,ev h r,in
h r,out
ASSESSMENT FRAMEWORK FOR FOOD MANUFACTURING PLANTS
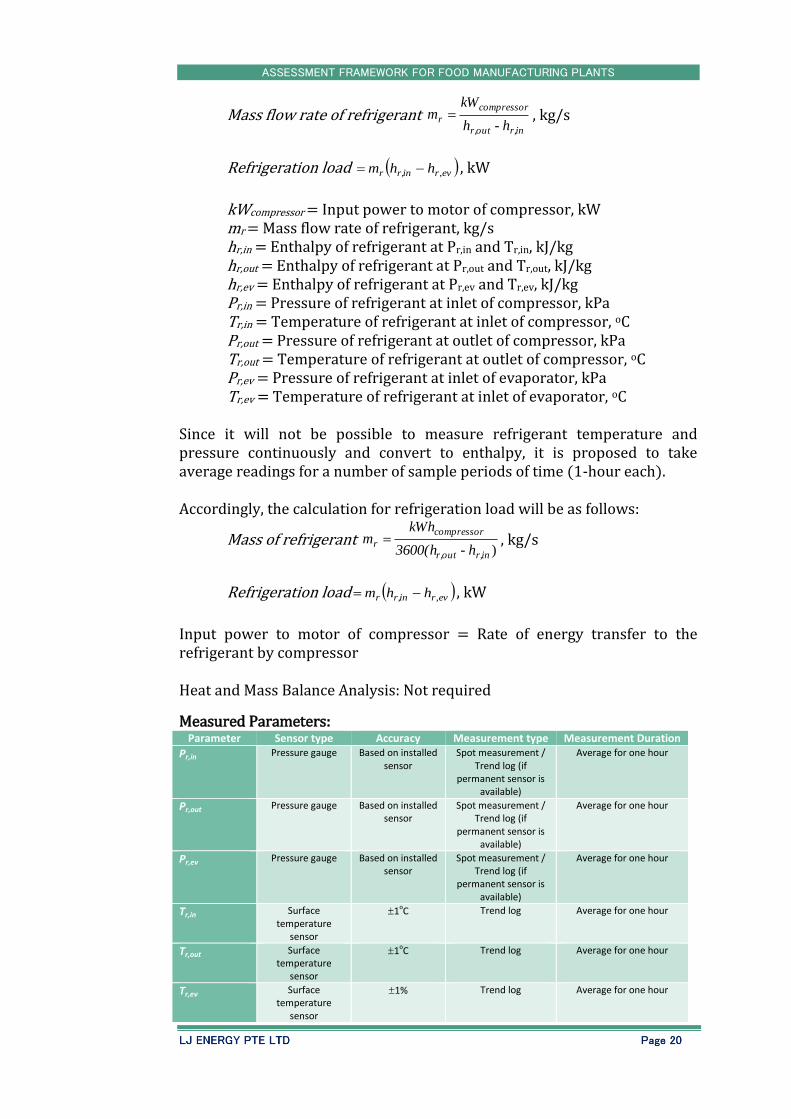
Mass flow rate of refrigerant inr,outr,
compressor
rh-h
kWm , kg/s
Refrigeration load evrinr,r hhm , , kW
kWcompressor = Input power to motor of compressor, kW mr = Mass flow rate of refrigerant, kg/s hr,in = Enthalpy of refrigerant at Pr,in and Tr,in, kJ/kg hr,out = Enthalpy of refrigerant at Pr,out and Tr,out, kJ/kg hr,ev = Enthalpy of refrigerant at Pr,ev and Tr,ev, kJ/kg Pr,in = Pressure of refrigerant at inlet of compressor, kPa Tr,in = Temperature of refrigerant at inlet of compressor, oC Pr,out = Pressure of refrigerant at outlet of compressor, kPa Tr,out = Temperature of refrigerant at outlet of compressor, oC Pr,ev = Pressure of refrigerant at inlet of evaporator, kPa Tr,ev = Temperature of refrigerant at inlet of evaporator, oC
Since it will not be possible to measure refrigerant temperature and pressure continuously and convert to enthalpy, it is proposed to take average readings for a number of sample periods of time (1-hour each). Accordingly, the calculation for refrigeration load will be as follows:
Mass of refrigerant )inr,outr,
compressor
rh-3600(h
kWhm , kg/s
Refrigeration load evrinr,r hhm , , kW
Input power to motor of compressor = Rate of energy transfer to the refrigerant by compressor Heat and Mass Balance Analysis: Not required
Measured Parameters: Parameter Sensor type Accuracy Measurement type Measurement Duration
Pr,in Pressure gauge Based on installed sensor
Spot measurement / Trend log (if
permanent sensor is available)
Average for one hour
Pr,out Pressure gauge Based on installed sensor
Spot measurement / Trend log (if
permanent sensor is available)
Average for one hour
Pr,ev Pressure gauge Based on installed sensor
Spot measurement / Trend log (if
permanent sensor is available)
Average for one hour
Tr,in Surface temperature
sensor
1oC Trend log Average for one hour
Tr,out Surface temperature
sensor
1oC Trend log Average for one hour
Tr,ev Surface temperature
sensor
1% Trend log Average for one hour
ASSESSMENT FRAMEWORK FOR FOOD MANUFACTURING PLANTS
kWcompressor Power transducer 1% Trend log 1 minute interval for 3 days
kWfan Power meter 1% Spot measurement -
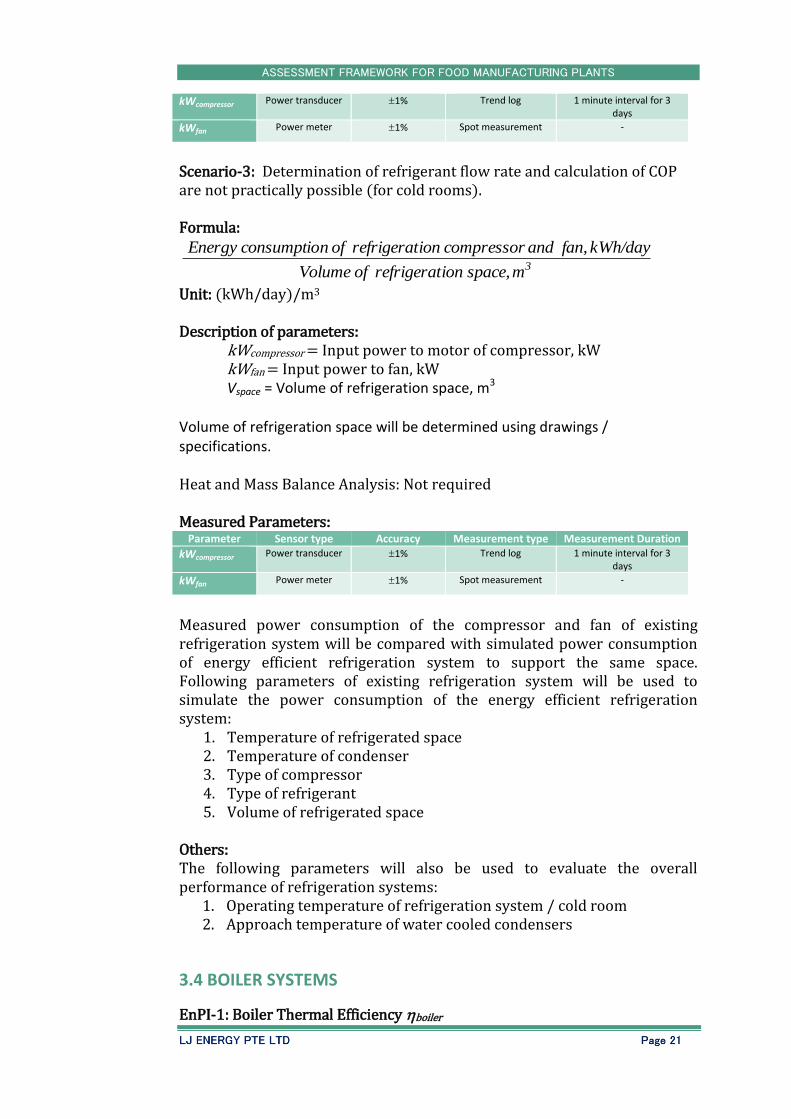
Scenario-3: Determination of refrigerant flow rate and calculation of COP are not practically possible (for cold rooms). Formula:
3m space,ionrefrigerat of Volume
kWh/day fan, and compressor ionrefrigerat of nconsumptioEnergy
Unit: (kWh/day)/m3
Description of parameters: kWcompressor = Input power to motor of compressor, kW kWfan = Input power to fan, kW
Vspace = Volume of refrigeration space, m3 Volume of refrigeration space will be determined using drawings / specifications. Heat and Mass Balance Analysis: Not required Measured Parameters:
Parameter Sensor type Accuracy Measurement type Measurement Duration
kWcompressor Power transducer 1% Trend log 1 minute interval for 3 days
kWfan Power meter 1% Spot measurement -
Measured power consumption of the compressor and fan of existing refrigeration system will be compared with simulated power consumption of energy efficient refrigeration system to support the same space. Following parameters of existing refrigeration system will be used to simulate the power consumption of the energy efficient refrigeration system:
1. Temperature of refrigerated space 2. Temperature of condenser 3. Type of compressor 4. Type of refrigerant 5. Volume of refrigerated space
Others: The following parameters will also be used to evaluate the overall performance of refrigeration systems:
1. Operating temperature of refrigeration system / cold room 2. Approach temperature of water cooled condensers
3.4 BOILER SYSTEMS
EnPI-1: Boiler Thermal Efficiency boiler

ASSESSMENT FRAMEWORK FOR FOOD MANUFACTURING PLANTS
BoilerVfuel
Tfeed
Vsteam
Psteam
Tsteam
Formula: Unit: % Option 1 – Plant has steam flow meter Schematic diagram of system showing sensor locations: Description of Parameters:
Energy output to steam = Vsteam x steam x hsteam – mfeed x hfeed
Vsteam = Volume flow rate of steam, m3/s steam = Density of steam at boiler outlet temperature and pressure, kg/m3 = Density of steam at Tsteam and Psteam, kg/m3 hsteam = Enthalpy of steam at the outlet of the boiler, kJ/kg = Enthalpy of steam at Tsteam and Psteam, kJ/kg Tsteam = Temperature of steam at boiler outlet, oC Psteam = Pressure of steam at boiler outlet, bar mfeed = mass flow rate of feed water = Vsteam x steam (kg/s) hfeed = Enthalpy of feed water at temperature Tfeed
Energy input of fuel = Vfuel x fuel x CV Vfuel = Fuel consumption rate, m3/s fuel = Density of fuel, kg/m3 CV = Gross calorific value of fuel, kJ/kg
Heat and Mass Balance Analysis: Not required Others: Specification of fuel will be used to determine the gross calorific value of fuel. Measured Parameters:
Parameter Sensor type Accuracy Measurement type Measurement Duration
Vsteam Plant flow meter Based on installed sensor
Trend log 1 minute interval for 3 days
Tsteam RTD Based on installed sensor
Spot measurement / Trend log
1 minute interval for 3 days (Depending on
installed system)
Tfeed Thermistor 0.2oC Trend log 1 minute interval for 3 days
Psteam Pressure gauge Based on installed sensor
Spot measurement / Trend log
1 minute interval for 3 days (Depending on
installed system)
Vfuel Plant flow meter or tank measurements
Based on installed sensor
Cumulative Daily readings
Option 2 – Plant does not have steam flow meter
ASSESSMENT FRAMEWORK FOR FOOD MANUFACTURING PLANTS
Boiler
Vfuel
Tfeed
Psteam
Tsteam
mfeed
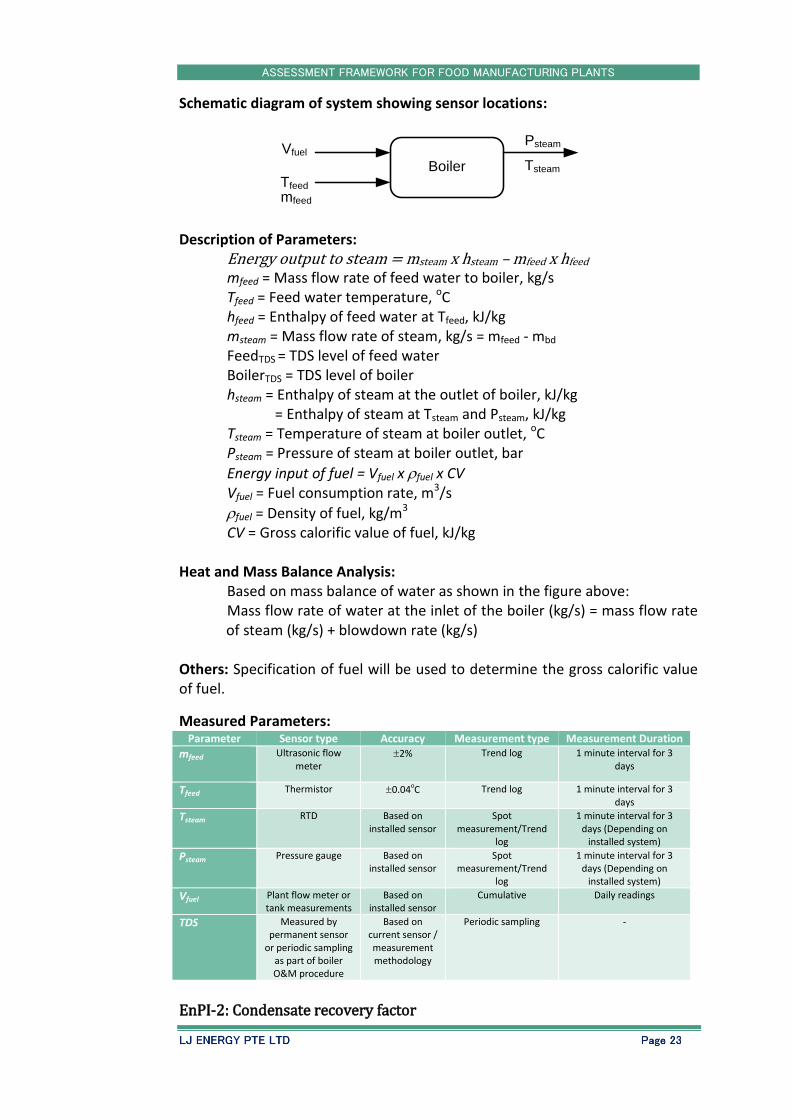
Schematic diagram of system showing sensor locations: Description of Parameters:
Energy output to steam = msteam x hsteam – mfeed x hfeed mfeed = Mass flow rate of feed water to boiler, kg/s Tfeed = Feed water temperature, oC hfeed = Enthalpy of feed water at Tfeed, kJ/kg msteam = Mass flow rate of steam, kg/s = mfeed - mbd FeedTDS = TDS level of feed water BoilerTDS = TDS level of boiler hsteam = Enthalpy of steam at the outlet of boiler, kJ/kg = Enthalpy of steam at Tsteam and Psteam, kJ/kg Tsteam = Temperature of steam at boiler outlet, oC Psteam = Pressure of steam at boiler outlet, bar
Energy input of fuel = Vfuel x fuel x CV Vfuel = Fuel consumption rate, m3/s
fuel = Density of fuel, kg/m3 CV = Gross calorific value of fuel, kJ/kg
Heat and Mass Balance Analysis:
Based on mass balance of water as shown in the figure above: Mass flow rate of water at the inlet of the boiler (kg/s) = mass flow rate of steam (kg/s) + blowdown rate (kg/s)
Others: Specification of fuel will be used to determine the gross calorific value of fuel.
Measured Parameters: Parameter Sensor type Accuracy Measurement type Measurement Duration
mfeed Ultrasonic flow meter
2% Trend log 1 minute interval for 3 days
Tfeed Thermistor 0.04oC Trend log 1 minute interval for 3 days
Tsteam RTD Based on installed sensor
Spot measurement/Trend
log
1 minute interval for 3 days (Depending on
installed system)
Psteam Pressure gauge Based on installed sensor
Spot measurement/Trend
log
1 minute interval for 3 days (Depending on
installed system)
Vfuel Plant flow meter or tank measurements
Based on installed sensor
Cumulative Daily readings
TDS Measured by permanent sensor
or periodic sampling as part of boiler O&M procedure
Based on current sensor / measurement methodology
Periodic sampling -
EnPI-2: Condensate recovery factor

ASSESSMENT FRAMEWORK FOR FOOD MANUFACTURING PLANTS
Formula: rate flow waterFeed
recoverd Condensate of Amount
Unit: % Description of parameters:
Amount of condensate recovered = Vfeed – MUwater
Vfeed = Feed water flow rate, m3/day
MUwater = Make-up water flow rate, m3/day
Heat and Mass Balance Analysis: Condensate recovery rate (kg/s) = Feed water flow rate (kg/s) – Make-up water flow rate (kg/s)
Measured Parameters:
Parameter Sensor type Accuracy Measurement type Measurement Duration
Vfeed Ultrasonic flow meter
2% Trend log 1 minute interval for 3 days
MUwater Plant water flow meter
2% Cumulative Daily readings
Others: The following parameters will also be used to evaluate the overall performance of boilers and steam systems:
1. Operating pressure 2. Combustion efficiency (where possible) 3. Steam leaks
3.5 OVENS AND FURNACES
EnPI-1: Energy Usage Efficiency
Formula: kW Heater, Electirc or Oven or Furnace to rate inputEnergy
kW products, theby rate absorptionEnergy
Unit: % Description of parameters:
Energy input rate to fuel fired furnace or oven, Qin = Vfuel x fuel x CV, kW Vfuel = Fuel consumption rate, m3/s
fuel = Density of fuel, kg/m3 CV = Gross calorific value of fuel, kJ/kg
Energy input rate to electrical furnace or oven, Qin = Input electrical
power to the heater, kW
Energy absorption rate by the products, Qout = Qin – Qconv – Qrad – Qex Convection heat loss from furnace skin Qconv = hcA(Tskin – Tair)/1000, kW Convective heat transfer coefficient hc = 10.45 - v + 10v0.5, W/m2 K v = Air flow velocity ranges from 2 to 20 m/s (natural)

ASSESSMENT FRAMEWORK FOR FOOD MANUFACTURING PLANTS
A = Exposed surface area of furnace or oven, m2 Tskin = Average temperature of furnace exposed surface, oC Tair = Surrounding air temperature, oC
Radiation heat loss from furnace exposed surface
Qrad = A[(Tskin)4– (Tair)4]/1000, kW
= Stefan-Boltzmann constant, 5.67x10⁻⁸ W/m2 K4
= Emissivity of furnace surface A = Exposed surface area of furnace or oven, m2 Tskin = Average temperature of furnace exposed surface, K Tair = Surrounding air temperature, K
Energy flow rate with flue gas Qex = mflue x Cp,flue x Tflue
mflue = Total mass flow rate of flue gas, kg/s Cp,flue = Specific heat of flue gas at Tflue, kJ/kg K Tflue = Flue gas temperature, oC (Note: Qex would be calculated for fuel fired furnace)
Determination of total mass flow rate of flue gas:
Measure fuel consumption rate using existing fuel flow meter = Vfuel
x fuel, kg/s
Calculate stoichiometric air fuel ratio and stoichiometric mass flow rate of air, kg/s
Measure O2 or CO2 or CO concentration in exhaust flue gas using gas analyzer (if port available)
Determine excess air flow rate based on measured O2 or CO2 or CO concentration, %
Total mass flow rate of flue gas (mflue), kg/s = Measured fuel consumption rate, kg/s + Stoichiometric air flow rate, kg/s x (1 + Excess air flow rate, fraction), kg/s
Heat and Mass Balance Analysis: Not required Others: Specification of fuel will be used to determine the gross calorific value of fuel (where applicable). Measured Parameters:
Parameter Sensor type Accuracy Measurement type Measurement Duration
Electrical power
Power transducer
1% Trend log 1 minute interval for 3 days
Tskin Infrared sensor 1oC Spot measurement -
Tair Temperature sensor
0.5oC Spot measurement -
Tflue RTD Based on installed sensor
Spot measurement -
Vfuel Plant flow meter or tank
measurements
Based on installed sensor
Cumulative Daily readings
ASSESSMENT FRAMEWORK FOR FOOD MANUFACTURING PLANTS
Compressor
Storage
tankMotor
kWcompressor
Air
Valve
Dryer Compressed air
Ptank
3.6 COMPRESSED AIR SYSTEMS
EnPI-1: Specific Energy Consumption of Compressor Formula:
/dayNm ,conditions normalat ratedelivery air Free
kWh/day system, cooling & dryers s,compressor ofn consumptioEnergy 3
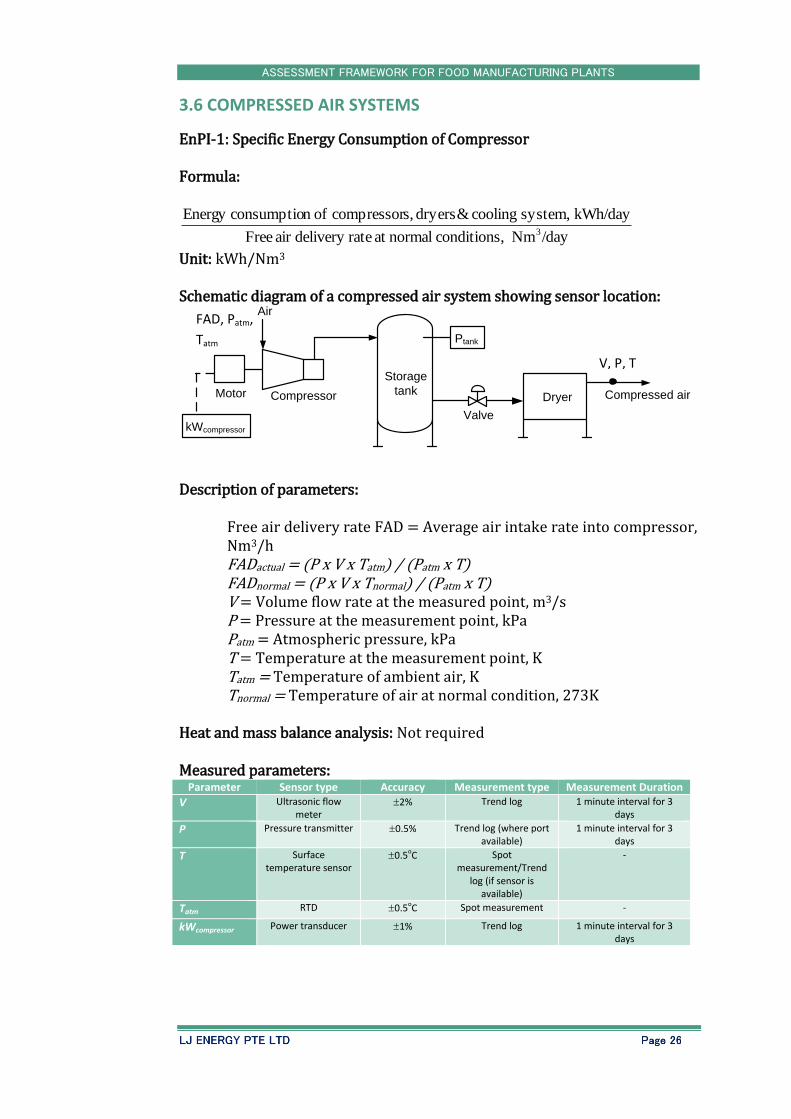
Unit: kWh/Nm3 Schematic diagram of a compressed air system showing sensor location: Description of parameters:
Free air delivery rate FAD = Average air intake rate into compressor, Nm3/h FADactual = (P x V x Tatm) / (Patm x T) FADnormal = (P x V x Tnormal) / (Patm x T) V = Volume flow rate at the measured point, m3/s P = Pressure at the measurement point, kPa Patm = Atmospheric pressure, kPa T = Temperature at the measurement point, K Tatm = Temperature of ambient air, K Tnormal = Temperature of air at normal condition, 273K
Heat and mass balance analysis: Not required Measured parameters:
Parameter Sensor type Accuracy Measurement type Measurement Duration
V Ultrasonic flow meter
2% Trend log 1 minute interval for 3 days
P Pressure transmitter 0.5% Trend log (where port available)
1 minute interval for 3 days
T Surface temperature sensor
0.5oC Spot measurement/Trend
log (if sensor is available)
-
Tatm RTD 0.5oC Spot measurement -
kWcompressor Power transducer 1% Trend log 1 minute interval for 3 days
V, P, T
FAD, Patm,
Tatm

ASSESSMENT FRAMEWORK FOR FOOD MANUFACTURING PLANTS
EnPI-2: Leakage Rate Formula:
System Leakage = minutes time, unload Average time load Average
minutes time, load Average x FAD
Unit: % and m3/min Description of parameters:
System leakage = (Q x T) / (T+ t), m3/min Q = Compressor FAD capacity, m3/min T = Average load time (minutes) t = Average unload time (minutes)
Measurement steps:
Switch-off equipment which use compressed air (plant shut-down) Operate the compressor and charge the system to the operating
pressure Measure the time taken for “load” and “unload” cycles continuously
for about 10 cycles Heat and mass balance analysis: Not required Measured parameters:
Parameter Sensor type Accuracy Measurement type Measurement duration
T Stop-watch Spot measurement 10 cycles
t Stop-watch Spot measurement 10 cycles
EnPI-3: Compressor Loading Percentage
Formula: minutes operation, unloaded and loaded of duration Average
minutes operation, loaded of duration Average
Unit: % Description of parameters:
Loading percentage = T / (T + t) x 100 T = Average load time (minutes) t = Average unload time (minutes)
Measurement steps:
Measure the time taken for “load” and “unload” cycles continuously for about 10 cycles
Heat and mass balance analysis: Not required Measured parameters:
Parameter Sensor type Accuracy Measurement type Measurement Duration
T Stop-watch Spot measurement 10 cycles
t Stop-watch Spot measurement 10 cycles

ASSESSMENT FRAMEWORK FOR FOOD MANUFACTURING PLANTS
Blower Cooling or heating coil
kWblowerCMH
Filter
Air
Others: The following parameters would also be used to evaluate the overall performance of compressed air systems:
1. Operating pressure 2. Intake temperature 3. Operating dew-point 4. Dryer power
3.7 FAN SYSTEMS
EnPI-1: Specific Power Consumption of Fans
Formula: /sm fan, of rate flow Volume
kW fan, ofn consumptioPower 3
Unit: kW/m3/s Schematic diagram of typical fan system showing sensor location: Description of parameters:
Q = Volume flow rate of air, m3/s kWblower = Fan / Blower power consumption, kW
Heat and mass balance analysis: Not required Measured parameters:
Parameter Sensor type Accuracy Measurement type Measurement Duration
Q Hot wire anemometer ±0.015 m/s Spot measurement -
kWblower Fluke power meter ±1% Spot measurement -
Others: The following parameters will also be used to evaluate the overall performance of ventilation systems:
1. Number of air changes 2. Type of filter / filter pressure drop 3. Code requirements
Q
ASSESSMENT FRAMEWORK FOR FOOD MANUFACTURING PLANTS
3.8 LIGHTING SYSTEMS
EnPI-1: Lighting Power Density
Formula: 2m area, Floor
W ballast, or gear including lamps of Power
Unit: W/m2 Description of parameters:
Count number and types of lamps Determine power of lamps, gear or ballast by measuring the power
consumption of 2 nos. of sample lighting circuits and counting number of lamps connected to the corresponding circuits (where feasible).
If different types of lamps or receptacle loads are connected with the lighting circuits, rated power of lamps, gear or ballast will be used.
Determine floor area served EnPI-2: Illuminance Level (Lux): Unit: Lux Description of parameters:
Measure Lux level for each type of space usage Measure Lux level at few locations for each type of space usage to
determine the range of illuminance level
3.9 PRODUCTION SYSTEMS
EnPI-1: Comparison of Specific Energy Consumption Comparison of actual specific energy consumption to the rated specific energy consumption
Formula:
output ratedkWh ,equipment production of nconsumptioenergy Rated
output actualkWh process, production of nconsumptioenergy Actual process
Unit: None Description of parameters:
Energy consumption of selected production processes will be measured for a particular period
Number of product units produced or weight of material processed (or any other suitable quantity of measure) during the same period will be recorded
The rated energy consumption of the production equipment and its rated capacity will be obtained from the manufacturer specifications
Heat and mass balance analysis: Not required

ASSESSMENT FRAMEWORK FOR FOOD MANUFACTURING PLANTS
Measured parameters: Parameter Sensor type Accuracy Measurement type Measurement Duration
kWhprocess Power transducer ±1% Trend log 1 minute interval for 2 days
Actual output of system
- - Production records 2 days
3.10 PACKAGING SYSTEMS
EnPI-1: Specific Energy Consumption
Formula: period samethe during produced unit of Number
kWh process, packaging of nconsumptioenergy Total
period samethe during packaged products of weightor Volume
kWh process, packaging of nconsumptioenergy Total
Unit: kWh/unit Description of parameters:
Energy consumption of selected packaging system will be measured for a particular period
Number of product units produced or weight of material processed (or any other suitable quantity of measure) during the same period will be recorded
Heat and mass balance analysis: Not required
Measured parameters:
Parameter Sensor type Accuracy Measurement type Measurement Duration
kWpackaging Power transducer ±1% Trend log 1 minute interval for 2 days
Output of system
- - Production records 2 days
EnPI-2: Comparison of Specific Energy Consumption Comparison of actual specific energy consumption to the rated specific energy consumption
Formula:
output ratedkWh ,equipment packaging of nconsumptioenergy Rated
output actualkWh process, packaging of nconsumptioenergy Actual packing
Unit: None Description of parameters:
Energy consumption of selected packaging system will be measured for a particular period

ASSESSMENT FRAMEWORK FOR FOOD MANUFACTURING PLANTS
Number of product units produced or weight of material processed (or any other suitable quantity of measure) during the same period will be recorded
The rated energy consumption of the packaging system and its rated capacity will be obtained from the manufacturer specifications
Heat and mass balance analysis: Not required
Measured parameters:
Parameter Sensor type Accuracy Measurement type Measurement Duration
kWhpacking Power transducer ±1% Trend log 1 minute interval for 2 days
Actual output of system
- - Production records 2 days
3.11 OTHER SYSTEMS
As stated in Section-2, if the total energy consumption of the equipment and
systems measured is less than 80% of the total energy usage of the plant,
additional equipment and systems will be included in the assessment.

ASSESSMENT FRAMEWORK FOR FOOD MANUFACTURING PLANTS
3.11 EVALUATION OF MATURITY LEVEL OF ENERGY MANAGEMENT SYSTEM
Maturity level of existing Energy Management System (EnMS) will be
evaluated based on the following criteria:
1) Energy policy
2) Energy Management team
3) Energy monitoring and accounting
4) Capabilities and training needs
5) Availability of funding
An interview will be conducted with the relevant personnel in the plant to
evaluate present status using the following metrics:
1) Energy policy
Level-1: No explicit energy policy Level-2: Unwritten set of guidelines Level-3: Unadopted energy policy set by department or energy
manager Level-4: Developed formal energy policy, but no commitment from
top management Level-5: Energy policy, planning and regular review. Commitment of
top management as part of environmental strategy
2) Energy Management team
Level-1: No formal delegation of responsibility for energy consumption
Level-2: Energy management is part-time responsibility of somebody with limited influence
Level-3: Energy manager appointed, Reporting to ad-hoc committee, Line management and authority not defined properly
Level-4: Chaired by member managing board, Energy manager accountable to energy committee representing all users
Level-5: Energy Management System is fully integrated into management structure, Clear delegation of responsibility for energy consumption
3) Energy Monitoring and Accounting
Level-1: No accounting / information for energy consumption Level-2: Facility engineer compiles energy consumption report
based on invoice data for internal use within technical department
ASSESSMENT FRAMEWORK FOR FOOD MANUFACTURING PLANTS
Level-3: Energy consumption monitoring & targeting based on main meter data. Energy unit has ad-hoc involvement in budget setting
Level-4: Energy consumption of major energy users are monitored using sub-meters. Energy savings not reported to respective users
Level-5: Formal and informal communication by Energy manager & energy staff at all levels
4) Capabilities and training needs
Level-1: Little knowledge / expertise in Energy Management Level-2: Have at least one person with some knowledge of Energy
Management or attended training in Energy Management Level-3: Have one Certified Energy Manager Level-4: Have more than one Certified Energy Manager Level-5: Have more than one Certified Energy Manager and
operations and Facility management staff regularly attend Energy Management related training
5) Availability of funding
Level-1: No investment for improving energy efficiency. No cost energy saving measures taken
Level-2: Only low cost energy saving measures taken Level-3: Energy saving measures with only short term payback
period taken Level-4: Same payback criteria as for other investment Level-5: In favor of “Green” schemes with detailed investment
appraisal of new energy efficient equipment and upgrading scopes
3.12 EVALUATION OF MAINTENANCE PRACTICES
The maintenance practices will be evaluated based on observations and
interview of relevant personnel using the following metrics:
Filters & strainers
Level-1: No regular schedule for checking and maintenance Level-2: Have a regular schedule but no evidence of compliance Level-3: Have a regular schedule and evidence of compliance Level-4: Have a comprehensive maintenance program with key
performance indicators and regular tracking of performance
Steam leaks
Level-1: Significant amount of leaks observed and no formal program to minimise leaks
Level-2: No formal program to minimise leaks but only few leaks observed
ASSESSMENT FRAMEWORK FOR FOOD MANUFACTURING PLANTS
Level-3: Have a regular program to check for leaks but some leaks are observed
Level-4: No leaks are observed
Compressed air leaks
Level-1: Significant amount of leaks observed and no formal program to minimise leaks
Level-2: No formal program to minimise leaks but only few leaks observed
Level-3: Have a regular program to check for leaks but some leaks are observed
Level-4: No leaks are observed
Condensers, boilers and heat exchangers
Level-1: No regular schedule for checking and maintenance Level-2: Have a regular schedule but no evidence of compliance Level-3: Have a regular schedule and evidence of compliance Level-4: Regular monitoring of performance with set KPIs
Motors and drives
Level-1: No regular schedule for checking and maintenance Level-2: Have a regular schedule but no evidence of compliance Level-3: Have a regular schedule and evidence of compliance Level-4: Have a predictive maintenance program (vibration
monitoring etc.) in addition to regular preventive maintenance
Monitoring and Control system
Level-1: No regular schedule for checking and maintenance Level-2: Have a regular schedule but evidence of wrong or erroneous
display readings Level-3: Have a regular schedule and display of readings appear to
be normal Level-4: Have a regular maintenance program together with regular
checking and calibration of sensors

ASSESSMENT FRAMEWORK FOR FOOD MANUFACTURING PLANTS
4.0 BENCHMARKING VALUES
Energy Performance Indicators (EnPIs) will be compared with benchmark
or established values which are summarized in the table below.
Energy Performance
Indicator Unit Benchmark Value
Chilled Water Systems
EnPI-1: COP of chillers
(water cooled, >300RT)
kWc/kWe
(kWe/RT)
6.9
(0.51)
EnPI-2: Specific power consumption of chilled water pumps
kWe /kWc
(kWe/RT)
0.0085
(0.03)
EnPI-3: Efficiency of chilled water pump system
% 72
EnPI-4: Specific power consumption of condenser water pumps
kWe /kWc
(kWe/RT)
0.0085
(0.03)
EnPI-5: Efficiency of condenser water pump system
% 72
EnPI-6: COP of cooling towerskWc/kWe
(kWe/RT)
117
(0.03)
EnPI-7: COP of chilled water system
kWc/kWe
(kWe/RT)
5.85
(0.60)
Process Cooling (Cooling Tower) Systems
EnPI-1: Specific heat rejection rate by cooling tower
kWC/kWe 117
EnPI-2: Efficiency of cooling tower water pump system
% 72
Refrigeration Systems
EnPI-1: Specific energy consumption
- Not available
ASSESSMENT FRAMEWORK FOR FOOD MANUFACTURING PLANTS
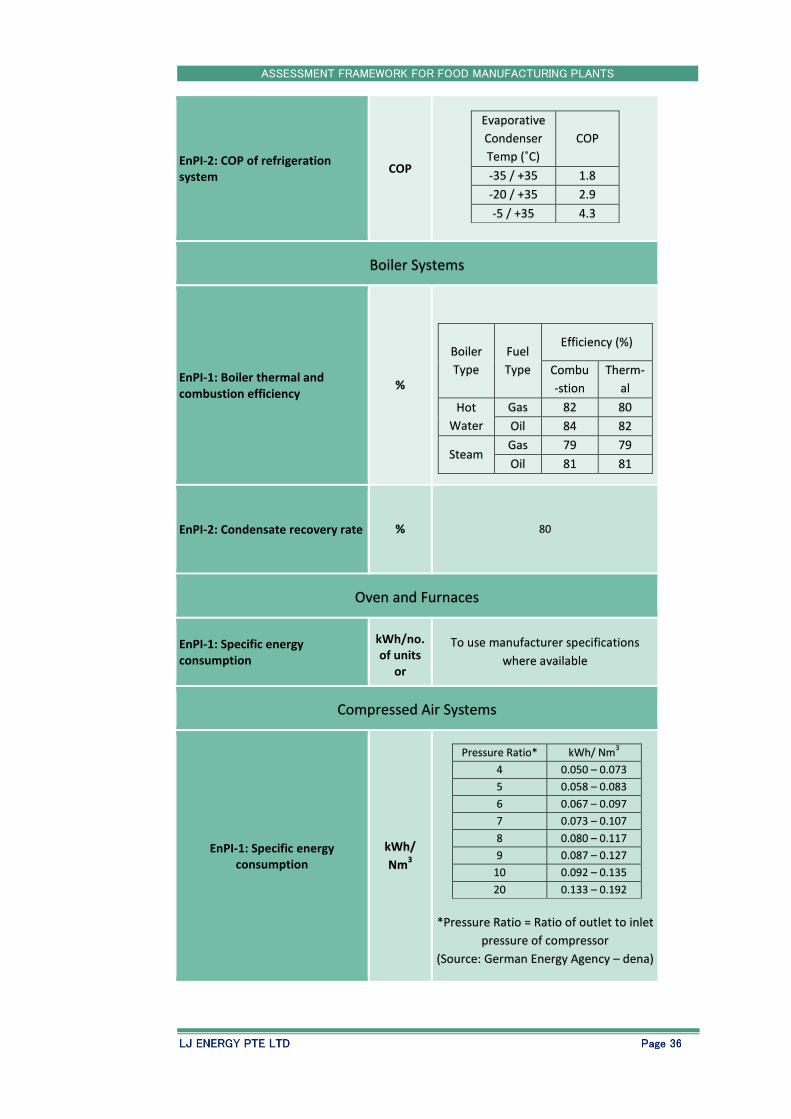
EnPI-2: COP of refrigeration system
COP
Evaporative
Condenser
Temp (˚C)
COP
-35 / +35 1.8
-20 / +35 2.9
-5 / +35 4.3
Boiler Systems
EnPI-1: Boiler thermal and combustion efficiency
%
Boiler
Type
Fuel
Type
Efficiency (%)
Combu
-stion
Therm-
al
Hot
Water
Gas 82 80
Oil 84 82
Steam Gas 79 79
Oil 81 81
EnPI-2: Condensate recovery rate % 80
Oven and Furnaces
EnPI-1: Specific energy consumption
kWh/no. of units
or kWh/kg
To use manufacturer specifications
where available
Compressed Air Systems
EnPI-1: Specific energy consumption
kWh/
Nm3
Pressure Ratio* kWh/ Nm3
4 0.050 – 0.073
5 0.058 – 0.083
6 0.067 – 0.097
7 0.073 – 0.107
8 0.080 – 0.117
9 0.087 – 0.127
10 0.092 – 0.135
20 0.133 – 0.192
*Pressure Ratio = Ratio of outlet to inlet
pressure of compressor
(Source: German Energy Agency – dena)

ASSESSMENT FRAMEWORK FOR FOOD MANUFACTURING PLANTS
EnPI-2: Leakage rate% and
m3/min
<2%
EnPI-3: Compressor loading percentage
% Not available
Fan Systems
EnPI-1: Specific power consumption of fans
kW/CMH
SS 553:2009
1.7 kW/m3/s (CAV)
2.4 kW/m3/s (VAV)
Lighting Systems
EnPI-1: Lighting power density W/m2
SS530:2014
7 W/m2 for warehouses
10 W/m2
for storage areas
10 W/m2 for mechanical & electrical
rooms
12W/m2
for office areas
13 W/m2 for manufacturing (Assembly
area)
EnPI-2: Illuminance level (Lux) Lux
SS531 Part 1: 2006 (2013)
100 to 200 Lux for warehouses
200 to 500 Lux for work / manufacturing
places
300 to 500 Lux for office areas
300 Lux for cutting, sorting and washing
areas
Production Systems
EnPI-1: Comparison of specific energy consumption
- To use manufacturer specifications
where available
Packaging Systems
EnPI-1: Specific energy consumption
kWh/unit
To use manufacturer specifications
where available
For common packaging systems, to
compare with best performing site
EnPI-2: Comparison of specific energy consumption
- Not available