Embed Size (px)
Citation preview
Energy DrinksFall 2012
Barrett Larson
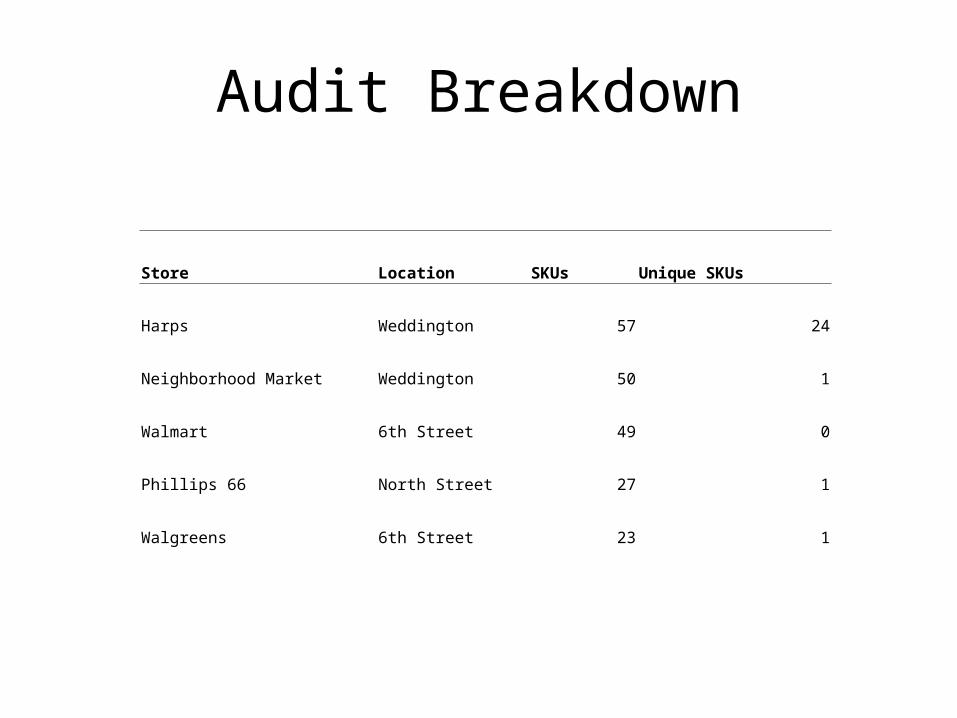
Audit Breakdown
Store Location SKUs Unique SKUs
Harps Weddington 57 24
Neighborhood Market Weddington 50 1
Walmart 6th Street 49 0
Phillips 66 North Street 27 1
Walgreens 6th Street 23 1
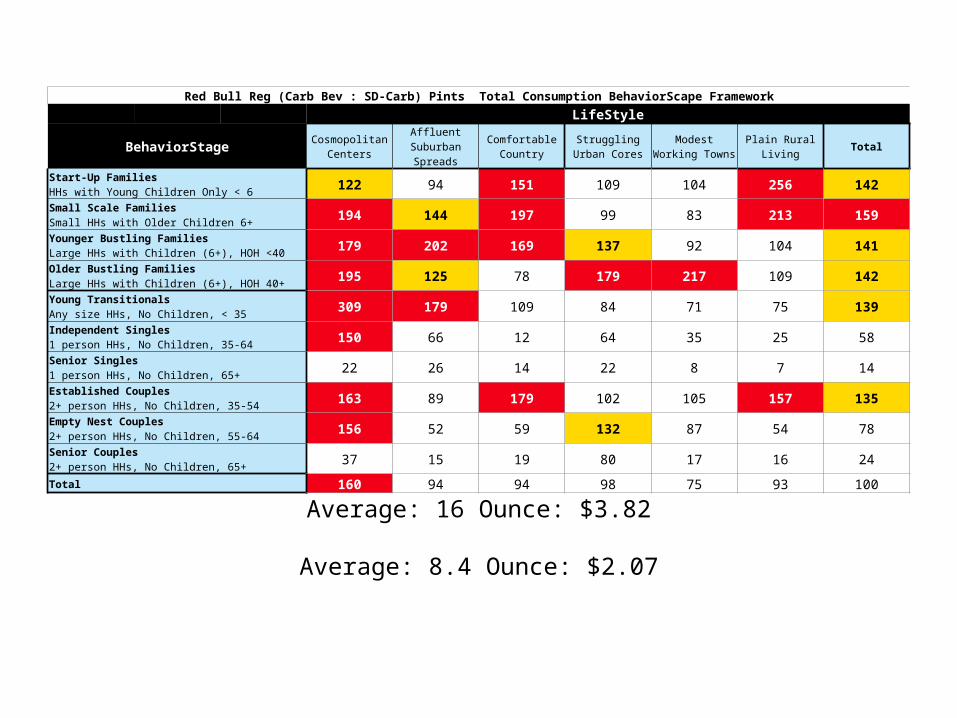
Average: 16 Ounce: $3.82
Average: 8.4 Ounce: $2.07
Red Bull Reg (Carb Bev : SD-Carb) Pints Total Consumption BehaviorScape Framework LifeStyle
BehaviorStage Cosmopolitan Centers
Affluent Suburban Spreads
Comfortable Country
Struggling Urban Cores
Modest Working Towns
Plain Rural Living Total
Start-Up FamiliesHHs with Young Children Only < 6 122 94 151 109 104 256 142Small Scale FamiliesSmall HHs with Older Children 6+ 194 144 197 99 83 213 159Younger Bustling FamiliesLarge HHs with Children (6+), HOH <40 179 202 169 137 92 104 141Older Bustling FamiliesLarge HHs with Children (6+), HOH 40+ 195 125 78 179 217 109 142Young TransitionalsAny size HHs, No Children, < 35 309 179 109 84 71 75 139Independent Singles1 person HHs, No Children, 35-64 150 66 12 64 35 25 58Senior Singles1 person HHs, No Children, 65+ 22 26 14 22 8 7 14Established Couples2+ person HHs, No Children, 35-54 163 89 179 102 105 157 135Empty Nest Couples2+ person HHs, No Children, 55-64 156 52 59 132 87 54 78Senior Couples2+ person HHs, No Children, 65+ 37 15 19 80 17 16 24
Total 160 94 94 98 75 93 100

Amp R (Carb Bev : SD-Carb) Pints * Total Consumption BehaviorScape Framework LifeStyle
BehaviorStage Cosmopolitan Centers
Affluent Suburban Spreads
Comfortable Country
Struggling Urban Cores
Modest Working Towns
Plain Rural Living Total
Start-Up FamiliesHHs with Young Children Only < 6 58 19 182 57 404 150 150
Small Scale FamiliesSmall HHs with Older Children 6+ 173 107 233 69 158 140 150
Younger Bustling FamiliesLarge HHs with Children (6+), HOH <40 157 143 268 93 166 231 183
Older Bustling FamiliesLarge HHs with Children (6+), HOH 40+ 831 102 135 26 188 232 220
Young TransitionalsAny size HHs, No Children, < 35 63 211 96 110 73 79 98
Independent Singles1 person HHs, No Children, 35-64 31 50 25 30 20 83 40
Senior Singles1 person HHs, No Children, 65+ 15 52 13 24 4 11 17
Established Couples2+ person HHs, No Children, 35-54 227 64 78 76 33 95 93
Empty Nest Couples2+ person HHs, No Children, 55-64 59 32 108 32 37 45 56
Senior Couples2+ person HHs, No Children, 65+ 27 12 48 43 41 35 34
Total 155 72 114 59 99 101 100
16oz. $2.41
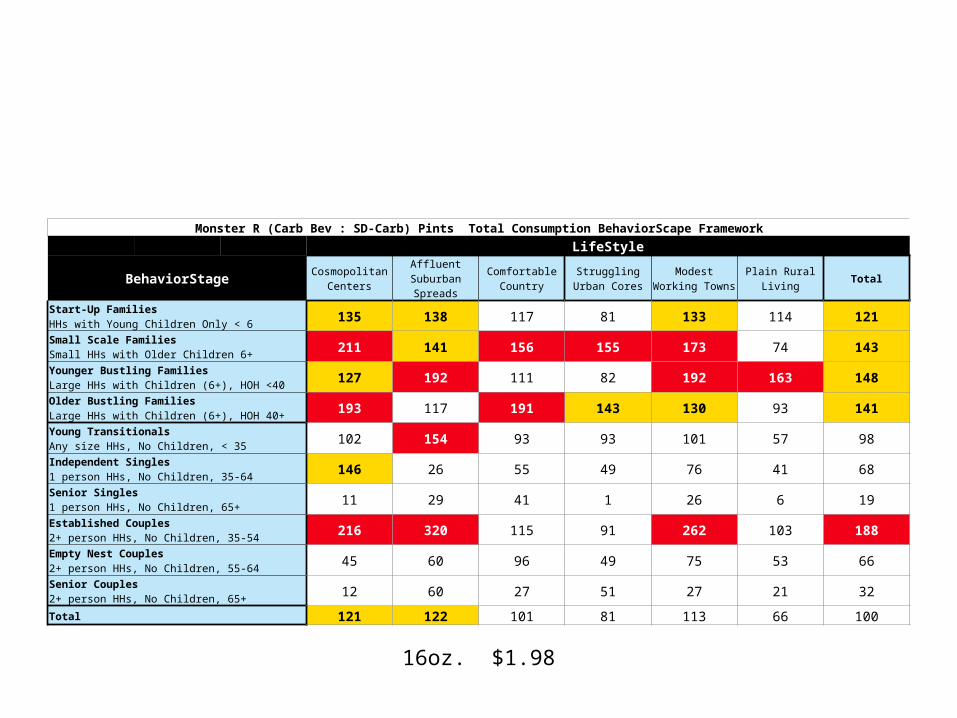
16oz. $1.98
Monster R (Carb Bev : SD-Carb) Pints Total Consumption BehaviorScape Framework LifeStyle
BehaviorStage Cosmopolitan Centers
Affluent Suburban Spreads
Comfortable Country
Struggling Urban Cores
Modest Working Towns
Plain Rural Living Total
Start-Up FamiliesHHs with Young Children Only < 6 135 138 117 81 133 114 121
Small Scale FamiliesSmall HHs with Older Children 6+ 211 141 156 155 173 74 143
Younger Bustling FamiliesLarge HHs with Children (6+), HOH <40 127 192 111 82 192 163 148
Older Bustling FamiliesLarge HHs with Children (6+), HOH 40+ 193 117 191 143 130 93 141
Young TransitionalsAny size HHs, No Children, < 35 102 154 93 93 101 57 98
Independent Singles1 person HHs, No Children, 35-64 146 26 55 49 76 41 68
Senior Singles1 person HHs, No Children, 65+ 11 29 41 1 26 6 19
Established Couples2+ person HHs, No Children, 35-54 216 320 115 91 262 103 188
Empty Nest Couples2+ person HHs, No Children, 55-64 45 60 96 49 75 53 66
Senior Couples2+ person HHs, No Children, 65+ 12 60 27 51 27 21 32
Total 121 122 101 81 113 66 100
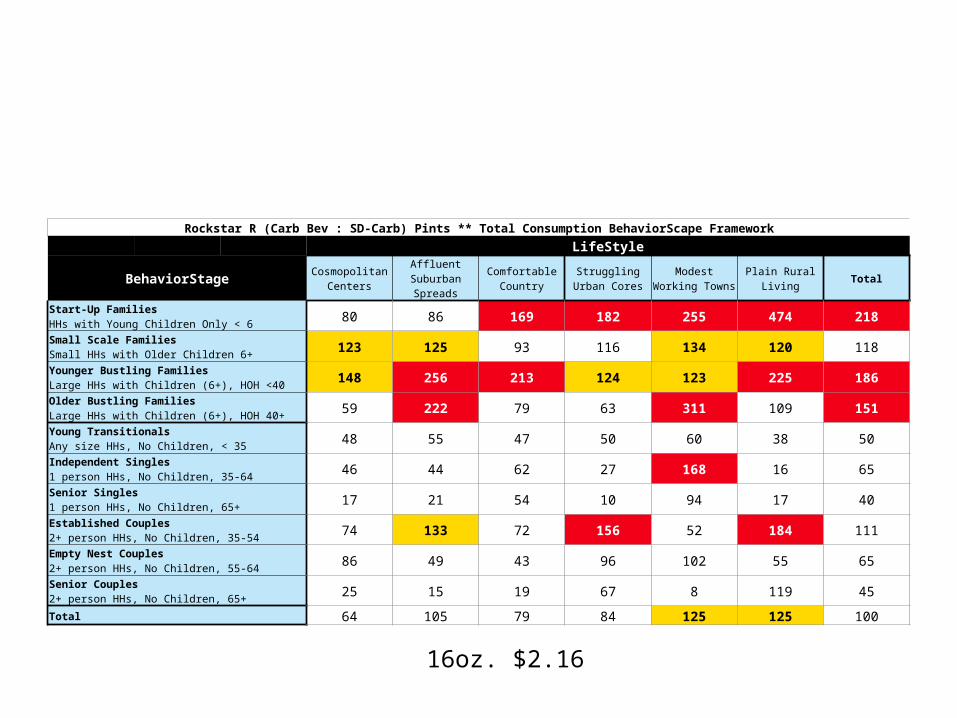
16oz. $2.16
Rockstar R (Carb Bev : SD-Carb) Pints ** Total Consumption BehaviorScape Framework LifeStyle
BehaviorStage Cosmopolitan Centers
Affluent Suburban Spreads
Comfortable Country
Struggling Urban Cores
Modest Working Towns
Plain Rural Living Total
Start-Up FamiliesHHs with Young Children Only < 6 80 86 169 182 255 474 218
Small Scale FamiliesSmall HHs with Older Children 6+ 123 125 93 116 134 120 118
Younger Bustling FamiliesLarge HHs with Children (6+), HOH <40 148 256 213 124 123 225 186
Older Bustling FamiliesLarge HHs with Children (6+), HOH 40+ 59 222 79 63 311 109 151
Young TransitionalsAny size HHs, No Children, < 35 48 55 47 50 60 38 50
Independent Singles1 person HHs, No Children, 35-64 46 44 62 27 168 16 65
Senior Singles1 person HHs, No Children, 65+ 17 21 54 10 94 17 40
Established Couples2+ person HHs, No Children, 35-54 74 133 72 156 52 184 111
Empty Nest Couples2+ person HHs, No Children, 55-64 86 49 43 96 102 55 65
Senior Couples2+ person HHs, No Children, 65+ 25 15 19 67 8 119 45
Total 64 105 79 84 125 125 100
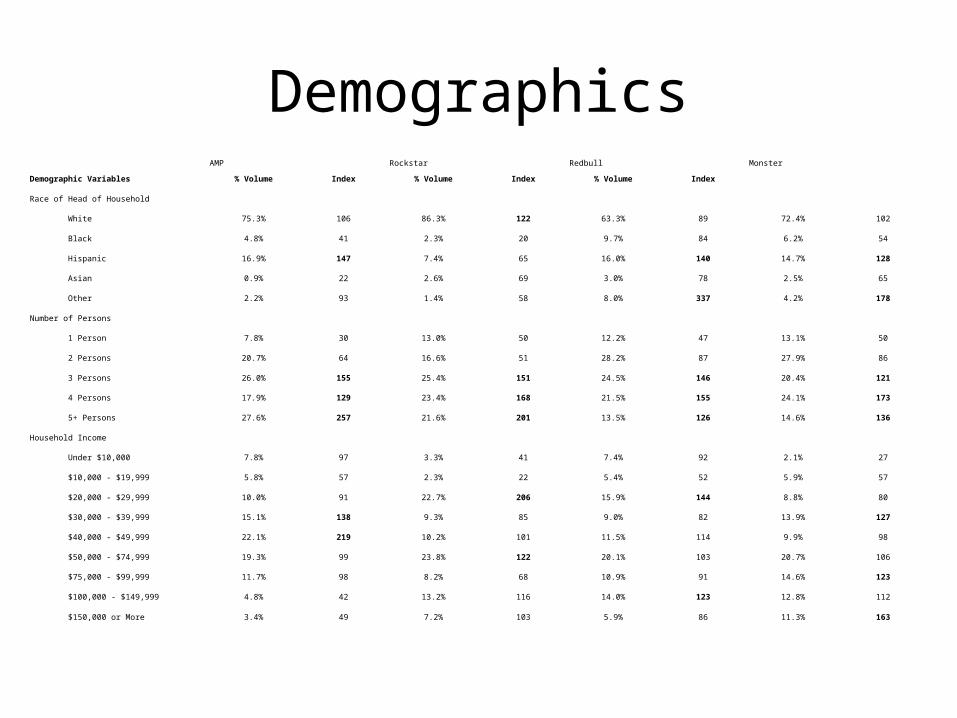
Demographics AMP Rockstar Redbull Monster
Demographic Variables % Volume Index % Volume Index % Volume Index
Race of Head of Household
White 75.3% 106 86.3% 122 63.3% 89 72.4% 102
Black 4.8% 41 2.3% 20 9.7% 84 6.2% 54
Hispanic 16.9% 147 7.4% 65 16.0% 140 14.7% 128
Asian 0.9% 22 2.6% 69 3.0% 78 2.5% 65
Other 2.2% 93 1.4% 58 8.0% 337 4.2% 178
Number of Persons
1 Person 7.8% 30 13.0% 50 12.2% 47 13.1% 50
2 Persons 20.7% 64 16.6% 51 28.2% 87 27.9% 86
3 Persons 26.0% 155 25.4% 151 24.5% 146 20.4% 121
4 Persons 17.9% 129 23.4% 168 21.5% 155 24.1% 173
5+ Persons 27.6% 257 21.6% 201 13.5% 126 14.6% 136
Household Income
Under $10,000 7.8% 97 3.3% 41 7.4% 92 2.1% 27
$10,000 - $19,999 5.8% 57 2.3% 22 5.4% 52 5.9% 57
$20,000 - $29,999 10.0% 91 22.7% 206 15.9% 144 8.8% 80
$30,000 - $39,999 15.1% 138 9.3% 85 9.0% 82 13.9% 127
$40,000 - $49,999 22.1% 219 10.2% 101 11.5% 114 9.9% 98
$50,000 - $74,999 19.3% 99 23.8% 122 20.1% 103 20.7% 106
$75,000 - $99,999 11.7% 98 8.2% 68 10.9% 91 14.6% 123
$100,000 - $149,999 4.8% 42 13.2% 116 14.0% 123 12.8% 112
$150,000 or More 3.4% 49 7.2% 103 5.9% 86 11.3% 163
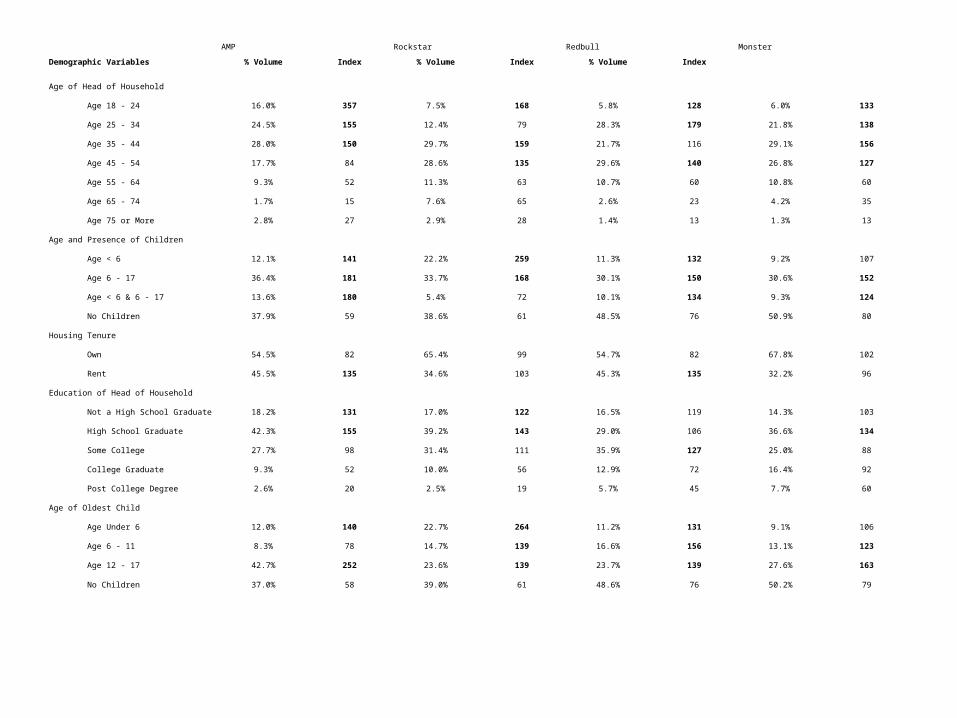
Age of Head of Household
Age 18 - 24 16.0% 357 7.5% 168 5.8% 128 6.0% 133
Age 25 - 34 24.5% 155 12.4% 79 28.3% 179 21.8% 138
Age 35 - 44 28.0% 150 29.7% 159 21.7% 116 29.1% 156
Age 45 - 54 17.7% 84 28.6% 135 29.6% 140 26.8% 127
Age 55 - 64 9.3% 52 11.3% 63 10.7% 60 10.8% 60
Age 65 - 74 1.7% 15 7.6% 65 2.6% 23 4.2% 35
Age 75 or More 2.8% 27 2.9% 28 1.4% 13 1.3% 13
Age and Presence of Children
Age < 6 12.1% 141 22.2% 259 11.3% 132 9.2% 107
Age 6 - 17 36.4% 181 33.7% 168 30.1% 150 30.6% 152
Age < 6 & 6 - 17 13.6% 180 5.4% 72 10.1% 134 9.3% 124
No Children 37.9% 59 38.6% 61 48.5% 76 50.9% 80
Housing Tenure
Own 54.5% 82 65.4% 99 54.7% 82 67.8% 102
Rent 45.5% 135 34.6% 103 45.3% 135 32.2% 96
Education of Head of Household
Not a High School Graduate 18.2% 131 17.0% 122 16.5% 119 14.3% 103
High School Graduate 42.3% 155 39.2% 143 29.0% 106 36.6% 134
Some College 27.7% 98 31.4% 111 35.9% 127 25.0% 88
College Graduate 9.3% 52 10.0% 56 12.9% 72 16.4% 92
Post College Degree 2.6% 20 2.5% 19 5.7% 45 7.7% 60
Age of Oldest Child
Age Under 6 12.0% 140 22.7% 264 11.2% 131 9.1% 106
Age 6 - 11 8.3% 78 14.7% 139 16.6% 156 13.1% 123
Age 12 - 17 42.7% 252 23.6% 139 23.7% 139 27.6% 163
No Children 37.0% 58 39.0% 61 48.6% 76 50.2% 79
AMP Rockstar Redbull Monster
Demographic Variables % Volume Index % Volume Index % Volume Index
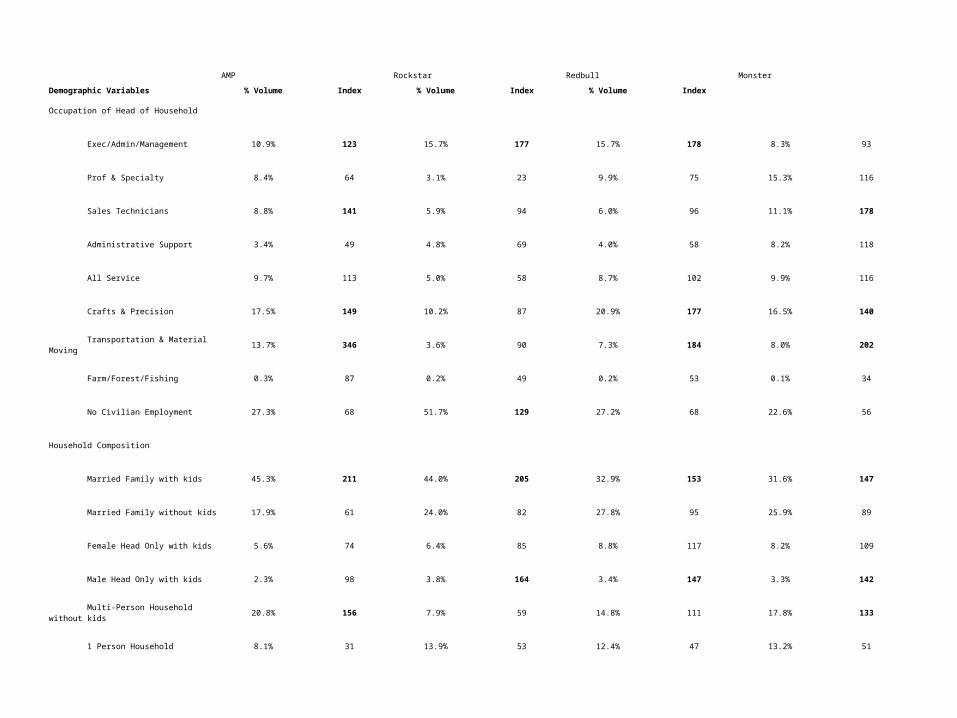
Occupation of Head of Household
Exec/Admin/Management 10.9% 123 15.7% 177 15.7% 178 8.3% 93
Prof & Specialty 8.4% 64 3.1% 23 9.9% 75 15.3% 116
Sales Technicians 8.8% 141 5.9% 94 6.0% 96 11.1% 178
Administrative Support 3.4% 49 4.8% 69 4.0% 58 8.2% 118
All Service 9.7% 113 5.0% 58 8.7% 102 9.9% 116
Crafts & Precision 17.5% 149 10.2% 87 20.9% 177 16.5% 140
Transportation & Material Moving 13.7% 346 3.6% 90 7.3% 184 8.0% 202
Farm/Forest/Fishing 0.3% 87 0.2% 49 0.2% 53 0.1% 34
No Civilian Employment 27.3% 68 51.7% 129 27.2% 68 22.6% 56
Household Composition
Married Family with kids 45.3% 211 44.0% 205 32.9% 153 31.6% 147
Married Family without kids 17.9% 61 24.0% 82 27.8% 95 25.9% 89
Female Head Only with kids 5.6% 74 6.4% 85 8.8% 117 8.2% 109
Male Head Only with kids 2.3% 98 3.8% 164 3.4% 147 3.3% 142
Multi-Person Household without kids 20.8% 156 7.9% 59 14.8% 111 17.8% 133
1 Person Household 8.1% 31 13.9% 53 12.4% 47 13.2% 51
AMP Rockstar Redbull Monster
Demographic Variables % Volume Index % Volume Index % Volume Index
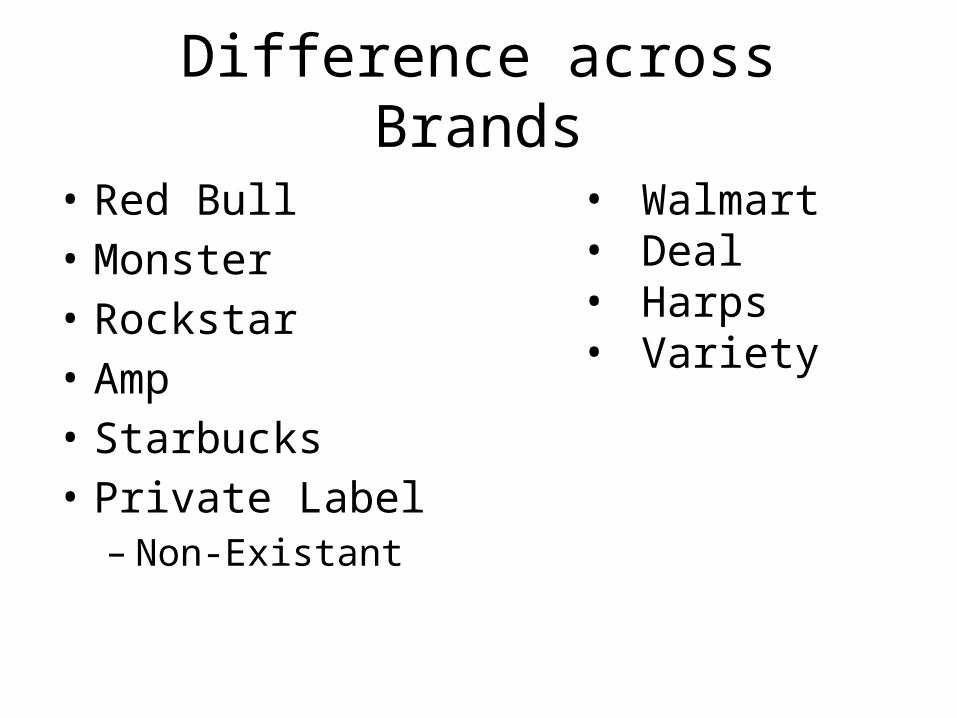
Difference across Brands
• Red Bull• Monster• Rockstar• Amp• Starbucks• Private Label
– Non-Existant
• Walmart• Deal• Harps• Variety

Growth
Neighborhood Market Harp’s Weddington
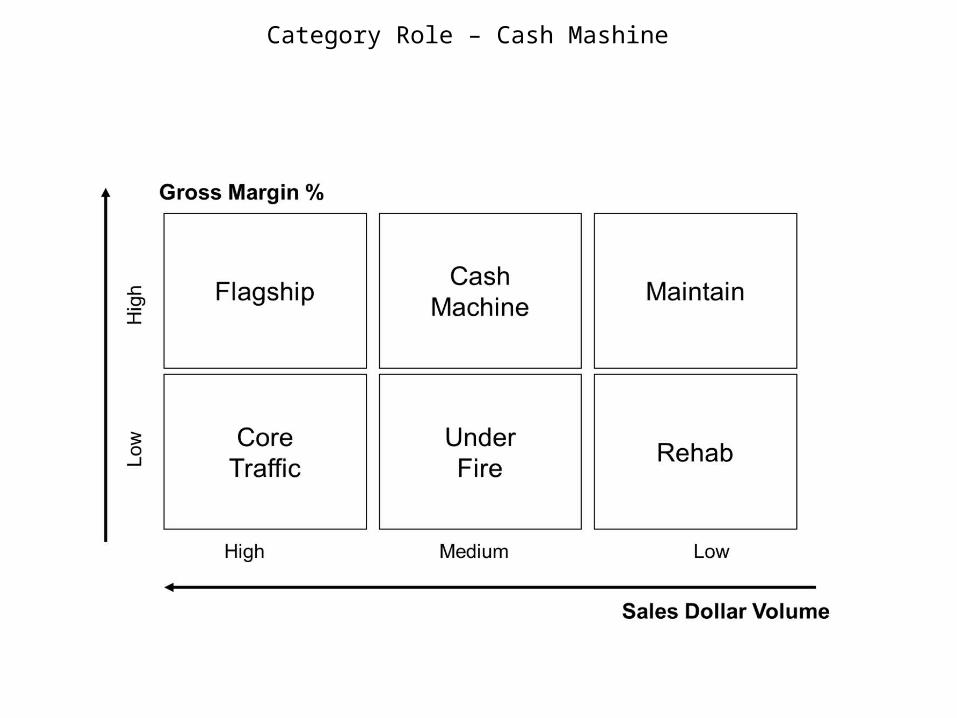
Category Role – Cash Mashine
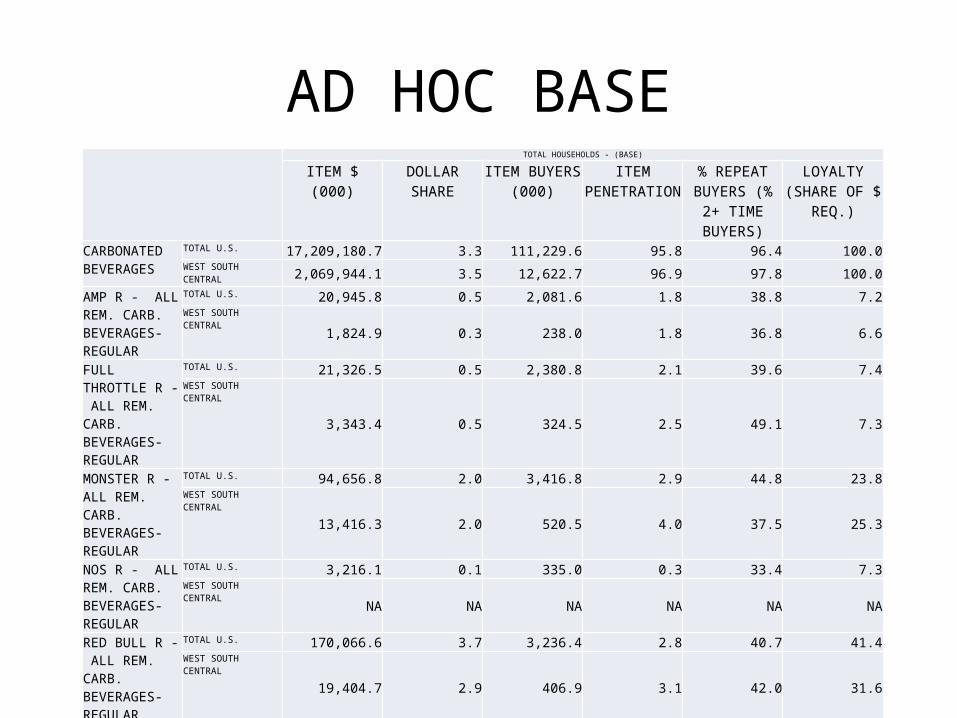
AD HOC BASE TOTAL HOUSEHOLDS - (BASE)
ITEM $ (000) DOLLAR SHARE ITEM BUYERS (000)
ITEM PENETRATION
% REPEAT BUYERS (% 2+ TIME BUYERS)
LOYALTY (SHARE OF $ REQ.)
CARBONATED BEVERAGES
TOTAL U.S. 17,209,180.7 3.3 111,229.6 95.8 96.4 100.0WEST SOUTH CENTRAL
2,069,944.1 3.5 12,622.7 96.9 97.8 100.0
AMP R - ALL REM. CARB. BEVERAGES- REGULAR
TOTAL U.S. 20,945.8 0.5 2,081.6 1.8 38.8 7.2WEST SOUTH CENTRAL
1,824.9 0.3 238.0 1.8 36.8 6.6
FULL THROTTLE R - ALL REM. CARB. BEVERAGES- REGULAR
TOTAL U.S. 21,326.5 0.5 2,380.8 2.1 39.6 7.4WEST SOUTH CENTRAL
3,343.4 0.5 324.5 2.5 49.1 7.3
MONSTER R - ALL REM. CARB. BEVERAGES- REGULAR
TOTAL U.S. 94,656.8 2.0 3,416.8 2.9 44.8 23.8WEST SOUTH CENTRAL
13,416.3 2.0 520.5 4.0 37.5 25.3
NOS R - ALL REM. CARB. BEVERAGES- REGULAR
TOTAL U.S. 3,216.1 0.1 335.0 0.3 33.4 7.3WEST SOUTH CENTRAL
NA NA NA NA NA NA
RED BULL R - ALL REM. CARB. BEVERAGES- REGULAR
TOTAL U.S. 170,066.6 3.7 3,236.4 2.8 40.7 41.4WEST SOUTH CENTRAL
19,404.7 2.9 406.9 3.1 42.0 31.6
ROCKSTAR R - ALL REM. CARB. BEVERAGES- REGULAR
TOTAL U.S. 26,430.7 0.6 1,597.6 1.4 38.0 13.1WEST SOUTH CENTRAL
NA NA NA NA NA NA
Changes in Category Depth
• Category Growth• Category Role
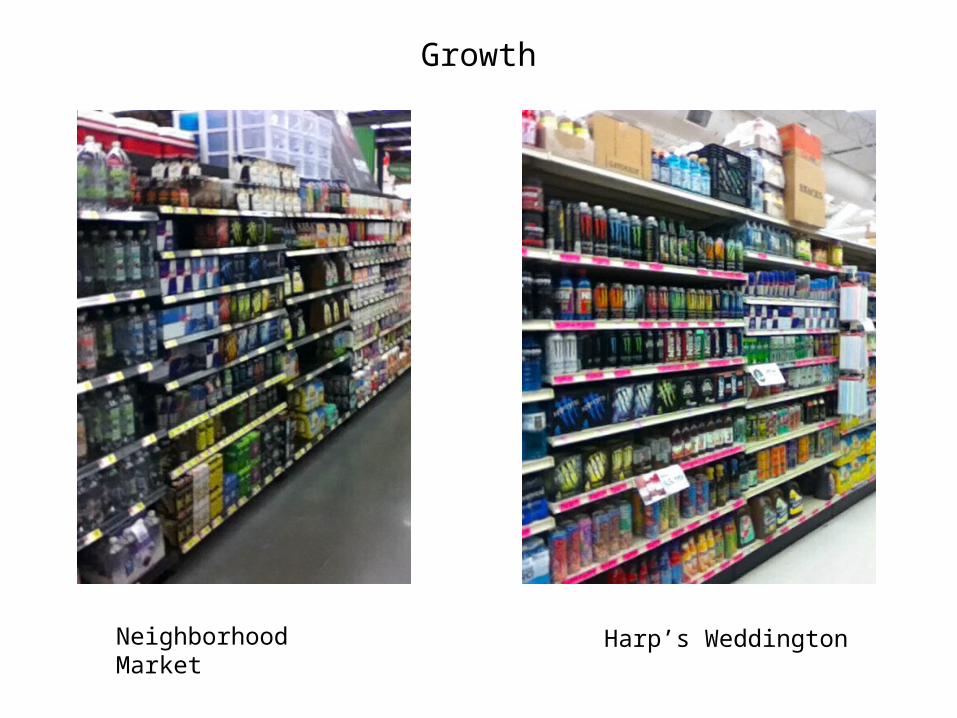
Growth
Neighborhood Market Harp’s Weddington
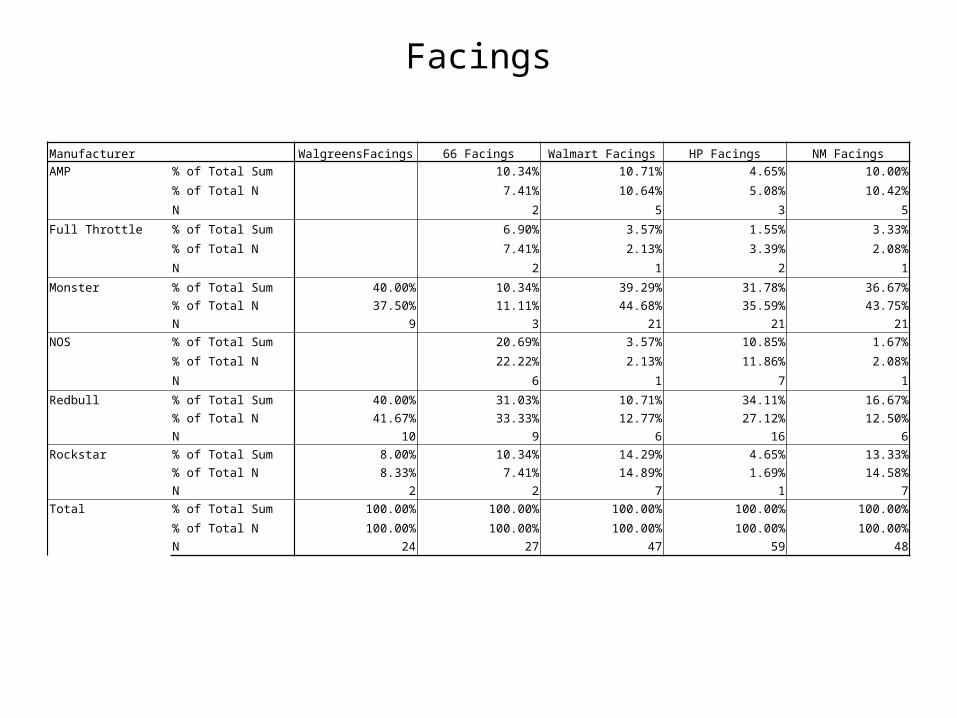
Facings
Manufacturer WalgreensFacings 66 Facings Walmart Facings HP Facings NM FacingsAMP % of Total Sum 10.34% 10.71% 4.65% 10.00%
% of Total N 7.41% 10.64% 5.08% 10.42%
N 2 5 3 5
Full Throttle % of Total Sum 6.90% 3.57% 1.55% 3.33%
% of Total N 7.41% 2.13% 3.39% 2.08%
N 2 1 2 1
Monster % of Total Sum 40.00% 10.34% 39.29% 31.78% 36.67%
% of Total N 37.50% 11.11% 44.68% 35.59% 43.75%
N 9 3 21 21 21
NOS % of Total Sum 20.69% 3.57% 10.85% 1.67%
% of Total N 22.22% 2.13% 11.86% 2.08%
N 6 1 7 1
Redbull % of Total Sum 40.00% 31.03% 10.71% 34.11% 16.67%
% of Total N 41.67% 33.33% 12.77% 27.12% 12.50%
N 10 9 6 16 6
Rockstar % of Total Sum 8.00% 10.34% 14.29% 4.65% 13.33%
% of Total N 8.33% 7.41% 14.89% 1.69% 14.58%
N 2 2 7 1 7
Total % of Total Sum 100.00% 100.00% 100.00% 100.00% 100.00%
% of Total N 100.00% 100.00% 100.00% 100.00% 100.00%
N 24 27 47 59 48
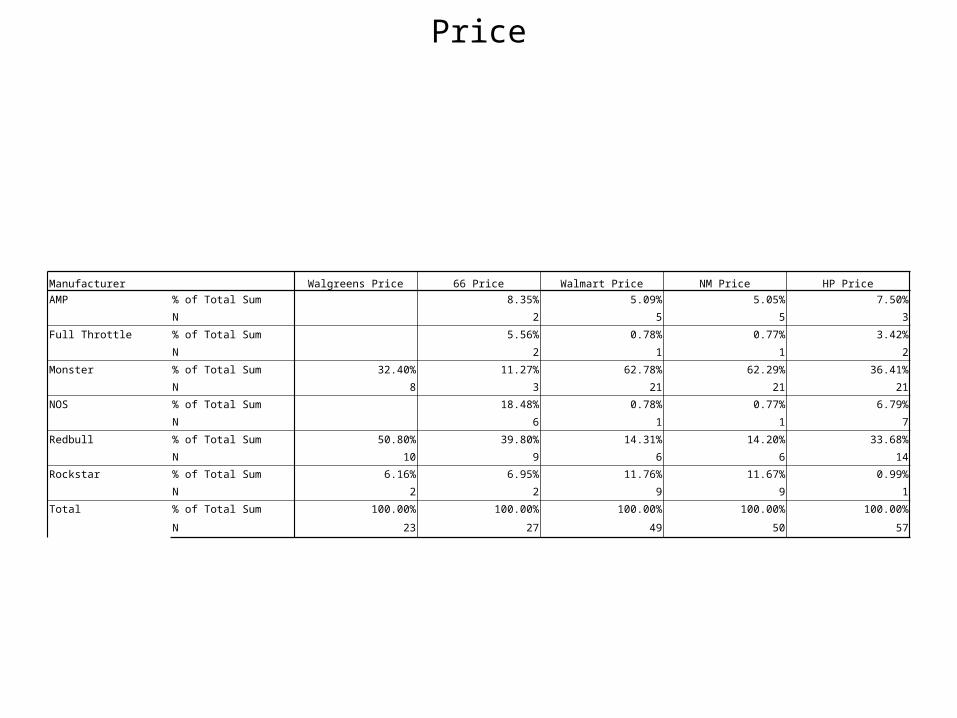
Price
Manufacturer Walgreens Price 66 Price Walmart Price NM Price HP PriceAMP % of Total Sum 8.35% 5.09% 5.05% 7.50%
N 2 5 5 3
Full Throttle % of Total Sum 5.56% 0.78% 0.77% 3.42%
N 2 1 1 2
Monster % of Total Sum 32.40% 11.27% 62.78% 62.29% 36.41%
N 8 3 21 21 21
NOS % of Total Sum 18.48% 0.78% 0.77% 6.79%
N 6 1 1 7
Redbull % of Total Sum 50.80% 39.80% 14.31% 14.20% 33.68%
N 10 9 6 6 14
Rockstar % of Total Sum 6.16% 6.95% 11.76% 11.67% 0.99%
N 2 2 9 9 1
Total % of Total Sum 100.00% 100.00% 100.00% 100.00% 100.00%
N 23 27 49 50 57
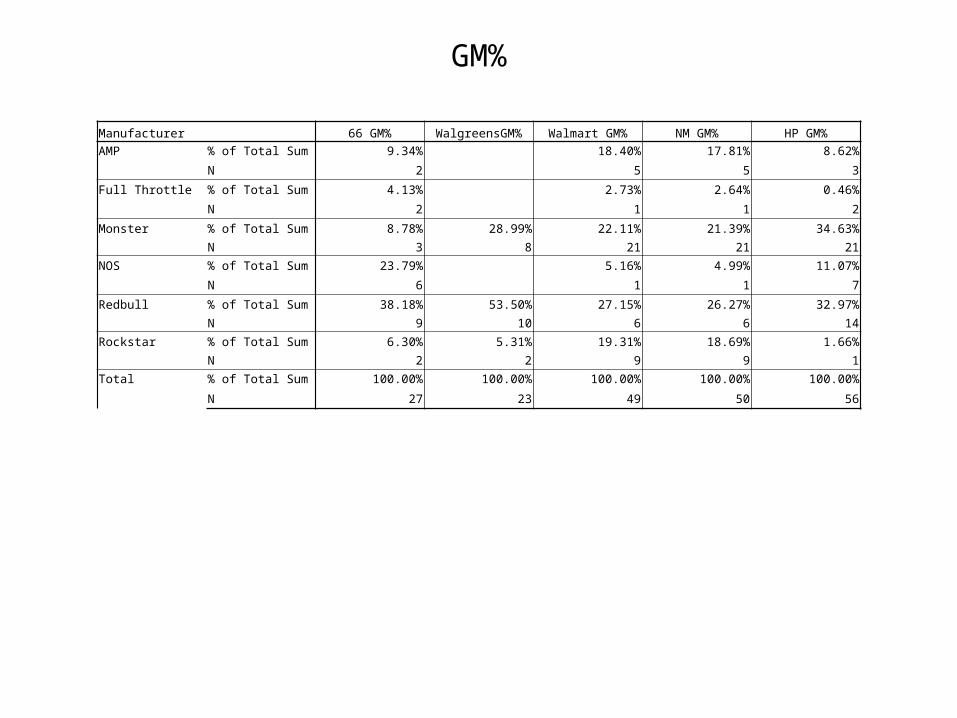
GM%
Manufacturer 66 GM% WalgreensGM% Walmart GM% NM GM% HP GM%AMP % of Total Sum 9.34% 18.40% 17.81% 8.62%
N 2 5 5 3
Full Throttle % of Total Sum 4.13% 2.73% 2.64% 0.46%
N 2 1 1 2
Monster % of Total Sum 8.78% 28.99% 22.11% 21.39% 34.63%
N 3 8 21 21 21
NOS % of Total Sum 23.79% 5.16% 4.99% 11.07%
N 6 1 1 7
Redbull % of Total Sum 38.18% 53.50% 27.15% 26.27% 32.97%
N 9 10 6 6 14
Rockstar % of Total Sum 6.30% 5.31% 19.31% 18.69% 1.66%
N 2 2 9 9 1
Total % of Total Sum 100.00% 100.00% 100.00% 100.00% 100.00%
N 27 23 49 50 56

Stocking Rates
Stores
Total
Stocking1 2 3 4 5 Rates
Manufacturer AMP 0 2 1 2 0 5 15 0.600Starbucks 0 0 3 0 0 3 9 0.600Rockstar 0 7 0 1 1 9 23 0.511Monster 9 12 9 1 2 33 74 0.448NOS 1 5 0 1 0 7 15 0.429Redbull 8 6 5 0 2 21 45 0.429Full Throttle
2 0 0 1 0 36 0.400
SLAP 0 3 0 0 0 3 6 0.400V8 0 2 0 0 0 2 4 0.400Sambazon 1 1 0 0 0 2 3 0.300AZ Energy 1 0 0 0 0 1 1 0.200illy 2 0 0 0 0 2 2 0.200Venom 3 0 0 0 0 3 3 0.200
Total 27 38 18 6 5 94
Private Label Success
• Absent Private Label• National Brand Dominance• New Category• Target

Use Of Space
Neighborhood Market Harp’s Weddington