Embed Size (px)
Citation preview
Energy conservation potential of the nitrogen fertiliser industry
P. Lako
ECN-E--09-011 March 2009

2 ECN-E--09-011
Acknowledgement This study presents an analysis of the potential for energy conservation the ‘resource-intensive’ Nitrogen (N) fertiliser industry. The author wishes to express his gratitude for comments and additional information provided by Mr. R. Coster of VKP (Vereniging van Kunstmest Producenten), Mr. J. van Damme of Yara (Sluiskil), Mr. H. Duisters of DSM Agro (Geleen), and Mr. W. Wetzels (ECN Policy Studies). The contents of the study, however, remain the responsibility of the author. The project is registered at ECN under project number 7.7731. Abstract This study mainly focuses on the energy efficiency potential of the N fertiliser industry (ammonia and urea production, etc), with special attention for the Netherlands. The time horizon is 2020. First, the potential for energy efficiency improvement in the industry in general is discussed. Then, the Dutch N fertiliser industry is analysed in that respect. In order to put the results in perspective, the efficiency potentials are compared with an ‘ICARUS-4’ study from 2000. This results in a view of energy efficiency and capacity increase realised and remaining options for efficiency improvement in plants belonging to the Dutch N fertiliser industry.
ECN-E--09-011 3
Contents
List of tables 4 List of figures 4 Summary 5 1. Introduction 7 2. Cross-cutting technologies for industrial energy conservation 9
2.1 Introduction 9 2.2 U.S. petrochemical industry 11
2.2.1 Current separation processes 11 2.2.2 Medium-term conservation potential 11
2.3 U.S. chemical industry 12 2.3.1 Low-energy separation potential USA 13
3. Energy conservation potential in the Dutch N fertiliser industry 17 3.1 Introduction 17 3.2 Ammonia 17 3.3 Nitric Acid 25 3.4 Urea 28 3.5 N fertiliser industry in general 30 3.6 Roundup and comparison to efficiency potential of ICARUS-4 31
4. Conclusions and recommendations 35 Acronyms and abbreviations 37 References 38 Internet sources 42 Appendix A Energy conservation potential of the U.S. chemical industry 43
4 ECN-E--09-011
List of tables
Table 2.1 Industrial mass transfer separation processses 9 Table 2.2 Industrial applications with potential for alternative low-energy separation
technologies 10 Table 2.3 Potential of low-energy separation in the U.S. petroleum refining industry 2001 12 Table 2.4 Potential of low-energy separation in the U.S. chemical industry 2001 13 Table 3.1 Global production and production capacity of Ammonia (2002-2003) 17 Table 3.2 World nitrogen fertiliser supply and demand balance 2005/06 through 2009/10 19 Table 3.3 World Ammonia production capacity and balance 2005-2011 19 Table 3.4 Net efficiency (estimate) of Ammonia plants in the Netherlands (2005) 21 Table 3.5 Energy use of state-of-the-art Ammonia plants with credit for steam or utilities 22 Table 3.6 Potential energy saved by reduced separation energy for three Ammonia plants 23 Table 3.7 Investment cost of Ammonia(Urea) plants for a range of plant capacities 23 Table 3.8 Global production and production capacity of Urea (2002) 29 Table 3.9 Energy efficiency Ammonia and Urea plants in Europe c.q. Netherlands 2002 29 Table 3.10 Total energy requirement for Ammonia & Urea in the Netherlands (2002/2005) 30 Table 3.11 Energy efficiency potential Ammonia and Urea production in the Netherlands 31 Table 3.12 Energy conservation with regard to electricity in the Dutch fertiliser industry 33 Table 3.13 Energy conservation with regard to Ammonia production in the Netherlands 33 Table A.1 Energy & exergy analysis of 25 chemical technologies U.S. chemical industry 44 Table A.2 Production (2002), energy use & conservation potential U.S. chemical industry 45
List of figures
Figure S.1 Production capacity of Ammonia plants in the Netherlands 5 Figure S.2 Energy requirement of BAT Ammonia plants 1968-2005 6 Figure 3.1 Ammonia production in different world regions, 2003-2006 18 Figure 3.2 World nitrogen fertiliser nutrient consumption, in crop years [Mt NH3-N] 18 Figure 3.3 Worldwide Ammonia production capacity 19 Figure 3.4 Forecast of fertiliser demand in the EU-25, 2005-2015 20 Figure 3.5 Production and production capacity of Ammonia plants in the Netherlands 20 Figure 3.6 Net energy efficiency of 66 Ammonia plants cf. benchmark of PSI [GJ/t NH3] 21 Figure 3.7 Energy requirement of BAT Ammonia plants 1968-2005 24 Figure 3.8 Industrial gas prices ($/GJ) in various countries and world regions 25 Figure 3.9 Monthly prices of Ammonia ($/ton, Gulf) and of natural gas ($/MBtu) in the
USA 25 Figure 3.10 Flow diagram of Nitric Acid and Ammonium Nitrate production 26 Figure 3.11 Applications of Nitric Acid 26 Figure 3.12 Net energy export of Nitric Acid plants [GJ/t HNO3-N] 27 Figure 3.13 Production of Ammonia plants in the Netherlands [1000 t NH3/year] 32
ECN-E--09-011 5
Summary
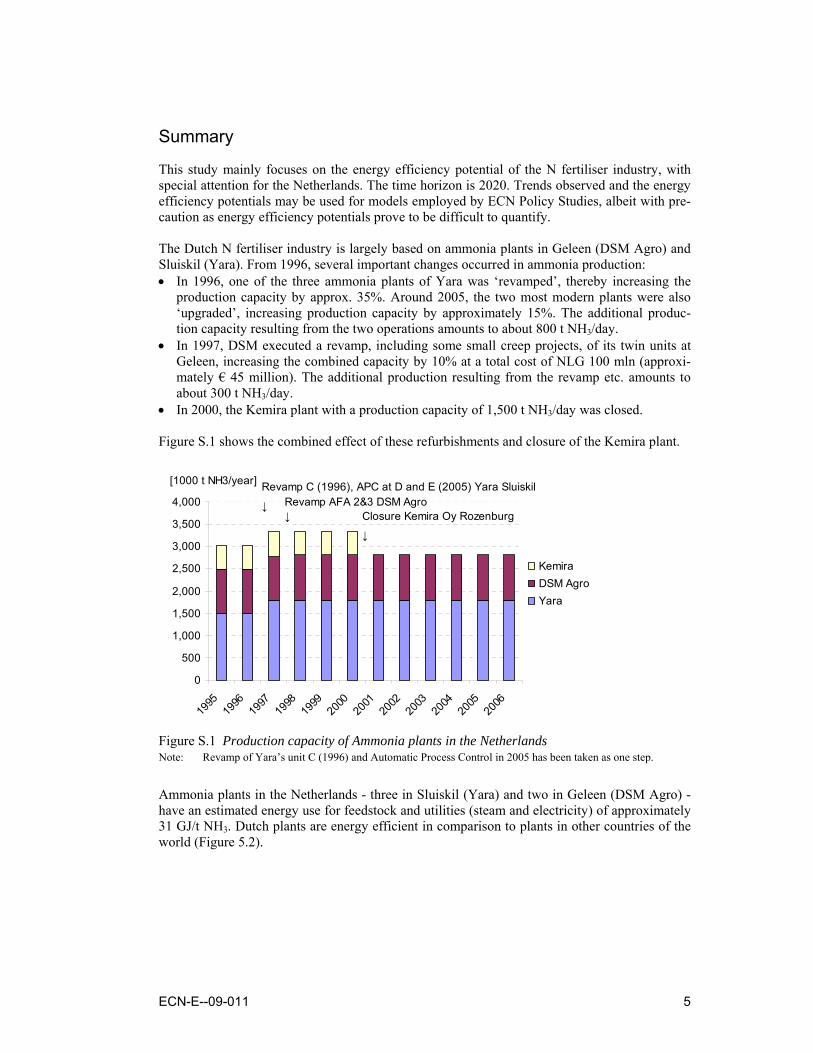
This study mainly focuses on the energy efficiency potential of the N fertiliser industry, with special attention for the Netherlands. The time horizon is 2020. Trends observed and the energy efficiency potentials may be used for models employed by ECN Policy Studies, albeit with pre-caution as energy efficiency potentials prove to be difficult to quantify. The Dutch N fertiliser industry is largely based on ammonia plants in Geleen (DSM Agro) and Sluiskil (Yara). From 1996, several important changes occurred in ammonia production: • In 1996, one of the three ammonia plants of Yara was ‘revamped’, thereby increasing the
production capacity by approx. 35%. Around 2005, the two most modern plants were also ‘upgraded’, increasing production capacity by approximately 15%. The additional produc-tion capacity resulting from the two operations amounts to about 800 t NH3/day.
• In 1997, DSM executed a revamp, including some small creep projects, of its twin units at Geleen, increasing the combined capacity by 10% at a total cost of NLG 100 mln (approxi-mately € 45 million). The additional production resulting from the revamp etc. amounts to about 300 t NH3/day.
• In 2000, the Kemira plant with a production capacity of 1,500 t NH3/day was closed. Figure S.1 shows the combined effect of these refurbishments and closure of the Kemira plant.
0
500
1,000
1,500
2,000
2,500
3,000
3,500
4,000
1995
1996
1997
1998
1999
2000
2001
2002
2003
2004
2005
2006
KemiraDSM AgroYara
[1000 t NH3/year]
Revamp AFA 2&3 DSM Agro↓
↓
Closure Kemira Oy Rozenburg
Revamp C (1996), APC at D and E (2005) Yara Sluiskil
↓
Figure S.1 Production capacity of Ammonia plants in the Netherlands Note: Revamp of Yara’s unit C (1996) and Automatic Process Control in 2005 has been taken as one step.
Ammonia plants in the Netherlands - three in Sluiskil (Yara) and two in Geleen (DSM Agro) - have an estimated energy use for feedstock and utilities (steam and electricity) of approximately 31 GJ/t NH3. Dutch plants are energy efficient in comparison to plants in other countries of the world (Figure 5.2).
6 ECN-E--09-011
0
5
10
15
20
25
30
35
40
45
1960 1970 1980 1990 2000 2010
[GJ/t NH3]
↓
Typical Russian Ammonia plant 2000
¤
Typical EFMA plant 2000
↓
¤
Average EU plant 1998
¤
↑
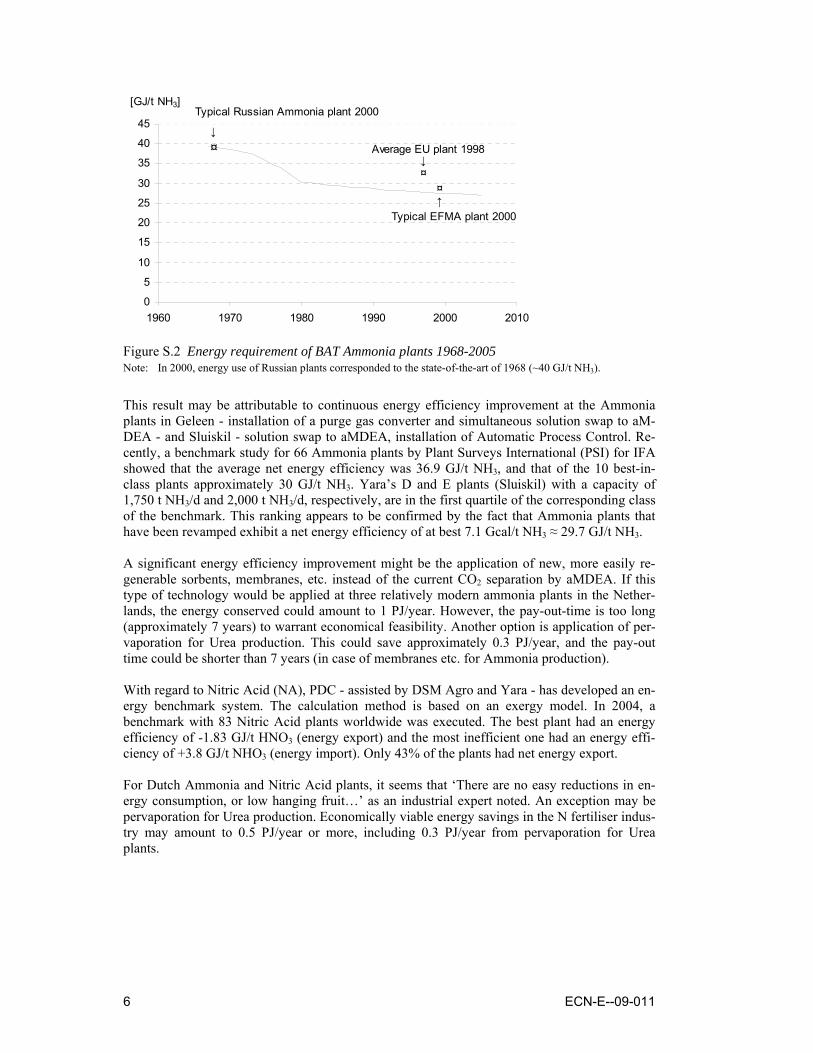
Figure S.2 Energy requirement of BAT Ammonia plants 1968-2005 Note: In 2000, energy use of Russian plants corresponded to the state-of-the-art of 1968 (~40 GJ/t NH3).
This result may be attributable to continuous energy efficiency improvement at the Ammonia plants in Geleen - installation of a purge gas converter and simultaneous solution swap to aM-DEA - and Sluiskil - solution swap to aMDEA, installation of Automatic Process Control. Re-cently, a benchmark study for 66 Ammonia plants by Plant Surveys International (PSI) for IFA showed that the average net energy efficiency was 36.9 GJ/t NH3, and that of the 10 best-in-class plants approximately 30 GJ/t NH3. Yara’s D and E plants (Sluiskil) with a capacity of 1,750 t NH3/d and 2,000 t NH3/d, respectively, are in the first quartile of the corresponding class of the benchmark. This ranking appears to be confirmed by the fact that Ammonia plants that have been revamped exhibit a net energy efficiency of at best 7.1 Gcal/t NH3 ≈ 29.7 GJ/t NH3. A significant energy efficiency improvement might be the application of new, more easily re-generable sorbents, membranes, etc. instead of the current CO2 separation by aMDEA. If this type of technology would be applied at three relatively modern ammonia plants in the Nether-lands, the energy conserved could amount to 1 PJ/year. However, the pay-out-time is too long (approximately 7 years) to warrant economical feasibility. Another option is application of per-vaporation for Urea production. This could save approximately 0.3 PJ/year, and the pay-out time could be shorter than 7 years (in case of membranes etc. for Ammonia production). With regard to Nitric Acid (NA), PDC - assisted by DSM Agro and Yara - has developed an en-ergy benchmark system. The calculation method is based on an exergy model. In 2004, a benchmark with 83 Nitric Acid plants worldwide was executed. The best plant had an energy efficiency of -1.83 GJ/t HNO3 (energy export) and the most inefficient one had an energy effi-ciency of +3.8 GJ/t NHO3 (energy import). Only 43% of the plants had net energy export. For Dutch Ammonia and Nitric Acid plants, it seems that ‘There are no easy reductions in en-ergy consumption, or low hanging fruit…’ as an industrial expert noted. An exception may be pervaporation for Urea production. Economically viable energy savings in the N fertiliser indus-try may amount to 0.5 PJ/year or more, including 0.3 PJ/year from pervaporation for Urea plants.
ECN-E--09-011 7
1. Introduction
This study may provide a background on energy efficiency improvement in the Nitrogen (N) fertiliser industry. In 2001, the Utrecht Centre for Energy Research (UCE) published an in-depth study of the energy conservation potential of the Dutch industry in order to update their so-called ICARUS-4 database. That study was financed by the Ministry of Economic Affairs and the Ministry of Housing, Spatial Planning and Environment in the Netherlands. An ‘re-source-intensive’ industrial (sub-)sectors covered by the study of UCE, notably the N fertiliser industry (Nieuwlaar, 2001) is revisited in the present study. For the development of medium-term (2020) scenario studies of the energy system of the Neth-erlands, ECN Policy Studies makes use of a number of models including energy conservation potentials based on the ICARUS-4 study. Since the publication of the ICARUS-4 study, pro-found changes have occurred in the conditions governing the Dutch energy economy, viz.: • Introduction of carbon trading in January 2005: the European Emission Trading Scheme (EU
ETS). • A steep increase of oil and gas prices, culminating in a temporary maximum oil price of ap-
proximately $78 per barrel in 2006 and up to maximum of approx. $145 per barrel in 2008. • An increased attention for energy conservation and renewable energy - next to other options
like advanced coal and nuclear power - in order to combat climate change, reduce the de-pendence on imported oil and gas, and reduce the cost of energy for the economy.
It is beyond the scope of this study to evaluate the complete ICARUS-4 study dating from 2000. Also, the effect of the changes signalled above cannot be evaluated in the framework of the pre-sent study. First, the study focuses on two generic energy conservation studies for the U.S. in-dustry, viz. a study of the U.S. ‘Energy Efficiency and Renewable Energy’ (EERE, Department of Energy) performed in 2005 (EERE, 2005) and the so-called ‘Chemical Bandwidth Study’ of JVP International (JVP, 2004), in order to formulate some conclusions with regard to the me-dium and long-term industrial energy conservation potential, more specifically for the chemical, petrochemical, and pulp and paper industry. These studies give ample information on the poten-tial of so-called ‘cross-cutting’ energy conservation technologies. These are technologies that apply to a number of (resource-intensive) industries. One example of a cross-cutting technology is the use of membranes and other low-energy separation technologies. These technologies are in the stage of R&D or just entering the demonstration stage. Therefore, they may have an im-pact on the energy use in particular industrial sectors in the period 2008-2020. As models used for scenario studies for the Netherlands generally focus on energy conservation options on the medium term - not options that need another 10 to 15 years before deployment - the present study focuses on technologies that may enter the market between 2010 and 2015 at the latest. Also, technologies need to have a reasonable energy efficiency potential in the Dutch industry. Therefore, there are a few criteria that determine whether a technology is prospective in terms of potential and cost and whether it fits in the timeframe used in this study (2020), a timeframe in which climate policies will become more and more effective on the EU level. Chapter 2 presents an overview of the energy conservation potential offered by technologies that may be called ‘cross-cutting’ energy conservation technologies and that conform to the abovementioned criteria of broad applicability, medium-term potential, and cost-effectiveness. This Chapter addresses the applicability in sectors of the U.S. industry, as the studies referenced focus on the U.S. industry. Energy efficiency potentials for the USA cannot be applied without further investigation to the Dutch energy economy, as some (chemical) industries in the USA are much less energy-efficient than corresponding industry in the Netherlands.

8 ECN-E--09-011
Chapters 3 focuses on the energy efficiency potential in the Dutch N fertiliser industry - produc-tion of, e.g., Ammonia and Urea - and ends with an overview and discussion of the potential that is described by (Nieuwlaar, 2001). Chapter 4 presents conclusions and recommendations.
ECN-E--09-011 9
2. Cross-cutting technologies for industrial energy conservation
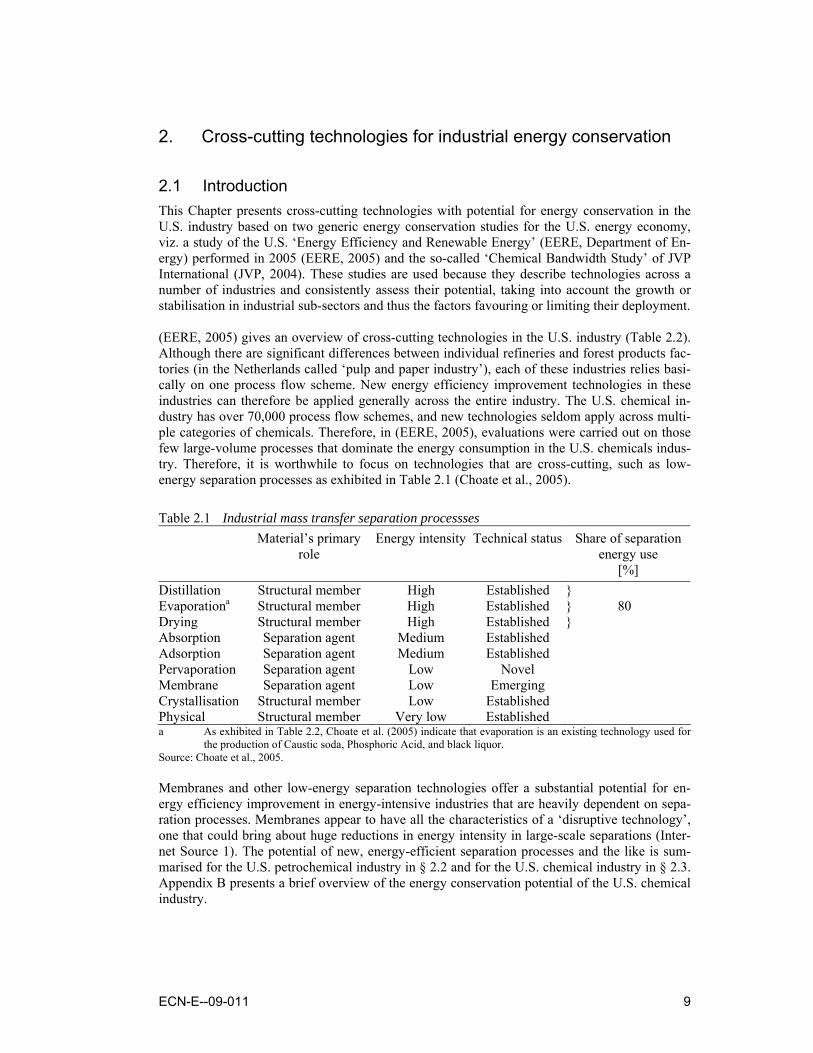
2.1 Introduction This Chapter presents cross-cutting technologies with potential for energy conservation in the U.S. industry based on two generic energy conservation studies for the U.S. energy economy, viz. a study of the U.S. ‘Energy Efficiency and Renewable Energy’ (EERE, Department of En-ergy) performed in 2005 (EERE, 2005) and the so-called ‘Chemical Bandwidth Study’ of JVP International (JVP, 2004). These studies are used because they describe technologies across a number of industries and consistently assess their potential, taking into account the growth or stabilisation in industrial sub-sectors and thus the factors favouring or limiting their deployment. (EERE, 2005) gives an overview of cross-cutting technologies in the U.S. industry (Table 2.2). Although there are significant differences between individual refineries and forest products fac-tories (in the Netherlands called ‘pulp and paper industry’), each of these industries relies basi-cally on one process flow scheme. New energy efficiency improvement technologies in these industries can therefore be applied generally across the entire industry. The U.S. chemical in-dustry has over 70,000 process flow schemes, and new technologies seldom apply across multi-ple categories of chemicals. Therefore, in (EERE, 2005), evaluations were carried out on those few large-volume processes that dominate the energy consumption in the U.S. chemicals indus-try. Therefore, it is worthwhile to focus on technologies that are cross-cutting, such as low-energy separation processes as exhibited in Table 2.1 (Choate et al., 2005).
Table 2.1 Industrial mass transfer separation processses Material’s primary
role Energy intensity Technical status Share of separation
energy use [%]
Distillation Structural member High Established } Evaporationa Structural member High Established } 80 Drying Structural member High Established } Absorption Separation agent Medium Established Adsorption Separation agent Medium Established Pervaporation Separation agent Low Novel Membrane Separation agent Low Emerging Crystallisation Structural member Low Established Physical Structural member Very low Established a As exhibited in Table 2.2, Choate et al. (2005) indicate that evaporation is an existing technology used for
the production of Caustic soda, Phosphoric Acid, and black liquor. Source: Choate et al., 2005. Membranes and other low-energy separation technologies offer a substantial potential for en-ergy efficiency improvement in energy-intensive industries that are heavily dependent on sepa-ration processes. Membranes appear to have all the characteristics of a ‘disruptive technology’, one that could bring about huge reductions in energy intensity in large-scale separations (Inter-net Source 1). The potential of new, energy-efficient separation processes and the like is sum-marised for the U.S. petrochemical industry in § 2.2 and for the U.S. chemical industry in § 2.3. Appendix B presents a brief overview of the energy conservation potential of the U.S. chemical industry.
10 ECN-E--09-011
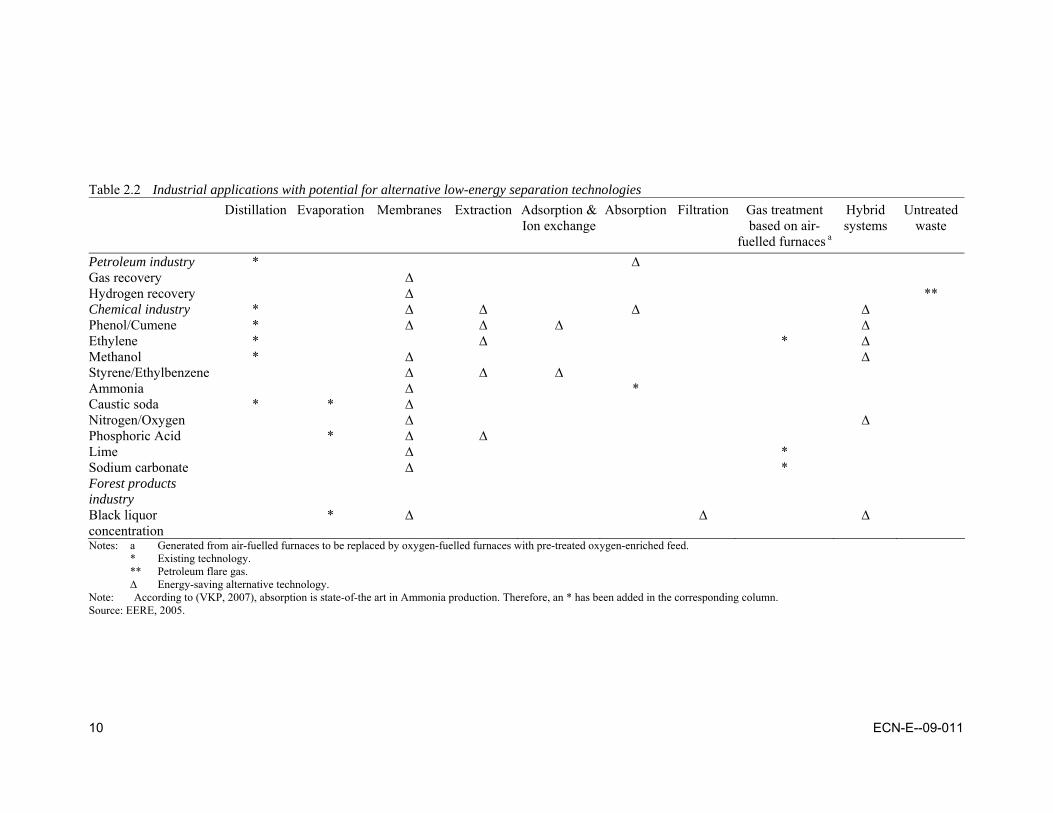
Table 2.2 Industrial applications with potential for alternative low-energy separation technologies Distillation Evaporation Membranes Extraction Adsorption &
Ion exchangeAbsorption Filtration Gas treatment
based on air-fuelled furnaces a
Hybrid systems
Untreated waste
Petroleum industry * ∆ Gas recovery ∆ Hydrogen recovery ∆ ** Chemical industry * ∆ ∆ ∆ ∆ Phenol/Cumene * ∆ ∆ ∆ ∆ Ethylene * ∆ * ∆ Methanol * ∆ ∆ Styrene/Ethylbenzene ∆ ∆ ∆ Ammonia ∆ * Caustic soda * * ∆ Nitrogen/Oxygen ∆ ∆ Phosphoric Acid * ∆ ∆ Lime ∆ * Sodium carbonate ∆ * Forest products industry
Black liquor concentration
* ∆ ∆ ∆
Notes: a Generated from air-fuelled furnaces to be replaced by oxygen-fuelled furnaces with pre-treated oxygen-enriched feed. * Existing technology. ** Petroleum flare gas. ∆ Energy-saving alternative technology. Note: According to (VKP, 2007), absorption is state-of-the art in Ammonia production. Therefore, an * has been added in the corresponding column. Source: EERE, 2005.
ECN-E--09-011 11
2.2 U.S. petrochemical industry
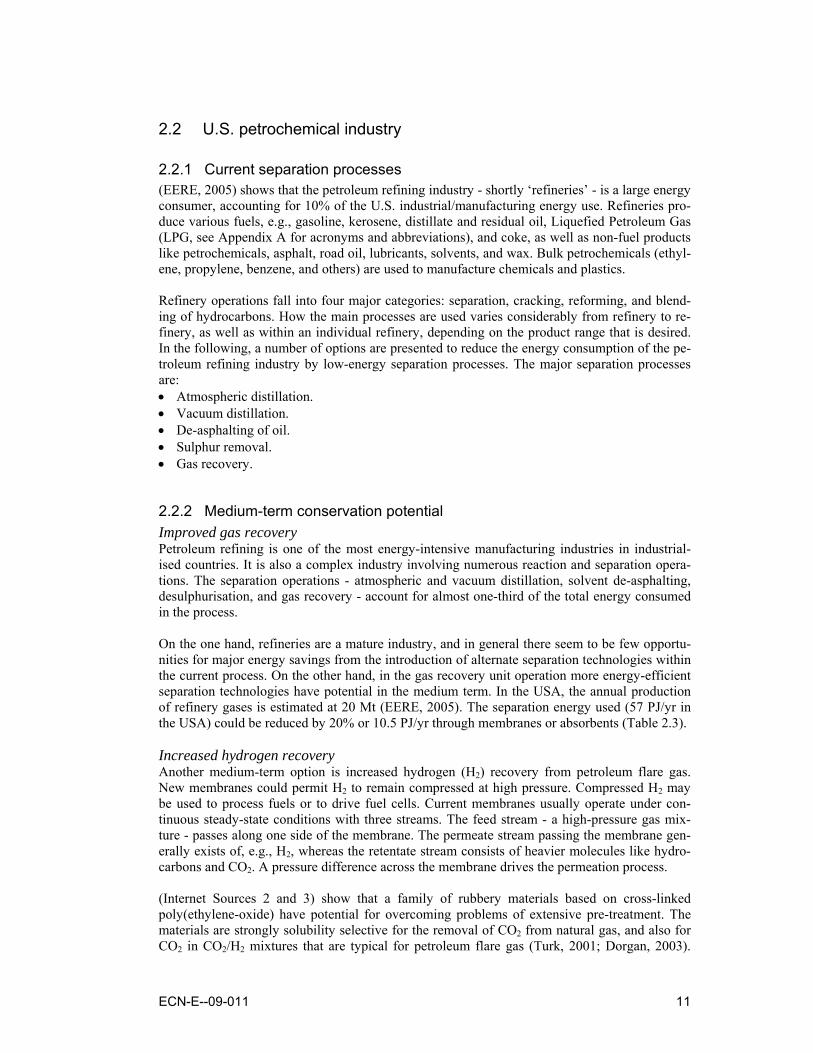
2.2.1 Current separation processes (EERE, 2005) shows that the petroleum refining industry - shortly ‘refineries’ - is a large energy consumer, accounting for 10% of the U.S. industrial/manufacturing energy use. Refineries pro-duce various fuels, e.g., gasoline, kerosene, distillate and residual oil, Liquefied Petroleum Gas (LPG, see Appendix A for acronyms and abbreviations), and coke, as well as non-fuel products like petrochemicals, asphalt, road oil, lubricants, solvents, and wax. Bulk petrochemicals (ethyl-ene, propylene, benzene, and others) are used to manufacture chemicals and plastics. Refinery operations fall into four major categories: separation, cracking, reforming, and blend-ing of hydrocarbons. How the main processes are used varies considerably from refinery to re-finery, as well as within an individual refinery, depending on the product range that is desired. In the following, a number of options are presented to reduce the energy consumption of the pe-troleum refining industry by low-energy separation processes. The major separation processes are: • Atmospheric distillation. • Vacuum distillation. • De-asphalting of oil. • Sulphur removal. • Gas recovery.
2.2.2 Medium-term conservation potential Improved gas recovery Petroleum refining is one of the most energy-intensive manufacturing industries in industrial-ised countries. It is also a complex industry involving numerous reaction and separation opera-tions. The separation operations - atmospheric and vacuum distillation, solvent de-asphalting, desulphurisation, and gas recovery - account for almost one-third of the total energy consumed in the process. On the one hand, refineries are a mature industry, and in general there seem to be few opportu-nities for major energy savings from the introduction of alternate separation technologies within the current process. On the other hand, in the gas recovery unit operation more energy-efficient separation technologies have potential in the medium term. In the USA, the annual production of refinery gases is estimated at 20 Mt (EERE, 2005). The separation energy used (57 PJ/yr in the USA) could be reduced by 20% or 10.5 PJ/yr through membranes or absorbents (Table 2.3). Increased hydrogen recovery Another medium-term option is increased hydrogen (H2) recovery from petroleum flare gas. New membranes could permit H2 to remain compressed at high pressure. Compressed H2 may be used to process fuels or to drive fuel cells. Current membranes usually operate under con-tinuous steady-state conditions with three streams. The feed stream - a high-pressure gas mix-ture - passes along one side of the membrane. The permeate stream passing the membrane gen-erally exists of, e.g., H2, whereas the retentate stream consists of heavier molecules like hydro-carbons and CO2. A pressure difference across the membrane drives the permeation process. (Internet Sources 2 and 3) show that a family of rubbery materials based on cross-linked poly(ethylene-oxide) have potential for overcoming problems of extensive pre-treatment. The materials are strongly solubility selective for the removal of CO2 from natural gas, and also for CO2 in CO2/H2 mixtures that are typical for petroleum flare gas (Turk, 2001; Dorgan, 2003).
12 ECN-E--09-011
Membranes could become available that could separate H2 and CO2 better than previous mem-branes as they are much more permeable to H2 than to CO2. Membrane developers estimate that dedicated membranes could save 3 PJ/yr of H2 from petroleum flare gas in the USA (Table 2.3).
Table 2.3 Potential of low-energy separation in the U.S. petroleum refining industry 2001 Process Annual
production Final energy
(process energy) a
Separation energy
Energy savings potential [PJ/yr]
[Mt/yr] [PJ/yr] [PJ/yr] Medium term Long term Atmospheric/vacuum distillations 888 749 749 150 Cracking, reforming, LubeOil, Asphalt and Viscosity Breaking
1,006 733 733 10.5 145
Gas recovery 20 57 57 11.5 Hydrogen recovery 3 Subtotal b 1,914 1,539 1,539 25 295 Total (medium term + long term) 320 Percent studied (EERE, 2005) c 94% 49% 100% a In (EERE, 2005) final energy is denoted as ‘process energy’, a term not commonly used for final energy. b The medium-term potential pertains to de-asphalting of oil, gas recovery, and hydrogen recovery. c Processes covered by the industry analysis are represented by the row Subtotal. In case of the refineries, the frac-
tion analysed represents 94% of the annual production (by weight) and 49% of the process energy. Source: EERE, 2005. De-asphalting of oil A third medium-term option is the use of hybrid systems of pervaporation - membrane-distillation hybrid system - or distillation-adsorption hybrid processes1 for de-asphalting of oil. The potential energy saving is high. Such hybrid systems, when applied in U.S. refineries, could reduce the separation energy for de-asphalting of oil by 33%, from 32 PJ/yr to about 10.5 PJ/yr. Medium-term conservation potential (until 2020) seems to be available in gas recovery, hydro-gen recovery, and de-asphalting of oil. In addition, in the long term (>2020), membranes could potentially save approximately 20% of the energy currently used in distillation separation, viz. for: • Atmospheric and vacuum distillations (749 PJ/yr). • Cracking, reforming, LubeOil, Asphalt and Viscosity Breaking (733 PJ/yr). For the USA, the additional long-term potential of low-energy separation processes in refineries would amount to 20% of approximately 1,480 PJ/yr, or 295 PJ/yr (Table 2.3). The total me-dium- and long-term potential amounts to 320 PJ/yr, or about 20% of the separation energy.
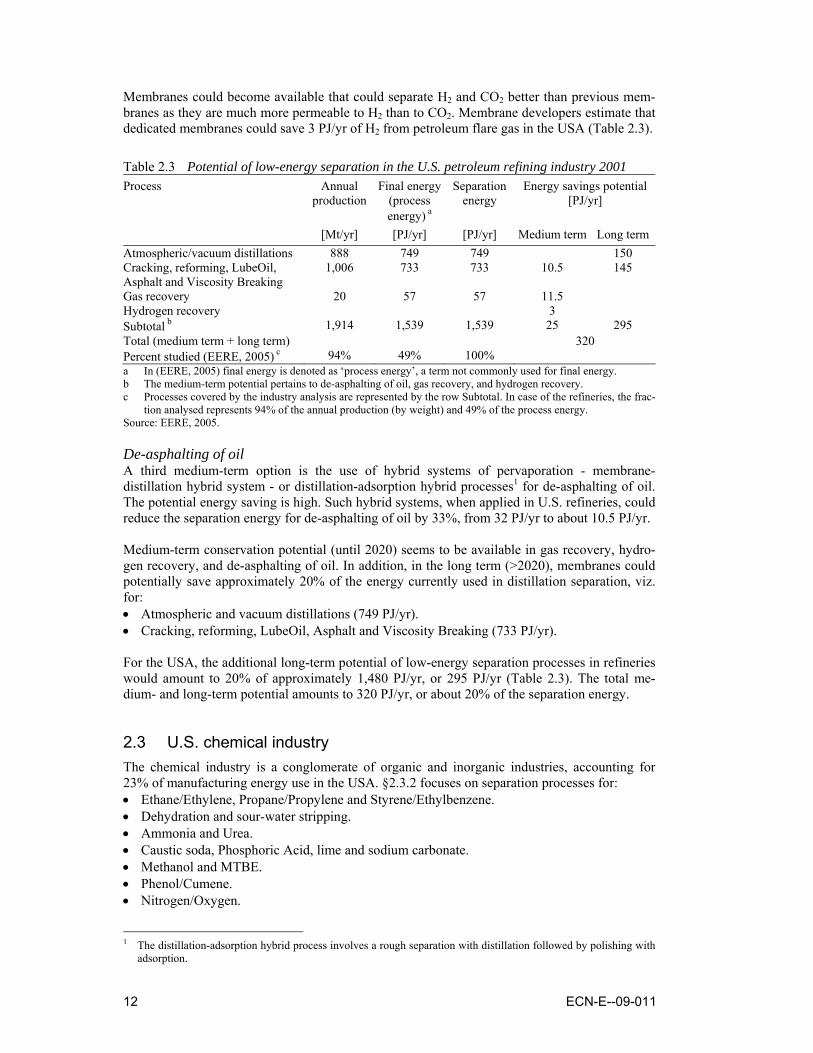
2.3 U.S. chemical industry The chemical industry is a conglomerate of organic and inorganic industries, accounting for 23% of manufacturing energy use in the USA. §2.3.2 focuses on separation processes for: • Ethane/Ethylene, Propane/Propylene and Styrene/Ethylbenzene. • Dehydration and sour-water stripping. • Ammonia and Urea. • Caustic soda, Phosphoric Acid, lime and sodium carbonate. • Methanol and MTBE. • Phenol/Cumene. • Nitrogen/Oxygen.
1 The distillation-adsorption hybrid process involves a rough separation with distillation followed by polishing with
adsorption.
ECN-E--09-011 13
2.3.1 Low-energy separation potential USA Summary Table 2.4 shows the low-energy separation potential of the chemical industry (EERE, 2005). The medium-term potential is 175 PJ/yr, or about 20% of the separation energy. The total poten-tial is approximately 250 PJ/yr, which is of the same order of magnitude as for refining (§ 2.2).
Table 2.4 Potential of low-energy separation in the U.S. chemical industry 2001 Process Annual
production Final energy
(process energy) a
Separation energy
Energy efficiency potential
[PJ/yr] [Mt/yr] [PJ/yr] [PJ/yr] Medium term Long term Ethylene/Methane etc. 23.6 528 127 58 (Ethylene/Ethane) b (N/A) (N/A) (19) (6) Propane/Propylene c N/A N/A 41 14 Styrene/Ethylbenzene 5.0 211 42 12 Natural gas Dehydration c N/A N/A 38 13 Inorganic Acid Dehydration c N/A N/A 16 5 Acetic Acid Dehydration c N/A N/A 9 3 Sour-water stripping c N/A N/A 19 6 Ammonia 13.2 211 53 16 66 Urea b 7.2 N/A 6 2 Caustic soda 11.3 422 211 4 Phosphoric Acid 10.9 211 53 6 Lime 18.6 106 1 0 3 Sodium carbonate 10.4 95 21 0 1 Methanol 3.2 53 11 2 1 MTBE c N/A N/A 6 2 Phenol/Cumene 2.3 53 32 9 Nitrogen/Oxygen 30.8 50 50 24 Subtotal c 129 1,938 600 (755) c ~ 130 (175) c ~70 Total (medium term + long term) 1,090 3,185 1,275 ~ 200 (245) Percent studied in (EERE, 2005)d 12% 61% 47% (59%) c a In (EERE, 2005) final energy is denoted as ‘process energy’, a term not commonly used for final energy. b Pervaporation for ethane/ethylene separation saves much less energy than the process on top of the list. c The separation options in italics have not been analysed in depth in (EERE, 2005). d The fraction studied in (EERE, 2005) is 12% of the production by weight, 61% of the process energy, and 47%
of the separation energy. Including the separation options in italics increases the percentage from 47% to 59%. Sources: EERE, 2005; USGS, 2004. Ethane/Ethylene, Propane/Propylene and Styrene/Ethylbenzene The primary separation technology used in ethylene production is cryogenic distillation. The separation consumes only 22% of the total energy input to the system. Of this amount of energy, virtually all is consumed in running the compressor that provides refrigeration for the cooler and the cryogenic distillation. About 27% of the total energy input is consumed in reaction opera-tions and another 22% in the heat of reaction. The remaining 29% is consumed in the conver-sion of energy to other forms. This conversion involves first the production of steam which is used to provide heat to several of the process steps, but a major fraction is consumed in the gen-eration of mechanical work which in turn is used to provide refrigeration for the condenser and the cryogenic distillation column. Use of membranes for methane (CH4) separation and the application of liquid extraction, mem-brane, or adsorbents to reduce or eliminate the cryogenic distillation operation are estimated to have the potential to save 58 PJ/yr in the USA. Alternatively, the use of pervaporation -membrane-distillation hybrid system - in the separation of ethane would have a potential of sav-
14 ECN-E--09-011
ing 6 PJ/yr. Also, in the U.S. chemicals industry, an energy efficiency improvement could be achieved of 33% or 14 PJ/yr in case of separation of propane and propylene by pervaporation. Like crude oil refining, styrene/ethylbenzene production contains numerous distillation opera-tions. Nearly 60% of the total energy input is consumed in reaction operations and 20% in sepa-ration operations. Distillation currently accounts for more than 90% of the energy used in the separation process. Liquid/liquid extraction utilising high-selectivity extractants could poten-tially be developed for use instead of the benzene and ethylbenzene recycle columns. Membrane separation technology could also be used in the final purification step for styrene. It is estimated that a potential saving of 30% could be achieved in each of these operations resulting in the U.S. chemical industry in a net saving of about 12 PJ/yr. Dehydration and sour water stripping Pervaporation - membrane-distillation hybrid systems - could be developed and applied for de-hydration of natural gas, inorganic acid, and acetic acid, with potential savings of 13 PJ/yr, 5 PJ/yr, and 3 PJ/yr, respectively (based on an assumed energy saving of 33%). Also, pervapora-tion could be applied to sour-water stripping, incurring an energy saving of 6 PJ/yr in the USA. Ammonia and Urea Natural gas is the most common feedstock in Ammonia production via steam reforming (JVP, 2004). The synthesis CO2 gas separator is the largest source of exergy losses (hot exit CO2 stream, exchanger cooling of MEA). The next largest source of energy loss is ammonia synthe-sis, occurring in the high-pressure syngas compressor, syngas reactor, and cooling and refrigera-tion units. Much of the low-quality energy is due to low temperature levels. In preheating and reforming, large internal exergy losses occur in the secondary reformer and waste heat boiler downstream of the reformer. These losses occur due to large temperature gradient-driven heat transfer operations. Considerable waste heat recovery is already used. There is little incentive for R&D as the market for ammonia is not growing very fast and producers are under severe economic pressure. A fair amount of energy recovery is already practised in the global ammonia and urea industry. Improved CO2 removal is one potential area for reducing energy losses. The conventional steam reforming process involves a single separation operation, i.e. the re-moval of CO2 produced from the use of natural gas feed to the reformer as a source of hydro-gen. The single step consumes 25% of the total energy input to the process. Currently, CO2 re-moval is accomplished using aqueous amine solutions (e.g., Activated Methyl Di-Ethanolamine, aMDEA2) or physical solvents like glycol di-methyl-ethers (Selexol). New, more easily regen-erable sorbents, membranes, or ionic liquids could potentially save 30% of the separation en-ergy. The energy efficiency potential of the U.S. fertiliser industry is estimated at 16 PJ/yr3. This is very ambitious, but an energy efficiency potential of this order of magnitude might be available in U.S. Ammonia plants that are less efficient than European plants (VKP, 2007). Following bulk CO2 removal, traces of CO and CO2 are catalytically reacted with H2 to avoid poisoning the ammonia synthesis catalyst. There is significant potential for improvement by: • Development of a highly efficient means to produce H2 as feed to the process. • Development of an ammonia synthesis catalyst that would be resistant to poisoning by CO2,
thus eliminating the CO2 removal unit and methanation operations entirely. For the USA, this would save 66 PJ/yr. It involves a saving in process energy in addition to separation en-ergy use. However, the CO2 removal section has developed into a very efficient process step, using energy-efficient aMDEA solvent or physical absorbents. Furthermore often pure CO2 is needed for other uses like Urea production (VKP, 2007), thereby making it also necessary to have a CO2 removal step in the ammonia plant This option is deemed to be ‘long-term’,
2 The MEA (Mono EthanolAmine) process is characterised by relatively high energy consumption for regeneration.
Therefore, the MEA process is not regarded as a BAT (Best Available Technique) process (EFMA, 2000a). 3 Alternatively, pervaporation could be used to save a much lower amount of energy, viz. 2 PJ/yr in the USA.
ECN-E--09-011 15
viz. beyond 2020. Besides the medium- and long-term energy savings achievable in Ammonia production, per-vaporation is estimated to save 33% of the separation energy, or 2 PJ/yr in Urea production. Caustic soda Caustic soda production contains numerous separation operations including electrolysis, evapo-ration, and settling. In total these operations comprise over 40% of the energy input to the plant. The production of steam and electricity accounts for another 35% and the heat of reaction con-sumes nearly 18%. In the separation operations the multiple-effect evaporator associated with re-crystallisation and recycling of NaCl consumes over 18% of the energy feed to the plant and the final evaporator consumes 6%. The final evaporation step may lend itself to the application of membranes or crystallisation to pre-concentrate the NaOH solution prior to final vaporisation resulting in potential savings in the U.S. chemical industry of the order of 4 PJ/yr (2%). Phosphoric Acid More than 60% of the total energy input to the Phosphoric Acid production using the dehydrate process is consumed in the grinding of the phosphate containing rock. Just over 30% of the en-ergy is used in separation. This is split roughly into one-third filter operations to remove the in-soluble gypsum and two-thirds to concentrate the phosphoric acid by steam-driven water evapo-ration. Roughly five tons of gypsum is generated for each ton of the acid produced. Improved filter material and the development of membrane, extraction, and/or crystallisation process for pre-concentration water removal could save ~20% of energy consumed in the filtra-tion and evaporation operations, which is equivalent to 6 PJ/yr in the USA. Lime and sodium carbonate Analysis of the lime and sodium carbonate processes did not reveal significant opportunities for energy savings in the separation operations, representing 1% and 16%, respectively, of the total energy input to the processes. However, O2 enrichment of the air to the kiln was considered to reduce the mass of N2 heated and released to the stack. It is estimated that membranes to enrich the O2 by reducing the mass of N2 by 50% could save 170 kJ/kg of lime or about 3 PJ/yr. The savings in the sodium carbonate industry are estimated at 1 PJ/yr. However, O2 enrichment for furnaces would generate insufficient net energy savings presumed that the energy consumption for N2/O2 separation would be reduced by merely 50%. Substantially more energy-efficient N2/O2 separations (presented below at ‘nitrogen/oxygen’) would be needed for significant net energy savings in the lime industry and - to a lesser extent - the sodium carbonate industry. Therefore, this is a long-term option. Methanol Methanol is generally produced from natural gas. Two-thirds of the separation energy is used by the final distillation to remove water from the methanol. It is estimated that liquid/liquid extrac-tion or a hybrid pervaporation process could reduce this energy consumption by 25% or 2 PJ/yr (in the USA). The other major energy consumer is the reformer furnace. O2 enrichment of the air fed to the furnace will reduce the mass of N2 heated and released to the stack. Just like for O2 enrichment for furnaces in the lime and sodium carbonate industries, substantially more energy-efficient N2/O2 separations are needed for significant energy savings of 1 PJ/yr and are therefore ‘long term’. MTBE MTBE (methyl tertiary-butyl ether) is produced from methanol and isobutylene. As a gasoline additive (oxygenate), it may profit from low-energy separation processes like pervaporation
16 ECN-E--09-011
(membrane-distillation hybrid system) developed for, e.g., dehydration of natural gas, inorganic acid, Acetic Acid, etc. Application of pervaporation to the manufacture of MTBE would incur a potential energy saving of 2 PJ/yr in the U.S. chemical industry. Phenol/cumene Phenol/cumene is produced by one of two processes. The UOP gas phase reaction process is the dominant manufacturing process in the industry and is the reference technology. The separation operations associated with phenol/cumene production are almost exclusively distillation and consume over 60% of the energy fed to the plant. The application of membranes, new extrac-tants/sorbents could significantly reduce the energy consumed in the repeated vaporisation of the components as required by distillation. Estimated energy savings of 30% in each of the four largest distillation operations would incur savings of nearly 9 PJ/yr. This is a conservative esti-mate and does not include potential associated reduction in the energy consumed in the boiler to produce steam for the distillation columns (constituting ~30% of the total energy input). Nitrogen/Oxygen Separation of O2 and N2 through membranes would offer significant energy savings. The com-pressor in the cryogenic process consumes 91% of the energy fed to the process. It is estimated that the application of alternate technology such as membranes could reduce the overall energy consumption by 50%, or 24 PJ/yr. Membranes for separation of O2 and N2 appear to offer po-tential on the medium term only if O2 is needed today. In case of O2 enriched air for lime and sodium carbonate (kilns), and reformer furnaces at methanol plants, substantially more energy-efficient N2/O2 separations would be needed, which is clearly a long-term prospect.
ECN-E--09-011 17
3. Energy conservation potential in the Dutch N fertiliser industry
3.1 Introduction This chapter highlights the energy efficiency potential of the (N) fertiliser industry in the Neth-erlands, based on §2.3.1 and on additional information with regard to Ammonia production. §3.2 addresses the energy conservation potential for Ammonia, §3.3 for Nitric Acid, and §3.4 for Urea production. §3.5 is a synthesis of the preceding paragraphs for the Dutch N fertiliser industry. Finally, §3.6 gives a roundup of the energy efficiency potential in Ammonia and Urea plants and a comparison to the energy efficiency potential estimated by (Nieuwlaar, 2001).
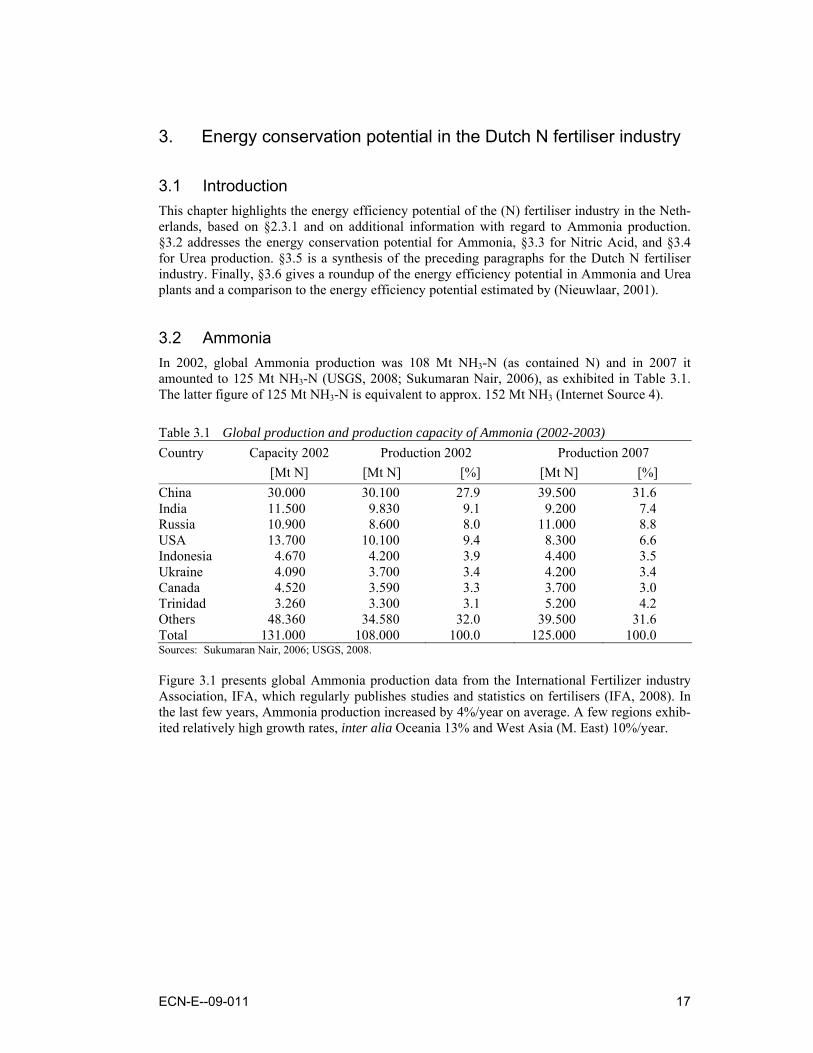
3.2 Ammonia In 2002, global Ammonia production was 108 Mt NH3-N (as contained N) and in 2007 it amounted to 125 Mt NH3-N (USGS, 2008; Sukumaran Nair, 2006), as exhibited in Table 3.1. The latter figure of 125 Mt NH3-N is equivalent to approx. 152 Mt NH3 (Internet Source 4).
Table 3.1 Global production and production capacity of Ammonia (2002-2003) Country Capacity 2002 Production 2002 Production 2007 [Mt N] [Mt N] [%] [Mt N] [%] China 30.000 30.100 27.9 39.500 31.6 India 11.500 9.830 9.1 9.200 7.4 Russia 10.900 8.600 8.0 11.000 8.8 USA 13.700 10.100 9.4 8.300 6.6 Indonesia 4.670 4.200 3.9 4.400 3.5 Ukraine 4.090 3.700 3.4 4.200 3.4 Canada 4.520 3.590 3.3 3.700 3.0 Trinidad 3.260 3.300 3.1 5.200 4.2 Others 48.360 34.580 32.0 39.500 31.6 Total 131.000 108.000 100.0 125.000 100.0 Sources: Sukumaran Nair, 2006; USGS, 2008. Figure 3.1 presents global Ammonia production data from the International Fertilizer industry Association, IFA, which regularly publishes studies and statistics on fertilisers (IFA, 2008). In the last few years, Ammonia production increased by 4%/year on average. A few regions exhib-ited relatively high growth rates, inter alia Oceania 13% and West Asia (M. East) 10%/year.
18 ECN-E--09-011
0
20,000
40,000
60,000
80,000
100,000
120,000
140,000
2003 2004 2005 2006
OceaniaAfricaCentral EuropeLatin AmericaWestern EuropeNorth AmericaE. Europe & C. AsiaWest Asia (M. East)South AsiaEast Asia
[t N]
Figure 3.1 Ammonia production in different world regions, 2003-2006 Source: IFA, 2008.
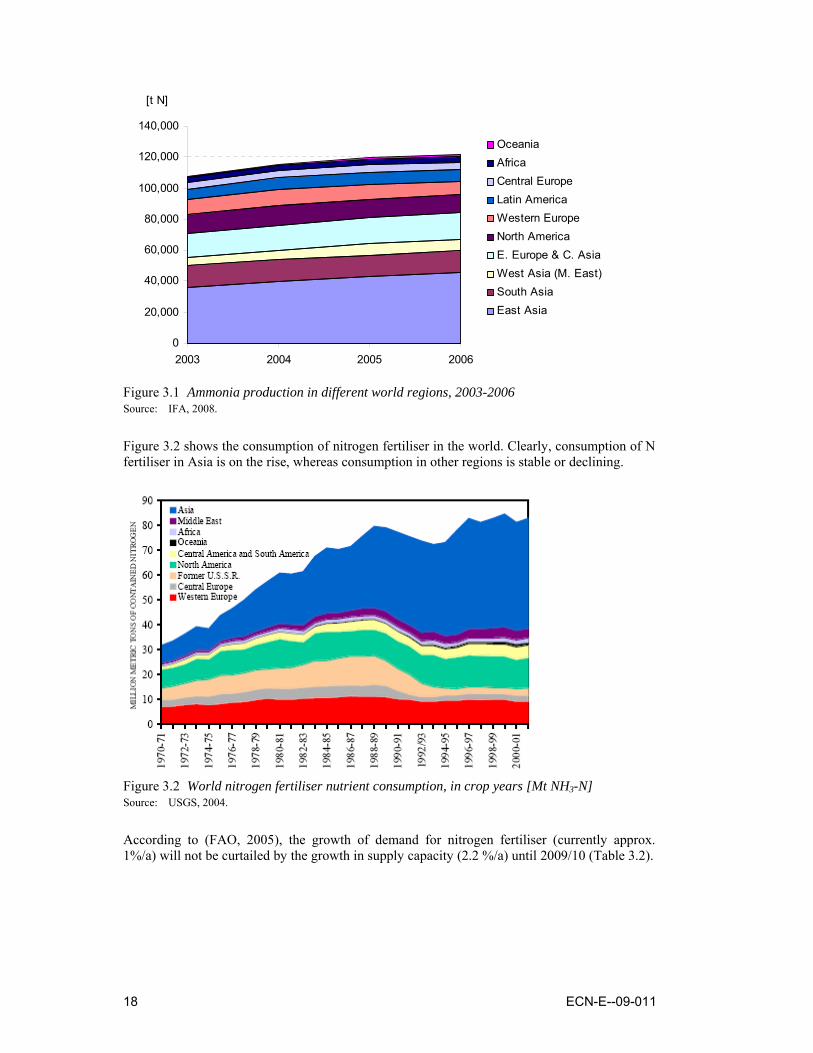
Figure 3.2 shows the consumption of nitrogen fertiliser in the world. Clearly, consumption of N fertiliser in Asia is on the rise, whereas consumption in other regions is stable or declining.
Figure 3.2 World nitrogen fertiliser nutrient consumption, in crop years [Mt NH3-N] Source: USGS, 2004.
According to (FAO, 2005), the growth of demand for nitrogen fertiliser (currently approx. 1%/a) will not be curtailed by the growth in supply capacity (2.2 %/a) until 2009/10 (Table 3.2).
ECN-E--09-011 19
Table 3.2 World nitrogen fertiliser supply and demand balance 2005/06 through 2009/10 N fertiliser supply, demand and surplus [Mt N] (Season) 2005/06 2006/07 2007/08 2008/09 2009/10 Maximum supply 96.5 100.0 103.6 106.0 107.7 Total demand 90.7 92.0 93.2 94.3 95.5 Balance (+ = surplus) + 5.8 + 8.0 + 10.4 + 11.7 + 12.2 Source: FAO, 2005. The relation between supply and demand for Ammonia is shown in Table 3.3, based on the de-mand and the supply capability projected by (IFA, 2005a), and capacity data of (USGS, 2004).
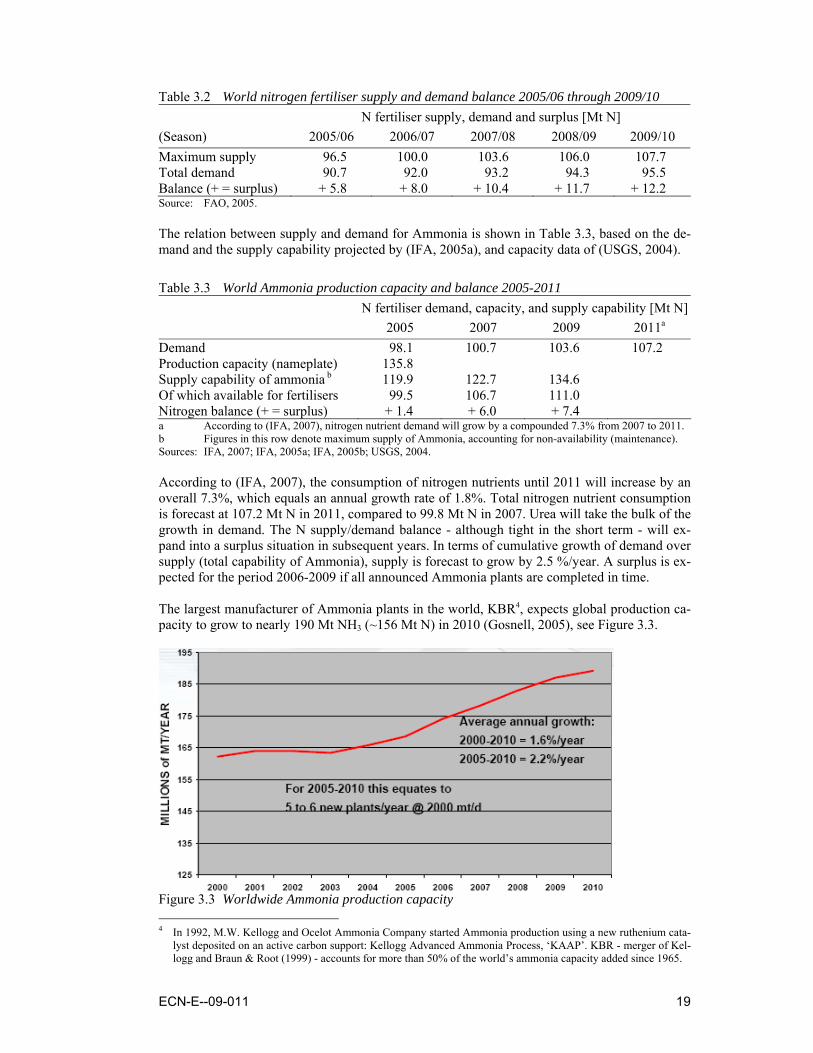
Table 3.3 World Ammonia production capacity and balance 2005-2011 N fertiliser demand, capacity, and supply capability [Mt N] 2005 2007 2009 2011a Demand 98.1 100.7 103.6 107.2 Production capacity (nameplate) 135.8 Supply capability of ammonia b 119.9 122.7 134.6 Of which available for fertilisers 99.5 106.7 111.0 Nitrogen balance (+ = surplus) + 1.4 + 6.0 + 7.4 a According to (IFA, 2007), nitrogen nutrient demand will grow by a compounded 7.3% from 2007 to 2011. b Figures in this row denote maximum supply of Ammonia, accounting for non-availability (maintenance). Sources: IFA, 2007; IFA, 2005a; IFA, 2005b; USGS, 2004. According to (IFA, 2007), the consumption of nitrogen nutrients until 2011 will increase by an overall 7.3%, which equals an annual growth rate of 1.8%. Total nitrogen nutrient consumption is forecast at 107.2 Mt N in 2011, compared to 99.8 Mt N in 2007. Urea will take the bulk of the growth in demand. The N supply/demand balance - although tight in the short term - will ex-pand into a surplus situation in subsequent years. In terms of cumulative growth of demand over supply (total capability of Ammonia), supply is forecast to grow by 2.5 %/year. A surplus is ex-pected for the period 2006-2009 if all announced Ammonia plants are completed in time. The largest manufacturer of Ammonia plants in the world, KBR4, expects global production ca-pacity to grow to nearly 190 Mt NH3 (~156 Mt N) in 2010 (Gosnell, 2005), see Figure 3.3.
Figure 3.3 Worldwide Ammonia production capacity 4 In 1992, M.W. Kellogg and Ocelot Ammonia Company started Ammonia production using a new ruthenium cata-
lyst deposited on an active carbon support: Kellogg Advanced Ammonia Process, ‘KAAP’. KBR - merger of Kel-logg and Braun & Root (1999) - accounts for more than 50% of the world’s ammonia capacity added since 1965.
20 ECN-E--09-011
According to the European Fertilizer Manufacturers’ Association, EFMA, the demand for N-fertiliser in the EU-25 will increase by about 2.5% in the period 2006-2016 (Figure 3.4). Most of the EU-15 will see a decreasing demand, except Denmark, Austria and Sweden for which slight increases in N-fertiliser consumption are projected - due to particularly bad situations in these countries. In the EU-10, on the other hand, consumption of all nutrients will increase.
Figure 3.4 Forecast of fertiliser demand in the EU-25, 2005-2015 Note: Forecast of EFMA (European Fertilizer Manufacturers’ Association). Source: EFMA, 2006.
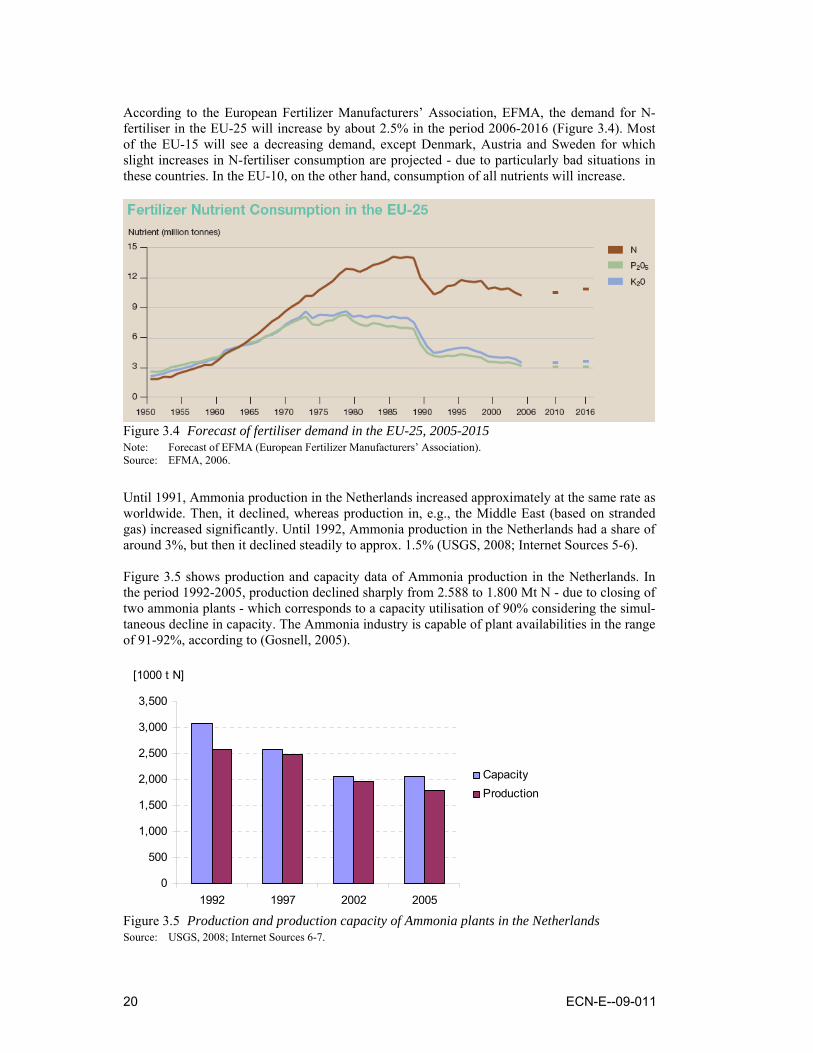
Until 1991, Ammonia production in the Netherlands increased approximately at the same rate as worldwide. Then, it declined, whereas production in, e.g., the Middle East (based on stranded gas) increased significantly. Until 1992, Ammonia production in the Netherlands had a share of around 3%, but then it declined steadily to approx. 1.5% (USGS, 2008; Internet Sources 5-6). Figure 3.5 shows production and capacity data of Ammonia production in the Netherlands. In the period 1992-2005, production declined sharply from 2.588 to 1.800 Mt N - due to closing of two ammonia plants - which corresponds to a capacity utilisation of 90% considering the simul-taneous decline in capacity. The Ammonia industry is capable of plant availabilities in the range of 91-92%, according to (Gosnell, 2005).
0
500
1,000
1,500
2,000
2,500
3,000
3,500
1992 1997 2002 2005
CapacityProduction
[1000 t N]
Figure 3.5 Production and production capacity of Ammonia plants in the Netherlands Source: USGS, 2008; Internet Sources 6-7.
ECN-E--09-011 21
In 1996/1997, the combined capacity of units AFA-2 and AFA-3 at Geleen increased by 100 t NH3/d, by installation of a purge gas converter (Roos et al., 2000). Table 3.4 shows data and es-timates for the Ammonia plants in the Netherlands (2005). The average energy efficiency of the Ammonia plants is tentatively estimated at 30.8-31.0 GJ/t NH3, which is explicated in the fol-lowing. The capacity of 2,304 kt N/year (equivalent to 6,567 t NH3/d) is based on (VKP, 2007).
Table 3.4 Net efficiency (estimate) of Ammonia plants in the Netherlands (2005) Com-pany/Site
Code/year built Licence Capacity [t NH3/d]
Capacity [t N/d]
Capacity[kt N/year]
Efficiency [GJ/t NH3]
References
AFA-2/ 1971 Bechtel 1,500a 1,234 412 DSM Agro/ Geleen AFA-3/ 1983 Kellogg 1,500a 1,234 412 Revamp/ 1997 Haldor Topsøe Subtotal 3,000a 2,468 824 ~ 31.7
Roos et al, 2000; Ver-
duijn and De Wit, 2001; VKP, 2007;
C/ 1973 Braun 1,231 1,012 321 D/ 1984 Braun 1,750 1,439 535 ~ 30.5 E/ 1988 Braun 2,004 1,648 625 ~ 30.0
Yarab (formerly Hydro Agri) / Sluiskil
Subtotal 4,985c 4,100 1,480 ~ 30.5
Boot, 1994;Internet
Source 7; VKP, 2007
Total 7,985 6,567 2,304 30.8-31.0 a Simultaneous with the revamp in 1997, which included installation of a purge gas converter and some small creep
projects, which increased the combined capacity of AFA-2 and AFA-3 by 100 kt NH3/year, a solution swap to ac-tivated Methyl Di-Ethanol Amine (aMDEA™) was implemented (VKP, 2007).
b Yara and IPCOS deployed APC (Automatic Process Control) systems on the plants D and E at Sluiskil. Benefits generated are about 0.5 to 2% for the combined optimisation objectives (Internet Source 7). Recently, Yara retro-fitted plant C with a low-temperature methanation catalyst (VKP, 2007).
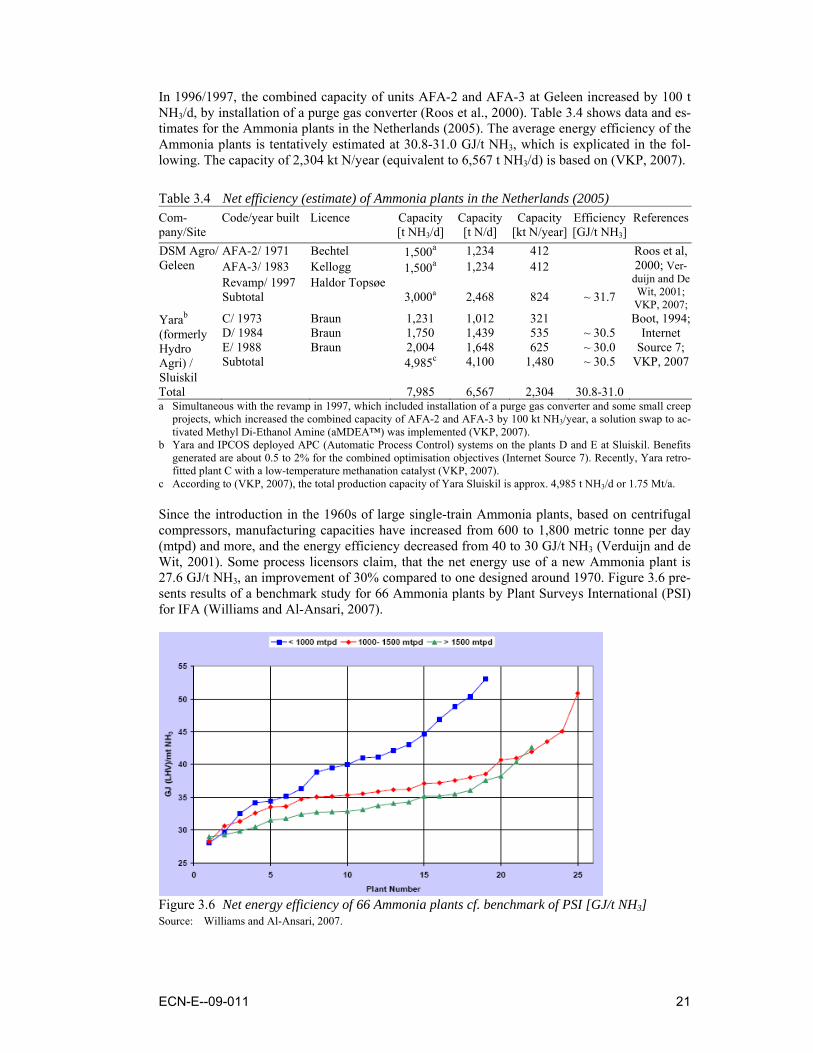
c According to (VKP, 2007), the total production capacity of Yara Sluiskil is approx. 4,985 t NH3/d or 1.75 Mt/a. Since the introduction in the 1960s of large single-train Ammonia plants, based on centrifugal compressors, manufacturing capacities have increased from 600 to 1,800 metric tonne per day (mtpd) and more, and the energy efficiency decreased from 40 to 30 GJ/t NH3 (Verduijn and de Wit, 2001). Some process licensors claim, that the net energy use of a new Ammonia plant is 27.6 GJ/t NH3, an improvement of 30% compared to one designed around 1970. Figure 3.6 pre-sents results of a benchmark study for 66 Ammonia plants by Plant Surveys International (PSI) for IFA (Williams and Al-Ansari, 2007).
Figure 3.6 Net energy efficiency of 66 Ammonia plants cf. benchmark of PSI [GJ/t NH3] Source: Williams and Al-Ansari, 2007.
22 ECN-E--09-011
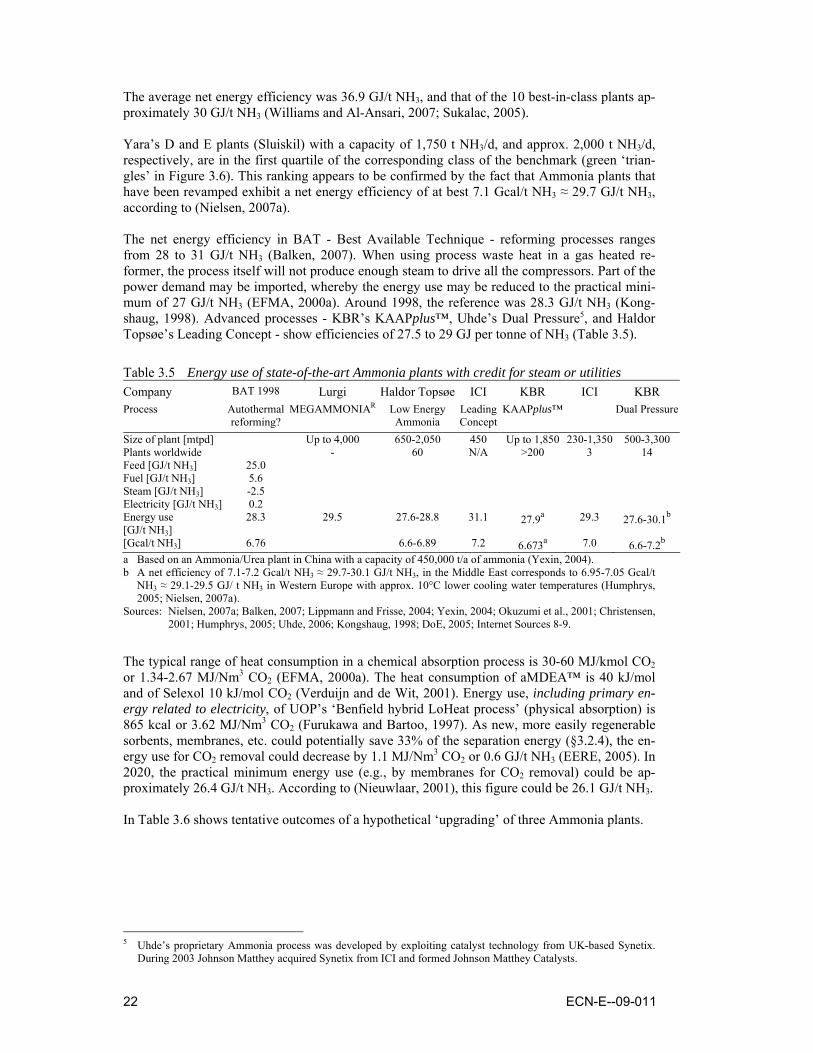
The average net energy efficiency was 36.9 GJ/t NH3, and that of the 10 best-in-class plants ap-proximately 30 GJ/t NH3 (Williams and Al-Ansari, 2007; Sukalac, 2005). Yara’s D and E plants (Sluiskil) with a capacity of 1,750 t NH3/d, and approx. 2,000 t NH3/d, respectively, are in the first quartile of the corresponding class of the benchmark (green ‘trian-gles’ in Figure 3.6). This ranking appears to be confirmed by the fact that Ammonia plants that have been revamped exhibit a net energy efficiency of at best 7.1 Gcal/t NH3 ≈ 29.7 GJ/t NH3, according to (Nielsen, 2007a). The net energy efficiency in BAT - Best Available Technique - reforming processes ranges from 28 to 31 GJ/t NH3 (Balken, 2007). When using process waste heat in a gas heated re-former, the process itself will not produce enough steam to drive all the compressors. Part of the power demand may be imported, whereby the energy use may be reduced to the practical mini-mum of 27 GJ/t NH3 (EFMA, 2000a). Around 1998, the reference was 28.3 GJ/t NH3 (Kong-shaug, 1998). Advanced processes - KBR’s KAAPplus™, Uhde’s Dual Pressure5, and Haldor Topsøe’s Leading Concept - show efficiencies of 27.5 to 29 GJ per tonne of NH3 (Table 3.5).
Table 3.5 Energy use of state-of-the-art Ammonia plants with credit for steam or utilities Company BAT 1998 Lurgi Haldor Topsøe ICI KBR ICI KBR Process Autothermal
reforming? MEGAMMONIAR Low Energy
Ammonia Leading Concept
KAAPplus™ Dual Pressure
Size of plant [mtpd] Up to 4,000 650-2,050 450 Up to 1,850 230-1,350 500-3,300 Plants worldwide - 60 N/A >200 3 14 Feed [GJ/t NH3] 25.0 Fuel [GJ/t NH3] 5.6 Steam [GJ/t NH3] -2.5 Electricity [GJ/t NH3] 0.2 Energy use [GJ/t NH3]
28.3 29.5 27.6-28.8 31.1 27.9a 29.3 27.6-30.1b
[Gcal/t NH3] 6.76 6.6-6.89 7.2 6.673a 7.0 6.6-7.2b a Based on an Ammonia/Urea plant in China with a capacity of 450,000 t/a of ammonia (Yexin, 2004). b A net efficiency of 7.1-7.2 Gcal/t NH3 ≈ 29.7-30.1 GJ/t NH3, in the Middle East corresponds to 6.95-7.05 Gcal/t
NH3 ≈ 29.1-29.5 GJ/ t NH3 in Western Europe with approx. 10°C lower cooling water temperatures (Humphrys, 2005; Nielsen, 2007a).
Sources: Nielsen, 2007a; Balken, 2007; Lippmann and Frisse, 2004; Yexin, 2004; Okuzumi et al., 2001; Christensen, 2001; Humphrys, 2005; Uhde, 2006; Kongshaug, 1998; DoE, 2005; Internet Sources 8-9.
The typical range of heat consumption in a chemical absorption process is 30-60 MJ/kmol CO2 or 1.34-2.67 MJ/Nm3 CO2 (EFMA, 2000a). The heat consumption of aMDEA™ is 40 kJ/mol and of Selexol 10 kJ/mol CO2 (Verduijn and de Wit, 2001). Energy use, including primary en-ergy related to electricity, of UOP’s ‘Benfield hybrid LoHeat process’ (physical absorption) is 865 kcal or 3.62 MJ/Nm3 CO2 (Furukawa and Bartoo, 1997). As new, more easily regenerable sorbents, membranes, etc. could potentially save 33% of the separation energy (§3.2.4), the en-ergy use for CO2 removal could decrease by 1.1 MJ/Nm3 CO2 or 0.6 GJ/t NH3 (EERE, 2005). In 2020, the practical minimum energy use (e.g., by membranes for CO2 removal) could be ap-proximately 26.4 GJ/t NH3. According to (Nieuwlaar, 2001), this figure could be 26.1 GJ/t NH3. In Table 3.6 shows tentative outcomes of a hypothetical ‘upgrading’ of three Ammonia plants.
5 Uhde’s proprietary Ammonia process was developed by exploiting catalyst technology from UK-based Synetix.
During 2003 Johnson Matthey acquired Synetix from ICI and formed Johnson Matthey Catalysts.
ECN-E--09-011 23
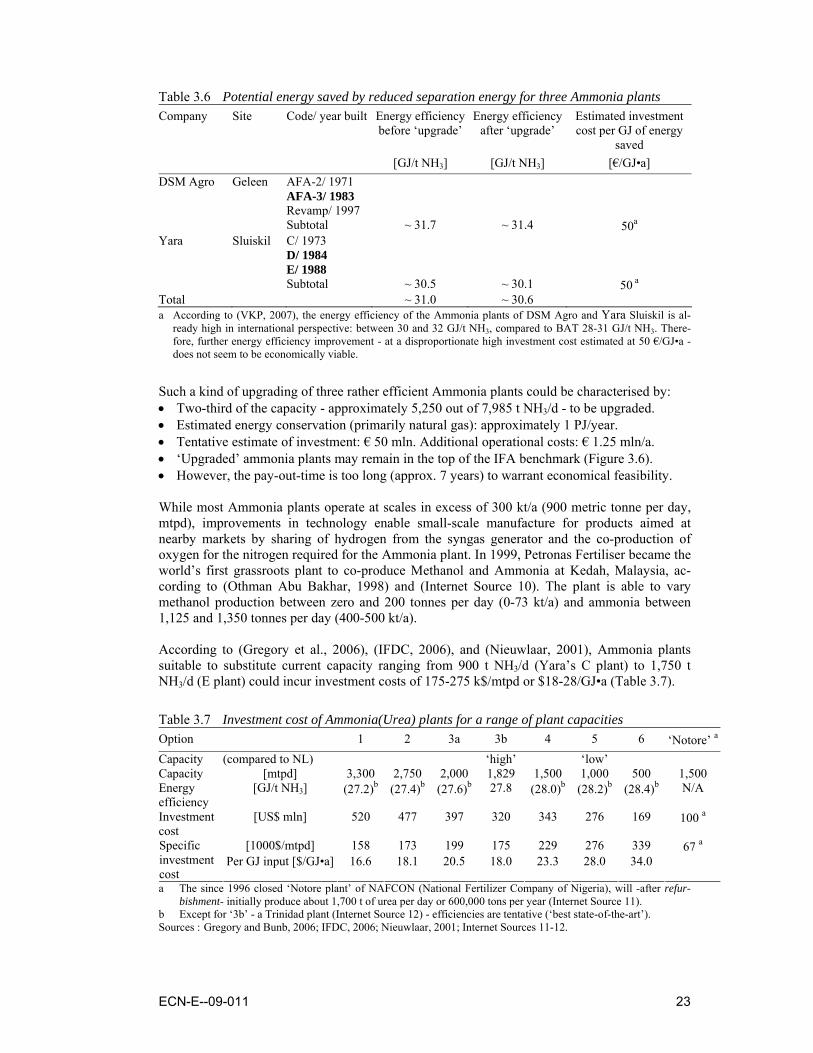
Table 3.6 Potential energy saved by reduced separation energy for three Ammonia plants Company Site Code/ year built Energy efficiency
before ‘upgrade’Energy efficiency
after ‘upgrade’ Estimated investment cost per GJ of energy
saved [GJ/t NH3] [GJ/t NH3] [€/GJ•a] DSM Agro Geleen AFA-2/ 1971 AFA-3/ 1983 Revamp/ 1997 Subtotal ~ 31.7 ~ 31.4 50a Yara Sluiskil C/ 1973 D/ 1984 E/ 1988 Subtotal ~ 30.5 ~ 30.1 50 a Total ~ 31.0 ~ 30.6 a According to (VKP, 2007), the energy efficiency of the Ammonia plants of DSM Agro and Yara Sluiskil is al-
ready high in international perspective: between 30 and 32 GJ/t NH3, compared to BAT 28-31 GJ/t NH3. There-fore, further energy efficiency improvement - at a disproportionate high investment cost estimated at 50 €/GJ•a - does not seem to be economically viable.
Such a kind of upgrading of three rather efficient Ammonia plants could be characterised by: • Two-third of the capacity - approximately 5,250 out of 7,985 t NH3/d - to be upgraded. • Estimated energy conservation (primarily natural gas): approximately 1 PJ/year. • Tentative estimate of investment: € 50 mln. Additional operational costs: € 1.25 mln/a. • ‘Upgraded’ ammonia plants may remain in the top of the IFA benchmark (Figure 3.6). • However, the pay-out-time is too long (approx. 7 years) to warrant economical feasibility. While most Ammonia plants operate at scales in excess of 300 kt/a (900 metric tonne per day, mtpd), improvements in technology enable small-scale manufacture for products aimed at nearby markets by sharing of hydrogen from the syngas generator and the co-production of oxygen for the nitrogen required for the Ammonia plant. In 1999, Petronas Fertiliser became the world’s first grassroots plant to co-produce Methanol and Ammonia at Kedah, Malaysia, ac-cording to (Othman Abu Bakhar, 1998) and (Internet Source 10). The plant is able to vary methanol production between zero and 200 tonnes per day (0-73 kt/a) and ammonia between 1,125 and 1,350 tonnes per day (400-500 kt/a). According to (Gregory et al., 2006), (IFDC, 2006), and (Nieuwlaar, 2001), Ammonia plants suitable to substitute current capacity ranging from 900 t NH3/d (Yara’s C plant) to 1,750 t NH3/d (E plant) could incur investment costs of 175-275 k$/mtpd or $18-28/GJ•a (Table 3.7).
Table 3.7 Investment cost of Ammonia(Urea) plants for a range of plant capacities Option 1 2 3a 3b 4 5 6 ‘Notore’ a
Capacity (compared to NL) ‘high’ ‘low’ Capacity [mtpd] 3,300 2,750 2,000 1,829 1,500 1,000 500 1,500 Energy efficiency
[GJ/t NH3] (27.2)b (27.4)b (27.6)b 27.8 (28.0)b (28.2)b (28.4)b N/A
Investment cost
[US$ mln] 520 477 397 320 343 276 169 100 a
[1000$/mtpd] 158 173 199 175 229 276 339 67 a Specific investment cost
Per GJ input [$/GJ•a] 16.6 18.1 20.5 18.0 23.3 28.0 34.0
a The since 1996 closed ‘Notore plant’ of NAFCON (National Fertilizer Company of Nigeria), will -after refur-bishment- initially produce about 1,700 t of urea per day or 600,000 tons per year (Internet Source 11).
b Except for ‘3b’ - a Trinidad plant (Internet Source 12) - efficiencies are tentative (‘best state-of-the-art’). Sources : Gregory and Bunb, 2006; IFDC, 2006; Nieuwlaar, 2001; Internet Sources 11-12.
24 ECN-E--09-011
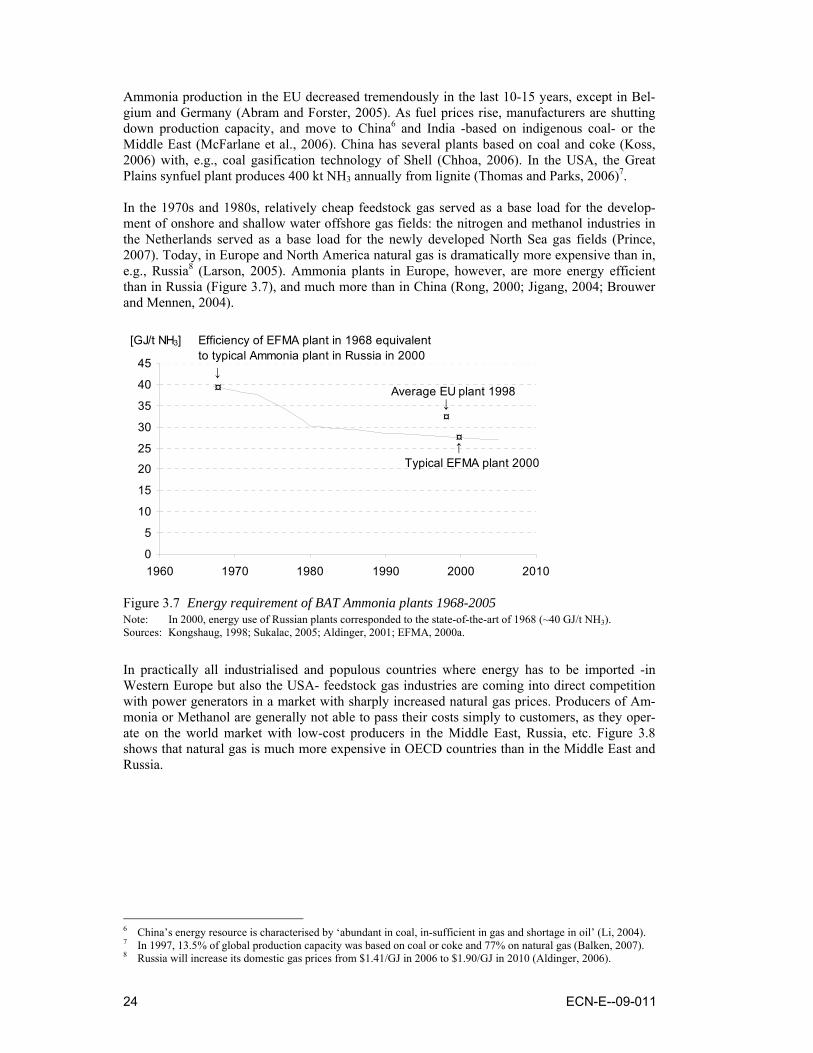
Ammonia production in the EU decreased tremendously in the last 10-15 years, except in Bel-gium and Germany (Abram and Forster, 2005). As fuel prices rise, manufacturers are shutting down production capacity, and move to China6 and India -based on indigenous coal- or the Middle East (McFarlane et al., 2006). China has several plants based on coal and coke (Koss, 2006) with, e.g., coal gasification technology of Shell (Chhoa, 2006). In the USA, the Great Plains synfuel plant produces 400 kt NH3 annually from lignite (Thomas and Parks, 2006)7. In the 1970s and 1980s, relatively cheap feedstock gas served as a base load for the develop-ment of onshore and shallow water offshore gas fields: the nitrogen and methanol industries in the Netherlands served as a base load for the newly developed North Sea gas fields (Prince, 2007). Today, in Europe and North America natural gas is dramatically more expensive than in, e.g., Russia8 (Larson, 2005). Ammonia plants in Europe, however, are more energy efficient than in Russia (Figure 3.7), and much more than in China (Rong, 2000; Jigang, 2004; Brouwer and Mennen, 2004).
0
5
10
15
20
25
30
35
40
45
1960 1970 1980 1990 2000 2010
[GJ/t NH3]
↓
Efficiency of EFMA plant in 1968 equivalent to typical Ammonia plant in Russia in 2000
¤
Typical EFMA plant 2000
↓
¤
Average EU plant 1998
¤
↑
Figure 3.7 Energy requirement of BAT Ammonia plants 1968-2005 Note: In 2000, energy use of Russian plants corresponded to the state-of-the-art of 1968 (~40 GJ/t NH3). Sources: Kongshaug, 1998; Sukalac, 2005; Aldinger, 2001; EFMA, 2000a.
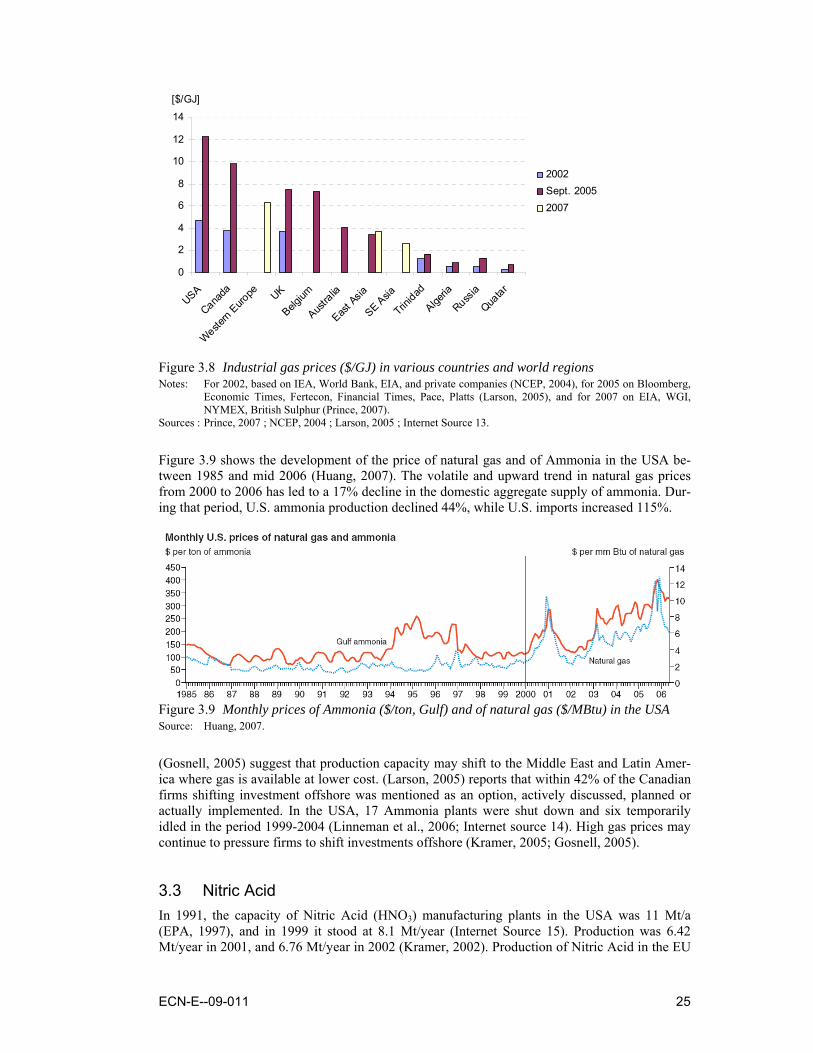
In practically all industrialised and populous countries where energy has to be imported -in Western Europe but also the USA- feedstock gas industries are coming into direct competition with power generators in a market with sharply increased natural gas prices. Producers of Am-monia or Methanol are generally not able to pass their costs simply to customers, as they oper-ate on the world market with low-cost producers in the Middle East, Russia, etc. Figure 3.8 shows that natural gas is much more expensive in OECD countries than in the Middle East and Russia.
6 China’s energy resource is characterised by ‘abundant in coal, in-sufficient in gas and shortage in oil’ (Li, 2004). 7 In 1997, 13.5% of global production capacity was based on coal or coke and 77% on natural gas (Balken, 2007). 8 Russia will increase its domestic gas prices from $1.41/GJ in 2006 to $1.90/GJ in 2010 (Aldinger, 2006).
ECN-E--09-011 25
0
2
4
6
8
10
12
14
USA
Canada
Western
Europe UK
Belgium
Austra
lia
East A
sia
SE Asia
Trinidad
Algeria
Russia
Quatar
2002Sept. 20052007
[$/GJ]
Figure 3.8 Industrial gas prices ($/GJ) in various countries and world regions Notes: For 2002, based on IEA, World Bank, EIA, and private companies (NCEP, 2004), for 2005 on Bloomberg,
Economic Times, Fertecon, Financial Times, Pace, Platts (Larson, 2005), and for 2007 on EIA, WGI, NYMEX, British Sulphur (Prince, 2007).
Sources : Prince, 2007 ; NCEP, 2004 ; Larson, 2005 ; Internet Source 13.
Figure 3.9 shows the development of the price of natural gas and of Ammonia in the USA be-tween 1985 and mid 2006 (Huang, 2007). The volatile and upward trend in natural gas prices from 2000 to 2006 has led to a 17% decline in the domestic aggregate supply of ammonia. Dur-ing that period, U.S. ammonia production declined 44%, while U.S. imports increased 115%.
Figure 3.9 Monthly prices of Ammonia ($/ton, Gulf) and of natural gas ($/MBtu) in the USA Source: Huang, 2007.
(Gosnell, 2005) suggest that production capacity may shift to the Middle East and Latin Amer-ica where gas is available at lower cost. (Larson, 2005) reports that within 42% of the Canadian firms shifting investment offshore was mentioned as an option, actively discussed, planned or actually implemented. In the USA, 17 Ammonia plants were shut down and six temporarily idled in the period 1999-2004 (Linneman et al., 2006; Internet source 14). High gas prices may continue to pressure firms to shift investments offshore (Kramer, 2005; Gosnell, 2005).
3.3 Nitric Acid In 1991, the capacity of Nitric Acid (HNO3) manufacturing plants in the USA was 11 Mt/a (EPA, 1997), and in 1999 it stood at 8.1 Mt/year (Internet Source 15). Production was 6.42 Mt/year in 2001, and 6.76 Mt/year in 2002 (Kramer, 2002). Production of Nitric Acid in the EU
26 ECN-E--09-011
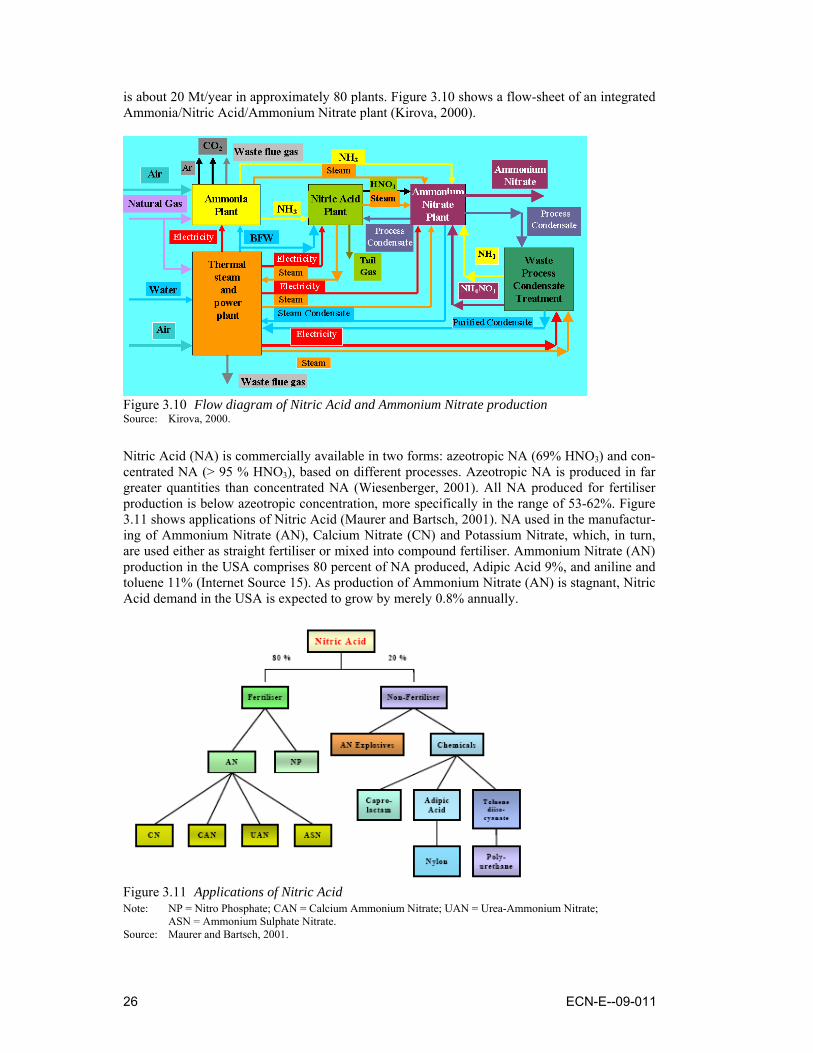
is about 20 Mt/year in approximately 80 plants. Figure 3.10 shows a flow-sheet of an integrated Ammonia/Nitric Acid/Ammonium Nitrate plant (Kirova, 2000).
Figure 3.10 Flow diagram of Nitric Acid and Ammonium Nitrate production Source: Kirova, 2000.
Nitric Acid (NA) is commercially available in two forms: azeotropic NA (69% HNO3) and con-centrated NA (> 95 % HNO3), based on different processes. Azeotropic NA is produced in far greater quantities than concentrated NA (Wiesenberger, 2001). All NA produced for fertiliser production is below azeotropic concentration, more specifically in the range of 53-62%. Figure 3.11 shows applications of Nitric Acid (Maurer and Bartsch, 2001). NA used in the manufactur-ing of Ammonium Nitrate (AN), Calcium Nitrate (CN) and Potassium Nitrate, which, in turn, are used either as straight fertiliser or mixed into compound fertiliser. Ammonium Nitrate (AN) production in the USA comprises 80 percent of NA produced, Adipic Acid 9%, and aniline and toluene 11% (Internet Source 15). As production of Ammonium Nitrate (AN) is stagnant, Nitric Acid demand in the USA is expected to grow by merely 0.8% annually.
Figure 3.11 Applications of Nitric Acid Note: NP = Nitro Phosphate; CAN = Calcium Ammonium Nitrate; UAN = Urea-Ammonium Nitrate;
ASN = Ammonium Sulphate Nitrate. Source: Maurer and Bartsch, 2001.
ECN-E--09-011 27
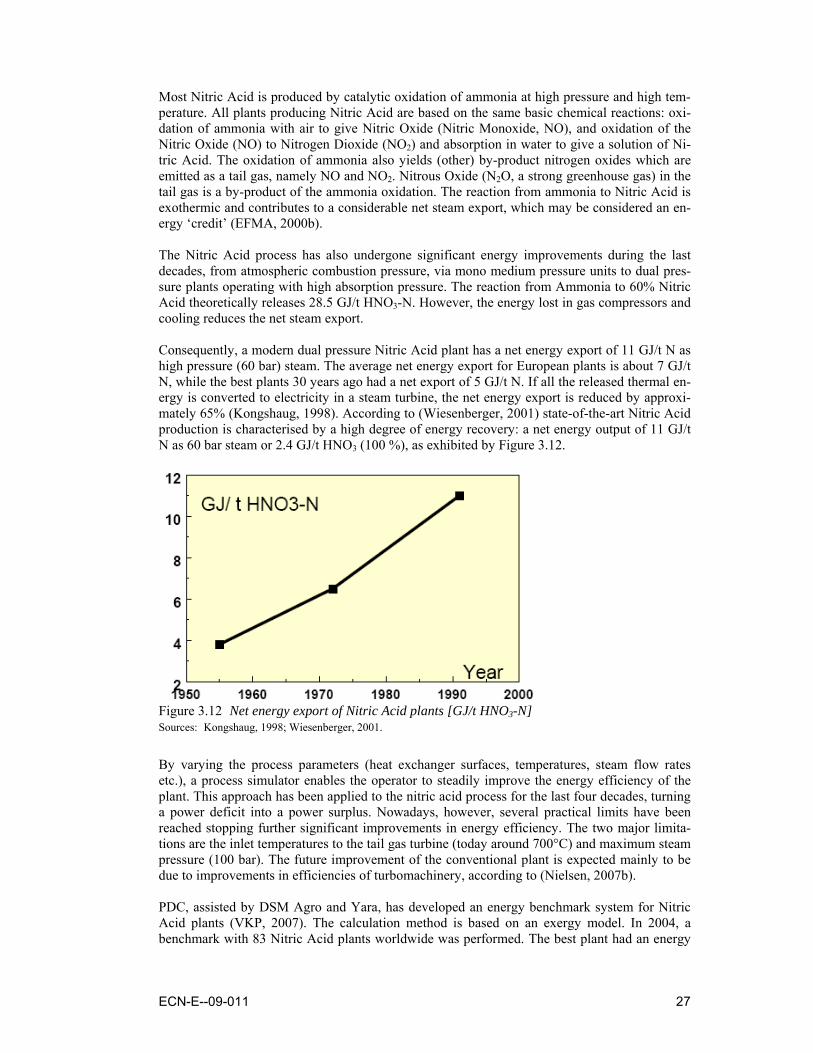
Most Nitric Acid is produced by catalytic oxidation of ammonia at high pressure and high tem-perature. All plants producing Nitric Acid are based on the same basic chemical reactions: oxi-dation of ammonia with air to give Nitric Oxide (Nitric Monoxide, NO), and oxidation of the Nitric Oxide (NO) to Nitrogen Dioxide (NO2) and absorption in water to give a solution of Ni-tric Acid. The oxidation of ammonia also yields (other) by-product nitrogen oxides which are emitted as a tail gas, namely NO and NO2. Nitrous Oxide (N2O, a strong greenhouse gas) in the tail gas is a by-product of the ammonia oxidation. The reaction from ammonia to Nitric Acid is exothermic and contributes to a considerable net steam export, which may be considered an en-ergy ‘credit’ (EFMA, 2000b). The Nitric Acid process has also undergone significant energy improvements during the last decades, from atmospheric combustion pressure, via mono medium pressure units to dual pres-sure plants operating with high absorption pressure. The reaction from Ammonia to 60% Nitric Acid theoretically releases 28.5 GJ/t HNO3-N. However, the energy lost in gas compressors and cooling reduces the net steam export. Consequently, a modern dual pressure Nitric Acid plant has a net energy export of 11 GJ/t N as high pressure (60 bar) steam. The average net energy export for European plants is about 7 GJ/t N, while the best plants 30 years ago had a net export of 5 GJ/t N. If all the released thermal en-ergy is converted to electricity in a steam turbine, the net energy export is reduced by approxi-mately 65% (Kongshaug, 1998). According to (Wiesenberger, 2001) state-of-the-art Nitric Acid production is characterised by a high degree of energy recovery: a net energy output of 11 GJ/t N as 60 bar steam or 2.4 GJ/t HNO3 (100 %), as exhibited by Figure 3.12.
Figure 3.12 Net energy export of Nitric Acid plants [GJ/t HNO3-N] Sources: Kongshaug, 1998; Wiesenberger, 2001.
By varying the process parameters (heat exchanger surfaces, temperatures, steam flow rates etc.), a process simulator enables the operator to steadily improve the energy efficiency of the plant. This approach has been applied to the nitric acid process for the last four decades, turning a power deficit into a power surplus. Nowadays, however, several practical limits have been reached stopping further significant improvements in energy efficiency. The two major limita-tions are the inlet temperatures to the tail gas turbine (today around 700°C) and maximum steam pressure (100 bar). The future improvement of the conventional plant is expected mainly to be due to improvements in efficiencies of turbomachinery, according to (Nielsen, 2007b). PDC, assisted by DSM Agro and Yara, has developed an energy benchmark system for Nitric Acid plants (VKP, 2007). The calculation method is based on an exergy model. In 2004, a benchmark with 83 Nitric Acid plants worldwide was performed. The best plant had an energy
28 ECN-E--09-011
efficiency of -1.83 GJ/t HNO3 (energy export) and the most inefficient plant had an energy effi-ciency of +3.8 GJ/t NHO3 (energy import). Only about 43% of the plants had net energy export. (Internet Source 16) shows that the investment cost of a 100% Nitric Acid plant (Mono pressure process) with a capacity of 900 mtpd in the Czech Republic was about €41 mln (Koruna 1.3 bln). Stagnant markets for AN and Nitric Acid give little incentive for R&D (Appendix C).
3.4 Urea Urea is produced from NH3 and CO2. It is the fertiliser with the highest concentration of nitro-gen (46%). From 1959, Stamicarbon in the Netherlands commercialised urea production with full recycle of unreacted reactants in terms of water soluble coal-ammonia salts, resulting in a granulated product by splashing a strong Urea solution in a hollow tower against the air flow - a process called prilling (Internet Source 17). More recently, process development focused on reducing production costs and emission levels. Emission reduction and introduction of ‘total recycling’ increased energy consumption, but heat recovery and reduction of utilities reduced overall energy consumption. Today, different Urea processes have almost the same energy requirement (Kongshaug, 1998). The Stamicarbon and Snamprogetti processes captured approximately 76% of the world market (Internet Source 18). Urea, also known as carbamide or carbonyl diamide, is marketed as a solution or in solid form. Most Urea solution produced is used in fertiliser mixtures, with a small amount going to animal feed supplements. Most solids are produced as prills or granules, for use as fertiliser or protein supplement in animal feed, and in plastics manufacturing (Internet Source 19). In 2000, 62 Urea plants were in operation in Western Europe. The total capacity in 1999/2000 was about 5.8 Mt Urea (EFMA, 2000c). Downstream use of Urea comprises (Mitsubishi, 2004): • Fertilizer bagging and blending plants. • Livestock nutrition (cattle/poultry). • Melamine. • Coatings and laminate. • Formaldehyde. • Building products (particle board and melamine). • Fuel additives. Urea is produced from liquid NH3 and gaseous CO2 at high pressure and temperature. Both re-actants often are obtained from an ammonia-synthesis plant; Urea plants tend to be co-located with Ammonia plants. The CO2 is a by-product stream, which is vented from the CO2 removal section of the ammonia plant. The two feed components are delivered to the high-pressure urea reactor usually at a molar ratio of greater than 2.5 to 1. Urea is formed as follows:
2NH3 + CO2 ↔ NH2COONH4 (1) and NH2COONH4 ↔ CO(NH2)2 + H2O (2)
where NH2COONH4 is ammonium carbamate. The formation of NH2COONH4 and the dehydra-tion to urea take place simultaneously for all practical purposes (USGS, 2004). Reaction 1 is fast, highly exothermic, and goes essentially to completion under normal industrial processing conditions, while reaction 2 is slow, endothermic and usually does not reach thermodynamic equilibrium under processing conditions (Internet Source 18). In 2002, the Urea production capacity stood at 61.2 Mt N/a, or 131.2 Mt Urea/a (USGS, 2004). In 2002, 1.8% of the global Ammonia production was produced in the Netherlands. The corre-sponding figure for Urea production was 0.9%, according to (USGS, 2004), see Table 3.8.
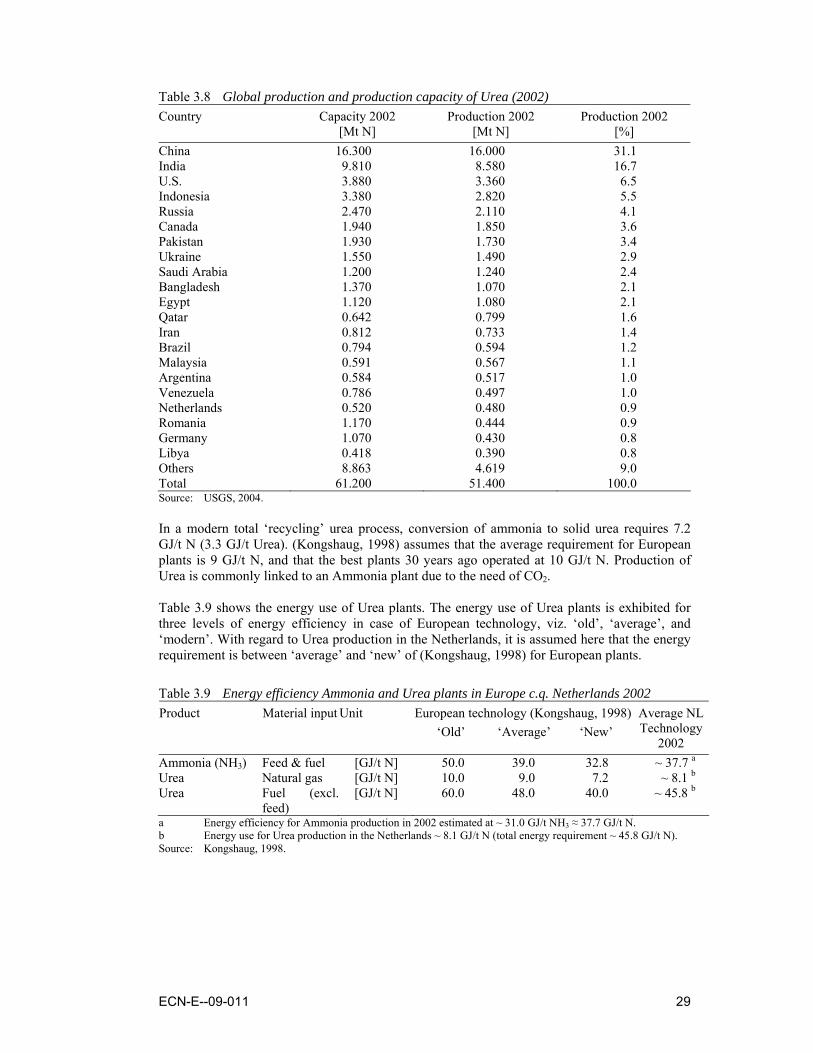
ECN-E--09-011 29
Table 3.8 Global production and production capacity of Urea (2002) Country Capacity 2002 Production 2002 Production 2002 [Mt N] [Mt N] [%] China 16.300 16.000 31.1 India 9.810 8.580 16.7 U.S. 3.880 3.360 6.5 Indonesia 3.380 2.820 5.5 Russia 2.470 2.110 4.1 Canada 1.940 1.850 3.6 Pakistan 1.930 1.730 3.4 Ukraine 1.550 1.490 2.9 Saudi Arabia 1.200 1.240 2.4 Bangladesh 1.370 1.070 2.1 Egypt 1.120 1.080 2.1 Qatar 0.642 0.799 1.6 Iran 0.812 0.733 1.4 Brazil 0.794 0.594 1.2 Malaysia 0.591 0.567 1.1 Argentina 0.584 0.517 1.0 Venezuela 0.786 0.497 1.0 Netherlands 0.520 0.480 0.9 Romania 1.170 0.444 0.9 Germany 1.070 0.430 0.8 Libya 0.418 0.390 0.8 Others 8.863 4.619 9.0 Total 61.200 51.400 100.0 Source: USGS, 2004. In a modern total ‘recycling’ urea process, conversion of ammonia to solid urea requires 7.2 GJ/t N (3.3 GJ/t Urea). (Kongshaug, 1998) assumes that the average requirement for European plants is 9 GJ/t N, and that the best plants 30 years ago operated at 10 GJ/t N. Production of Urea is commonly linked to an Ammonia plant due to the need of CO2. Table 3.9 shows the energy use of Urea plants. The energy use of Urea plants is exhibited for three levels of energy efficiency in case of European technology, viz. ‘old’, ‘average’, and ‘modern’. With regard to Urea production in the Netherlands, it is assumed here that the energy requirement is between ‘average’ and ‘new’ of (Kongshaug, 1998) for European plants.
Table 3.9 Energy efficiency Ammonia and Urea plants in Europe c.q. Netherlands 2002 Product Material input Unit European technology (Kongshaug, 1998) ‘Old’ ‘Average’ ‘New’
Average NL Technology
2002 Ammonia (NH3) Feed & fuel [GJ/t N] 50.0 39.0 32.8 ~ 37.7 a Urea Natural gas [GJ/t N] 10.0 9.0 7.2 ~ 8.1 b Urea Fuel (excl.
feed) [GJ/t N] 60.0 48.0 40.0 ~ 45.8 b
a Energy efficiency for Ammonia production in 2002 estimated at ~ 31.0 GJ/t NH3 ≈ 37.7 GJ/t N. b Energy use for Urea production in the Netherlands ~ 8.1 GJ/t N (total energy requirement ~ 45.8 GJ/t N). Source: Kongshaug, 1998.
30 ECN-E--09-011
3.5 N fertiliser industry in general Regarding Nitric Acid it was noted that current processes are based on significant heat recovery. Lower temperature catalysts for ammonia oxidation could be an area for research. However, in-centives for further energy efficiency improvement are lacking in a stagnant Nitric Acid market. With regard to Ammonia, developing a synthesis catalyst that is resistant to poisoning by CO2, thus eliminating the CO2 removal unit and methanation entirely is a long-term (>2020) option. (Energetics Inc., 2000) suggests that many low-cost, high-return investments have already been made, or as (Larson, 2005) notes on Canada: ‘There are no easy reductions in energy consump-tion, or low hanging fruit here’. Deeper efficiency improvement demands drastic changes in process design and innovative R&D. In Table 3.10, the energy use for Ammonia and Urea is compared with the total energy use of the fertiliser industry in the Netherlands in 2002 based on (CBS, 2006).
Table 3.10 Total energy requirement for Ammonia & Urea in the Netherlands (2002/2005) Specific
energy use 2005 a
Production 2002
Specific energy use a (for NH3 see
Table 3.5)
Production 2002
Energy requirement
2002
Energy requirement
1986 [GJ/t N] [1000 t N] [GJ/t product] [kt product] [PJ] [PJ] Ammonia (NH3) ~ 37.6 1,970 ~ 31.0 2,395 ~ 74.17 93.0 Urea excl. ammonia (NH3) 8.10 480 3.78 1,029 3.89 2.5 Total Ammonia & Urea ~ 78.06 Other fertiliser industry b ~ 8.15 Other (mainly NPK) 4.7 Fertiliser industry (CBS) ~ 86.21c 100.2 a Merely natural gas, assuming an Ammonia/Urea plant with net steam or electricity import or export. b Other than Ammonia and Urea, and in 2002 including combined heat and power at ammonia plants. c In 2002, the energy use of the fertiliser industry was 86.77 PJ. Considering the efficiency improvement due to
application of Automatic Process Control at units D and E at Sluiskil since 2002, the total energy use has been lowered by 0.56 PJ in order to present a more representative figure for ‘other fertiliser industry’.
Table 3.6 showed a tentative estimate of the energy efficiency potential - approximately 1 PJ - of more efficient technology for CO2 separation at three energy-efficient Ammonia plants in the Netherlands. (EERE, 2005) presents an estimate of the energy efficiency potential of pervapora-tion - hybrid technologies based on membranes and distillation - for the U.S. Urea production of 2 PJ (§2.3.1). Based on the ratio between Urea production in the Netherlands (480 kt N) and the USA (3,260 kt N), approx. 0.3 PJ could be conserved in Dutch Urea production plants. As it is technically easier and more economical to replace distillation with hybrid systems than to totally replace it with an alternative technology, the investment for pervaporation at Urea plants is es-timated at no more than € 15/GJ•a and additional O&M cost at € 0.3/GJ (Table 3.11).
ECN-E--09-011 31
Table 3.11 Energy efficiency potential Ammonia and Urea production in the Netherlands Stage
Total energy requirement
2002
Tentative estimate of investment
Tentative estimate of
specific investment
Tentative estimate of additional
O&M
Tentative estimate of additional O&M cost
[PJ] [€ mln] [€/GJ•a] [€ mln/a] [€/GJ] 0 Status 2002, Table 3.10 78.06 A Pervaporation for Urea
production 77.75 (-0.31)
~ 4.7 15 ~ 0.1 0.3
B ‘Upgrade’ Ammoniaproduction (regenerable sorbents, etc.)
77.06 (-1.000)
~ 50 50 ~ 1.25 1.25
A+B Pervaporation (Urea) &‘upgrade’ Ammonia
76.75 (-1.31)
~ 54.7 41.8 ~ 1.35 ~ 1.0
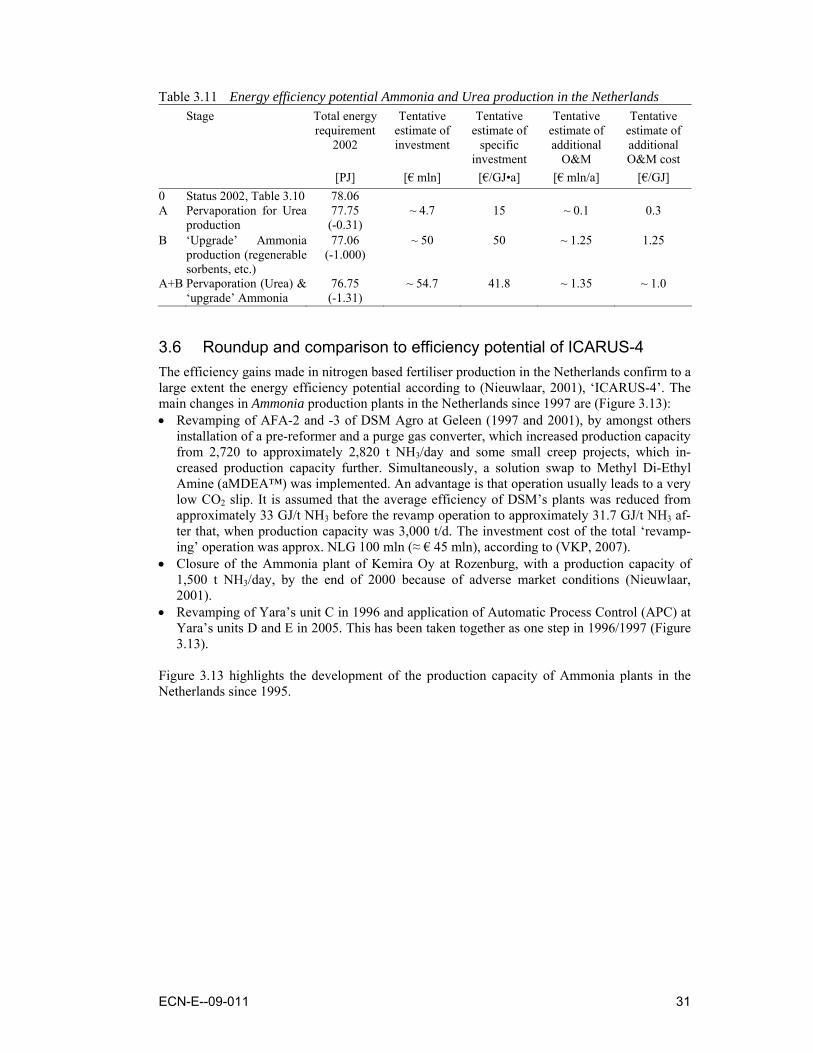
3.6 Roundup and comparison to efficiency potential of ICARUS-4 The efficiency gains made in nitrogen based fertiliser production in the Netherlands confirm to a large extent the energy efficiency potential according to (Nieuwlaar, 2001), ‘ICARUS-4’. The main changes in Ammonia production plants in the Netherlands since 1997 are (Figure 3.13): • Revamping of AFA-2 and -3 of DSM Agro at Geleen (1997 and 2001), by amongst others
installation of a pre-reformer and a purge gas converter, which increased production capacity from 2,720 to approximately 2,820 t NH3/day and some small creep projects, which in-creased production capacity further. Simultaneously, a solution swap to Methyl Di-Ethyl Amine (aMDEA™) was implemented. An advantage is that operation usually leads to a very low CO2 slip. It is assumed that the average efficiency of DSM’s plants was reduced from approximately 33 GJ/t NH3 before the revamp operation to approximately 31.7 GJ/t NH3 af-ter that, when production capacity was 3,000 t/d. The investment cost of the total ‘revamp-ing’ operation was approx. NLG 100 mln (≈ € 45 mln), according to (VKP, 2007).
• Closure of the Ammonia plant of Kemira Oy at Rozenburg, with a production capacity of 1,500 t NH3/day, by the end of 2000 because of adverse market conditions (Nieuwlaar, 2001).
• Revamping of Yara’s unit C in 1996 and application of Automatic Process Control (APC) at Yara’s units D and E in 2005. This has been taken together as one step in 1996/1997 (Figure 3.13).
Figure 3.13 highlights the development of the production capacity of Ammonia plants in the Netherlands since 1995.
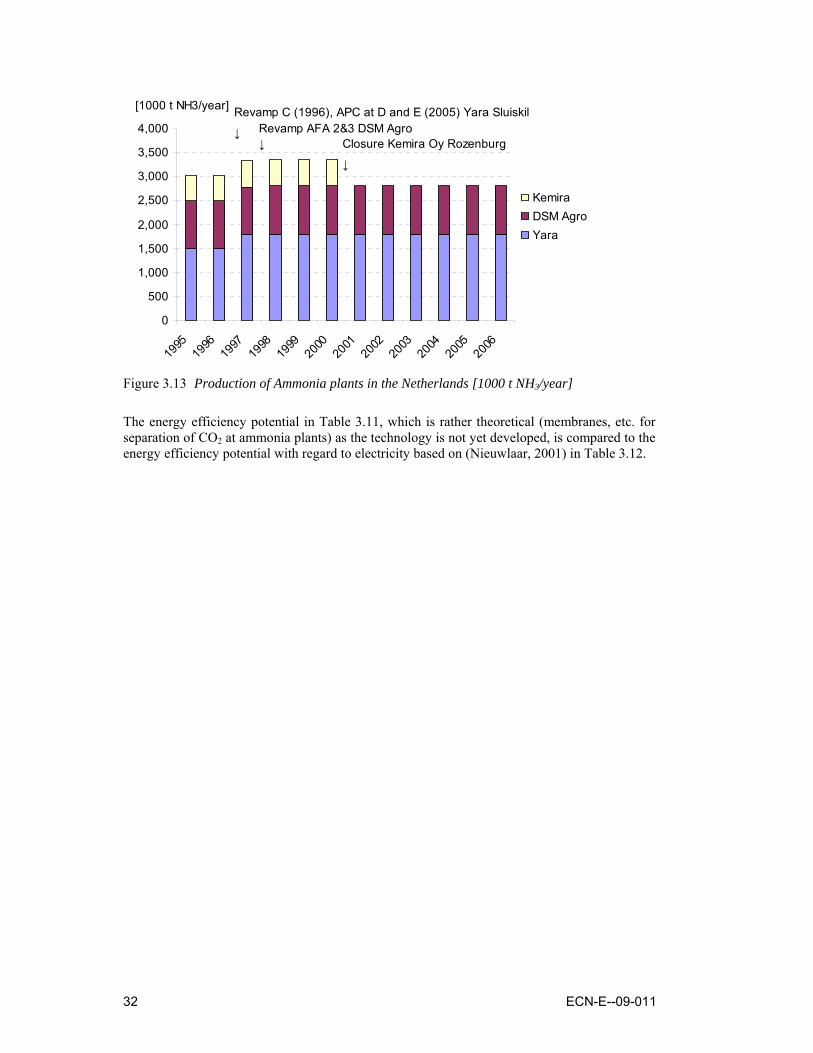
32 ECN-E--09-011
0
500
1,000
1,500
2,000
2,500
3,000
3,500
4,000
1995
1996
1997
1998
1999
2000
2001
2002
2003
2004
2005
2006
KemiraDSM AgroYara
[1000 t NH3/year]
Revamp AFA 2&3 DSM Agro↓
↓
Closure Kemira Oy Rozenburg
Revamp C (1996), APC at D and E (2005) Yara Sluiskil
↓
Figure 3.13 Production of Ammonia plants in the Netherlands [1000 t NH3/year]
The energy efficiency potential in Table 3.11, which is rather theoretical (membranes, etc. for separation of CO2 at ammonia plants) as the technology is not yet developed, is compared to the energy efficiency potential with regard to electricity based on (Nieuwlaar, 2001) in Table 3.12.
ECN-E--09-011 33
Table 3.12 Energy conservation with regard to electricity in the Dutch fertiliser industry Category Energy use
1995 Efficiency
improvement potential
Specific investment cost Explanation
[PJe] (%)
[PJe] (%)
[€/GJe•a] [€/GJp•a]
Pumps 1.55 (42)
0.25 (16)
16 6.4 Approx. 92% of pumps are oversized and controlled by throttling or bypass adjustment. Adjustable Speed Drives (ASD) may reduce consumption of pumps by 16%.
Machine drives
0.89 (24)
0.02 (2)
225 91 Adjustable Speed Drives (ASD) might reduce consumption of machine drives by 2%.
Fans 0.67 (18)
0.07 (10)
45.5 18 High efficiency fans may reduce electricity consumption of fans by 10%.
Compressed air
0.48 (13)
0.10 (20)
16 6.4 Electric compressors are mainly used for compressed air. Savings may be achieved by diminishing leakages, applying different pressured levels, lowering working pressure and using colder air. The energy saving is estimated at 20%.
Lighting 0.11 (3)
0.04 (35)
25 10 Efficient lamps, fittings, and lighting control systems are examples of measures to reduce energy consumption of lighting. The energy saving is estimated at 35%.
Total/ average
3.70 (100)
0.47 (13)
29 12 These measures are assumed not implemented before 1995.
Note: (Nieuwlaar, 2001) presents data in (€/GJe•a) as well as (€/GJp•a), taking into account a conversion effi-ciency for electricity generation.
Source: Nieuwlaar, 2001.
With regard to Ammonia production (Nieuwlaar, 2001) presents the following energy efficiency potential (Table 3.13).
Table 3.13 Energy conservation with regard to Ammonia production in the Netherlands Category Penetration
1995 (percentage of capacity)
Efficiency improvement
potential
Specific investment
cost
Additional O&M cost
Explanation
[%] [%] [€/GJ•a] [€/GJ] Pre-reformer 18 4 7.5 In 1990 Kemira Oy installed a pre-
reformer. Hydrogen recovery
10 0.8 GJ/t NH3 10 0.25 Hydrogen recovery by membranes is installed at 10% of capacity.
Process integration
50 4 15 0.5 Penetration is assumed to be 50% in 1995.
Auxiliary steam generation
2.5 45 1.5 Changing boilers to ‘hot stand-by’ reduces the stand-by capacity.
CO2 removal with improved solvents
20 30-60 MJ/kmol CO2
3 Replacement of, e.g., potassium carbonate by aMDEA. Penetration is assumed to be 20% in 1995.
Note: According to (VKP, 2007), aMDEA was introduced in Dutch ammonia plants about 10 years ago. Source: Nieuwlaar, 2001.

34 ECN-E--09-011
Furthermore, (Nieuwlaar, 2001) notes that in modern Urea plants energy use may be as low as 2.75 GJ/t Urea. Energy use in Dutch Urea plants is estimated at 3.05 GJ/t Urea. Therefore, an energy efficiency improvement of 11% is deemed achievable. This would entail a specific in-vestment cost of €25/GJ. Urea production is assumed to account for 10% of the energy use for fertiliser production in 1995. According to (Nieuwlaar, 2001), Nitric Acid and CAN plants may export steam, thereby reduc-ing the energy use of fertiliser production in 1995 by an estimated 4%. The specific investments costs incurred are estimated at €75/GJ.
ECN-E--09-011 35
4. Conclusions and recommendations
Conclusions This study focuses on the energy efficiency potential of the Nitrogen (N) fertiliser industry. First, the study presents an overview of the energy efficiency potential of several ‘resource-intensive’ industries in the USA, based on two in-depth studies. Secondly, the energy efficiency potential of the N fertiliser industry in the Netherlands is analysed, drawing on the generic stud-ies for the USA and country-specific studies and data for the Netherlands. The N fertiliser in-dustry in the Netherlands encompasses Ammonia production, Urea production, etc. The time horizon is 2020. Therefore, technologies with a long-term potential - e.g., technologies that are in the R&D stage - are not taken into account. The trends observed for the N fertiliser industry as well as the energy efficiency potential that results from the analysis, may be used for models employed by ECN Policy Studies. However, the energy efficiency potentials resulting from the analysis have to be used with care as they prove to be difficult to quantify. The Dutch N fertiliser industry mainly consists of ammonia plants in Geleen (DSM Agro) and Sluiskil (Yara) that have been built in the 1970s and 1980s when the use of gas for fertiliser production was favoured in order to provide a base load for gas production from the Dutch con-tinental shelf. From the 1990s, several important changes occurred with regard to ammonia pro-duction in the Netherlands. First, one of the three ammonia plants in Sluiskil (Yara) was ‘re-vamped’, thereby increasing the production capacity. Later on, Yara’s other ammonia plants were equipped with Automatic Process Control, and their production capacity was increased too. Secondly, in 1997, DSM executed a revamp of its twin units at Geleen, increasing their ca-pacity and decreasing the net energy use (including utilities, viz. steam and electricity) signifi-cantly. Thirdly, in 2000 the ammonia plant operated by Kemira in Rozenburg was closed. In 1991 also the DSM Agro IJmuiden ammonia plant was closed. The production capacity of the five remaining ammonia plants (three in Sluiskil and two in Geleen) increased substantially from 1997 onwards. Ammonia plants in the Netherlands have an estimated energy use for feedstock and utilities (steam and electricity) of on average 31 GJ/t NH3. Dutch ammonia plants are energy efficient in comparison to plants in other countries of the world. This can be attributed to continuous energy efficiency improvement at the ammonia plants in Geleen - installation of a purge gas converter, simultaneous solution swap to aMDEA, installation of a pre-reformer, etc - and Sluiskil - solu-tion swap to aMDEA, installation of Automatic Process Control. Recently, a benchmark study for 66 Ammonia plants by Plant Surveys International (PSI) for IFA showed that the average net energy efficiency of these 66 plants was 36.9 GJ/t NH3, and that of the 10 best-in-class plants approximately 30 GJ/t NH3.Yara’s D and E plants (Sluiskil), are in the first quartile of the corresponding class of the benchmark. This ranking appears to be confirmed by the fact that Ammonia plants that have been revamped exhibit a net energy efficiency of at best approx. 29.7 GJ/t NH3. A significant energy efficiency improvement might be the application of new, more easily re-generable sorbents, membranes, etc. instead of the current CO2 separation by aMDEA. If this type of technology would be developed and applied at three relatively modern ammonia plants in the Netherlands, the energy conserved could amount to 1 PJ/year. However, at this moment this technology is not available yet. Another option is application of pervaporation for Urea pro-duction. This could save approximately 0.3 PJ/year, and the pay-out time could be shorter than 7 years (in case of membranes for Ammonia production).
36 ECN-E--09-011
With regard to Nitric Acid (NA), PDC - assisted by DSM Agro and Yara - has developed an en-ergy benchmark system. The calculation method is based on an exergy model. In 2004, a benchmark with 83 Nitric Acid plants worldwide was performed. The best plant had an energy efficiency of -1.83 GJ/t HNO3 (energy export) and the most inefficient one had an energy effi-ciency of +3.8 GJ/t NHO3 (energy import). Only 43% of the plants had net energy export. For Dutch Ammonia and Nitric Acid plants, it seems that ‘There are no easy reductions in en-ergy consumption, or low hanging fruit…’ as an industrial expert noted. An exception may be pervaporation for Urea production. Economically viable energy savings in the N fertiliser indus-try may amount to 0.5 PJ/year or more, including 0.3 PJ/year from pervaporation for Urea plants. Recommendations Cross-cutting technologies like separation technologies with potential for energy conservation in the N fertiliser industry in the Netherlands deserve due attention. This is because studies on en-ergy efficiency improvement in the past mainly focused on incremental energy efficiency im-provement. It is noted, that in particular studies in the framework of ‘ICARUS-4’ of Utrecht University (Utrecht Centre for Energy Research, UCE) remain valuable from the point of view of the methodological approach. However, much of the ‘low hanging fruit’ already has been harvested, particularly in the N fertiliser industry. Also, profound changes have occurred in the conditions governing the Dutch energy economy, viz.: • Introduction of carbon trading in January 2005: the European Emission Trading Scheme. • A steep increase of oil and gas prices, culminating in a temporary maximum oil price of ap-
proximately $78 per barrel in 2006 and up to maximum of approx. $145 per barrel in 2008. • An increased attention for energy conservation and renewable energy - next to other options
like advanced coal and nuclear power - in order to combat climate change, reduce the de-pendence on imported oil and gas, and reduce the cost of energy for the economy.
It may be recommended to take a fresh look at the potential for energy efficiency improvement in (sectors of) the energy or resource intensive industry, based on a distinctive approach: • Determination of the position of the industrial sector from an international point of view,
e.g., taking into account benchmark studies performed or other (international) literature stud-ies.
• Consideration of energy efficiency improvements achieved, like those reported in this study for the Dutch N fertiliser industry, as well as consideration of plans with regard to energy conservation and capacity expansion (e.g., through revamping) in the medium term.
• Quantification of energy conservation potential through a supply curve, if possible (as prac-tised by Utrecht University in the framework of ICARUS-4.
In the past, Utrecht University has applied such an approach for several industrial sectors. How-ever, for the N fertiliser industry their study is more or less outdated. Thus, the energy effi-ciency potential has to be checked again based on, e.g., benchmark studies, if available, taking into account competition in an international framework, including carbon trading etc.
ECN-E--09-011 37
Acronyms and abbreviations
CAN Acrylonitril ADt Air Dried tonne aMDEA Activated Methyl Diethanol Amine AN Ammonium Nitrate APC Automatic Process Control ASD Adjustable Speed Drives ASN Ammonium Sulphate Nitrate BAT Best Available Technique BPF Berghuizer Papierfabriek CAN Calcium Ammonium Nitrate CapEx Capital Expenditures CCE Cost of Conserved Energy CCS CO2 Capture and Storage CHP Combined Heat and Power CN Calcium Nitrate DMFC Direct Methanol Fuel Cell DoE Department of Energy (USA) EC European Commission EDC Ethylene dichloride EEI Energy Efficiency Index EFMA European Fertilizer Manufacturers’ Association EO Ethylene oxide EU ETS European Emission Trading Scheme GHG Greenhouse gas IFA International Fertilizer industry Association LPG Liquefied petroleum gas MEA Mono ethanolamine MTBE Methyl Tertiary Butyl Ether NA Nitric Acid NGL Natural gas liquid NP Nitro Phosphate O&M Operation and Maintenance OpEx Operating Expenditures PSA Pressure Swing Adsorption PTA Purified Terephthalic Acid RD&D Research, Development, and Demonstration RTD&D Research and Technological Development and Demonstration SHC Specific Heat Consumption UAN Urea-Ammonium Nitrate UCE Utrecht Centre for Energy Research VBE Verificatiebureau Benchmarking Energie-efficiency
38 ECN-E--09-011
References
Abram, A., D.L. Forster (2005): A Primer on Ammonia, Nitrogen Fertilizers, and Natural Gas Markets. Department of AED Economics, The Ohio State University, USA, September 30, 2005, p. 17.
Aldinger, H. (2006): The European Fertilizer Sector in a Changing Domestic and Global Environment. 12th AFA International Annual Conference, Cairo, Egypt, 6-8 February 2006.
Aldinger, H. (2001): The Fertilizer Sector in Western Europe - Market Trends and Industry Outlook. 2nd International Conference on The Chemical and Petrochemical Industries of Russia, the CIS and Central & Eastern Europe, Budapest, Hungary, 23-24 April 2001, p. 15.
Balken, H. van (2007): Best Available Techniques for the production of ammonia. IFA 2007 Technical Committee Meeting - Workshop on Energy Efficiency and CO2 Reduction Prospects in Ammonia Production, 12-14 March 2007, Ho Chi Minh City, Viet Nam.
Boot, H. (1994): Sectorstudie kunstmestindustrie. Project NEEDIS, TNO Apeldoorn, The Netherlands, October 1994.
Brouwer, M., J. Mennen (2004): Stamicarbon Revamping Strategy in China. IFA Technical Conference, Beijing, China, 20-23 April 2004.
CBS (2006): CBS Energiebalans Industrie. CBS, The Hague, 2006.
Chhoa, T. (2006): Shell Clean Coal Energy in Asia-Pacific. Shell, VP Clean Coal Energy Asia-Pacific Shell Gas & Power, April 10, 2006. Http://www.gasification.org/Docs/2006_Papers/34CHHO.pdf.
Choate, W. et al (2005): Materials for Separation Technologies. ORNL, USA, 2005. http://www.eere.energy.gov/industry/imf/pdfs/separationsreport.pdf#search=%22Materials%20for%20separation%20technologies%22.
Christensen, P.V. (2001): Design and Operation of Large Capacity Ammonia Plants. 4th Conference for Development and Integration of Petrochemical Industries in the Arab States, Bahrain, May 7-8, 2001.
DoE (2005): Separation Technology R&D Needs for Hydrogen Production in the Chemical and Petrochemical Industries. U.S. Department of Energy (DoE), Washington DC, December 2005.
Dorgan, J.R. et al (2003): Energy Saving Separations Technologies for the Petroleum Industry: An Industry-University-National Laboratory Research Partnership. Chemical Engineering and Petroleum Refining Dept. Colorado School of Mines, Golden, Colorado, USA, March 2003.
EERE (2005): Materials for Separation Technologies: Energy and Emission Reduction Opportunities. Energy Efficiency and Renewable Energy (EERE), Department of Energy, USA, May 4, 2005.
EFMA (2000a): Production of Ammonia - Best Available Techniques for Pollution Prevention and Control in the European Fertilizer Industry. European Fertilizes Manufacturers Association (EFMA), Brussels, Belgium, 2000.
EFMA (2000b): Production of Nitric Acid. EFMA, Brussels, Belgium, 2000.
EFMA (2000c): Production of Urea and Urea Ammonium Nitrate. EFMA, Brussels, Belgium, 2000.
ECN-E--09-011 39
EFMA (2006): Forecast of Food, Farming and Fertilizer Use in the European Union 2006-2016. EFMA, 2006. http://cms.efma.org/EPUB/easnet.dll/GetDoc?APPL=1&DAT_IM=000E50&DWNLD=EfmaForecast06Site.pdf
Energetics Inc. (2000): Energy and Environmental Profile of the U.S. Chemical Industry. Energetics Inc., Columbia, Maryland, USA, May 2000, p. 24.
EPA (1991): Alternative Control Techniques Document - Nitric and Adipic Acid Manufacturing Plants. U.S. EPA, Office of Air Quality, Planning, and Standards, Research Triangle, NC. EPA-450/3-91-026, 1991.
FAO (2005): Current World Fertilizer Trends and Outlook to 2009/10. Food and Agriculture Organization (FAO), Rome, Italy, 2005.
Furukawa, S.K., R.K. Bartoo (1997): Improved Benfield Process for Ammonia Plants. UOP, Des Plaines, Illinois, USA, 1997. http://www.uop.com/objects/85ImprvdBenfieldAmm.pdf.
Gosnell, J. (2005): Efficient Ammonia Production. Hydrogen Conference, Argonne National Laboratory. KBR, USA, 13 October 2005.
Gregory, D.I., B.L. Bumb (2006): Factors Affecting Supply of Fertilizer in Sub-Saharan Africa. Agriculture and Rural Development Discussion Paper 24, the World Bank, Washington DC, USA, 2006.
Huang, W.-Y. (2007): Impact of Rising Natural Gas Prices on U.S. Ammonia Supply. United States Department of Agriculture (USDA), August 2007. Http://www.ers.usda.gov/Publications/WRS0702/
Humphrys, M. (2005): The Effect of Johnson Matthey Catalysts on the Uhde Ammonia Flowsheet. 18th AFA International Annual Technical Conference & Exhibition, Casablanca, Morocco, 5-7 July, 2005.
IEA (2006) : Energy Technology Perspectives 2006. IEA, Paris, France, 2006.
IFA (2008): Production and International Trade Committee: World Ammonia Statistics by Region. International Fertilizer Industry Association (IFA), Paris, France, 2008. http://www.fertilizer.org/ifa/content/download/7832/121893/version/1/file/2006_ammonia_public.xls
IFA (2007): Medium-Term Outlook for Global Fertilizer Demand, Supply and Trade 2007-2011 - Summary Report. 75th IFA Annual Conference, Istanbul, Turkey, 21-23 May 2007, A/07/88, June 2007.
IFA (2005a): Medium-Term Outlook for Global Fertilizer Demand, Supply and Trade - Summary Report. IFA, Paris, France, June 2005.
IFA (2005b): World Agriculture and Fertilizer Demand, Global Fertilizer Supply and Trade 2005-2006 - Summary Report. IFA, Paris, France, December 2005.
IFDC (2006): IFDC Corporate Report 2005/2006. International Fertilizer Development Center (IFDC), Muscle Shoals, Alabama, USA, 2006, p. 25.
Jigang, T. (2004): Energy Saving and Capacity Increase Retrofit for a large-scale Ammonia Plant. IFA Technical Conference, Beijing, China, 20-23 April 2004.
JVP (2004): Chemical Bandwidth Study. JVP International, Inc., New York, USA, December 2004.
40 ECN-E--09-011
Kirova, Z. (2000): Thermodynamic Estimation of the Environmental Impact of Mineral Fertilizers Production. University “Prof. Assen Zlatarov”, Bourgas, Bulgaria, 2000. Http://www.chem.ntnu.no/…/R8/14.30-16.00/_THERMODYNAMIC-ESTIMATION-OF-THE-ENVIRONMENTAL-Kirova-Yordanova.ppt.
Kongshaug, G. (1998): Energy Consumption and Greenhouse Gas Emissions in Fertilizer Production. Hydro Agri Europe, Norway, 20 July 1998. Http://www.fertilizer.org/ifa/publicat/PDF/1998_biblio_65.pdf.
Koss, U. (2006): Rectisol expands its Scope in China. A brief glance on Lurgi’s syngas-based activities in China presented at GTC Conference 2006. Washington DC, USA, 2006.
Kramer, D.A. (2005): Nitrogen. United States Geological Survey (USGS) Minerals Yearbook 2005, USA, 2005. http:://minerals.usgs.gov/minerals/pubs/commodity/nitrogen/nitromyb05.pdf.
Kramer, D.A. (2002): Nitrogen. USGS Minerals Yearbook 2002, USA, 2002. Http://minerals.usgs.gov/minerals/pubs/commodity/nitrogen/nitromyb02.pdf
Larsen, J., et al. (2003) : Large-scale Hydrogen Plants. Uhde and UOP’s experience. 2003 Spring Meeting, New Orleans, USA, March 30-April 03, 2003. Http://www.uop.com/objects/LgScaleHydroPlnts41b.pdf.
Larson, R. (2005): The Demand Crunch. Submission to Council of Energy Ministers Meeting. St. Andrews, Brunswick, Canada, September 20, 2005. Http://www.cfi.ca/files/PDF/CIEC_CEM_2005-English.PDF.
Li, Z. (2004): Coal-based Ammonia Plants, New Technology and Trend in Ammonia Production in China. IFA Technical Conference, Beijing, China, 20-23 April 2004.
Linneman, L. et al. (2006): Ammonia Chain. University of Wisconsin - Eau Claire, Wisconsin, USA, 17 November 2006. Http://www.uwec.edu/carneymj/Adobe%20handouts/Ammonia%20Chain.pdf.
Lippmann, D., N. Frisse (2004): First Application of the Uhde Dual Pressure Ammonia Process for the 3300 Mtpd Ammonia Plant for SAFCO in Saudi Arabia. IFA Technical Conference, Beijing, China, 20-23 April 2004. Http://www.fertilizer.org/ifa/publicat/PDF/2004_tech_beijing_frisse.pdf.
Maurer, R., U. Bartsch (2001): Enhanced Plant Design for the Production of Azeotropic Nitric Acid. Heraeus Nitric Acid Conference, Johannesburg, South Africa, November 29-30, 2001.
McFarlane, J., S. Robinson: Alternative Feedstocks in Chemicals Manufacturing. Green Chemistry and Green Engineering Conference American Chemical Society, Washington DC, USA, June 27, 2006. Http://www.ornl.gov/~webworks/cppr/y2001/pres/124993.pdf.
Mitsubishi (2004): Brunei Ammonia/Urea Manufacturing Project. Mitsubishi Corporation, Japan, 20 September 2004. Http://www.pivot.com.au/zone_files/PDFs/BruneiConsortiumPresentation.pdf.
NCEP (2004): NCEP Technical Appendix Chapter 4: Expanding Energy Supplies. Energy and Environmental Analysis, Inc., on behalf of National Commission on Energy Policy (NCEP), Arlington, Virginia, USA, May 2004, p. 109.
Nielsen, S.E. (2007a): Future Energy Efficiency and CO2 Reduction Potential. IFA 2007 Technical Committee Meeting - Workshop on Energy Efficiency and CO2 Reduction Prospects in Ammonia Production, 12-14 March 2007, Ho Chi Minh City, Viet Nam.
ECN-E--09-011 41
Nielsen, J.S. (2007b): Energy Efficiency Measures in Fertilizers Sites. IFA 2007 Technical Committee Meeting - Workshop on Energy Efficiency and CO2 Reduction Prospects in Ammonia Production, 12-14 March 2007, Ho Chi Minh City, Viet Nam.
Nieuwlaar, E. (2001): ICARUS-4 - Sector study for the chemical industry. NWS-E-2001-19, Utrecht, The Netherlands, September 2001.
Okuzumi, N. et al. (2001): Start-up of the World Largest Ammonia Plant. Nitrogen 2001, Tampa Bay, Florida, USA, February 18-21, 2001. http://www.topsoe.com/site.nsf/vALLWEBDOCID/KVOO-5PGF6C/$file/Ammonia4-Start-upoftheWorldsLargestAmmoniaPlant.pdf.
Othman Abu Bakhar, S. (1998): Economics of Co-Production of Methanol in Ammonia/Urea Complex. Petronas Fertilizer, Kedah, Malaysia, 1998. Http://www.fertilizer.org/ifa/publicat/PDF/1998_biblio_96.pdf.
Park, M.S., et al. (2002): Oxidative dehydrogenation of ethylbenzene with carbon dioxide over zeolite-supported iron oxide catalysts. Res.Chem.Intermed., Vol. 28, 5, 2002, pp. 461-469.
Prince, A. (2007): Initiating New Projects in the Ammonia Sector. IFA 2007 Technical Committee Meeting - Workshop on Energy Efficiency and CO2 Reduction Prospects in Ammonia Production, 12-14 March 2007, Ho Chi Minh City, Viet Nam.
Rong, M. (2000): The Development of Fertilizer Industry in China. International Workshop on Economic Policy Reforms and Agricultural Input Markets: Experiences, Lessons, and Challenges. Cape Town, South Africa, October 16-20, 2000.
Roos, W.F., et al. (2000): Increasing Ammonia Plant Capacity by Utilizing Purge Gas from Two Adjacent Ammonia Plants. 45th Annual Safety in Ammonia Plants and Related Facilities Symposium, Tucson, Arizona, USA, September 11-14, 2000.
Sukalac, K.E. (2005): Technology Transfer to reduce Climate Change Impacts from the Fertilizer Industry. Knowledge transfer to reduce GHG emissions: lessons from the fertilizer industry. COP11/MOP1 UNFCCC, Montreal, Quebec, Canada, 6 December 2005. Http://regserver.unfccc.int/seors/file_storage/yuq4s8s77zfrj8l.pdf.
Sukumaran Nair, M.P. (2006): Ammonia industry - today and tomorrow. Hydrocarbon Processing, April 2006, pp. 47-55.
Thomas, G., G. Parks (2006): Potential Roles of Ammonia in a Hydrogen Economy. U.S. Department of Energy (DoE), Washington DC, February 2006.
Turk, B.S. et al (2001) : Novel Technologies for Gaseous Contaminants Control. National Energy Technology Laboratory (NETL), Department of Energy, Washington DC, USA, September 2001.
Uhde (2006): Ammonia. Uhde, Dortmund, Germany, 2006. Http://www.uhde.biz/cgi-bin/byteserver.pl/archive/upload/uhde_brochures_pdf_en_5.00.pdf.
USGS (2008): Mineral Commodity Summaries: Nitrogen (fixed) — Ammonia. U.S. Geological Survey (USGS), January 2008. Http://minerals.usgs.gov/minerals/pubs/commodity/nitrogen/mcs-2008-nitro.pdf.
USGS (2004): Mineral Commodity Profiles: Nitrogen. United States Geological Survey (USGS), Open-File Report 2004-1290, 2004.
Verduijn, W., J. de Wit (2001): Energy Conservation: Key to Survival for Fertiliser Producers. The International Fertiliser Society, London, May 10, 2001, ISBN 0 85310 1159.
VKP (2007): Commentaar conceptstudie ammoniakindustrie Nederland. Vereniging van Kunstmest Producenten (VKP), Leidschendam, the Netherlands, B-07-00043-MD, October 2007.
42 ECN-E--09-011
Wiesenberger (2001): State-of-the-art for the Production of Nitric Acid with regard to the IPPC Directive. Umweltbundesamt GmbH (Federal Environment Agency Ltd), Monographien Band 150, Vienna, Austria, 2001.
Williams, G., F. Al-Ansari (2007): IFA Benchmarking of Global Energy Efficiency in Ammonia Production. IFA 2007 Technical Committee Meeting - Workshop on Energy Efficiency and CO2 Reduction Prospects in Ammonia Production, 12-14 March 2007, Ho Chi Minh City, Viet Nam.
Yexin, Y. (2004): Blue Print of CNOOC Oriental Chemical Park: Construction of CNOOC Fertilizers Complex. IFA Technical Conference, Beijing, China, 20-23 April 2004. Http://www.fertilizer.org/ifa/publicat/PDF/2004_tech_beijing_yang_yexin.pdf.
Internet sources
1. Http://www.chemicalprocessing.com/articles/2006/025.html.
2. Http://www.pubs.acs.org/cen/coverstory/83/8340membranes.html.
3. Http://www.physorg.com/news10485.html.
4. Http://www.dis.anl.gov/ceeesa/programs/hydrogen_markets.html.
5. Http://minerals.usgs.gov/minerals/pubs/commodity/nitrogen/nitromcs05.pdf.
6. Http://minerals.usgs.gov/minerals/pubs/commodity/nitrogen/nitromcs06.pdf.
7. Http://www.ipcos.be/news.html (November 7, 2005).
8. Http://www.iffco.nic.in/applications/iffcowebr5.nsf/622a5cc0ab1610f6e52566a500151fbb/4c4c41bda8dce6c7652570c40047bd41?OpenDocument.
9. Http://www.lurgi.com/website/fileadmin/user_upload/pdfs/09_Ammoniak-E.pdf.
10. Http://www.chemlink.com.au/ammonia.htm.
11. Http://www.africafertilizersummit.org/Online_Press_Room/NOTORE.pdf.
12. Http://www.innovations-report.de/html/berichte/unternehmensmeldung/bericht-59615.html.
13. Http://www.cfi.ca/files/publications/facts_and_issues/cfi_issues-energy_FINAL.PDF.
14. Http://minerals.usgs.gov/minerals/pubs/commodity/nitrogen/nitromcs04.pdf.
15. Http://www.epa.gov/nitrousoxide/pdfs/adipic_nitric_n2o.pdf.
16. Http://www.chemicals-technology.com/projects/lovochemie/
17. Http://www.niik.ru/urea-eng.htm.
18. Http://www.cheresources.com/ureamodeling.pdf
19. Http://www.epa.gov/ttn/chief/ap42/ch08/final/c08s02.pdf.
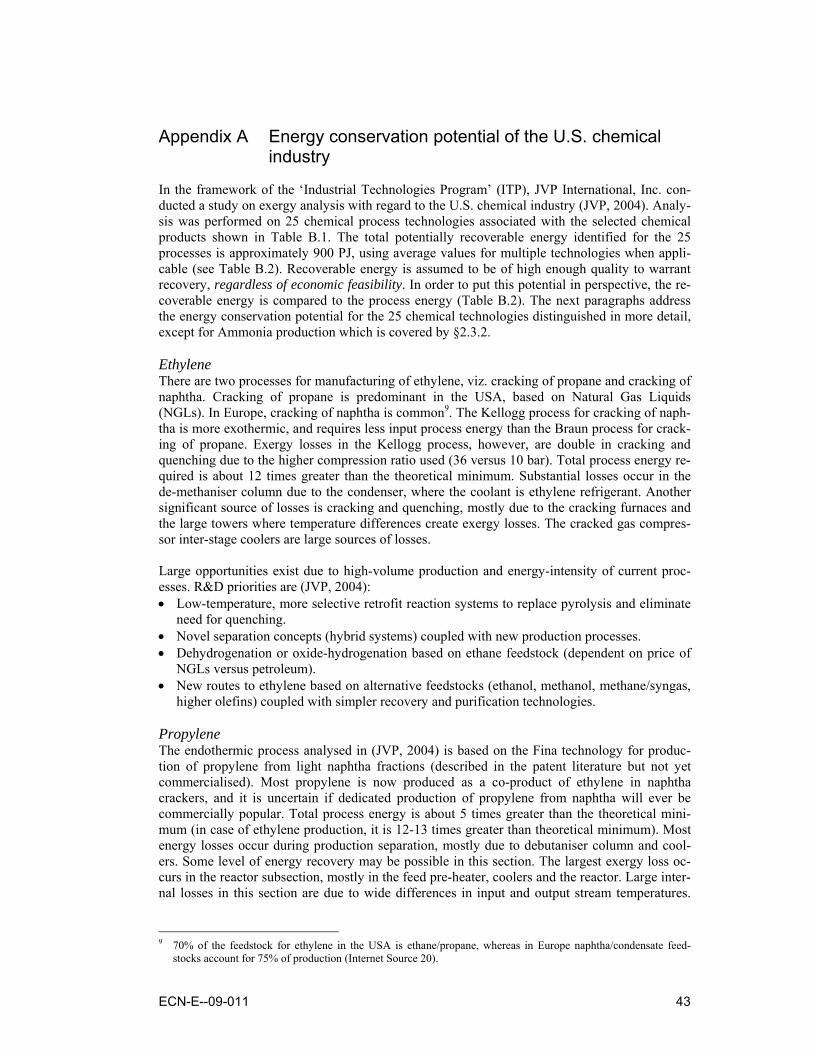
ECN-E--09-011 43
Appendix A Energy conservation potential of the U.S. chemical industry
In the framework of the ‘Industrial Technologies Program’ (ITP), JVP International, Inc. con-ducted a study on exergy analysis with regard to the U.S. chemical industry (JVP, 2004). Analy-sis was performed on 25 chemical process technologies associated with the selected chemical products shown in Table B.1. The total potentially recoverable energy identified for the 25 processes is approximately 900 PJ, using average values for multiple technologies when appli-cable (see Table B.2). Recoverable energy is assumed to be of high enough quality to warrant recovery, regardless of economic feasibility. In order to put this potential in perspective, the re-coverable energy is compared to the process energy (Table B.2). The next paragraphs address the energy conservation potential for the 25 chemical technologies distinguished in more detail, except for Ammonia production which is covered by §2.3.2. Ethylene There are two processes for manufacturing of ethylene, viz. cracking of propane and cracking of naphtha. Cracking of propane is predominant in the USA, based on Natural Gas Liquids (NGLs). In Europe, cracking of naphtha is common9. The Kellogg process for cracking of naph-tha is more exothermic, and requires less input process energy than the Braun process for crack-ing of propane. Exergy losses in the Kellogg process, however, are double in cracking and quenching due to the higher compression ratio used (36 versus 10 bar). Total process energy re-quired is about 12 times greater than the theoretical minimum. Substantial losses occur in the de-methaniser column due to the condenser, where the coolant is ethylene refrigerant. Another significant source of losses is cracking and quenching, mostly due to the cracking furnaces and the large towers where temperature differences create exergy losses. The cracked gas compres-sor inter-stage coolers are large sources of losses. Large opportunities exist due to high-volume production and energy-intensity of current proc-esses. R&D priorities are (JVP, 2004): • Low-temperature, more selective retrofit reaction systems to replace pyrolysis and eliminate
need for quenching. • Novel separation concepts (hybrid systems) coupled with new production processes. • Dehydrogenation or oxide-hydrogenation based on ethane feedstock (dependent on price of
NGLs versus petroleum). • New routes to ethylene based on alternative feedstocks (ethanol, methanol, methane/syngas,
higher olefins) coupled with simpler recovery and purification technologies. Propylene The endothermic process analysed in (JVP, 2004) is based on the Fina technology for produc-tion of propylene from light naphtha fractions (described in the patent literature but not yet commercialised). Most propylene is now produced as a co-product of ethylene in naphtha crackers, and it is uncertain if dedicated production of propylene from naphtha will ever be commercially popular. Total process energy is about 5 times greater than the theoretical mini-mum (in case of ethylene production, it is 12-13 times greater than theoretical minimum). Most energy losses occur during production separation, mostly due to debutaniser column and cool-ers. Some level of energy recovery may be possible in this section. The largest exergy loss oc-curs in the reactor subsection, mostly in the feed pre-heater, coolers and the reactor. Large inter-nal losses in this section are due to wide differences in input and output stream temperatures.
9 70% of the feedstock for ethylene in the USA is ethane/propane, whereas in Europe naphtha/condensate feed-
stocks account for 75% of production (Internet Source 20).
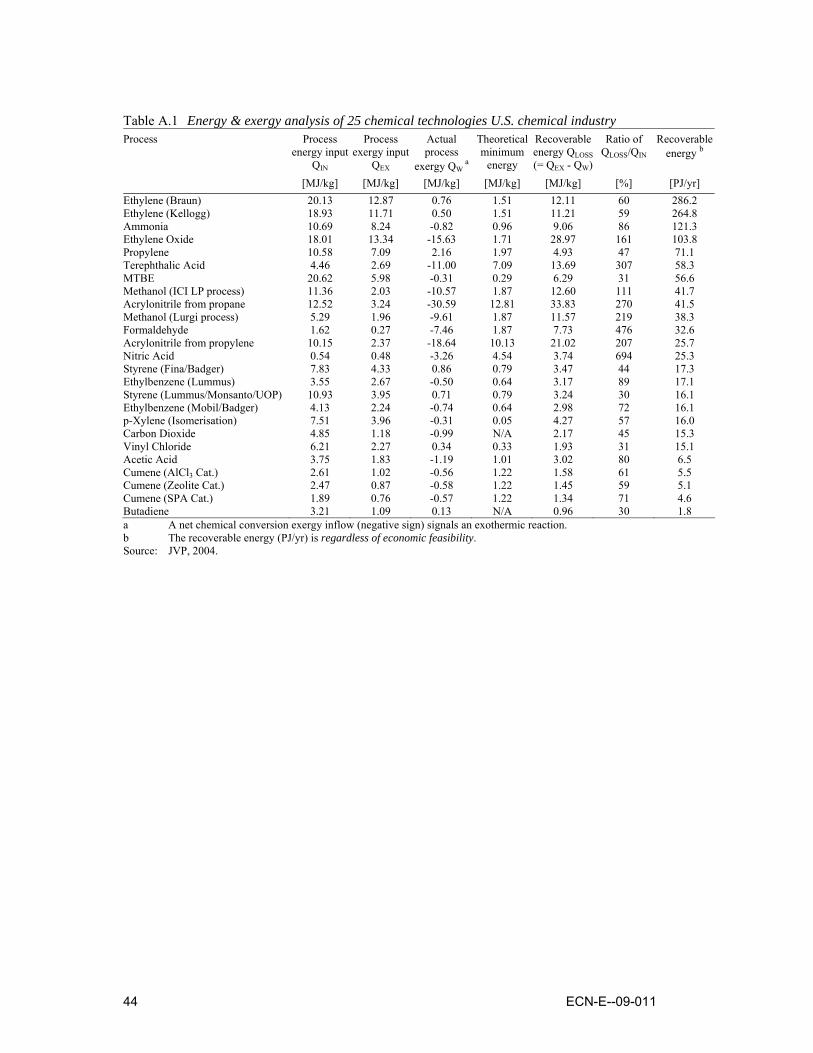
44 ECN-E--09-011
Table A.1 Energy & exergy analysis of 25 chemical technologies U.S. chemical industry Process Process
energy input QIN
Process exergy input
QEX
Actual process
exergy QW a
Theoretical minimum
energy
Recoverable energy QLOSS (= QEX - QW)
Ratio of QLOSS/QIN
Recoverable energy b
[MJ/kg] [MJ/kg] [MJ/kg] [MJ/kg] [MJ/kg] [%] [PJ/yr] Ethylene (Braun) 20.13 12.87 0.76 1.51 12.11 60 286.2 Ethylene (Kellogg) 18.93 11.71 0.50 1.51 11.21 59 264.8 Ammonia 10.69 8.24 -0.82 0.96 9.06 86 121.3 Ethylene Oxide 18.01 13.34 -15.63 1.71 28.97 161 103.8 Propylene 10.58 7.09 2.16 1.97 4.93 47 71.1 Terephthalic Acid 4.46 2.69 -11.00 7.09 13.69 307 58.3 MTBE 20.62 5.98 -0.31 0.29 6.29 31 56.6 Methanol (ICI LP process) 11.36 2.03 -10.57 1.87 12.60 111 41.7 Acrylonitrile from propane 12.52 3.24 -30.59 12.81 33.83 270 41.5 Methanol (Lurgi process) 5.29 1.96 -9.61 1.87 11.57 219 38.3 Formaldehyde 1.62 0.27 -7.46 1.87 7.73 476 32.6 Acrylonitrile from propylene 10.15 2.37 -18.64 10.13 21.02 207 25.7 Nitric Acid 0.54 0.48 -3.26 4.54 3.74 694 25.3 Styrene (Fina/Badger) 7.83 4.33 0.86 0.79 3.47 44 17.3 Ethylbenzene (Lummus) 3.55 2.67 -0.50 0.64 3.17 89 17.1 Styrene (Lummus/Monsanto/UOP) 10.93 3.95 0.71 0.79 3.24 30 16.1 Ethylbenzene (Mobil/Badger) 4.13 2.24 -0.74 0.64 2.98 72 16.1 p-Xylene (Isomerisation) 7.51 3.96 -0.31 0.05 4.27 57 16.0 Carbon Dioxide 4.85 1.18 -0.99 N/A 2.17 45 15.3 Vinyl Chloride 6.21 2.27 0.34 0.33 1.93 31 15.1 Acetic Acid 3.75 1.83 -1.19 1.01 3.02 80 6.5 Cumene (AlCl3 Cat.) 2.61 1.02 -0.56 1.22 1.58 61 5.5 Cumene (Zeolite Cat.) 2.47 0.87 -0.58 1.22 1.45 59 5.1 Cumene (SPA Cat.) 1.89 0.76 -0.57 1.22 1.34 71 4.6 Butadiene 3.21 1.09 0.13 N/A 0.96 30 1.8 a A net chemical conversion exergy inflow (negative sign) signals an exothermic reaction. b The recoverable energy (PJ/yr) is regardless of economic feasibility. Source: JVP, 2004.
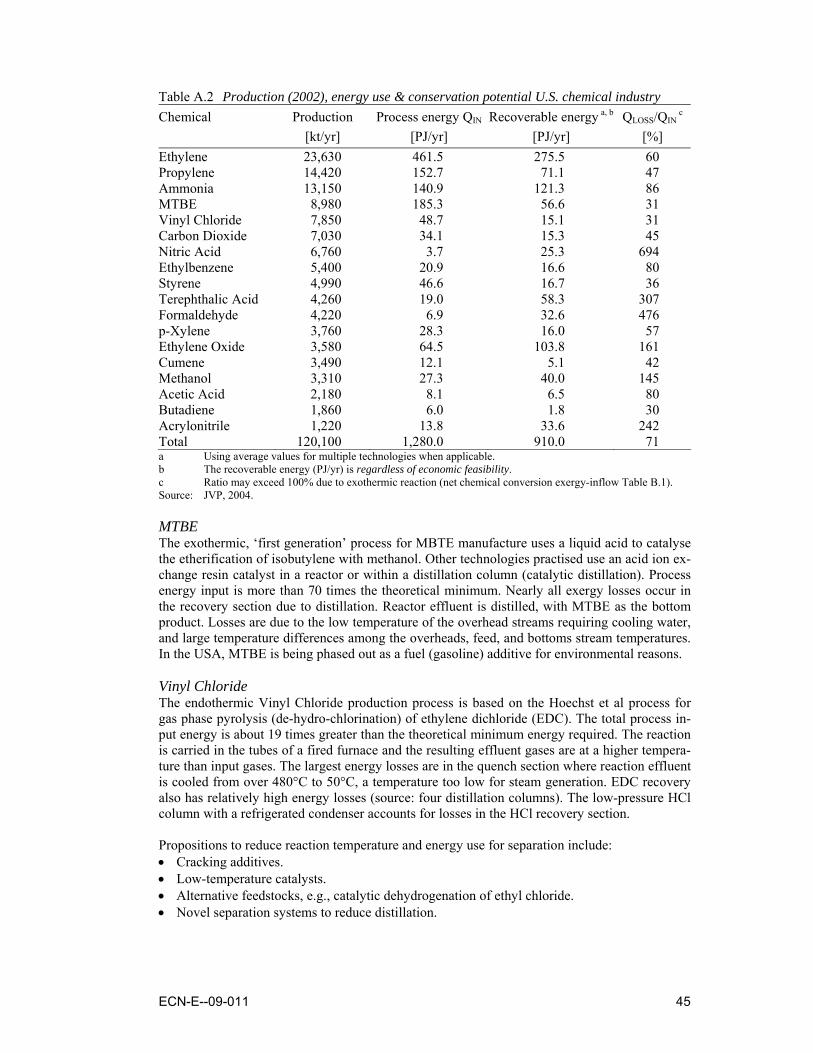
ECN-E--09-011 45
Table A.2 Production (2002), energy use & conservation potential U.S. chemical industry Chemical Production Process energy QIN Recoverable energy a, b QLOSS/QIN
c [kt/yr] [PJ/yr] [PJ/yr] [%] Ethylene 23,630 461.5 275.5 60 Propylene 14,420 152.7 71.1 47 Ammonia 13,150 140.9 121.3 86 MTBE 8,980 185.3 56.6 31 Vinyl Chloride 7,850 48.7 15.1 31 Carbon Dioxide 7,030 34.1 15.3 45 Nitric Acid 6,760 3.7 25.3 694 Ethylbenzene 5,400 20.9 16.6 80 Styrene 4,990 46.6 16.7 36 Terephthalic Acid 4,260 19.0 58.3 307 Formaldehyde 4,220 6.9 32.6 476 p-Xylene 3,760 28.3 16.0 57 Ethylene Oxide 3,580 64.5 103.8 161 Cumene 3,490 12.1 5.1 42 Methanol 3,310 27.3 40.0 145 Acetic Acid 2,180 8.1 6.5 80 Butadiene 1,860 6.0 1.8 30 Acrylonitrile 1,220 13.8 33.6 242 Total 120,100 1,280.0 910.0 71 a Using average values for multiple technologies when applicable. b The recoverable energy (PJ/yr) is regardless of economic feasibility. c Ratio may exceed 100% due to exothermic reaction (net chemical conversion exergy-inflow Table B.1). Source: JVP, 2004. MTBE The exothermic, ‘first generation’ process for MBTE manufacture uses a liquid acid to catalyse the etherification of isobutylene with methanol. Other technologies practised use an acid ion ex-change resin catalyst in a reactor or within a distillation column (catalytic distillation). Process energy input is more than 70 times the theoretical minimum. Nearly all exergy losses occur in the recovery section due to distillation. Reactor effluent is distilled, with MTBE as the bottom product. Losses are due to the low temperature of the overhead streams requiring cooling water, and large temperature differences among the overheads, feed, and bottoms stream temperatures. In the USA, MTBE is being phased out as a fuel (gasoline) additive for environmental reasons. Vinyl Chloride The endothermic Vinyl Chloride production process is based on the Hoechst et al process for gas phase pyrolysis (de-hydro-chlorination) of ethylene dichloride (EDC). The total process in-put energy is about 19 times greater than the theoretical minimum energy required. The reaction is carried in the tubes of a fired furnace and the resulting effluent gases are at a higher tempera-ture than input gases. The largest energy losses are in the quench section where reaction effluent is cooled from over 480°C to 50°C, a temperature too low for steam generation. EDC recovery also has relatively high energy losses (source: four distillation columns). The low-pressure HCl column with a refrigerated condenser accounts for losses in the HCl recovery section. Propositions to reduce reaction temperature and energy use for separation include: • Cracking additives. • Low-temperature catalysts. • Alternative feedstocks, e.g., catalytic dehydrogenation of ethyl chloride. • Novel separation systems to reduce distillation.
46 ECN-E--09-011
Carbon Dioxide (CO2) CO2 is produced by recovery from gas streams where it is a contaminant or by-product. The ma-jority comes from ammonia, H2 or ethylene oxide producing plants. The total process input en-ergy is about 19 times greater than the theoretical minimum energy required. The most common process is absorption via a physical or chemical solvent. (JVP, 2004) models a process where mono ethanolamine (MEA) is used to recover CO2 from power plant flue gas. The CO2 stripper and absorber are large sources of exergy losses. A large exergy loss occurs where hot flue gas is cooled to minimise water content and temperature of flue gas entering the MEA system. Energy recovery could be possible from the associated cooling water recycle, make-up and purge loop. Solvents for recovering CO2 are limited and expensive, and could poison recycle gases. Possible areas for research are (JVP, 2004): • Better solvents, especially adducts. • Novel separations or hybrid separations with membranes, PSA (Appendix A), etc. Nitric Acid The exothermic process for Nitric Acid manufacture is based on a composite of various licensed technologies via oxidation of ammonia to Nitric Oxide (NO) and ultimately Nitric Acid. The total process input energy is less than the theoretical minimum due to significant energy genera-tion made possible by the exothermic reaction. The largest exergy losses are in the heat recovery section, which appears to have considerable additional capacity for energy recovery. In addition, most nitric acid plants utilised a steam turbine and gas expander to drive one or more compres-sors. Energy losses in the reaction section are due primarily to the nitric acid absorber, which performs the absorption of Nitrogen Dioxide (NO2) in water while reacting it to form Nitric Acid, generating heat in the process. The heat of reaction is taken out in the partial condenser of the absorber, usually with refrigeration. Large internal exergy losses are due mostly to extreme temperature differences between feed and effluent streams and other exchanged streams in the system (gas coolers, steam super-heaters, evaporators). A stagnant Nitric Acid market gives little incentive for R&D. Current processes practise signifi-cant heat recovery. Lower temperature catalysts for ammonia oxidation could be an R&D area. Ethylbenzene There are two ethylbenzene production processes: the vapour-phase Mobil/Badger and the Lummus process. In the most energy-efficient one, the Lummus process, ethylbenzene is pro-duced via liquid-phase benzene alkylation, and the front end of the process differs considerably from the Mobil/Badger process. The reaction systems differ substantially in operating tempera-ture as well as phase of reaction. After the reaction system the processes are very similar. The total process energy input is about 6 times greater than the theoretical minimum (8 times for Mobil/Badger). The benzene fractionator accounts for most exergy losses, similar to the Mo-bil/Badger technology. This column processes both fresh feed and recycle benzene, and its large condenser operates at a low temperature, inhibiting economic energy recovery. There is some opportunity for medium- to low-pressure steam export from the alkylation reactor. Ethylbenzene is used exclusively for the production of styrene, and synergies should be consid-ered, as well as the possibility of finding alternative feedstocks for producing styrene. The cur-rent process is relatively efficient; finding more active catalysts to lower the alkylation tempera-ture would be a useful future research area. Styrene There are two processes for styrene production, viz. the Lummus/Monsanto/UOP and the Fina/Badger process. The most energy efficient of the two, the Fina/Badger process, is an endo-thermic process that is very similar to the Lummus process, except for modest differences in the reactor section. Total process energy input is about 10 times greater than the theoretical mini-
ECN-E--09-011 47
mum. The largest energy losses are found in air coolers used to condense and cool the reactor effluent, although the quality of the energy lost is relatively low. The feed preheat is the source of significant exergy losses due to high temperature differences in reactor effluent exchangers and in the dehydrogenation reactors. Losses also occur in the ethylbenzene/styrene stripper col-umn, which must be operated under vacuum, and the large condenser load is removed with cooling water at too low a temperature for heat recovery. The Lummus process uses a higher steam/ethylbenzene ratio than the Fina/Badger technology, and requires higher energy input. However, the Lummus process recovers low-temperature heat from the ethylbenzene/styrene stripper and exergy losses are lower than those in the Fina/Badger unit operation. The current high-temperature endothermic reaction requires preheating of feed and cooling of effluents with relatively high energy burdens. R&D to reduce energy use includes (JVP, 2004): • Liquid phase lower temperature process with continuous removal of hydrogen. • Novel separation technologies to remove hydrogen. • Process using diluents other than steam. • Alternative feedstock process. A process substituting CO2 as a soft oxidant for CO2 has been proposed by (Park et al, 2002). Catalytic activity is reported to be greatly improved using zeolite-supported iron oxide catalysts. Terephthalic Acid This exothermic process is based on Amoco technology for producing Purified Terephthalic Acid (PTA) via oxidation of p-xylene. It is a complex, energy- and exergy-intensive process. Purification requirements are critical and the current process yields are high. Total process en-ergy input is about twice that of theoretical minimum energy requirements. Large exergy losses occur in the reaction system, mostly due to process irreversibilities associated with the wide range in temperatures and compositions of the various feed streams and the effluent. The oxida-tion reactor is a main source of losses. In crystallisation, the solvent dehydrator is a primary source of losses. Condensers and slurry vessels account for losses during purification. The high selectivity of the current catalyst system limits the interest in seeking new approaches to produc-ing PTA. Current research is concentrated on further improvements to product purification. Purification requirements are critical and current yields are approaching stoichiometricity. Puri-fication and catalyst recovery, both complex and energy-intensive, could be improved: • Novel separation schemes for solvent recovery and dehydration and for refining/purifying
PTA (Purified Terephthalic Acid). • Process requiring less corrosive solvent. • Entirely new concepts for producing PTA. Formaldehyde This exothermic process produces formaldehyde from methanol using a silver-based catalyst, and is based on BASF technology. Total process energy-input is about 4 times greater than theo-retical minimum energy requirements. In this relatively simple process configuration, the low temperature quench of the reactor effluent is responsible for most of the energy consumption as well as energy and exergy losses. The very large driving forces around the exothermic reactor contribute to the substantial internal exergy losses. According to (JVP, 2004), it is uncertain what the process of choice will be for formaldehyde production (mixed-oxide versus silver catalyst). Possible improvements are: • More selective, longer-life catalysts. • New ways to recover formaldehyde (without polymerisation).
48 ECN-E--09-011
p-Xylene The process for p-xylene manufacture is based on conventional production from a mixture of C8 aromatic isomers (p-xylene, o-xylene, m-xylene, ethylbenzene). The isomerisation reaction is endothermic, but chemical conversion is exothermic due to side reactions. The total process en-ergy-input is 600 times greater than the theoretical minimum due based on isomerisation of a p-xylene-depleted xylene mixture. Energy losses are comparable between isomerisation and frac-tionation, but exergy losses are much higher in isomerisation due to large temperature differen-tials between inlet and outlet streams to the reactors and feed pre-heaters. The low external ex-ergy loss indicates little opportunity for further energy recovery in isomerisation. In fractiona-tion, the produce cooler is the largest source of losses. The process temperatures in this cooler are high enough to suggest steam generation or cross-exchange would save energy. Considerable energy recovery is already practised. New opportunities include (JVP, 2004): • New separation technologies, e.g., removing p-xylene during isomerisation. • Couple p-xylene process with downstream terephthalic acid process to achieve reductions in
energy use (e.g., unique catalyst for oxidation). Ethylene Oxide The exothermic process for Ethylene Oxide (EO) based on Shell technology is based on direct oxidation of ethylene with oxygen. EO plants also produce ethylene glycol in an integrated flow sheet. The process as modelled has half of the product EO as an aqueous stream. This has con-tributed to unusually high energy and exergy losses. In addition, the process couples the up-stream stripping column condenser with the purification column condenser, creating a very large condensing load at too low a temperature for energy recovery. This may not be common practice. Process energy is about 10 times theoretical minimum energy requirements. The EO purification unit accounts for 91% of energy- and 19% of exergy losses. In the stripper section, high internal exergy losses are due to heat exchangers and columns in the recirculating water loop. Relatively low temperatures result in little opportunity for heat recovery. Internal losses could be reduced by larger heat exchangers. Large internal losses in the reactor section area due to large temperature differentials in the inlet gas and exothermic conditions in the reactor. EO technology must operate at low per pass conversion to maintain selectivity and to control the reaction gas composition outside the flammable region. New processes/process routes are: • Fluidised bed reactors. • Liquid-phase (LP) oxidations, LP process using hydro-peroxide or hydrogen peroxide. • Bioxidation of ethylene. • Processes for richer EO-containing streams to reduce large recycle. • Novel separations for richer EO streams, including carbonate system. Cumene There are three processes for Cumene production, among which a Solid Phosphoric Acid (SPA) catalysed process and a Zeolite catalysed one. The most energy efficient (exothermic) process is based on propylene alkylation of benzene with a Solid Phosphoric Acid (SPA) catalyst (UOP design). Total process energy input is about 1.5 times greater than the theoretical minimum. The largest energy losses occur in air coolers, primarily due to their low temperatures. Virtually all energy and exergy losses occur in Cumene recovery, primarily due to three distillation columns. Additional energy recovery is possible from the Cumene fractionator, but may not be economi-cal. There may be opportunity for feed preheating in the alkylation section. All Cumene goes to production of phenol and acetone (JVP, 2004). Demand for phenol is not balanced with demand for acetone (often sold at distress prices). The result is a major thrust to find alternative processes to produce phenol that do not require propylene or produce acetone. Related research topics include alternative (or one-step) routes to phenol and integration with bisphenolA processes.
ECN-E--09-011 49
Methanol The main processes for methanol production are the ICI low-pressure and the Lurgi process. The Lurgi process utilises a combined reforming process with two stages of reforming in series, the second with oxygen injection. The heat recovery section exhibits the greatest external ex-ergy losses and indicates potential for low-temperature energy recovery. The methanol column in the refining section also makes a large contribution to energy losses. Condenser steam gen-eration could reduce energy losses. Relatively large losses are also attributed to a process ex-changer and combustion furnace in the reforming section, and to methanol reactors, condensers and air coolers in the synthesis section. The process exchanger is a candidate for steam genera-tion with substantial energy recovery. The combustion furnace has a lower energy loss but the high external energy ratio suggests the possible use of a waste heat boiler to recover energy. Ex-ergy losses occur in the reforming and heat recovery sections due to the wide range of inlet and outlet temperatures involved. Preheating the feed within the reactor system is the source of large internal exergy losses in the synthesis section due to large temperature differences. Expectations for building methanol plants in the USA are not high. Innovations could include: • Liquid phase processes for methanol production. • Better process technologies for production of synthesis gas. • Improved catalysts, including biocatalysts. • Alternative feedstocks (methane, biomass). • Novel separation technologies to reduce distillation. Acetic Acid The process analysed is the Acetica Process developed by Chiyoda and UOP that is similar to other acetic acid facilities based on carbonylation of methanol. Differences are the bubble col-umn reactor design that eliminates the agitator, and the immobilisation of the catalyst onto solid particles rather than being dissolved in reaction medium. No commercial plants using this tech-nology are currently operating. The total process input energy is about 4 times greater than the theoretical minimum. Acetic acid refining accounts for the largest exergy-losses, primarily due to the crude fractionator. The overhead temperature of the column is too low to reasonably re-cover the energy in condenser cooling water. Large internal exergy losses are due to large tem-perature, pressure and composition differences of the streams leaving the column. Large internal exergy losses are also present in the carbonylation reactor, due to large temperature, pressure and composition differences among the recycle, feed methanol and carbon monoxide streams. Catalyst research continues to improve acetic acid production. Other research needs are: • Novel separations to improve carbonylation routes (e.g., separation of gases from carbonyla-
tion reaction, supplementation of distillation). • Alternative routes (oxidation of butane, ethylene-based, oxidative dehydrogenation of eth-
ane). • Acetic acid from biomass via chemical or bio-catalysis. Butadiene The Nippon Zeon process is based on extractive distillation with DMF solvent to recover buta-diene from mixed C4 streams (butane and derivatives, viz. butene, butylene, butadiene). This is a separation process with no chemical reaction, so no theoretical minimum is given. Distillation columns (butadiene stripping column, butene extractive column, propylene and butadiene prod-uct columns) account for large exergy losses in extractive and conventional distillation. The large internal exergy losses reflect wide differences in the composition and temperature of inlet and outlet streams. Large energy losses are due to refrigeration used for condensation in some cases. Most of the column condensers are operating at temperatures too low for energy recov-ery, except the acetylenes stripping column, where reuse of heat of condensation is possible.
50 ECN-E--09-011
Almost all butadiene is present in C4 streams from refineries and steam crackers. Improvements could be made in methods of separating butadiene from butane/butane/butadiene mixtures (new solvents, hybrid systems, membranes, PSA). Acrylonitrile The process analysed for acrylonitrile (ACN) production is the exothermic propylene ammoxi-dation process which occurs at high temperatures. This process is based on SOHIO-BP fluidized bed technology, which is now used predominantly. The total process energy input is approxi-mately the same as the theoretical minimum energy required (considerable energy is produced by the exothermic reaction). About 45% of energy losses are recoverable heat and refrigeration of process effluent streams. The largest exergy losses occur in the heat and refrigeration section, primarily due to effects of refrigeration cycles needed to separate the product and by-products at low temperatures. A large source of losses in the ammoxidation section is the quench column overhead cooler, although most exergy losses occur as internal losses in the ammoxidation reac-tors due to the large number of input and output steams at widely different temperatures. In-creased heat exchange to increase the cold feed temperatures could reduce these irreversibilities, if economic. Most of the losses in the ACN separation are due to the HCN stripper column and condenser, which is cooled with refrigeration and is very energy-intensive. Conversion to ACN requires a rapid quench of reaction gases to lower temperatures with a complex separation scheme (with refrigeration). Novel ideas to reduce the energy intensity are: • Fluidised beds. • Recycle process with substitution of oxygen for air. • Bio-catalytic production of ACN.