Embed Size (px)
Citation preview

Department of Primary Industries and Fisheries Queensland QI 06004 ISSN 0727-6273 ISBN 0 7345 03377
The Department of Primary Industries and Fisheries (DPI&F) seeks to maximise the economic potential of Queensland’s primary industries on a sustainable basis.
This publication provides a summary of physical and financial data from 157 dairy farms in Northern Australia that use the Queensland Dairy Accounting Scheme. It provides background information for farmers, agribusiness and advisers who have an interest in profitable and sustainable dairy production systems.
While every care has been taken in preparing this publication, the State of Queensland accepts no responsibility for decisions or actions taken as a result of any data, information, statement or advice, expressed or implied, contained in this report.
© The State of Queensland, Department of Primary Industries and Fisheries 2006
Copyright protects this publication. The State of Queensland has no objection to this material being reproduced but asserts its right to be recognised as author of its original material and the right to have its material remain unaltered.
Copyright enquiries should be addressed to: Manager, DPI&F Publications Department of Primary Industries and Fisheries GPO Box 46 Brisbane Qld 4001
Data enquiries should be addressed to: Graeme Busby Department of Primary Industries and Fisheries 203 Tor Street PO Box 102 TOOWOOMBA QLD 4350 Australia Phone +61 7 4688 1254 Fax +61 7 4688 1477 Email: [email protected]
QI 06004 ISSN 0727-6273 ISBN 0 7345 03377
Balancing dairy production and profits
in Northern Australia
QDAS Financial and production trends – 2005
Compiled by
Graeme Busby, Toowoomba Geoff Hetherington, Mutdapilly Ross Itzstein, Nambour Ray Murphy, Toowoomba
Department of Primary Industries and Fisheries 2006
QDAS 2004-2005 i
Contents Objectives...................................................................................................................................................... 1 Acknowledgements ....................................................................................................................................... 1
1. Introduction ............................................................................................................ 2
2. Analysis of results (2002–2005) .............................................................................. 3 2.1 Major industry findings – Business traits (2004–2005) .......................................................................... 3 2.2 Major findings for farmers (2004–2005) ................................................................................................ 4
3. Regional trends in farm financial performance (2004–2005) ............................ 5 3.1 South east Queensland ............................................................................................................................ 5 3.2 North Queensland.................................................................................................................................... 6 3.3 Central Queensland ................................................................................................................................. 6 3.4 Northern New South Wales .................................................................................................................... 7
4. Drivers of farm production and profitability (2004–2005) ................................. 7 4.1 Characteristics of the farms with the highest operating profit per cow................................................... 7 4.2 Increasing production per cow ................................................................................................................ 8 4.3 Increasing herd size................................................................................................................................. 9 4.4 Milk production from home–grown feed .............................................................................................. 10 4.5 Strategic nitrogen fertiliser application ................................................................................................. 11 4.6 Increasing the stocking rate................................................................................................................... 11
5. Other results from 2004–2005............................................................................. 12 5.1 Calculating total production costs ......................................................................................................... 12 5.2 Capital efficiency .................................................................................................................................. 13 5.3 Administration costs.............................................................................................................................. 14 5.4 Labour resources ................................................................................................................................... 14
Appendices ................................................................................................................. 16 1 Map of farm performance – top 25% of farms (2004–2005) ................................................................... 17 2 Group cash gross margin – 157 QDAS farms (2004–2005) .................................................................... 18 3 Group cash gross margin – South-east Queensland (2004–2005) ........................................................... 19 4 Group cash gross margin – Central Queensland (2004–2005)................................................................. 20 5 Group cash gross margin – North Queensland (2004–2005) ................................................................... 21 6 Group cash gross margin – Northern New South Wales (2004–2005) .................................................... 22 7 Business traits, key performance indicators and definitions .................................................................... 23
QDAS 2004-2005 ii
Tables Table 1. Financial and performance ratios for the top 25% and the average QDAS farm (2002–2005).......... 3 Table 2. Regional trends in KPI over four years in SEQ, CQ, NQ and NNSW (2002 to 2005) ...................... 5 Table 3. KPI for top 25 percent of farms (2004-2005) ..................................................................................... 7 Table 4. KPI for 5 per cow production groups (2004-2005) ............................................................................ 8 Table 5. Proportion of energy intake partitioned for maintenance and milk production .................................. 9 Table 6. KPI for farms in 5 production groups (2004-2005) .......................................................................... 10 Table 7. Production per cow from home-grown feed (2004-2005) ............................................................... 10 Table 8. Target milk yields from forage ........................................................................................................ 10 Table 9. The effect of nitrogen fertiliser use on production (2004-2005) ...................................................... 11 Table 10. Production costs on QDAS farms – profit analysis (2004–2005)................................................... 12 Table 11. Production costs for QDAS farms – cash analysis (2004–2005).................................................... 13 Table 12. Land, plant and stock valuations for QDAS dairy farms (2004–2005) .......................................... 13 Table 13. Administration costs for farms with increasing annual production (2004-2005) ........................... 14 Table 14. Imputed labour / management allowance calculation (2004-2005)................................................ 14 Table 15. Regional labour statistics (2004-2005) ........................................................................................... 14 Table 16. Business traits and key performance indicators (2004-2005)......................................................... 23
Figures Figure 1. The relationship between production per cow and the margin over feed costs (2002–2005) ........... 9 Figure 2. The relationship between stocking rate, milk yield and margins (2004 –2005).............................. 12
QDAS 2004-2005 1
Objectives The objectives of this book are to:
• Provide Queensland Dairy Accounting Scheme (QDAS) participants with a summary of physical and financial data from South-east Queensland (SEQ), Central Queensland (CQ), North Queensland (NQ) and Northern New South Wales (NNSW). This will give dairy farming families/enterprises information that will enable them to make more informed business decisions.
• Act as a resource guide for local advisers, consultants and other industry service personnel who wish to encourage positive change.
• Provide background material for industry participants negotiating with banks, governments, suppliers or other agents.
Acknowledgements The authors wish to thank all cooperating farmers who supplied data and provided valuable feedback in discussion groups held during late 2005.
The QDAS group also acknowledges the support and effort provided by the field staff from the major dairy processors and officers of the Department of Agriculture in New South Wales.
We would also like to specifically acknowledge the support of the Subtropical Dairy Program Ltd for funding the publication of this report.
Graeme. J. Busby Project Leader
Queensland Dairy Accounting Scheme Department of Primary Industries and Fisheries January 2006

QDAS 2004-2005 2
1. Introduction This report contains physical and financial data from 157 farms and includes data from all dairy regions in Queensland and northern New South Wales. For the purpose of this report, the area is called the Northern Australia dairy region, and this area is serviced by the Subtropical Dairy group.
The farms in northern New South Wales have production systems similar to those of coastal dairy farms in South east Queensland. It is estimated that the region produced approximately 771 million litres of milk from 1120 farms in 2004–2005.
Participation in the Queensland dairy accounting scheme (QDAS) is voluntary; results and trends need to be interpreted carefully as QDAS farms have larger herds and produce more milk per farm.
Section 2 presents a summary of results. Four business traits – liquidity, solvency, profitability and efficiency are used to measure farm performance. The results for these traits are presented using 16 key performance indicators (KPI).
Section 3 details the trends from 85 farms that have contributed data over four continuous years. Analysis of their data gives a more accurate reflection of changes in the Northern Australian dairy industry since deregulation.
Section 4 and 5 present detailed financial analyses of all farms, examining trends and highlighting practices designed to improve both cashflow and profit. The cost of production is calculated in cash and on a profit basis.
The appendices contain summary reports from all regions.
QDAS 2004-2005 3
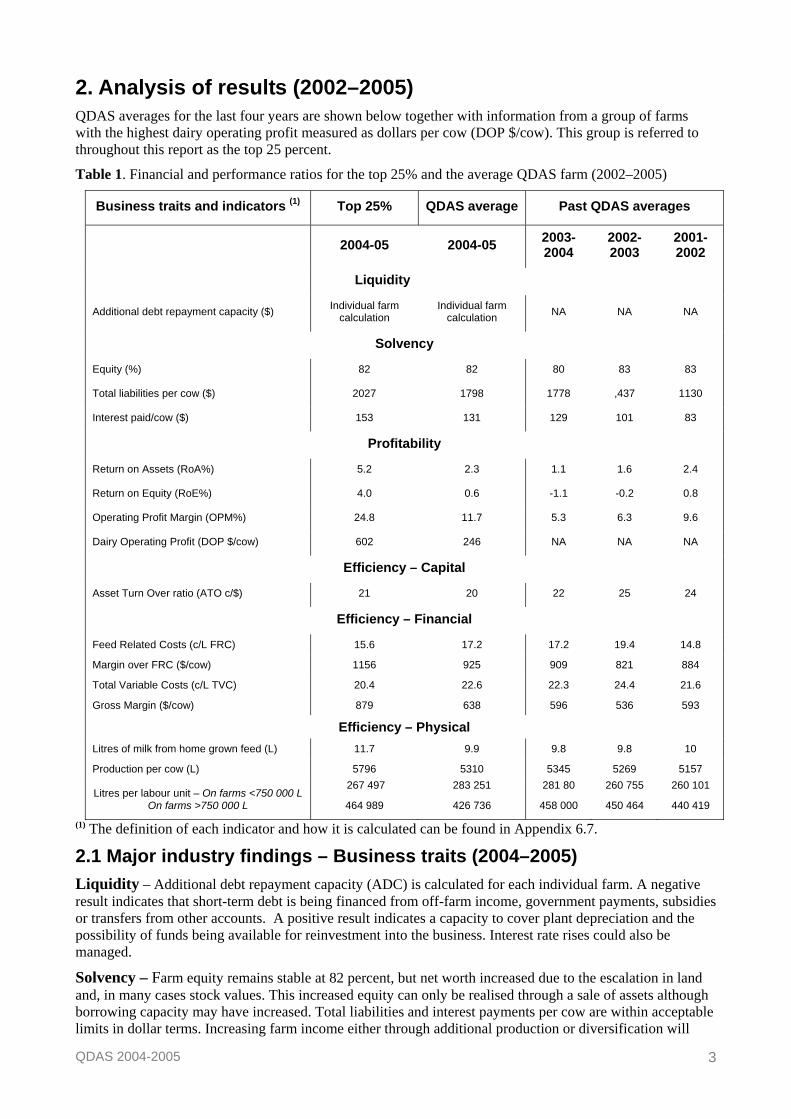
2. Analysis of results (2002–2005) QDAS averages for the last four years are shown below together with information from a group of farms with the highest dairy operating profit measured as dollars per cow (DOP $/cow). This group is referred to throughout this report as the top 25 percent.
Table 1. Financial and performance ratios for the top 25% and the average QDAS farm (2002–2005)
Business traits and indicators (1) Top 25% QDAS average Past QDAS averages
2004-05 2004-05 2003-2004
2002-2003
2001-2002
Liquidity
Additional debt repayment capacity ($) Individual farm calculation
Individual farm calculation NA NA NA
Solvency
Equity (%) 82 82 80 83 83
Total liabilities per cow ($) 2027 1798 1778 ,437 1130
Interest paid/cow ($) 153 131 129 101 83
Profitability
Return on Assets (RoA%) 5.2 2.3 1.1 1.6 2.4
Return on Equity (RoE%) 4.0 0.6 -1.1 -0.2 0.8
Operating Profit Margin (OPM%) 24.8 11.7 5.3 6.3 9.6
Dairy Operating Profit (DOP $/cow) 602 246 NA NA NA
Efficiency – Capital
Asset Turn Over ratio (ATO c/$) 21 20 22 25 24
Efficiency – Financial
Feed Related Costs (c/L FRC) 15.6 17.2 17.2 19.4 14.8
Margin over FRC ($/cow) 1156 925 909 821 884
Total Variable Costs (c/L TVC) 20.4 22.6 22.3 24.4 21.6
Gross Margin ($/cow) 879 638 596 536 593
Efficiency – Physical Litres of milk from home grown feed (L) 11.7 9.9 9.8 9.8 10
Production per cow (L) 5796 5310 5345 5269 5157
Litres per labour unit – On farms <750 000 L On farms >750 000 L
267 497
464 989
283 251
426 736
281 80
458 000
260 755
450 464
260 101
440 419
(1) The definition of each indicator and how it is calculated can be found in Appendix 6.7.
2.1 Major industry findings – Business traits (2004–2005) Liquidity – Additional debt repayment capacity (ADC) is calculated for each individual farm. A negative result indicates that short-term debt is being financed from off-farm income, government payments, subsidies or transfers from other accounts. A positive result indicates a capacity to cover plant depreciation and the possibility of funds being available for reinvestment into the business. Interest rate rises could also be managed.
Solvency – Farm equity remains stable at 82 percent, but net worth increased due to the escalation in land and, in many cases stock values. This increased equity can only be realised through a sale of assets although borrowing capacity may have increased. Total liabilities and interest payments per cow are within acceptable limits in dollar terms. Increasing farm income either through additional production or diversification will

QDAS 2004-2005 4
ensure the payments remain manageable. The top group of farms had higher debt per cow and interest costs per cow.
Profitability – Business profits as measured by RoA and RoE were unacceptably low at 2.3 and 0.6 percent. Asset valuations affect these results; in QDAS the average valuation using opening and closing details is used. It is more meaningful to calculate OPM, and on average this was 11.7 percent; the top group achieved a result for OPM of 24.8 percent, which would be attractive to investors interested in dairying. The percentage OPM is the amount of profit generated from each dollar of income.
Efficiency – Total variable costs increased by 0.3 cents per litre in 2005. The reduction in grain and concentrate prices were largely negated by rising fuel and fertiliser input costs. Inflationary pressures on inputs such as fertiliser, fuel and equipment repairs will continue to negate efficiency gains. However, better seasons and increases in water entitlements for irrigation farms will be positively reflected. By making improvements in feed utilisation and adopting new technology in feed production, animal and milking management gains can be made.
The average farm could increase per cow production by 500 to 1,000 litres economically given that the production per cow from home–grown feed is just below 10 litres per cow per day. The top farms produced approximately 500 litres more from home–grown feed. Increasing farm production and paying particular attention to optimising inputs will ensure a profitable dairying operation is achieved.
2.2 Major findings for farmers (2004–2005) • Operating profit margin expressed per cow and as a percentage of income has been included on
profit maps this year. These indicators show the profits generated irrespective of farm and herd size. The top 25 percent had an OPM per cow of $602.
• The average cash cost of production was 38.0 cents per litre whereas top farms produced milk for 35.0 cents per litre. This cash cost included a living allowance of $45,000. The major differences were in cattle sales, feed costs and production per cow.
• Across Northern Australia there are quite marked differences in milk returns and gross margins. Even so, there were very successful farmers in all regions.
• Eighty five farms have continuous data for four years; their results are included in Section 3. In Queensland herd size has stabilised but, in NNSW, these farms have continued to increase their herd numbers. In NQ and CQ, production per cow increased significantly.
• Major differences between farms can be identified in the following areas – production per cow, fertiliser use, size of operations, home–grown feed utilisation. The top 25 percent of farms had higher per cow production (+665 litres), their margin over feed related costs was higher (+$455) even through the feed costs per cow were similar. They produced more milk from pasture (61 compared to 55 percent) than the remaining 75 percent of farms.
• Farms with cows producing 6000-7000 litres (6304 litres on average) had a high margin over feed costs per cow ($1056), a high gross margin per farm ($129 403) and the highest dairy operating profit at $348 per cow.
• Farms producing in excess of 1.25 million litres recorded high production per cow (>5800 litres), the highest margins, and highest labour use efficiency milking almost 100 cows per labour unit.
• In all regions, farms with highest production from pastures had the highest dairy operating profit per cow.
• In high rainfall areas, farms in the high nitrogen fertiliser group (average 141 units of nitrogen per cow) had the highest gross margin and litres produced from low–cost pasture. Optimum fertiliser use combined with higher stocking rates has always proven to be economical.
• Land accounts for 72 percent of the total asset with livestock making up just 11 percent of the asset value. The high land prices contribute to net worth but impact negatively on the return on asset calculation. For this reason, a range of KPI should be used to monitor business performance.
• Only small savings in overhead costs per litre (0.5 to 1.0 cent) are evident as production increases.

QDAS 2004-2005 5
3. Regional trends in farm financial performance (2004–2005) Participation in QDAS is voluntary so the farm data collated is not a random sample of industry data. In fact, the average QDAS farm produces 263 000 litres of milk more annually than the average north Australian dairy farm. From the cooperating group in 2005, 85 farms have a minimum four years past data. To highlight the real trends on this group since deregulation their data is shown in tables below.
General comments:
• In 2005, total variable costs on these farms accounted for a large proportion of the gross milk income – 57 cents (CQ), 61 cents (SEQ), 71 cents (NNSW) and 68 cents in (NQ) of each dollar of milk income.
• The data would suggest that on average, farmers have reduced their total variable costs as much as possible. Twenty-two cents per litre may be the base variable cost. The general rise in input costs over time for fuel, fertiliser and repairs appears to negate the possible gains in efficiency.
• Land values increased in all areas. While the cash position, as measured by additional debt repayment capacity remains tight for many farmers, the higher land values will be reflected by an improvement in net worth on the balance sheet.
In SEQ: • Farm production has increased to 947 867 litres (11 percent) over the period, as a result of an
increase in herd size with 18 additional milkers; production per cow is relatively unchanged.
• Feed related and total variable costs show a small increase over the period.
• Dairy operating profit per cow was $298 – a disappointing result with little change over the period.
Table 2. Regional trends in KPI over four years in SEQ, CQ, NQ and NNSW (2002 to 2005)
3.1 South east Queensland 2001-2002 2002-2003 2003-2004 2004-2005
Total milk income (c/L) 32.8 34.5 34.1 34.9
Average herd size 155 167 170 173
PPC (L) 5525 5220 5396 5479
FRC (c/L) 14.7 18.0 15.4 16.4
TVC (c/L) 20.0 22.9 20.8 21.4
Gross margin (c/L) 12.7 11.6 13.3 13.6
Equity (%) 87 85 87 86
RoA (%) 3.2 3.0 3.9 2.5
OPM (%) 14.4 12.8 18.7 13.7
DOP ($/cow) 285 266 340 298
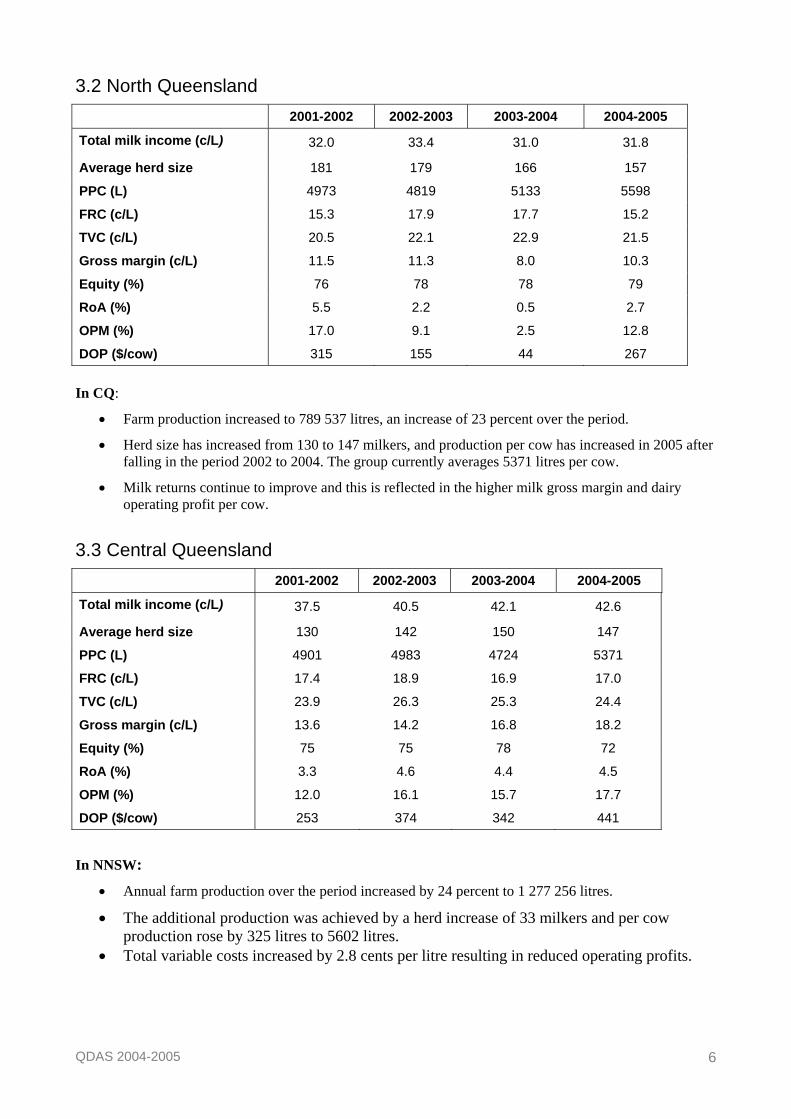
In NQ:
• Milk production was 900 113 litres in 2005. The table shows a decline in cow numbers but a rise in production per cow of 625 litres.
• Feed and other variable costs were contained in 2005 at 15.2 and 21.5 cents per litre, while milk returns were similar per litre to those received in 2002. Milk income per cow was $1780. Dairy operating profit margins were higher than those in the last two years.
QDAS 2004-2005 6
3.2 North Queensland 2001-2002 2002-2003 2003-2004 2004-2005
Total milk income (c/L) 32.0 33.4 31.0 31.8
Average herd size 181 179 166 157
PPC (L) 4973 4819 5133 5598
FRC (c/L) 15.3 17.9 17.7 15.2
TVC (c/L) 20.5 22.1 22.9 21.5
Gross margin (c/L) 11.5 11.3 8.0 10.3
Equity (%) 76 78 78 79
RoA (%) 5.5 2.2 0.5 2.7
OPM (%) 17.0 9.1 2.5 12.8
DOP ($/cow) 315 155 44 267
In CQ:
• Farm production increased to 789 537 litres, an increase of 23 percent over the period.
• Herd size has increased from 130 to 147 milkers, and production per cow has increased in 2005 after falling in the period 2002 to 2004. The group currently averages 5371 litres per cow.
• Milk returns continue to improve and this is reflected in the higher milk gross margin and dairy operating profit per cow.
3.3 Central Queensland
2001-2002 2002-2003 2003-2004 2004-2005
Total milk income (c/L) 37.5 40.5 42.1 42.6
Average herd size 130 142 150 147
PPC (L) 4901 4983 4724 5371
FRC (c/L) 17.4 18.9 16.9 17.0
TVC (c/L) 23.9 26.3 25.3 24.4
Gross margin (c/L) 13.6 14.2 16.8 18.2
Equity (%) 75 75 78 72
RoA (%) 3.3 4.6 4.4 4.5
OPM (%) 12.0 16.1 15.7 17.7
DOP ($/cow) 253 374 342 441
In NNSW: • Annual farm production over the period increased by 24 percent to 1 277 256 litres.
• The additional production was achieved by a herd increase of 33 milkers and per cow production rose by 325 litres to 5602 litres.
• Total variable costs increased by 2.8 cents per litre resulting in reduced operating profits.
QDAS 2004-2005 7
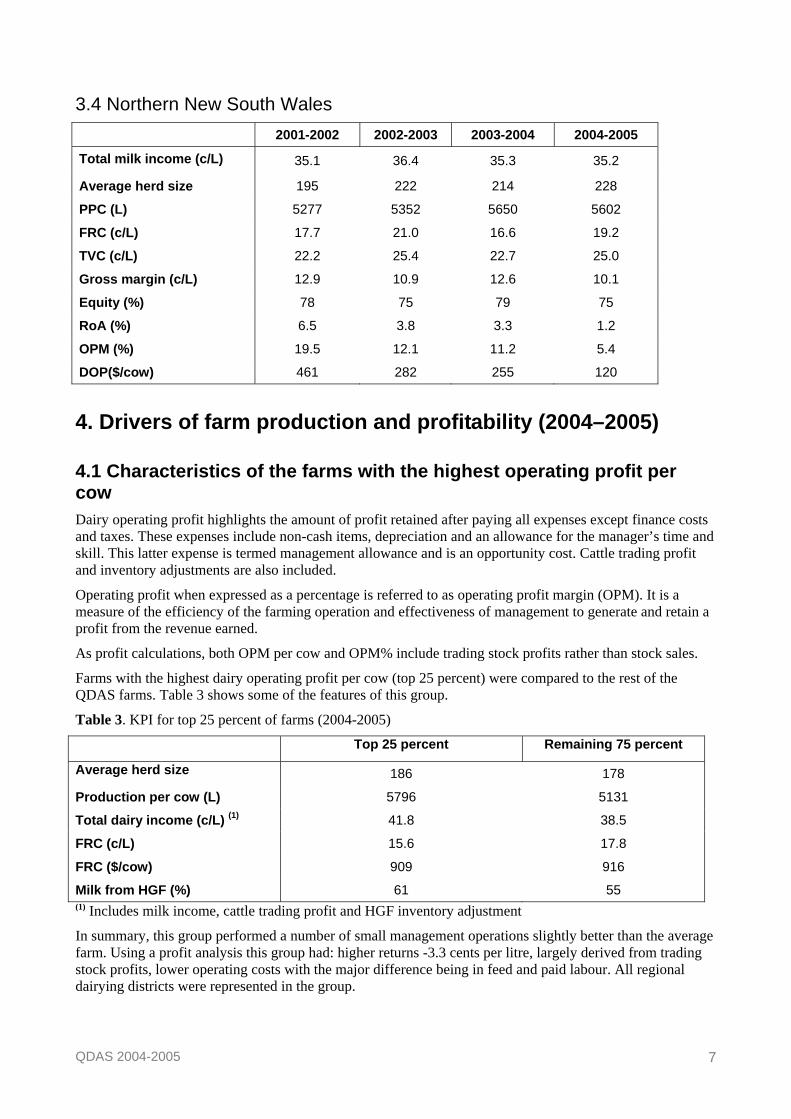
3.4 Northern New South Wales
2001-2002 2002-2003 2003-2004 2004-2005
Total milk income (c/L) 35.1 36.4 35.3 35.2
Average herd size 195 222 214 228
PPC (L) 5277 5352 5650 5602
FRC (c/L) 17.7 21.0 16.6 19.2
TVC (c/L) 22.2 25.4 22.7 25.0
Gross margin (c/L) 12.9 10.9 12.6 10.1
Equity (%) 78 75 79 75
RoA (%) 6.5 3.8 3.3 1.2
OPM (%) 19.5 12.1 11.2 5.4
DOP($/cow) 461 282 255 120
4. Drivers of farm production and profitability (2004–2005) 4.1 Characteristics of the farms with the highest operating profit per cow Dairy operating profit highlights the amount of profit retained after paying all expenses except finance costs and taxes. These expenses include non-cash items, depreciation and an allowance for the manager’s time and skill. This latter expense is termed management allowance and is an opportunity cost. Cattle trading profit and inventory adjustments are also included.
Operating profit when expressed as a percentage is referred to as operating profit margin (OPM). It is a measure of the efficiency of the farming operation and effectiveness of management to generate and retain a profit from the revenue earned.
As profit calculations, both OPM per cow and OPM% include trading stock profits rather than stock sales.
Farms with the highest dairy operating profit per cow (top 25 percent) were compared to the rest of the QDAS farms. Table 3 shows some of the features of this group.
Table 3. KPI for top 25 percent of farms (2004-2005)
Top 25 percent Remaining 75 percent
Average herd size 186 178
Production per cow (L) 5796 5131
Total dairy income (c/L) (1) 41.8 38.5
FRC (c/L) 15.6 17.8
FRC ($/cow) 909 916
Milk from HGF (%) 61 55 (1) Includes milk income, cattle trading profit and HGF inventory adjustment
In summary, this group performed a number of small management operations slightly better than the average farm. Using a profit analysis this group had: higher returns -3.3 cents per litre, largely derived from trading stock profits, lower operating costs with the major difference being in feed and paid labour. All regional dairying districts were represented in the group.

QDAS 2004-2005 8
To raise production and increase margins, QDAS results indicate consideration should be given to the following:
• increasing production per cow • increasing the utilisation of home grown feed • nitrogen fertiliser use • stocking rates • expanding the size of the farming operation • Quality and use of farm assets.
4.2 Increasing production per cow The detailed operational costs obtained from farmers has provided information that consistently shows that as you improve a cow’s diet, thereby utilising her genetic potential, you increase the margin over feed costs, the gross margin per cow and per farm. This was certainly true as per cow production increased to 6300 litres. There may be a limit however to increasing production using high cost supplements. The comment has been made in the past that when returns are based on international export milk prices, high input dairy systems may be unprofitable. There is also evidence that production costs in the tropics are higher than in temperate areas of Australia. If changing to a high input system it is essential to maximise home-grown feed utilisation and produce large volumes of milk, in an industry with low margins. In Table 4, data for 2004-2005 is presented which highlights the effects of increasing per cow production. In QDAS the number of milking cows plus the dry cows is totalled to determine the milking herd size. This calculation assumes a twelve-month inter-calving interval. Herds with inter-calving intervals of 13 or 14 months will find that their average production in QDAS reports is lower than that reported in herd recording reports. This difference could be as high as 600 litres per cow in some herds; the QDAS calculation method will have more impact in high per cow producing herds with long inter-calving intervals. Points to note in this table:
• Milk income in cents per litre does not have a significant impact on the differences in margins between the groups.
• Large herds can achieve high production per cow. • While the margin over feed related costs per litre fluctuated on a per litre basis, the margin per cow
increased from $565 to $1179. The gross margin per farm followed a similar trend. There were only a limited number of herds producing in excess of 7000 litres; the data tends to indicate that efficiency is lost in this high production group. However, the QDAS calculation of cow numbers as described above may have an impact.
• Dairy operating profit per cow and per farm increased steadily as production per cow increased to 6300 litres.
Table 4. KPI for 5 per cow production groups (2004-2005)
Production group <4000 L 4-5000 L 5-6000 L 6-7000 L >7000 L
No of farms 22 40 53 29 13
Litres (L) 490 490 8747787 957 255 1 144 568 1 633 061
Average herd size 148 188 174 181 222
Production/cow (L) 3312 4504 5471 6304 7330
Total milk income (c/L) 33.7 34.3 35.7 34.3 33.7
Margin over FRC (c/L) 17.0 16.9 18.8 16.7 16.0
Margin over FRC/cow ($) 565 761 1029 1056 1179
Gross margin/cow ($) 362 503 718 749 840
Gross margin/farm ($) 53 530 96 125 125 806 129 403 178 704
DOP (EBIT -$/farm) 13 898 45 000 47 431 63 120 37 945
DOP ($/cow) 94 239 273 348 171
QDAS 2004-2005 9
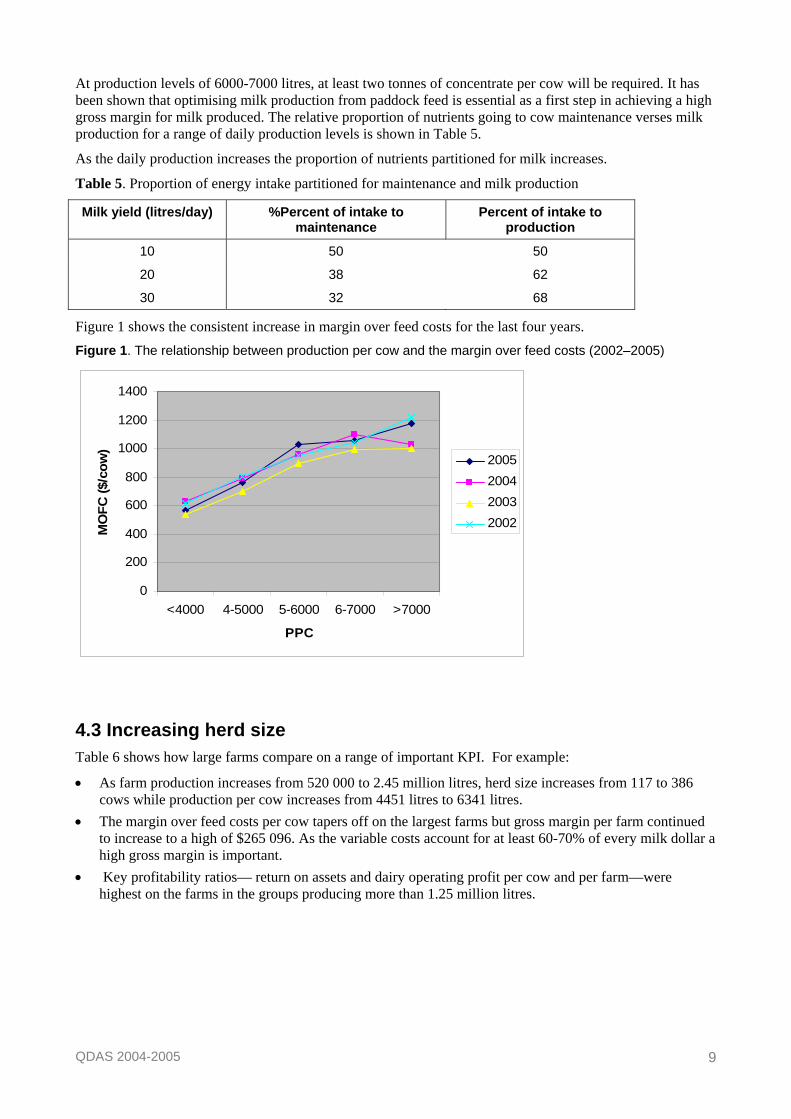
At production levels of 6000-7000 litres, at least two tonnes of concentrate per cow will be required. It has been shown that optimising milk production from paddock feed is essential as a first step in achieving a high gross margin for milk produced. The relative proportion of nutrients going to cow maintenance verses milk production for a range of daily production levels is shown in Table 5.
As the daily production increases the proportion of nutrients partitioned for milk increases.
Table 5. Proportion of energy intake partitioned for maintenance and milk production
Milk yield (litres/day) %Percent of intake to maintenance
Percent of intake to production
10 50 50
20 38 62
30 32 68
Figure 1 shows the consistent increase in margin over feed costs for the last four years. Figure 1. The relationship between production per cow and the margin over feed costs (2002–2005)
0
200
400
600
800
1000
1200
1400
<4000 4-5000 5-6000 6-7000 >7000
PPC
MO
FC ($
/cow
)
2005200420032002
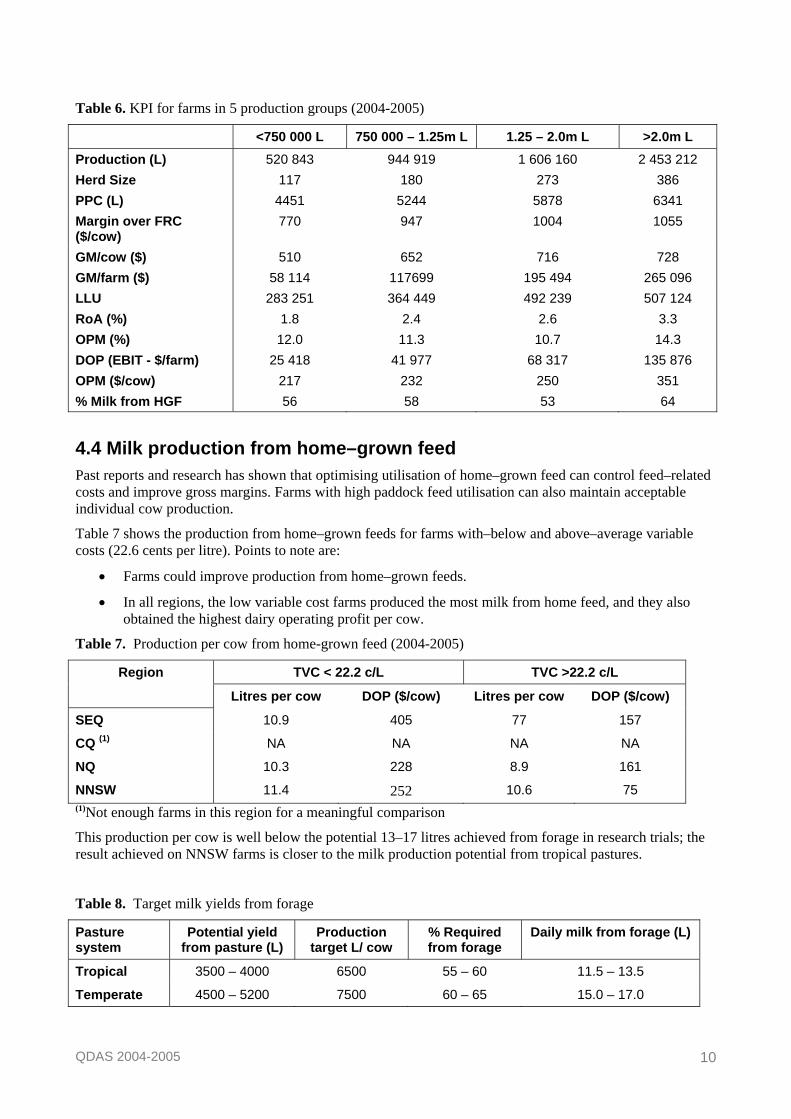
4.3 Increasing herd size Table 6 shows how large farms compare on a range of important KPI. For example:
• As farm production increases from 520 000 to 2.45 million litres, herd size increases from 117 to 386 cows while production per cow increases from 4451 litres to 6341 litres.
• The margin over feed costs per cow tapers off on the largest farms but gross margin per farm continued to increase to a high of $265 096. As the variable costs account for at least 60-70% of every milk dollar a high gross margin is important.
• Key profitability ratios— return on assets and dairy operating profit per cow and per farm—were highest on the farms in the groups producing more than 1.25 million litres.
QDAS 2004-2005 10
Table 6. KPI for farms in 5 production groups (2004-2005)
<750 000 L 750 000 – 1.25m L 1.25 – 2.0m L >2.0m L Production (L) 520 843 944 919 1 606 160 2 453 212 Herd Size 117 180 273 386 PPC (L) 4451 5244 5878 6341 Margin over FRC ($/cow)
770 947 1004 1055
GM/cow ($) 510 652 716 728 GM/farm ($) 58 114 117699 195 494 265 096 LLU 283 251 364 449 492 239 507 124 RoA (%) 1.8 2.4 2.6 3.3 OPM (%) 12.0 11.3 10.7 14.3 DOP (EBIT - $/farm) 25 418 41 977 68 317 135 876 OPM ($/cow) 217 232 250 351 % Milk from HGF 56 58 53 64
4.4 Milk production from home–grown feed Past reports and research has shown that optimising utilisation of home–grown feed can control feed–related costs and improve gross margins. Farms with high paddock feed utilisation can also maintain acceptable individual cow production.
Table 7 shows the production from home–grown feeds for farms with–below and above–average variable costs (22.6 cents per litre). Points to note are:
• Farms could improve production from home–grown feeds.
• In all regions, the low variable cost farms produced the most milk from home feed, and they also obtained the highest dairy operating profit per cow.
Table 7. Production per cow from home-grown feed (2004-2005)
TVC < 22.2 c/L TVC >22.2 c/L Region
Litres per cow DOP ($/cow) Litres per cow DOP ($/cow)
SEQ 10.9 405 77 157
CQ (1) NA NA NA NA
NQ 10.3 228 8.9 161
NNSW 11.4 252 10.6 75 (1)Not enough farms in this region for a meaningful comparison
This production per cow is well below the potential 13–17 litres achieved from forage in research trials; the result achieved on NNSW farms is closer to the milk production potential from tropical pastures.
Table 8. Target milk yields from forage
Pasture system
Potential yield from pasture (L)
Production target L/ cow
% Required from forage
Daily milk from forage (L)
Tropical 3500 – 4000 6500 55 – 60 11.5 – 13.5
Temperate 4500 – 5200 7500 60 – 65 15.0 – 17.0
QDAS 2004-2005 11
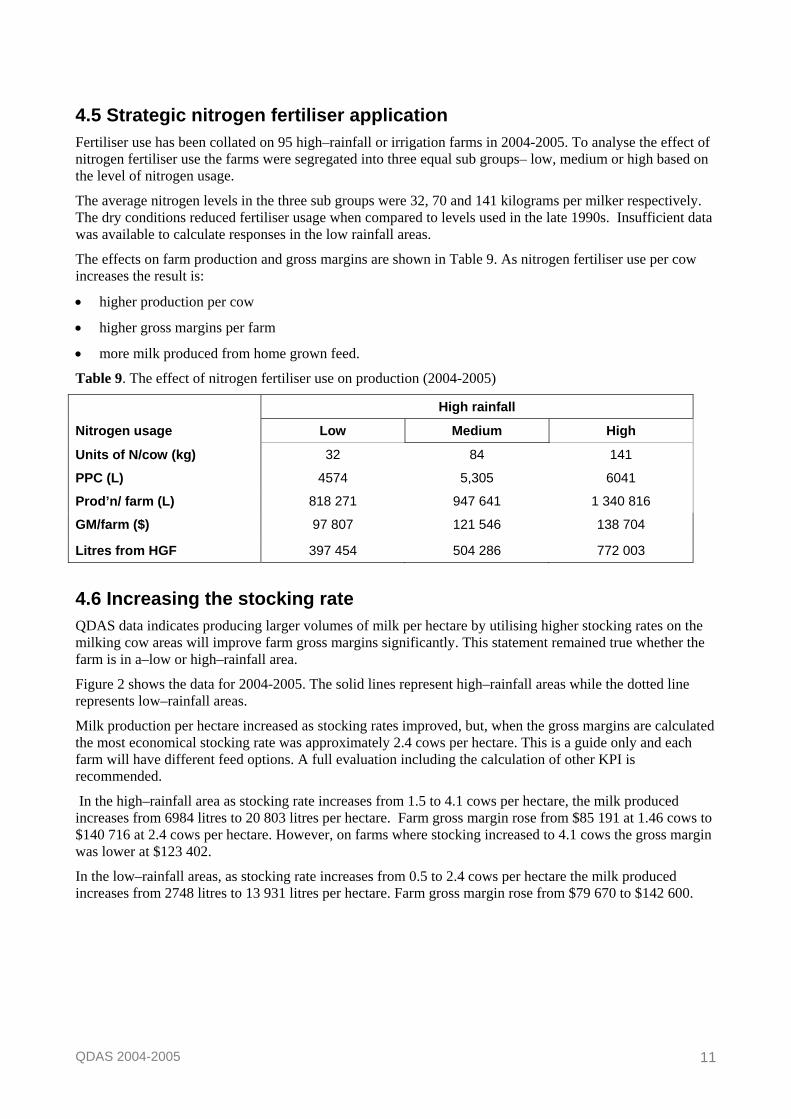
4.5 Strategic nitrogen fertiliser application Fertiliser use has been collated on 95 high–rainfall or irrigation farms in 2004-2005. To analyse the effect of nitrogen fertiliser use the farms were segregated into three equal sub groups– low, medium or high based on the level of nitrogen usage.
The average nitrogen levels in the three sub groups were 32, 70 and 141 kilograms per milker respectively. The dry conditions reduced fertiliser usage when compared to levels used in the late 1990s. Insufficient data was available to calculate responses in the low rainfall areas.
The effects on farm production and gross margins are shown in Table 9. As nitrogen fertiliser use per cow increases the result is:
• higher production per cow
• higher gross margins per farm
• more milk produced from home grown feed.
Table 9. The effect of nitrogen fertiliser use on production (2004-2005)
High rainfall
Nitrogen usage Low Medium High
Units of N/cow (kg) 32 84 141
PPC (L) 4574 5,305 6041
Prod’n/ farm (L) 818 271 947 641 1 340 816
GM/farm ($) 97 807 121 546 138 704
Litres from HGF 397 454 504 286 772 003
4.6 Increasing the stocking rate QDAS data indicates producing larger volumes of milk per hectare by utilising higher stocking rates on the milking cow areas will improve farm gross margins significantly. This statement remained true whether the farm is in a–low or high–rainfall area.
Figure 2 shows the data for 2004-2005. The solid lines represent high–rainfall areas while the dotted line represents low–rainfall areas.
Milk production per hectare increased as stocking rates improved, but, when the gross margins are calculated the most economical stocking rate was approximately 2.4 cows per hectare. This is a guide only and each farm will have different feed options. A full evaluation including the calculation of other KPI is recommended.
In the high–rainfall area as stocking rate increases from 1.5 to 4.1 cows per hectare, the milk produced increases from 6984 litres to 20 803 litres per hectare. Farm gross margin rose from $85 191 at 1.46 cows to $140 716 at 2.4 cows per hectare. However, on farms where stocking increased to 4.1 cows the gross margin was lower at $123 402.
In the low–rainfall areas, as stocking rate increases from 0.5 to 2.4 cows per hectare the milk produced increases from 2748 litres to 13 931 litres per hectare. Farm gross margin rose from $79 670 to $142 600.

QDAS 2004-2005 12
Figure 2. The relationship between stocking rate, milk yield and margins (2004 –2005)
0
5000
10000
15000
20000
25000
0 1 2 3 4 5
Stocking Rate (Cows/ha)
Milk
(l/h
a)
0
20000
40000
60000
80000
100000
120000
140000
160000
GM
($/fa
rm)HR - M
LR - M
LR - GM
HR - GM
5. Other results from 2004–2005 5.1 Calculating total production costs The calculation of profit includes the following non-cash items — adjustments to the purchased feed stocks, plant depreciation and management allowance; while on the income side, adjustments are made for the use and or increase in the home–grown feed inventory. Consideration is given to the opening and closing cattle inventory, sales and purchases to arrive at the cattle trading profit.
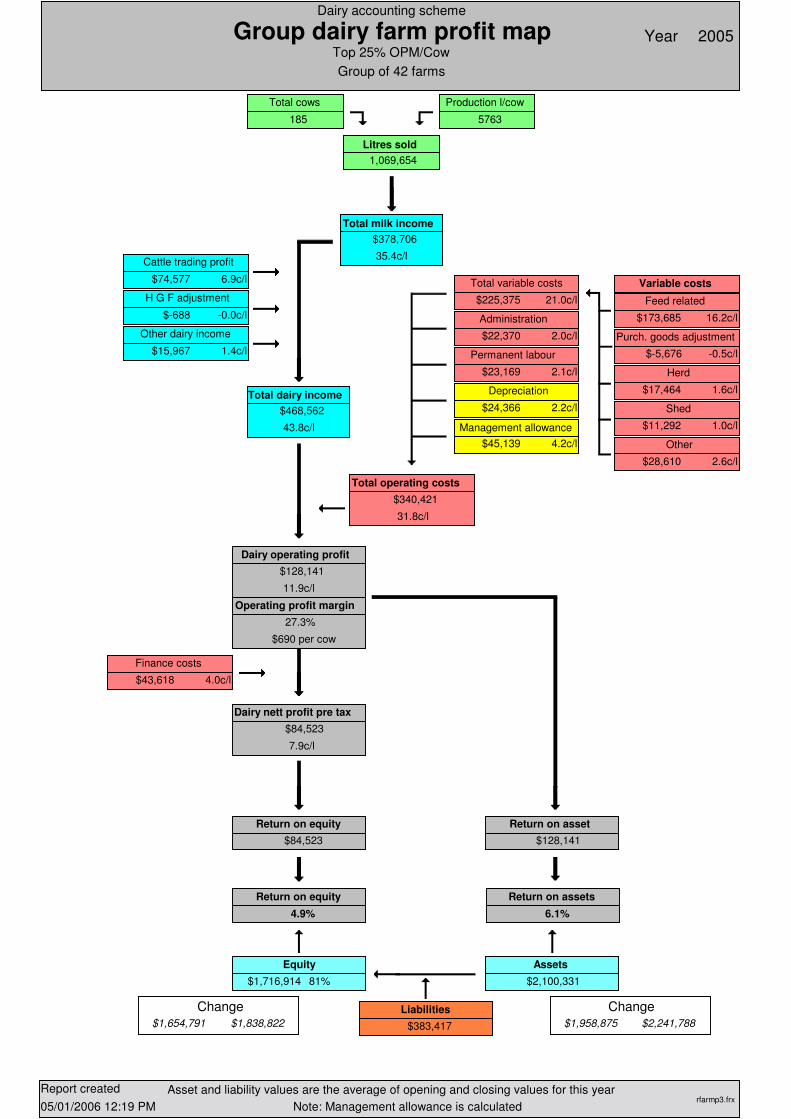
A profit map showing the QDAS result for the top 25 percent of farms in 2005 is included as Appendix 1. The map shows how QDAS calculates profit; this format follows national benchmarking guidelines.
If the return on asset is below the benchmark or target set for your farm, it is simply a matter of tracing back up the map to isolate the areas where your result differs from your predetermined target and formulating a plan to correct the problem area. The calculations in the map are in total dollars but by dividing by the annual production (litres), or by the number of milkers or labour units a value per litre, per cow or per labour unit is possible. Tables 10 and 11 show the cash cost and the cost as determined in a profit analyses for 2004-2005.
Table 10. Production costs on QDAS farms – profit analysis (2004–2005)
Average Top 25% farms
Average return (c/L) (1) 39.5 41.8
Total variable cost (c/L) (2) 22.6 20.4
Administration costs (c/L) 2.4 2.0
Paid labour costs (c/L) 3.0 2.4
Imputed labour (c/L) (3) 4.5 4.1
Depreciation costs (c/L) 2.3 2.2
Finance costs (c/L) 3.6 3.8
Total production costs (c/L) 38.6 35.2
(1) Average return in a profit analysis includes – milk income, cattle trading profit and HGF changes (2) Purchased feed inventory changes are included in these figures (3) Imputed labour is calculated using the formula shown in Table 14
QDAS 2004-2005 13
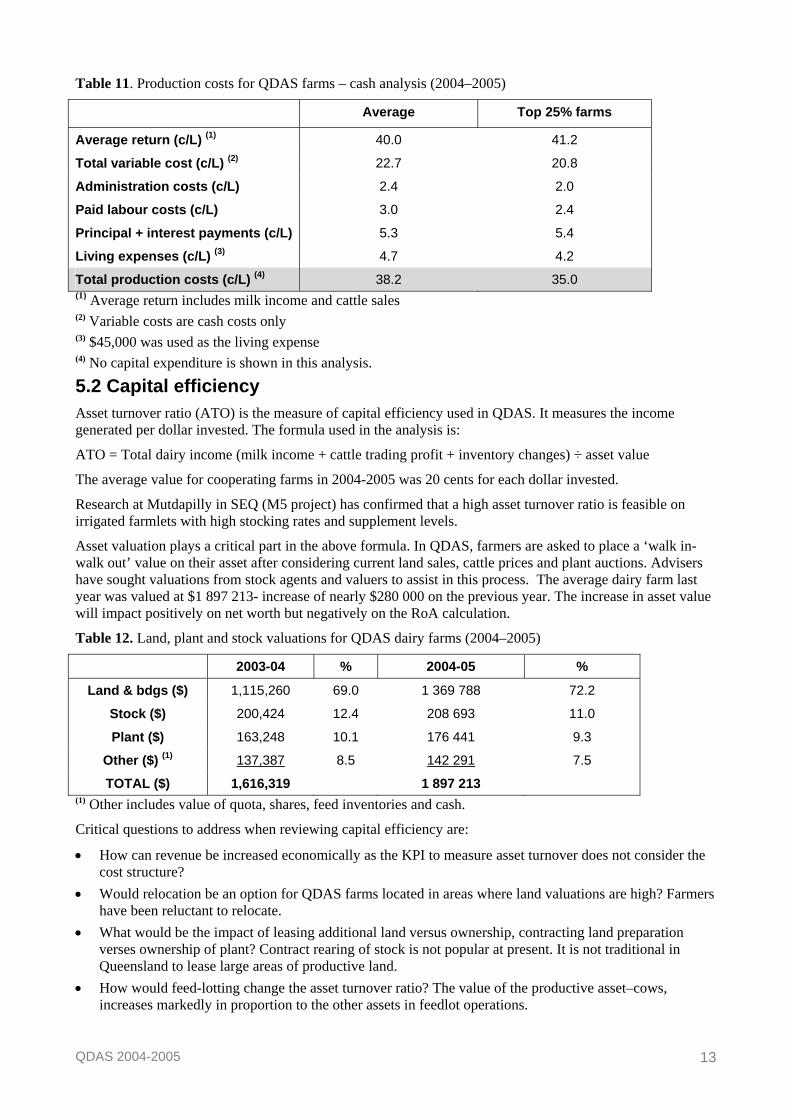
Table 11. Production costs for QDAS farms – cash analysis (2004–2005)
Average Top 25% farms
Average return (c/L) (1) 40.0 41.2
Total variable cost (c/L) (2) 22.7 20.8
Administration costs (c/L) 2.4 2.0
Paid labour costs (c/L) 3.0 2.4
Principal + interest payments (c/L) 5.3 5.4
Living expenses (c/L) (3) 4.7 4.2
Total production costs (c/L) (4) 38.2 35.0 (1) Average return includes milk income and cattle sales (2) Variable costs are cash costs only (3) $45,000 was used as the living expense (4) No capital expenditure is shown in this analysis.
5.2 Capital efficiency Asset turnover ratio (ATO) is the measure of capital efficiency used in QDAS. It measures the income generated per dollar invested. The formula used in the analysis is:
ATO = Total dairy income (milk income + cattle trading profit + inventory changes) ÷ asset value
The average value for cooperating farms in 2004-2005 was 20 cents for each dollar invested.
Research at Mutdapilly in SEQ (M5 project) has confirmed that a high asset turnover ratio is feasible on irrigated farmlets with high stocking rates and supplement levels.
Asset valuation plays a critical part in the above formula. In QDAS, farmers are asked to place a ‘walk in-walk out’ value on their asset after considering current land sales, cattle prices and plant auctions. Advisers have sought valuations from stock agents and valuers to assist in this process. The average dairy farm last year was valued at $1 897 213- increase of nearly $280 000 on the previous year. The increase in asset value will impact positively on net worth but negatively on the RoA calculation.
Table 12. Land, plant and stock valuations for QDAS dairy farms (2004–2005)
2003-04 % 2004-05 %
Land & bdgs ($) 1,115,260 69.0 1 369 788 72.2
Stock ($) 200,424 12.4 208 693 11.0
Plant ($) 163,248 10.1 176 441 9.3
Other ($) (1) 137,387 8.5 142 291 7.5
TOTAL ($) 1,616,319 1 897 213 (1) Other includes value of quota, shares, feed inventories and cash.
Critical questions to address when reviewing capital efficiency are:
• How can revenue be increased economically as the KPI to measure asset turnover does not consider the cost structure?
• Would relocation be an option for QDAS farms located in areas where land valuations are high? Farmers have been reluctant to relocate.
• What would be the impact of leasing additional land versus ownership, contracting land preparation verses ownership of plant? Contract rearing of stock is not popular at present. It is not traditional in Queensland to lease large areas of productive land.
• How would feed-lotting change the asset turnover ratio? The value of the productive asset–cows, increases markedly in proportion to the other assets in feedlot operations.
QDAS 2004-2005 14
• What benchmark is appropriate for Queensland and NNSW? Is asset turnover a worthwhile key performance indicator?
5.3 Administration costs Administration includes the following costs: accountancy, rates, registration of farm vehicles, insurance, telephone and associated office expenses, repairs to permanent improvements and membership of professional organisations. The average administration cost across all 157 farms in QDAS was $23 009 or 2.4 c/L. Administration is a fixed expense and hence gets proportionately lower per litre as farms expand production.(Table 13).
Table 13. Administration costs for farms with increasing annual production (2004-2005)
Annual production <750,000 L 750 –1.25 m L 1.25-2.0 m L >2.0 m L
Administration (c/L) 3.0 2.4 2.1 1.9
Administration ($) 16 935 22 817 33 752 47 325
5.4 Labour resources The number of labour units contributing to the milk production was recorded under two headings in 2005:
• unpaid permanent labour – the farm owners • paid labour – casual and permanent.
Paid labour costs include superannuation contributions, taxation and workers compensation payments. Average regional labour information, paid labour plus the opportunity cost of the owners/managers labour is summarised in Table 15.
Table 14. Imputed labour / management allowance calculation (2004-2005)
Large farms would now have to pay more than $54 000 for a competent manager.
Table 15. Regional labour statistics (2004-2005)
Region No of units paid + unpaid
Cost paid + imputed
Average litres produced per labour unit
SEQ 0.9 + 1.6 $28 399 + $43 467 = $71 866 376 179
CQ 0.8 +1.6 $22 339 + $43 380 = $65 719 345 883
NQ 0.9 + 1.6 $27 818 + $ 43 163 = $70 981 400 780
NNSW 1.2 + 1.4 $32 538 + $44 333= $76 871 389 131
In Northern Australia the number of milking cows and the litres of milk produced per labour unit were calculated. At 74 milkers and 397 571 litres per unit the calculation revealed numbers below an acceptable benchmark.
Being able to make the best use of labour is essential—this is a matter of trying to work smarter, combined with knowing the value of each labour unit and equating any capital expenditure against potential labour savings. The question —how best should labour be utilised—is one of the areas which needs constant attention as production increases.
The following points need to be considered when addressing labour issues:
Farm production Management allowance
Where production is less than 300 000 L $20 000
Where production is between 300 000 & 900 000 L 6 c/L
Where production exceeds 900 000 L $54 000

QDAS 2004-2005 15
• the number of employees • milk per labour unit • cows per labour unit • award rates and conditions • job skills and training programs • shed design and farm layout • unpaid family labour • other labour–saving technology
Labour costs are the second biggest production cost after feed costs. Labour, lifestyle and succession are important issues for families and the industry in general to debate.
QDAS 2004-2005 16
Appendices
1 Map of farm performance – top 25% of farms (2004-2005)
2 Group cash gross margin – 157 QDAS farms (2004-2005)
3 Group cash gross margin – SEQ farms (2004-2005)
4 Group cash gross margin – CQ farms (2004-2005)
5 Group cash gross margin – NQ farms (2004-2005)
6 Group cash gross margin – NNSW farms (2004-2005)
7 Business traits, KPI and definitions used in (2004-2005)

QDAS 2004-2005 17
1 Map of farm performance – top 25% of farms (2004–2005)

QDAS 2004-2005 18
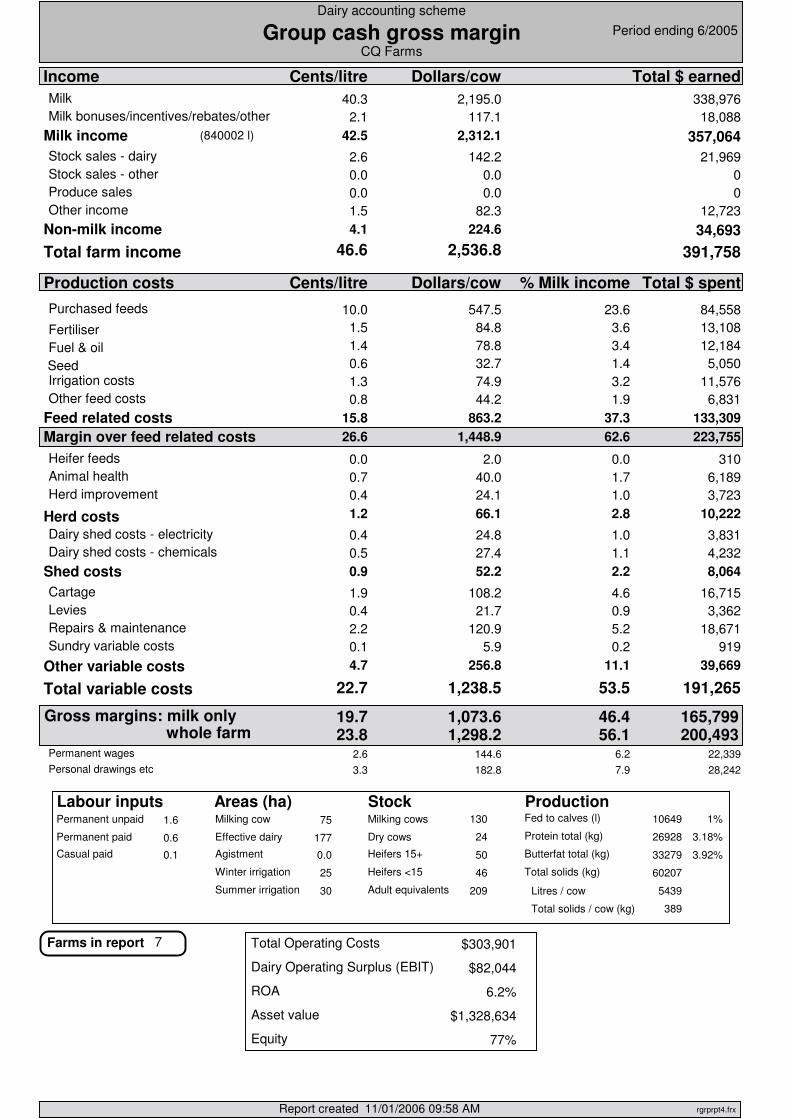
2 Group cash gross margin – 157 QDAS farms (2004–2005)
QDAS 2004-2005 19
3 Group cash gross margin – South-east Queensland (2004–2005)
QDAS 2004-2005 20
4 Group cash gross margin – Central Queensland (2004–2005)

QDAS 2004-2005 21
5 Group cash gross margin – North Queensland (2004–2005)

QDAS 2004-2005 22
6 Group cash gross margin – Northern New South Wales (2004–2005)
QDAS 2004-2005 23
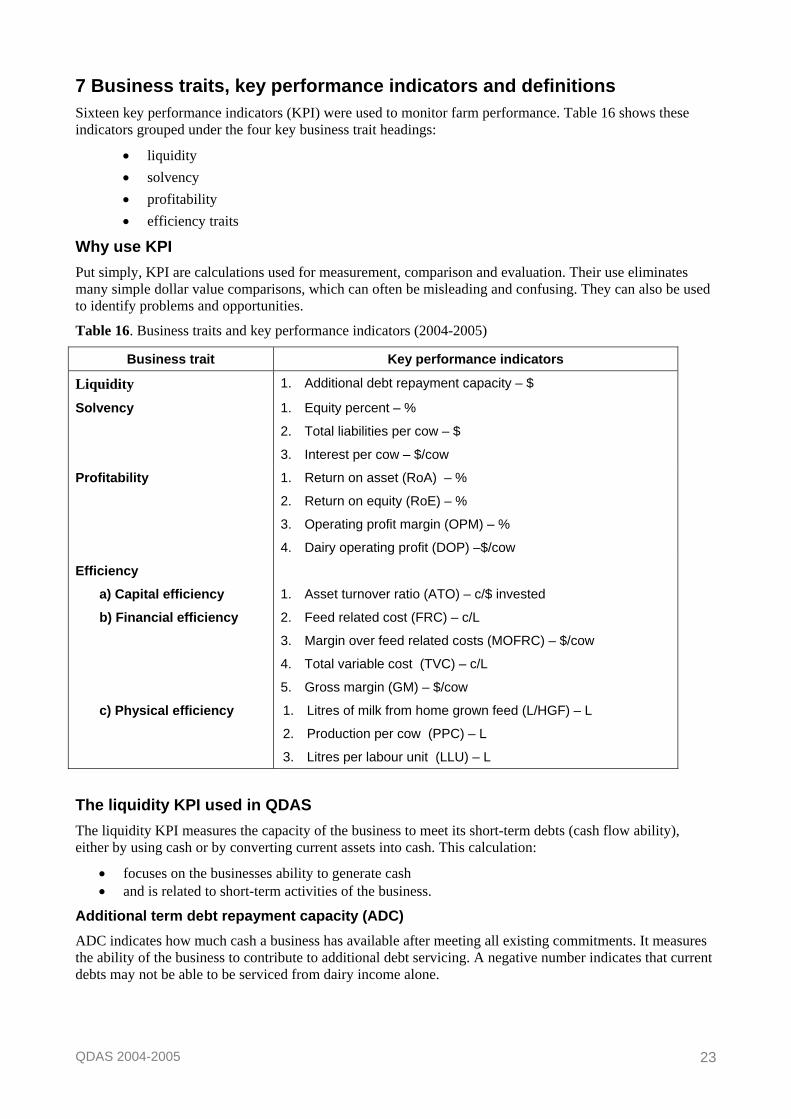
7 Business traits, key performance indicators and definitions Sixteen key performance indicators (KPI) were used to monitor farm performance. Table 16 shows these indicators grouped under the four key business trait headings:
• liquidity • solvency • profitability • efficiency traits
Why use KPI Put simply, KPI are calculations used for measurement, comparison and evaluation. Their use eliminates many simple dollar value comparisons, which can often be misleading and confusing. They can also be used to identify problems and opportunities.
Table 16. Business traits and key performance indicators (2004-2005)
Business trait Key performance indicators
Liquidity 1. Additional debt repayment capacity – $
Solvency 1. Equity percent – %
2. Total liabilities per cow – $
3. Interest per cow – $/cow
Profitability 1. Return on asset (RoA) – %
2. Return on equity (RoE) – %
3. Operating profit margin (OPM) – %
4. Dairy operating profit (DOP) –$/cow
Efficiency
a) Capital efficiency
b) Financial efficiency
c) Physical efficiency
1. Asset turnover ratio (ATO) – c/$ invested
2. Feed related cost (FRC) – c/L
3. Margin over feed related costs (MOFRC) – $/cow
4. Total variable cost (TVC) – c/L
5. Gross margin (GM) – $/cow
1. Litres of milk from home grown feed (L/HGF) – L
2. Production per cow (PPC) – L
3. Litres per labour unit (LLU) – L
The liquidity KPI used in QDAS The liquidity KPI measures the capacity of the business to meet its short-term debts (cash flow ability), either by using cash or by converting current assets into cash. This calculation:
• focuses on the businesses ability to generate cash • and is related to short-term activities of the business.
Additional term debt repayment capacity (ADC) ADC indicates how much cash a business has available after meeting all existing commitments. It measures the ability of the business to contribute to additional debt servicing. A negative number indicates that current debts may not be able to be serviced from dairy income alone.
QDAS 2004-2005 24
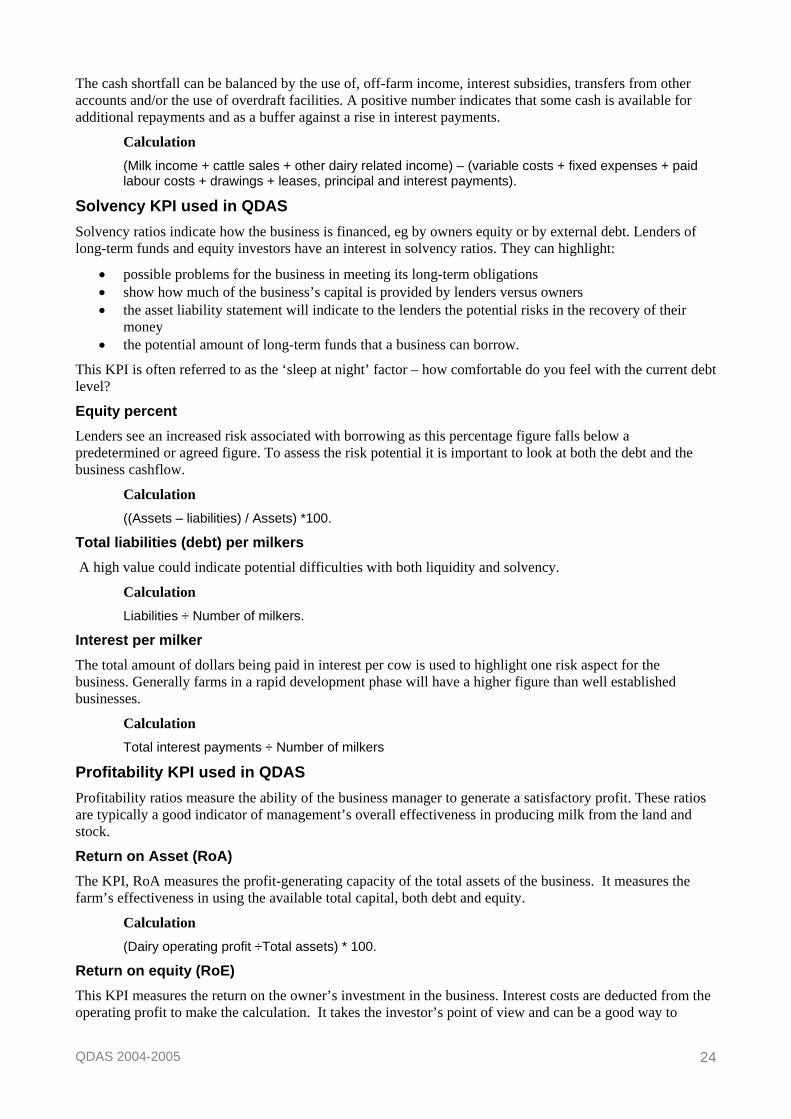
The cash shortfall can be balanced by the use of, off-farm income, interest subsidies, transfers from other accounts and/or the use of overdraft facilities. A positive number indicates that some cash is available for additional repayments and as a buffer against a rise in interest payments.
Calculation (Milk income + cattle sales + other dairy related income) – (variable costs + fixed expenses + paid labour costs + drawings + leases, principal and interest payments).
Solvency KPI used in QDAS Solvency ratios indicate how the business is financed, eg by owners equity or by external debt. Lenders of long-term funds and equity investors have an interest in solvency ratios. They can highlight:
• possible problems for the business in meeting its long-term obligations • show how much of the business’s capital is provided by lenders versus owners • the asset liability statement will indicate to the lenders the potential risks in the recovery of their
money • the potential amount of long-term funds that a business can borrow.
This KPI is often referred to as the ‘sleep at night’ factor – how comfortable do you feel with the current debt level?
Equity percent Lenders see an increased risk associated with borrowing as this percentage figure falls below a predetermined or agreed figure. To assess the risk potential it is important to look at both the debt and the business cashflow.
Calculation ((Assets – liabilities) / Assets) *100.
Total liabilities (debt) per milkers A high value could indicate potential difficulties with both liquidity and solvency.
Calculation Liabilities ÷ Number of milkers.
Interest per milker The total amount of dollars being paid in interest per cow is used to highlight one risk aspect for the business. Generally farms in a rapid development phase will have a higher figure than well established businesses.
Calculation Total interest payments ÷ Number of milkers
Profitability KPI used in QDAS Profitability ratios measure the ability of the business manager to generate a satisfactory profit. These ratios are typically a good indicator of management’s overall effectiveness in producing milk from the land and stock.
Return on Asset (RoA) The KPI, RoA measures the profit-generating capacity of the total assets of the business. It measures the farm’s effectiveness in using the available total capital, both debt and equity.
Calculation (Dairy operating profit ÷Total assets) * 100.
Return on equity (RoE) This KPI measures the return on the owner’s investment in the business. Interest costs are deducted from the operating profit to make the calculation. It takes the investor’s point of view and can be a good way to
QDAS 2004-2005 25
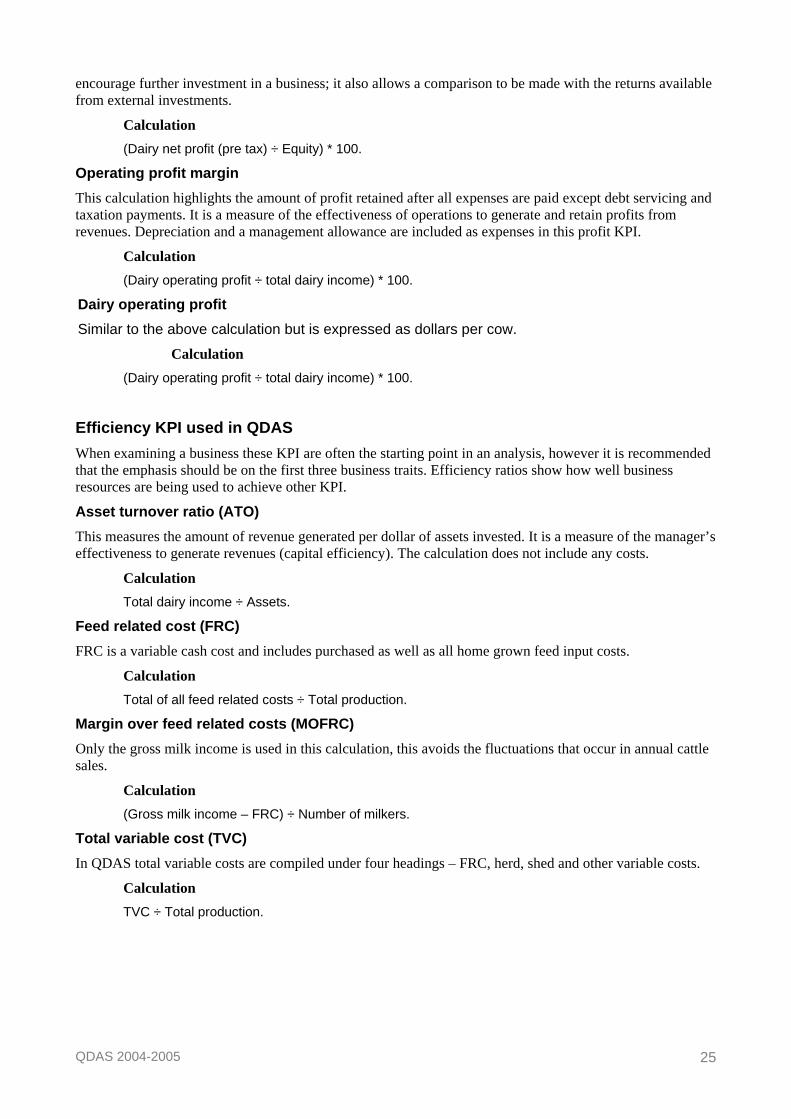
encourage further investment in a business; it also allows a comparison to be made with the returns available from external investments.
Calculation (Dairy net profit (pre tax) ÷ Equity) * 100.
Operating profit margin This calculation highlights the amount of profit retained after all expenses are paid except debt servicing and taxation payments. It is a measure of the effectiveness of operations to generate and retain profits from revenues. Depreciation and a management allowance are included as expenses in this profit KPI.
Calculation (Dairy operating profit ÷ total dairy income) * 100.
Dairy operating profit Similar to the above calculation but is expressed as dollars per cow.
Calculation (Dairy operating profit ÷ total dairy income) * 100.
Efficiency KPI used in QDAS When examining a business these KPI are often the starting point in an analysis, however it is recommended that the emphasis should be on the first three business traits. Efficiency ratios show how well business resources are being used to achieve other KPI.
Asset turnover ratio (ATO) This measures the amount of revenue generated per dollar of assets invested. It is a measure of the manager’s effectiveness to generate revenues (capital efficiency). The calculation does not include any costs.
Calculation Total dairy income ÷ Assets.
Feed related cost (FRC) FRC is a variable cash cost and includes purchased as well as all home grown feed input costs.
Calculation Total of all feed related costs ÷ Total production.
Margin over feed related costs (MOFRC) Only the gross milk income is used in this calculation, this avoids the fluctuations that occur in annual cattle sales.
Calculation (Gross milk income – FRC) ÷ Number of milkers.
Total variable cost (TVC) In QDAS total variable costs are compiled under four headings – FRC, herd, shed and other variable costs.
Calculation TVC ÷ Total production.
QDAS 2004-2005 26
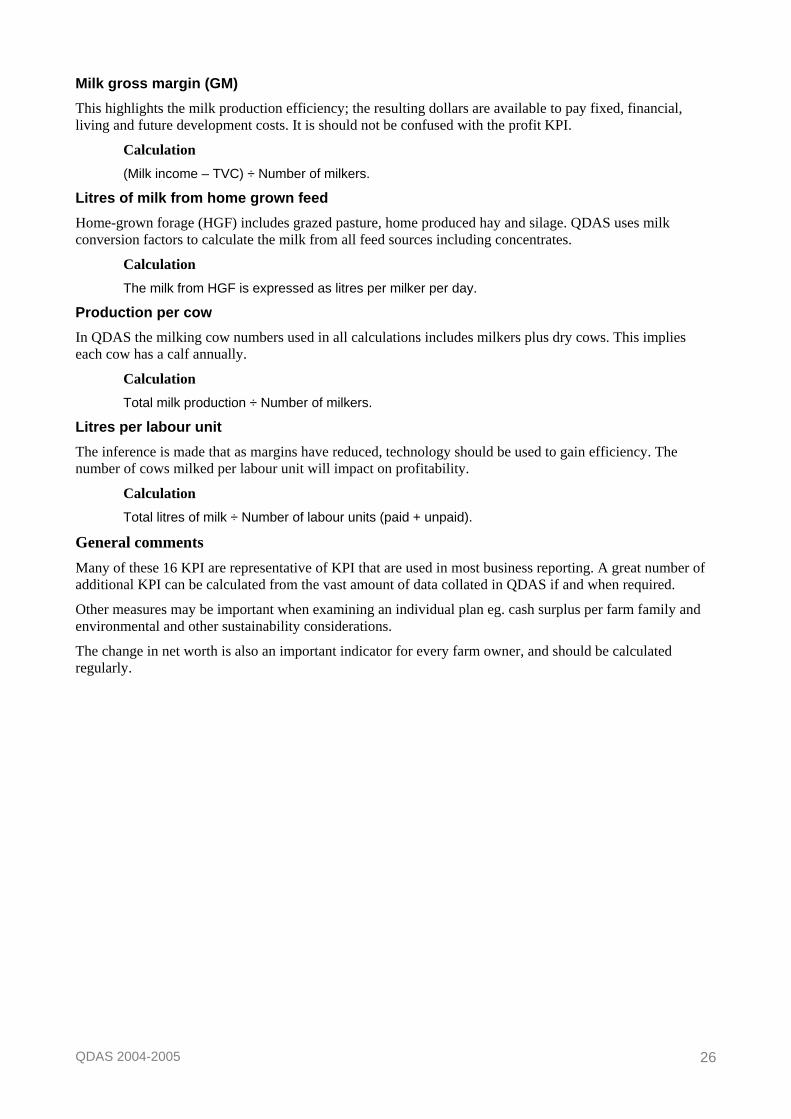
Milk gross margin (GM) This highlights the milk production efficiency; the resulting dollars are available to pay fixed, financial, living and future development costs. It is should not be confused with the profit KPI.
Calculation (Milk income – TVC) ÷ Number of milkers.
Litres of milk from home grown feed Home-grown forage (HGF) includes grazed pasture, home produced hay and silage. QDAS uses milk conversion factors to calculate the milk from all feed sources including concentrates.
Calculation The milk from HGF is expressed as litres per milker per day.
Production per cow In QDAS the milking cow numbers used in all calculations includes milkers plus dry cows. This implies each cow has a calf annually.
Calculation Total milk production ÷ Number of milkers.
Litres per labour unit The inference is made that as margins have reduced, technology should be used to gain efficiency. The number of cows milked per labour unit will impact on profitability.
Calculation Total litres of milk ÷ Number of labour units (paid + unpaid).
General comments Many of these 16 KPI are representative of KPI that are used in most business reporting. A great number of additional KPI can be calculated from the vast amount of data collated in QDAS if and when required.
Other measures may be important when examining an individual plan eg. cash surplus per farm family and environmental and other sustainability considerations.
The change in net worth is also an important indicator for every farm owner, and should be calculated regularly.


Group cash gross margin Period ending 6/2005
Dairy accounting scheme
NQ Farms
Income Cents/litre Dollars/cow Total $ earned
Milk
Milk income 320,752
307,96430.1 1,544.3
Stock sales - dairy
Other income
Non-milk income
Total farm income
Production costs Cents/litre Dollars/cow Total $ spent% Milk income
Purchased feeds
Fertiliser
Other feed costs
Irrigation costs
Feed related costs
Seed
Fuel & oil
2.9 149.6 29,845 9.3
Cartage
Levies
Herd improvement
Repairs & maintenance
Animal health
Dairy shed costs - electricity
Sundry variable costs
Other variable costs
Total variable costs
Gross margins: milk onlywhole farm
Permanent wages
Milk bonuses/incentives/rebates/other 12,788
Stock sales - other
Produce sales
Dairy shed costs - chemicals
Heifer feeds
Herd costs
Shed costs
Labour inputsPermanent unpaid
Permanent paid
Casual paid
1.6
0.6
0.3
Areas (ha)Milking cow
Effective dairy
Agistment
160
10.5
Winter irrigation
Summer irrigation
17
StockMilking cows
Dry cows
Heifers 15+
Heifers <15
Adult equivalents 258
ProductionFed to calves (l)
Butterfat total (kg)
Protein total (kg)
Total solids / cow (kg)
24109
38922
32382
5128
2%
3.83%
3.18%
Total solids (kg) 71305
Litres / cow
357
99
0
166
32
51
58
1.2 64.1
31.3 1,608.5
26,880
5,786
14,436
2.6 134.8
0
0.5 29.0
0.0 0.0
1.4 72.3
47,103 4.6 236.2
367,85535.9 1,844.7
0.7 39.3 7,849 2.4
0.4 22.8 4,556 1.4
0.4 20.9 4,187 1.3
0.7 39.1 7,806 2.4
10.0 515.8 102,857 32.0
15.3 787.8 157,102 48.9
0.6 32.0 6,387 1.9
0.1 7.4 1,484 0.4
2.7 139.5 27,818 8.6
1.1 57.7 11,523 3.5
0.4 23.0 4,591 1.4
0.5 30.3 6,047 1.8
1.0 53.3 10,638 3.3
2.6 136.3 27,190 8.4
0.9 46.5 9,279 2.8
0.2 11.9 2,385 0.7
0.3 15.7 3,143 0.9
1.3 67.2 13,413 4.1
1.9 102.4 20,427 6.3
21.0 1,079.9 215,358 67.1
10.3 528.5 105,393 32.814.9 764.7 152,497 47.5
Farms in report 27
Personal drawings etc 4.4 228.9 45,645 14.2
(1022733 l)
Margin over feed related costs 16.0 820.6 163,649 51.0
Total Operating Costs
Dairy Operating Surplus (EBIT)
ROA
Asset value
Equity 81%
$2,012,042
$329,925
$41,615
2.1%
11/01/2006 09:59 AMReport created rgrprpt4.frx
Group cash gross margin Period ending 6/2005
Dairy accounting scheme
CQ Farms
Income Cents/litre Dollars/cow Total $ earned
Milk
Milk income 357,064
338,97640.3 2,195.0
Stock sales - dairy
Other income
Non-milk income
Total farm income
Production costs Cents/litre Dollars/cow Total $ spent% Milk income
Purchased feeds
Fertiliser
Other feed costs
Irrigation costs
Feed related costs
Seed
Fuel & oil
1.5 84.8 13,108 3.6
Cartage
Levies
Herd improvement
Repairs & maintenance
Animal health
Dairy shed costs - electricity
Sundry variable costs
Other variable costs
Total variable costs
Gross margins: milk onlywhole farm
Permanent wages
Milk bonuses/incentives/rebates/other 18,088
Stock sales - other
Produce sales
Dairy shed costs - chemicals
Heifer feeds
Herd costs
Shed costs
Labour inputsPermanent unpaid
Permanent paid
Casual paid
1.6
0.6
0.1
Areas (ha)Milking cow
Effective dairy
Agistment
177
0.0
Winter irrigation
Summer irrigation
25
StockMilking cows
Dry cows
Heifers 15+
Heifers <15
Adult equivalents 209
ProductionFed to calves (l)
Butterfat total (kg)
Protein total (kg)
Total solids / cow (kg)
10649
33279
26928
5439
1%
3.92%
3.18%
Total solids (kg) 60207
Litres / cow
389
75
30
130
24
50
46
2.1 117.1
42.5 2,312.1
21,969
0
12,723
2.6 142.2
0
0.0 0.0
0.0 0.0
1.5 82.3
34,693 4.1 224.6
391,75846.6 2,536.8
1.4 78.8 12,184 3.4
0.6 32.7 5,050 1.4
1.3 74.9 11,576 3.2
0.8 44.2 6,831 1.9
10.0 547.5 84,558 23.6
15.8 863.2 133,309 37.3
0.4 24.1 3,723 1.0
0.1 5.9 919 0.2
2.6 144.6 22,339 6.2
0.7 40.0 6,189 1.7
0.5 27.4 4,232 1.1
0.4 24.8 3,831 1.0
0.9 52.2 8,064 2.2
1.2 66.1 10,222 2.8
0.0 2.0 310 0.0
1.9 108.2 16,715 4.6
0.4 21.7 3,362 0.9
2.2 120.9 18,671 5.2
4.7 256.8 39,669 11.1
22.7 1,238.5 191,265 53.5
19.7 1,073.6 165,799 46.423.8 1,298.2 200,493 56.1
Farms in report 7
Personal drawings etc 3.3 182.8 28,242 7.9
(840002 l)
Margin over feed related costs 26.6 1,448.9 223,755 62.6
Total Operating Costs
Dairy Operating Surplus (EBIT)
ROA
Asset value
Equity 77%
$1,328,634
$303,901
$82,044
6.2%
11/01/2006 09:58 AMReport created rgrprpt4.frx

Group cash gross margin Period ending 6/2005
Dairy accounting scheme
SEQ Farms
Income Cents/litre Dollars/cow Total $ earned
Milk
Milk income 325,018
308,11933.3 1,812.3
Stock sales - dairy
Other income
Non-milk income
Total farm income
Production costs Cents/litre Dollars/cow Total $ spent% Milk income
Purchased feeds
Fertiliser
Other feed costs
Irrigation costs
Feed related costs
Seed
Fuel & oil
1.7 93.6 15,919 4.8
Cartage
Levies
Herd improvement
Repairs & maintenance
Animal health
Dairy shed costs - electricity
Sundry variable costs
Other variable costs
Total variable costs
Gross margins: milk onlywhole farm
Permanent wages
Milk bonuses/incentives/rebates/other 16,899
Stock sales - other
Produce sales
Dairy shed costs - chemicals
Heifer feeds
Herd costs
Shed costs
Labour inputsPermanent unpaid
Permanent paid
Casual paid
1.5
0.7
0.1
Areas (ha)Milking cow
Effective dairy
Agistment
202
11.9
Winter irrigation
Summer irrigation
33
StockMilking cows
Dry cows
Heifers 15+
Heifers <15
Adult equivalents 221
ProductionFed to calves (l)
Butterfat total (kg)
Protein total (kg)
Total solids / cow (kg)
9439
36828
29892
5439
1%
3.99%
3.23%
Total solids (kg) 66720
Litres / cow
392
108
32
140
29
40
61
1.8 99.4
35.1 1,911.7
34,236
2,420
13,309
3.7 201.3
1,746
0.2 14.2
0.1 10.2
1.4 78.2
51,712 5.5 304.1
376,73140.7 2,215.9
1.4 76.1 12,948 3.9
0.6 33.2 5,658 1.7
0.8 48.8 8,302 2.5
1.2 70.5 11,998 3.6
11.0 602.8 102,489 31.5
17.0 925.3 157,317 48.4
0.4 23.4 3,991 1.2
0.2 13.9 2,363 0.7
3.0 165.2 28,090 8.6
0.7 43.2 7,355 2.2
0.5 28.6 4,865 1.4
0.4 27.1 4,612 1.4
1.0 55.7 9,478 2.9
1.5 85.8 14,601 4.4
0.3 19.1 3,254 1.0
0.2 15.3 2,613 0.8
0.3 17.2 2,933 0.9
1.7 97.8 16,636 5.1
2.6 144.3 24,546 7.5
22.2 1,211.3 205,942 63.3
12.8 700.3 119,075 36.618.4 1,004.5 170,788 52.5
Farms in report 88
Personal drawings etc 2.1 116.8 19,864 6.1
(924800 l)
Margin over feed related costs 18.1 986.4 167,701 51.5
Total Operating Costs
Dairy Operating Surplus (EBIT)
ROA
Asset value
Equity 85%
$1,962,970
$316,785
$51,302
2.6%
11/01/2006 09:56 AMReport created rgrprpt4.frx

Group cash gross margin Period ending 6/2005
Dairy accounting scheme
All Farms
Income Cents/litre Dollars/cow Total $ earned
Milk
Milk income 330,515
317,84333.2 1,768.2
Stock sales - dairy
Other income
Non-milk income
Total farm income
Production costs Cents/litre Dollars/cow Total $ spent% Milk income
Purchased feeds
Fertiliser
Other feed costs
Irrigation costs
Feed related costs
Seed
Fuel & oil
2.1 112.4 20,206 6.1
Cartage
Levies
Herd improvement
Repairs & maintenance
Animal health
Dairy shed costs - electricity
Sundry variable costs
Other variable costs
Total variable costs
Gross margins: milk onlywhole farm
Permanent wages
Milk bonuses/incentives/rebates/other 12,671
Stock sales - other
Produce sales
Dairy shed costs - chemicals
Heifer feeds
Herd costs
Shed costs
Labour inputsPermanent unpaid
Permanent paid
Casual paid
1.5
0.8
0.1
Areas (ha)Milking cow
Effective dairy
Agistment
188
8.5
Winter irrigation
Summer irrigation
28
StockMilking cows
Dry cows
Heifers 15+
Heifers <15
Adult equivalents 236
ProductionFed to calves (l)
Butterfat total (kg)
Protein total (kg)
Total solids / cow (kg)
14692
37594
30772
5310
2%
3.93%
3.21%
Total solids (kg) 68366
Litres / cow
380
101
24
153
25
46
64
1.3 70.4
34.6 1,838.7
32,872
2,351
14,999
3.4 182.8
1,337
0.2 13.0
0.1 7.4
1.5 83.4
51,561 5.4 286.8
382,07640.0 2,125.5
1.2 67.9 12,211 3.6
0.7 40.8 7,339 2.2
0.6 35.7 6,431 1.9
1.2 68.3 12,278 3.7
11.0 588.4 105,766 32.0
17.2 913.6 164,235 49.6
0.4 25.8 4,648 1.4
0.2 12.6 2,281 0.6
3.0 160.1 28,778 8.7
0.7 42.2 7,601 2.3
0.5 29.9 5,374 1.6
0.5 30.2 5,433 1.6
1.1 60.1 10,808 3.2
1.7 92.7 16,665 5.0
0.4 24.5 4,414 1.3
0.3 20.3 3,659 1.1
0.3 17.0 3,066 0.9
1.7 92.5 16,637 5.0
2.6 142.6 25,645 7.7
22.7 1,209.1 217,354 65.7
11.8 629.5 113,161 34.217.2 916.3 164,722 49.8
Farms in report 157
Personal drawings etc 2.8 150.9 27,125 8.2
(954517 l)
Margin over feed related costs 17.4 925.0 166,280 50.3
Total Operating Costs
Dairy Operating Surplus (EBIT)
ROA
Asset value
Equity 82%
$1,897,213
$333,255
$44,225
2.3%
11/01/2006 09:53 AMReport created rgrprpt4.frx
Group dairy farm profit mapTop 25% OPM/Cow
Dairy accounting scheme
Year 2005
Group of 42 farms
$378,706
35.4c/l
6.9c/l
185
Total cows Production l/cow
5763
Litres sold
1,069,654
Total milk income
Cattle trading profit
$74,577
-0.0c/l
H G F adjustment
$-688
1.4c/l
Other dairy income
$15,967
$468,562
43.8c/l
Total dairy income
31.8c/l
Total operating costs
$340,421
2.2c/l
Depreciation
$24,366
Dairy operating profit
21.0c/l
Total variable costs
$225,375
2.0c/l
Administration
2.1c/l
Permanent labour
$23,169
16.2c/l
Variable costs
$173,685
1.6c/l
Herd
$17,464
1.0c/l
Shed
$11,292
Feed related
2.6c/l
Other
$28,610
7.9c/l
Dairy nett profit pre tax
$84,523
4.0c/l
Finance costs
$43,618
4.2c/l
Management allowance
$45,139
Return on equity Return on asset
Return on equity
4.9%
Assets
$2,100,331
Equity
81%$1,716,914
Liabilities
$383,417
Return on assets
6.1%
$22,370
-0.5c/l
Purch. goods adjustment
$-5,676
$128,141
11.9c/l
$84,523 $128,141
$2,241,788$1,958,875$1,654,791 $1,838,822
ChangeChange
Operating profit margin
27.3%
$690 per cow
05/01/2006 12:19 PMrfarmp3.frx
Note: Management allowance is calculated
Report created Asset and liability values are the average of opening and closing values for this year

Group cash gross margin Period ending 6/2005
Dairy accounting scheme
NNSW Farms
Income Cents/litre Dollars/cow Total $ earned
Milk
Milk income 346,556
345,68534.5 1,780.5
Stock sales - dairy
Other income
Non-milk income
Total farm income
Production costs Cents/litre Dollars/cow Total $ spent% Milk income
Purchased feeds
Fertiliser
Other feed costs
Irrigation costs
Feed related costs
Seed
Fuel & oil
2.4 128.6 24,969 7.2
Cartage
Levies
Herd improvement
Repairs & maintenance
Animal health
Dairy shed costs - electricity
Sundry variable costs
Other variable costs
Total variable costs
Gross margins: milk onlywhole farm
Permanent wages
Milk bonuses/incentives/rebates/other 870
Stock sales - other
Produce sales
Dairy shed costs - chemicals
Heifer feeds
Herd costs
Shed costs
Labour inputsPermanent unpaid
Permanent paid
Casual paid
1.3
1.1
0.0
Areas (ha)Milking cow
Effective dairy
Agistment
174
0.3
Winter irrigation
Summer irrigation
24
StockMilking cows
Dry cows
Heifers 15+
Heifers <15
Adult equivalents 264
ProductionFed to calves (l)
Butterfat total (kg)
Protein total (kg)
Total solids / cow (kg)
21445
39357
32510
5148
2%
3.85%
3.22%
Total solids (kg) 71868
Litres / cow
370
93
21
182
11
57
79
0.0 4.4
34.6 1,785.0
36,246
0
20,137
3.6 186.7
1,608
0.0 0.0
0.1 8.2
2.0 103.7
57,993 5.8 298.7
404,54940.4 2,083.7
1.3 70.7 13,730 3.9
1.4 72.9 14,169 4.0
0.2 12.5 2,429 0.7
1.7 90.2 17,523 5.0
12.0 620.6 120,492 34.7
19.3 995.7 193,315 55.7
0.5 26.4 5,142 1.4
0.2 15.2 2,963 0.8
3.2 167.5 32,537 9.3
0.5 28.2 5,479 1.5
0.7 38.5 7,487 2.1
0.7 37.8 7,344 2.1
1.4 76.3 14,832 4.2
1.5 77.3 15,023 4.3
0.4 22.6 4,401 1.2
0.4 24.0 4,662 1.3
0.3 16.9 3,282 0.9
1.8 96.4 18,721 5.4
2.9 152.6 29,630 8.5
25.2 1,302.1 252,801 72.9
9.3 482.9 93,754 27.015.1 781.6 151,747 43.7
Farms in report 35
Personal drawings etc 3.0 159.0 30,874 8.9
(999513 l)
Margin over feed related costs 15.3 789.3 153,240 44.2
Total Operating Costs
Dairy Operating Surplus (EBIT)
ROA
Asset value
Equity 78%
$1,757,013
$383,104
$20,880
1.2%
11/01/2006 10:03 AMReport created rgrprpt4.frx