Embed Size (px)
Citation preview
1
Energy Audits under BEECIFF
Bulgaria Energy Efficiency for Competitive Industry Financing Facility (BEECIFF): Project Preparation, Capacity Building and
Implementation Support
Consultancy Contract No: C22081/EEFF-2011-05-03
This assignment is funded by the EU/EBRD Energy Efficiency Finance Facility Fund
2
Contract Details
Client European Bank for Reconstruction and Development One Exchange Square, London, EC2A 2 JN
Contractor Kommunalkredit Public Consulting GmbH Tuerkenstrasse 9, 1092 Vienna, Austria www.publicconsulting.at
Contract Bulgaria Energy Efficiency for Competitive Industry Financing Facility (BEECIFF) Project Preparation, Capacity Building and Implementation Support Contract No. C22081/EEFF-2011-05-03
Consortium Coordinator
Alexander Linke [email protected] Tel.: +43 1 31631 223 Mobile: +43 67688 3163223 Fax: +43 1 31631 104
3
Table of Content
1. Background................................................................................................................................................ 4
2. Summary of Energy Audits carried out in the framework of BEECIFF...................................................... 5
Eligibility criteria for auditors.......................................................................................................................... 5
Selecting and contracting auditor .................................................................................................................. 6
Performing audits........................................................................................................................................... 6
Audit costs ..................................................................................................................................................... 6
3. List of Attachments .................................................................................................................................... 8
I. Simplified Energy Audit Report Template.................................................................................................. 8
II. Example of an Simplified Energy Audit ..................................................................................................... 8
III. Checklist for the Project Assistant ...................................................................................... 8
IV. Contract template for hiring Energy Auditors...................................................................... 8
V. List of eligible Energy Auditors ........................................................................................... 8
VI. Voucher Systems................................................................................................................ 8
4
1. Background
The Ministry of Economy, Energy and Tourism (“MoEET”) and the European Bank of Reconstruction and Development (“EBRD”) are working together to develop and implement the “Energy Efficiency and Green Economy Programme” (“Programme”) in Bulgaria. This new Programme will combine a loan component, provided by commercial banks (“Participating Banks (“PBs”)) based on a credit line extended by EBRD, and a grant component (EU Structural Funds), provided by the Ministry from the Operational Program “Development of the Competitiveness of the Bulgarian Economy” (“OP Competitiveness”). A third component, the Technical Assistance (“TA”) component will provide implementation support. Based on the policy objectives of the OP Competitiveness, the Programme aims to:
- Improve the efficiency and productivity of environmentally friendly technology used by Small and Medium Enterprises (“SMEs”);
- reduce the energy intensity and any adverse environmental impacts by promoting investments in environmentally friendly, low-waste, energy saving production technologies and utilization of renewable energy sources.
By combining grants, loans and TA in one instrument, this new program overcomes barriers and constraints faced by Bulgarian in designing, implementing and financing sustainable energy projects. SMEs can submit both Energy Efficiency Projects and Renewable Energy Projects to the Programme. Depending on the project’s scale and complexity, two main sub-types of projects are eligible:
- Technology-Driven Projects; Technology-Driven Projects are small-scale and simple measures, using technology and equipment as defined in the List of Eligible Materials and Equipment (“LEME”);
- Energy Audit-Driven Projects;
Such projects are larger and more complex, and are based on the results of an energy audit, which must be performed by a Certified Energy Audit Company.
The TA is provided by two consultants, the Project Assistant (“PA”) and the Verification Assistant (“VA”). The PA will assess the technical eligibility of project applications, the compliance with applicable procurement regulations, will provide information and counselling to potential applicants and will administer the program’s database and website. The VA will check and verify the successful implementation of all projects to be presented in Interim Validation Reports (“IVR”) and Completion Validation Reports (“CVR”) and will also maintain the LEME.
5
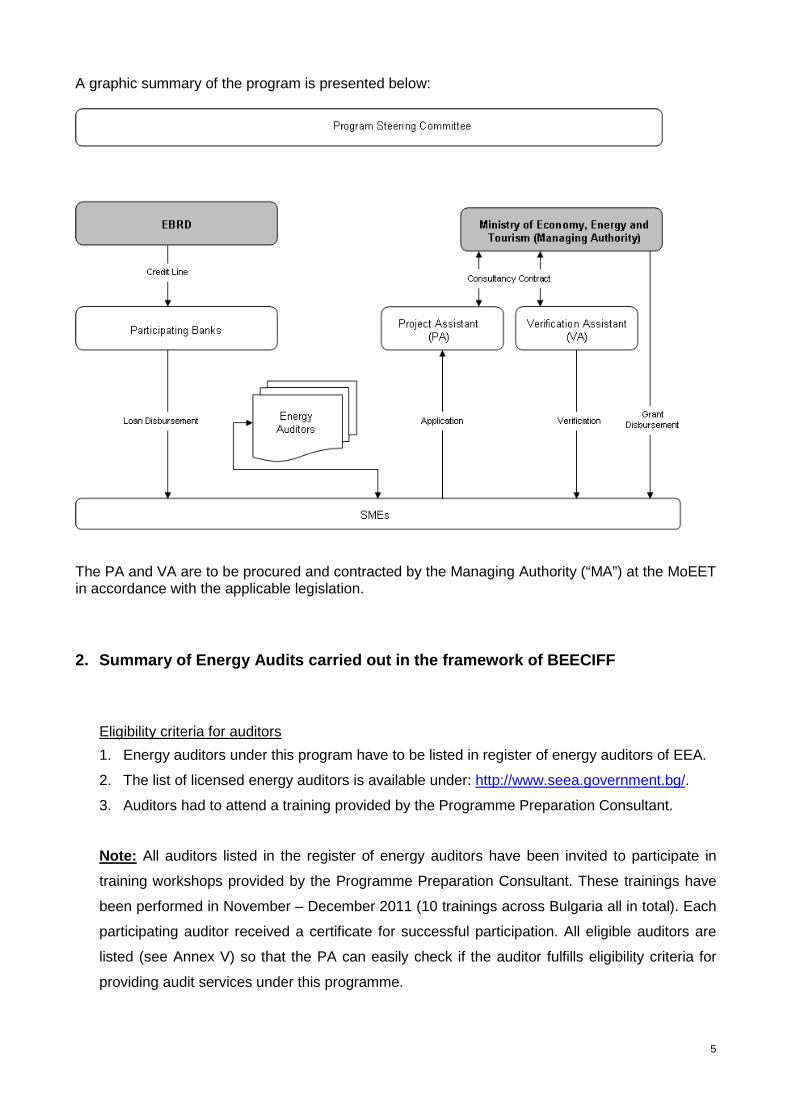
A graphic summary of the program is presented below:
The PA and VA are to be procured and contracted by the Managing Authority (“MA”) at the MoEET in accordance with the applicable legislation.
2. Summary of Energy Audits carried out in the fram ework of BEECIFF
Eligibility criteria for auditors
1. Energy auditors under this program have to be listed in register of energy auditors of EEA.
2. The list of licensed energy auditors is available under: http://www.seea.government.bg/.
3. Auditors had to attend a training provided by the Programme Preparation Consultant.
Note: All auditors listed in the register of energy auditors have been invited to participate in
training workshops provided by the Programme Preparation Consultant. These trainings have
been performed in November – December 2011 (10 trainings across Bulgaria all in total). Each
participating auditor received a certificate for successful participation. All eligible auditors are
listed (see Annex V) so that the PA can easily check if the auditor fulfills eligibility criteria for
providing audit services under this programme.
6
When will an Auditor be needed?
1. For each Non-LEME project.
2. On a voluntary basis (e.g. in order to improve the grant intensity).
Selecting and contracting auditor
1. List of eligible auditors is available on website stated above.
2. Applicants can select one of the eligible auditors for the simplified energy audit
3. Depending on project complexity audit shall be performed within 2 to 10 days.
4. Eligible costs for carrying out an energy audit are capped at 5.000 EUR.
5. A contract template for contracting auditors will be provided on the website.
Performing audits
1. Only simplified audits will be needed. Simplified audits focus only on the project itself,
planned measures and process that will be targeted by the project. There is no need for
auditing all processes of whole company.
2. The auditors shall use audit template (See Annex I).
3. The auditors shall use calculation tool provided during the trainings, these are available on
the programme website or upon request from the Project Assistant.
4. Each audit shall include recommendations on further EE measure.
5. Each audit shall be performed before implementation.
6. The quality of audits will be checked by the PA using the checklist (Annex III) provided
within this document. PA can easily check if audit report matches with minimum
requirement.
Note: The project assistant (PA) must be technically qualified to examine the energy saving
measures proposed by the auditor and see if there are systematic or rough calculation
errors. It is repeatedly emphasized during the training courses that each calculation has to be
performed with Microsoft Excel, and each digit in the calculation is clearly explained to the
participants in the training. If there is suspicion of a wrong calculation, the Energy Efficiency
Agency performs a detailed verification of the calculations. Specialists from the EEA also
attend the training course.
Audit costs
1. Costs for energy audit shall be eligible up to an amount of 5.000 EUR1.
2. Energy audits prepared by licensed companies for investigating the energy efficiency of
industrial systems under art. 34, para. 4 of the Energy Efficiency Act, can be used for
1 As an alternative, during the preparation of the programme also the applicability of a voucher scheme was discussed. Information on such a voucher scheme can be found in the Annex.
7
applying under OP Competitiveness after three years from the date of application The idea
is that companies that have already an energy audit carried out/performed by a
licensed (and eligible) auditor shall use that audit, but of course, the audit needs to be
updated. This refers to Bulgarian law that obliges companies with huge energy demand to
perform a energy audit on regularly basis. Since there this energy is also performed by
same auditors, we suggest that this already existing audit report shall be eligible under the
pre-condition that it is not older than 3 years
3. If the energy audit needs to be updated, the SME will be eligible for a voucher that covers
up to 75% of the costs for the energy audit service.
4. PB shall use audit report as basis for bankable decision.
Note: The main idea on such an energy audit report is that an auditor comments the planed
investment against engineering experiences and BAT. Hence the report can confirm that
planned measures meet minimum quality level and calculated savings are based on realistic
data and assumptions.

8
3. List of Attachments
I. Simplified Energy Audit Report Template
II. Example of an Simplified Energy Audit
III. Checklist for the Project Assistant
IV. Contract template for hiring Energy Auditors
V. List of eligible Energy Auditors
VI. Voucher Systems

1
ANNEX I
Simplified Energy Audit Report Template
2
____________________________________________________________________
Name of company ____________________________________________________________________
BEECIFF
II
Simplified
ENERGY AUDIT
Final Report
Name of auditor
Sofia, March 2012

3
IMPRESSUM:
Client:
Contractor:
Project team:
4
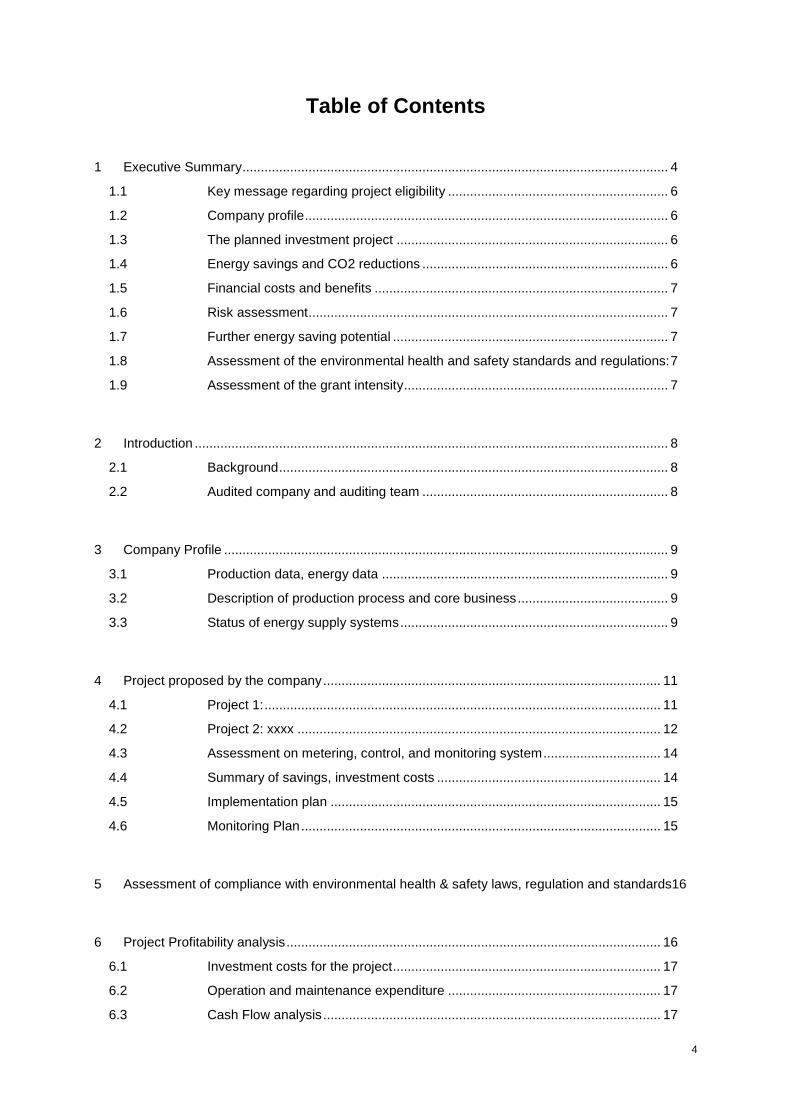
Table of Contents
1 Executive Summary.................................................................................................................... 4
1.1 Key message regarding project eligibility ............................................................ 6
1.2 Company profile................................................................................................... 6
1.3 The planned investment project .......................................................................... 6
1.4 Energy savings and CO2 reductions ................................................................... 6
1.5 Financial costs and benefits ................................................................................ 7
1.6 Risk assessment.................................................................................................. 7
1.7 Further energy saving potential ........................................................................... 7
1.8 Assessment of the environmental health and safety standards and regulations:7
1.9 Assessment of the grant intensity........................................................................ 7
2 Introduction ................................................................................................................................. 8
2.1 Background.......................................................................................................... 8
2.2 Audited company and auditing team ................................................................... 8
3 Company Profile ......................................................................................................................... 9
3.1 Production data, energy data .............................................................................. 9
3.2 Description of production process and core business......................................... 9
3.3 Status of energy supply systems......................................................................... 9
4 Project proposed by the company............................................................................................ 11
4.1 Project 1:............................................................................................................ 11
4.2 Project 2: xxxx ................................................................................................... 12
4.3 Assessment on metering, control, and monitoring system................................ 14
4.4 Summary of savings, investment costs ............................................................. 14
4.5 Implementation plan .......................................................................................... 15
4.6 Monitoring Plan.................................................................................................. 15
5 Assessment of compliance with environmental health & safety laws, regulation and standards16
6 Project Profitability analysis...................................................................................................... 16
6.1 Investment costs for the project......................................................................... 17
6.2 Operation and maintenance expenditure .......................................................... 17
6.3 Cash Flow analysis............................................................................................ 17
5
7 Risk assessment....................................................................................................................... 19
8 Recommendations to the company.......................................................................................... 20
8.1 Additional measures proposed to the client....................................................... 20
8.2 Overview of possible additional measures ........................................................ 20
8.3 Cost benefit assessment on proposed measures ............................................. 21
8.4 Further benefits from the projects...................................................................... 21
9 Assessment of eligibility under BEECIFF................................................................................. 22
9.1 Eligibility assessment......................................................................................... 22
9.2 Grant intensity.................................................................................................... 23
9.3 Quality check list (to be completed by the PA) .................................................. 24
6
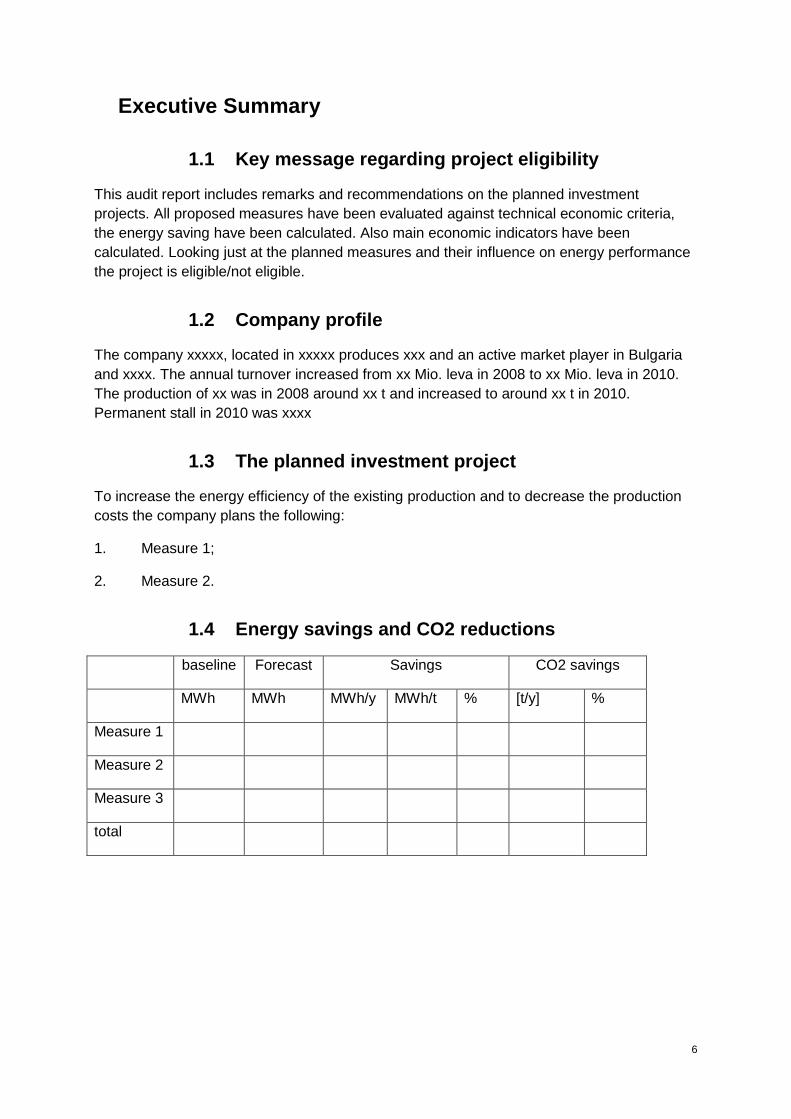
Executive Summary
1.1 Key message regarding project eligibility
This audit report includes remarks and recommendations on the planned investment projects. All proposed measures have been evaluated against technical economic criteria, the energy saving have been calculated. Also main economic indicators have been calculated. Looking just at the planned measures and their influence on energy performance the project is eligible/not eligible.
1.2 Company profile
The company xxxxx, located in xxxxx produces xxx and an active market player in Bulgaria and xxxx. The annual turnover increased from xx Mio. leva in 2008 to xx Mio. leva in 2010. The production of xx was in 2008 around xx t and increased to around xx t in 2010. Permanent stall in 2010 was xxxx
1.3 The planned investment project
To increase the energy efficiency of the existing production and to decrease the production costs the company plans the following:
1. Measure 1;
2. Measure 2.
1.4 Energy savings and CO2 reductions
baseline Forecast Savings CO2 savings
MWh MWh MWh/y MWh/t % [t/y] %
Measure 1
Measure 2
Measure 3
total
7
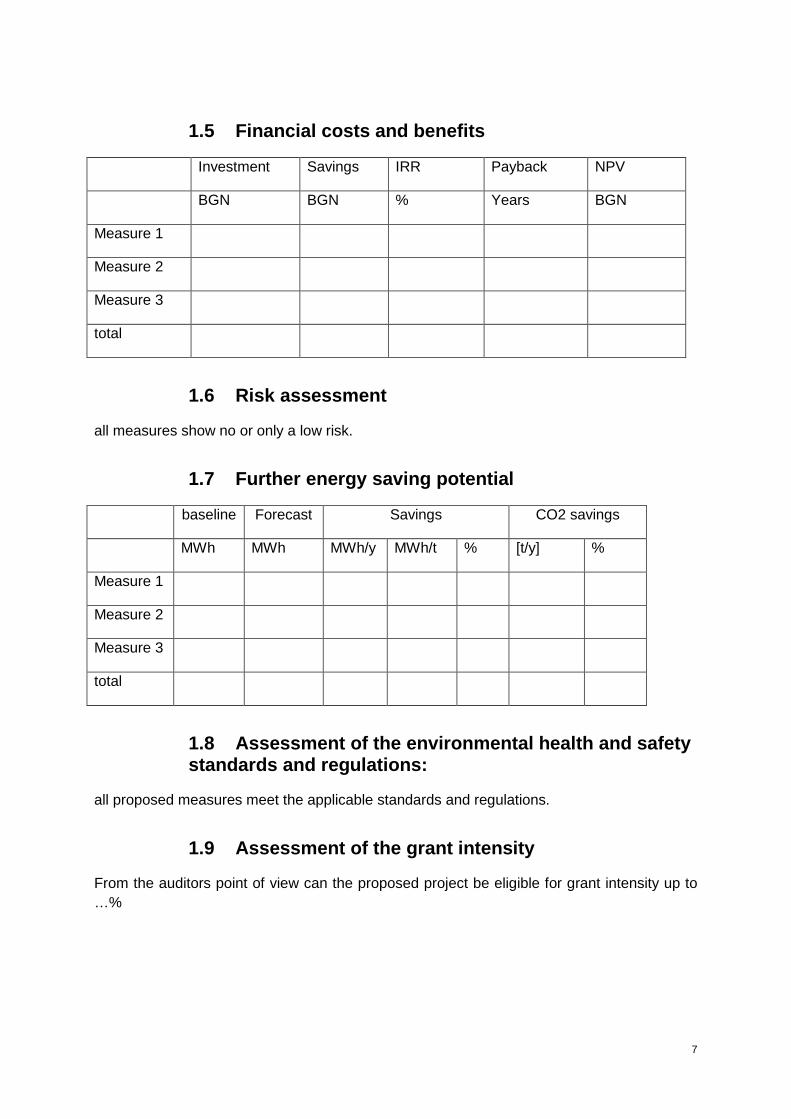
1.5 Financial costs and benefits
Investment Savings IRR Payback NPV
BGN BGN % Years BGN
Measure 1
Measure 2
Measure 3
total
1.6 Risk assessment
all measures show no or only a low risk.
1.7 Further energy saving potential
baseline Forecast Savings CO2 savings
MWh MWh MWh/y MWh/t % [t/y] %
Measure 1
Measure 2
Measure 3
total
1.8 Assessment of the environmental health and safety standards and regulations:
all proposed measures meet the applicable standards and regulations.
1.9 Assessment of the grant intensity
From the auditors point of view can the proposed project be eligible for grant intensity up to …%
8
2 Introduction
2.1 Background
This energy audit was prepared within the framework of the Energy Efficiency for Competitive Industry Financing Facility (BEECIFF). The EBRD has established BEECIFF in the form of a dedicated credit facility that provides funds to participating banks for on-lending to Bulgarian private companies. The goal is to support investment in energy efficiency and renewable energy projects, thereby reducing energy consumption and green house gas emissions.
Business sector: xxxxxxx (code)
2.2 Audited company and auditing team
This audit has been carried out for the company by:
(Name of the company) license number of EEA……/(date)
The audit was carried out in xxx by the following auditing team:
Auditing team:
Thermal power engineer;
Engineer on Heat engineering;
Electrical engineer.
Factory staff:
xxxxxxx General Manager
xxxxxxx Technical director
9
3 Company Profile
Brief description of the company’s products, services and facilities.
3.1 Production data, energy data
The total annual Turnover increased from xx Mio. BGN in 200x up to xx Mio. BGN in 201x. The prospected Turnover for 201x will be xx Mio. BGN. The production volume increased from xx t in 200x up to xx t in 201x. The prospected production amount in 2011 will be around xx t.
The electricity consumption decreased from xx MWh in 200x to xx MWh in 201x (-5%). The electricity costs had a share of xx % of the production costs in 200x and xx% in 201x. The specific electricity consumption per t of product amounted to xx MWh/t in 200x and xx MWh/t in 201x. Explanation of the changes of the values, if any.
The natural gas consumption decreased from xx MWh in 200x to xx MWh in 201x (-xx%). The natural gas costs had a share of xx % of the production costs in 200x and xx% in 201x. The specific gas consumption per t of product amounted to xx MWh/t in 200x and xx MWh/t in 201x. Explanation of the changes of the values, if any.
The total energy demand decreased from xx MWh in 200x to xx MWh in 201x (-xx%). The energy costs had a share of xx % of the total production costs in 200x and xx% in 201x0. The total energy consumption per t of product amounted to xx MWh/t in 200x and xx MWh/t in 201x. Explanation of the changes of the values, if any.
The table below gives an overview the turnover, production data, energy consumption and specific values
3.2 Description of production process and core business
Brief description of production process with the main process steps, which are relevant for the project.
3.3 Status of energy supply systems
Brief description of the status of the installed energy supply systems. Particular attention will be paid to equipment age, efficiency and performance in comparison to state of the art equipment.
10
Electricity
The company is directly supplied with electricity by the local electricity utility xxx via a power cable with a currency of 10 kV to the main transformer on the production site.
Electricity measurement devices: At the transformers the main electricity meter is installed.
Between 200x and 201x, the total electricity demand has increased by about x%. In the same period, the costs for electricity went up around xx%.
The electricity demand and expenses between 200x and 201x are been summarized in the Table below.
Natural gas
The company is directly supplied with natural gas by the local gas utility xxx to the main connecting point on the production site.
Natural gas measurement devices: At the main connecting point a gas meter is installed.
Between 200x and 201x, the total natural gas demand has increased by about x%. In the same period, the costs for natural went up around xx%.
The natural gas demand and expenses between 200x and 201x are been summarized in the Table below.
(taking into account climatic conditions for given site, operational patterns, process and indoor requirements and heat gains, this will give a picture about energy conversion efficiencies)
11
4 Project proposed by the company
4.1 Project 1:
Description of the baseline scenario:
The base line analysis will project the relevant data and calculation for the analysis period under the assumption that the project would not be implemented. Particular attention will be paid to:
- Energy consumption - Energy costs - CO2 emissions
Concept of improvement:
Description of the investment
Capital and Operation & maintenance expenditure
Description of the investment costs and operational costs for the measure described above.
Calculation of energy savings in MWh
Comprehensive (understandable) calculation of the energy savings from the proposed measure based on standard methodology
Calculation of emission reduction
Comprehensive (understandable) calculation of the direct CO2 reduction from the proposed measure based on standard methodology
Implementation schedule
The implementation plan with time schedule and disbursement schedule and the implications for the financing cash flow will be analyzed in this section.
Assessment of permits required
Procurement requirements
12
Technical feasibility analysis
Statement about the technical feasibility of the proposed measure(s) and assessment whether proven energy technologies and/or Best Available Technologies are used.
Short statement regarding the compliance with health, safety and environment standards of each measure.
4.2 Project 2: xxxx
Description of the baseline scenario:
The base line analysis will project the relevant data and calculation for the analysis period under the assumption that the project would not be implemented. Particular attention will be paid to:
- Energy consumption - Energy costs - CO2 emissions
Concept of improvement:
Description of the investment
Capital and Operation & maintenance expenditure
Description of the investment costs and operational costs for the measure described above.
Calculation of energy savings in MWh
Calculation of the energy savings from the proposed measure based on standard methodology
Calculation of emission reduction
Calculation of the direct CO2 reduction from the proposed measure based on standard methodology
Implementation schedule

13
The implementation plan with time schedule and disbursement schedule and the implications for the financing cash flow will be analyzed in this section.
Assessment of permits required
Procurement requirements
Technical feasibility analysis
Statement about the technical feasibility of the proposed measure(s) and assessment whether proven energy technologies and/or Best Available Technologies are used.
Short statement regarding the compliance with health, safety and environment standards of each measure.
14
4.3 Assessment on metering, control, and monitoring system
Metering system
Description how energy data are collected, stored and which meter are in use. Is there a metering management in place? Is staff trained to assess energy consumption on regular basis?
Monitoring
Is there a monitoring system in place? Is energy consumption checked against benchmark default values? Can deviation be detected?
Controling of energy use
Is there any planning of energy consumption in place? Are there anc guidelines on what to do if energy consumptions increases unexpected?
Targeting
Are there any objectives and goals for reducing energy demand in place?
Recommendations
Auditor shall give non-mandatory recommandations on how Metering, control and monitoring can be improved
4.4 Summary of savings, investment costs
Energy savings will be calculated by using a standard methodology.
The overall investment costs (excl. VAT) were estimated to xxx BGN.
The savings of electricity were calculated to xxx MWh per unit of production (reduction of xx % of the 201x consumption) and the savings of natural gas to xxx MWh per unit of production (reduction of xx % of the 201x consumption). The overall amount of CO2 reductions is around xx t per year.
The overall specific value for energy savings per invested BGN is xx kWh/BGN.
The detailed investment costs and the calculated savings on electricity and natural gas are shown in the table below.
Calculated values:
- Overall Energy savings in MWh per year - Overall Energy savings in MWh per unit of production, - Development of output after implementation if any - energy savings in % against baseline using ISI methodology - Energy costs after implementation (including best case and worst case scenario)

15
4.5 Implementation plan
The implementation plan was assessed for each measure.
Measure Project status Permits (if required)
Project start Project end
Measure 1:
Measure 2:
Measure 3:
Table 1: Implementation plan
ad project status
Project cycle: preliminary (preliminary design is available e.g. EA from PC), engineering (engineering documents are available), supplier selected (supplier already contracted, detailed design documents available), implementation (project is under construction), in operation (project is already in operation)
4.6 Monitoring Plan
In order to be able to evaluate the performance of each measure after the project implementation the following measurement equipment should be applied for recording the stated monitoring indicators.
Measure Monitoring indicator
Evaluation date Responsibility
Measure 1:
Measure 2:
Measure 3:
Indicators to be used will be provided
16
5 Assessment of compliance with environmental healt h & safety laws, regulation and standards
Short statement regarding the compliance with health, safety and environment standards of each measure.
6 Project Profitability analysis
The used model is in accordance with “Guide to cost-benefit analyses of investment projects” prepared for the Evaluation Unit DG Regional Policy European Commission and sponsored by Structural Fund (SF), Cohesion Fund (CF) and Instrument for Pre-Accession Countries (ISPA).
The analysis of financial indicators and the cash flow of the project were made with a software “ENSI Financial calculations”. This software is accepted as legitimate by the Energy Efficiency Agency. An interest rate under an investment loan is accepted, which is equal to xxx % and the grace period is xxx months. Estimated annual inflation rate for 201x (xx%), the value of funds which will be invested by (name of the company) (25% of total investment), and grant obtaining to the amount of xxx % on the loan under BEERECL, costs for operation and maintenance and the loan amount from the commercial bank.
(Name of the company) will repay the loan in equal (annuity) monthly installments. A maximum return period of the investments for the different energy saving measures is adopted– up to 10 years.
In table ……………. is presented a financial analysis for the implementation of energy saving measures as a result of the performed calculations, the submitted preliminary offers and the accepted pre-conditions for funding.
Fixed criteria:
- interest rate: 8%%
- Discount rate
- lifetime of invest 20 years
17
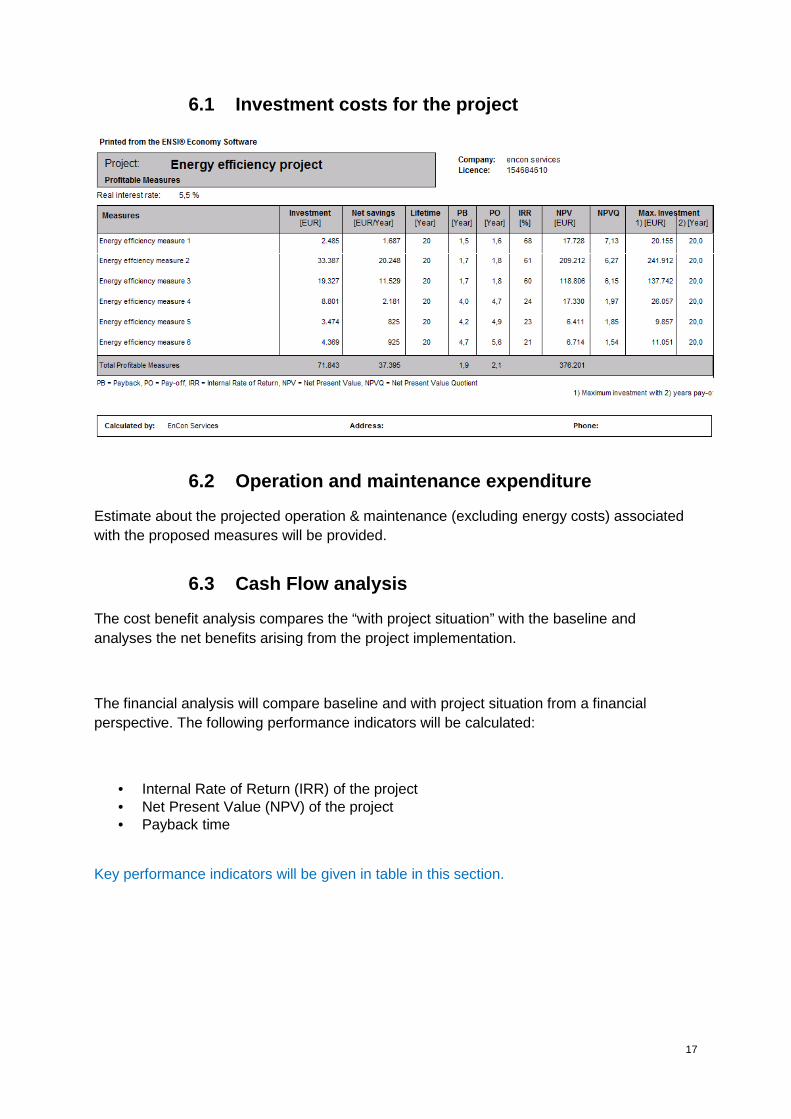
6.1 Investment costs for the project
6.2 Operation and maintenance expenditure
Estimate about the projected operation & maintenance (excluding energy costs) associated with the proposed measures will be provided.
6.3 Cash Flow analysis
The cost benefit analysis compares the “with project situation” with the baseline and analyses the net benefits arising from the project implementation.
The financial analysis will compare baseline and with project situation from a financial perspective. The following performance indicators will be calculated:
• Internal Rate of Return (IRR) of the project • Net Present Value (NPV) of the project • Payback time
Key performance indicators will be given in table in this section.

18
InvestmentAnnual
savings
Simple payback
periodIRR NPV
Yes No BGN BGN Years % %
MEE - 01 Energy efficiency measure 1 √ 4860 3299 1.5 67.9 34667 Very high
MEE - 02 Energy efficiency measure 2 √ 37800 22548 1.7 36.4 54881 High
MEE - 03 Energy efficiency measure 3 √ 8830 1810 4.9 20 12856 High
MEE - 04 Energy efficiency measure 4 √ 16300 5941 2.7 36.4 54881 Very high
MEE - 05 Energy efficiency measure 5 √ 5900 2366 2.5 40.1 22448 High
MEE - 06 Energy efficiency measure 6 √ 65300 39602 1.6 60.7 409187 High
MEE - 07 Energy efficiency measure 7 √ 294900 143899 2.0 48.8 1429208 High
MEE - Total Total for the project √ 433890 219465 2.0 2018128 High
Feasibility
analysis Priority
Investment plan and priority classification of energy efficiency measures
Energy efficiency measure
19
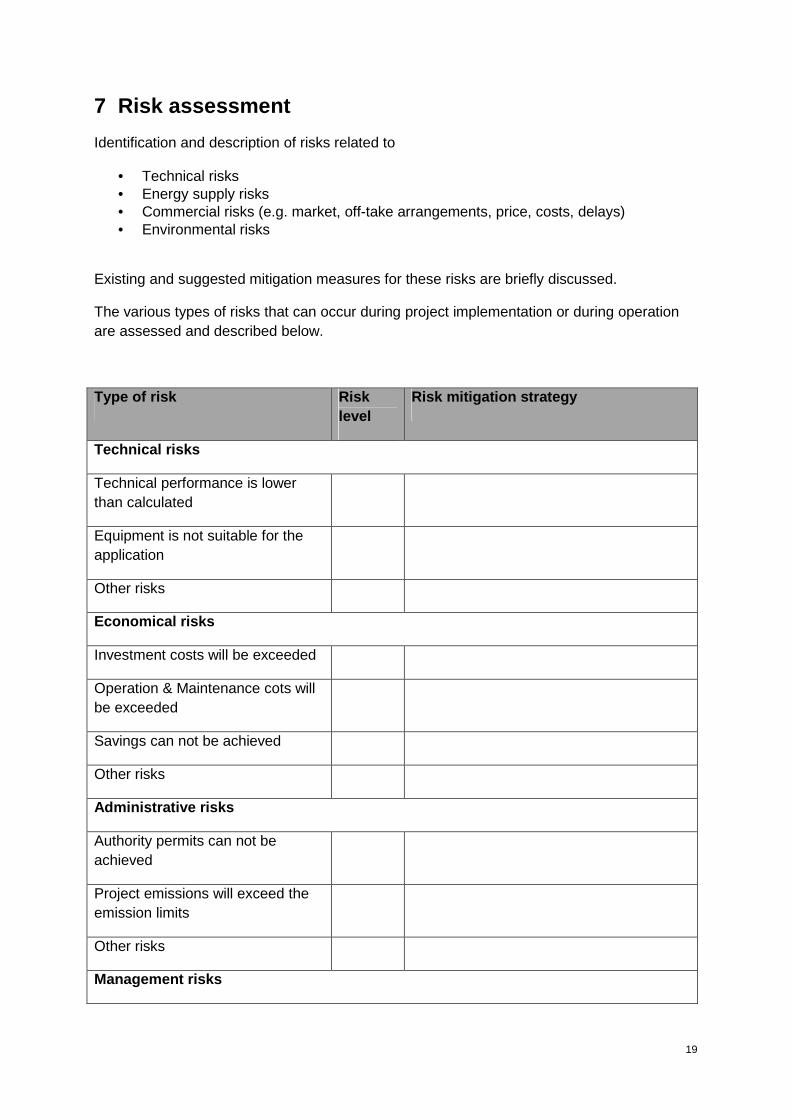
7 Risk assessment
Identification and description of risks related to
• Technical risks • Energy supply risks • Commercial risks (e.g. market, off-take arrangements, price, costs, delays) • Environmental risks
Existing and suggested mitigation measures for these risks are briefly discussed.
The various types of risks that can occur during project implementation or during operation are assessed and described below.
Type of risk Risk level
Risk mitigation strategy
Technical risks
Technical performance is lower than calculated
Equipment is not suitable for the application
Other risks
Economical risks
Investment costs will be exceeded
Operation & Maintenance cots will be exceeded
Savings can not be achieved
Other risks
Administrative risks
Authority permits can not be achieved
Project emissions will exceed the emission limits
Other risks
Management risks
20
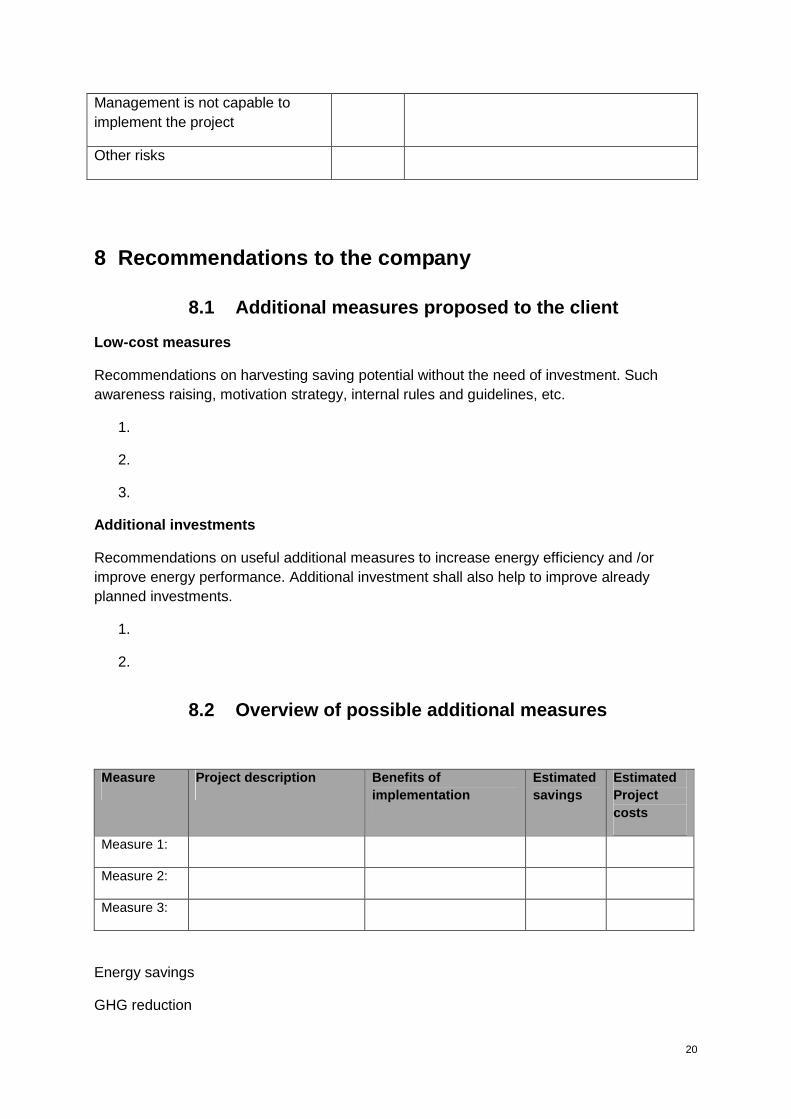
Management is not capable to implement the project
Other risks
8 Recommendations to the company
8.1 Additional measures proposed to the client
Low-cost measures
Recommendations on harvesting saving potential without the need of investment. Such awareness raising, motivation strategy, internal rules and guidelines, etc.
1.
2.
3.
Additional investments
Recommendations on useful additional measures to increase energy efficiency and /or improve energy performance. Additional investment shall also help to improve already planned investments.
1.
2.
8.2 Overview of possible additional measures
Measure Project description Benefits of implementation
Estimated savings
Estimated Project costs
Measure 1:
Measure 2:
Measure 3:
Energy savings
GHG reduction

21
Investment costs (estimated)
Estimated savings /year
Priorities
8.3 Cost benefit assessment on proposed measures
8.4 Further benefits from the projects
Apart from the costs and benefits listed above, the proposed investment may bring about further benefits in other fields, such as environmental or social benefits which will be briefly described in this section.

22
9 Assessment of eligibility under BEECIFF
9.1 Eligibility assessment
All measures are assessed in regard to the applicable eligible criteria under BEECIFF. The assessment shows that all proposed meets the eligible criteria, see table below.
General criteria Y / N Remark
The company is a legal and private enterprise
The companies business is not listed in the exclusion or referral list of the EBRD
Project criteria
The Project is in compliance with Bulgarian environmental, health & safety standards
Type of all measures is eligible
EE: Overall value for energy savings reaches 10%
Table 2: Eligibility assessment
23
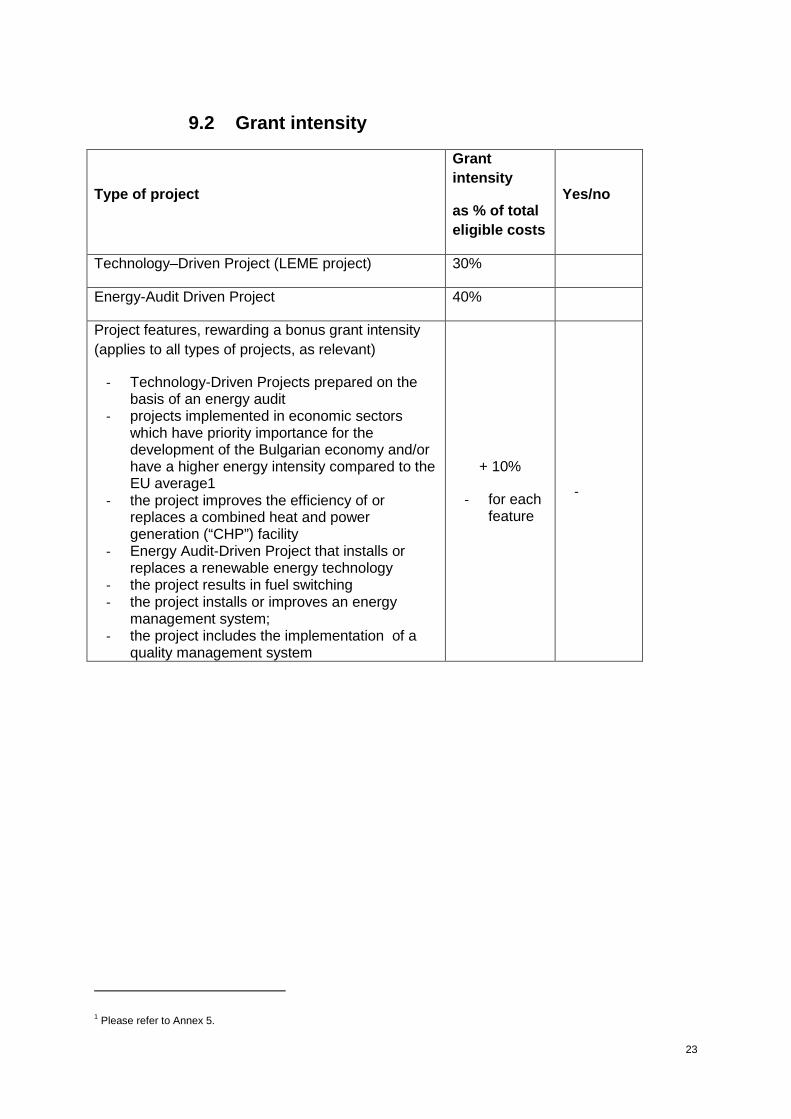
9.2 Grant intensity
Type of project
Grant intensity
as % of total eligible costs
Yes/no
Technology–Driven Project (LEME project) 30%
Energy-Audit Driven Project 40%
Project features, rewarding a bonus grant intensity (applies to all types of projects, as relevant)
- Technology-Driven Projects prepared on the basis of an energy audit
- projects implemented in economic sectors which have priority importance for the development of the Bulgarian economy and/or have a higher energy intensity compared to the EU average1
- the project improves the efficiency of or replaces a combined heat and power generation (“CHP”) facility
- Energy Audit-Driven Project that installs or replaces a renewable energy technology
- the project results in fuel switching - the project installs or improves an energy
management system; - the project includes the implementation of a
quality management system
+ 10%
- for each feature
-
1 Please refer to Annex 5.
24
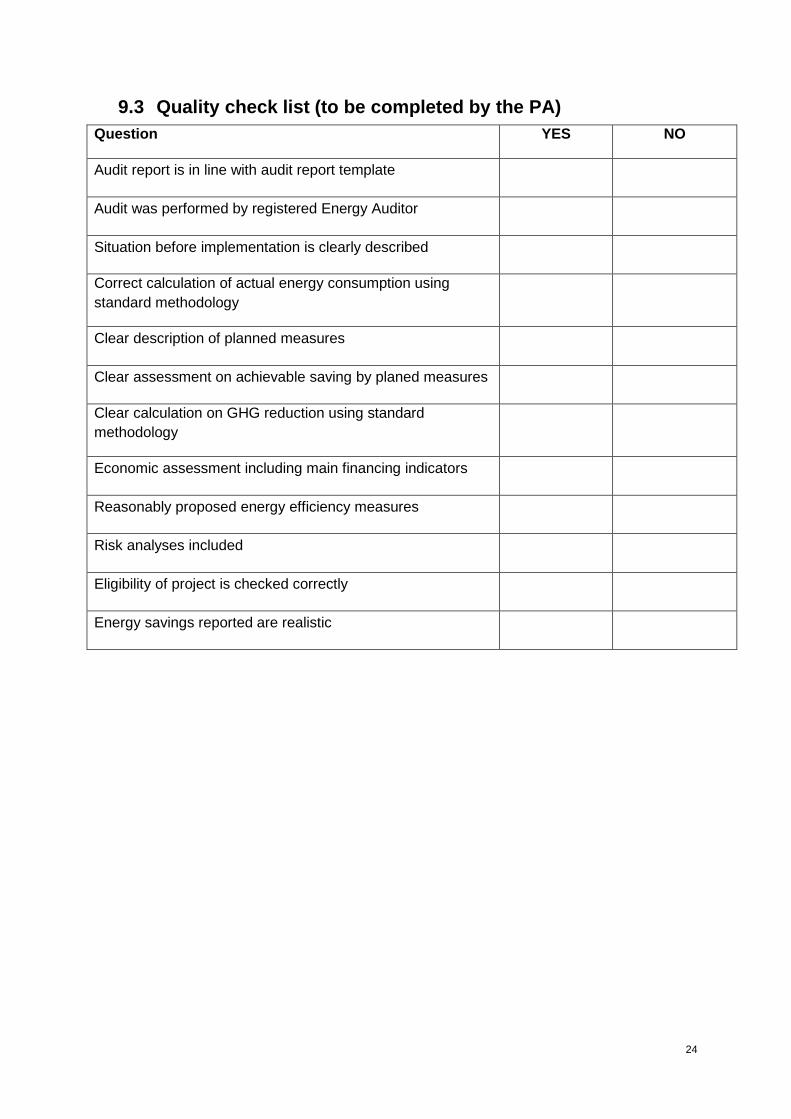
9.3 Quality check list (to be completed by the PA) Question YES NO
Audit report is in line with audit report template
Audit was performed by registered Energy Auditor
Situation before implementation is clearly described
Correct calculation of actual energy consumption using standard methodology
Clear description of planned measures
Clear assessment on achievable saving by planed measures
Clear calculation on GHG reduction using standard methodology
Economic assessment including main financing indicators
Reasonably proposed energy efficiency measures
Risk analyses included
Eligibility of project is checked correctly
Energy savings reported are realistic

ANNEX II
Example of an Simplified Energy Audit
BEECIFF
Company name: MTB Group Ltd
Project No: Example
Industrial Sector: Food production
ENERGY AUDIT REPORT
This Energy Audit Report was prepared for:
XXX Bank
2-III
Table of Contents
ANNEX II - Example of an Simplified Energy Audit ........................................................................... 1
1 Executive Summary ................................................................................................................... 6
1.1 Key message regarding project eligibility ............................................................ 6
1.2 Company profile .................................................................................................. 6
1.3 The planned investment project .......................................................................... 6
1.4 Energy savings and CO2 reductions................................................................... 7
1.5 Financial costs and benefits ................................................................................ 8
1.6 Further energy saving potential........................................................................... 8
1.7 Assessment of the environmental health and safety standards and regulations:8
1.8 Risk assessment: ................................................................................................ 8
2 Introduction................................................................................................................................. 9
3 Company profile, general project information .......................................................................... 10
3.1 Production data, energy data ............................................................................ 10
3.2 Description of production process and core business....................................... 11
3.3 Status of energy supply systems....................................................................... 11
3.3.1 Electricity ........................................................................................................... 11
3.3.2 Natural gas ........................................................................................................ 12
4 Investment projects .................................................................................................................. 13
4.1 Project 1: Optimizing steam boiler system ........................................................ 14
4.2 Project 2: Optimization of the ventilation system in the sweets production hall 18
4.3 Project 3: Implementation of a chiller system (incl. waste heat recovery system) for cold storage warehouse.......................................................................................................... 21
4.4 Project 4: Energy data monitoring system ........................................................ 24
4.5 Summary of production, savings, investment costs .......................................... 26
4.6 Implementation plan .......................................................................................... 27
4.7 Monitoring Plan.................................................................................................. 27
5 Assessment of compliance with environmental, health & safety laws, regulation and standards 29
2-IV
6 Profitability analysis.................................................................................................................. 30
6.1 Capital expenditure, Operation & Maintenance expenditure (incl. VAT)........... 30
6.2 Cash Flow Analysis ........................................................................................... 31
7 Risk Assessment...................................................................................................................... 32
8 Recommendations to the company.......................................................................................... 33
8.1 Overview of possible additional measures........................................................ 33
8.2 Further benefits from the projects ..................................................................... 34
9 Assessment of eligibility under BEECIFF................................................................................. 35
9.1 Eligibility assessment ........................................................................................ 35
9.2 Quality check list (to be completed by the PA).................................................. 36
2-V
List of Tables
Table 3: Summary of turnover, energy consumption, specific values ............................................. 11 Table 4: Electricity consumption (prices and costs incl. VAT) ......................................................... 12 Table 5: Natural gas consumption (prices and costs incl. VAT) ...................................................... 12 Table 6: Calculation of annual savings ............................................................................................ 18 Table 7: Calculation of annual savings ............................................................................................ 20 Table 8: Calculation of annual savings ............................................................................................ 23 Table 9: Calculation of annual savings ............................................................................................ 25 Table 10: Summary of production, savings, investment costs......................................................... 27 Table 11: Implementation plan......................................................................................................... 27 Table 12: Monitoring plan................................................................................................................. 28 Table 13: Capital expenditure, operation & maintenance expenditure ............................................ 30 Table 14: Results of the Cash Flow Analysis................................................................................... 32 Table 15: Risk Assessment.............................................................................................................. 33 Table 16: Eligibility assessment ....................................................................................................... 35
6
1 Executive Summary
1.1 Key message regarding project eligibility
the sub borrower as well as the proposed measures meet the eligibility criteria under BEECIFF.
1.2 Company profile
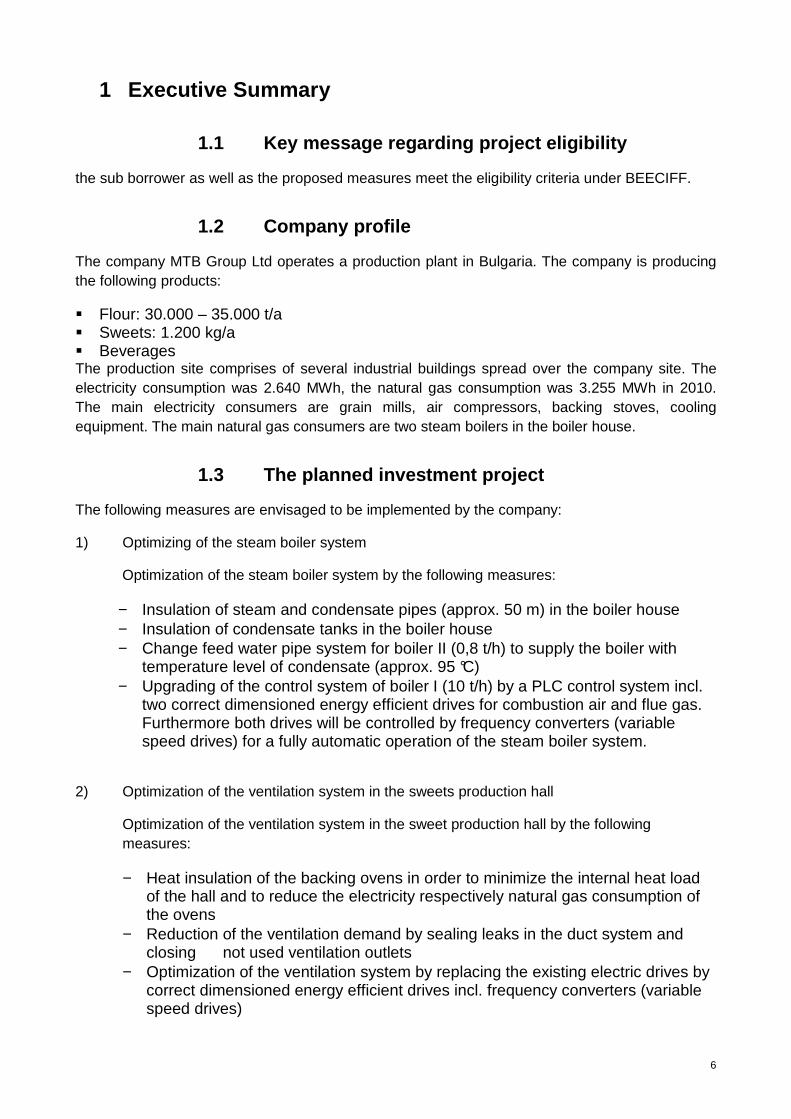
The company MTB Group Ltd operates a production plant in Bulgaria. The company is producing the following products:
� Flour: 30.000 – 35.000 t/a � Sweets: 1.200 kg/a � Beverages The production site comprises of several industrial buildings spread over the company site. The electricity consumption was 2.640 MWh, the natural gas consumption was 3.255 MWh in 2010. The main electricity consumers are grain mills, air compressors, backing stoves, cooling equipment. The main natural gas consumers are two steam boilers in the boiler house.
1.3 The planned investment project
The following measures are envisaged to be implemented by the company:
1) Optimizing of the steam boiler system
Optimization of the steam boiler system by the following measures:
− Insulation of steam and condensate pipes (approx. 50 m) in the boiler house − Insulation of condensate tanks in the boiler house − Change feed water pipe system for boiler II (0,8 t/h) to supply the boiler with
temperature level of condensate (approx. 95 °C) − Upgrading of the control system of boiler I (10 t/h) by a PLC control system incl.
two correct dimensioned energy efficient drives for combustion air and flue gas. Furthermore both drives will be controlled by frequency converters (variable speed drives) for a fully automatic operation of the steam boiler system.
2) Optimization of the ventilation system in the sweets production hall
Optimization of the ventilation system in the sweet production hall by the following measures:
− Heat insulation of the backing ovens in order to minimize the internal heat load of the hall and to reduce the electricity respectively natural gas consumption of the ovens
− Reduction of the ventilation demand by sealing leaks in the duct system and closing not used ventilation outlets
− Optimization of the ventilation system by replacing the existing electric drives by correct dimensioned energy efficient drives incl. frequency converters (variable speed drives)
7
− Adjusting the ventilation demand to the needs of the production
3) Implementation of a chiller system (incl. waste heat recovery system) for a new cold storage warehouse The company plans to erect a new cold storage warehouse of total 2.000 m² (area A: 1.000 m² < -10 °C and area B: 1.000 m² +2°C to + 5 °C) The cooling energy for cooling area A will be produced by a conventional chiller system with waste heat recovery system, cooling energy for cooling area B will be produced by a energy efficient chiller system (variable speed drive) with waste heat recovery system. Waste heat is transported via pipe system to a storage tank (6 m³) in the main building for heating and hot water preparation purposes.
4) Energy data management system Implementation of an energy data monitoring system comprising of an automatic recording system of energy data of the main 20 consumers and energy data management software
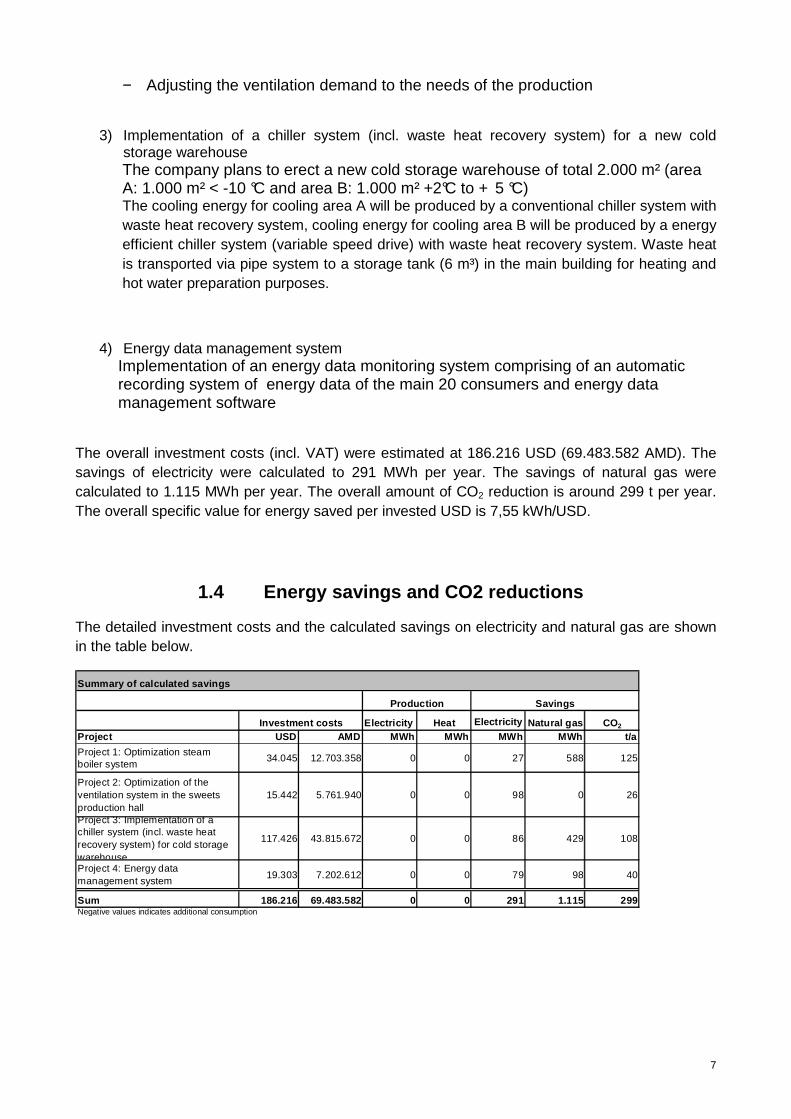
The overall investment costs (incl. VAT) were estimated at 186.216 USD (69.483.582 AMD). The savings of electricity were calculated to 291 MWh per year. The savings of natural gas were calculated to 1.115 MWh per year. The overall amount of CO2 reduction is around 299 t per year. The overall specific value for energy saved per invested USD is 7,55 kWh/USD.
1.4 Energy savings and CO2 reductions
The detailed investment costs and the calculated savings on electricity and natural gas are shown in the table below.
Electricity Heat Electricity Natural gas CO 2
Project USD AMD MWh MWh MWh MWh t/a
Project 1: Optimization steam boiler system
34.045 12.703.358 0 0 27 588 125
Project 2: Optimization of the ventilation system in the sweets production hall
15.442 5.761.940 0 0 98 0 26
Project 3: Implementation of a chiller system (incl. waste heat recovery system) for cold storage warehouse
117.426 43.815.672 0 0 86 429 108
Project 4: Energy data management system
19.303 7.202.612 0 0 79 98 40
Sum 186.216 69.483.582 0 0 291 1.115 299Negative values indicates additional consumption
Summary of calculated savings
Investment costs
SavingsProduction
8
1.5 Financial costs and benefits
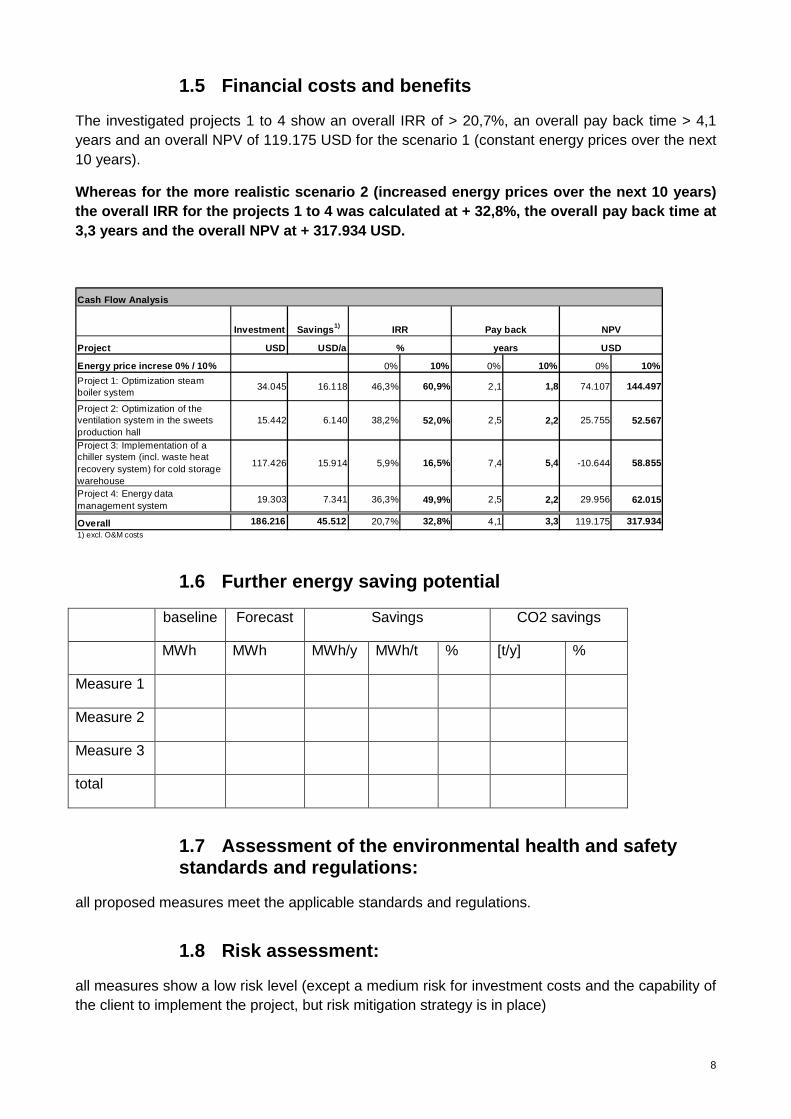
The investigated projects 1 to 4 show an overall IRR of > 20,7%, an overall pay back time > 4,1 years and an overall NPV of 119.175 USD for the scenario 1 (constant energy prices over the next 10 years).
Whereas for the more realistic scenario 2 (increase d energy prices over the next 10 years) the overall IRR for the projects 1 to 4 was calcula ted at + 32,8%, the overall pay back time at 3,3 years and the overall NPV at + 317.934 USD.
Cash Flow Analysis
Investment Savings 1)
Project USD USD/a
Energy price increse 0% / 10% 0% 10% 0% 10% 0% 10%
Project 1: Optimization steam boiler system
34.045 16.118 46,3% 60,9% 2,1 1,8 74.107 144.497
Project 2: Optimization of the ventilation system in the sweets production hall
15.442 6.140 38,2% 52,0% 2,5 2,2 25.755 52.567
Project 3: Implementation of a chiller system (incl. waste heat recovery system) for cold storage warehouse
117.426 15.914 5,9% 16,5% 7,4 5,4 -10.644 58.855
Project 4: Energy data management system
19.303 7.341 36,3% 49,9% 2,5 2,2 29.956 62.015
Overall 186.216 45.512 20,7% 32,8% 4,1 3,3 119.175 317.9341) excl. O&M costs
IRR Pay back
% years
NPV
USD
1.6 Further energy saving potential
baseline Forecast Savings CO2 savings
MWh MWh MWh/y MWh/t % [t/y] %
Measure 1
Measure 2
Measure 3
total
1.7 Assessment of the environmental health and safety standards and regulations:
all proposed measures meet the applicable standards and regulations.
1.8 Risk assessment:
all measures show a low risk level (except a medium risk for investment costs and the capability of the client to implement the project, but risk mitigation strategy is in place)
9
2 Introduction
Background
This energy audit was prepared within the framework of the Energy Efficiency for Competitive Industry Financing Facility (BEECIFF). The EBRD has established BEECIFF in the form of a dedicated credit facility that provides funds to participating banks for on-lending to Bulgarian private companies. The goal is to support investment in energy efficiency and renewable energy projects, thereby reducing energy consumption and green house gas emissions.
Audited company:
MTB Ltd
Auditing team:
International energy expert
Local energy expert
Company staff:
Director
Date of Energy Audit: 26.04.2011
10
3 Company profile, general project information
The company MTB Ltd operates a production plant in Yerevan. The company is producing the following products:
� Flour: 30.000 – 35.000 t/a � Sweets: 1.200 kg/a � Beverages The production site comprises of several industrial buildings spread over the company site. The electricity consumption was 2.640 MWh, the natural gas consumption was 3.255 MWh in 2010. The main electricity consumers are grain mills, air compressors, backing stoves, cooling equipment. The main natural gas consumers are two steam boilers in the boiler house.
3.1 Production data, energy data
The total turnover was 20,5 Mio. USD in 2010. The electricity costs had a share of 0,8% of the turnover in 2010. The electricity consumption amounted to 2.514 MWh in 2008 and 2.640 MWh in 2010 (increase of +5%).
The natural gas costs had a share of 0,4% of the turnover in 2010. The gas consumption amounted to 267 MWh in 2008 (not representative) and 3.255 MWh in 2010.
The total energy costs had a share of 1,2% in 2010 of the turnover.
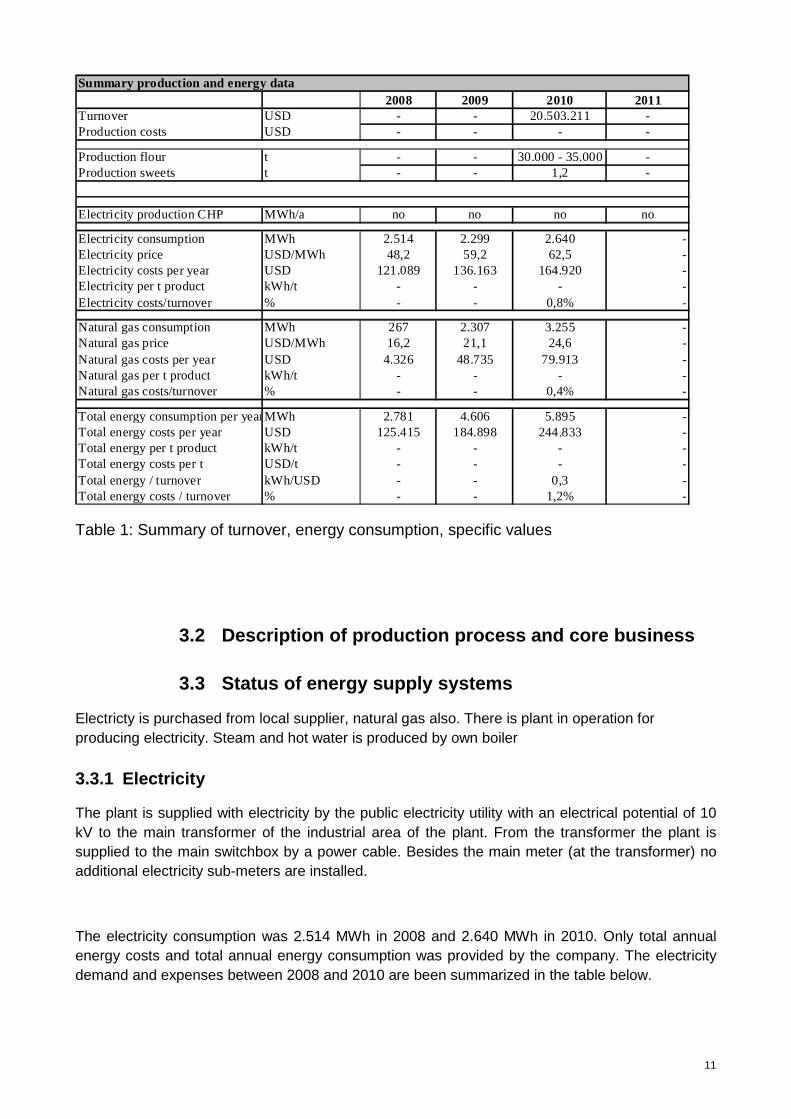
The table below gives an overview about turnover, energy consumption, specific values.
11
2008 2009 2010 2011Turnover USD - - 20.503.211 -Production costs USD - - - -
Production flour t - - 30.000 - 35.000 -Production sweets t - - 1,2 -
Electricity production CHP MWh/a no no no no
Electricity consumption MWh 2.514 2.299 2.640 -Electricity price USD/MWh 48,2 59,2 62,5 -Electricity costs per year USD 121.089 136.163 164.920 -Electricity per t product kWh/t - - - -Electricity costs/turnover % - - 0,8% -
Natural gas consumption MWh 267 2.307 3.255 -Natural gas price USD/MWh 16,2 21,1 24,6 -Natural gas costs per year USD 4.326 48.735 79.913 -Natural gas per t product kWh/t - - - -Natural gas costs/turnover % - - 0,4% -
Total energy consumption per yearMWh 2.781 4.606 5.895 -Total energy costs per year USD 125.415 184.898 244.833 -Total energy per t product kWh/t - - - -Total energy costs per t USD/t - - - -Total energy / turnover kWh/USD - - 0,3 -Total energy costs / turnover % - - 1,2% -
Summary production and energy data
Table 1: Summary of turnover, energy consumption, specific values
3.2 Description of production process and core business
3.3 Status of energy supply systems
Electricty is purchased from local supplier, natural gas also. There is plant in operation for producing electricity. Steam and hot water is produced by own boiler
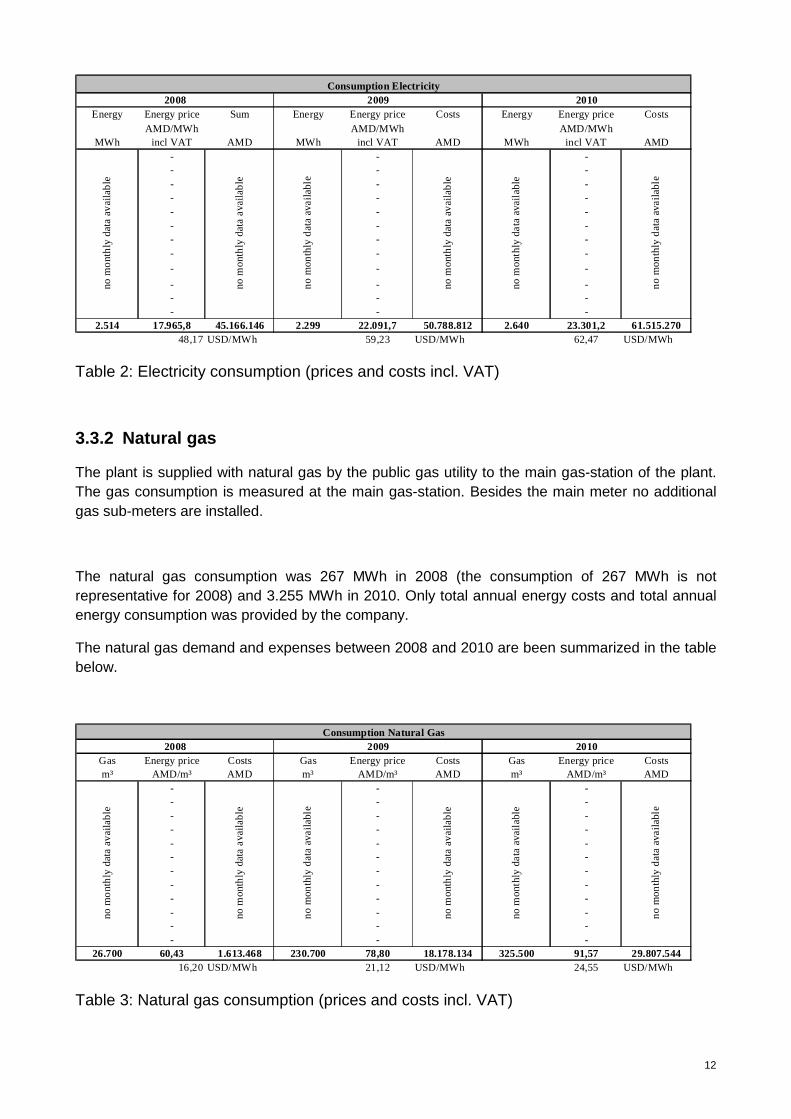
3.3.1 Electricity
The plant is supplied with electricity by the public electricity utility with an electrical potential of 10 kV to the main transformer of the industrial area of the plant. From the transformer the plant is supplied to the main switchbox by a power cable. Besides the main meter (at the transformer) no additional electricity sub-meters are installed.
The electricity consumption was 2.514 MWh in 2008 and 2.640 MWh in 2010. Only total annual energy costs and total annual energy consumption was provided by the company. The electricity demand and expenses between 2008 and 2010 are been summarized in the table below.
12
Energy Energy price Sum Energy Energy price Costs Energy Energy price Costs
MWhAMD/MWh
incl VAT AMD MWhAMD/MWh
incl VAT AMD MWhAMD/MWh incl VAT AMD
- - -- - -- - -- - -- - -- - -- - -- - -
- - -
- - -- - -- - -
2.514 17.965,8 45.166.146 2.299 22.091,7 50.788.812 2.640 23.301,2 61.515.27048,17 USD/MWh 59,23 USD/MWh 62,47 USD/MWh
Consumption Electricity2009 20102008
no m
ont
hly
da
ta a
va
ilab
le
no m
onth
ly d
ata
ava
ilab
le
no
mon
thly
da
ta a
vaila
ble
no m
onth
ly d
ata
av
aila
ble
no m
onth
ly d
ata
ava
ilab
le
no
mon
thly
da
ta a
vaila
ble
Table 2: Electricity consumption (prices and costs incl. VAT)
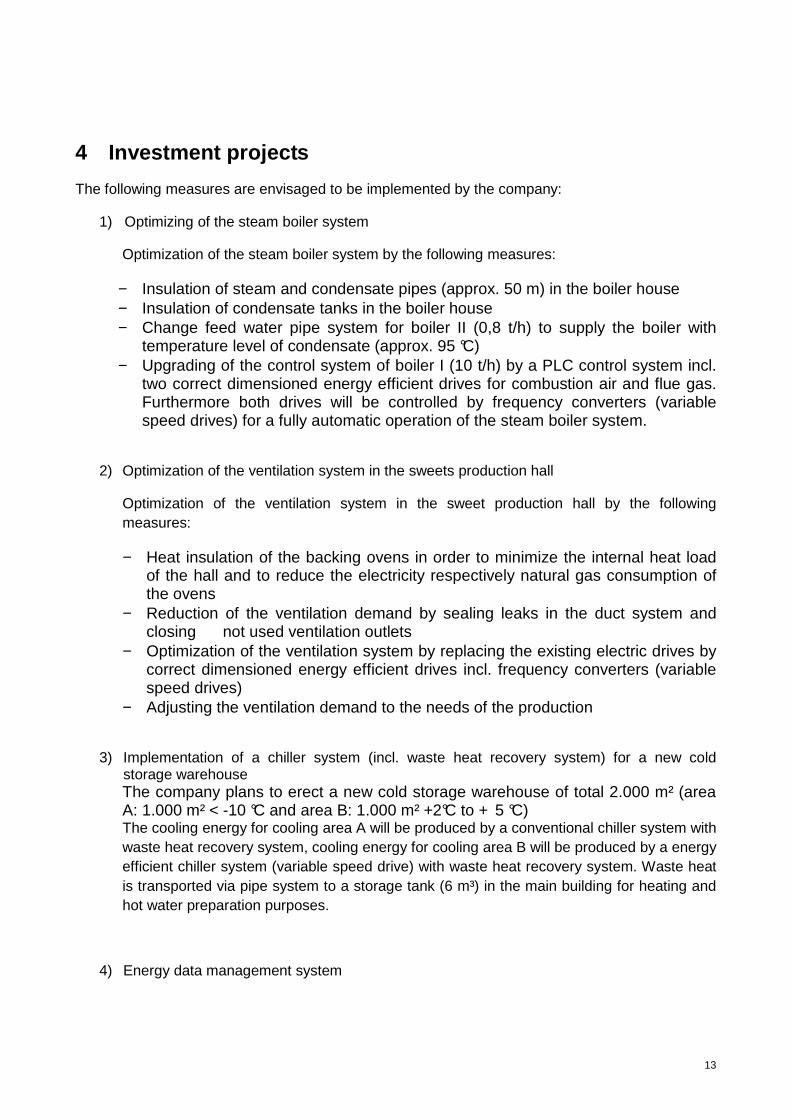
3.3.2 Natural gas
The plant is supplied with natural gas by the public gas utility to the main gas-station of the plant. The gas consumption is measured at the main gas-station. Besides the main meter no additional gas sub-meters are installed.
The natural gas consumption was 267 MWh in 2008 (the consumption of 267 MWh is not representative for 2008) and 3.255 MWh in 2010. Only total annual energy costs and total annual energy consumption was provided by the company.
The natural gas demand and expenses between 2008 and 2010 are been summarized in the table below.
Gas Energy price Costs Gas Energy price Costs Gas Energy price Costsm³ AMD/m³ AMD m³ AMD/m³ AMD m³ AMD/m³ AMD
- - -- - -- - -- - -- - -- - -- - -- - -- - -- - -- - -- - -
26.700 60,43 1.613.468 230.700 78,80 18.178.134 325.500 91,57 29.807.54416,20 USD/MWh 21,12 USD/MWh 24,55 USD/MWh
2009Consumption Natural Gas
no m
onth
ly d
ata
ava
ilabl
e
no
mon
thly
da
ta a
vaila
ble
20102008
no m
ont
hly
dat
a a
vaila
ble
no m
onth
ly d
ata
ava
ilab
le
no
mon
thly
da
ta a
vaila
ble
no m
onth
ly d
ata
ava
ilab
le
Table 3: Natural gas consumption (prices and costs incl. VAT)
13
4 Investment projects
The following measures are envisaged to be implemented by the company:
1) Optimizing of the steam boiler system
Optimization of the steam boiler system by the following measures:
− Insulation of steam and condensate pipes (approx. 50 m) in the boiler house − Insulation of condensate tanks in the boiler house − Change feed water pipe system for boiler II (0,8 t/h) to supply the boiler with
temperature level of condensate (approx. 95 °C) − Upgrading of the control system of boiler I (10 t/h) by a PLC control system incl.
two correct dimensioned energy efficient drives for combustion air and flue gas. Furthermore both drives will be controlled by frequency converters (variable speed drives) for a fully automatic operation of the steam boiler system.
2) Optimization of the ventilation system in the sweets production hall
Optimization of the ventilation system in the sweet production hall by the following measures:
− Heat insulation of the backing ovens in order to minimize the internal heat load of the hall and to reduce the electricity respectively natural gas consumption of the ovens
− Reduction of the ventilation demand by sealing leaks in the duct system and closing not used ventilation outlets
− Optimization of the ventilation system by replacing the existing electric drives by correct dimensioned energy efficient drives incl. frequency converters (variable speed drives)
− Adjusting the ventilation demand to the needs of the production
3) Implementation of a chiller system (incl. waste heat recovery system) for a new cold storage warehouse The company plans to erect a new cold storage warehouse of total 2.000 m² (area A: 1.000 m² < -10 °C and area B: 1.000 m² +2°C to + 5 °C) The cooling energy for cooling area A will be produced by a conventional chiller system with waste heat recovery system, cooling energy for cooling area B will be produced by a energy efficient chiller system (variable speed drive) with waste heat recovery system. Waste heat is transported via pipe system to a storage tank (6 m³) in the main building for heating and hot water preparation purposes.
4) Energy data management system
14
Implementation of an energy data monitoring system comprising of an automatic recording system of energy data of the main 20 consumers and energy data management software
For each sub-project a specific baseline-scenario was developed. The baseline-scenario describes the scenario what would happen if the proposed saving project will not be implemented. In case of optimization of existing equipment the current used equipment (and it´s energy consumption) represents the baseline-scenario.
In case of a greenfield project or substantial enlargement of the production capacity, new production equipment with the lowest investment costs (and it´s energy consumption) will be considered as baseline–scenario.
4.1 Project 1: Optimizing steam boiler system
Description of the baseline scenario (current situa tion)
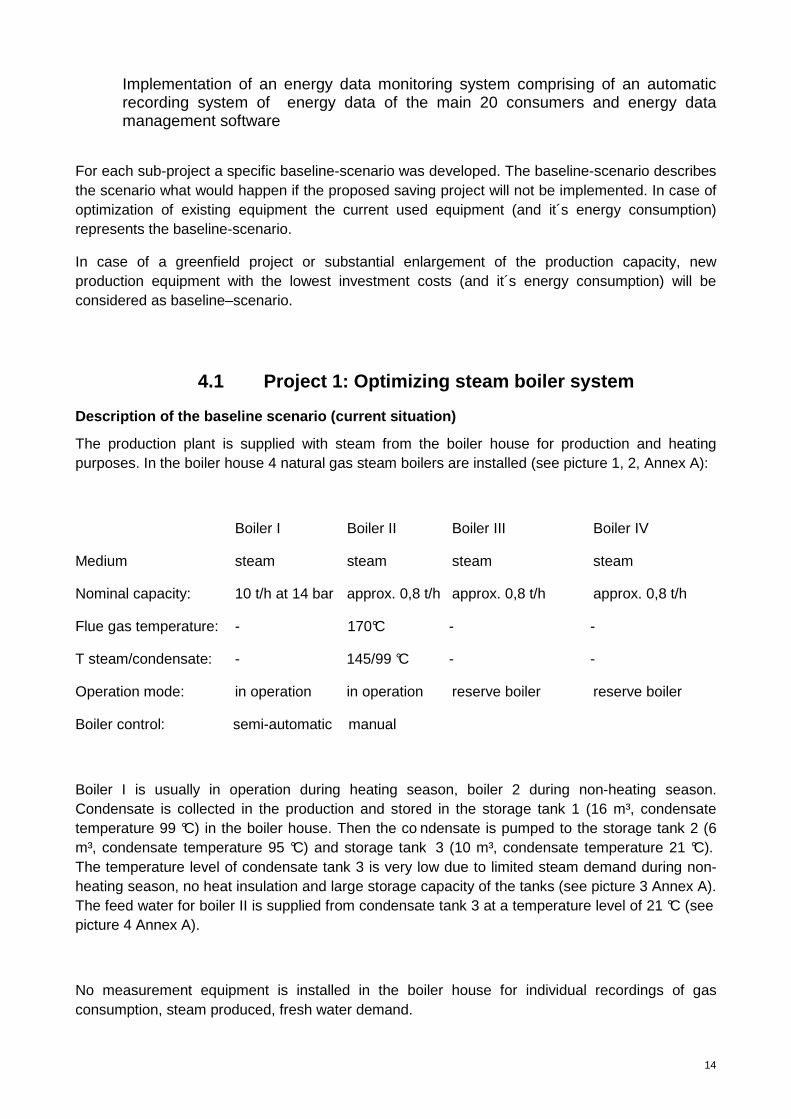
The production plant is supplied with steam from the boiler house for production and heating purposes. In the boiler house 4 natural gas steam boilers are installed (see picture 1, 2, Annex A):
Boiler I Boiler II Boiler III Boiler IV
Medium steam steam steam steam
Nominal capacity: 10 t/h at 14 bar approx. 0,8 t/h approx. 0,8 t/h approx. 0,8 t/h
Flue gas temperature: - 170°C - -
T steam/condensate: - 145/99 °C - -
Operation mode: in operation in operation reserve boiler reserve boiler
Boiler control: semi-automatic manual
Boiler I is usually in operation during heating season, boiler 2 during non-heating season. Condensate is collected in the production and stored in the storage tank 1 (16 m³, condensate temperature 99 °C) in the boiler house. Then the co ndensate is pumped to the storage tank 2 (6 m³, condensate temperature 95 °C) and storage tank 3 (10 m³, condensate temperature 21 °C). The temperature level of condensate tank 3 is very low due to limited steam demand during non-heating season, no heat insulation and large storage capacity of the tanks (see picture 3 Annex A). The feed water for boiler II is supplied from condensate tank 3 at a temperature level of 21 °C (see picture 4 Annex A).
No measurement equipment is installed in the boiler house for individual recordings of gas consumption, steam produced, fresh water demand.
15
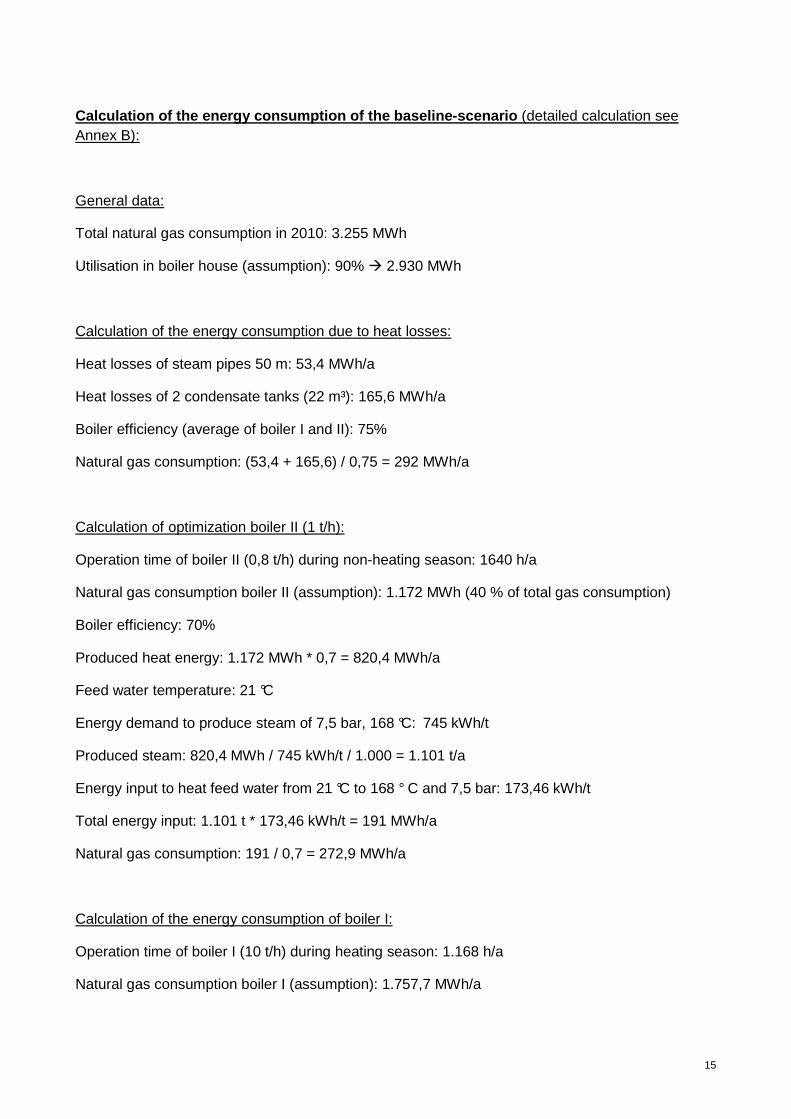
Calculation of the energy consumption of the baseli ne-scenario (detailed calculation see Annex B):
General data:
Total natural gas consumption in 2010: 3.255 MWh
Utilisation in boiler house (assumption): 90% � 2.930 MWh
Calculation of the energy consumption due to heat losses:
Heat losses of steam pipes 50 m: 53,4 MWh/a
Heat losses of 2 condensate tanks (22 m³): 165,6 MWh/a
Boiler efficiency (average of boiler I and II): 75%
Natural gas consumption: (53,4 + 165,6) / 0,75 = 292 MWh/a
Calculation of optimization boiler II (1 t/h):
Operation time of boiler II (0,8 t/h) during non-heating season: 1640 h/a
Natural gas consumption boiler II (assumption): 1.172 MWh (40 % of total gas consumption)
Boiler efficiency: 70%
Produced heat energy: 1.172 MWh * 0,7 = 820,4 MWh/a
Feed water temperature: 21 °C
Energy demand to produce steam of 7,5 bar, 168 °C: 745 kWh/t
Produced steam: 820,4 MWh / 745 kWh/t / 1.000 = 1.101 t/a
Energy input to heat feed water from 21 °C to 168 ° C and 7,5 bar: 173,46 kWh/t
Total energy input: 1.101 t * 173,46 kWh/t = 191 MWh/a
Natural gas consumption: 191 / 0,7 = 272,9 MWh/a
Calculation of the energy consumption of boiler I:
Operation time of boiler I (10 t/h) during heating season: 1.168 h/a
Natural gas consumption boiler I (assumption): 1.757,7 MWh/a
16
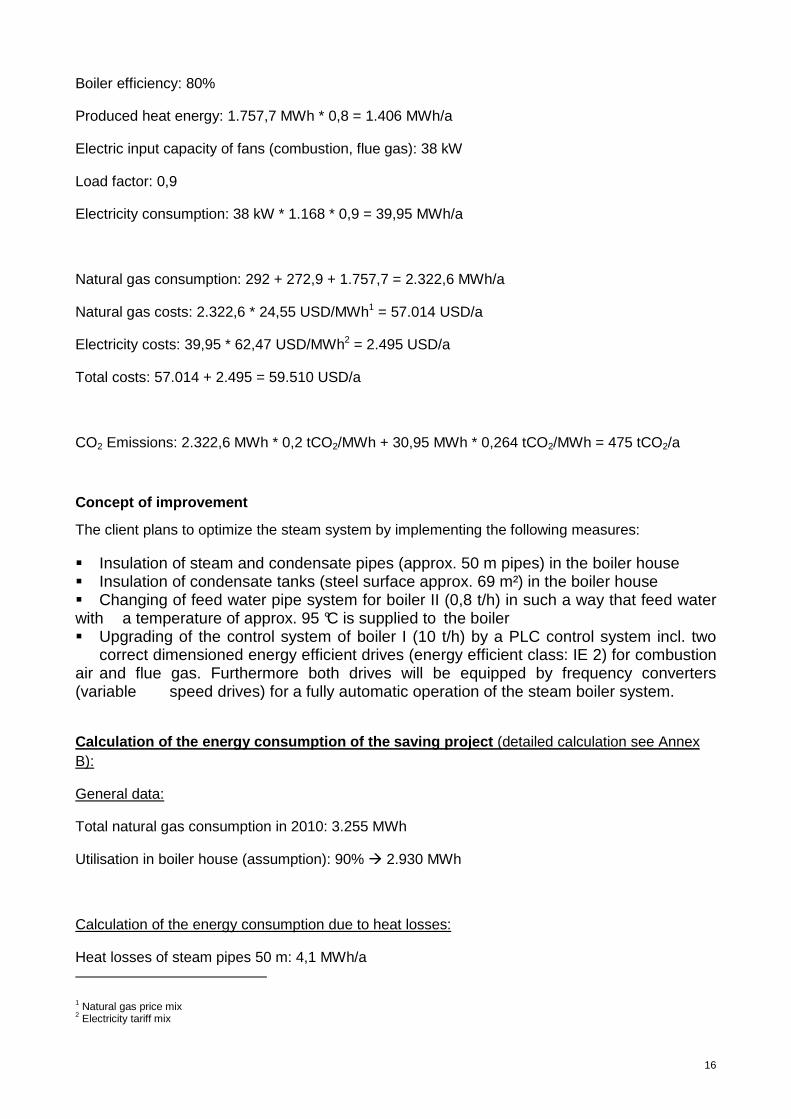
Boiler efficiency: 80%
Produced heat energy: 1.757,7 MWh * 0,8 = 1.406 MWh/a
Electric input capacity of fans (combustion, flue gas): 38 kW
Load factor: 0,9
Electricity consumption: 38 kW * 1.168 * 0,9 = 39,95 MWh/a
Natural gas consumption: 292 + 272,9 + 1.757,7 = 2.322,6 MWh/a
Natural gas costs: 2.322,6 * 24,55 USD/MWh1 = 57.014 USD/a
Electricity costs: 39,95 * 62,47 USD/MWh2 = 2.495 USD/a
Total costs: 57.014 + 2.495 = 59.510 USD/a
CO2 Emissions: 2.322,6 MWh * 0,2 tCO2/MWh + 30,95 MWh * 0,264 tCO2/MWh = 475 tCO2/a
Concept of improvement
The client plans to optimize the steam system by implementing the following measures:
� Insulation of steam and condensate pipes (approx. 50 m pipes) in the boiler house � Insulation of condensate tanks (steel surface approx. 69 m²) in the boiler house � Changing of feed water pipe system for boiler II (0,8 t/h) in such a way that feed water with a temperature of approx. 95 °C is supplied to the boiler � Upgrading of the control system of boiler I (10 t/h) by a PLC control system incl. two correct dimensioned energy efficient drives (energy efficient class: IE 2) for combustion air and flue gas. Furthermore both drives will be equipped by frequency converters (variable speed drives) for a fully automatic operation of the steam boiler system.
Calculation of the energy consumption of the saving project (detailed calculation see Annex B):
General data:
Total natural gas consumption in 2010: 3.255 MWh
Utilisation in boiler house (assumption): 90% � 2.930 MWh
Calculation of the energy consumption due to heat losses:
Heat losses of steam pipes 50 m: 4,1 MWh/a
1 Natural gas price mix 2 Electricity tariff mix
17
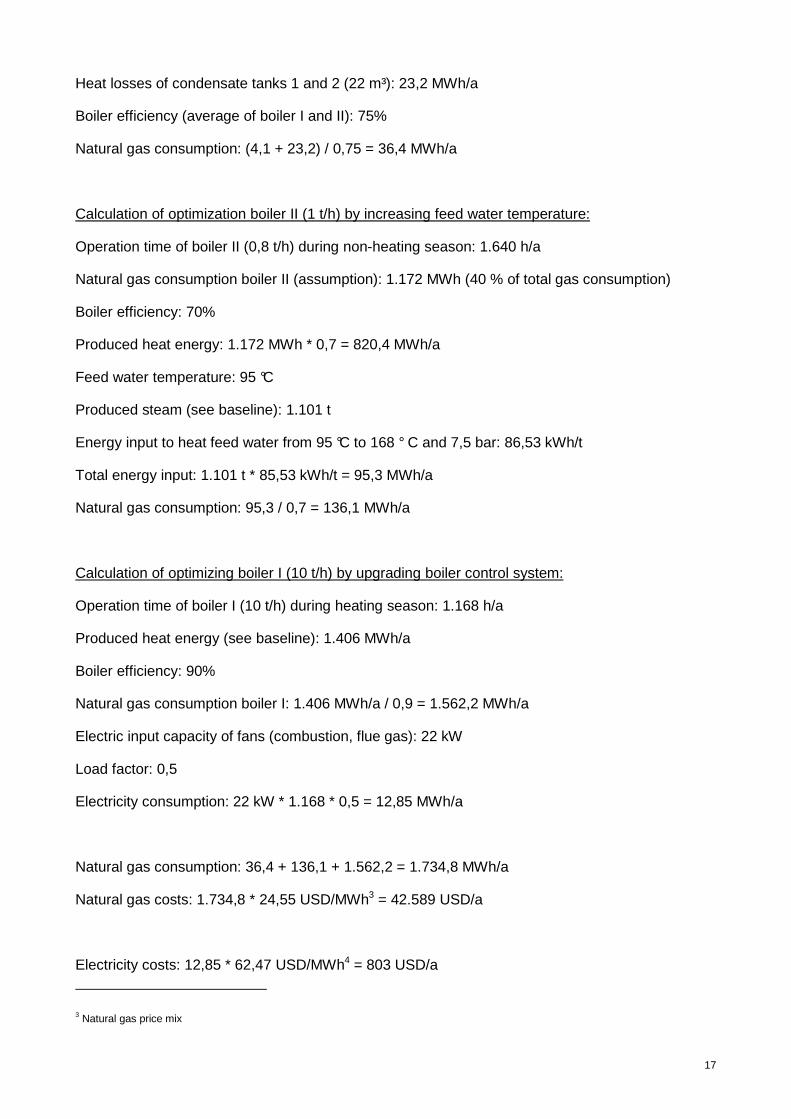
Heat losses of condensate tanks 1 and 2 (22 m³): 23,2 MWh/a
Boiler efficiency (average of boiler I and II): 75%
Natural gas consumption: (4,1 + 23,2) / 0,75 = 36,4 MWh/a
Calculation of optimization boiler II (1 t/h) by increasing feed water temperature:
Operation time of boiler II (0,8 t/h) during non-heating season: 1.640 h/a
Natural gas consumption boiler II (assumption): 1.172 MWh (40 % of total gas consumption)
Boiler efficiency: 70%
Produced heat energy: 1.172 MWh * 0,7 = 820,4 MWh/a
Feed water temperature: 95 °C
Produced steam (see baseline): 1.101 t
Energy input to heat feed water from 95 °C to 168 ° C and 7,5 bar: 86,53 kWh/t
Total energy input: 1.101 t * 85,53 kWh/t = 95,3 MWh/a
Natural gas consumption: 95,3 / 0,7 = 136,1 MWh/a
Calculation of optimizing boiler I (10 t/h) by upgrading boiler control system:
Operation time of boiler I (10 t/h) during heating season: 1.168 h/a
Produced heat energy (see baseline): 1.406 MWh/a
Boiler efficiency: 90%
Natural gas consumption boiler I: 1.406 MWh/a / 0,9 = 1.562,2 MWh/a
Electric input capacity of fans (combustion, flue gas): 22 kW
Load factor: 0,5
Electricity consumption: 22 kW * 1.168 * 0,5 = 12,85 MWh/a
Natural gas consumption: 36,4 + 136,1 + 1.562,2 = 1.734,8 MWh/a
Natural gas costs: 1.734,8 * 24,55 USD/MWh3 = 42.589 USD/a
Electricity costs: 12,85 * 62,47 USD/MWh4 = 803 USD/a
3 Natural gas price mix
18
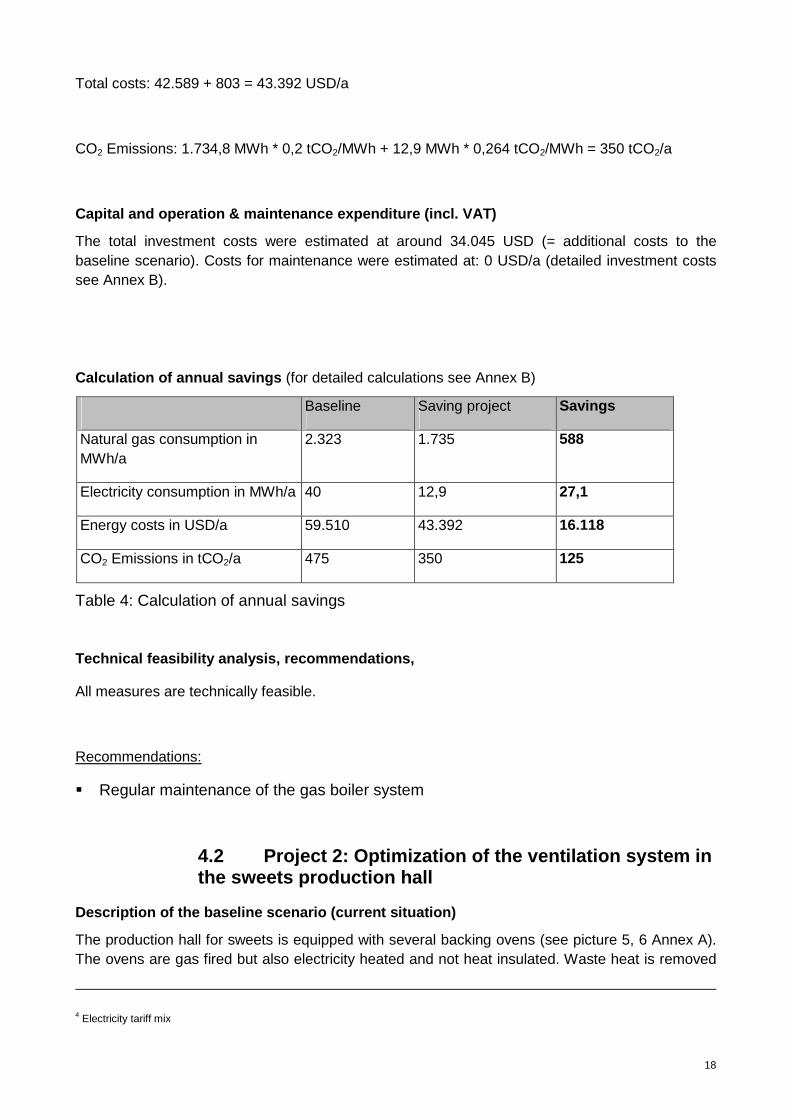
Total costs: 42.589 + 803 = 43.392 USD/a
CO2 Emissions: 1.734,8 MWh * 0,2 tCO2/MWh + 12,9 MWh * 0,264 tCO2/MWh = 350 tCO2/a
Capital and operation & maintenance expenditure (in cl. VAT)
The total investment costs were estimated at around 34.045 USD (= additional costs to the baseline scenario). Costs for maintenance were estimated at: 0 USD/a (detailed investment costs see Annex B).
Calculation of annual savings (for detailed calculations see Annex B)
Baseline Saving project Savings
Natural gas consumption in MWh/a
2.323 1.735 588
Electricity consumption in MWh/a 40 12,9 27,1
Energy costs in USD/a 59.510 43.392 16.118
CO2 Emissions in tCO2/a 475 350 125
Table 4: Calculation of annual savings
Technical feasibility analysis, recommendations,
All measures are technically feasible.
Recommendations:
� Regular maintenance of the gas boiler system
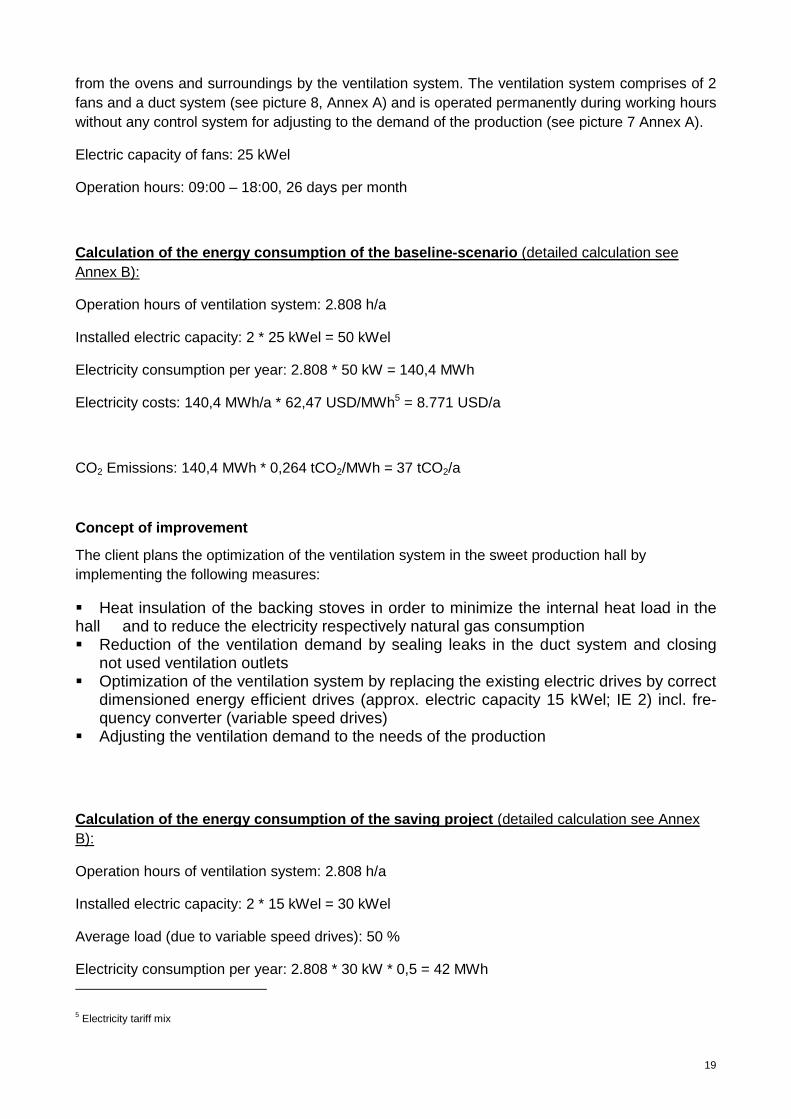
4.2 Project 2: Optimization of the ventilation system in the sweets production hall
Description of the baseline scenario (current situa tion)
The production hall for sweets is equipped with several backing ovens (see picture 5, 6 Annex A). The ovens are gas fired but also electricity heated and not heat insulated. Waste heat is removed
4 Electricity tariff mix
19
from the ovens and surroundings by the ventilation system. The ventilation system comprises of 2 fans and a duct system (see picture 8, Annex A) and is operated permanently during working hours without any control system for adjusting to the demand of the production (see picture 7 Annex A).
Electric capacity of fans: 25 kWel
Operation hours: 09:00 – 18:00, 26 days per month
Calculation of the energy consumption of the baseli ne-scenario (detailed calculation see Annex B):
Operation hours of ventilation system: 2.808 h/a
Installed electric capacity: 2 * 25 kWel = 50 kWel
Electricity consumption per year: 2.808 * 50 kW = 140,4 MWh
Electricity costs: 140,4 MWh/a * 62,47 USD/MWh5 = 8.771 USD/a
CO2 Emissions: 140,4 MWh * 0,264 tCO2/MWh = 37 tCO2/a
Concept of improvement
The client plans the optimization of the ventilation system in the sweet production hall by implementing the following measures:
� Heat insulation of the backing stoves in order to minimize the internal heat load in the hall and to reduce the electricity respectively natural gas consumption � Reduction of the ventilation demand by sealing leaks in the duct system and closing not used ventilation outlets � Optimization of the ventilation system by replacing the existing electric drives by correct dimensioned energy efficient drives (approx. electric capacity 15 kWel; IE 2) incl. fre- quency converter (variable speed drives) � Adjusting the ventilation demand to the needs of the production
Calculation of the energy consumption of the saving project (detailed calculation see Annex B):
Operation hours of ventilation system: 2.808 h/a
Installed electric capacity: 2 * 15 kWel = 30 kWel
Average load (due to variable speed drives): 50 %
Electricity consumption per year: 2.808 * 30 kW * 0,5 = 42 MWh
5 Electricity tariff mix
20
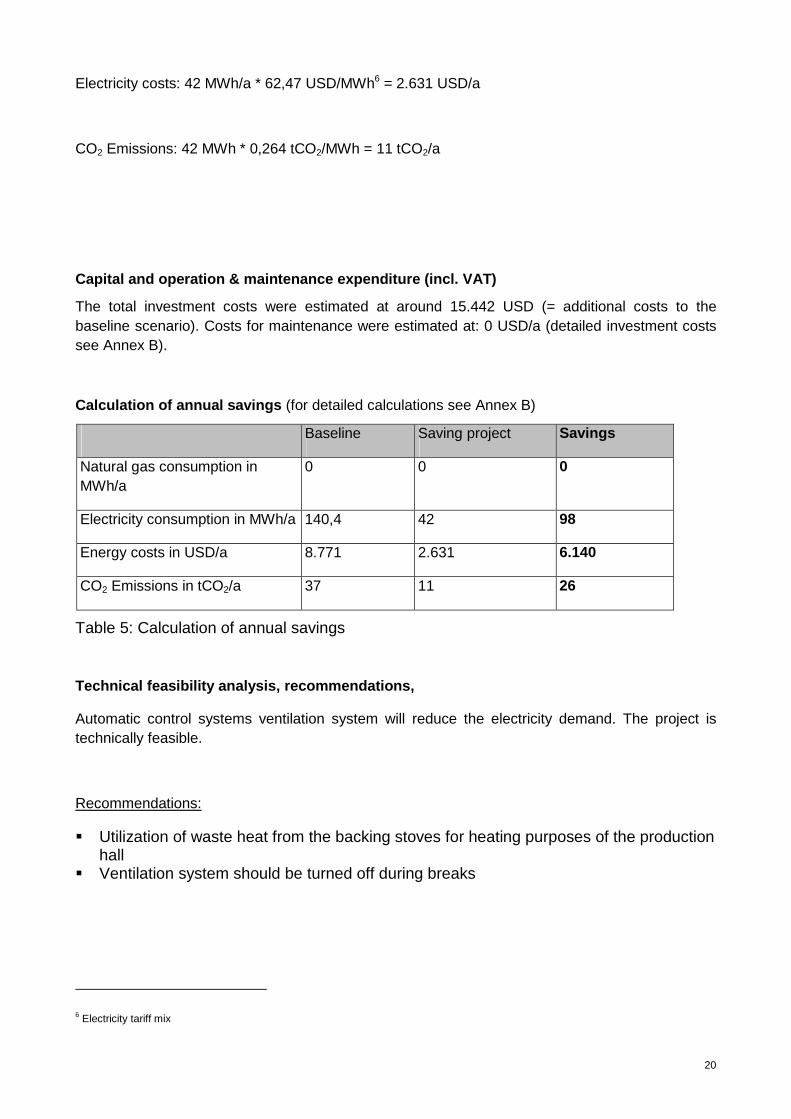
Electricity costs: 42 MWh/a * 62,47 USD/MWh6 = 2.631 USD/a
CO2 Emissions: 42 MWh * 0,264 tCO2/MWh = 11 tCO2/a
Capital and operation & maintenance expenditure (in cl. VAT)
The total investment costs were estimated at around 15.442 USD (= additional costs to the baseline scenario). Costs for maintenance were estimated at: 0 USD/a (detailed investment costs see Annex B).
Calculation of annual savings (for detailed calculations see Annex B)
Baseline Saving project Savings
Natural gas consumption in MWh/a
0 0 0
Electricity consumption in MWh/a 140,4 42 98
Energy costs in USD/a 8.771 2.631 6.140
CO2 Emissions in tCO2/a 37 11 26
Table 5: Calculation of annual savings
Technical feasibility analysis, recommendations,
Automatic control systems ventilation system will reduce the electricity demand. The project is technically feasible.
Recommendations:
� Utilization of waste heat from the backing stoves for heating purposes of the production hall
� Ventilation system should be turned off during breaks
6 Electricity tariff mix
21
4.3 Project 3: Implementation of a chiller system (incl. waste heat recovery system) for cold storage warehouse
Description of the baseline scenario:
The company owns several buildings at the site which are currently not used. Therefore the company plans to utilize one building complex to implement a new cold storage warehouse.
� Cooling area A (< -10 °C): 1.000 m²; volume of 6.0 00 m³ � Cooling area B (+2 °C to +5 °C): 1.000 m²; volume of 6.000 m³ The cooling energy will be produced by 2 conventional chillers (each around 300 kW cooling capacity) with no waste heat recovery system.
Calculation of the energy consumption of the baseli ne-scenario (detailed calculation see Annex B):
Cooling area B (+2 °C to +5 °C): 1.000 m²; volume o f 6.000 m³ Specific cooling energy demand per m³7: 80 kWh/m³, a
Total cooling demand per year: 6.000 m³ * 80 kWh/m³,a / 1.000 = 480 MWh/a
Chiller I cooling capacity: 300 kWcool
COP chiller: 3,0
Electrical input: 100 kWel
Waste heat recovery: no
Boiler efficiency for hot water preparation and heating: 70%
Waste heat potential (see saving project): 300 MWh/a
Electricity consumption: 480 kWcool / 3,0 = 160 MWh/a
Electricity costs per year: 160 MWh * 62,47 USD/MWh8 = 9.995 USD/a
Natural gas consumption: 300 MWh/a / 0,7 = 429 MWh/a
Natural gas costs per year: 429 MWh * 24,55 USD/MWh9 = 10.532 USD/a
Total costs per year: 9.995 + 10.532 = 20.527 USD/a
7 Average cooling energy demand of European storehouses. Value strongly depends on loading/unloading frequency
of the warehouse. Source: Leitfaden „Energieeffizienz für Tiefkühlhäuser“ 8 Electricity tariff mix
9 Natural gas tariff mix
22
CO2 Emissions: 160 MWh * 0,264 tCO2/MWh + 429 MWh * 0,2 tCO2/MWh = 128 tCO2/a
Concept of improvement:
The company owns several buildings at the site which are currently not used. Therefore the company plans to utilize one building complex to implement a new cold storage warehouse.
� Cooling area A (< -10 °C): 1.000 m²; volume of 6.0 00 m³ � Cooling area B (+2 °C to +5 °C): 1.000 m²; volume of 6.000 m³ The cooling energy for cooling area A will be produced by a conventional chiller system with waste heat recovery system, cooling energy for cooling area B will be produced by a energy efficient chiller system (variable speed drive for automatic adjusting on the cooling demand) with waste heat recovery system. Waste heat is transported via pipe system to a storage tank (6 m³) in the main building for heating and hot water preparation purposes.
Calculation of the energy consumption of the saving project (detailed calculation see Annex B):
Cooling area B (+2 °C to +5 °C): 1.000 m²; volume o f 6.000 m³ Specific cooling energy demand per m³10: 80 kWh/m³, a
Total cooling demand per year: 6.000 m³ * 80 kWh/m³,a / 1.000 = 480 MWh/a
Chiller I cooling capacity: 300 kWcool
COP chiller: 6,5
Electrical input: 68 kWel
Waste heat potential: 1.500 MWh/a
Waste heat recovery rate: 20% � 1.500 MWh/a * 0,2 = 300 MWh/a
Boiler efficiency for hot water preparation and heating: 70%
Electricity consumption: 480 kWcool / 6,5 = 73,8 MWh/a
Electricity costs per year: 73,8 MWh * 62,47 USD/MWh11 = 4.613 USD/a
Natural gas consumption: 0 MWh/a
Natural gas costs per year: 0 USD/a
Total costs per year: 4.613 USD/a
10 Average cooling energy demand of European storehouses. Value strongly depends on loading/unloading frequency of the warehouse. Source: Leitfaden „Energieeffizienz für Tiefkühlhäuser“ 11 Electricity tariff mix
23
CO2 Emissions: 73,8 MWh * 0,264 tCO2/MWh + 0 MWh * 0,2 tCO2/MWh = 19,3 tCO2/a
Capital and operation & maintenance expenditure (in cl. VAT)
The total investment costs were estimated at around 117.426 USD (= additional costs to the baseline scenario, the investment costs for the baseline scenario were estimated at 80.000 USD).
Costs for maintenance were estimated at: 0 USD/a (detailed investment costs see Annex B).
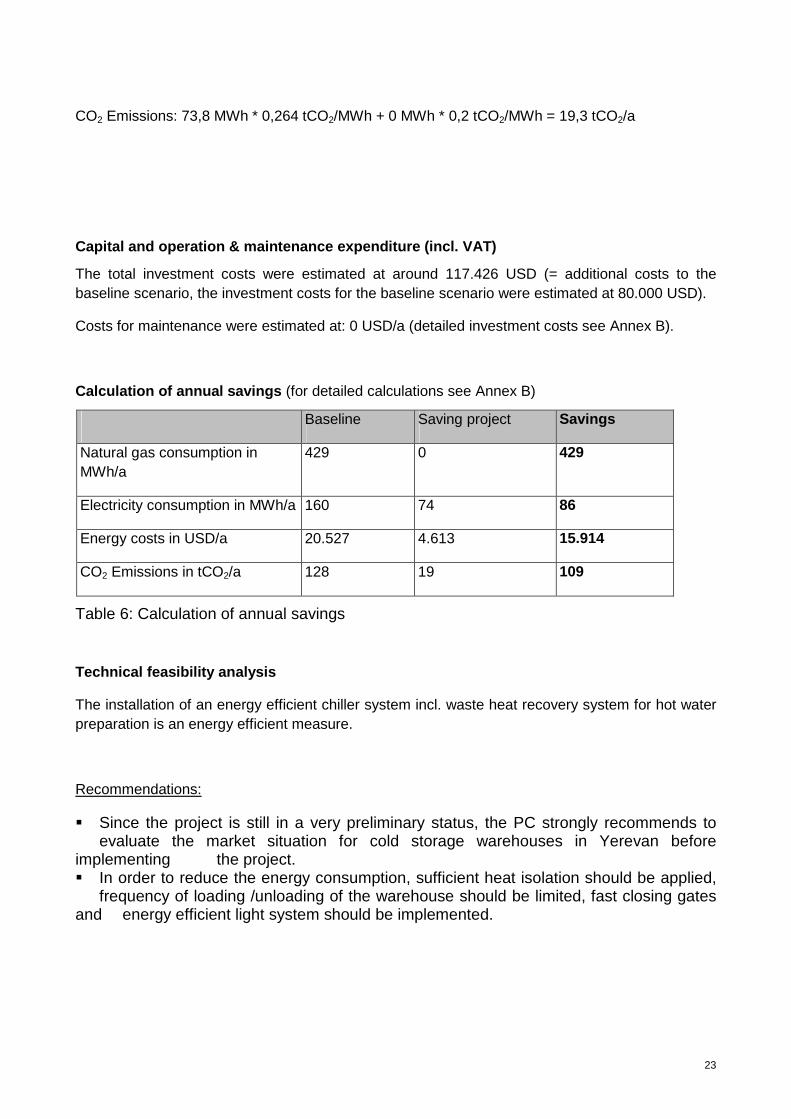
Calculation of annual savings (for detailed calculations see Annex B)
Baseline Saving project Savings
Natural gas consumption in MWh/a
429 0 429
Electricity consumption in MWh/a 160 74 86
Energy costs in USD/a 20.527 4.613 15.914
CO2 Emissions in tCO2/a 128 19 109
Table 6: Calculation of annual savings
Technical feasibility analysis
The installation of an energy efficient chiller system incl. waste heat recovery system for hot water preparation is an energy efficient measure.
Recommendations:
� Since the project is still in a very preliminary status, the PC strongly recommends to evaluate the market situation for cold storage warehouses in Yerevan before implementing the project. � In order to reduce the energy consumption, sufficient heat isolation should be applied, frequency of loading /unloading of the warehouse should be limited, fast closing gates and energy efficient light system should be implemented.
24
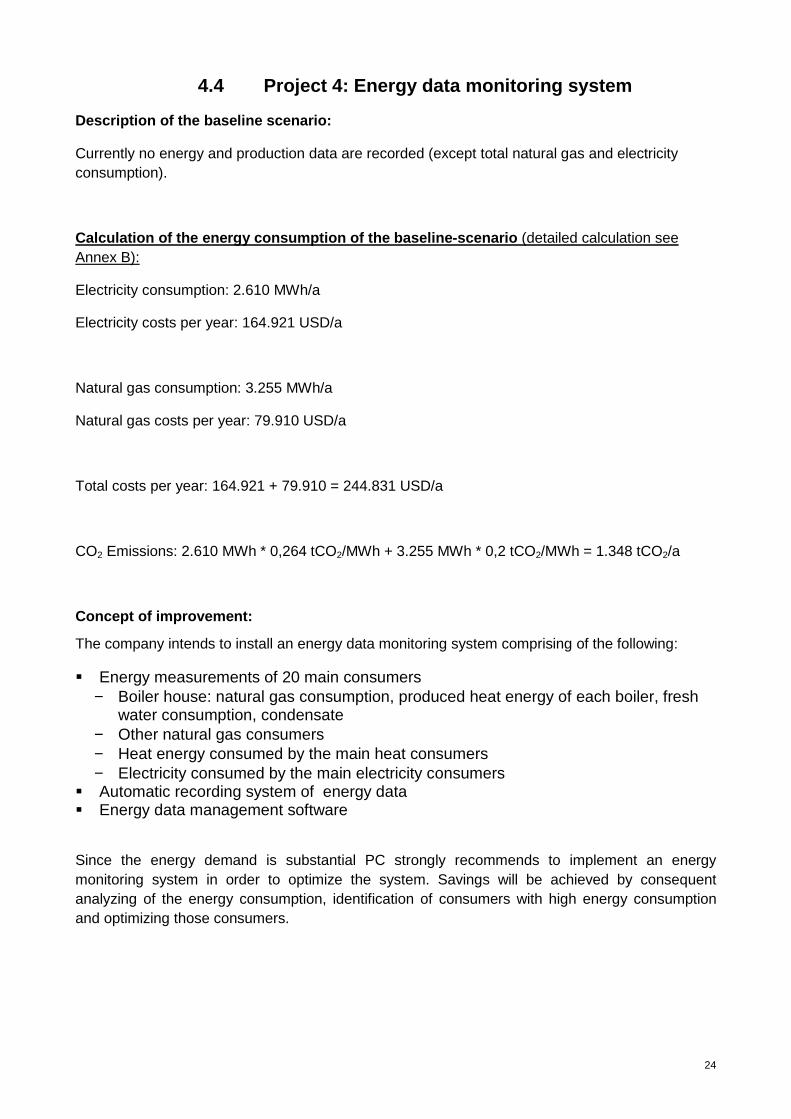
4.4 Project 4: Energy data monitoring system
Description of the baseline scenario:
Currently no energy and production data are recorded (except total natural gas and electricity consumption).
Calculation of the energy consumption of the baseli ne-scenario (detailed calculation see Annex B):
Electricity consumption: 2.610 MWh/a
Electricity costs per year: 164.921 USD/a
Natural gas consumption: 3.255 MWh/a
Natural gas costs per year: 79.910 USD/a
Total costs per year: 164.921 + 79.910 = 244.831 USD/a
CO2 Emissions: 2.610 MWh * 0,264 tCO2/MWh + 3.255 MWh * 0,2 tCO2/MWh = 1.348 tCO2/a
Concept of improvement:
The company intends to install an energy data monitoring system comprising of the following:
� Energy measurements of 20 main consumers − Boiler house: natural gas consumption, produced heat energy of each boiler, fresh
water consumption, condensate − Other natural gas consumers − Heat energy consumed by the main heat consumers − Electricity consumed by the main electricity consumers
� Automatic recording system of energy data � Energy data management software
Since the energy demand is substantial PC strongly recommends to implement an energy monitoring system in order to optimize the system. Savings will be achieved by consequent analyzing of the energy consumption, identification of consumers with high energy consumption and optimizing those consumers.
25
Calculation of the energy consumption of the saving project (detailed calculation see Annex B):
Electricity consumption in 2010: 2.640 MWh/a
Savings of the electricity consumption: 3 %
Electricity consumption: 2.640 MWh * 0,97 = 2.561 MWh/a
Electricity costs per year: 2.561 * 62,47 USD/MWh12 = 159.986 USD/a
Natural gas consumption: 3.255 MWh
Savings of the natural gas consumption: 3 %
Natural gas consumption: 3.255 * 0,97 = 3.157 MWh/a
Natural gas costs per year: 3.157 MWh * 24,55 USD/MWh13 = 77.504 USD/a
Total costs per year: 159.986 + 77.504 = 237.490 USD/a
CO2 Emissions: 2.561 MWh * 0,264 tCO2/MWh + 3.157 MWh * 0,2 tCO2/MWh = 1.307,5 tCO2/a
Capital and operation & maintenance expenditure (in cl. VAT)
The total investment costs were estimated at around 19.303 USD (= additional costs to the baseline scenario). Costs for maintenance were estimated at: 0 USD/a (detailed investment costs see Annex B).
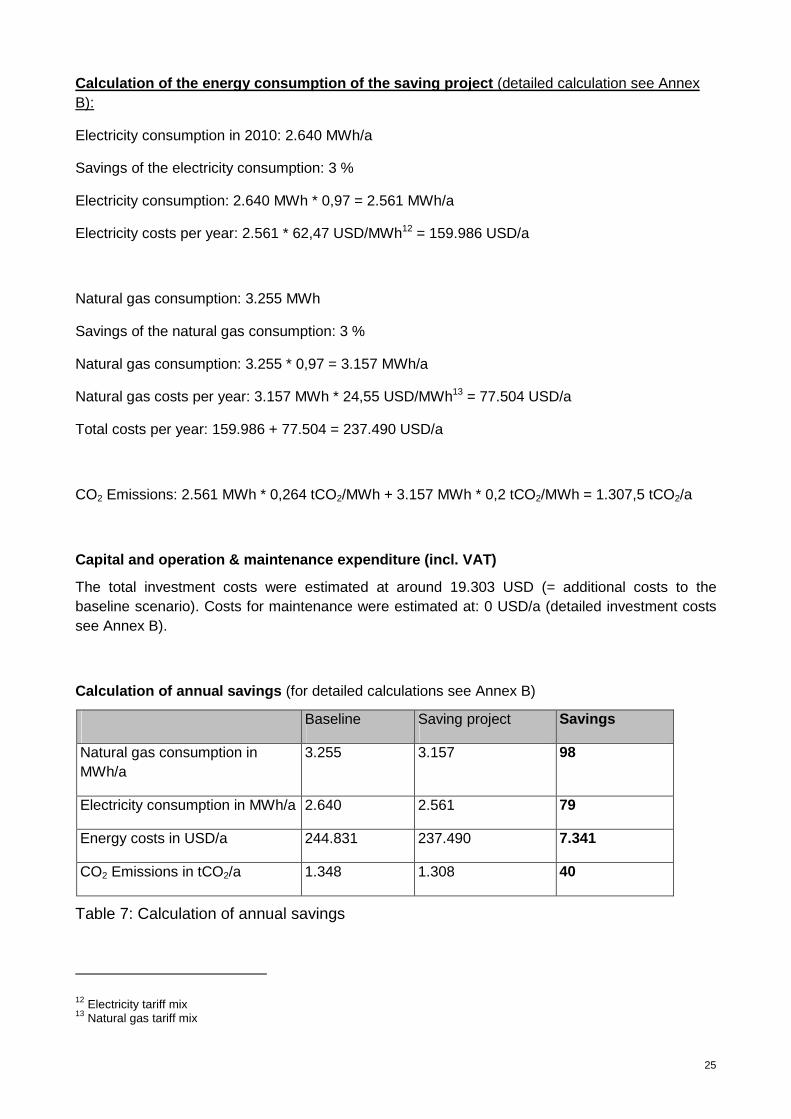
Calculation of annual savings (for detailed calculations see Annex B)
Baseline Saving project Savings
Natural gas consumption in MWh/a
3.255 3.157 98
Electricity consumption in MWh/a 2.640 2.561 79
Energy costs in USD/a 244.831 237.490 7.341
CO2 Emissions in tCO2/a 1.348 1.308 40
Table 7: Calculation of annual savings
12 Electricity tariff mix 13 Natural gas tariff mix
26
Technical feasibility analysis
The installation of an energy data monitoring system is an energy efficient measure. The project is technical feasible.
Recommendations:
Energy data and production data (e.g. produced flour, produced sweets) should be monitored and analyzed regularly. Calculation of benchmarks (e.g. kWh/t) will help to recognize malfunctions in the technical system.
4.5 Summary of production, savings, investment costs
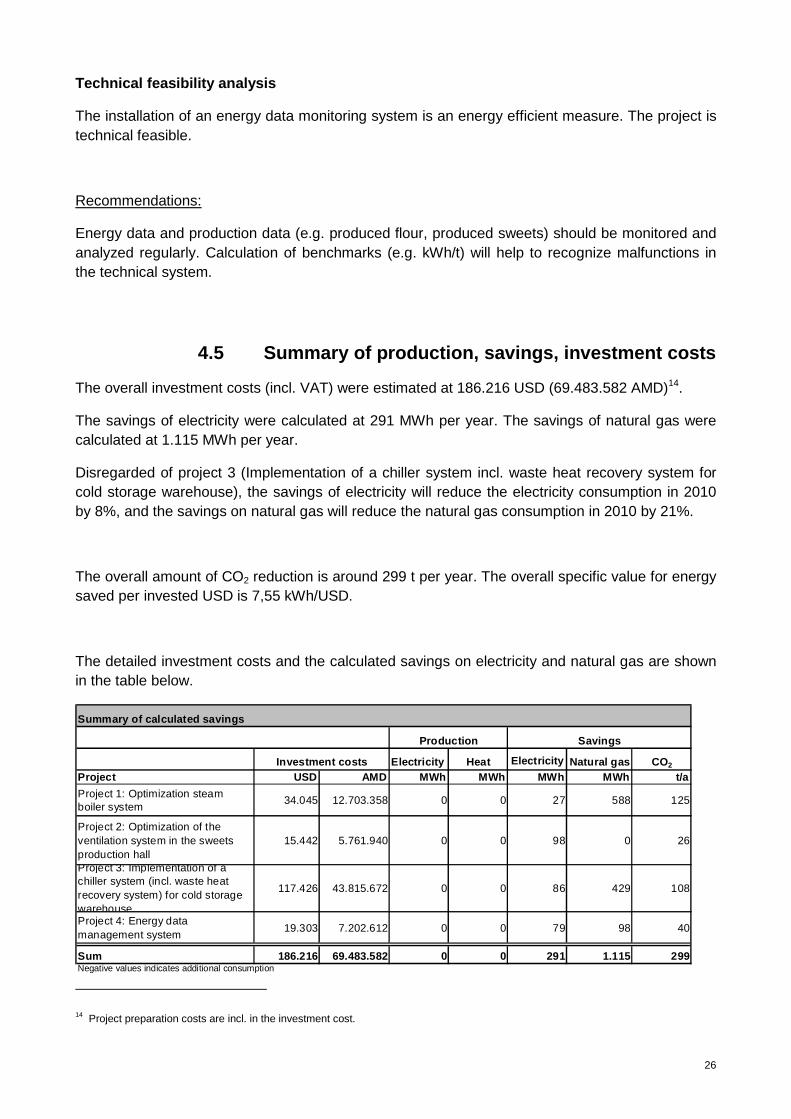
The overall investment costs (incl. VAT) were estimated at 186.216 USD (69.483.582 AMD)14.
The savings of electricity were calculated at 291 MWh per year. The savings of natural gas were calculated at 1.115 MWh per year.
Disregarded of project 3 (Implementation of a chiller system incl. waste heat recovery system for cold storage warehouse), the savings of electricity will reduce the electricity consumption in 2010 by 8%, and the savings on natural gas will reduce the natural gas consumption in 2010 by 21%.
The overall amount of CO2 reduction is around 299 t per year. The overall specific value for energy saved per invested USD is 7,55 kWh/USD.
The detailed investment costs and the calculated savings on electricity and natural gas are shown in the table below.
Electricity Heat Electricity Natural gas CO 2
Project USD AMD MWh MWh MWh MWh t/a
Project 1: Optimization steam boiler system
34.045 12.703.358 0 0 27 588 125
Project 2: Optimization of the ventilation system in the sweets production hall
15.442 5.761.940 0 0 98 0 26
Project 3: Implementation of a chiller system (incl. waste heat recovery system) for cold storage warehouse
117.426 43.815.672 0 0 86 429 108
Project 4: Energy data management system
19.303 7.202.612 0 0 79 98 40
Sum 186.216 69.483.582 0 0 291 1.115 299Negative values indicates additional consumption
Summary of calculated savings
Investment costs
SavingsProduction
14 Project preparation costs are incl. in the investment cost.
27
Table 8: Summary of production, savings, investment costs
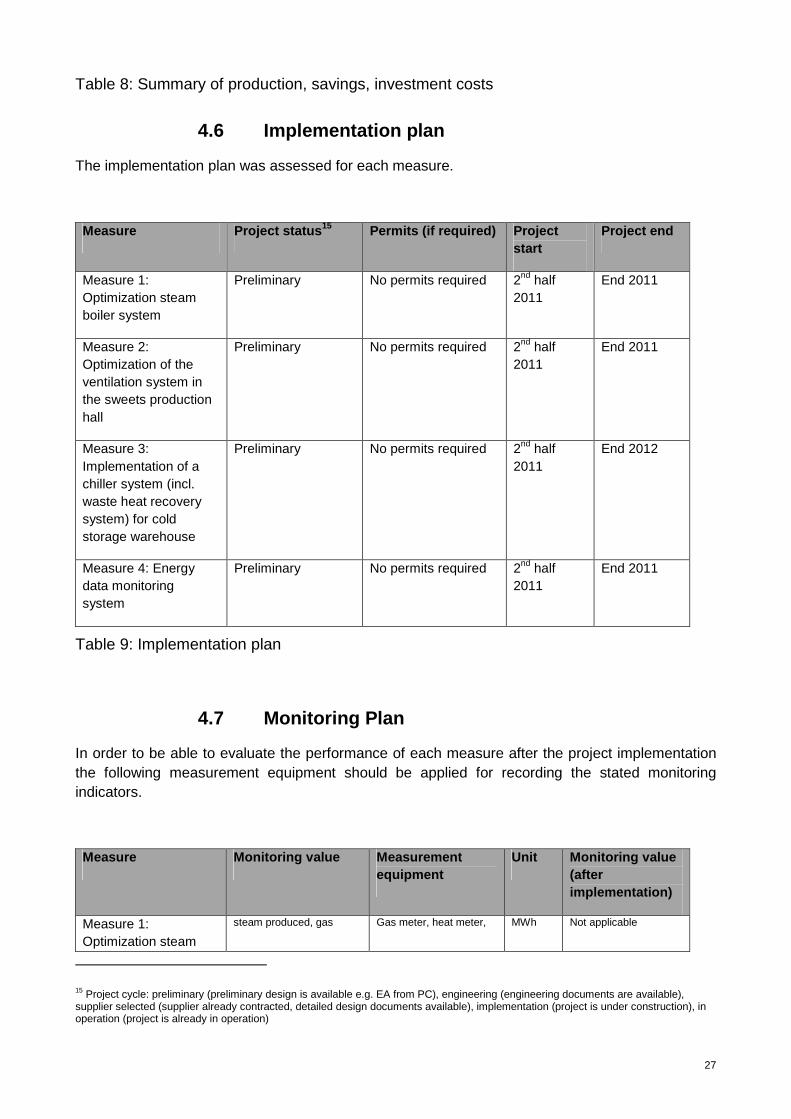
4.6 Implementation plan
The implementation plan was assessed for each measure.
Measure Project status 15 Permits (if required) Project start
Project end
Measure 1: Optimization steam boiler system
Preliminary No permits required 2nd half 2011
End 2011
Measure 2: Optimization of the ventilation system in the sweets production hall
Preliminary No permits required 2nd half 2011
End 2011
Measure 3: Implementation of a chiller system (incl. waste heat recovery system) for cold storage warehouse
Preliminary No permits required 2nd half 2011
End 2012
Measure 4: Energy data monitoring system
Preliminary No permits required 2nd half 2011
End 2011
Table 9: Implementation plan
4.7 Monitoring Plan
In order to be able to evaluate the performance of each measure after the project implementation the following measurement equipment should be applied for recording the stated monitoring indicators.
Measure Monitoring value Measurement equipment
Unit Monitoring value (after implementation)
Measure 1: Optimization steam
steam produced, gas Gas meter, heat meter, MWh Not applicable
15 Project cycle: preliminary (preliminary design is available e.g. EA from PC), engineering (engineering documents are available), supplier selected (supplier already contracted, detailed design documents available), implementation (project is under construction), in operation (project is already in operation)

28
boiler system consumption water meter
Measure 2: Optimization of the ventilation system in the sweets production hall
Electricity consumption
Electric meter
MWh Not applicable
Measure 3: Implementation of a chiller system (incl. waste heat recovery system) for cold storage warehouse
Cooling energy produced, heat energy produced of the waste heat recovery system
Heat meter MWh Not applicable
Measure 4: Energy data monitoring system
Energy data Heat meter, electric meter, gas meter
MWh Not applicable
Table 10: Monitoring plan
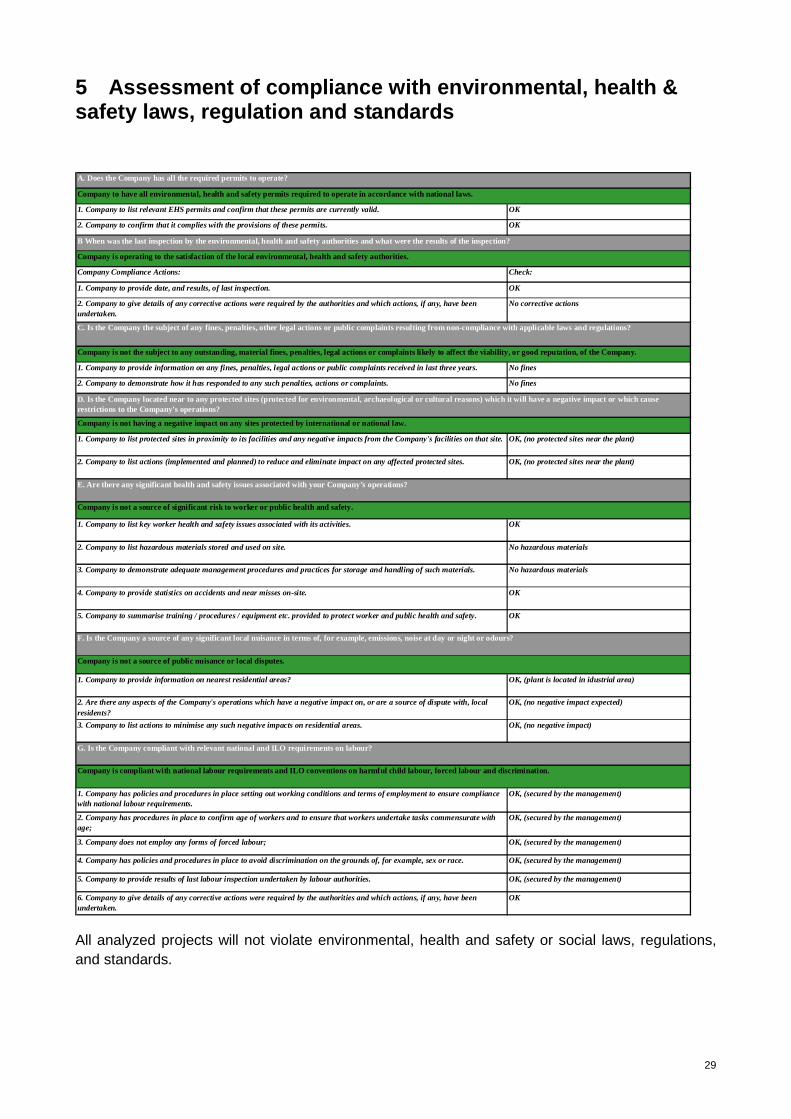
29
5 Assessment of compliance with environmental, heal th & safety laws, regulation and standards
1. Company to list relevant EHS permits and confirm that these permits are currently valid. OK
2. Company to confirm that it complies with the provisions of these permits. OK
Company Compliance Actions: Check:
1. Company to provide date, and results, of last inspection. OK
2. Company to give details of any corrective actions were required by the authorities and which actions, if any, have been undertaken.
No corrective actions
1. Company to provide information on any fines, penalties, legal actions or public complaints received in last three years. No fines
2. Company to demonstrate how it has responded to any such penalties, actions or complaints. No fines
1. Company to list protected sites in proximity to its facilities and any negative impacts from the Company's facilities on that site. OK, (no protected sites near the plant)
2. Company to list actions (implemented and planned) to reduce and eliminate impact on any affected protected sites. OK, (no protected sites near the plant)
1. Company to list key worker health and safety issues associated with its activities. OK
2. Company to list hazardous materials stored and used on site. No hazardous materials
3. Company to demonstrate adequate management procedures and practices for storage and handling of such materials. No hazardous materials
4. Company to provide statistics on accidents and near misses on-site. OK
5. Company to summarise training / procedures / equipment etc. provided to protect worker and public health and safety. OK
1. Company to provide information on nearest residential areas? OK, (plant is located in idustrial area)
2. Are there any aspects of the Company's operations which have a negative impact on, or are a source of dispute with, local residents?
OK, (no negative impact expected)
3. Company to list actions to minimise any such negative impacts on residential areas. OK, (no negative impact)
1. Company has policies and procedures in place setting out working conditions and terms of employment to ensure compliance with national labour requirements.
OK, (secured by the management)
2. Company has procedures in place to confirm age of workers and to ensure that workers undertake tasks commensurate with age;
OK, (secured by the management)
3. Company does not employ any forms of forced labour; OK, (secured by the management)
4. Company has policies and procedures in place to avoid discrimination on the grounds of, for example, sex or race. OK, (secured by the management)
5. Company to provide results of last labour inspection undertaken by labour authorities. OK, (secured by the management)
6. Company to give details of any corrective actions were required by the authorities and which actions, if any, have been undertaken.
OK
A. Does the Company has all the required permits to operate?
Company to have all environmental, health and safety permits required to operate in accordance with national laws.
B When was the last inspection by the environmental, health and safety authorities and what were the results of the inspection?
Company is operating to the satisfaction of the local environmental, health and safety authorities.
E. Are there any significant health and safety issues associated with your Company’s operations?
Company is not a source of significant risk to worker or public health and safety.
C. Is the Company the subject of any fines, penalties, other legal actions or public complaints resulting from non-compliance with applicable laws and regulations?
Company is not the subject to any outstanding, material fines, penalties, legal actions or complaints likely to affect the viability, or good reputation, of the Company.
D. Is the Company located near to any protected sites (protected for environmental, archaeological or cultural reasons) which it will have a negative impact or which cause restrictions to the Company’s operations?
Company is not having a negative impact on any sites protected by international or national law.
G. Is the Company compliant with relevant national and ILO requirements on labour?
Company is compliant with national labour requirements and ILO conventions on harmful child labour, forced labour and discrimination.
F. Is the Company a source of any significant local nuisance in terms of, for example, emissions, noise at day or night or odours?
Company is not a source of public nuisance or local disputes.
All analyzed projects will not violate environmental, health and safety or social laws, regulations, and standards.
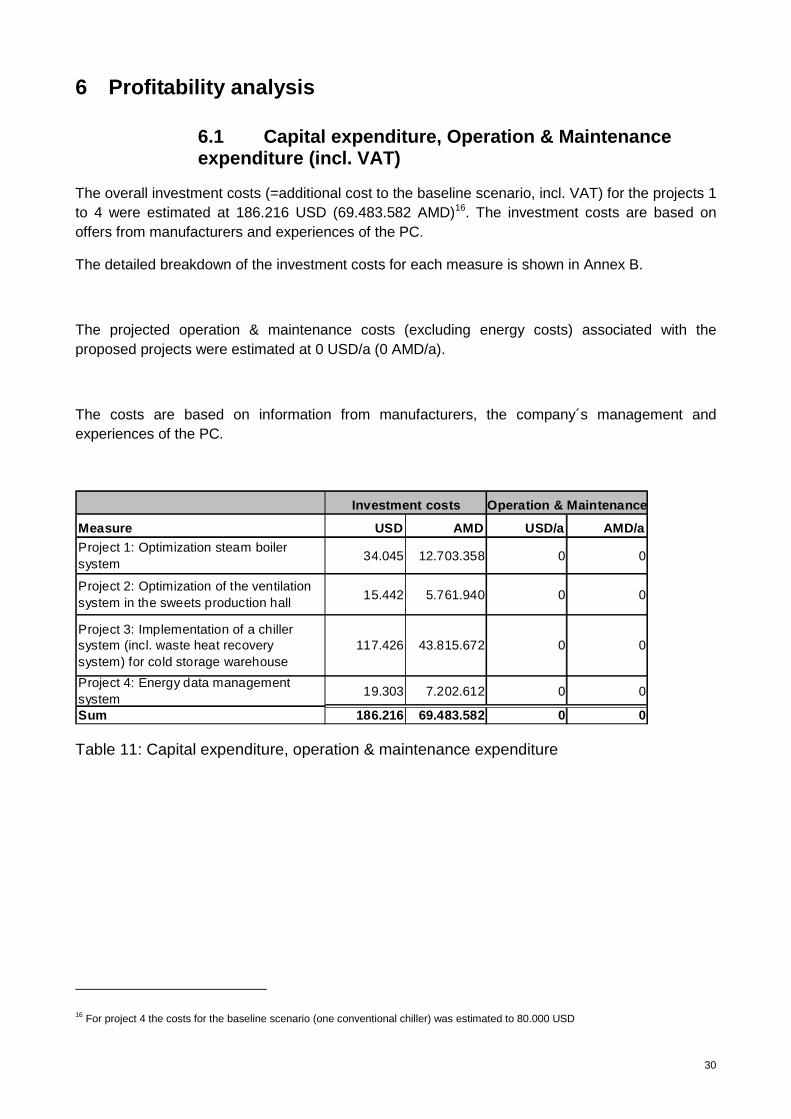
30
6 Profitability analysis
6.1 Capital expenditure, Operation & Maintenance expenditure (incl. VAT)
The overall investment costs (=additional cost to the baseline scenario, incl. VAT) for the projects 1 to 4 were estimated at 186.216 USD (69.483.582 AMD)16. The investment costs are based on offers from manufacturers and experiences of the PC.
The detailed breakdown of the investment costs for each measure is shown in Annex B.
The projected operation & maintenance costs (excluding energy costs) associated with the proposed projects were estimated at 0 USD/a (0 AMD/a).
The costs are based on information from manufacturers, the company´s management and experiences of the PC.
Measure USD AMD USD/a AMD/aProject 1: Optimization steam boiler system
34.045 12.703.358 0 0
Project 2: Optimization of the ventilation system in the sweets production hall
15.442 5.761.940 0 0
Project 3: Implementation of a chiller system (incl. waste heat recovery system) for cold storage warehouse
117.426 43.815.672 0 0
Project 4: Energy data management system
19.303 7.202.612 0 0
Sum 186.216 69.483.582 0 0
Investment costs Operation & Maintenance
Table 11: Capital expenditure, operation & maintenance expenditure
16 For project 4 the costs for the baseline scenario (one conventional chiller) was estimated to 80.000 USD
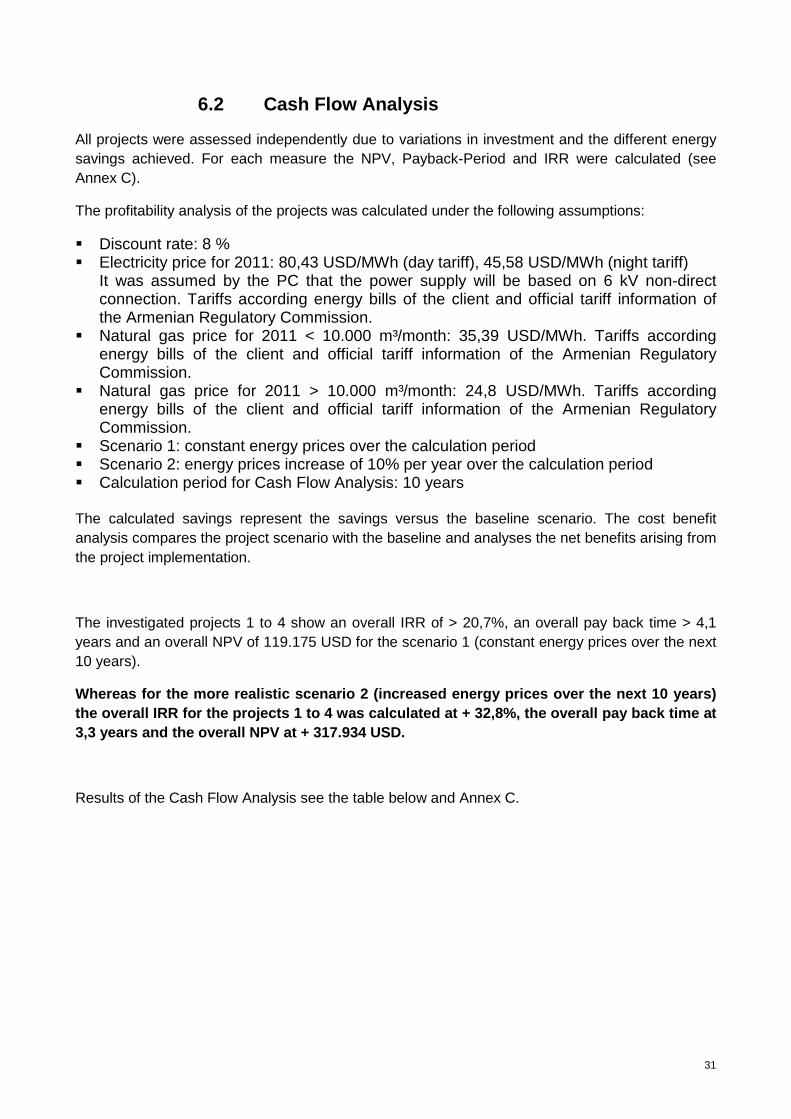
31
6.2 Cash Flow Analysis
All projects were assessed independently due to variations in investment and the different energy savings achieved. For each measure the NPV, Payback-Period and IRR were calculated (see Annex C).
The profitability analysis of the projects was calculated under the following assumptions:
� Discount rate: 8 % � Electricity price for 2011: 80,43 USD/MWh (day tariff), 45,58 USD/MWh (night tariff)
It was assumed by the PC that the power supply will be based on 6 kV non-direct connection. Tariffs according energy bills of the client and official tariff information of the Armenian Regulatory Commission.
� Natural gas price for 2011 < 10.000 m³/month: 35,39 USD/MWh. Tariffs according energy bills of the client and official tariff information of the Armenian Regulatory Commission.
� Natural gas price for 2011 > 10.000 m³/month: 24,8 USD/MWh. Tariffs according energy bills of the client and official tariff information of the Armenian Regulatory Commission.
� Scenario 1: constant energy prices over the calculation period � Scenario 2: energy prices increase of 10% per year over the calculation period � Calculation period for Cash Flow Analysis: 10 years The calculated savings represent the savings versus the baseline scenario. The cost benefit analysis compares the project scenario with the baseline and analyses the net benefits arising from the project implementation.
The investigated projects 1 to 4 show an overall IRR of > 20,7%, an overall pay back time > 4,1 years and an overall NPV of 119.175 USD for the scenario 1 (constant energy prices over the next 10 years).
Whereas for the more realistic scenario 2 (increase d energy prices over the next 10 years) the overall IRR for the projects 1 to 4 was calcula ted at + 32,8%, the overall pay back time at 3,3 years and the overall NPV at + 317.934 USD.
Results of the Cash Flow Analysis see the table below and Annex C.
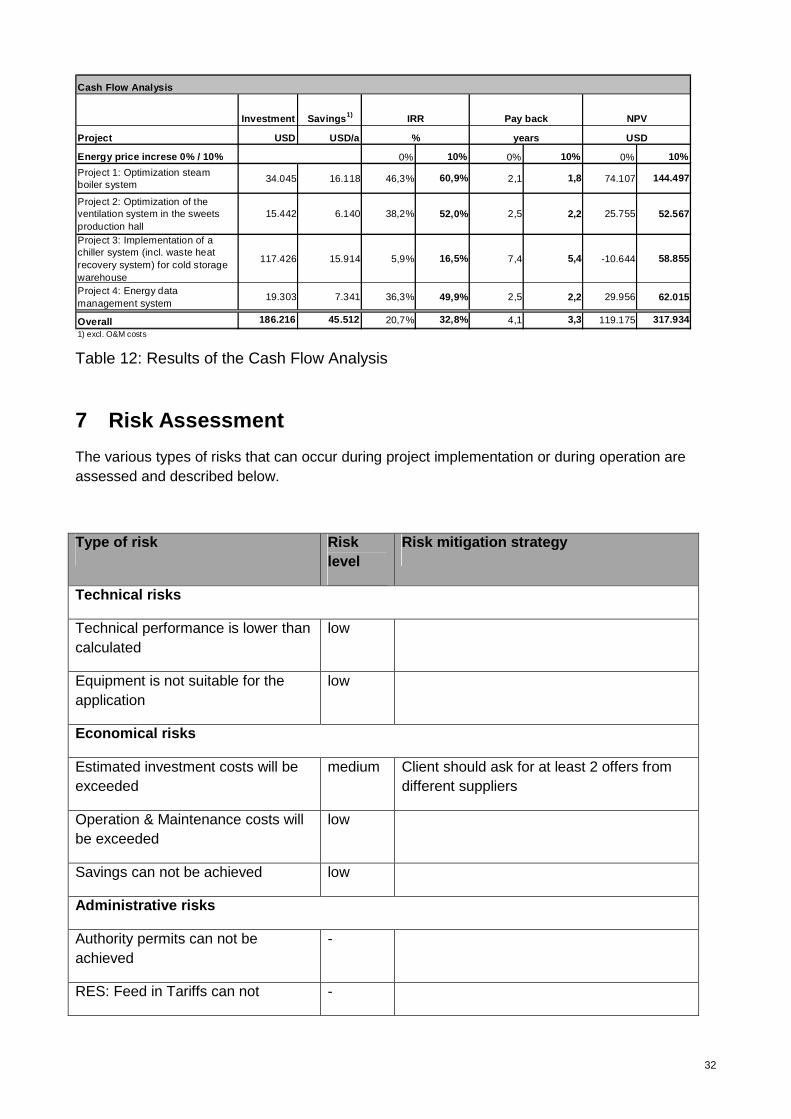
32
Cash Flow Analysis
Investment Savings 1)
Project USD USD/a
Energy price increse 0% / 10% 0% 10% 0% 10% 0% 10%
Project 1: Optimization steam boiler system
34.045 16.118 46,3% 60,9% 2,1 1,8 74.107 144.497
Project 2: Optimization of the ventilation system in the sweets production hall
15.442 6.140 38,2% 52,0% 2,5 2,2 25.755 52.567
Project 3: Implementation of a chiller system (incl. waste heat recovery system) for cold storage warehouse
117.426 15.914 5,9% 16,5% 7,4 5,4 -10.644 58.855
Project 4: Energy data management system
19.303 7.341 36,3% 49,9% 2,5 2,2 29.956 62.015
Overall 186.216 45.512 20,7% 32,8% 4,1 3,3 119.175 317.9341) excl. O&M costs
IRR Pay back
% years
NPV
USD
Table 12: Results of the Cash Flow Analysis
7 Risk Assessment
The various types of risks that can occur during project implementation or during operation are assessed and described below.
Type of risk Risk level
Risk mitigation strategy
Technical risks
Technical performance is lower than calculated
low
Equipment is not suitable for the application
low
Economical risks
Estimated investment costs will be exceeded
medium Client should ask for at least 2 offers from different suppliers
Operation & Maintenance costs will be exceeded
low
Savings can not be achieved low
Administrative risks
Authority permits can not be achieved
-
RES: Feed in Tariffs can not -
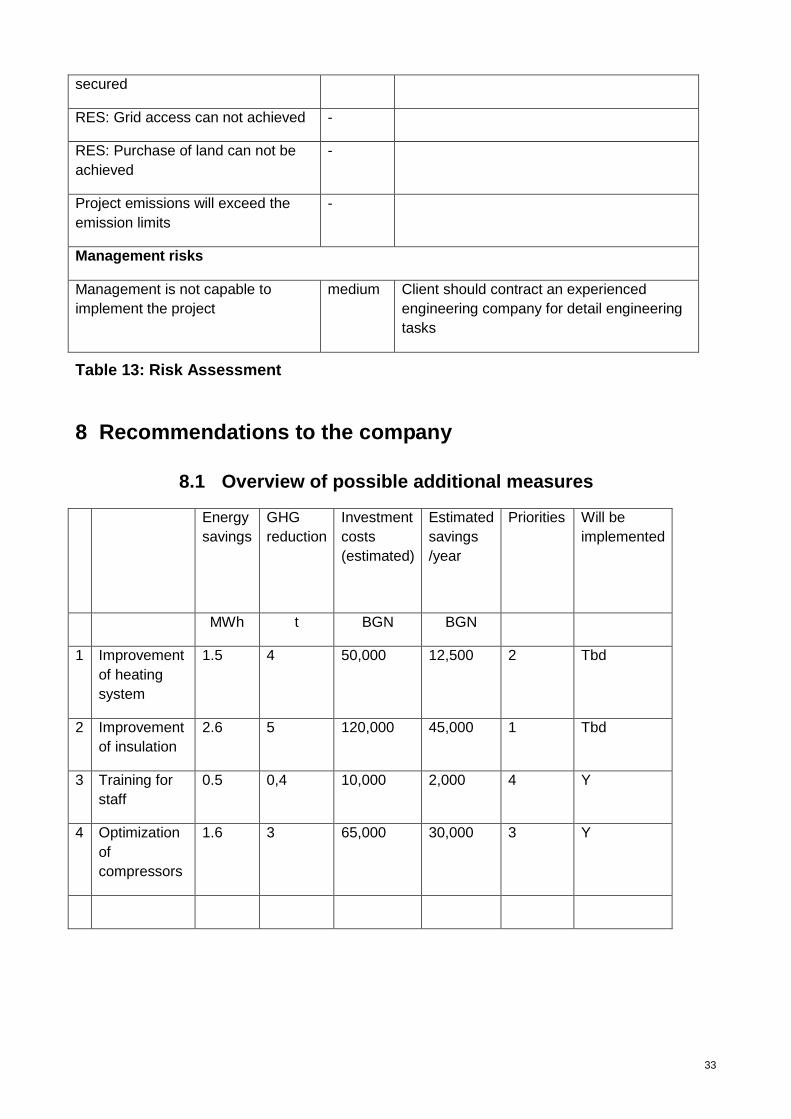
33
secured
RES: Grid access can not achieved -
RES: Purchase of land can not be achieved
-
Project emissions will exceed the emission limits
-
Management risks
Management is not capable to implement the project
medium Client should contract an experienced engineering company for detail engineering tasks
Table 13: Risk Assessment
8 Recommendations to the company
8.1 Overview of possible additional measures
Energy savings
GHG reduction
Investment costs (estimated)
Estimated savings /year
Priorities
Will be implemented
MWh t BGN BGN
1 Improvement of heating system
1.5 4 50,000 12,500 2 Tbd
2 Improvement of insulation
2.6 5 120,000 45,000 1 Tbd
3 Training for staff
0.5 0,4 10,000 2,000 4 Y
4 Optimization of compressors
1.6 3 65,000 30,000 3 Y

34
8.2 Further benefits from the projects
Apart from the costs and benefits listed above, the proposed investment may bring about further benefits in other fields, such as environmental or social benefits which will be briefly described in this section.
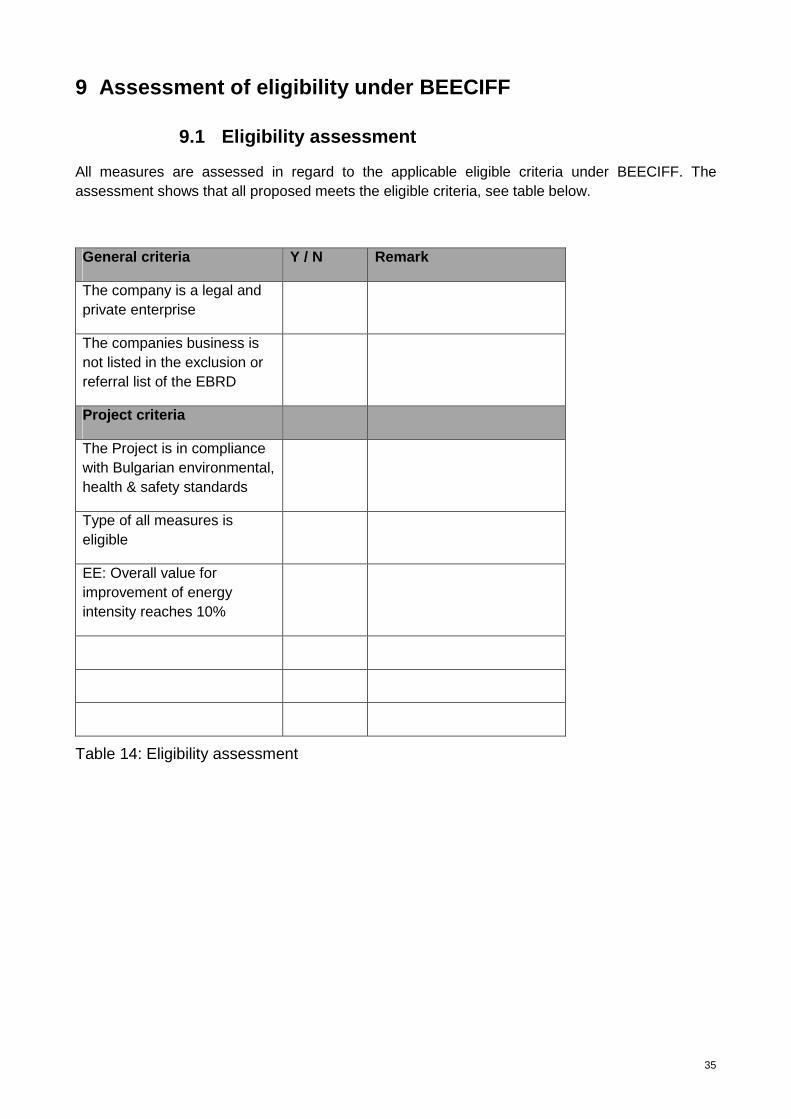
35
9 Assessment of eligibility under BEECIFF
9.1 Eligibility assessment
All measures are assessed in regard to the applicable eligible criteria under BEECIFF. The assessment shows that all proposed meets the eligible criteria, see table below.
General criteria Y / N Remark
The company is a legal and private enterprise
The companies business is not listed in the exclusion or referral list of the EBRD
Project criteria
The Project is in compliance with Bulgarian environmental, health & safety standards
Type of all measures is eligible
EE: Overall value for improvement of energy intensity reaches 10%
Table 14: Eligibility assessment
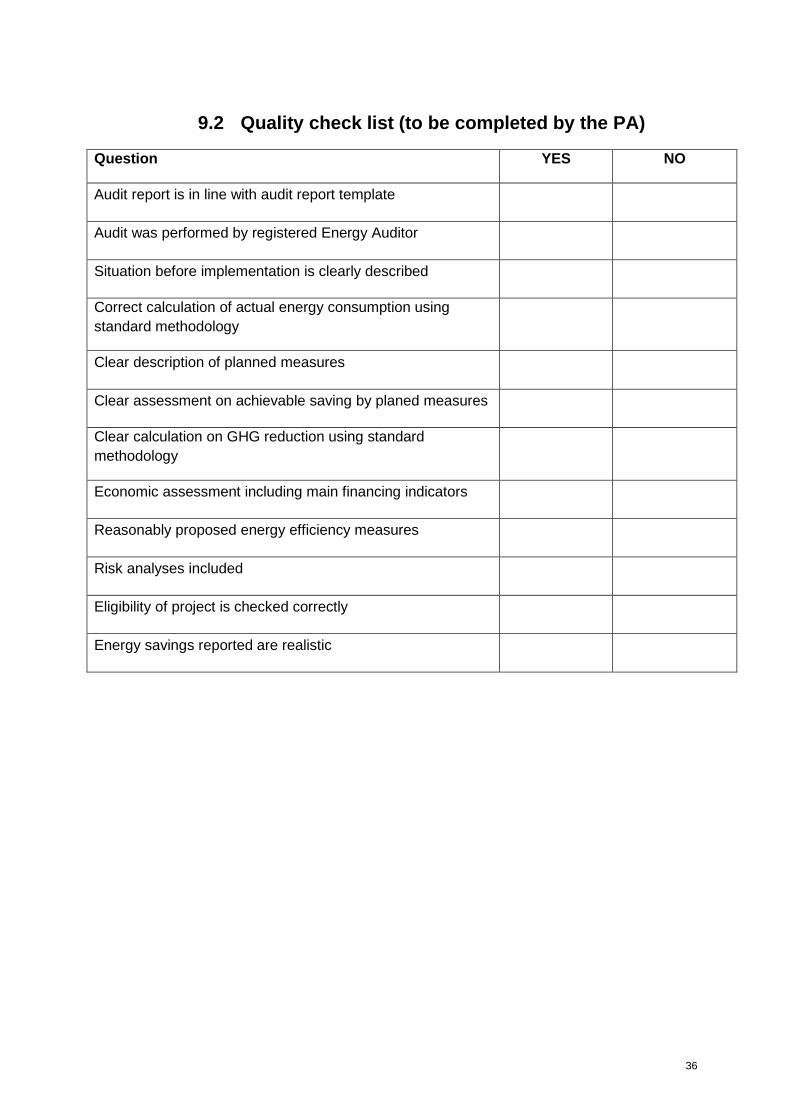
36
9.2 Quality check list (to be completed by the PA)
Question YES NO
Audit report is in line with audit report template
Audit was performed by registered Energy Auditor
Situation before implementation is clearly described
Correct calculation of actual energy consumption using standard methodology
Clear description of planned measures
Clear assessment on achievable saving by planed measures
Clear calculation on GHG reduction using standard methodology
Economic assessment including main financing indicators
Reasonably proposed energy efficiency measures
Risk analyses included
Eligibility of project is checked correctly
Energy savings reported are realistic

Annex III
Checklist for the Project Assistant
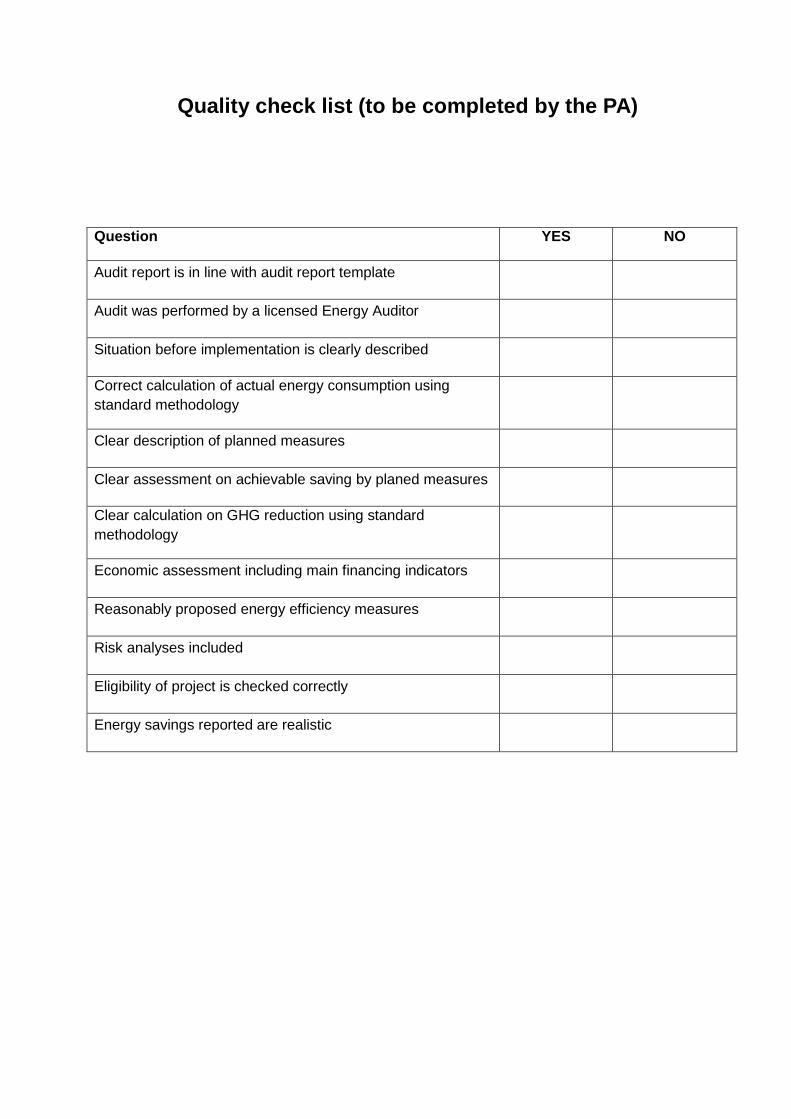
Quality check list (to be completed by the PA)
Question YES NO
Audit report is in line with audit report template
Audit was performed by a licensed Energy Auditor
Situation before implementation is clearly described
Correct calculation of actual energy consumption using standard methodology
Clear description of planned measures
Clear assessment on achievable saving by planed measures
Clear calculation on GHG reduction using standard methodology
Economic assessment including main financing indicators
Reasonably proposed energy efficiency measures
Risk analyses included
Eligibility of project is checked correctly
Energy savings reported are realistic

1
Annex IV
Contract template for hiring Energy Auditors
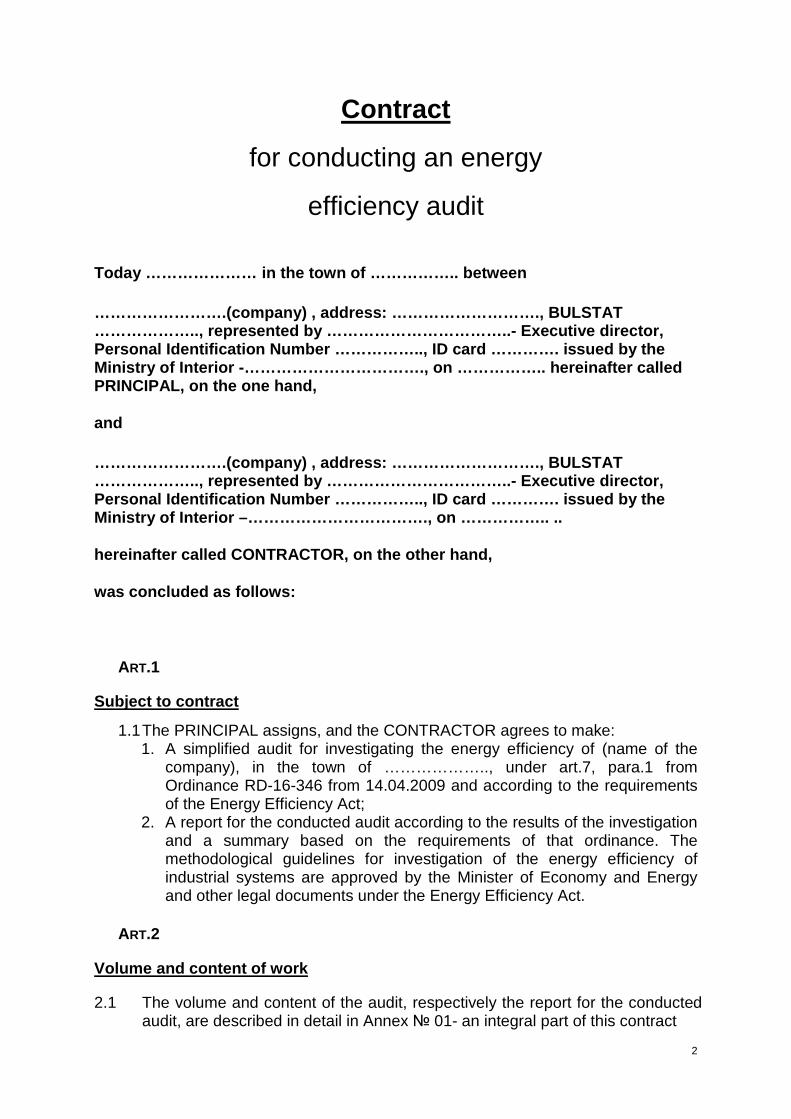
2
Contract
for conducting an energy
efficiency audit
Today ………………… in the town of …………….. between
…………………….(company) , address: ………………………., BULSTAT ……………….., represented by ……………………………..- Executive d irector, Personal Identification Number …………….., ID card ……… …. issued by the Ministry of Interior -……………………………., on …………….. here inafter called PRINCIPAL, on the one hand,
and
…………………….(company) , address: ………………………., BULSTAT ……………….., represented by ……………………………..- Executive d irector, Personal Identification Number …………….., ID card ……… …. issued by the Ministry of Interior –……………………………., on …………….. ..
hereinafter called CONTRACTOR, on the other hand,
was concluded as follows:
ART.1
Subject to contract
1.1 The PRINCIPAL assigns, and the CONTRACTOR agrees to make: 1. A simplified audit for investigating the energy efficiency of (name of the
company), in the town of ……………….., under art.7, para.1 from Ordinance RD-16-346 from 14.04.2009 and according to the requirements of the Energy Efficiency Act;
2. A report for the conducted audit according to the results of the investigation and a summary based on the requirements of that ordinance. The methodological guidelines for investigation of the energy efficiency of industrial systems are approved by the Minister of Economy and Energy and other legal documents under the Energy Efficiency Act.
ART.2
Volume and content of work
2.1 The volume and content of the audit, respectively the report for the conducted audit, are described in detail in Annex № 01- an integral part of this contract
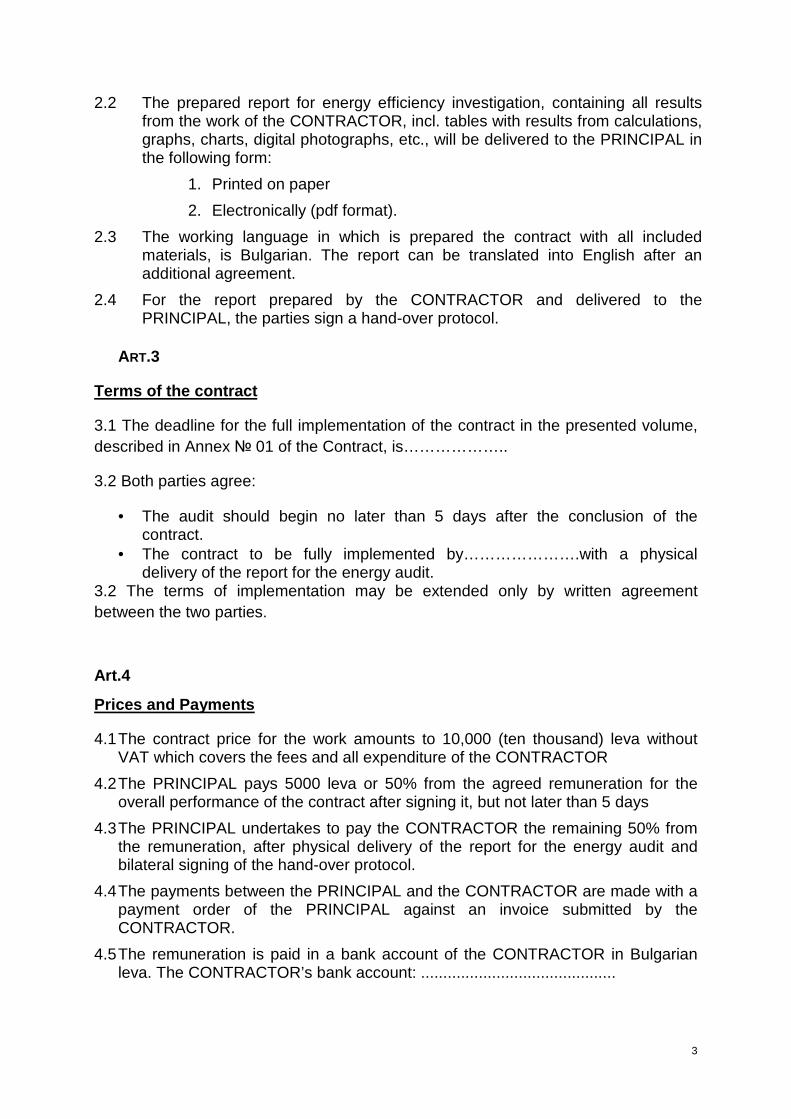
3
2.2 The prepared report for energy efficiency investigation, containing all results from the work of the CONTRACTOR, incl. tables with results from calculations, graphs, charts, digital photographs, etc., will be delivered to the PRINCIPAL in the following form:
1. Printed on paper
2. Electronically (pdf format).
2.3 The working language in which is prepared the contract with all included materials, is Bulgarian. The report can be translated into English after an additional agreement.
2.4 For the report prepared by the CONTRACTOR and delivered to the PRINCIPAL, the parties sign a hand-over protocol.
ART.3
Terms of the contract
3.1 The deadline for the full implementation of the contract in the presented volume, described in Annex № 01 of the Contract, is………………..
3.2 Both parties agree:
• The audit should begin no later than 5 days after the conclusion of the contract.
• The contract to be fully implemented by………………….with a physical delivery of the report for the energy audit.
3.2 The terms of implementation may be extended only by written agreement between the two parties.
Art.4
Prices and Payments
4.1 The contract price for the work amounts to 10,000 (ten thousand) leva without VAT which covers the fees and all expenditure of the CONTRACTOR
4.2 The PRINCIPAL pays 5000 leva or 50% from the agreed remuneration for the overall performance of the contract after signing it, but not later than 5 days
4.3 The PRINCIPAL undertakes to pay the CONTRACTOR the remaining 50% from the remuneration, after physical delivery of the report for the energy audit and bilateral signing of the hand-over protocol.
4.4 The payments between the PRINCIPAL and the CONTRACTOR are made with a payment order of the PRINCIPAL against an invoice submitted by the CONTRACTOR.
4.5 The remuneration is paid in a bank account of the CONTRACTOR in Bulgarian leva. The CONTRACTOR’s bank account: ............................................
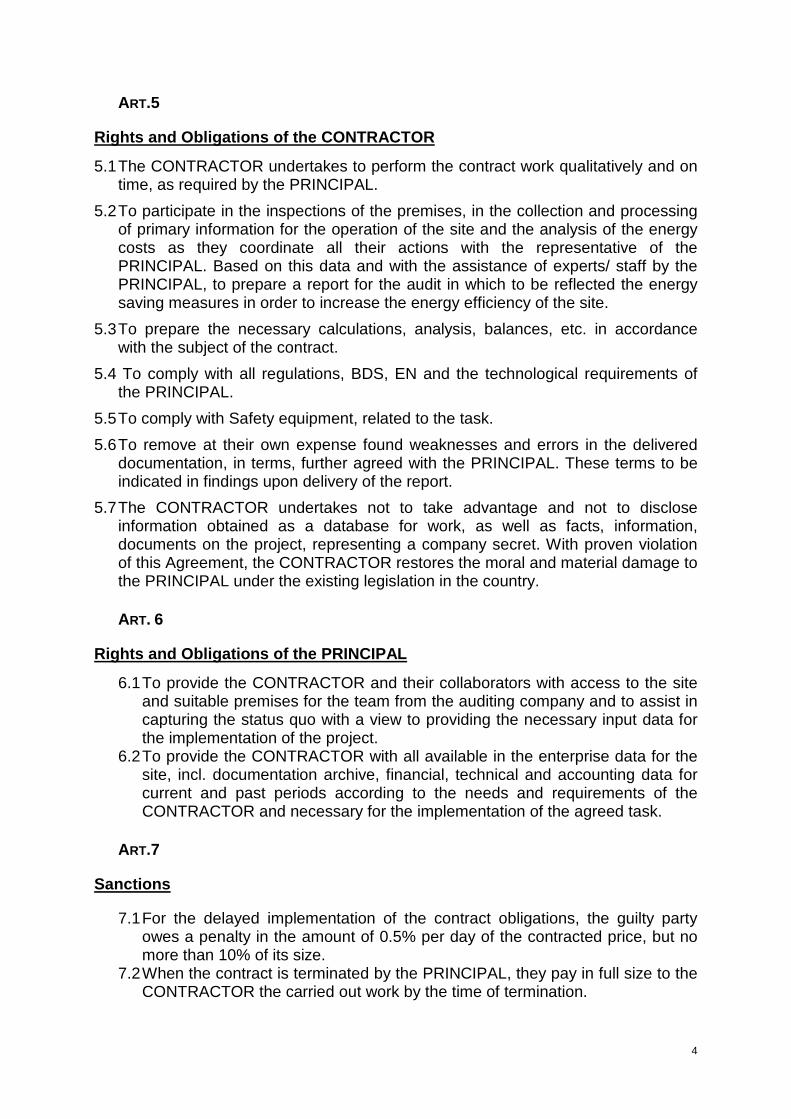
4
ART.5
Rights and Obligations of the CONTRACTOR
5.1 The CONTRACTOR undertakes to perform the contract work qualitatively and on time, as required by the PRINCIPAL.
5.2 To participate in the inspections of the premises, in the collection and processing of primary information for the operation of the site and the analysis of the energy costs as they coordinate all their actions with the representative of the PRINCIPAL. Based on this data and with the assistance of experts/ staff by the PRINCIPAL, to prepare a report for the audit in which to be reflected the energy saving measures in order to increase the energy efficiency of the site.
5.3 To prepare the necessary calculations, analysis, balances, etc. in accordance with the subject of the contract.
5.4 To comply with all regulations, BDS, EN and the technological requirements of the PRINCIPAL.
5.5 To comply with Safety equipment, related to the task.
5.6 To remove at their own expense found weaknesses and errors in the delivered documentation, in terms, further agreed with the PRINCIPAL. These terms to be indicated in findings upon delivery of the report.
5.7 The CONTRACTOR undertakes not to take advantage and not to disclose information obtained as a database for work, as well as facts, information, documents on the project, representing a company secret. With proven violation of this Agreement, the CONTRACTOR restores the moral and material damage to the PRINCIPAL under the existing legislation in the country.
ART. 6
Rights and Obligations of the PRINCIPAL
6.1 To provide the CONTRACTOR and their collaborators with access to the site and suitable premises for the team from the auditing company and to assist in capturing the status quo with a view to providing the necessary input data for the implementation of the project.
6.2 To provide the CONTRACTOR with all available in the enterprise data for the site, incl. documentation archive, financial, technical and accounting data for current and past periods according to the needs and requirements of the CONTRACTOR and necessary for the implementation of the agreed task.
ART.7
Sanctions
7.1 For the delayed implementation of the contract obligations, the guilty party owes a penalty in the amount of 0.5% per day of the contracted price, but no more than 10% of its size.
7.2 When the contract is terminated by the PRINCIPAL, they pay in full size to the CONTRACTOR the carried out work by the time of termination.

5
7.3 In breach of contract from the CONTRACTOR, they return to the PRINCIPAL the received amount, implemented as an advance under point 4.2 from the contract together with the legal interest for the period of its detention.
Art.8
Proprietorship
8.1 Any results or patents, received by the CONTRACTOR in the implementation of the negotiated agreement, will be owned by the PRINCIPAL
8.2 Copyright and other proprietary rights with respect to reports, documents, data, manuscripts or parts of them belong exclusively to the PRINCIPAL, except where proven that copyright or other proprietary right already exist before the date of this agreement.
Art.9
Confidentiality clause
The CONTRACTOR undertakes not to take advantage and not to disclose to third parties, except with the prior consent of the PRINCIPAL facts, information, documents and other issues, known, reported or brought to their attention during the execution of this agreement as well as any issues arising from them.
Art.10
Final provisions
1. Any amendments under this contract are made in writing and become an integral part of it;
2. For the outstanding issues in this contract are applied the provisions under the Law on Obligations and Contracts and the other legal documents;
3. The PRINCIPAL may assign to the CONTRACTOR additional work beyond the current contract indicated with an addendum to this contract.
This contract was signed in 2 (two) identical copies, one for each party.
PRINCIPAL: CONTRACTOR:
…………………… .............................

6
ANNEX № 01
TO CONTRACT DATED ...............
CONTENT OF AN AUDIT
FOR INVESTIGATION OF ENERGY EFFICIENCY

1
Annex V
List of eligible Energy Auditors

2
Number of
trainer Mr/Ms First name Family name 1 Mr. Ivan Trichkov 2 Mrs. Tanya Hisova 3 Ms. Ivana Serafimova 4 Mr. Alexander Penchev 5 Mr. Ivo Dimov 6 Mrs. Vera Mincheva 7 Mr. Angel Hristov 8 Mr. Georgi Stoynov 9 Mrs. Elena Dicheva
10 Mr. Anton Todorov 11 Mr. Blagomir Zhelqzkov 12 Mr. Kamen Simeonov 13 Mr. Alexander Stankov 14 Mr. Ventsislav Mirchev 15 Mr. Krasimir Stefanov 16 Mr. Kristian Spasov 17 Mr. Peter Zhelev 18 Mr. Dobromir Dobrev 19 Mr. Georgi Rashkov 20 Mr. Ivan Prodanov 21 Mr. Dimitar Baev 22 Mr. Nikola Stankov 23 Mr. Bozhidar Ivanov 24 Mr. Zdravko Georgiev 25 Mr. Venelin Draganov 26 Mrs. Ekaterina Taneva-Papen 27 Mr. Ivan Zahariev 28 Ms. Hristina Budinova 29 Mr. Hristiyan Terziev 30 Mr. Alexander Vodenicharov 31 Dobrin Oreshkov 32 Ms. Ina Boyadzhieva 33 Mr. Vladislav Aleksandrov 34 Mr. Lyubomir Lyubomirov 35 Ms. Nina Penkova 36 Mr. Kalin Krumov 37 Mr. Emil Vladimirov 38 Dr. eng. Lyubomir Tsokov 39 Assist. Prof. Kamen Stokov 40 Assist. Prof. Momchil Vasilev 41 Mr. Rosen Tsekov 42 M. Sc. Eng. Mihael Deliyski 43 Zhivko Dimov 44 Mr. Plamen Stanev 45 Ms. Tsvetanka Naydenova 46 Mr. Julian Radev

3
47 Ms. Maria Nikolova 48 Ms. Maria Stariradeva 49 Mr. Bojidar Borisov 50 Mr. Todor Lefterov 51 Mr. Yordan Torbov 52 Mr. Vladimir Stanoev 53 Mr. Borislav Stoimenov 54 Mr. Lazar Nikolaev 55 Mr. Teodor Vuchkov 56 Mr. Aleksi Krastev 57 Mr. Boncho Katinov 58 Ms. Aneliya Raycheva 59 Ms. Merima Zlateva 60 Mr. Lyuben Karabojikov 61 Mr. Alexander Kirii 62 Mr. Nikolay Stankov 63 Mr. Radoslav Raychev 64 Mr. Goergi Kostov 65 Mr. Zahari Dimanov 66 Mr. Radi Radev 67 Mr. Lyudmil Radev 68 Mrs. Dimitrina Gencheva 69 Mrs. Iliyana Hadzhieva 70 Mr. Stoyan Vladimirov 71 Mr. Tsvetko Shokov 72 Mr. Georgi Vodenicharov 73 Mr. Veselin Chaushev 74 Ms. Desislava Chausheva 75 Mr. Konstantin Delisivkov 76 Mr. Boyan Tsvetkov 77 Mr. Plamen Nikolov 78 Mr. Rumen Sirakov 79 Mr. Daniel Valev 80 Mr. Evstati Ilchev 81 Mr. Boyko Salin 82 Mr. Yulian Yovchev 83 Mr. Plamen Shindarski 84 Ms. Kostadinka Todorova 85 Ms. Ivanka Koemdjieva 86 Ms. Veselina Yancheva 87 Mr. Bojidar Naldjiev 88 M. Sc. Eng. Peter Evrosimovski 89 Ms. Desislava Chalamova 90 Ms. Gergana Hristova 91 Ms. Yordanka Nikolova 92 Mr. Boyan Yankulov 93 Mr. Georgi Velikov 94 Mr. Konstantin Velev 95 Ms. Rosiza Mladenova
4
96 Mr. Kosta Todorov 97 Mr. Tihomir Galov 98 Dr. eng. Pencho Penchev 99 Dr. eng. Valentin Bobilov 100 Dr. eng. Jivko Kolev 101 Dr. eng. Pencho Zlatev 102 Mr. Plamen Mushakov 103 Mr. Lyuben Mukov 104 Mr. Venko Kirilov 105 Mr. Georgi Atanasov 106 Mr. Lyubomir Serkedzhiev 107 Mr. Konstantin Stoyanov 108 Mr. Angel Kolev 109 Mr. Hristo Anev 110 Mr. Georgi Georgiev 111 Mr. Alexander Valkov 112 Mr. Georgi Naldjiev 113 Ms. Gergana Naldjiev 114 Dr. eng. Violeta Rasheva 115 Dr. eng. Stanislava Tasheva 116 Dr. eng. Georgi Dinkov 117 Prof. Mincho Minchev, 118 Prof. Milcho Angelov, 119 Mr. Konstantin Delisivkov 120 Ms. Olga Popova 121 Mr. Iliya Doychinov 122 Mr. Nikola Abadzhiev 123 Mrs. Nina Raycheva 124 Mr. Krasimir Lachev 125 Mr. Andon Georgiev 126 Mr. Ivan Raskov 127 Mr. Rumen Hristov 128 Ms. Maria Toneva 129 Mr. Nikolay Genov 130 Mr. Elenko Bojkov 131 Mr. Angel Angelov 132 Mr. Ivan Yankov 133 Ms. Gergana Georgieva 134 Mr. Hristo Gospodinov 135 Mr. Tanio Germanov 136 Mr. Shtilian Kunev 137 Ms. Marushka Koleva 138 Mr. Metodi Nikiforov 139 Mr. Vladimir Tunev 140 Mr. Milen Venkov 141 Mr. Ivaylo Aleksiev 142 Mr. Nikolay Kolev 143 Mr. Peter Staev 144 Mr. Todor Nikolov
5
145 Mr. Alexander Nedelchev 146 Mr. Gospodin Tabakov 147 Mr. Emil Boev 148 Mr. Grigor Grigorov 149 Mr. Yosif Genov 150 Mr. Rumen Sapundzhiev 151 Mr. Alexander Popov 152 Dr. eng. Nikolay Angelov 153 Dr. eng. Atanas Mirchev 154 Mr. Hristo Hristov 155 Mrs. Olga Radeva 156 Mrs. Velichka Radeva 157 Mrs. Svetla Damyanova 158 Mr. Vasil Aleksiev 159 Dr. eng. Neven Krastev 160 Ms. Dimitrinka Koeva 161 Ms. Velichka Radeva 162 Mr. Atanas Kumanov 163 Mr. Deyan Atanasov 164 Mr. Todor Horozov 165 Mr. Mincho Peev 166 Prof. Peter Kostov 167 Assist. Prof. Koicho Atanasov 168 Mr. Petko Cankov 169 Mr. Mincho Minchev 170 Mrs. Vesela Dimitrova 171 Mr. Georgi Georgiev 172 Mr. Ivelin Dimitrov 173 Mrs. Evelina Pirushkina 174 Mr. Galin Velikov 175 Mr. Ivaylo Pavlov 176 Mr. Plamen Nikolov 177 Mr. Boyan Tzvetkov 178 Mr. Stoyan Ralchev 179 Mr. Nikola Rusinov

1
ANNEX VI
Voucher Systems
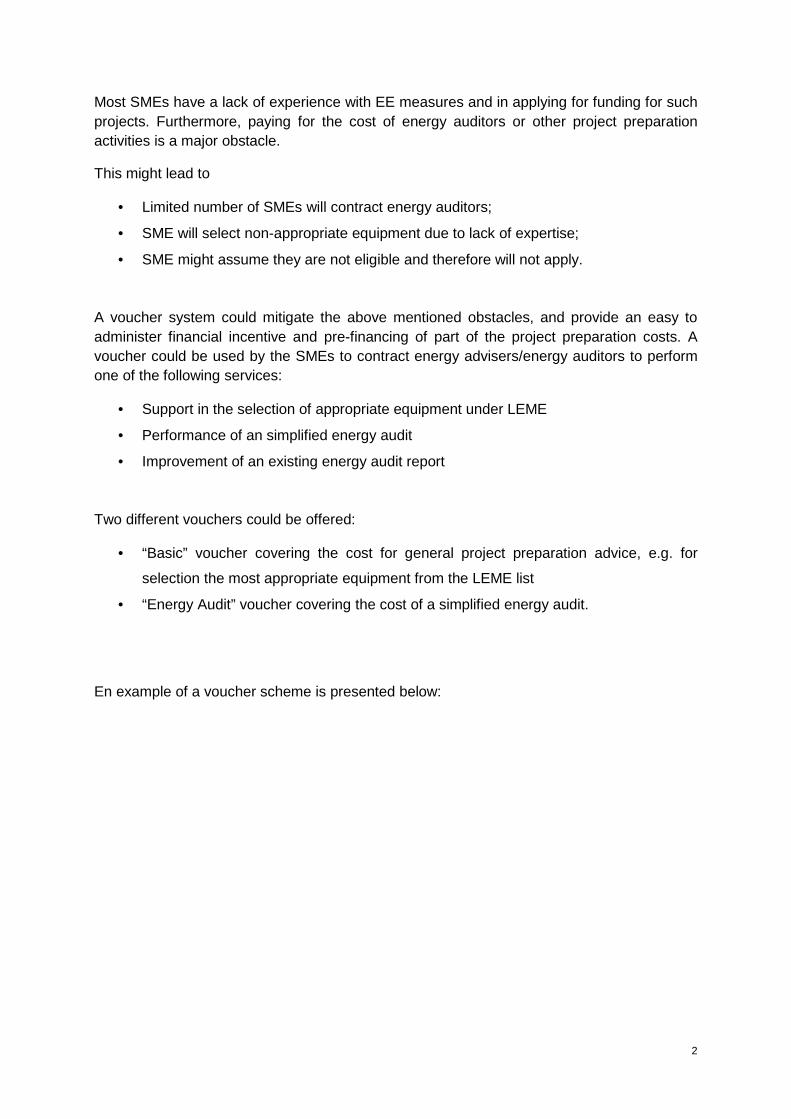
2
Most SMEs have a lack of experience with EE measures and in applying for funding for such projects. Furthermore, paying for the cost of energy auditors or other project preparation activities is a major obstacle.
This might lead to
• Limited number of SMEs will contract energy auditors;
• SME will select non-appropriate equipment due to lack of expertise;
• SME might assume they are not eligible and therefore will not apply.
A voucher system could mitigate the above mentioned obstacles, and provide an easy to administer financial incentive and pre-financing of part of the project preparation costs. A voucher could be used by the SMEs to contract energy advisers/energy auditors to perform one of the following services:
• Support in the selection of appropriate equipment under LEME
• Performance of an simplified energy audit
• Improvement of an existing energy audit report
Two different vouchers could be offered:
• “Basic” voucher covering the cost for general project preparation advice, e.g. for
selection the most appropriate equipment from the LEME list
• “Energy Audit” voucher covering the cost of a simplified energy audit.
En example of a voucher scheme is presented below:
3
SUMMARY OF THE AUSTRIAN
SME ENERGY EFFICIENCY INITIATIVE (VOUCHER SYSTEM)
WWW.KMU-SCHECK.AT
4
The SME Energy Efficiency Initiative
Austria has about 280.000 small- and medium sized enterprises (SMEs), and they have a large potential to save energy and decrease the reduction of emissions.
Various studies confirm an energy savings potential between 20% and 30%, depending on the economic sector.
In the context of the SME Energy Efficiency Initiative a comprehensive, region-wide incentive system was developed to foster energy audits and support the implementation of the identified measures.
The SME Energy Efficiency Initiative is funded by the Austrian Climate and Energy Fund, and implemented by the Austrian Federal Economic Chamber, with a strong involvement of the Energy Institute of the Economic Chamber. Kommunalkredit Public Consulting is also supporting this programme in the financial control of its implementation. The involvement of the Chamber shall ensure a strong participation of SMEs in this Initiative.
Objectives of the Initiative:
• Awareness raising among enterprises and employees through information, consulting, standardised trainings and standardized performance control.
• Creation of demand from SMEs for energy consulting services. • Support in a quick implementation of economically sound energy efficiency measures
based on recommendations from energy consulting. • Conclusions about effective incentive systems for the implementation of the energy
efficiency measures. • Development of practical benchmarks for energy relevant sectors. • Development of case studies of mitigation strategies, which support the reduction of
CO2 emissions and which ultimately lead to a zero-emission energy cycles. • Utilisation of highly efficient energy efficiency technologies. • Development of potential financing strategies to reduce CO2 emissions.
The Energy Efficiency Voucher
In the framework of the SME Energy Efficiency Initiative grants in the form of an “Energy Efficiency Voucher”, which partly cover the cost of energy consultants, are provided. The program supports “Initial Consulting Services” and “Implementation Support”.
Initial Consulting provides recommendations for energy efficiency improvements. Accredited energy consultants will develop specific energy efficiency measures and provide guidance in obtaining additional funding.
5
Implementation Support offers advisory and/or engineering services, which are directly connected to the implementation of specific energy efficiency measures.
The grant for Initial Consulting and for Implementation Support covers 90% of the
consultancy fee, capped at EUR 675. Each SME can apply for only one voucher for Initial
Consulting and Implementation Support within one year. The implementation of the SME
Energy Efficiency Initiative is regulated by specific grant regulations, which must be applied.
Procedures
Each SME has to apply for the grant (voucher) electronically by first registering on the
website www.kmu-scheck.at. Then the applicant receives electronically an application form,
which has to be submitted to Kommunalkredit Public Consulting (KPC). In general all SMEs
are eligible, however there are upper limits for the number grants per sector. One the
application is approved the applicant receives a grant agreement plus a symbolic “voucher”.
The the SME has to contract an energy consultant from a list of pre-approved consultants.
The programme provides standardises template contracts, each for initial consulting and
implementation support. After the implementation of the consultancy and the submission of
the (standardised) final report to KPC, KPC directly disburses the funds to the energy
consultants.
Available Programme Documents
- Scope of Work for Initial Consulting
- Scope of Work for Implementation Support
- Contract Template Initial Consulting
- Contract Template Implementation Support
- Grant Regulations
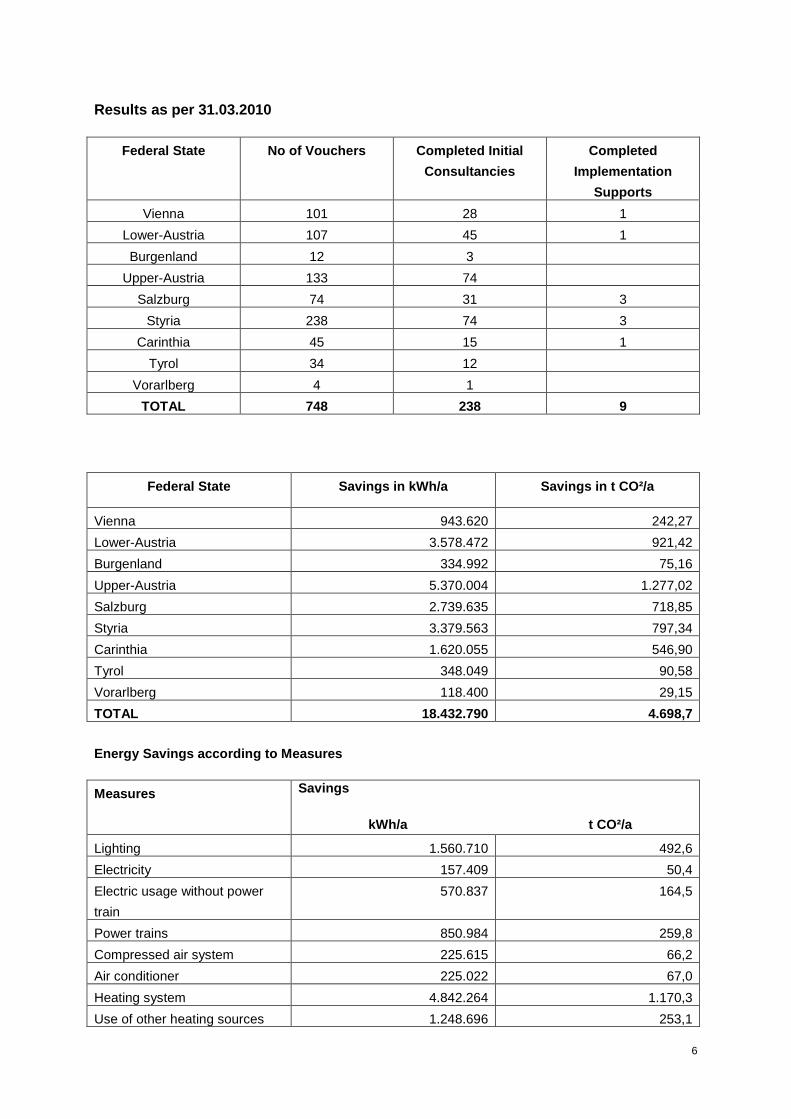
6
Results as per 31.03.2010
Federal State No of Vouchers Completed Initial
Consultancies
Completed
Implementation
Supports
Vienna 101 28 1
Lower-Austria 107 45 1
Burgenland 12 3
Upper-Austria 133 74
Salzburg 74 31 3
Styria 238 74 3
Carinthia 45 15 1
Tyrol 34 12
Vorarlberg 4 1
TOTAL 748 238 9
Federal State Savings in kWh/a Savings in t CO²/a
Vienna 943.620 242,27
Lower-Austria 3.578.472 921,42
Burgenland 334.992 75,16
Upper-Austria 5.370.004 1.277,02
Salzburg 2.739.635 718,85
Styria 3.379.563 797,34
Carinthia 1.620.055 546,90
Tyrol 348.049 90,58
Vorarlberg 118.400 29,15
TOTAL 18.432.790 4.698,7
Energy Savings according to Measures
Measures Savings
kWh/a t CO²/a
Lighting 1.560.710 492,6
Electricity 157.409 50,4
Electric usage without power
train
570.837 164,5
Power trains 850.984 259,8
Compressed air system 225.615 66,2
Air conditioner 225.022 67,0
Heating system 4.842.264 1.170,3
Use of other heating sources 1.248.696 253,1
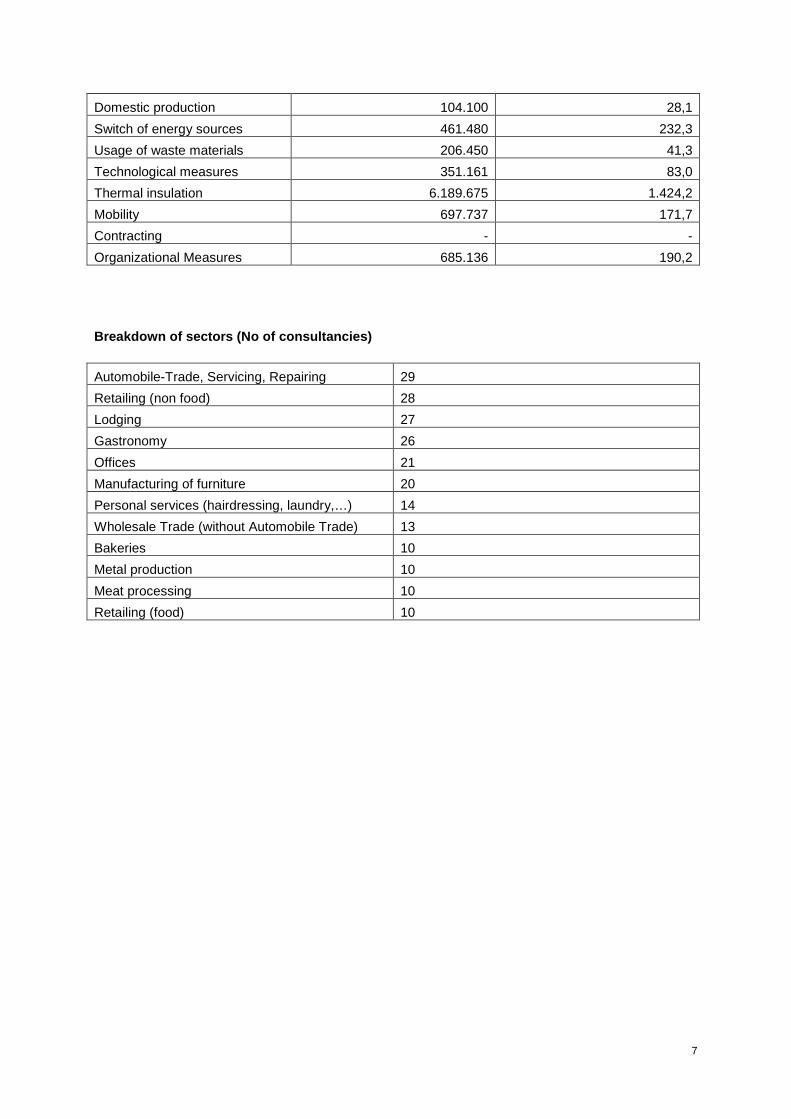
7
Domestic production 104.100 28,1
Switch of energy sources 461.480 232,3
Usage of waste materials 206.450 41,3
Technological measures 351.161 83,0
Thermal insulation 6.189.675 1.424,2
Mobility 697.737 171,7
Contracting - -
Organizational Measures 685.136 190,2
Breakdown of sectors (No of consultancies)
Automobile-Trade, Servicing, Repairing 29
Retailing (non food) 28
Lodging 27
Gastronomy 26
Offices 21
Manufacturing of furniture 20
Personal services (hairdressing, laundry,…) 14
Wholesale Trade (without Automobile Trade) 13
Bakeries 10
Metal production 10
Meat processing 10
Retailing (food) 10