Embed Size (px)
Citation preview
This product is part of the RAND Corporation reprint series. RAND reprints present previously published journal articles, book chapters, and reports with the permission of the publisher. RAND reprints have been formally reviewed in accordance with the publisher’s editorial policy, and are compliant with RAND’s rigorous quality assurance standards for quality and objectivity.
This PDF document was made available from www.rand.org as a public
service of the RAND Corporation.
6Jump down to document
THE ARTS
CHILD POLICY
CIVIL JUSTICE
EDUCATION
ENERGY AND ENVIRONMENT
HEALTH AND HEALTH CARE
INTERNATIONAL AFFAIRS
NATIONAL SECURITY
POPULATION AND AGING
PUBLIC SAFETY
SCIENCE AND TECHNOLOGY
SUBSTANCE ABUSE
TERRORISM AND HOMELAND SECURITY
TRANSPORTATION ANDINFRASTRUCTURE
WORKFORCE AND WORKPLACE
The RAND Corporation is a nonprofit research organization providing objective analysis and effective solutions that address the challenges facing the public and private sectors around the world.
Visit RAND at www.rand.org
Explore RAND Education
View document details
For More Information
Browse Books & Publications
Make a charitable contribution
Support RAND


State and Local Implementation of theNo Child Left Behind Act:
Volume I—Title I School Choice, Supplemental Educational Services, and Student Achievement
A report from the National Longitudinal Study of No Child Left Behind (NLS-NCLB)
Ron Zimmer, RAND Brian Gill, RAND
Paula Razquin, RAND Kevin Booker, Mathematica Policy Research
J.R. Lockwood III, RAND
----------------
Series Principal Investigators
Georges Vernez, RAND Beatrice F. Birman, AIR Michael S. Garet, AIR Jennifer O’Day, AIR
Prepared for:
U.S. Department of Education Office of Planning, Evaluation and Policy Development
Policy and Program Studies Service
2007
This report was prepared for the U.S. Department of Education under Contract Number ED00CO0087 with RAND. Stephanie Stullich served as the contracting officer’s representative for the National Longitudinal Study of No Child Left Behind. The views expressed herein do not necessarily represent the positions or policies of the Department of Education. No official endorsement by the U.S. Department of Education is intended or should be inferred.
U.S. Department of Education Margaret Spellings Secretary
Office of Planning, Evaluation and Policy Development Doug Mesecar Acting Assistant Secretary
Policy and Program Studies Service Alan Ginsburg Director
Program and Analytic Studies David Goodwin Director
June 2007; Revised July 2007
This report is in the public domain. Authorization to reproduce it in whole or in part is granted. While permission to reprint this publication is not necessary, the suggested citation is: U.S. Department of Education, Office of Planning, Evaluation and Policy Development, Policy and Program Studies Service, State and Local Implementation of the No Child Left Behind Act, Volume I—Title I School Choice, Supplemental Educational Services, and Student Achievement, Washington, D.C., 2007.
To order copies of this report, write:
ED Pubs Education Publications Center U.S. Department of Education P.O. Box 1398 Jessup, MD 20794-1398
Via fax, dial (301) 470-1244.
You may also call toll-free: 1-877-433-7827 (1-877-4-ED-PUBS). If 877 service is not yet available in your area, call 1-800-872-5327 (1-800-USA-LEARN). Those who use a telecommunications device for the deaf (TDD) or a teletypewriter (TTY) should call 1-877-576-7734.
To order online, point your Internet browser to: www.edpubs.org.
This report is also available on the Department’s Web site at: www.ed.gov/about/offices/list/opepd/ppss/reports.html#title.
On request, this publication is available in alternate formats, such as Braille, large print, or computer diskette. For more information, please contact the Department’s Alternate Format Center at 202-260-0852 or 202-260-0818.
iii
CONTENTS
List of Exhibits ..........................................................................................................................v
Preface .....................................................................................................................................vii
Acknowledgments ....................................................................................................................ix
Executive Summary..................................................................................................................xi
Key Findings .................................................................................................................................................xi
Who Uses Title I Supplemental Educational Services and School Choice?.......................................xii
Impact on Student Achievement .............................................................................................................xiii
Conclusions.................................................................................................................................................xiv
I. Introduction ....................................................................................................................... 1
Overview of Title I Parental Choice Provisions of NCLB .....................................................................1
Research Questions.......................................................................................................................................2
II. Data Sources ......................................................................................................................3
Student Eligibility and Participation ...........................................................................................................4
Characteristics of School Populations........................................................................................................4
Student Achievement....................................................................................................................................5
III. Student Participation in Title I Parental Choice Options.................................................7
Possible Factors Affecting Use of the Choice Options...........................................................................7
Student Participation Rates..........................................................................................................................8
Characteristics of Participants .....................................................................................................................9
Characteristics of Chosen Schools............................................................................................................11
IV. Impact of Title I Parental Choice Options on Student Achievement............................. 15
Evaluation Approach..................................................................................................................................15
Analytic Details............................................................................................................................................16
Impact of Title I Supplemental Educational Services on Student Achievement...............................18
Impact of Title I School Choice on Student Achievement...................................................................23
V. Conclusions...................................................................................................................... 31
iv
References................................................................................................................................ 33
Appendix A. Description of the Nine-District Data Set ........................................................ 37
Appendix B. Impact of Participation in Title I School Choice: Gains of Current Participants Compared to Those of Future Participants ................................................ 41
Appendix C. Meta-Analysis of Effects of Title I School Choice and Supplemental Educational Services........................................................................................................ 43
v
EXHIBITS
Executive Summary
Exhibit S.1 Percentage of Eligible Students Participating in Title I Supplemental Educational Services and School Choice, by Demographic Categories,2004–05.................................................................................................................................xiii
Exhibit S.2 Overall Achievement Gains of Student Participation in Title I Supplemental Educational Services in Seven Districts, Meta-Analysis, 2002–03 Through 2004–05.................................................................................................................................xiv
II. Data Sources
Exhibit 1 Districts Included in the Examination of Students Participating in the Title I Supplemental Educational Services and School Choice Options....................................3
III. Student Participation in Title I Parental Choice Options
Exhibit 2 Percentage of Eligible Students Participating in Title I Supplemental Educational Services and School Choice in Nine Districts, 2002–03 Through 2004–05....................................................................................................................................8
Exhibit 3 Percentage of Eligible Students Participating in Title I Supplemental Educational Services and School Choice, by Grade Level in Nine Districts, 2004–05....................................................................................................................................9
Exhibit 4 Percentage of Eligible Students Participating in Title I Supplemental Educational Services and School Choice, by Demographic Categories,2004–05..................................................................................................................................10
Exhibit 5 Prior Achievement Levels (Measured in Z-Scores) of Students Participating and Eligible for Title I Choice Options, 2004–05 ...........................................................11
Exhibit 6 Average Student Achievement in Schools That Students Participating in Title I School Choice Left and to Which They Transferred, Relative to Average District Achievement, 2003–04 and 2004–05...................................................12
Exhibit 7 Racial and Ethnic Composition of the Schools That Students Participating in Title I School Choice Left and to Which They Transferred, 2003–04 and 2004–05..................................................................................................................................13
IV. Impact of Title I Parental Choice Options on Student Achievement
Exhibit 8 Number of Student Participants Contributing to the Achievement Gain Analyses for Title I Supplemental Educational Services and School Choice, 2002–03 Through 2004–05 .................................................................................................17
Exhibit 9 Achievement Effects of Student Participation in Title I Supplemental Educational Services in Seven Districts ............................................................................19
vi
Exhibit 10 Overall Achievement Gains of Student Participation in Title I Supplemental Educational Services in Seven Districts, Meta-Analysis, 2002–03 Through 2004–05..................................................................................................................................21
Exhibit 11 Achievement Effects of Student Participation in Title I Supplemental Educational Services in Four Districts, by District and Non-District Providers ................................................................................................................................22
Exhibit 12 Achievement Effects of Student Participation in Title I School Choice in Six Districts, Fixed-Effect Analysis ..........................................................................................24
Exhibit 13 Achievement Effects of Student Participation in Title I School Choice in Six Districts, Meta-Analysis, 2002–03 Through 2004–05 .....................................................26
Exhibit 14 Achievement Effects of Student Participation in Title I School Choice in Six Districts, Intent-to-Treat Analysis......................................................................................27
Exhibit 15 Average Schoolwide Achievement Levels for Pre-Choice Schools of Current Participants (Treatment Group) and Future Participants (Control Group) in Title I School Choice, 2002–03 and 2003–04 ..................................................................29
Exhibit 16 Achievement Effect of Student Participation in Title I School Choice in Six Districts, as Measured by Comparing Achievement Gains of Current and Future Participants, 2002–03 and 2003–04 ......................................................................30
Exhibit 17 Overall Achievement Gains of Student Participation in Title I School Choice in Six Districts, as Measured by Comparing Achievement Gains of Current and Future Participants, Meta-Analysis, 2002–03 and 2003–04....................................30
Appendix B. Impact of Participation in Title I School Choice: Gains of Current Participants Compared to Those of Future Participants
Exhibit B.1 Effects on Math Achievement of Current Participants in Title I School Choice Relative to Future Participants, by District, 2002–03 and 2003–04..............................41
Exhibit B.2 Effect on Reading Achievement of Current Participants in Title I School Choice Relative to Future Participants, by District, 2002–03 and 2003–04 ................42
Appendix C. Meta-Analysis of Effects of Title I School Choice and Supplemental Educational Services
Exhibit C.1 Student Observations Contributing to the Meta-Analysis Estimates for Title I Supplemental Educational Services and School Choice in Exhibits 10 and 13 ..........44
Exhibit C.2 Student Observations Contributing to the Meta-Analysis Estimates in the Title I School Choice Analysis Comparing Achievement Gains of Current and Future Participants in Exhibit 17................................................................................44
Preface vii
PREFACE
This report presents findings about the relationship between participation in the Title I school choice and supplemental educational services options and student achievement from the National Longitudinal Study of No Child Left Behind (NLS-NCLB). The NLS-NCLB has collaborated with another study, the Study of State Implementation of Accountability and Teacher Quality Under No Child Left Behind(SSI-NCLB), to provide an integrated evaluation of the implementation of key NCLB provisions at the state level (SSI-NCLB) and at the district and school levels (NLS-NCLB). Together the two studies are issuing a series of reports on the topics of accountability, teacher quality, Title I school choice and supplemental educational services, and targeting and resource allocation. This report presents data from an analysis conducted by the NLS-NCLB using student-level data from nine large urban school districts to examine the characteristics of students participating in the two options and the related impact on student achievement.

Acknowledgments ix
ACKNOWLEDGMENTS
We wish to thank the many individuals who contributed to the completion of this report. We are especially grateful to officials in Baltimore, Chicago, Denver, Long Beach, Los Angeles, Palm Beach, Philadelphia, San Diego, and Washington, D.C., who graciously provided student-level data for the analysis. Without their efforts, this report would not have been possible, and we deeply appreciate their assistance.
The information in this report was provided through the congressionally mandated National Longitudinal Study of No Child Left Behind (NLS-NCLB), which was conducted by the RAND Corporation and the American Institutes for Research (AIR) under contract to the U.S. Department of Education. The NLS-NCLB was led by Georges Vernez of the RAND Corporation and Michael Garet and Beatrice Birman of AIR, assisted by Brian Stecher (accountability team leader), Brian Gill (choice team leader), Meredith Ludwig (teacher quality team leader) and Jay Chambers (targeting and resource allocation team leader). Marie Halverson of the National Opinion Research Center directed data collection for the NLS-NCLB.
Several individuals at the U.S. Department of Education provided guidance and direction for this report. Stephanie Stullich served as project officer for the National Longitudinal Study of No Child Left Behindand provided invaluable substantive guidance and support throughout this study and the production of this report. We would also like to acknowledge the assistance of David Goodwin, director of Program and Analytic Studies in Policy and Program Studies Services (PPSS), and Daphne Kaplan, PPSS team leader.
We would like to acknowledge thoughtful contributions of the members of our Technical Working Group, including Julian Betts, David Francis, Margaret Goertz, Brian Gong, Eric Hanushek, Richard Ingersoll, Phyllis McClure, Paul Peterson, Christine Steele, and Phoebe Winter. Thomas Cook, Christopher Cross, Eric Smith, and Maris Vinovskis also provided useful comments and suggestions.
We also would like to thank Julian Betts who read and provided helpful comments that improved the quality of the report.
While we appreciate the assistance and support of all of these individuals, any errors in judgment or fact are, of course, the responsibility of the authors.

Executive Summary xi
EXECUTIVE SUMMARY
A key aim of the federal No Child Left Behind Act of 2001 (NCLB) is to provide new educational options to parents whose children attend Title I schools1 that are identified for improvement, corrective action, or restructuring because the schools have not made adequate yearly progress (AYP) toward meeting state standards for two or more years. The first of these options is the opportunity for parents to transfer their children to another school in the district that has not been identified. The second option is the opportunity for parents to enroll their children in supplemental educational services—such as tutoring, remediation, or other academic instruction—that are offered by a state-approved provider and are in addition to instruction provided during the school day. This option is available to low-income families whose children attend a Title I school that is in Year 2 (or a later year) of identified for improvement status.
This report examines the characteristics of students participating in the two options and the related impact on student achievement.
Data from nine large, urban school districts were used for this study. These districts were selected primarily because they had relatively large numbers (but not necessarily large percentages) of students participating in the two choice options. In the 2004–05 school year, the average participation rates across these districts were 0.5 percent for Title I school choice and 12 percent for supplemental educational services, lower than the national averages of 1 and 19 percent, respectively (Stullich, et al., forthcoming).
KEY FINDINGS
Participation rates by grade level. Participation in both the Title I school choice and supplemental educational services options was highest in elementary grades. For supplemental services, 24 to 28 percent of eligible students in grades 2 through 5 participated, while in high school, fewer than 5 percent of eligible students participated. For school choice, average participation rates in grades 2 through 5 were between 0.6 and 1.0 percent, while high school participation rates were between 0.2 and 0.4 percent.
Variation in participation rates by student characteristics. African-American students had the highest rate of participation, compared with other racial or ethnic groups, in Title I supplemental educational services and an above-average participation rate in school choice. Hispanic students had a higher participation rate than white students in supplemental services but a lower participation rate in school choice. Limited English proficiency (LEP) students and students with disabilities had relatively high participation rates in supplemental services and relatively low participation rates in school choice.
Prior achievement levels for participating students. Students enrolled in supplemental educational services had prior achievement levels lower than those for students who were also eligible for these services but who did not enroll. Students who used the Title I school
1 Title I schools are schools that operate programs funded under Title I of the Elementary and Secondary Education Act of 1965 (ESEA), the largest federal program supporting elementary and secondary education. Title I, Part A, includes the two parental choice options that are the subject of this paper. The No Child Left Behind Act of 2001 is the most recent reauthorization of ESEA.
Executive Summary xii
choice option had prior achievement levels similar to those of eligible students who did not transfer. For both options, participating students had prior achievement levels that were lower than those of ineligible students.
Characteristics of chosen schools. Students who used the Title I school choice option moved from schools with below-average achievement levels to schools with above-average achievement levels. Also, students tended to move to more racially balanced schools.
Impact of Title I supplemental educational services on student achievement. Onaverage, across seven districts,2 participation in supplemental educational services had a statistically significant, positive effect on students’ achievement in reading and math. Students participating for multiple years experienced larger gains.
Impact of Title I school choice on student achievement. In contrast, across six districts,3 no statistically significant effect on achievement, positive or negative, was found for students participating in Title I school choice. However, sample sizes for school choice were much smaller than were those for supplemental services, so there was limited statistical power to detect effects, and caution is warranted in interpreting this result.
Because these findings are based on a small number of school districts that are not nationally representative, they should not be viewed as representative of the effects of school choice and supplemental educational services nationally. However, as one of the first studies of the effects of the Title I parental choice options, the results are important because they are based on data from districts that include a range of underperforming schools and disadvantaged populations that NCLB is designed to target.
WHO USES TITLE I SUPPLEMENTAL EDUCATIONAL SERVICES AND SCHOOL
CHOICE?
For both options, African-American students had above-average participation rates.
For supplemental services, eligible African-American and Hispanic students had higher participation rates (16.9 percent and 11.6 percent, respectively) than did eligible white students (10.1 percent). Above-average participation rates were also found for students with disabilities (14.6 percent) and LEP students (13.1 percent). Among students eligible for school choice, African-American and white students had above-average participation rates, but participation rates for all measured subgroups were no more than 1.1 percent (see Exhibit S.1).
Students who were eligible for school choice or supplemental educational services were, on average, lower achieving than other students in their districts.
Achievement scores in reading and math for those students who were eligible for school choice or supplemental services were lower than the average scores for the district. In addition, looking specifically at the pool of eligible students (rather than all students in a district), participants in
2 Two districts were excluded from the impact analysis for supplemental services because they did not have a sufficient sample of participating students (i.e., fewer than 100 participating students with test score data). 3 Three districts were excluded from the impact analysis for school choice because they did not have a sufficient sample of participating students (i.e., fewer than 100 participating students with test score data).
Executive Summary xiii
supplemental services were, on average, lower achieving than students who were eligible but did not participate. Participants in school choice had prior achievement scores that were similar to those who were eligible but did not participate.
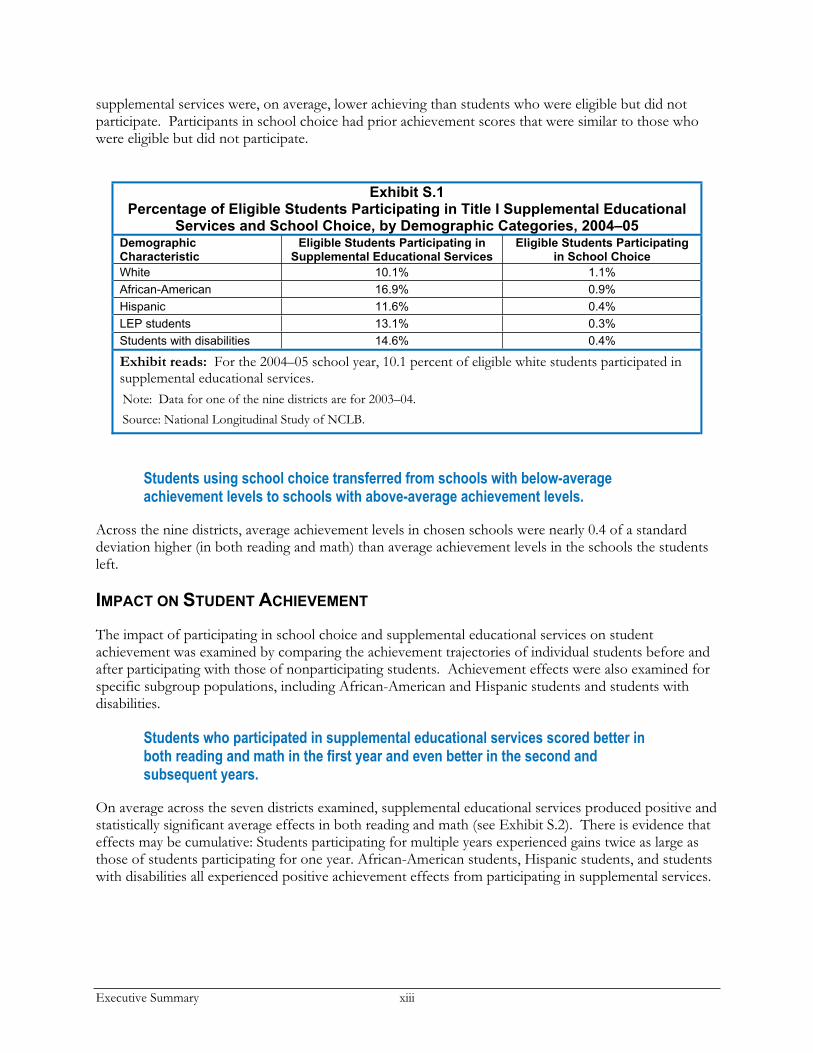
Exhibit S.1Percentage of Eligible Students Participating in Title I Supplemental Educational
Services and School Choice, by Demographic Categories, 2004–05 Demographic Characteristic
Eligible Students Participating in Supplemental Educational Services
Eligible Students Participating in School Choice
White 10.1% 1.1%
African-American 16.9% 0.9%
Hispanic 11.6% 0.4%
LEP students 13.1% 0.3%
Students with disabilities 14.6% 0.4%
Exhibit reads: For the 2004–05 school year, 10.1 percent of eligible white students participated in supplemental educational services. Note: Data for one of the nine districts are for 2003–04. Source: National Longitudinal Study of NCLB.
Students using school choice transferred from schools with below-average achievement levels to schools with above-average achievement levels.
Across the nine districts, average achievement levels in chosen schools were nearly 0.4 of a standard deviation higher (in both reading and math) than average achievement levels in the schools the students left.
IMPACT ON STUDENT ACHIEVEMENT
The impact of participating in school choice and supplemental educational services on student achievement was examined by comparing the achievement trajectories of individual students before and after participating with those of nonparticipating students. Achievement effects were also examined for specific subgroup populations, including African-American and Hispanic students and students with disabilities.
Students who participated in supplemental educational services scored better in both reading and math in the first year and even better in the second and subsequent years.
On average across the seven districts examined, supplemental educational services produced positive and statistically significant average effects in both reading and math (see Exhibit S.2). There is evidence that effects may be cumulative: Students participating for multiple years experienced gains twice as large as those of students participating for one year. African-American students, Hispanic students, and students with disabilities all experienced positive achievement effects from participating in supplemental services.
Executive Summary xiv
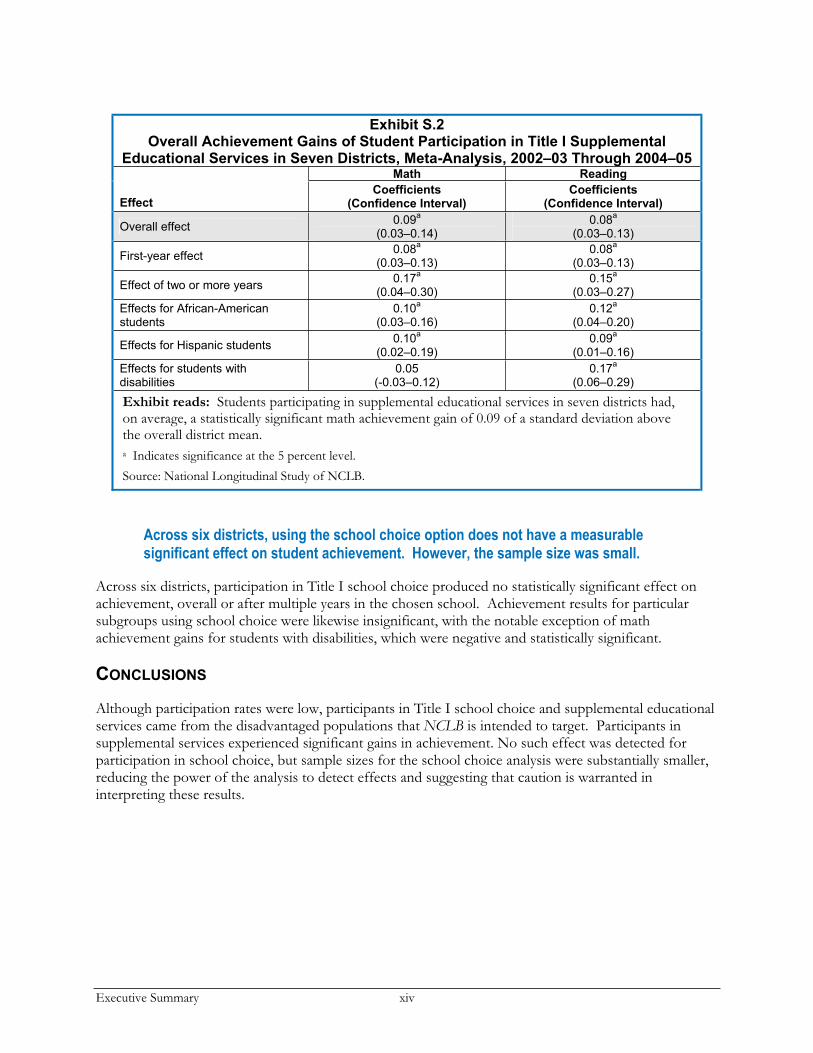
Exhibit S.2 Overall Achievement Gains of Student Participation in Title I Supplemental
Educational Services in Seven Districts, Meta-Analysis, 2002–03 Through 2004–05 Math Reading
EffectCoefficients
(Confidence Interval) Coefficients
(Confidence Interval)
Overall effect 0.09
a
(0.03–0.14) 0.08
a
(0.03–0.13)
First-year effect 0.08
a
(0.03–0.13) 0.08
a
(0.03–0.13)
Effect of two or more years 0.17
a
(0.04–0.30) 0.15
a
(0.03–0.27)
Effects for African-American students
0.10a
(0.03–0.16) 0.12
a
(0.04–0.20)
Effects for Hispanic students 0.10
a
(0.02–0.19) 0.09
a
(0.01–0.16)
Effects for students with disabilities
0.05(-0.03–0.12)
0.17a
(0.06–0.29)
Exhibit reads: Students participating in supplemental educational services in seven districts had, on average, a statistically significant math achievement gain of 0.09 of a standard deviation above the overall district mean. a Indicates significance at the 5 percent level. Source: National Longitudinal Study of NCLB.
Across six districts, using the school choice option does not have a measurable significant effect on student achievement. However, the sample size was small.
Across six districts, participation in Title I school choice produced no statistically significant effect on achievement, overall or after multiple years in the chosen school. Achievement results for particular subgroups using school choice were likewise insignificant, with the notable exception of math achievement gains for students with disabilities, which were negative and statistically significant.
CONCLUSIONS
Although participation rates were low, participants in Title I school choice and supplemental educational services came from the disadvantaged populations that NCLB is intended to target. Participants in supplemental services experienced significant gains in achievement. No such effect was detected for participation in school choice, but sample sizes for the school choice analysis were substantially smaller, reducing the power of the analysis to detect effects and suggesting that caution is warranted in interpreting these results.
Chapter I 1
I. INTRODUCTION
A key aim of the federal No Child Left Behind Act of 2001(NCLB) is to provide new educational options to parents whose children attend Title I schools4 that are identified for improvement, corrective action, or restructuring because the schools did not make adequate yearly progress (AYP) toward meeting state standards for two or more years. The first of these options is the opportunity to transfer their children to another school in the district that has not been identified. The second option is the opportunity to enroll the child in supplemental educational services—such as tutoring, remediation, or other academic instruction—that are offered in addition to instruction provided during the school day. This option is available to low-income families whose children attend a Title I school that is in Year 2 (or later) of identified for improvement status.
This report, produced as part of the National Longitudinal Study of NCLB (NLS-NCLB), examines the characteristics of students using the Title I school choice and supplemental services options offered under NCLB and the relationship between the use of those options and student achievement. This examination focuses on nine large, urban school districts across the country, selected because they have numerous students exercising the NCLB options and have longitudinal student-level data.
Three companion reports from the NLS-NCLB examine implementation of the required Title I parental options (school choice and supplemental services), accountability, and teacher quality provisions in districts and schools across the country. These reports analyze results from surveys of nationally representative samples of district officials, principals, teachers, and paraprofessionals, as well as subsamples of parents and supplemental service providers. A fourth report examines resource targeting and allocation under Title I and certain other federal education programs.
OVERVIEW OF TITLE I PARENTAL CHOICE PROVISIONS OF NCLB
Under NCLB, schools must make AYP toward achieving the Act’s overall goal: ensuring that all children are proficient in reading and math by 2014. AYP standards are set by each state. Title I schools that do not meet state goals for AYP for two consecutive years are identified as being in need of improvement and considered to be in Year 1 of improvement status. Schools that fail to make AYP an additional year are considered to be in Year 2 of improvement status.
NCLB requires that parents of students in Title I schools that are in identified for improvement status be given the option to transfer their children to another public school in the district that has not been identified, with transportation provided by the district. Parents must be given more than one choice of transfer options, if more than one choice exists. While all students in eligible schools must be offered this option, if demand exceeds funding available, priority for transportation must be given to the lowest-achieving low-income students requesting transfers. However, all students requesting transfers must still be allowed to transfer. If a Title I school is in Year 2 (or later) of identified for improvement status, parents of low-income students must be offered a second option (in addition to school choice): They must have access to supplemental educational services for their child. These services are free to parents and students, must be in addition to instruction provided during the school day, and may include tutoring, after-school services, and summer programs. Parents are permitted to select a supplemental
4 Title I schools are schools that operate programs funded under Title I of the Elementary and Secondary Education Act of 1965 (ESEA), the largest federal program supporting elementary and secondary education. Title I, Part A, includes the two parental choice options that are the subject of this paper. The No Child Left Behind Act of 2001 is the most recent reauthorization of ESEA.
Chapter I 2
service provider from a list of providers that have been approved by the state to offer services. School districts, in consultation with parents and providers, must develop specific educational goals for each participating student. Supplemental service providers are responsible for measuring students’ progress and reporting regularly on that progress to teachers and parents.
Supplemental educational services may be provided by a variety of agencies, including approved for-profit and nonprofit entities, school districts, faith-based organizations, and public or private schools. Each state is responsible for developing criteria for approving providers and for providing school districts with a list of available approved providers in their geographic locations.
RESEARCH QUESTIONS
This study examines two sets of policy questions related to the Title I parental choice provisions of the law:
1. What are the characteristics of the students who take advantage of the school choice and supplemental educational services options offered under NCLB? Do they differ from eligible nonparticipants in terms of race, ethnicity, limited English proficiency (LEP), and prior achievement levels? What are the characteristics of the student populations of the schools chosen by students who elect the school choice option?
2. What is the relationship between student achievement and participation in the Title I school choice and supplemental educational services options? How does the achievement of students who use the choice options compare to their own prior levels of achievement and to theachievement of eligible students who do not choose to use the options?
Chapter II 3
II. DATA SOURCES
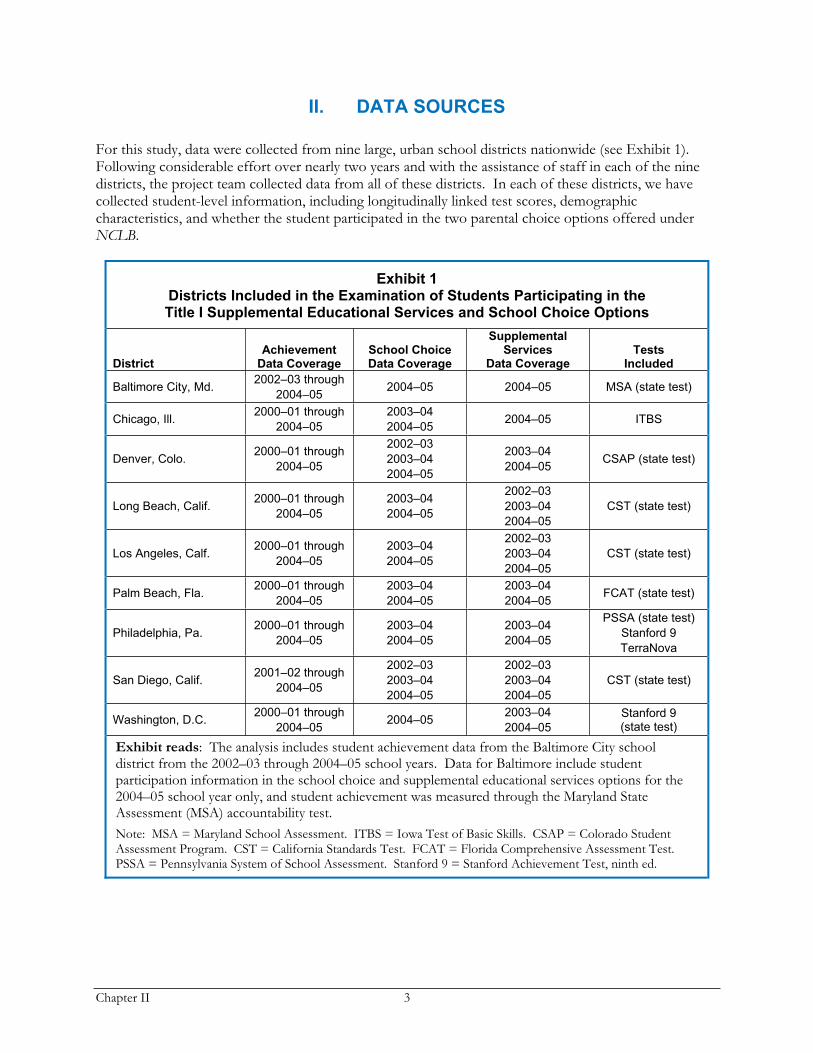
For this study, data were collected from nine large, urban school districts nationwide (see Exhibit 1). Following considerable effort over nearly two years and with the assistance of staff in each of the nine districts, the project team collected data from all of these districts. In each of these districts, we have collected student-level information, including longitudinally linked test scores, demographic characteristics, and whether the student participated in the two parental choice options offered under NCLB.
Exhibit 1Districts Included in the Examination of Students Participating in the Title I Supplemental Educational Services and School Choice Options
DistrictAchievement
Data Coverage School Choice Data Coverage
Supplemental Services
Data Coverage Tests
Included
Baltimore City, Md. 2002–03 through
2004–05 2004–05 2004–05 MSA (state test)
Chicago, Ill. 2000–01 through
2004–05
2003–04
2004–05 2004–05 ITBS
Denver, Colo. 2000–01 through
2004–05
2002–03
2003–04
2004–05
2003–04
2004–05 CSAP (state test)
Long Beach, Calif. 2000–01 through
2004–05
2003–04
2004–05
2002–03
2003–04
2004–05
CST (state test)
Los Angeles, Calf. 2000–01 through
2004–05
2003–04
2004–05
2002–03
2003–04
2004–05
CST (state test)
Palm Beach, Fla. 2000–01 through
2004–05
2003–04
2004–05
2003–04
2004–05 FCAT (state test)
Philadelphia, Pa. 2000–01 through
2004–05
2003–04
2004–05
2003–04
2004–05
PSSA (state test)
Stanford 9
TerraNova
San Diego, Calif. 2001–02 through
2004–05
2002–03
2003–04
2004–05
2002–03
2003–04
2004–05
CST (state test)
Washington, D.C. 2000–01 through
2004–05 2004–05
2003–04
2004–05
Stanford 9 (state test)
Exhibit reads: The analysis includes student achievement data from the Baltimore City school district from the 2002–03 through 2004–05 school years. Data for Baltimore include student participation information in the school choice and supplemental educational services options for the 2004–05 school year only, and student achievement was measured through the Maryland State Assessment (MSA) accountability test. Note: MSA = Maryland School Assessment. ITBS = Iowa Test of Basic Skills. CSAP = Colorado Student Assessment Program. CST = California Standards Test. FCAT = Florida Comprehensive Assessment Test. PSSA = Pennsylvania System of School Assessment. Stanford 9 = Stanford Achievement Test, ninth ed.
Chapter II 4
STUDENT ELIGIBILITY AND PARTICIPATION
One of the challenges for the analysis was collecting district-by-district information on student eligibility for and participation in the two options. For example, districts often had difficulty determining whether students who transferred had done so under the NCLB transfer provision or for other reasons. Moreover, identifying participating students was often easier than identifying the total pool of eligible students. In districts that did not provide eligibility information, we used the improvement status of schools to determine whether students were eligible.5 Under NCLB, all students in schools identified for improvement are eligible for school choice.
For the second option (supplemental services), the eligibility status of students cannot be determined solely by the school’s improvement status. NCLB defines eligibility for supplemental services to apply to students from low-income families in schools that are in Year 2 or beyond of school improvement. Districts may also choose to expand eligibility to all students in such schools, but they may not count funds spent for non-low-income students toward the requirement to spend 20 percent of their Title I allocation on supplemental education services and transportation for school choice participants.
Chicago and Palm Beach were unable to provide verifiable eligibility data for supplemental services.6 In both districts, some students who were not classified as low-income were, in fact, receiving Title I–related supplemental services. We therefore assumed that all students in those districts who attend schools identified for improvement in Year 2 and beyond were eligible to receive supplemental services. (More than 90 percent of the students in the relevant schools in both districts were in fact low-income students, so the presence or absence of a low-income requirement does not make a large difference to the eligibility pool.7)
CHARACTERISTICS OF SCHOOL POPULATIONS
Information is available on the characteristics of the student populations in schools sending and receiving students under school choice. In contrast, for most districts, we do not have information on specific supplemental service providers chosen by students. However, in four of the districts, the district indicated whether the provider was the district or a private provider. We used this information to examine whether the type of provider affected student achievement.
5 Chicago, Washington, D.C., and Los Angeles provided indicators for all relevant school years, designating whether each student was eligible for the school-choice and supplemental services provisions. (However, we had complications in using the eligibility information from Chicago and Palm Beach, as described below). Denver, Long Beach, Philadelphia, and San Diego provided indicators for supplemental service eligibility for all school years, while school-choice eligibility was inferred from the school’s identification status. In Baltimore and Palm Beach, we used information on the school improvement status of each school to infer eligibility for transfer and supplemental educational services. 6 Chicago provided eligibility information for supplemental services, but many of the students noted as eligible did not attend schools that were in the Year 2 or beyond of improvement, according to the Illinois State Board of Education (http://www.isbe.state.il.us/research/htmls/report_card.htm). We therefore used the school status according to the Illinois State Board of Education to determine whether a student was eligible for the options of school choice and supplemental services. 7 In Chicago in 2004–05, 7.5 percent of students in schools in Year 2 or beyond of improvement were not low-income, while 3.7 percent of students participating in supplemental services were not low-income. In Palm Beach in 2004–05, 8.8 percent of students in schools in year two of improvement or beyond were not low-income, while 4.0 percent of students participating in supplemental services were not low-income.
Chapter II 5
STUDENT ACHIEVEMENT
In most districts, the state accountability test was used to track student performance over time. In Philadelphia, the state accountability test (PSSA) was administered consistently only in grades 5, 8, and 11 during the period of the study. Therefore, in addition to the PSSA scores, we used district-administered Stanford 9 and TerraNova scores in other grades to follow the achievement of individual students over time.8 Similarly, in Chicago, we used the district-mandated ITBS rather than the state test, which was administered in only a few grades during the period examined.
To examine outcomes in standard units, all test scores were converted into rank-based z-scores by grade and year within each district, with a mean of 0 and a standard deviation of 1. More specifically, all student scores were sorted by rank then converted to z-scores normed across the entire population of tested students in that subject and grade for each district. This does not create a psychometrically valid developmental scale, but it permits an examination of changes in rank with fewer assumptions than would be needed under other kinds of scaling. (See the appendixes of Gill et al. (2005) for a further discussion of rank-based z-scores.) Results are reported separately for each district.
A more complete description of the data collected from each district, along with assumptions made, is contained in Appendix A. Also, because we do not have each district’s permission to present our results, we mask the identities of the districts by using nondescriptive names in the exhibits and by not referring to district identifiers in our discussion of results.
8 Test data in Philadelphia include results on the state accountability test (PSSA) in grades 5, 8, and 11, and results for other grades from Stanford 9 in 2000–01 and 2001–02 and TerraNova in subsequent years. Washington, D.C. data include test scores in grades 1 through 11 for the 2000–01 through 2003–04 school years, when Stanford 9 was used as the accountability test. For the 2004–05 school year, in Washington we have test data in grades 3, 5, 8, and 10 only, limiting the examination of achievement impacts to students in those grades. In Baltimore, test data are available for grades 3, 5, and 8 for 2002–03 and 2003–04, and for grades 3 through 10 in 2004–05 (all of which are state test results), likewise limiting the number of students for whom longitudinal achievement effects can be estimated.

Chapter III 7
III. STUDENT PARTICIPATION IN TITLE I PARENTAL CHOICE OPTIONS
NCLB makes two new educational options—school choice and supplemental educational services—available to students in Title I schools that have been identified for improvement, corrective action, or restructuring, but the use of those options depends on parental decisions. The extent to which the options are being used, the characteristics of the students using them and the characteristics of the schools and providers chosen are critical empirical questions regarding the implementation of NCLB.
POSSIBLE FACTORS AFFECTING USE OF THE CHOICE OPTIONS
A number of factors can affect student participation in Title I choice options. One issue is the extent to which districts provide timely, useful, and easy-to-understand information about the options. The National Assessment of Title I found that only 29 percent of affected districts notified parents about the Title I school choice option before the beginning of the 2004-05 school year (Stullich et al., 2006). One reason for the late notice to parents may be that many states (20) did not notify districts about which schools were identified for improvement prior to the start of the 2004-05 school year. In addition, some districts may have few non-identified schools available for transfer students, and available schools may have few spaces available to accommodate transfer students.
Preexisting school choice programs and after-school programs can affect whether a family chooses to participate in either of the NCLB choice options. In Washington, D.C., for example, more than a fourth of all students attend a charter school, and nearly 2,000 students participate in a local school voucher program. In other districts—including Los Angeles, Chicago, San Diego, Philadelphia, and Palm Beach—tens of thousands of students attend charter schools. Similarly, Los Angeles, Chicago, and San Diego offer intra-district choice programs in which students can choose among district-operated public schools, including vibrant magnet programs.
In addition, a wide variety of out-of-school supplemental programs has been created over the past few decades, independent of NCLB. In a typical large district, dozens of different supplemental programs operate simultaneously. Although the district operates some of these programs, many are operated by community groups and may include not only academic tutoring but enrichment programs as well. Because the vast majority of these programs are operated outside of the district’s control, it is hard to know how many students are participating in these programs across the nine districts included in our study. The availability of these programs could affect students’ participation in the Title I choice options.
Many of these programs predate the initiation of the Title I choice options and may help explain the low participation rates in these options nationally. The NLS-NCLB study has estimated that about 1 percent of eligible students made use of the school choice option as of 2004–05, and about 19 percent of eligible students enrolled in supplemental services as of 2003–04 (Stullich et al., forthcoming).
Chapter III 8
STUDENT PARTICIPATION RATES
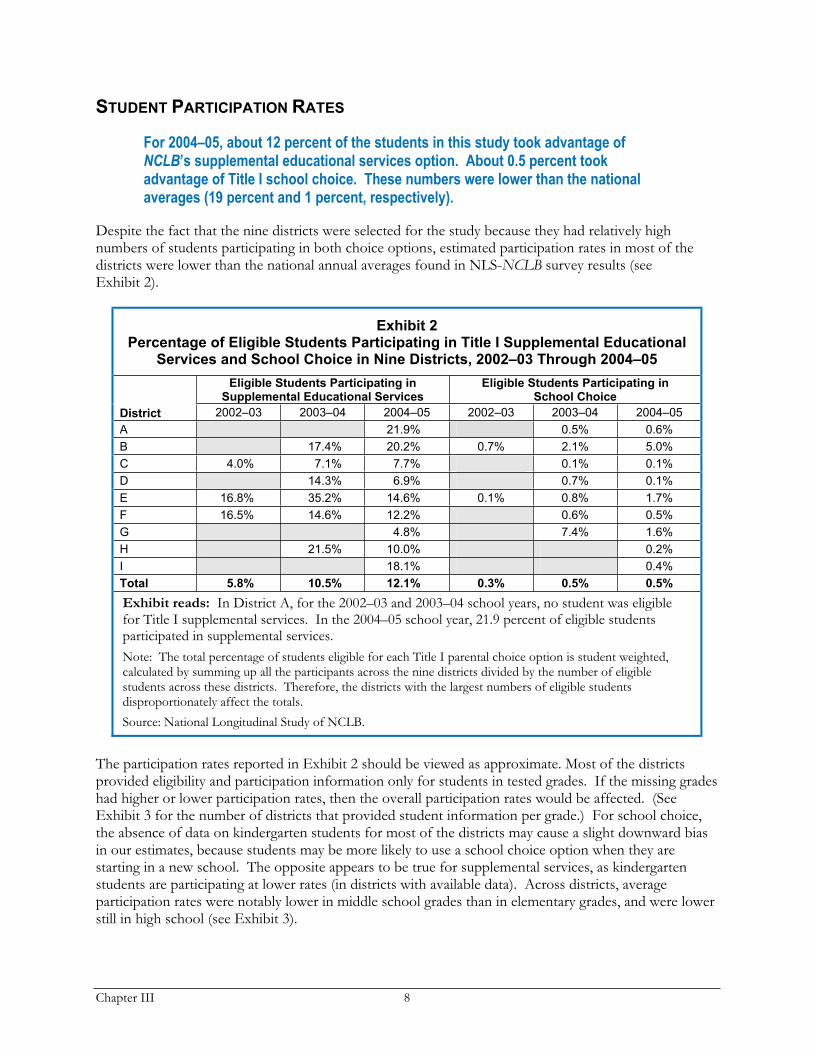
For 2004–05, about 12 percent of the students in this study took advantage of NCLB’s supplemental educational services option. About 0.5 percent took advantage of Title I school choice. These numbers were lower than the national averages (19 percent and 1 percent, respectively).
Despite the fact that the nine districts were selected for the study because they had relatively high numbers of students participating in both choice options, estimated participation rates in most of the districts were lower than the national annual averages found in NLS-NCLB survey results (see Exhibit 2).
Exhibit 2Percentage of Eligible Students Participating in Title I Supplemental Educational
Services and School Choice in Nine Districts, 2002–03 Through 2004–05
Eligible Students Participating in Supplemental Educational Services
Eligible Students Participating in School Choice
District 2002–03 2003–04 2004–05 2002–03 2003–04 2004–05
A 21.9% 0.5% 0.6%
B 17.4% 20.2% 0.7% 2.1% 5.0%
C 4.0% 7.1% 7.7% 0.1% 0.1%
D 14.3% 6.9% 0.7% 0.1%
E 16.8% 35.2% 14.6% 0.1% 0.8% 1.7%
F 16.5% 14.6% 12.2% 0.6% 0.5%
G 4.8% 7.4% 1.6%
H 21.5% 10.0% 0.2%
I 18.1% 0.4%
Total 5.8% 10.5% 12.1% 0.3% 0.5% 0.5%
Exhibit reads: In District A, for the 2002–03 and 2003–04 school years, no student was eligible for Title I supplemental services. In the 2004–05 school year, 21.9 percent of eligible students participated in supplemental services. Note: The total percentage of students eligible for each Title I parental choice option is student weighted, calculated by summing up all the participants across the nine districts divided by the number of eligible students across these districts. Therefore, the districts with the largest numbers of eligible students disproportionately affect the totals. Source: National Longitudinal Study of NCLB.
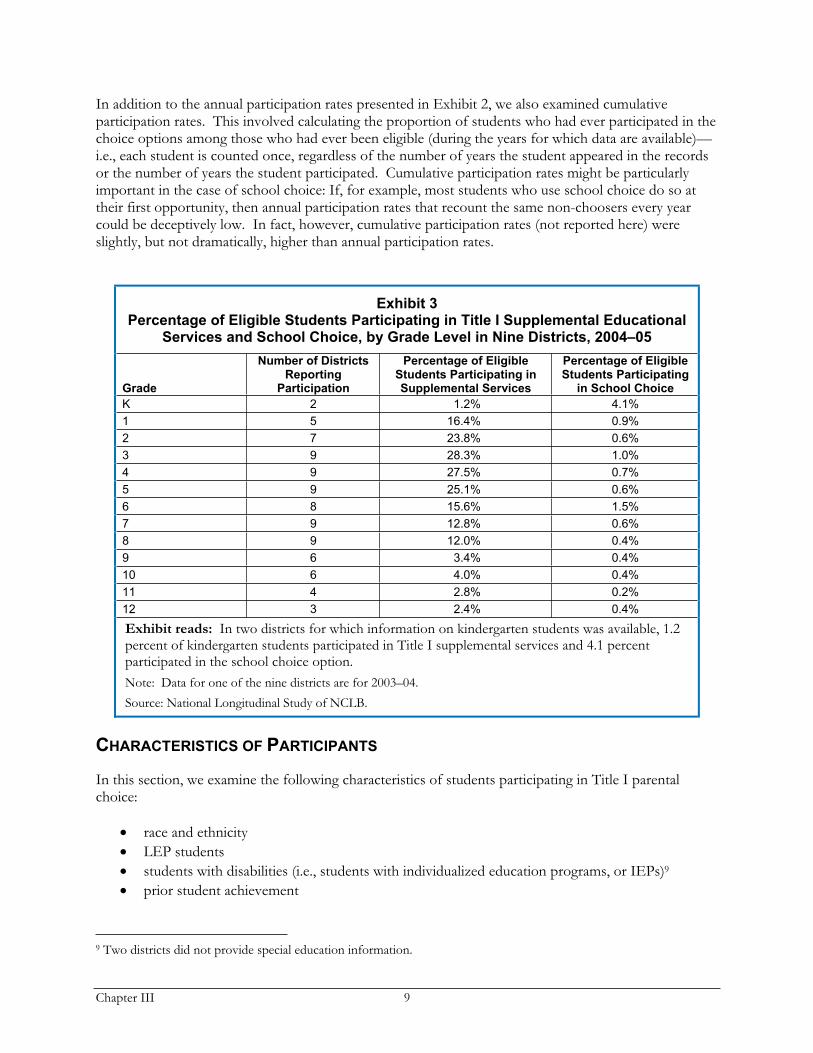
The participation rates reported in Exhibit 2 should be viewed as approximate. Most of the districts provided eligibility and participation information only for students in tested grades. If the missing grades had higher or lower participation rates, then the overall participation rates would be affected. (See Exhibit 3 for the number of districts that provided student information per grade.) For school choice, the absence of data on kindergarten students for most of the districts may cause a slight downward bias in our estimates, because students may be more likely to use a school choice option when they are starting in a new school. The opposite appears to be true for supplemental services, as kindergarten students are participating at lower rates (in districts with available data). Across districts, average participation rates were notably lower in middle school grades than in elementary grades, and were lower still in high school (see Exhibit 3).
Chapter III 9
In addition to the annual participation rates presented in Exhibit 2, we also examined cumulative participation rates. This involved calculating the proportion of students who had ever participated in the choice options among those who had ever been eligible (during the years for which data are available)—i.e., each student is counted once, regardless of the number of years the student appeared in the records or the number of years the student participated. Cumulative participation rates might be particularly important in the case of school choice: If, for example, most students who use school choice do so at their first opportunity, then annual participation rates that recount the same non-choosers every year could be deceptively low. In fact, however, cumulative participation rates (not reported here) were slightly, but not dramatically, higher than annual participation rates.
Exhibit 3Percentage of Eligible Students Participating in Title I Supplemental Educational
Services and School Choice, by Grade Level in Nine Districts, 2004–05
Grade
Number of Districts Reporting
Participation
Percentage of Eligible Students Participating in Supplemental Services
Percentage of Eligible Students Participating
in School Choice
K 2 1.2% 4.1%
1 5 16.4% 0.9%
2 7 23.8% 0.6%
3 9 28.3% 1.0%
4 9 27.5% 0.7%
5 9 25.1% 0.6%
6 8 15.6% 1.5%
7 9 12.8% 0.6%
8 9 12.0% 0.4%
9 6 3.4% 0.4%
10 6 4.0% 0.4%
11 4 2.8% 0.2%
12 3 2.4% 0.4%
Exhibit reads: In two districts for which information on kindergarten students was available, 1.2 percent of kindergarten students participated in Title I supplemental services and 4.1 percent participated in the school choice option. Note: Data for one of the nine districts are for 2003–04. Source: National Longitudinal Study of NCLB.
CHARACTERISTICS OF PARTICIPANTS
In this section, we examine the following characteristics of students participating in Title I parental choice:
race and ethnicity LEP students students with disabilities (i.e., students with individualized education programs, or IEPs)9
prior student achievement
9 Two districts did not provide special education information.
Chapter III 10
For the comparisons, the analysis is restricted to the 2004–05 school year (except in one district, where data are from 2003–04).10
Of particular interest is whether disadvantaged students and students with low levels of prior achievement were taking advantage of the Tile I choice options. This is an important question, given that these disadvantaged students are the primary focus of NCLB.
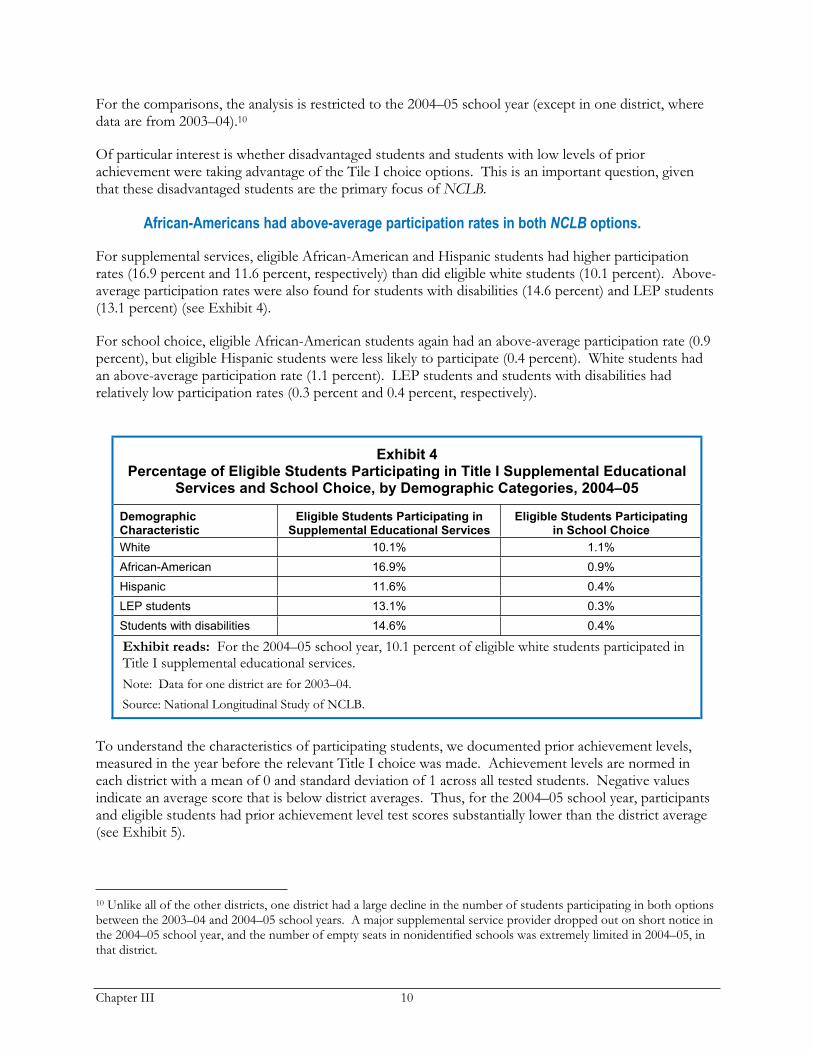
African-Americans had above-average participation rates in both NCLB options.
For supplemental services, eligible African-American and Hispanic students had higher participation rates (16.9 percent and 11.6 percent, respectively) than did eligible white students (10.1 percent). Above-average participation rates were also found for students with disabilities (14.6 percent) and LEP students (13.1 percent) (see Exhibit 4).
For school choice, eligible African-American students again had an above-average participation rate (0.9 percent), but eligible Hispanic students were less likely to participate (0.4 percent). White students had an above-average participation rate (1.1 percent). LEP students and students with disabilities had relatively low participation rates (0.3 percent and 0.4 percent, respectively).
Exhibit 4 Percentage of Eligible Students Participating in Title I Supplemental Educational
Services and School Choice, by Demographic Categories, 2004–05
Demographic Characteristic
Eligible Students Participating in Supplemental Educational Services
Eligible Students Participating in School Choice
White 10.1% 1.1%
African-American 16.9% 0.9%
Hispanic 11.6% 0.4%
LEP students 13.1% 0.3%
Students with disabilities 14.6% 0.4%
Exhibit reads: For the 2004–05 school year, 10.1 percent of eligible white students participated in Title I supplemental educational services. Note: Data for one district are for 2003–04. Source: National Longitudinal Study of NCLB.
To understand the characteristics of participating students, we documented prior achievement levels, measured in the year before the relevant Title I choice was made. Achievement levels are normed in each district with a mean of 0 and standard deviation of 1 across all tested students. Negative values indicate an average score that is below district averages. Thus, for the 2004–05 school year, participants and eligible students had prior achievement level test scores substantially lower than the district average (see Exhibit 5).
10 Unlike all of the other districts, one district had a large decline in the number of students participating in both options between the 2003–04 and 2004–05 school years. A major supplemental service provider dropped out on short notice in the 2004–05 school year, and the number of empty seats in nonidentified schools was extremely limited in 2004–05, in that district.
Chapter III 11
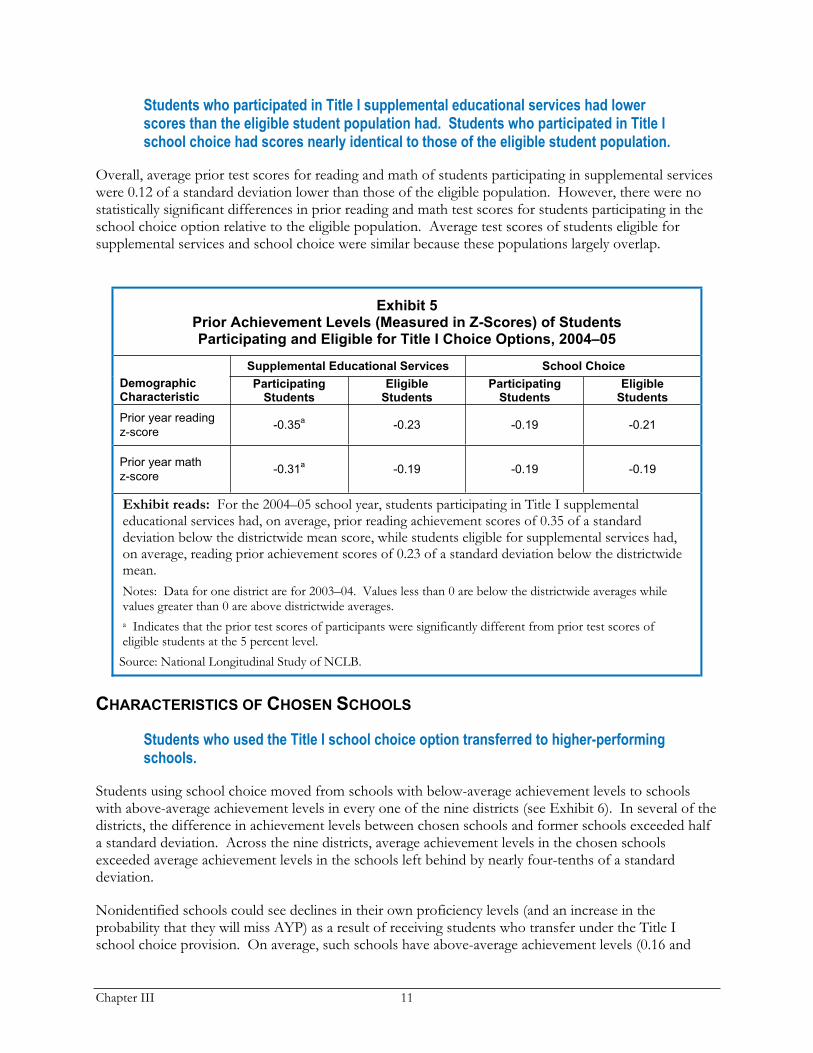
Students who participated in Title I supplemental educational services had lower scores than the eligible student population had. Students who participated in Title I school choice had scores nearly identical to those of the eligible student population.
Overall, average prior test scores for reading and math of students participating in supplemental services were 0.12 of a standard deviation lower than those of the eligible population. However, there were no statistically significant differences in prior reading and math test scores for students participating in the school choice option relative to the eligible population. Average test scores of students eligible for supplemental services and school choice were similar because these populations largely overlap.
Exhibit 5Prior Achievement Levels (Measured in Z-Scores) of Students Participating and Eligible for Title I Choice Options, 2004–05
Supplemental Educational Services School Choice
Demographic Characteristic
ParticipatingStudents
Eligible Students
ParticipatingStudents
Eligible Students
Prior year reading
z-score-0.35
a -0.23 -0.19 -0.21
Prior year math
z-score-0.31
a -0.19 -0.19 -0.19
Exhibit reads: For the 2004–05 school year, students participating in Title I supplemental educational services had, on average, prior reading achievement scores of 0.35 of a standard deviation below the districtwide mean score, while students eligible for supplemental services had, on average, reading prior achievement scores of 0.23 of a standard deviation below the districtwide mean.Notes: Data for one district are for 2003–04. Values less than 0 are below the districtwide averages while values greater than 0 are above districtwide averages. a Indicates that the prior test scores of participants were significantly different from prior test scores of eligible students at the 5 percent level.
Source: National Longitudinal Study of NCLB.
CHARACTERISTICS OF CHOSEN SCHOOLS
Students who used the Title I school choice option transferred to higher-performing schools.
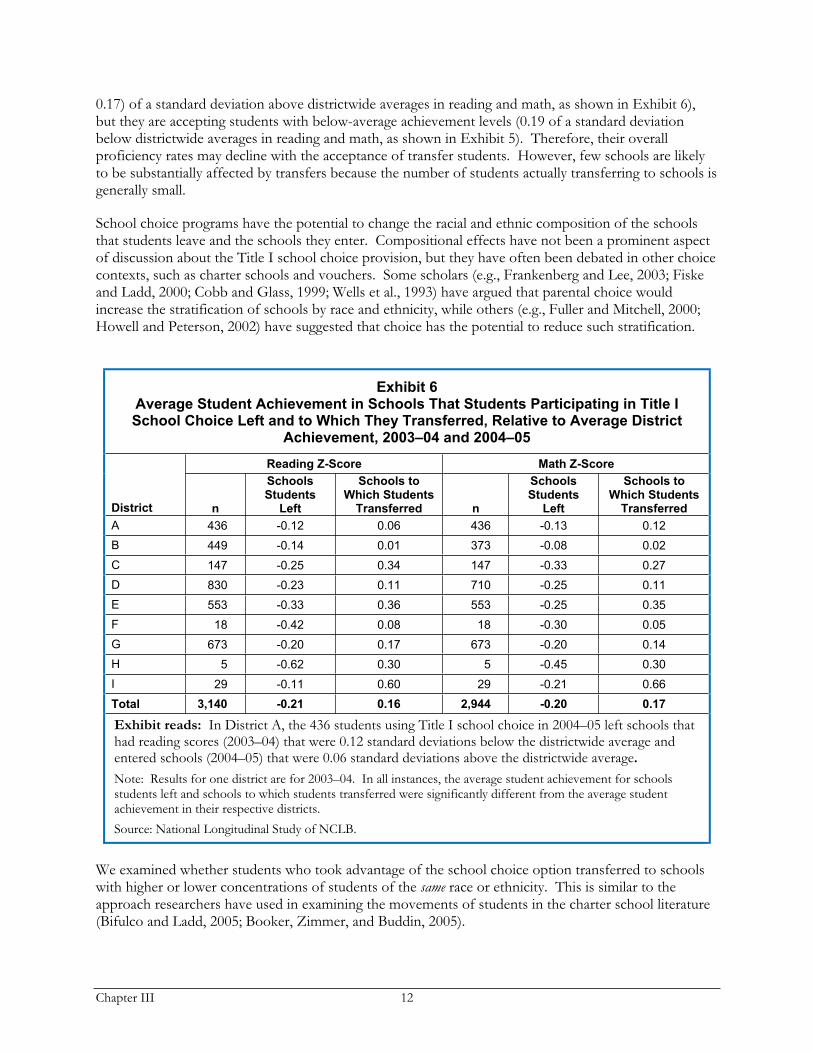
Students using school choice moved from schools with below-average achievement levels to schools with above-average achievement levels in every one of the nine districts (see Exhibit 6). In several of the districts, the difference in achievement levels between chosen schools and former schools exceeded half a standard deviation. Across the nine districts, average achievement levels in the chosen schools exceeded average achievement levels in the schools left behind by nearly four-tenths of a standard deviation.
Nonidentified schools could see declines in their own proficiency levels (and an increase in the probability that they will miss AYP) as a result of receiving students who transfer under the Title I school choice provision. On average, such schools have above-average achievement levels (0.16 and
Chapter III 12
0.17) of a standard deviation above districtwide averages in reading and math, as shown in Exhibit 6), but they are accepting students with below-average achievement levels (0.19 of a standard deviation below districtwide averages in reading and math, as shown in Exhibit 5). Therefore, their overall proficiency rates may decline with the acceptance of transfer students. However, few schools are likely to be substantially affected by transfers because the number of students actually transferring to schools is generally small.
School choice programs have the potential to change the racial and ethnic composition of the schools that students leave and the schools they enter. Compositional effects have not been a prominent aspect of discussion about the Title I school choice provision, but they have often been debated in other choice contexts, such as charter schools and vouchers. Some scholars (e.g., Frankenberg and Lee, 2003; Fiske and Ladd, 2000; Cobb and Glass, 1999; Wells et al., 1993) have argued that parental choice would increase the stratification of schools by race and ethnicity, while others (e.g., Fuller and Mitchell, 2000; Howell and Peterson, 2002) have suggested that choice has the potential to reduce such stratification.
Exhibit 6 Average Student Achievement in Schools That Students Participating in Title I School Choice Left and to Which They Transferred, Relative to Average District
Achievement, 2003–04 and 2004–05
Reading Z-Score Math Z-Score
District n
Schools Students
Left
Schools to Which Students
Transferred n
Schools Students
Left
Schools to Which Students
Transferred
A 436 -0.12 0.06 436 -0.13 0.12
B 449 -0.14 0.01 373 -0.08 0.02
C 147 -0.25 0.34 147 -0.33 0.27
D 830 -0.23 0.11 710 -0.25 0.11
E 553 -0.33 0.36 553 -0.25 0.35
F 18 -0.42 0.08 18 -0.30 0.05
G 673 -0.20 0.17 673 -0.20 0.14
H 5 -0.62 0.30 5 -0.45 0.30
I 29 -0.11 0.60 29 -0.21 0.66
Total 3,140 -0.21 0.16 2,944 -0.20 0.17
Exhibit reads: In District A, the 436 students using Title I school choice in 2004–05 left schools that had reading scores (2003–04) that were 0.12 standard deviations below the districtwide average and entered schools (2004–05) that were 0.06 standard deviations above the districtwide average.
Note: Results for one district are for 2003–04. In all instances, the average student achievement for schools students left and schools to which students transferred were significantly different from the average student achievement in their respective districts. Source: National Longitudinal Study of NCLB.
We examined whether students who took advantage of the school choice option transferred to schools with higher or lower concentrations of students of the same race or ethnicity. This is similar to the approach researchers have used in examining the movements of students in the charter school literature (Bifulco and Ladd, 2005; Booker, Zimmer, and Buddin, 2005).
Chapter III 13
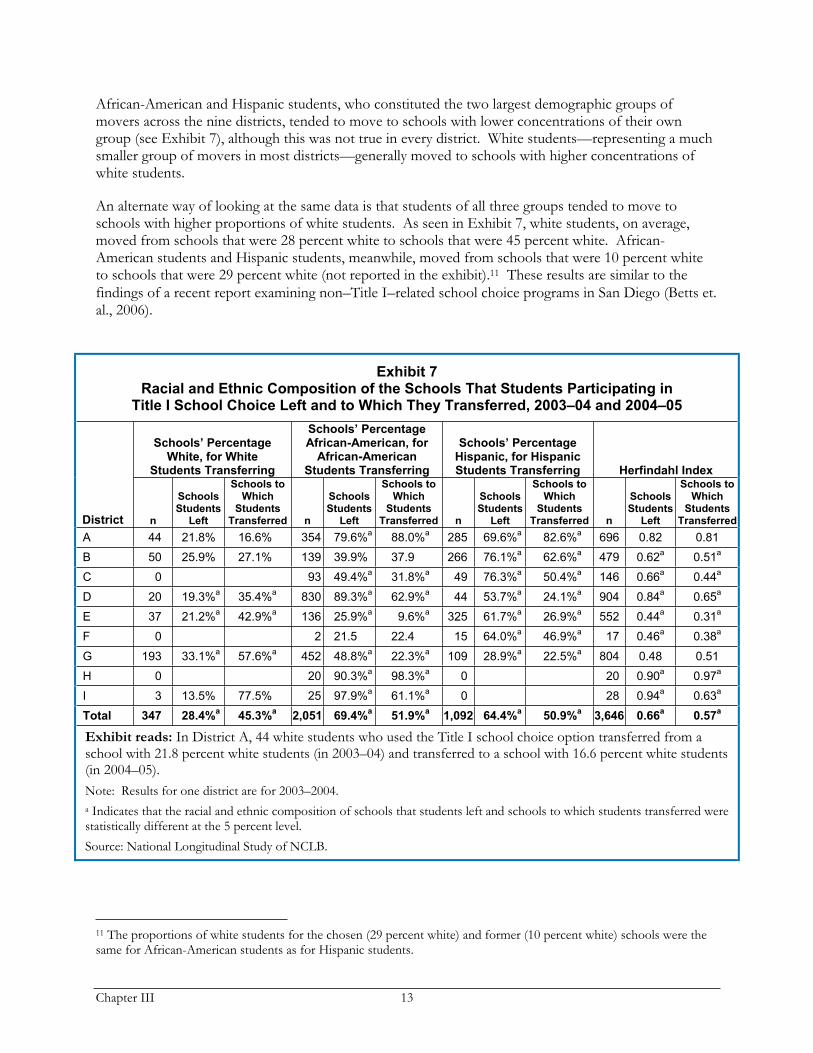
African-American and Hispanic students, who constituted the two largest demographic groups of movers across the nine districts, tended to move to schools with lower concentrations of their own group (see Exhibit 7), although this was not true in every district. White students—representing a much smaller group of movers in most districts—generally moved to schools with higher concentrations of white students.
An alternate way of looking at the same data is that students of all three groups tended to move to schools with higher proportions of white students. As seen in Exhibit 7, white students, on average, moved from schools that were 28 percent white to schools that were 45 percent white. African-American students and Hispanic students, meanwhile, moved from schools that were 10 percent white to schools that were 29 percent white (not reported in the exhibit).11 These results are similar to the findings of a recent report examining non–Title I–related school choice programs in San Diego (Betts et. al., 2006).
Exhibit 7 Racial and Ethnic Composition of the Schools That Students Participating in
Title I School Choice Left and to Which They Transferred, 2003–04 and 2004–05
Schools’ Percentage White, for White
Students Transferring
Schools’ Percentage African-American, for
African-American Students Transferring
Schools’ Percentage Hispanic, for Hispanic Students Transferring Herfindahl Index
District n
Schools Students
Left
Schools to Which
Students Transferred n
Schools Students
Left
Schools to Which
Students Transferred n
Schools Students
Left
Schools to Which
Students Transferred n
Schools Students
Left
Schools to Which
Students Transferred
A 44 21.8% 16.6% 354 79.6%a
88.0%a 285 69.6%
a82.6%
a 696 0.82 0.81
B 50 25.9% 27.1% 139 39.9% 37.9 266 76.1%a
62.6%a 479 0.62
a 0.51
a
C 0 93 49.4%a
31.8%a 49 76.3%
a50.4%
a 146 0.66
a 0.44
a
D 20 19.3%a 35.4%
a 830 89.3%
a62.9%
a 44 53.7%
a24.1%
a 904 0.84
a 0.65
a
E 37 21.2%a 42.9%
a 136 25.9%
a9.6%
a 325 61.7%
a26.9%
a 552 0.44
a 0.31
a
F 0 2 21.5 22.4 15 64.0%a
46.9%a 17 0.46
a 0.38
a
G 193 33.1%a 57.6%
a 452 48.8%
a22.3%
a 109 28.9%
a22.5%
a 804 0.48 0.51
H 0 20 90.3%a
98.3%a 0 20 0.90
a 0.97
a
I 3 13.5% 77.5% 25 97.9%a
61.1%a 0 28 0.94
a 0.63
a
Total 347 28.4%a 45.3%
a 2,051 69.4%
a51.9%
a 1,092 64.4%
a50.9%
a 3,646 0.66
a 0.57
a
Exhibit reads: In District A, 44 white students who used the Title I school choice option transferred from a school with 21.8 percent white students (in 2003–04) and transferred to a school with 16.6 percent white students (in 2004–05). Note: Results for one district are for 2003–2004. a Indicates that the racial and ethnic composition of schools that students left and schools to which students transferred were statistically different at the 5 percent level. Source: National Longitudinal Study of NCLB.
11 The proportions of white students for the chosen (29 percent white) and former (10 percent white) schools were the same for African-American students as for Hispanic students.
Chapter III 14
These results should not be viewed as evidence of parents’ preferences about the demographic composition of schools. Indeed, the results may follow almost inevitably from the fact that schools identified for improvement serve a disproportionate number of nonwhite students (see Stullich et al., forthcoming). Students moving from identified schools to non-identified schools are therefore likely to be moving to schools with higher proportions of white students.
Students who used the Title I school choice option transferred to schools with greater racial balance.
Finally, we examined the racial balance of schools from which and to which students transferred. Transferring students tended to go to schools with greater racial balance than the school they left as shown by comparing Herfindahl indexes between schools students left and schools to which they transferred.12 A Herfindahl index value of 0 indicates that a school is evenly distributed across all races and ethnicities and a value of 1 indicates that a school is completely concentrated in one race or ethnicity. Across the nine districts, on average, students moved to schools with a Herfindahl index of 0.66 to schools with a Herfindahl index of 0.57, which is a 14-percent reduction in the index (see Exhibit 7). Overall, students generally transferred to schools that were somewhat more diverse than the schools they left.
12 The Herfindahl index is typically used by economists as a measure of market concentration to detect monopoly power. Researchers have also used the Herfindahl index in the educational context to measure competition and racial concentration (Booker, Zimmer, and Buddin, 2005; Zanzig, 1997; Borland and Howsen, 1996; Hoxby, 1994).
Chapter IV 15
IV. IMPACT OF TITLE I PARENTAL CHOICE OPTIONS ON STUDENT ACHIEVEMENT
EVALUATION APPROACH
The aim of the choice provisions of NCLB is to give parents educational options that will raise their child’s level of student achievement (specifically, their academic proficiency as measured by state assessments). To estimate the effect of the two Title I choice options on achievement, the counterfactual must be estimated—how students exposed to NCLB options would have performed in the absence of those options. Estimating an appropriate counterfactual is challenging, because participating students may be different from nonparticipating students in unobservable ways. Indeed, the mere fact that they have taken advantage of an option suggests that differences are likely. A conventional regression model that examines achievement results for participants crosssectionally, with controls for demographic variables, may produce biased estimates of program effects. It cannot be assumed that if the choices were not available, students using the choice provisions would have had the same outcomes as those of students who did not choose.
The ideal way to control for unobserved differences between treatment and control groups is a randomized experiment with assignment to treatment or control by lottery. Random assignment through a lottery ensures that the treatment and control groups are similar in every way except in the use of the treatment itself (in this case, Title I–related school choice or supplemental services). Randomized experimental designs have been used to analyze the effects of other school choice programs, including vouchers (Peterson et al., 2003; Howell et al., 2002) and charter schools (Hoxby and Rockoff, 2004).
In the context of NCLB, however, a randomized experiment may be difficult to achieve. Under the statute, the two Title I choice options must be made available to all eligible students, unless there are not sufficient resources to serve all eligible students. Only in districts in which the choice options were oversubscribed would it be possible to randomly assign students, and there may be few districts in which this condition applies. For this study, none of the nine school districts in our sample randomly assigned students to either of the Title I choice options.
In the absence of an experimental option, the best alternatives are quasi-experimental designs. These include regression discontinuity (Cook and Campbell, 1979) and longitudinal difference-in-differences approaches (Wooldridge, 2002). Regression discontinuity compares the outcomes of treatment and non-treatment groups for which assignment is based on an exogenously and consistently applied cutoff point from a continuous distribution. In theory, the Title I choice provisions could be evaluated using a regression discontinuity approach in a district in which budget constraints require limiting access to the provisions based on a clearly defined cut point measured by previous achievement test results (a policy permitted by the statute). In practice, however, low participation rates have meant that budget constraints have not forced most districts to limit access to the choice provisions. To our knowledge, none of the districts in our study limited access based on achievement levels.
Fortunately, however, it is possible to implement a quasi-experimental difference-in-differences approach to analyze the achievement effects of the two options in all nine districts in our sample; indeed, the districts were selected in part because they have data available permitting such an approach. Researchers often use a difference-in-differences approach to control for selection bias (Wooldridge, 2002), and it has been used specifically in school choice studies of charter schools (Bifulco and Ladd,
Chapter IV 16
2006; Sass, 2006; Zimmer and Buddin, 2006; Hanushek et al., 2005; Booker et al., 2007; Zimmer et al., 2003).
The difference-in-differences approach uses within-subject pre-post comparisons and comparisons between participating and nonparticipating students. In essence, this approach examines differences in achievement trajectories for (nonequivalent) treatment and comparison groups, over a period extending before and after treatment (i.e., before and after students transfer to a new school or enroll in supplemental services). In econometric terms, this is referred to as a student fixed-effect approach.
ANALYTIC DETAILS
As previously indicated, outcome indicators for the achievement analyses are rank-based math and reading z-scores for individual students followed longitudinally over time. The longitudinal nature of the data allows the use of a student fixed effect to control for any time-invariant characteristics of the student, such as family status and ability. The fixed-effect model is implicitly a “value-added” model that aims to assess the contribution of the chosen educational program (i.e., the benefit of the new school or supplemental service).
The formal model for our analysis is specified in Equation 1.13 To examine achievement effects, we used achievement gains (Ajt – Ajt-1) as the outcome measure to guard against difference in achievement trajectories prior to “treatment.” Using gains allows the analysis to compare the student’s achievement gains while participating in the option with his or her achievement gains prior to participation in the option (school choice or supplemental services). Examining gains accounts for the possibility that students with similar baseline achievement scores would have different underlying achievement trajectories.
jtgtjjtjtjtjt EligNCLBAA1
(1)
where
Ajt – Ajt-1 is a measure of the achievement gain of the jth student in the tth year NCLBjt is an indicator whether student j is participating in the NCLB option (separate models are run for the supplemental services and school choice option), in the tth year Eligjt is an indicator of whether the student j is eligible or not in the tth year
j captures individual student fixed effects gt captures grade-by-year fixed effects, and is the random disturbance term.
This regression specification shows the relationship between student achievement and participating in either the supplemental services or the school choice option.14 For the school choice option, a student is considered to be participating in the program not only for the year after the student transfers into a new school, but also for any year after the student transfers, as long as the student remains in the new school.
13 The analysis incorporates the clustering of student achievement results within schools, thereby ensuring the estimation of robust standard errors. 14 In a few districts, we also had information on the subjects in which students received supplemental services and in additional analyses, we estimated the effects for students receiving services in math only, in reading only, or in both. The vast majority of students who received supplemental services received services in both math and reading, and as a result, the sample sizes of students participating in math only and reading only were relatively small, which reduced our ability to detect significant effects and minimized the usefulness of these subject-specific analyses.
Chapter IV 17
Participation in supplemental services, by contrast, is coded separately for each year (where some students may participate for multiple years).
Because our analyses use fixed-effect models, all student characteristics that remain constant over time (while implicitly controlled for) are differenced out. As a result, demographic characteristics, such as race and ethnicity, drop out of the models. The basic model estimates coefficients for year-and-grade parameters and the NCLB-related provisions plus a control for whether the student was eligible. For simplicity, only the treatment coefficients are presented in Exhibits 9 through 17.
Number of students contributing to each district’s estimate
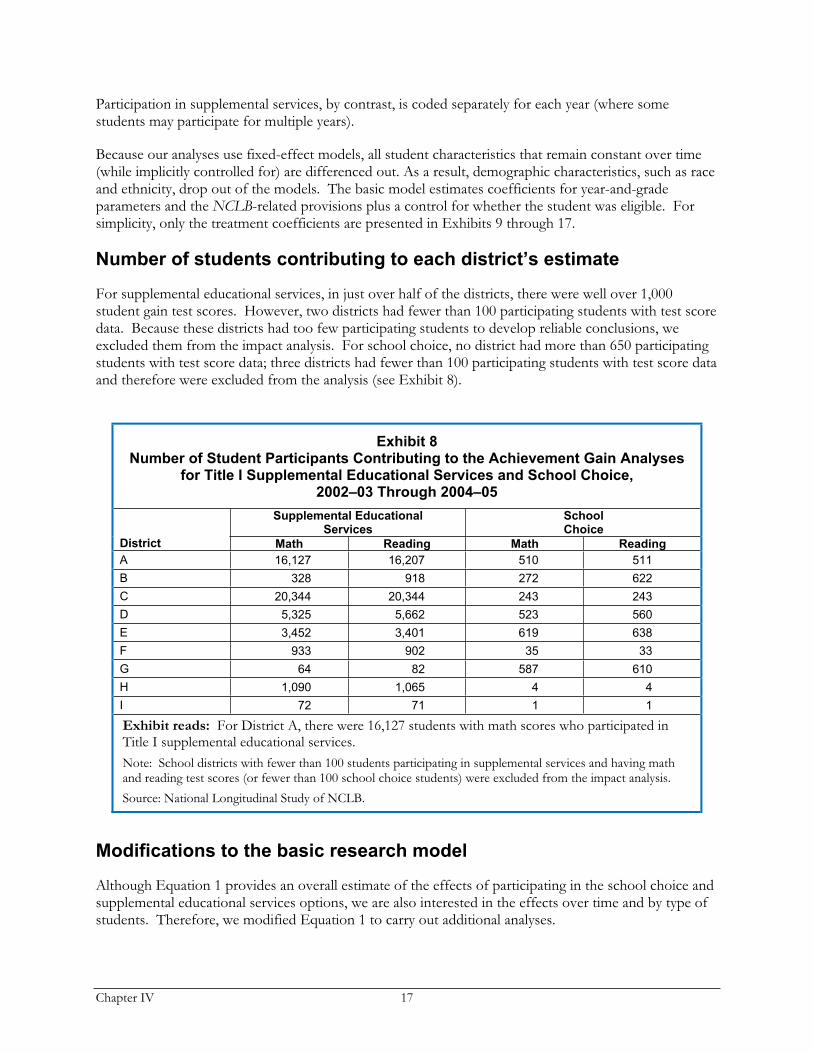
For supplemental educational services, in just over half of the districts, there were well over 1,000 student gain test scores. However, two districts had fewer than 100 participating students with test score data. Because these districts had too few participating students to develop reliable conclusions, we excluded them from the impact analysis. For school choice, no district had more than 650 participating students with test score data; three districts had fewer than 100 participating students with test score data and therefore were excluded from the analysis (see Exhibit 8).
Exhibit 8 Number of Student Participants Contributing to the Achievement Gain Analyses
for Title I Supplemental Educational Services and School Choice,2002–03 Through 2004–05
Supplemental Educational Services
School Choice
District Math Reading Math Reading
A 16,127 16,207 510 511
B 328 918 272 622
C 20,344 20,344 243 243
D 5,325 5,662 523 560
E 3,452 3,401 619 638
F 933 902 35 33
G 64 82 587 610
H 1,090 1,065 4 4
I 72 71 1 1
Exhibit reads: For District A, there were 16,127 students with math scores who participated in Title I supplemental educational services. Note: School districts with fewer than 100 students participating in supplemental services and having math and reading test scores (or fewer than 100 school choice students) were excluded from the impact analysis. Source: National Longitudinal Study of NCLB.
Modifications to the basic research model
Although Equation 1 provides an overall estimate of the effects of participating in the school choice and supplemental educational services options, we are also interested in the effects over time and by type of students. Therefore, we modified Equation 1 to carry out additional analyses.
Chapter IV 18
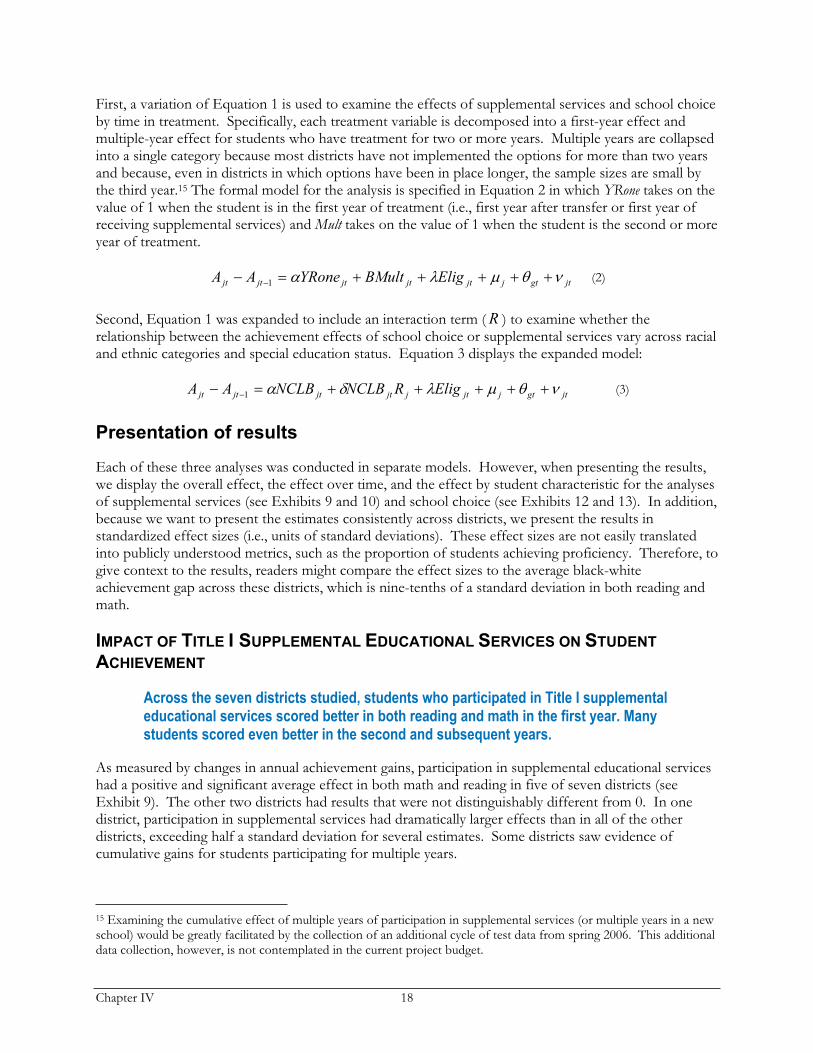
First, a variation of Equation 1 is used to examine the effects of supplemental services and school choice by time in treatment. Specifically, each treatment variable is decomposed into a first-year effect and multiple-year effect for students who have treatment for two or more years. Multiple years are collapsed into a single category because most districts have not implemented the options for more than two years and because, even in districts in which options have been in place longer, the sample sizes are small by the third year.15 The formal model for the analysis is specified in Equation 2 in which YRone takes on the value of 1 when the student is in the first year of treatment (i.e., first year after transfer or first year of receiving supplemental services) and Mult takes on the value of 1 when the student is the second or more year of treatment.
jtgtjjtjtjtjtjt EligBMultYRoneAA1
(2)
Second, Equation 1 was expanded to include an interaction term (R ) to examine whether the relationship between the achievement effects of school choice or supplemental services vary across racial and ethnic categories and special education status. Equation 3 displays the expanded model:
jtgtjjtjjtjtjtjt EligRNCLBNCLBAA1
(3)
Presentation of results
Each of these three analyses was conducted in separate models. However, when presenting the results, we display the overall effect, the effect over time, and the effect by student characteristic for the analyses of supplemental services (see Exhibits 9 and 10) and school choice (see Exhibits 12 and 13). In addition, because we want to present the estimates consistently across districts, we present the results in standardized effect sizes (i.e., units of standard deviations). These effect sizes are not easily translated into publicly understood metrics, such as the proportion of students achieving proficiency. Therefore, to give context to the results, readers might compare the effect sizes to the average black-white achievement gap across these districts, which is nine-tenths of a standard deviation in both reading and math.
IMPACT OF TITLE I SUPPLEMENTAL EDUCATIONAL SERVICES ON STUDENT
ACHIEVEMENT
Across the seven districts studied, students who participated in Title I supplemental educational services scored better in both reading and math in the first year. Many students scored even better in the second and subsequent years.
As measured by changes in annual achievement gains, participation in supplemental educational services had a positive and significant average effect in both math and reading in five of seven districts (see Exhibit 9). The other two districts had results that were not distinguishably different from 0. In one district, participation in supplemental services had dramatically larger effects than in all of the other districts, exceeding half a standard deviation for several estimates. Some districts saw evidence of cumulative gains for students participating for multiple years.
15 Examining the cumulative effect of multiple years of participation in supplemental services (or multiple years in a new school) would be greatly facilitated by the collection of an additional cycle of test data from spring 2006. This additional data collection, however, is not contemplated in the current project budget.
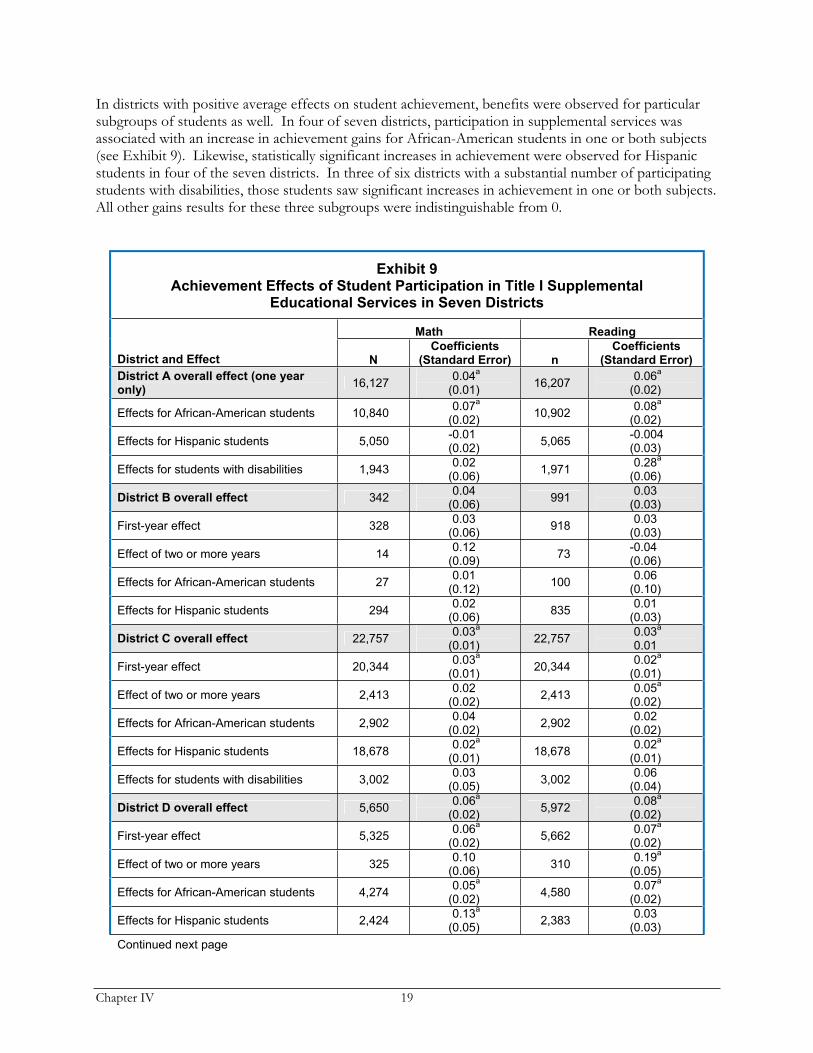
Chapter IV 19
In districts with positive average effects on student achievement, benefits were observed for particular subgroups of students as well. In four of seven districts, participation in supplemental services was associated with an increase in achievement gains for African-American students in one or both subjects (see Exhibit 9). Likewise, statistically significant increases in achievement were observed for Hispanic students in four of the seven districts. In three of six districts with a substantial number of participating students with disabilities, those students saw significant increases in achievement in one or both subjects. All other gains results for these three subgroups were indistinguishable from 0.
Exhibit 9 Achievement Effects of Student Participation in Title I Supplemental
Educational Services in Seven Districts
Math Reading
District and Effect NCoefficients
(Standard Error) n Coefficients
(Standard Error)
District A overall effect (one year only)
16,127 0.04
a
(0.01)16,207
0.06a
(0.02)
Effects for African-American students 10,840 0.07
a
(0.02)10,902
0.08a
(0.02)
Effects for Hispanic students 5,050 -0.01(0.02)
5,065-0.004(0.03)
Effects for students with disabilities 1,943 0.02
(0.06)1,971
0.28a
(0.06)
District B overall effect 3420.04
(0.06)991
0.03(0.03)
First-year effect 328 0.03
(0.06)918
0.03(0.03)
Effect of two or more years 14 0.12
(0.09)73
-0.04(0.06)
Effects for African-American students 27 0.01
(0.12)100
0.06(0.10)
Effects for Hispanic students 294 0.02
(0.06)835
0.01(0.03)
District C overall effect 22,757 0.03
a
(0.01)22,757
0.03a
0.01
First-year effect 20,344 0.03
a
(0.01)20,344
0.02a
(0.01)
Effect of two or more years 2,413 0.02
(0.02)2,413
0.05a
(0.02)
Effects for African-American students 2,902 0.04
(0.02)2,902
0.02(0.02)
Effects for Hispanic students 18,678 0.02
a
(0.01)18,678
0.02a
(0.01)
Effects for students with disabilities 3,002 0.03
(0.05)3,002
0.06(0.04)
District D overall effect 5,6500.06
a
(0.02)5,972
0.08a
(0.02)
First-year effect 5,325 0.06
a
(0.02)5,662
0.07a
(0.02)
Effect of two or more years 325 0.10
(0.06)310
0.19a
(0.05)
Effects for African-American students 4,274 0.05
a
(0.02)4,580
0.07a
(0.02)
Effects for Hispanic students 2,424 0.13
a
(0.05)2,383
0.03(0.03)
Continued next page
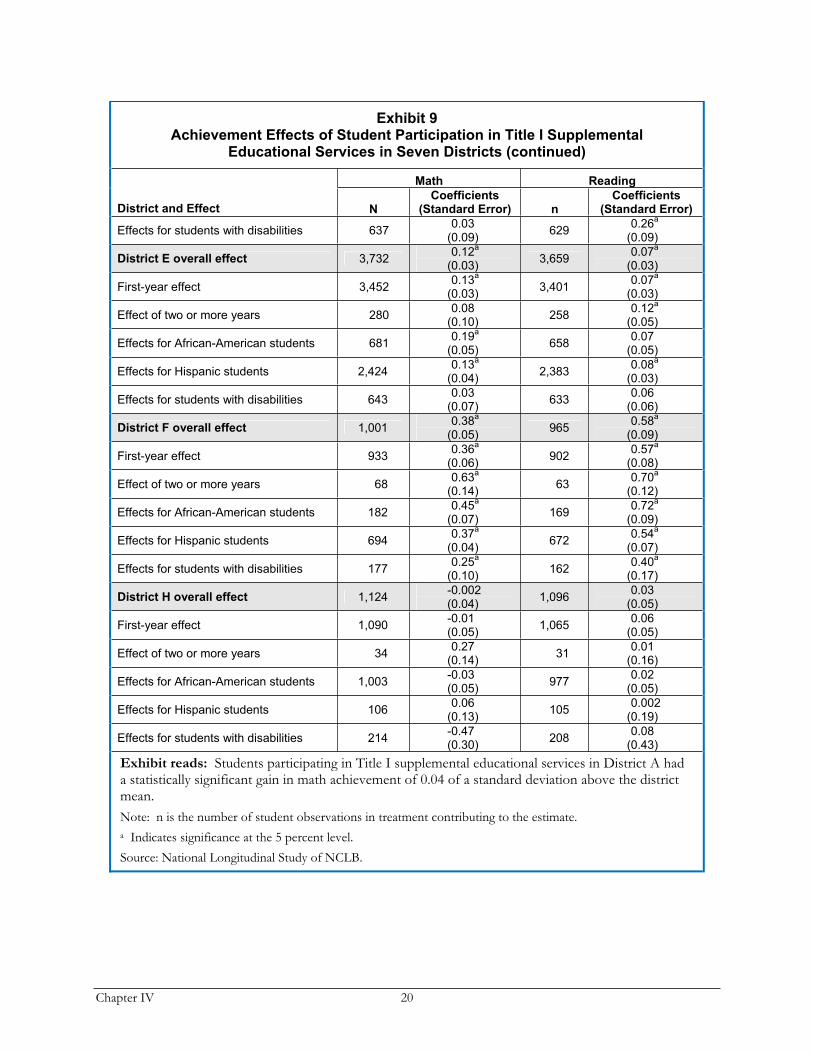
Chapter IV 20
Exhibit 9 Achievement Effects of Student Participation in Title I Supplemental
Educational Services in Seven Districts (continued)
Math Reading
District and Effect NCoefficients
(Standard Error) nCoefficients
(Standard Error)
Effects for students with disabilities 637 0.03
(0.09)629
0.26a
(0.09)
District E overall effect 3,7320.12
a
(0.03)3,659
0.07a
(0.03)
First-year effect 3,452 0.13
a
(0.03)3,401
0.07a
(0.03)
Effect of two or more years 280 0.08
(0.10)258
0.12a
(0.05)
Effects for African-American students 681 0.19
a
(0.05)658
0.07(0.05)
Effects for Hispanic students 2,424 0.13
a
(0.04)2,383
0.08a
(0.03)
Effects for students with disabilities 643 0.03
(0.07)633
0.06(0.06)
District F overall effect 1,0010.38
a
(0.05)965
0.58a
(0.09)
First-year effect 933 0.36
a
(0.06)902
0.57a
(0.08)
Effect of two or more years 68 0.63
a
(0.14)63
0.70a
(0.12)
Effects for African-American students 182 0.45
a
(0.07)169
0.72a
(0.09)
Effects for Hispanic students 694 0.37
a
(0.04)672
0.54a
(0.07)
Effects for students with disabilities 177 0.25
a
(0.10)162
0.40a
(0.17)
District H overall effect 1,124-0.002(0.04)
1,0960.03
(0.05)
First-year effect 1,090 -0.01(0.05)
1,0650.06
(0.05)
Effect of two or more years 34 0.27
(0.14)31
0.01(0.16)
Effects for African-American students 1,003 -0.03(0.05)
9770.02
(0.05)
Effects for Hispanic students 106 0.06
(0.13)105
0.002(0.19)
Effects for students with disabilities 214 -0.47(0.30)
2080.08
(0.43)
Exhibit reads: Students participating in Title I supplemental educational services in District A had a statistically significant gain in math achievement of 0.04 of a standard deviation above the district mean.Note: n is the number of student observations in treatment contributing to the estimate. a Indicates significance at the 5 percent level. Source: National Longitudinal Study of NCLB.
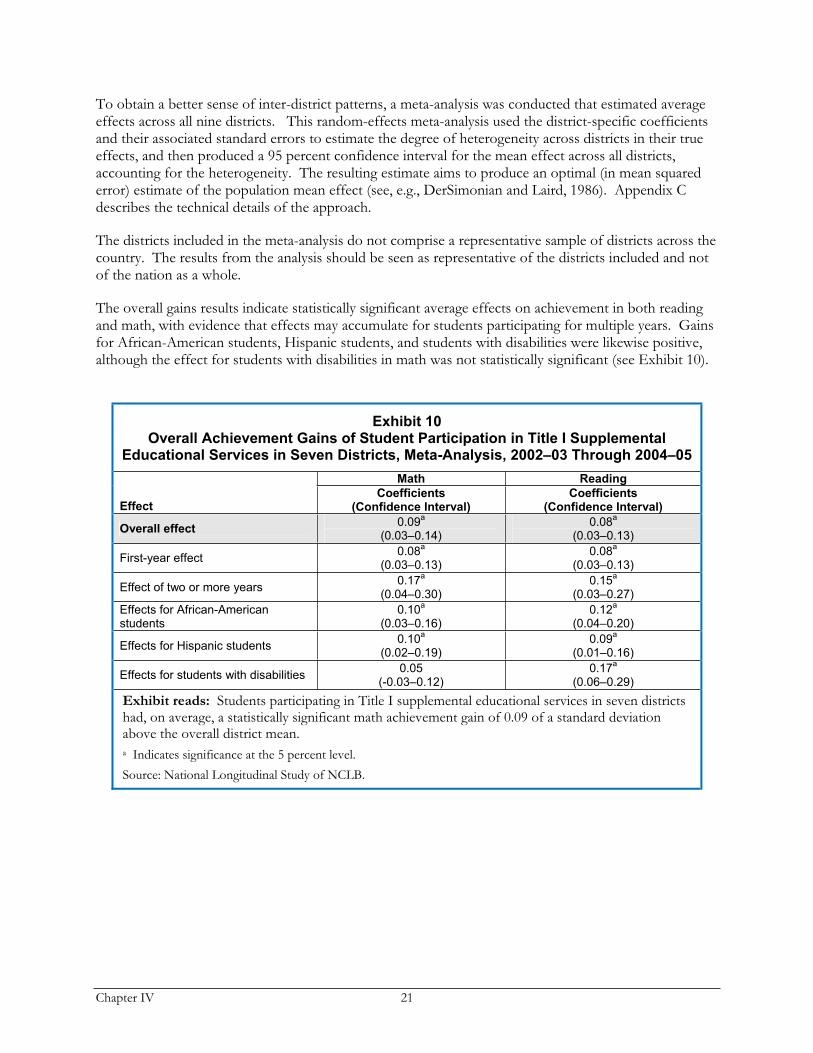
Chapter IV 21
To obtain a better sense of inter-district patterns, a meta-analysis was conducted that estimated average effects across all nine districts. This random-effects meta-analysis used the district-specific coefficients and their associated standard errors to estimate the degree of heterogeneity across districts in their true effects, and then produced a 95 percent confidence interval for the mean effect across all districts, accounting for the heterogeneity. The resulting estimate aims to produce an optimal (in mean squared error) estimate of the population mean effect (see, e.g., DerSimonian and Laird, 1986). Appendix C describes the technical details of the approach.
The districts included in the meta-analysis do not comprise a representative sample of districts across the country. The results from the analysis should be seen as representative of the districts included and not of the nation as a whole.
The overall gains results indicate statistically significant average effects on achievement in both reading and math, with evidence that effects may accumulate for students participating for multiple years. Gains for African-American students, Hispanic students, and students with disabilities were likewise positive, although the effect for students with disabilities in math was not statistically significant (see Exhibit 10).
Exhibit 10 Overall Achievement Gains of Student Participation in Title I Supplemental
Educational Services in Seven Districts, Meta-Analysis, 2002–03 Through 2004–05
Math Reading
EffectCoefficients
(Confidence Interval) Coefficients
(Confidence Interval)
Overall effect 0.09
a
(0.03–0.14) 0.08
a
(0.03–0.13)
First-year effect 0.08
a
(0.03–0.13) 0.08
a
(0.03–0.13)
Effect of two or more years 0.17
a
(0.04–0.30) 0.15
a
(0.03–0.27)
Effects for African-American students
0.10a
(0.03–0.16) 0.12
a
(0.04–0.20)
Effects for Hispanic students 0.10
a
(0.02–0.19) 0.09
a
(0.01–0.16)
Effects for students with disabilities 0.05
(-0.03–0.12) 0.17
a
(0.06–0.29)
Exhibit reads: Students participating in Title I supplemental educational services in seven districts had, on average, a statistically significant math achievement gain of 0.09 of a standard deviation above the overall district mean. a Indicates significance at the 5 percent level. Source: National Longitudinal Study of NCLB.
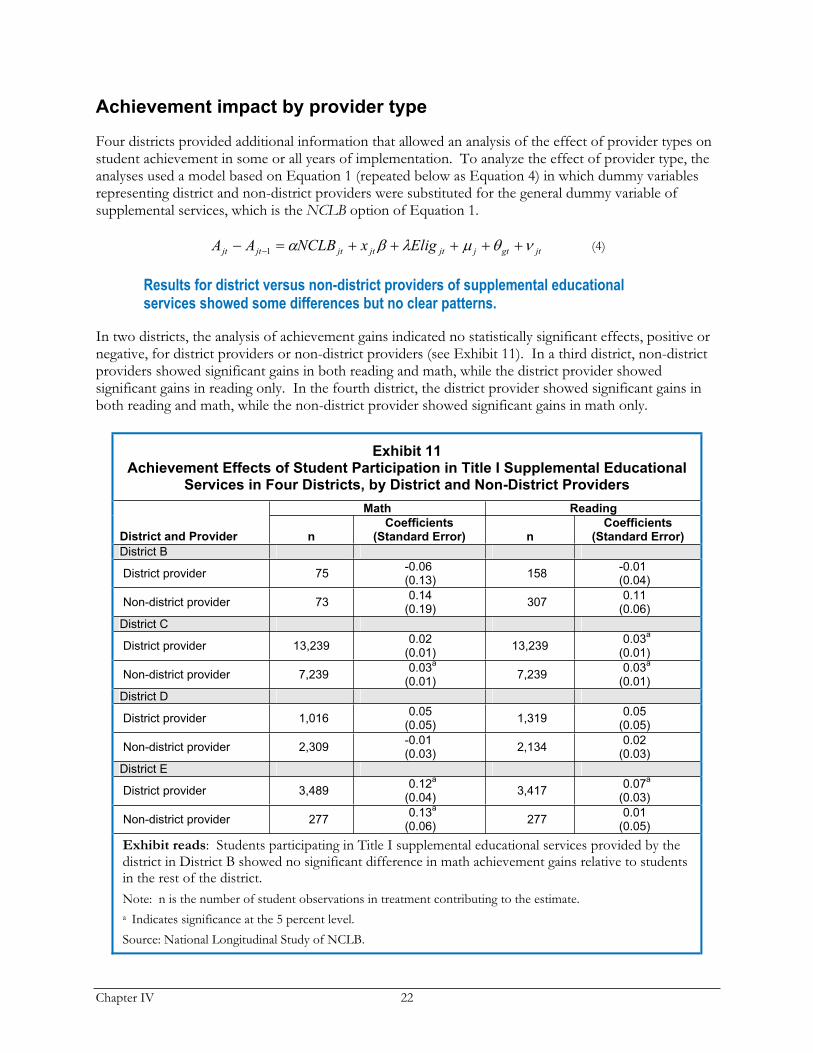
Chapter IV 22
Achievement impact by provider type
Four districts provided additional information that allowed an analysis of the effect of provider types on student achievement in some or all years of implementation. To analyze the effect of provider type, the analyses used a model based on Equation 1 (repeated below as Equation 4) in which dummy variables representing district and non-district providers were substituted for the general dummy variable of supplemental services, which is the NCLB option of Equation 1.
jtgtjjtjtjtjtjt EligxNCLBAA1
(4)
Results for district versus non-district providers of supplemental educational services showed some differences but no clear patterns.
In two districts, the analysis of achievement gains indicated no statistically significant effects, positive or negative, for district providers or non-district providers (see Exhibit 11). In a third district, non-district providers showed significant gains in both reading and math, while the district provider showed significant gains in reading only. In the fourth district, the district provider showed significant gains in both reading and math, while the non-district provider showed significant gains in math only.
Exhibit 11 Achievement Effects of Student Participation in Title I Supplemental Educational
Services in Four Districts, by District and Non-District Providers
Math Reading
District and Provider nCoefficients
(Standard Error) n Coefficients
(Standard Error)
District B
District provider 75 -0.06(0.13)
158-0.01(0.04)
Non-district provider 73 0.14
(0.19)307
0.11(0.06)
District C
District provider 13,239 0.02
(0.01)13,239
0.03a
(0.01)
Non-district provider 7,239 0.03
a
(0.01)7,239
0.03a
(0.01)
District D
District provider 1,016 0.05
(0.05)1,319
0.05(0.05)
Non-district provider 2,309 -0.01(0.03)
2,1340.02
(0.03)
District E
District provider 3,489 0.12
a
(0.04)3,417
0.07a
(0.03)
Non-district provider 277 0.13
a
(0.06)277
0.01(0.05)
Exhibit reads: Students participating in Title I supplemental educational services provided by the district in District B showed no significant difference in math achievement gains relative to students in the rest of the district. Note: n is the number of student observations in treatment contributing to the estimate. a Indicates significance at the 5 percent level. Source: National Longitudinal Study of NCLB.
Chapter IV 23
IMPACT OF TITLE I SCHOOL CHOICE ON STUDENT ACHIEVEMENT
Although few studies of the achievement effects of Title I school choice have been conducted,16 the effects of other school choice programs have been extensively examined. Researchers have assessed the achievement impacts of voucher programs that allow students to attend private schools; public charter schools that operate autonomously and independently of conventional school districts; and intradistrict choice programs, including magnet schools. Because the NCLB options are restricted to public schools, we discuss here only studies of public-school choice programs.
A handful of studies have used longitudinal data with quasi-experimental or experimental designs to control for selection bias to examine the achievement effects of charter schools. In Arizona, Solmon et al. (2001) found that students in Arizona charter schools outperformed conventional public school students. Three other studies found mixed results in Texas. Gronberg and Jansen (2001) found that charter schools that focus on at-risk students provided slightly more additional value than did conventional public schools while non–at-risk charters provided slightly less additional value than conventional schools did. Hanushek, Kain, and Rivkin (2002) found negative achievement effects for Texas charter schools that were in their first few years of operation, and neither positive nor negative effects in the long run. In a more recent study, Booker et al. (2005) found positive charter effects in Texas. Sass (2006) found that Florida charter schools initially had lower performance than conventional public schools had, but eventually produced similar achievement gains in math and somewhat higher achievement gains in reading over time. Bifulco and Ladd (2006) found negative effects for charter schools in North Carolina but likewise show that charter school performance improves over time.17
Using a randomized design, Hoxby and Rockoff (2004) found positive effects for Chicago charter schools. Finally, Zimmer et al. (2003) found no effects, positive or negative, for students attending charter schools in California.
For more general public school choice programs, such as magnet programs and open enrollment, even fewer studies using quasi-experimental or experimental designs have been conducted. Ballou, Goldring, and Liu (2006) found no significant effect from attending magnet schools in an anonymous, Southern, midsized city. Cullen, Jacobs, and Levitt (2003) found little benefit of the open enrollment policies for high schools in Chicago. Betts et al. (2006) examined magnet and open enrollment programs in San Diego and generally found no significant effect from participation in these programs.
As the review of the research suggests, studies of public-school choice in other contexts have not led to consistent findings about the effect of school choice on student achievement.
As previously discussed, most of the nine districts included in the current study had far fewer students participating in school choice than in supplemental educational services. Indeed, three districts had fewer than 70 school choice participants with test data in their peak years of school choice participation, and were therefore omitted from the analyses below. Even in the six districts included in the analyses, there was limited statistical power to detect achievement effects.
16 For instance, see Nicotera et al. (2006). 17 Hoxby and Rockoff (2004) also examined four charter schools in Chicago and found some evidence that charter students outperform noncharter students. Their analysis capitalized on the fact that these schools are oversubscribed and use a lottery mechanism to admit students. Presumably, the lottery winners and losers are similar in every way except admission into these schools. Tracking performance of both sets of students then creates an unbiased perspective of performance. However, Hoxby and Rockoff’s study has a major drawback in that it may have limited implications for those schools that do not have wait lists. In fact, one would expect schools with wait lists to be the best schools, and it would be surprising if they had the same results as other charter schools.
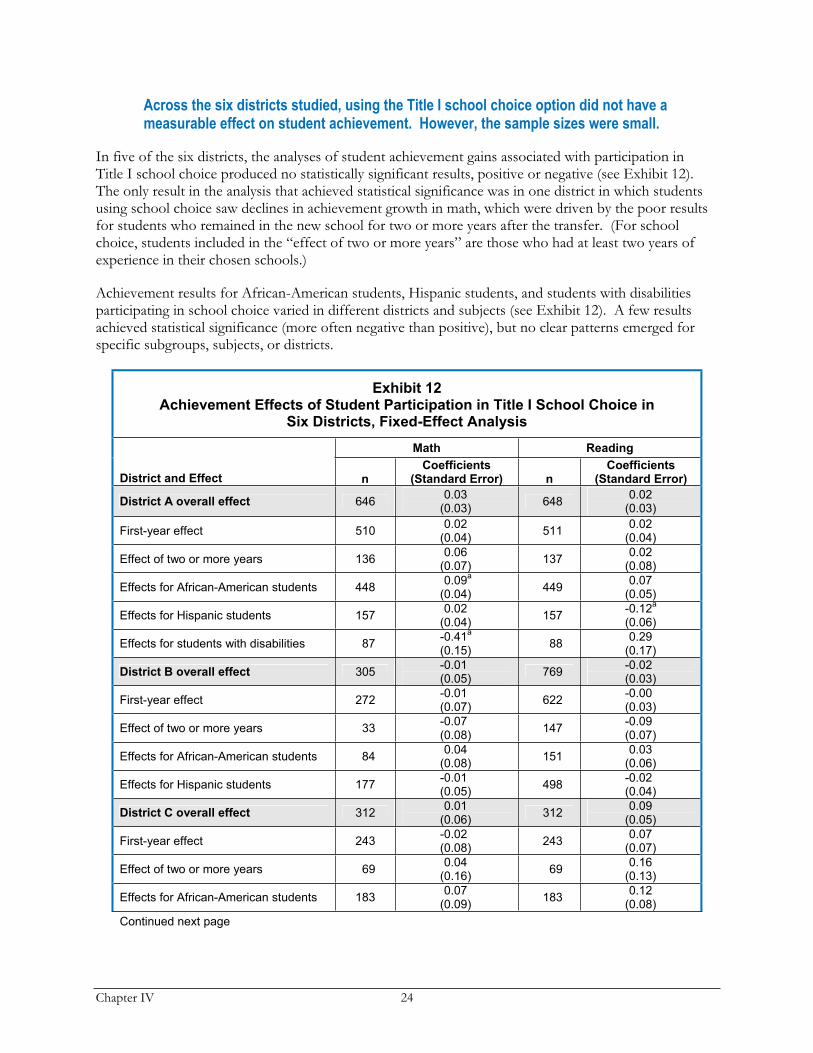
Chapter IV 24
Across the six districts studied, using the Title I school choice option did not have a measurable effect on student achievement. However, the sample sizes were small.
In five of the six districts, the analyses of student achievement gains associated with participation in Title I school choice produced no statistically significant results, positive or negative (see Exhibit 12). The only result in the analysis that achieved statistical significance was in one district in which students using school choice saw declines in achievement growth in math, which were driven by the poor results for students who remained in the new school for two or more years after the transfer. (For school choice, students included in the “effect of two or more years” are those who had at least two years of experience in their chosen schools.)
Achievement results for African-American students, Hispanic students, and students with disabilities participating in school choice varied in different districts and subjects (see Exhibit 12). A few results achieved statistical significance (more often negative than positive), but no clear patterns emerged for specific subgroups, subjects, or districts.
Exhibit 12 Achievement Effects of Student Participation in Title I School Choice in
Six Districts, Fixed-Effect Analysis
Math Reading
District and Effect nCoefficients
(Standard Error) nCoefficients
(Standard Error)
District A overall effect 6460.03
(0.03)648
0.02(0.03)
First-year effect 510 0.02
(0.04)511
0.02(0.04)
Effect of two or more years 136 0.06
(0.07)137
0.02(0.08)
Effects for African-American students 448 0.09
a
(0.04)449
0.07(0.05)
Effects for Hispanic students 157 0.02
(0.04)157
-0.12a
(0.06)
Effects for students with disabilities 87 -0.41
a
(0.15)88
0.29(0.17)
District B overall effect 305-0.01(0.05)
769-0.02(0.03)
First-year effect 272 -0.01(0.07)
622-0.00(0.03)
Effect of two or more years 33 -0.07(0.08)
147-0.09(0.07)
Effects for African-American students 84 0.04
(0.08)151
0.03(0.06)
Effects for Hispanic students 177 -0.01(0.05)
498-0.02(0.04)
District C overall effect 3120.01
(0.06)312
0.09(0.05)
First-year effect 243 -0.02(0.08)
2430.07
(0.07)
Effect of two or more years 69 0.04
(0.16)69
0.16(0.13)
Effects for African-American students 183 0.07
(0.09)183
0.12(0.08)
Continued next page
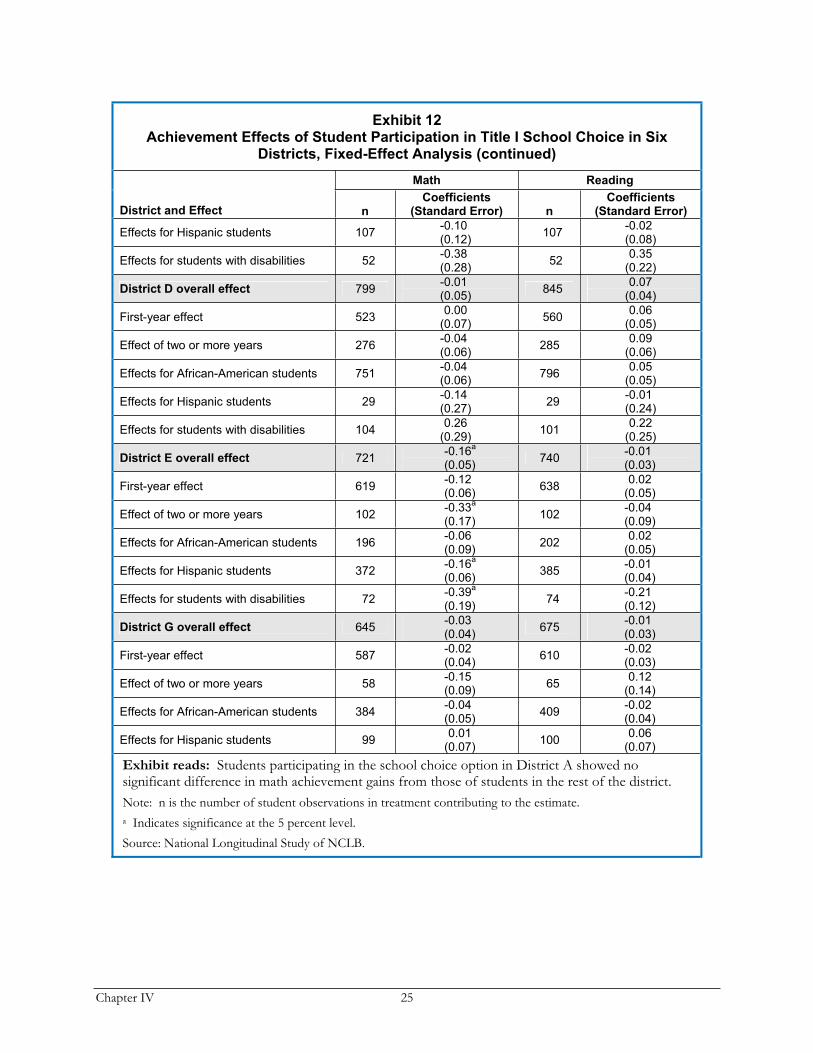
Chapter IV 25
Exhibit 12 Achievement Effects of Student Participation in Title I School Choice in Six
Districts, Fixed-Effect Analysis (continued)
Math Reading
District and Effect nCoefficients
(Standard Error) nCoefficients
(Standard Error)
Effects for Hispanic students 107 -0.10(0.12)
107-0.02(0.08)
Effects for students with disabilities 52 -0.38(0.28)
520.35
(0.22)
District D overall effect 799-0.01(0.05)
8450.07
(0.04)
First-year effect 523 0.00
(0.07)560
0.06(0.05)
Effect of two or more years 276 -0.04(0.06)
2850.09
(0.06)
Effects for African-American students 751 -0.04(0.06)
7960.05
(0.05)
Effects for Hispanic students 29 -0.14(0.27)
29-0.01(0.24)
Effects for students with disabilities 104 0.26
(0.29)101
0.22(0.25)
District E overall effect 721-0.16
a
(0.05)740
-0.01(0.03)
First-year effect 619 -0.12(0.06)
6380.02
(0.05)
Effect of two or more years 102 -0.33
a
(0.17)102
-0.04(0.09)
Effects for African-American students 196 -0.06(0.09)
2020.02
(0.05)
Effects for Hispanic students 372 -0.16
a
(0.06)385
-0.01(0.04)
Effects for students with disabilities 72 -0.39
a
(0.19)74
-0.21(0.12)
District G overall effect 645-0.03(0.04)
675-0.01(0.03)
First-year effect 587 -0.02(0.04)
610-0.02(0.03)
Effect of two or more years 58 -0.15(0.09)
650.12
(0.14)
Effects for African-American students 384 -0.04(0.05)
409-0.02(0.04)
Effects for Hispanic students 99 0.01
(0.07)100
0.06(0.07)
Exhibit reads: Students participating in the school choice option in District A showed no significant difference in math achievement gains from those of students in the rest of the district. Note: n is the number of student observations in treatment contributing to the estimate. a Indicates significance at the 5 percent level. Source: National Longitudinal Study of NCLB.
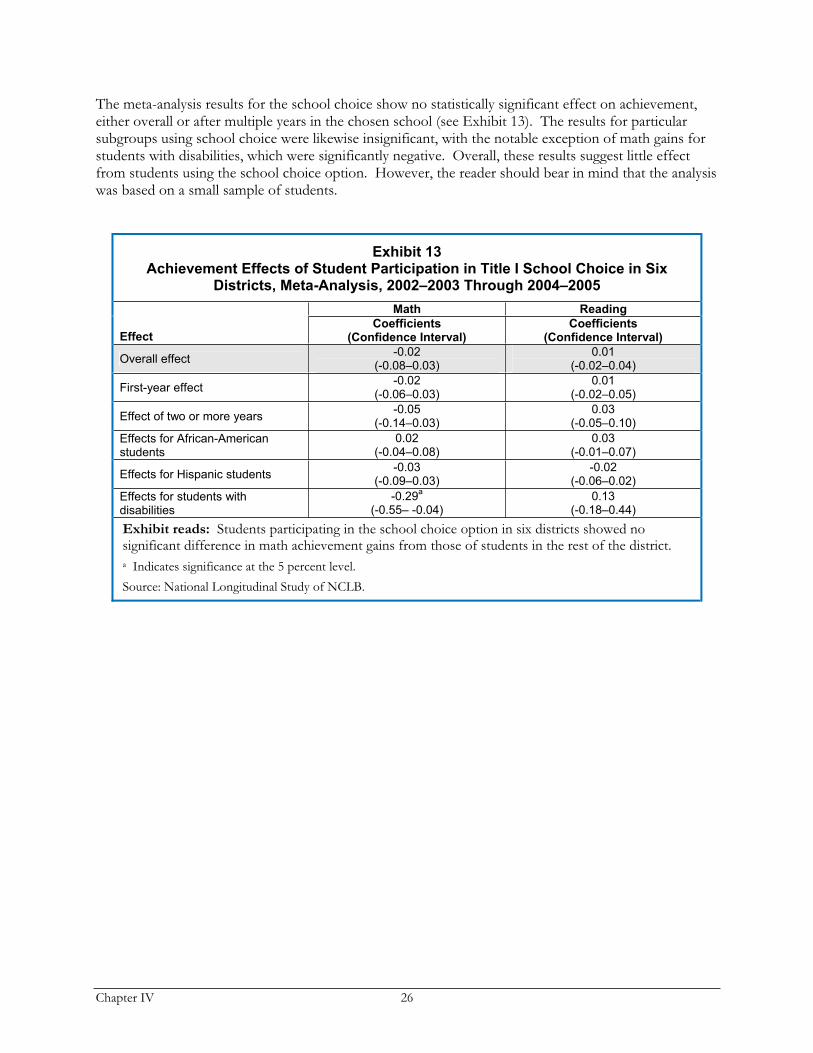
Chapter IV 26
The meta-analysis results for the school choice show no statistically significant effect on achievement, either overall or after multiple years in the chosen school (see Exhibit 13). The results for particular subgroups using school choice were likewise insignificant, with the notable exception of math gains for students with disabilities, which were significantly negative. Overall, these results suggest little effect from students using the school choice option. However, the reader should bear in mind that the analysis was based on a small sample of students.
Exhibit 13 Achievement Effects of Student Participation in Title I School Choice in Six
Districts, Meta-Analysis, 2002–2003 Through 2004–2005
Math Reading
EffectCoefficients
(Confidence Interval) Coefficients
(Confidence Interval)
Overall effect -0.02
(-0.08–0.03) 0.01
(-0.02–0.04)
First-year effect -0.02
(-0.06–0.03) 0.01
(-0.02–0.05)
Effect of two or more years -0.05
(-0.14–0.03) 0.03
(-0.05–0.10)
Effects for African-American students
0.02(-0.04–0.08)
0.03(-0.01–0.07)
Effects for Hispanic students -0.03
(-0.09–0.03) -0.02
(-0.06–0.02)
Effects for students with disabilities
-0.29a
(-0.55– -0.04) 0.13
(-0.18–0.44)
Exhibit reads: Students participating in the school choice option in six districts showed no significant difference in math achievement gains from those of students in the rest of the district. a Indicates significance at the 5 percent level. Source: National Longitudinal Study of NCLB.
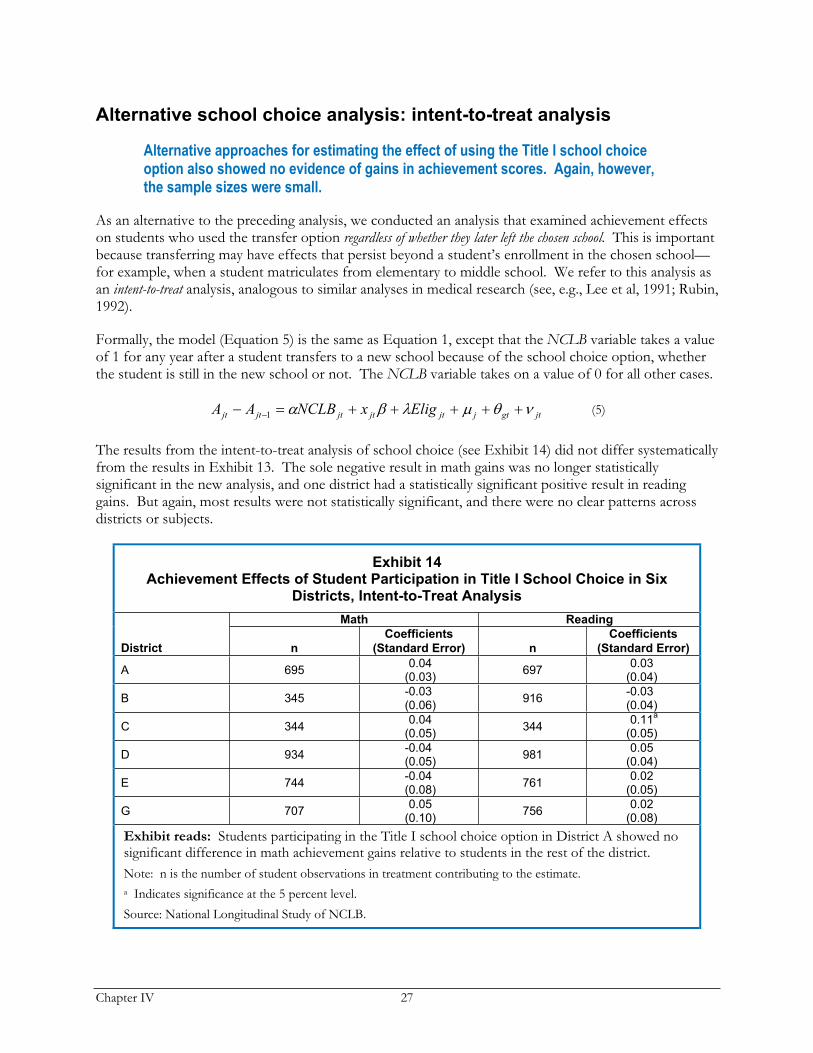
Chapter IV 27
Alternative school choice analysis: intent-to-treat analysis
Alternative approaches for estimating the effect of using the Title I school choice option also showed no evidence of gains in achievement scores. Again, however, the sample sizes were small.
As an alternative to the preceding analysis, we conducted an analysis that examined achievement effects on students who used the transfer option regardless of whether they later left the chosen school. This is important because transferring may have effects that persist beyond a student’s enrollment in the chosen school—for example, when a student matriculates from elementary to middle school. We refer to this analysis as an intent-to-treat analysis, analogous to similar analyses in medical research (see, e.g., Lee et al, 1991; Rubin, 1992).
Formally, the model (Equation 5) is the same as Equation 1, except that the NCLB variable takes a value of 1 for any year after a student transfers to a new school because of the school choice option, whether the student is still in the new school or not. The NCLB variable takes on a value of 0 for all other cases.
jtgtjjtjtjtjtjt EligxNCLBAA1
(5)
The results from the intent-to-treat analysis of school choice (see Exhibit 14) did not differ systematically from the results in Exhibit 13. The sole negative result in math gains was no longer statistically significant in the new analysis, and one district had a statistically significant positive result in reading gains. But again, most results were not statistically significant, and there were no clear patterns across districts or subjects.
Exhibit 14Achievement Effects of Student Participation in Title I School Choice in Six
Districts, Intent-to-Treat Analysis
Math Reading
District n
Coefficients
(Standard Error) n
Coefficients
(Standard Error)
A 695 0.04
(0.03)697
0.03(0.04)
B 345 -0.03(0.06)
916-0.03(0.04)
C 344 0.04
(0.05)344
0.11a
(0.05)
D 934 -0.04(0.05)
9810.05
(0.04)
E 744 -0.04(0.08)
7610.02
(0.05)
G 707 0.05
(0.10)756
0.02(0.08)
Exhibit reads: Students participating in the Title I school choice option in District A showed no significant difference in math achievement gains relative to students in the rest of the district. Note: n is the number of student observations in treatment contributing to the estimate. a Indicates significance at the 5 percent level. Source: National Longitudinal Study of NCLB.
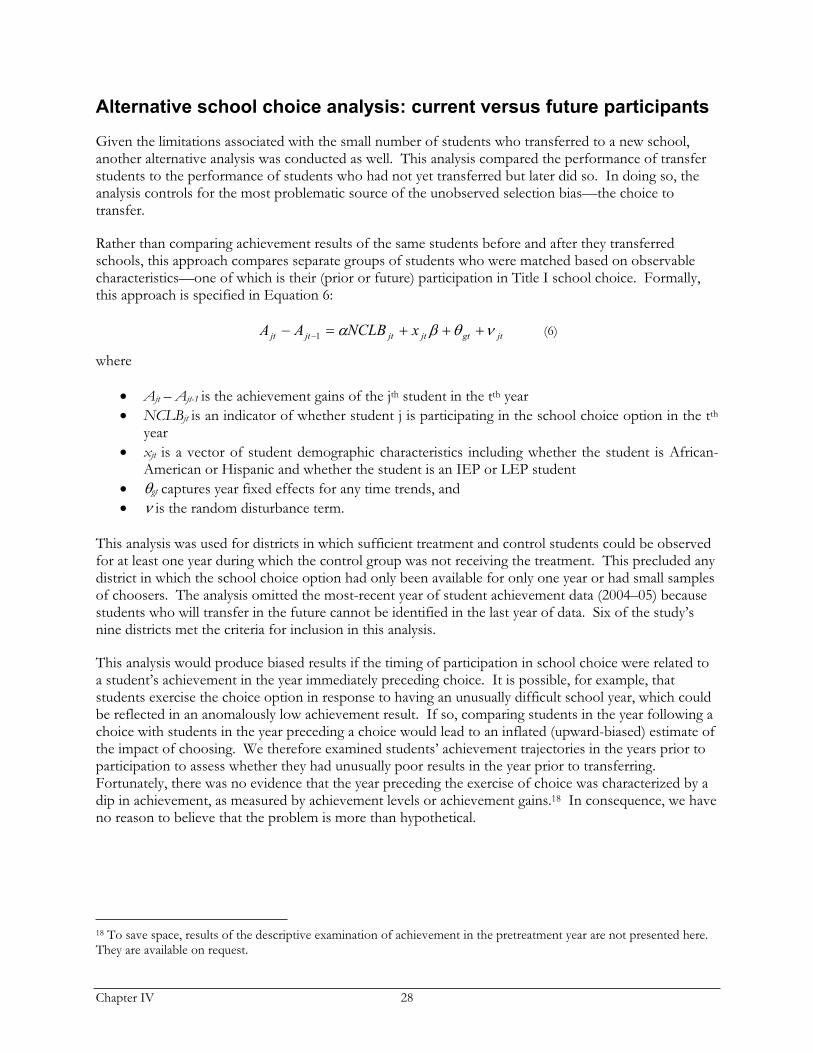
Chapter IV 28
Alternative school choice analysis: current versus future participants
Given the limitations associated with the small number of students who transferred to a new school, another alternative analysis was conducted as well. This analysis compared the performance of transfer students to the performance of students who had not yet transferred but later did so. In doing so, the analysis controls for the most problematic source of the unobserved selection bias—the choice to transfer.
Rather than comparing achievement results of the same students before and after they transferred schools, this approach compares separate groups of students who were matched based on observable characteristics—one of which is their (prior or future) participation in Title I school choice. Formally, this approach is specified in Equation 6:
jtgtjtjtjtjt xNCLBAA1
(6)
where
Ajt – Ajt-1 is the achievement gains of the jth student in the tth year NCLBjt is an indicator of whether student j is participating in the school choice option in the tth
yearxjt is a vector of student demographic characteristics including whether the student is African-American or Hispanic and whether the student is an IEP or LEP student
gt captures year fixed effects for any time trends, and is the random disturbance term.
This analysis was used for districts in which sufficient treatment and control students could be observed for at least one year during which the control group was not receiving the treatment. This precluded any district in which the school choice option had only been available for only one year or had small samples of choosers. The analysis omitted the most-recent year of student achievement data (2004–05) because students who will transfer in the future cannot be identified in the last year of data. Six of the study’s nine districts met the criteria for inclusion in this analysis.
This analysis would produce biased results if the timing of participation in school choice were related to a student’s achievement in the year immediately preceding choice. It is possible, for example, that students exercise the choice option in response to having an unusually difficult school year, which could be reflected in an anomalously low achievement result. If so, comparing students in the year following a choice with students in the year preceding a choice would lead to an inflated (upward-biased) estimate of the impact of choosing. We therefore examined students’ achievement trajectories in the years prior to participation to assess whether they had unusually poor results in the year prior to transferring. Fortunately, there was no evidence that the year preceding the exercise of choice was characterized by a dip in achievement, as measured by achievement levels or achievement gains.18 In consequence, we have no reason to believe that the problem is more than hypothetical.
18 To save space, results of the descriptive examination of achievement in the pretreatment year are not presented here. They are available on request.
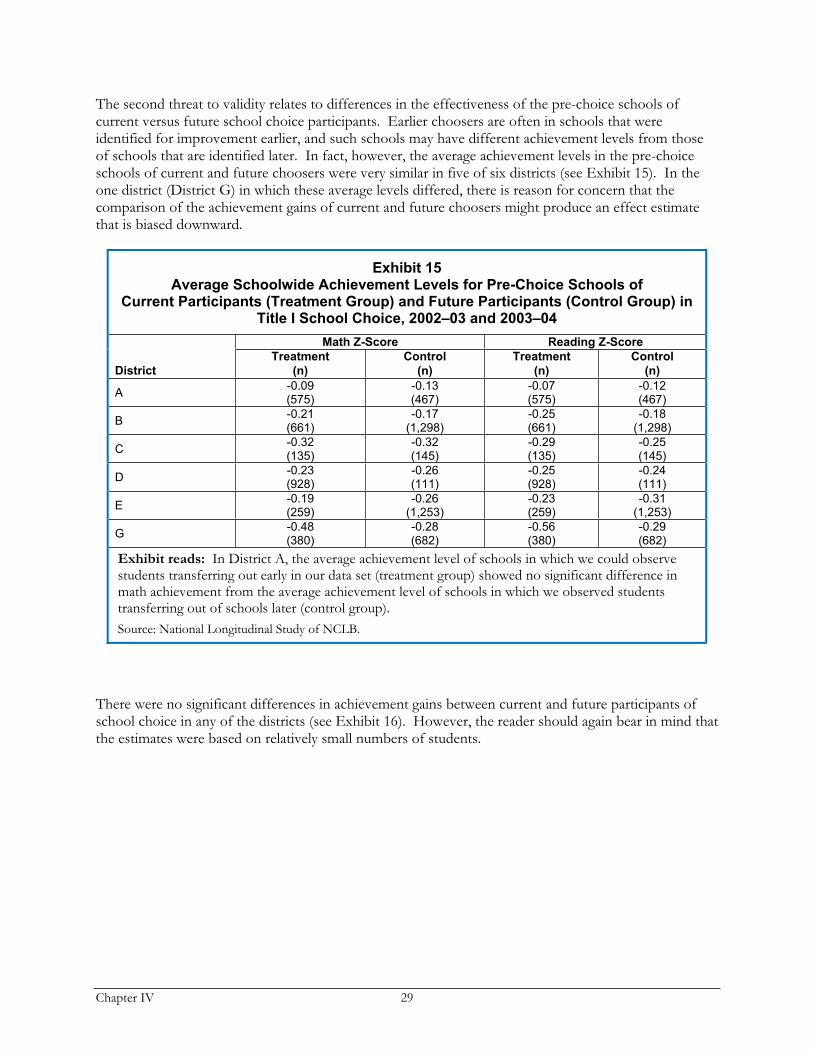
Chapter IV 29
The second threat to validity relates to differences in the effectiveness of the pre-choice schools of current versus future school choice participants. Earlier choosers are often in schools that were identified for improvement earlier, and such schools may have different achievement levels from those of schools that are identified later. In fact, however, the average achievement levels in the pre-choice schools of current and future choosers were very similar in five of six districts (see Exhibit 15). In the one district (District G) in which these average levels differed, there is reason for concern that the comparison of the achievement gains of current and future choosers might produce an effect estimate that is biased downward.
Exhibit 15Average Schoolwide Achievement Levels for Pre-Choice Schools of
Current Participants (Treatment Group) and Future Participants (Control Group) in Title I School Choice, 2002–03 and 2003–04
Math Z-Score Reading Z-Score
District
Treatment
(n)
Control
(n)
Treatment
(n)
Control
(n)
A-0.09(575)
-0.13(467)
-0.07(575)
-0.12(467)
B-0.21(661)
-0.17(1,298)
-0.25(661)
-0.18(1,298)
C-0.32(135)
-0.32(145)
-0.29(135)
-0.25(145)
D-0.23(928)
-0.26(111)
-0.25(928)
-0.24(111)
E-0.19(259)
-0.26(1,253)
-0.23(259)
-0.31(1,253)
G-0.48(380)
-0.28(682)
-0.56(380)
-0.29(682)
Exhibit reads: In District A, the average achievement level of schools in which we could observe students transferring out early in our data set (treatment group) showed no significant difference in math achievement from the average achievement level of schools in which we observed students transferring out of schools later (control group). Source: National Longitudinal Study of NCLB.
There were no significant differences in achievement gains between current and future participants of school choice in any of the districts (see Exhibit 16). However, the reader should again bear in mind that the estimates were based on relatively small numbers of students.
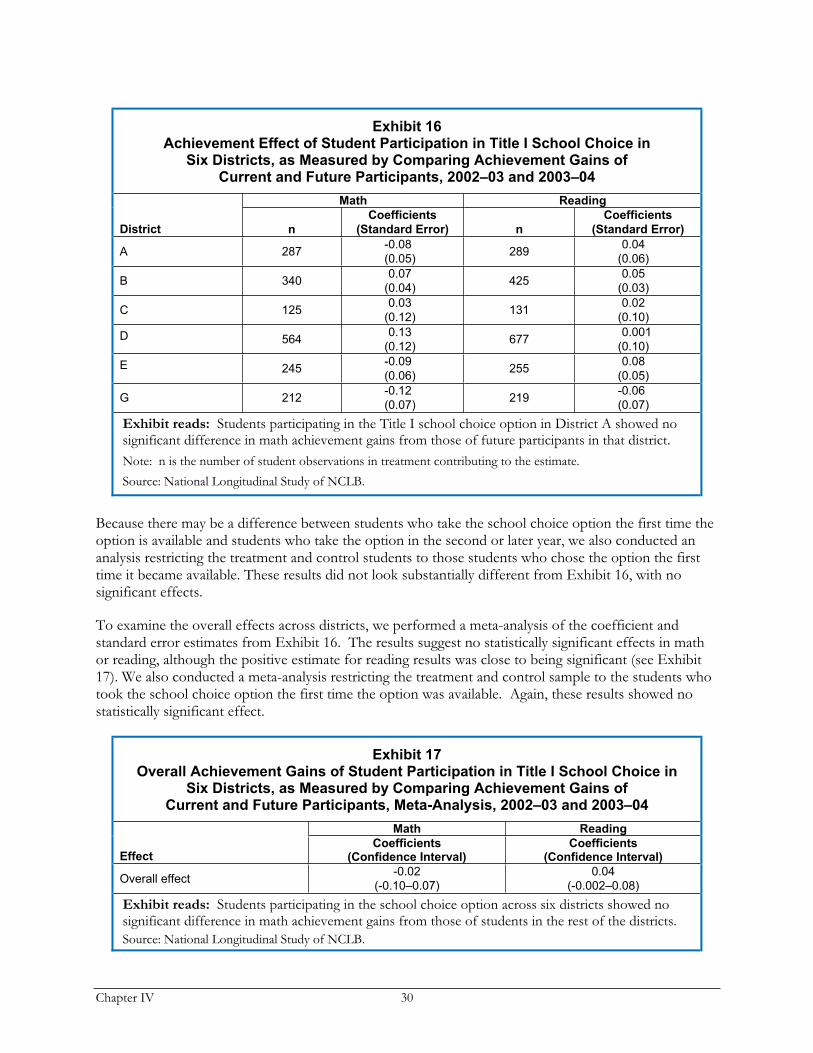
Chapter IV 30
Exhibit 16Achievement Effect of Student Participation in Title I School Choice in
Six Districts, as Measured by Comparing Achievement Gains of Current and Future Participants, 2002–03 and 2003–04
Math Reading
District n
Coefficients
(Standard Error) n
Coefficients
(Standard Error)
A 287 -0.08
(0.05)289
0.04
(0.06)
B 340 0.07
(0.04)425
0.05
(0.03)
C 125 0.03
(0.12)131
0.02
(0.10)
D 5640.13
(0.12)677
0.001
(0.10)
E 245-0.09
(0.06)255
0.08
(0.05)
G 212 -0.12
(0.07)219
-0.06
(0.07)
Exhibit reads: Students participating in the Title I school choice option in District A showed no significant difference in math achievement gains from those of future participants in that district. Note: n is the number of student observations in treatment contributing to the estimate. Source: National Longitudinal Study of NCLB.
Because there may be a difference between students who take the school choice option the first time the option is available and students who take the option in the second or later year, we also conducted an analysis restricting the treatment and control students to those students who chose the option the first time it became available. These results did not look substantially different from Exhibit 16, with no significant effects.
To examine the overall effects across districts, we performed a meta-analysis of the coefficient and standard error estimates from Exhibit 16. The results suggest no statistically significant effects in math or reading, although the positive estimate for reading results was close to being significant (see Exhibit 17). We also conducted a meta-analysis restricting the treatment and control sample to the students who took the school choice option the first time the option was available. Again, these results showed no statistically significant effect.
Exhibit 17Overall Achievement Gains of Student Participation in Title I School Choice in
Six Districts, as Measured by Comparing Achievement Gains of Current and Future Participants, Meta-Analysis, 2002–03 and 2003–04
Math Reading
EffectCoefficients
(Confidence Interval) Coefficients
(Confidence Interval)
Overall effect -0.02
(-0.10–0.07)
0.04
(-0.002–0.08)
Exhibit reads: Students participating in the school choice option across six districts showed no significant difference in math achievement gains from those of students in the rest of the districts. Source: National Longitudinal Study of NCLB.
Conclusions 31
V. CONCLUSIONS
This report examines the characteristics of students using Title I school choice and supplemental educational services, and the relationship between the use of those provisions and student achievement, in nine large, urban districts. Overall rates of participation in those nine districts were lower than national estimates. Key findings about the characteristics of choosers include the following:
Rates of participation in supplemental educational services were highest in elementary grades. In grades 2 through 5, 24 to 28 percent of eligible students participated. Participation rates were lower in middle school and lower still in high school (less than 5 percent).Similarly, participation rates for Title I school choice (although low overall) were higher for elementary grades than for upper grades. Participants in both the school choice and supplemental educational services options had, in the year before participation, lower-than-average achievement levels in their districts. For supplemental services, eligible African-American and Hispanic students had higher participation rates than did eligible white students. Above-average participation rates were also found for students with disabilities and for LEP students. However, prior-year achievement levels for participants were generally lower. For Title I school choice, eligible African-American students had an above-average participation rate, while Hispanic, LEP, and special need students had below-average participation rates. Prior-year achievement levels were about the same for both groups.
In sum, although participation rates were not high, the users of the two Title I parental options came from the disadvantaged populations that NCLB is intended to target.
A comparison of the average achievement levels of the former schools and chosen schools of school choice participants likewise suggests that, in one respect, the policy is working as intended: Choosers generally moved to schools with substantially higher levels of average achievement than the schools they left. They also generally moved to schools with higher levels of racial and ethnic integration and higher proportions of white students than the schools they left.
Key findings from our analyses of the relationship between participation in supplemental educational services and student achievement include the following:
As measured by changes in annual achievement gains, participation in supplemental educational services had a positive and significant average effect on participating students in both math and reading in five of seven districts. In districts in which positive average effects on student achievement were observed, benefits accrued for particular subgroups (African-American, Hispanic, and students with disabilities) as well.A multidistrict meta-analysis indicated statistically significant average effects in both reading and math for participants in supplemental services, with evidence that students participating for multiple years saw accumulating benefits in both subjects. Results for district versus non-district providers showed some differences but no clear patterns across districts.

Conclusions 32
Statistically significant effects were not found for participation in Title I school choice, but sample sizes for the school choice analysis were substantially smaller, suggesting that caution is warranted in interpreting our results. Finally, one area of concern suggested by the meta-analysis of school choice results relates to students with disabilities, for whom the effect estimated in math was negative and statistically significant.
Appendix A 33
REFERENCES
Ballou, D., E. Goldring, and K. Liu. Magnet Schools and Student Achievement, New York: National Center for the Study of Privatization in Education, March 2006. As of June 6, 2007: http://www.ncspe.org/publications_files/OP123.pdf.
Betts, J. R., L. A. Rice, A. C. Zau, Y. E. Tang, and C. R. Koedel. Does School Choice Work? Effects on Student Integration and Achievement, San Francisco, Calif.: Public Policy Institute of California, 2006.
Bifulco, R., and H. F. Ladd. “The Impact of Charter Schools on Student Achievement: Evidence from North Carolina,” Education Finance Policy, Vol. 1, No. 1, Winter 2006, pp. 50–90.
——— “School Choice, Racial Segregation, and Test-Score Gaps: Evidence from North Carolina’s Charter School Program,” Journal of Policy Analysis and Management,Vol. 26, No. 1, Jan. 2007, pp. 31–56.
Booker, K., S. M. Gilpatric, T. Gronberg, and D. Jansen. “The Impact of Charter School Attendance on Student Performance,” Journal of Public Economics, Vol. 91, Nos. 5–6, June 2007, pp. 849–876.
Booker, K., R. Zimmer, and R. Buddin. The Effects of Charter Schools on School Peer Composition, Santa Monica, Calif.: RAND Corporation, WR-306-EDU, 2005. As of June 6, 2007: http://www.rand.org/pubs/working_papers/WR306/.
Borland, M. V., and R. M. Howsen. “Competition, Expenditures, and Student Performance in Mathematics: A Comment on Couch et al.,” Public Choice, Vol. 87, Nos. 3–4, June 1996, pp. 395–400.
California Department of Education. “Title I Program Improvement Status Data Files,” Web page, last modified February 16, 2007. As of June 6, 2007: http://www.cde.ca.gov/ta/ac/ay/tidatafiles.asp.
Cobb, C. D., and G. V. Glass. “Ethnic Segregation in Arizona Charter Schools,” Education Policy Analysis Archives, Vol. 7, No. 1, Jan. 14, 1999. As of June 6, 2007: http://epaa.asu.edu/epaa/v7n1/.
Cook, T. D., and D. T. Campbell. “Validity,” Chapter Two, in Quasi-Experimentation: Design and Analysis Issues for Field Settings, Boston: Houghton Mifflin, 1979, pp. 37–94.
Cullen, J. B., B. A. Jacobs, and S. D. Levitt, The Effect of School Choice on Student Outcomes: Evidence from Randomized Lotteries, Cambridge, Mass.: National Bureau of Economic Research, working paper 10113, 2003. As of June 6, 2007: http://www.nber.org/papers/w10113.pdf.
DerSimonian, R., and N. Laird. “Meta-Analysis in Clinical Trials,” Controlled Clinical Trials, Vol. 7, No. 3, Sept. 1986, pp. 177–188.
Fiske, E. B., and H. F. Ladd. When Schools Compete: A Cautionary Tale, Washington, D.C.: Brookings Institution Press, 2000.
Frankenberg, E., and C. Lee. “Charter Schools and Race: A Lost Opportunity for Integrated Education,” Education Policy Analysis Archives, Vol. 11, No. 32, Sept. 5, 2003. As of June 6, 2007: http://epaa.asu.edu/epaa/v11n32/.
Appendix A 34
Fuller, H. L., and G. A. Mitchell. “The Impact of School Choice on Integration in Milwaukee Private Schools,” Current Education Issues, No. 2000-02, June 2000. As of June 6, 2007: http://www.schoolchoiceinfo.org/data/research/integ600.pdf.
Gill, B., L. S. Hamilton, J. R. Lockwood, J. A. Marsh, R. Zimmer, D. Hill, and S. Pribesh. Inspiration, Perspiration, and Time: Operations and Achievement in Edison Schools, Santa Monica, Calif.: RAND Corporation, MG-351-EDU, 2005. As of June 6, 2007: http://www.rand.org/pubs/monographs/MG351/.
Gronberg, T. J., and D. W. Jansen. Navigating Newly Chartered Waters: An Analysis of Texas Charter School Performance, San Antonio, Tex.: Texas Public Policy Foundation, 2001. As of June 6, 2007: http://www.texaspolicy.com/pdf/2001-05-17-educ-newly.pdf.
Hanushek, E. A., J. F. Kain, and S. G. Rivkin. The Impact of Charter Schools on Academic Achievement,preliminary draft, Oct. 2002, presented at National Bureau of Economic Research Education Program Meeting, Nov. 14, 2002. As of June 6, 2007: http://www.nber.org/~confer/2002/hiedf02/KAIN.pdf.
Hanushek, E. A., J. F. Kain, S. G. Rivkin, and G. F. Branch. Charter School Quality and Parental Decision Making with School Choice, Cambridge, Mass.: National Bureau of Economic Research, working paper 11252, 2005. As of June 6, 2007: http://www.nber.org/papers/W11252.
Howell, W. G., and P. E. Peterson. The Education Gap: Vouchers and Urban Schools, Washington D.C.: Brookings Institution Press, 2002.
Howell, W. G., P. J. Wolf, D. E. Campbell, and P. E. Peterson, “School Vouchers and Academic Performance: Results from Three Randomized Field Trials,” Journal of Policy Analysis and Management, Vol. 21, No. 2, Spring 2002, pp. 191–217.
Hoxby, C. M., Does Competition Among Public Schools Benefit Students and Taxpayers? Cambridge, Mass: National Bureau of Economic Research, working paper 4979, 1994.
Hoxby, C. M., and J. E. Rockoff, The Impact of Charter Schools on Student Achievement, Cambridge, Mass.: Department of Economics, Harvard University, 2004. As of June 6, 2007: http://post.economics.harvard.edu/faculty/hoxby/papers/hoxbyrockoff.pdf.
Illinois State Board of Education. “Data Analysis and Progress Reporting,” undated Web page. As of June 6, 2007: http://www.isbe.state.il.us/research/htmls/report_card.htm.
Lee, Y. J., J. H. Ellenberg, D. G. Hirtz, and K. B. Nelson. “Analysis of Clinical Trials by Treatment Actually Received: Is It Really an Option?” Statistics in Medicine, Vol. 10, No. 10, October 1991, pp. 1,595–1,605.
Nicotera, A., B. Teasley, and M. Berends. Examination of Student Movement in the Context of Federal Transfer Policies, Nashville, Tenn.: National Research and Development Center on School Choice, Competition, and Achievement, Vanderbilt University, 2006. As of June 14, 2007: http://www.vanderbilt.edu/schoolchoice/downloads/papers/nicoteraetal2006.pdf
Appendix A 35
Peterson, P. E., W. G. Howell, P. J. Wolf, and D. E. Campbell. “School Vouchers: Results from Randomized Experiments,” in Caroline Minter Hoxby, ed., The Economics of School Choice,Chicago, Ill.: University of Chicago Press, 2003, pp. 107–144.
Rubin, D. B. “Clinical Trials in Psychiatry: Should Protocol Deviation Censor Patient Data? A Comment,” Neuropsychopharmacology, Vol. 6, No. 1, 1992, pp. 59–60.
Sass, T. R. “Under Schools and Student Achievement in Florida,” Education Finance and Policy, Vol. 1, No. 1, Winter 2006, pp. 91–122.
Solmon, L. C., K. Paark, and D. Garcia. “Does Charter School Attendance Improve Test Scores? The Arizona Results,” Arizona Education Analysis, Phoenix, Ariz.: Goldwater Institute, March 16, 2001. As of June 6, 2007: http://www.goldwaterinstitute.org/AboutUs/ArticleView.aspx?id=111.
Stullich, S., E. Eisner, J. McCrary, and C. Roney. National Assessment of Title I: Interim Report, Vol. I:Implementation of Title I, Washington, D.C.: U.S. Department of Education, Institute of Education Sciences, National Center for Education Evaluation and Regional Assistance, NCEE 2006-4001R, February 2006.
Stullich, S., E. Eisner, and J. McCrary. National Assessment of Title I Report to Congress, Vol. I: Implementation of Title I, Washington, D.C.: U.S. Department of Education, Institute of Education Sciences, National Center for Education Evaluation and Regional Assistance, forthcoming.
Wells, A. S. Time to Choose: America at the Crossroads of School Choice Policy, New York: Hill and Wang, 1993.
Wooldridge, J. M. Econometric Analysis of Cross Section and Panel Data, Cambridge, Mass.: MIT Press, 2002.
Zanzig, B. R. “Measuring the Impact of Competition in Local Government Education Markets on Cognitive Achievement of Students,” Economics of Education Review, Vol. 16, No. 4, Oct. 1997, pp. 431–441.
Zimmer, R., and R. Buddin. “Charter School Performance in Two Large Urban Districts,” Journal of Urban Economics, Vol. 60, No. 2, Sept. 2006, pp. 307–326.
Zimmer, R., R. Buddin, D. Chau, G. A. Daley, B. Gill, C. M. Guarino, L. S. Hamilton, C. Krop, D. F. McCaffrey, M. Sandler, and D. J. Brewer. Charter School Operations and Performance: Evidence from California, Santa Monica, Calif.: RAND Corporation, MR-1700-EDU, 2003. As of June 6, 2007: http://www.rand.org/pubs/monograph_reports/MR1700/.

Appendix A 37
APPENDIX A.DESCRIPTION OF THE NINE-DISTRICT DATA SET
Below, we describe the district-by-district data provided to us, and the assumptions we made in creating the eligible and participation variables.
Baltimore
The Baltimore City Public Schools provided the project team with student-level demographic and test-score data for 2002–03 through 2004–05. For the 2002–03 and 2003–04 school years, the district provided test scores in grades 3, 5, and 8. For the 2004–05 school year, the district provided test scores in grades 3 through 8. Therefore, we can only track a subset of the students, which severely restricted the sample for the student achievement analysis. Also, the district provided no data on non-tested students, which restricted the sample of non-tested students we could observe for the demographic and participation rate analyses.
As part of the data set, the district indicated which students participated in the school choice and supplemental educational services options for the 2004–05 school year among those students tested. The district told us that all students attending schools identified for improvement were eligible for school choice and that all students attending schools that were in the Year 2 or beyond of improvement were eligible for supplemental services. We therefore created eligibility indicators for students using schools’ improvement status as indicated by the national school identification database created by the American Institutes for Research (AIR) for the NLS-NCLB and the SSI-NCLB.19
Chicago
The Chicago Public Schools provided the project team with student-level demographic and test score data for 2000–01 through 2004–05. For each school year, the district provided test score information in grades 3 through 8. In terms of eligibility and participation in the NCLB options, the school district provided information for transfers for the 2003–04 and 2004–05 school years and provided information for supplemental services for the 2004–05 school year only. Some students participated in supplemental services in the 2003–04 school year, but the district did not have electronic records for that year. Therefore, our analysis had to treat all students as if they did not receive supplemental services in the 2003–04 school year, even though some of them did.
The Chicago data had ambiguities related to eligibility and participation in school choice and supplemental services. The district’s records of transferring students did not indicate which students transferred under NCLB and which students transferred for other reasons. We therefore counted a student as a transfer student if the student was eligible and moved from a school that was in improvement status to a school that was not. School improvement status information came from the Illinois State Board of Education.20 Although some of these students may have transferred for other reasons, their move still reflects the policy intention.
According to district records, more than 47,000 students received supplemental services in the 2004–05 school year. But many of these students did not attend schools in Year 2 (or later) of identified for
19 Study of State Implementation of NCLB, National AYP and Identification database maintained by American Institutes for Research, Contact: James Taylor, [email protected] 20 http://www.isbe.state.il.us/research/htmls/report_card.htm.
Appendix A 38
improvement status (the schools required by NCLB to offer supplemental services). To reflect the stipulations of the law, our analysis counts as supplemental services participants only those students who participated and attended schools at which they should have been eligible.
Denver
The Denver Public Schools provided the project team with student-level demographic and test score data for 2000–01 through 2004–05.21 For reading, test scores were provided for grades 3 through 10 for each of these years. For math, in the 2000–01 school year, test scores in grades 5, 8, and 10 were provided. In the 2001–02 through 2003–04 school years, test scores were provided in grades 5 though 10. In the 2004–05 school year, test scores were provided in grades 3 through 10. We were therefore able to track the student achievement progress more completely in reading than in math. The data provided also indicate which students were eligible and which students participated in the supplemental services options. For school choice, the district provided information on which students transferred, but we had to infer from the improvement status of schools which students were eligible for the school choice option. As in Baltimore, we used school identification information available from the American Institutes for Research database.22
The Denver data also included the supplemental service provider for each student for the 2003–04 school year only. We used this information to analyze the student achievement effect of district versus non-district providers.
Long Beach
The Long Beach Unified School District provided the project team with student-level demographic and test score data for 2000–01 through 2004–05. For each school year and for both reading and math, test scores of students were provided in grades 2 through 11. However, for the 2000–01 school year, for both reading and math, only raw scores were available, while scaled scores were available in all other years. To make the outcome measures comparable over time, we converted the scores to rank-based z-scores. For school choice, the district provided information on which students transferred, but we had to infer from the improvement status of schools which students were eligible for the school choice option (for the 2002–03 and 2003–04 school years, the district provided information on school improvement status. For the 2004–05 school year, we used information from the California Department of Education.)23 For both eligibility and participation status of the supplemental services option, the district provided indicators for each school year in which the option was available.
Los Angeles
The Los Angeles Unified School District provided the project team with student-level demographic and test score data for 2000–01 through 2004–05. For each school year and for both reading and math, test scores of students were provided in grades 2 through 11. However, in the 2000–01 school year, for both reading and math, only raw scores were available while scaled scores were available in all other years. To make the outcome measures comparable over time, we converted the scores to rank-based z-scores. For
21 It should be noted that the district did not provide the special education status of students, which precluded us from analyzing the patterns of choices these students make in Denver and the effect the two NCLB-related options have on these students. 22 Study of State Implementation of NCLB, National AYP and Identification database maintained by American Institutes for Research, Contact: James Taylor, [email protected] 23 http://www.cde.ca.gov/ta/ac/ay/tidatafiles.asp.
Appendix A 39
both eligibility and participation status of the supplemental services and school choice options, the district provided indicators for each school year in which these options were available.
Palm Beach
The School District of Palm Beach County provided the project team with student-level demographic and test score data for 2000–01 through 2004–05.24 For each school year and for both reading and math, test scores of students were provided for grades 2 through 10. For both school choice and supplemental services, the district provided an indicator for each student for each year of whether the student participated in these options, but did not provide an indicator of whether a student was eligible for these options. As a result, we inferred eligibility status by using the student’s school’s identified for improvement status from AIR school identification database.25
Palm Beach also gave information for each student on the type of provider.
Philadelphia
The School District of Philadelphia provided the project team with student-level demographic and test score data for 2000–01 through 2004–05.26 During this time frame, the state accountability test (PSSA) was administered in grades 5, 8, and 11 only. To track student performance in other grades, we relied upon other district-administered tests, including the Stanford 9 and the TerraNova. The Stanford 9 was administered in grades 3, 4, 7, and 10 in the 2000–01 and 2001–02 school years. The TerraNova was administered in grades 2 through 10 in the spring of 2002–03 through 2004–05 school years. Because we had a variety of tests and to allow comparisons across grades and over time, we standardized results of these various test scores into rank-based z-scores, by year and grade.
The district also provided indicators of which students were eligible and participated for supplemental services. For the school choice option, the district provided the eligibility information, but we calculated the number of participants. Specifically, if a student was eligible for the school choice option (according to the district data) and transferred to a school not identified for improvement, then we considered the student an NCLB school choice transfer student. While some of these students may have transferred for other reasons, their transfers do reflect the intent of the policy.
Finally, the district provided information on the type of providers for both the 2003–04 and 2004–05 school years. However, for roughly two-thirds of students participating in the supplemental services option, this information is missing for the 2003–04 school year. Nevertheless, we used the information from both years to examine whether there are differentials in student achievement effects between district and non-district providers.
24 It should be noted that the district did not provide the special education status of students, which precluded us from analyzing the patterns of choices these students make in Palm Beach and the effect the two NCLB-related options have on these students. 25 Study of State Implementation of NCLB, National AYP and Identification database maintained by American Institutes for Research, Contact: James Taylor, [email protected] 26 It should be noted that the district provided free and reduced-price lunch status of students through the 2000–01 through 2002–03 school years and an alternative measure of poverty called economic disadvantage, which is not completely analogous to free and reduced-price lunch status. Therefore, we did not have a consistent measure of poverty throughout the time frame of the data.
Appendix A 40
San Diego
The San Diego Unified School District provided the project team with student-level demographic and test score data for the 2000–01 through the 2004–05 school years.27 For each school year and for both reading and math, test scores of students were provided for grades 2 through 11. For both eligibility and participation status of the supplemental services option, the district provided indicators for each school year in which the option was available. For school choice, the district provided information on which students transferred, but we had to infer from the improvement status of schools which students were eligible for the school choice option. The information on the improvement status of schools came from the district.
Finally, the district provided the name and type of supplemental service providers, which we used to examine whether there were differential achievement effects between district and non-district providers.
Washington, D.C.
The District of Columbia Public Schools provided the project team with student-level demographic and test-score data for 2000–01 through 2004–05. For the 2000–01 through 2003–04 school years, the district provided test score data in grades 1 though 11. For the 2004–05 school year, the district provided test score data in grades 3, 5, 8, and 10 only. Therefore, our analysis could track student performance for only a portion of the student population from the 2003–04 to 2004–05 school years. The data provided also indicated which students were eligible and which students participated in the school choice and supplemental services options.
Finally, the district provided information on the supplemental service provider type.
27 Because of concerns over students’ privacy, free and reduced-price lunch status was not provided.
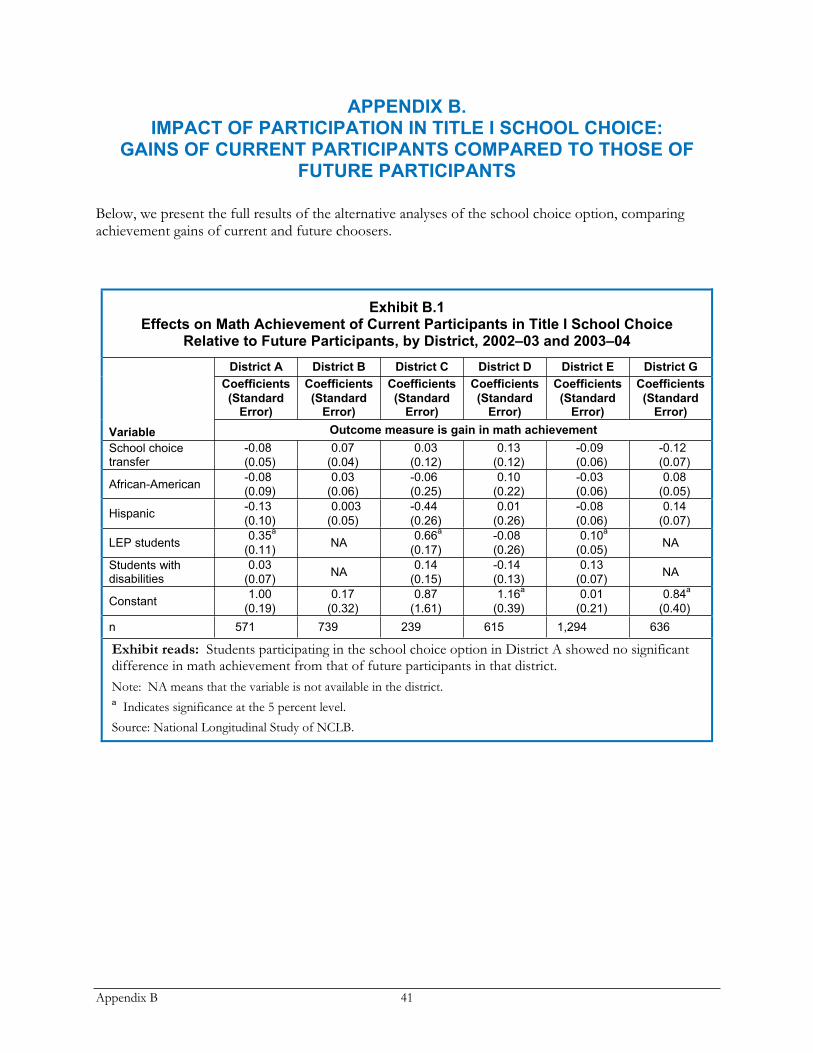
Appendix B 41
APPENDIX B.IMPACT OF PARTICIPATION IN TITLE I SCHOOL CHOICE:
GAINS OF CURRENT PARTICIPANTS COMPARED TO THOSE OF FUTURE PARTICIPANTS
Below, we present the full results of the alternative analyses of the school choice option, comparing achievement gains of current and future choosers.
Exhibit B.1Effects on Math Achievement of Current Participants in Title I School Choice
Relative to Future Participants, by District, 2002–03 and 2003–04
District A District B District C District D District E District G
Coefficients
(StandardError)
Coefficients
(StandardError)
Coefficients
(StandardError)
Coefficients
(StandardError)
Coefficients
(StandardError)
Coefficients
(StandardError)
Variable Outcome measure is gain in math achievement
School choice transfer
-0.08
(0.05)
0.07
(0.04)
0.03
(0.12)
0.13
(0.12)
-0.09
(0.06)
-0.12
(0.07)
African-American -0.08
(0.09)
0.03
(0.06)
-0.06
(0.25)
0.10
(0.22)
-0.03
(0.06)
0.08
(0.05)
Hispanic -0.13
(0.10)
0.003
(0.05)
-0.44
(0.26)
0.01
(0.26)
-0.08
(0.06)
0.14
(0.07)
LEP students 0.35
a
(0.11)NA
0.66a
(0.17)
-0.08
(0.26)
0.10a
(0.05)NA
Students with disabilities
0.03
(0.07)NA
0.14
(0.15)
-0.14
(0.13)
0.13
(0.07)NA
Constant 1.00
(0.19)
0.17
(0.32)
0.87
(1.61)
1.16a
(0.39)
0.01
(0.21)
0.84a
(0.40)
n 571 739 239 615 1,294 636
Exhibit reads: Students participating in the school choice option in District A showed no significant difference in math achievement from that of future participants in that district. Note: NA means that the variable is not available in the district. a Indicates significance at the 5 percent level. Source: National Longitudinal Study of NCLB.
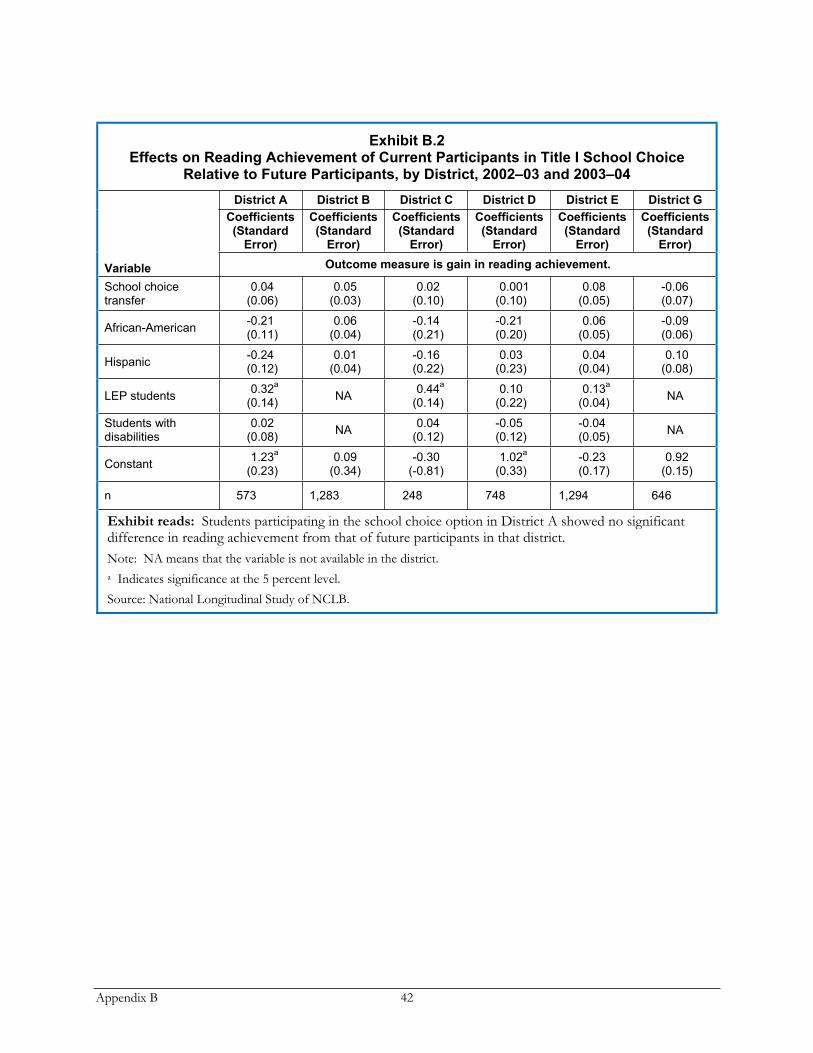
Appendix B 42
Exhibit B.2 Effects on Reading Achievement of Current Participants in Title I School Choice
Relative to Future Participants, by District, 2002–03 and 2003–04
District A District B District C District D District E District G
Coefficients (Standard
Error)
Coefficients(Standard
Error)
Coefficients(Standard
Error)
Coefficients(Standard
Error)
Coefficients (Standard
Error)
Coefficients(Standard
Error)
Variable Outcome measure is gain in reading achievement.
School choice transfer
0.04(0.06)
0.05(0.03)
0.02(0.10)
0.001(0.10)
0.08(0.05)
-0.06(0.07)
African-American -0.21(0.11)
0.06(0.04)
-0.14(0.21)
-0.21(0.20)
0.06(0.05)
-0.09(0.06)
Hispanic -0.24(0.12)
0.01(0.04)
-0.16(0.22)
0.03(0.23)
0.04(0.04)
0.10(0.08)
LEP students 0.32
a
(0.14)NA
0.44a
(0.14)0.10
(0.22)0.13
a
(0.04)NA
Students with disabilities
0.02(0.08)
NA0.04
(0.12)-0.05(0.12)
-0.04(0.05)
NA
Constant 1.23
a
(0.23)0.09
(0.34)-0.30
(-0.81)1.02
a
(0.33)-0.23(0.17)
0.92(0.15)
n 573 1,283 248 748 1,294 646
Exhibit reads: Students participating in the school choice option in District A showed no significant difference in reading achievement from that of future participants in that district. Note: NA means that the variable is not available in the district. a Indicates significance at the 5 percent level. Source: National Longitudinal Study of NCLB.
Appendix C 43
APPENDIX C.META-ANALYSIS OF EFFECTS OF TITLE I SCHOOL CHOICE AND
SUPPLEMENTAL EDUCATIONAL SERVICES
To carry out the meta-analyses for the school choice and supplemental educational services results across the districts, we assumed that for district j, the regression coefficient of interest Bj can be modeled as
Bj = B0 + Gj + Ej
where Gj is independent and identical normal (0,T2) and Ej are independent of the Gj and both are independent of one another with mean 0 normal distributions. We assumed that the variances of these distributions, denoted Sj2, are known and equal to the squared standard errors reported from the district-specific regression models. This model implies that the regression coefficients have a common mean across districts, and variance equal to (T2+Ej). It allows for the possibility that there are district random effects that center the sampling distribution of the regression coefficient for that district, conditional on Gj, at B0+Gj.
Using the observed regression coefficients bj and its estimated standard errors, the procedure estimates T2. Estimates of 0 imply that there appears to be no extra variability among districts in the estimated regression coefficients beyond what is reasonable given the level of sampling variance within districts. Alternatively, positive estimates suggest additional interdistrict variability, which is important to account in the pooled estimation to make appropriate inferences. Given estimates t2 of T2 for each type of regression coefficient and the Sj, we estimate the pooled regression coefficient using a weighted average:
SUM (wj X bj)
where
wj = (1/(t2 + Sj2)) / SUM(1/(t2 + Sj2))
That is, each estimated regression coefficient is weighted by a factor proportional to its estimated precision, giving more weight to regression coefficients estimated with less variance. Because the estimator is a linear combination of independent normal random variables, its variance is readily available and is equal to 1/SUM(1/(t2 + Sj2)). This reduces to the usual variance of the sample mean when t2=0and Sj2 are the same. Also note that this variance is larger (i.e., more conservative) than what would be the variance for the usual pooled estimator where t2 is identically equal to 0. By explicitly allowing for extra variability among districts, we are guarding against mistaken overconfidence in our inferences.
To produce the confidence interval, the estimated mean effect is assumed to be normally distributed with variance equal to 1/SUM(1/(t2 + Sj2)), from which the usual normal 95 percent confidence interval is calculated. A similar procedure is described in DerSimonian and Laird (1986).
Below, Exhibits C.1 and C.2 display the number of student observations contributing to the estimates for Exhibits 10, 13, and 17 in the main text.
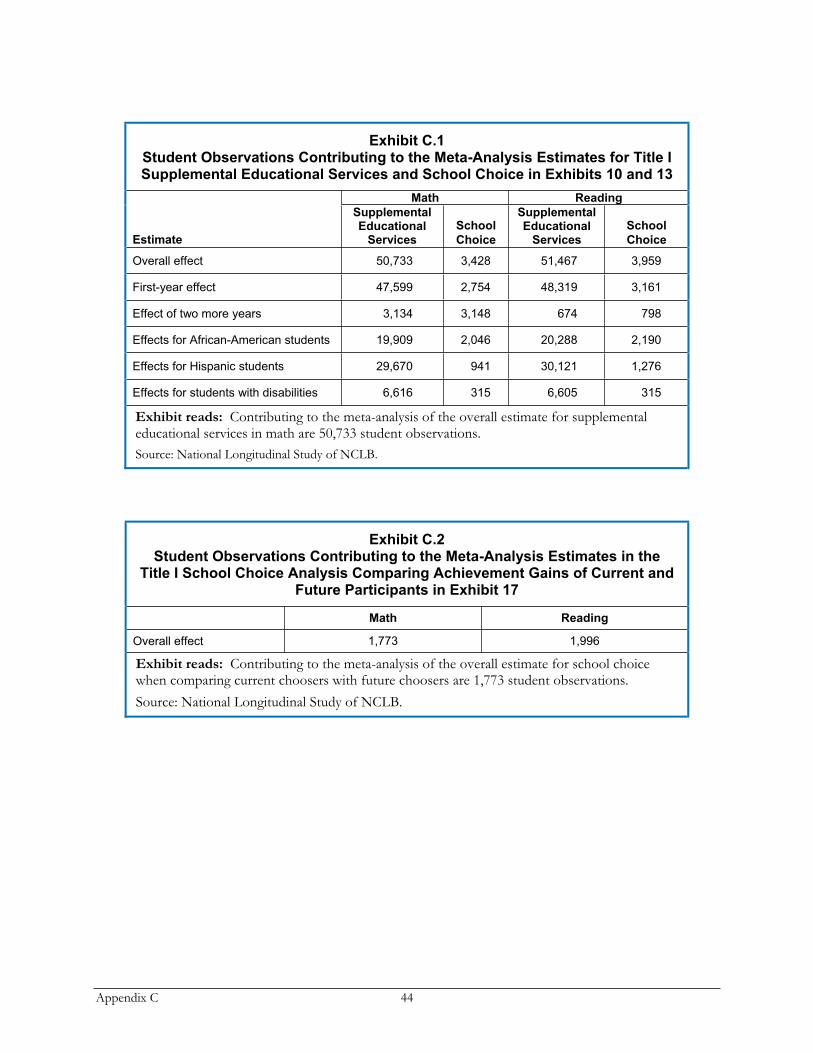
Appendix C 44
Exhibit C.1Student Observations Contributing to the Meta-Analysis Estimates for Title I Supplemental Educational Services and School Choice in Exhibits 10 and 13
Math Reading
Estimate
Supplemental Educational
Services
School
Choice
Supplemental Educational
Services
School
Choice
Overall effect 50,733 3,428 51,467 3,959
First-year effect 47,599 2,754 48,319 3,161
Effect of two more years 3,134 3,148 674 798
Effects for African-American students 19,909 2,046 20,288 2,190
Effects for Hispanic students 29,670 941 30,121 1,276
Effects for students with disabilities 6,616 315 6,605 315
Exhibit reads: Contributing to the meta-analysis of the overall estimate for supplemental educational services in math are 50,733 student observations.Source: National Longitudinal Study of NCLB.
Exhibit C.2Student Observations Contributing to the Meta-Analysis Estimates in the
Title I School Choice Analysis Comparing Achievement Gains of Current and Future Participants in Exhibit 17
Math Reading
Overall effect 1,773 1,996
Exhibit reads: Contributing to the meta-analysis of the overall estimate for school choice when comparing current choosers with future choosers are 1,773 student observations. Source: National Longitudinal Study of NCLB.