Embed Size (px)
Citation preview
Energy Analysis of the Electrification of Food Carts and Trucks in New York City
Prepared by:
Closed Loop Advisors
197 E. 4th St., Suite 5
New York, NY 10009
www.closedloopadvisors.com
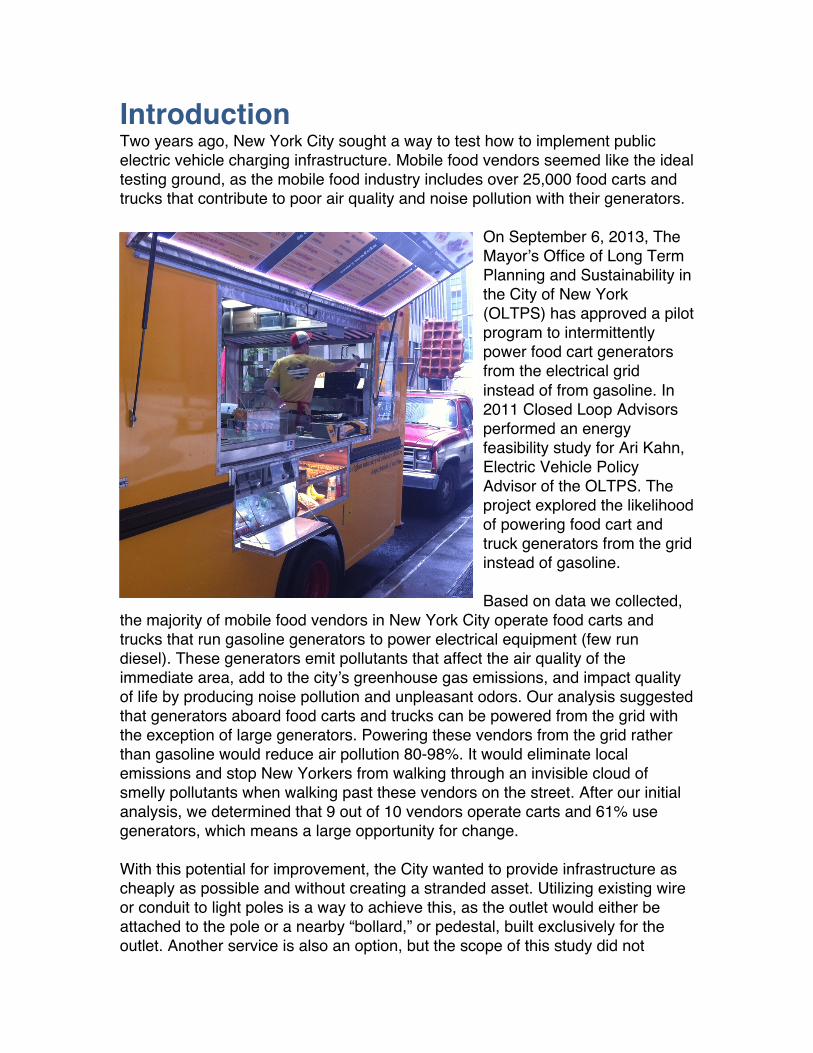
Introduction Two years ago, New York City sought a way to test how to implement public electric vehicle charging infrastructure. Mobile food vendors seemed like the ideal testing ground, as the mobile food industry includes over 25,000 food carts and trucks that contribute to poor air quality and noise pollution with their generators.
On September 6, 2013, The Mayor’s Office of Long Term Planning and Sustainability in the City of New York (OLTPS) has approved a pilot program to intermittently power food cart generators from the electrical grid instead of from gasoline. In 2011 Closed Loop Advisors performed an energy feasibility study for Ari Kahn, Electric Vehicle Policy Advisor of the OLTPS. The project explored the likelihood of powering food cart and truck generators from the grid instead of gasoline. Based on data we collected,
the majority of mobile food vendors in New York City operate food carts and trucks that run gasoline generators to power electrical equipment (few run diesel). These generators emit pollutants that affect the air quality of the immediate area, add to the city’s greenhouse gas emissions, and impact quality of life by producing noise pollution and unpleasant odors. Our analysis suggested that generators aboard food carts and trucks can be powered from the grid with the exception of large generators. Powering these vendors from the grid rather than gasoline would reduce air pollution 80-98%. It would eliminate local emissions and stop New Yorkers from walking through an invisible cloud of smelly pollutants when walking past these vendors on the street. After our initial analysis, we determined that 9 out of 10 vendors operate carts and 61% use generators, which means a large opportunity for change. With this potential for improvement, the City wanted to provide infrastructure as cheaply as possible and without creating a stranded asset. Utilizing existing wire or conduit to light poles is a way to achieve this, as the outlet would either be attached to the pole or a nearby “bollard,” or pedestal, built exclusively for the outlet. Another service is also an option, but the scope of this study did not
include other services. While several options were considered, an electricity pedestal was used for the pilot. The basis for investigation was the per-unit (e.g. gallon, kilowatt hour (kWh)) analysis of energy consumption from generator specifications and more importantly, from studying data collected from four food vendors - Wafels & Dinges, The Cinnamon Snail, FoodFreaks!, and Kelvin Natural Slush - that graciously volunteered for the study. Context about their operations were gained through phone interviews and on-site visits. Lastly, it was necessary to arrive at an apples-to-apples energy comparison of gasoline vs. grid power. This involved calculating the amount of grid power (in kWh) needed to supply the equivalent amount of electricity a gallon of gasoline would produce in a specific generator. While carts comprise the majority of vendors, trucks have been growing in popularity in the past few years. Despite typically having larger generators than carts, we realized that a pilot may include trucks and that it was critical to determine the cutoff point for generator size at 5,500 watts. We were told to assume a max of 40 amperes would be available per cart or truck. While larger generators could draw within this limit, it would depend on what the vendor was powering. A cutoff of 5,500 was a safe choice. The benefit of pollution reduction is clear. According to calculations of energy usage, if all mobile food vendors switched their source of generator power from gasoline to the grid, the CO2 emissions reduction would be equivalent to removing 2,000 to 3,500 cars from the road for a year. This range was found by projecting the sample of vendors and generator sizes (150) to the universe of all licensed vendors (3,000), accounting for high and low scenarios. Similarly, the projected reduction in NOx emissions from switching vendors from generators to the grid would be equal to removing 9,500 to 11,100 cars from the road for a year. Lastly, a study of the economic implications of switching generators from gasoline to grid power would yield annual fuel cost savings for the vendors we studied ranged from $1,000 to $5,200. The potential economic and pollution-reduction benefits warranted exploring the operational feasibility of a pilot that leveraged existing infrastructure to supply power. This report illustrates general insights gained from canvassing vendors, explains the analysis of energy consumption, emissions and economics of the generators used by the participating vendors, and concludes with a discussion and suggestions for further study. Our findings informed decision-making at OLTPS when planning the mobile food cart electrification pilot.
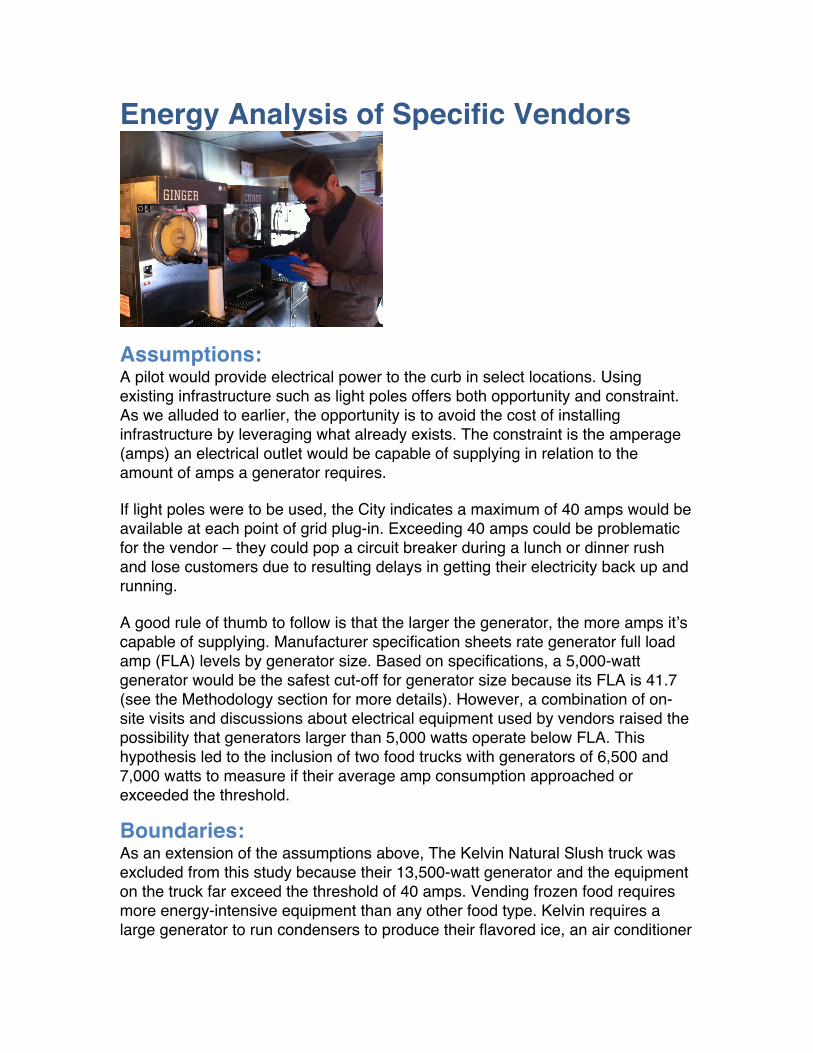
Energy Analysis of Specific Vendors
Assumptions: A pilot would provide electrical power to the curb in select locations. Using existing infrastructure such as light poles offers both opportunity and constraint. As we alluded to earlier, the opportunity is to avoid the cost of installing infrastructure by leveraging what already exists. The constraint is the amperage (amps) an electrical outlet would be capable of supplying in relation to the amount of amps a generator requires. If light poles were to be used, the City indicates a maximum of 40 amps would be available at each point of grid plug-in. Exceeding 40 amps could be problematic for the vendor – they could pop a circuit breaker during a lunch or dinner rush and lose customers due to resulting delays in getting their electricity back up and running. A good rule of thumb to follow is that the larger the generator, the more amps it’s capable of supplying. Manufacturer specification sheets rate generator full load amp (FLA) levels by generator size. Based on specifications, a 5,000-watt generator would be the safest cut-off for generator size because its FLA is 41.7 (see the Methodology section for more details). However, a combination of on-site visits and discussions about electrical equipment used by vendors raised the possibility that generators larger than 5,000 watts operate below FLA. This hypothesis led to the inclusion of two food trucks with generators of 6,500 and 7,000 watts to measure if their average amp consumption approached or exceeded the threshold.
Boundaries: As an extension of the assumptions above, The Kelvin Natural Slush truck was excluded from this study because their 13,500-watt generator and the equipment on the truck far exceed the threshold of 40 amps. Vending frozen food requires more energy-intensive equipment than any other food type. Kelvin requires a large generator to run condensers to produce their flavored ice, an air conditioner
to keep the inside of the vending area cool in the summer, and additional equipment like freezers. They and other vendors selling similar frozen treats are exceptions due to the nature of preparing and preserving the food they vend. Considering the analysis focused on electricity, equipment powered by propane gas was excluded. Examples of such equipment include but are not limited to griddles, deep fryers and coffee makers. The exclusion enables a pilot to be implemented at a minimum cost to the vendors since they would not be required to replace or purchase new equipment. The scope of this investigation did not include conducting a full economic analysis (the cost of implementation are unknown at this stage) or determining the logistics of how to plug generators into circuits (e.g. distance, tripping hazards, preventing unauthorized use). Particulate matter (PM) was excluded, as most generators observed did not run on diesel.
Methodology: See Appendix B
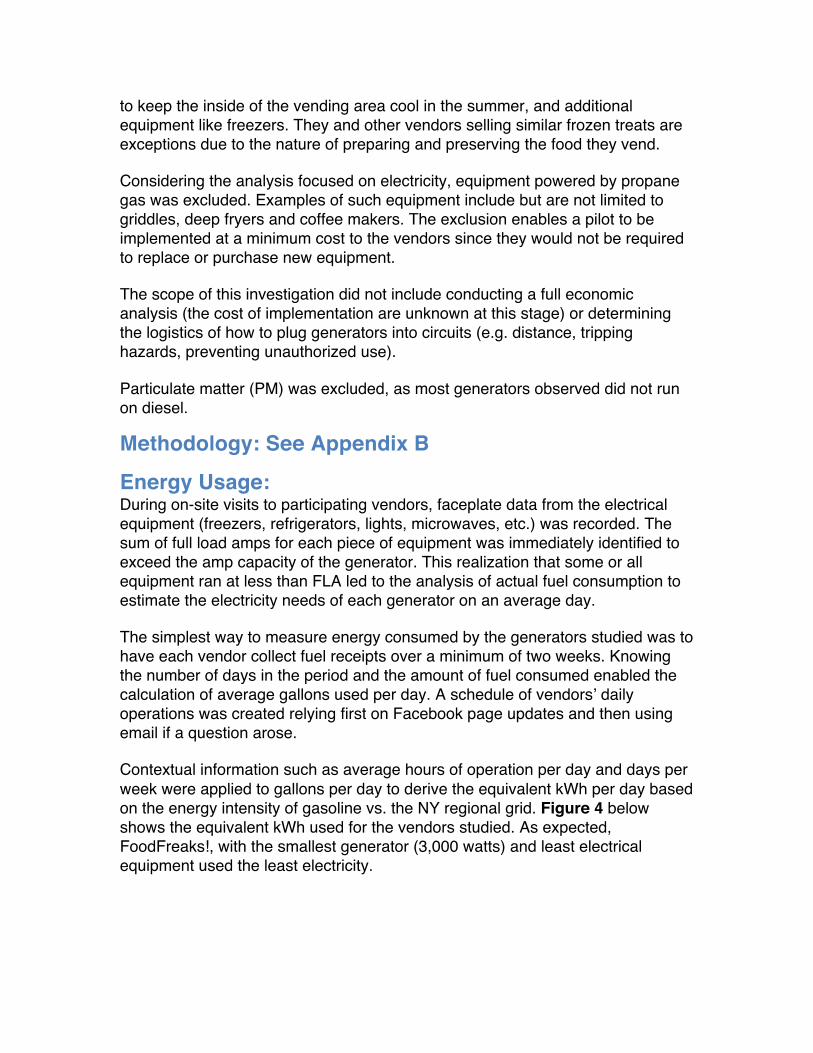
Energy Usage: During on-site visits to participating vendors, faceplate data from the electrical equipment (freezers, refrigerators, lights, microwaves, etc.) was recorded. The sum of full load amps for each piece of equipment was immediately identified to exceed the amp capacity of the generator. This realization that some or all equipment ran at less than FLA led to the analysis of actual fuel consumption to estimate the electricity needs of each generator on an average day. The simplest way to measure energy consumed by the generators studied was to have each vendor collect fuel receipts over a minimum of two weeks. Knowing the number of days in the period and the amount of fuel consumed enabled the calculation of average gallons used per day. A schedule of vendors’ daily operations was created relying first on Facebook page updates and then using email if a question arose. Contextual information such as average hours of operation per day and days per week were applied to gallons per day to derive the equivalent kWh per day based on the energy intensity of gasoline vs. the NY regional grid. Figure 4 below shows the equivalent kWh used for the vendors studied. As expected, FoodFreaks!, with the smallest generator (3,000 watts) and least electrical equipment used the least electricity.
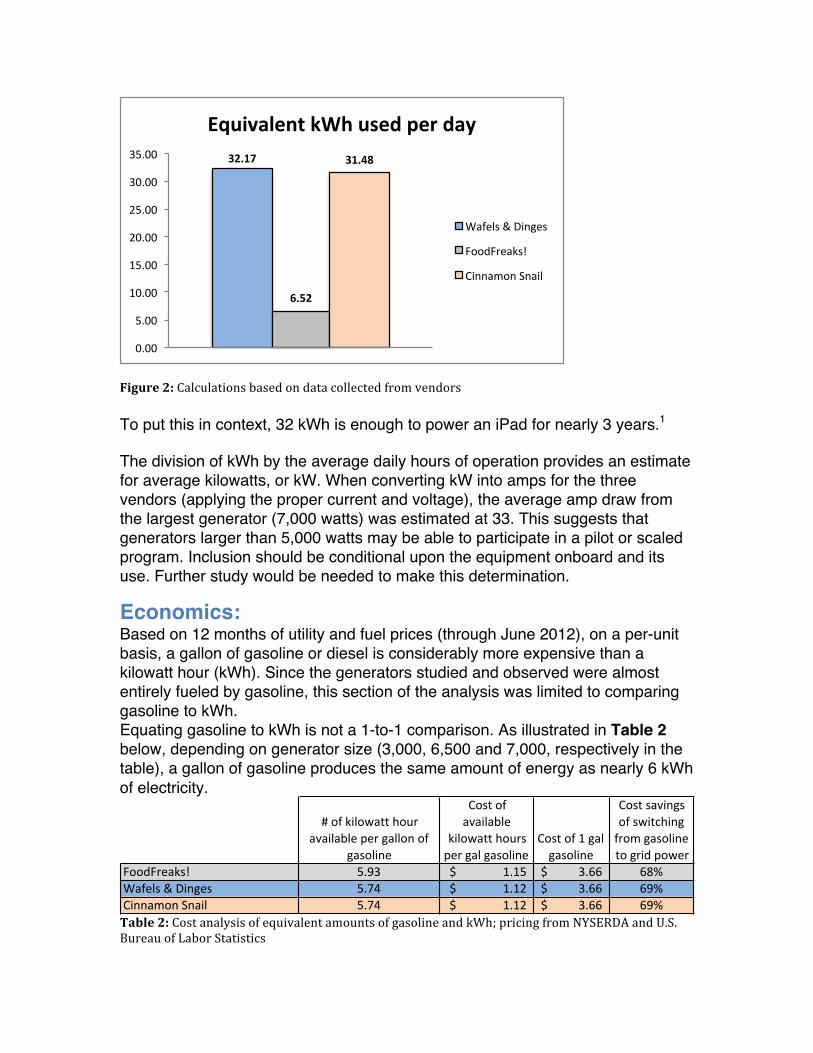
Figure 2: Calculations based on data collected from vendors To put this in context, 32 kWh is enough to power an iPad for nearly 3 years.1 The division of kWh by the average daily hours of operation provides an estimate for average kilowatts, or kW. When converting kW into amps for the three vendors (applying the proper current and voltage), the average amp draw from the largest generator (7,000 watts) was estimated at 33. This suggests that generators larger than 5,000 watts may be able to participate in a pilot or scaled program. Inclusion should be conditional upon the equipment onboard and its use. Further study would be needed to make this determination.
Economics: Based on 12 months of utility and fuel prices (through June 2012), on a per-unit basis, a gallon of gasoline or diesel is considerably more expensive than a kilowatt hour (kWh). Since the generators studied and observed were almost entirely fueled by gasoline, this section of the analysis was limited to comparing gasoline to kWh. Equating gasoline to kWh is not a 1-to-1 comparison. As illustrated in Table 2 below, depending on generator size (3,000, 6,500 and 7,000, respectively in the table), a gallon of gasoline produces the same amount of energy as nearly 6 kWh of electricity.
Table 2: Cost analysis of equivalent amounts of gasoline and kWh; pricing from NYSERDA and U.S. Bureau of Labor Statistics
#"of"kilowatt"hour"available"per"gallon"of"
gasoline
Cost"of"available"
kilowatt"hours"per"gal"gasoline
Cost"of"1"gal"gasoline
Cost"savings"of"switching"from"gasoline"to"grid"power
FoodFreaks! 5.93 1.15$"""""""""""""""" 3.66$""""""""""" 68%Wafels"&"Dinges 5.74 1.12$"""""""""""""""" 3.66$""""""""""" 69%Cinnamon"Snail 5.74 1.12$"""""""""""""""" 3.66$""""""""""" 69%
32.17&
6.52&
31.48&
0.00#
5.00#
10.00#
15.00#
20.00#
25.00#
30.00#
35.00#
Equivalent&kWh&used&per&day&
Wafels#&#Dinges#
FoodFreaks!#
Cinnamon#Snail#

When the cost of 1 gallon of gasoline is compared to the cost of its electricity unit-equivalent of nearly 6 kWh, vendors could save almost 70% by switching to grid power instead of gasoline (Table 2). An estimation of the average daily, weekly, monthly, and annual savings for each vendor was based on estimated hours of operations and days of operation per year. The projected annual savings are listed in Table 3. These figures represent the best estimates given accuracy of data available, particularly the hours of operation throughout the year. In addition, the estimated savings do not account for any service charges the City could chose to apply. Table 3: Savings calculations based on cost analysis and data collected from vendors
Pollution Analysis On a per unit basis, running electrical equipment on grid power has significantly less emissions than using either gasoline or diesel generators. This section compares CO2, and NOx generated by the three different power sources on a per-unit and annualized basis. The graphs illustrate the difference between sources and the benefits of running electrical equipment from the grid vs. generators.
CO2: Pounds of CO2 emitted per-unit of fuel consumed was analyzed first in order to arrive at the amount emitted by a specific vendor. Since the calculations began with per-unit measurements, the emissions are the same regardless of generator size.
They represent the emissions expected from a gallon of gasoline according to The Inventory of New York City Greenhouse Gas Emissions. Per-unit figures for a gallon of gasoline and for a kWh were then applied to actual usage, generator efficiency and hours of operation of the vendors studied. CO2 was then calculated
Annual&savings&grid&over&gasoline
FoodFreaks! 1,000$&&&&&&&&&&&&&&&&&&&&&Wafels&&&Dinges 5,200$&&&&&&&&&&&&&&&&&&&&&Cinnamon&Snail 5,100$&&&&&&&&&&&&&&&&&&&&&
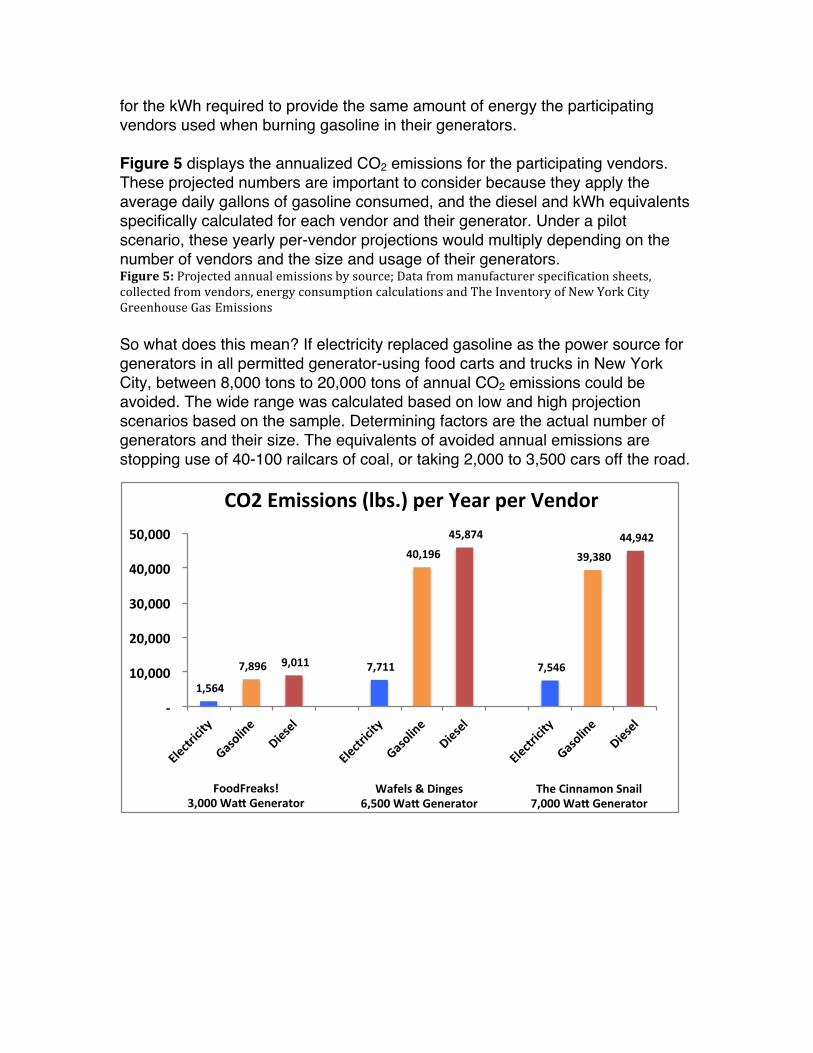
for the kWh required to provide the same amount of energy the participating vendors used when burning gasoline in their generators. Figure 5 displays the annualized CO2 emissions for the participating vendors. These projected numbers are important to consider because they apply the average daily gallons of gasoline consumed, and the diesel and kWh equivalents specifically calculated for each vendor and their generator. Under a pilot scenario, these yearly per-vendor projections would multiply depending on the number of vendors and the size and usage of their generators. Figure 5: Projected annual emissions by source; Data from manufacturer specification sheets, collected from vendors, energy consumption calculations and The Inventory of New York City Greenhouse Gas Emissions So what does this mean? If electricity replaced gasoline as the power source for generators in all permitted generator-using food carts and trucks in New York City, between 8,000 tons to 20,000 tons of annual CO2 emissions could be avoided. The wide range was calculated based on low and high projection scenarios based on the sample. Determining factors are the actual number of generators and their size. The equivalents of avoided annual emissions are stopping use of 40-100 railcars of coal, or taking 2,000 to 3,500 cars off the road.
!1,564!!
!7,896!! !9,011!! !7,711!!
!40,196!!
!45,874!!
!7,546!!
!39,380!!!44,942!!
!-!!
!10,000!!
!20,000!!
!30,000!!
!40,000!!
!50,000!!
Electricity!
Gasoline!
Diesel!
Electricity!
Gasoline!
Diesel!
Electricity!
Gasoline!
Diesel!
CO2!Emissions!(lbs.)!per!Year!per!Vendor!
FoodFreaks!!3,000!WaK!Generator!
Wafels!&!Dinges!6,500!WaK!Generator!
The!Cinnamon!Snail!7,000!WaK!Generator!
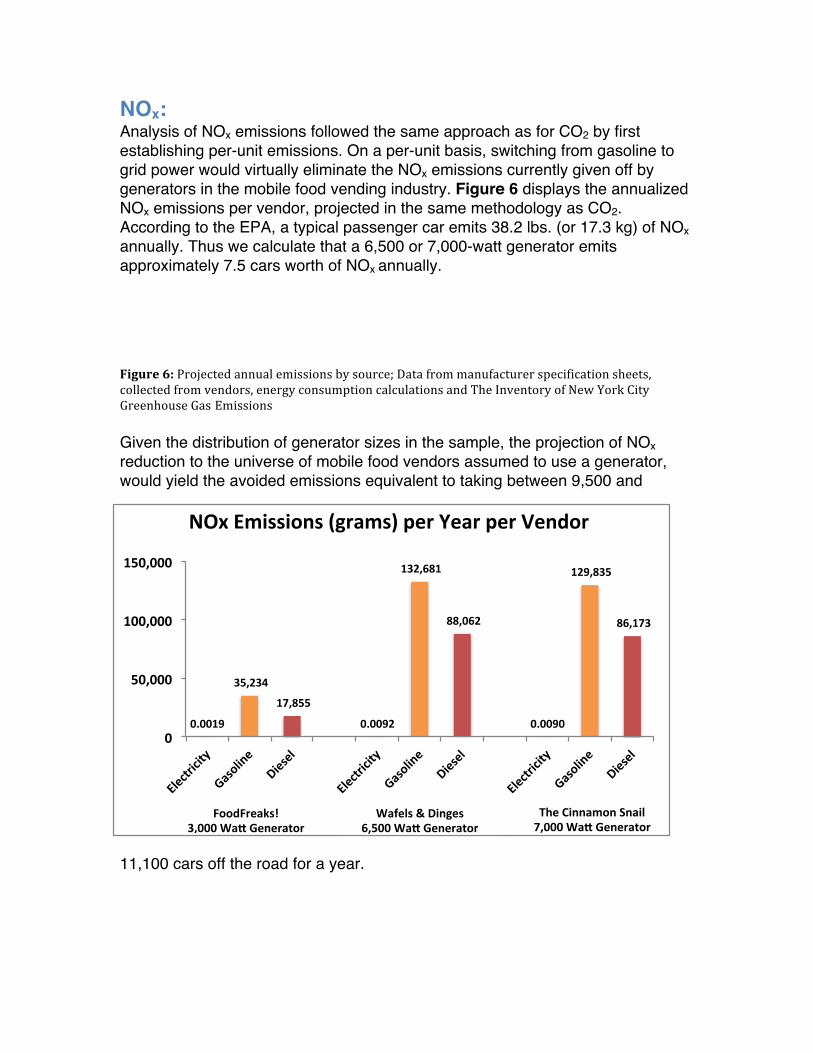
NOx: Analysis of NOx emissions followed the same approach as for CO2 by first establishing per-unit emissions. On a per-unit basis, switching from gasoline to grid power would virtually eliminate the NOx emissions currently given off by generators in the mobile food vending industry. Figure 6 displays the annualized NOx emissions per vendor, projected in the same methodology as CO2. According to the EPA, a typical passenger car emits 38.2 lbs. (or 17.3 kg) of NOx annually. Thus we calculate that a 6,500 or 7,000-watt generator emits approximately 7.5 cars worth of NOx annually.
Figure 6: Projected annual emissions by source; Data from manufacturer specification sheets, collected from vendors, energy consumption calculations and The Inventory of New York City Greenhouse Gas Emissions Given the distribution of generator sizes in the sample, the projection of NOx reduction to the universe of mobile food vendors assumed to use a generator, would yield the avoided emissions equivalent to taking between 9,500 and
11,100 cars off the road for a year.
0.0019%
%35,234%%
%17,855%%
0.0092%
%132,681%%
%88,062%%
0.0090%
%129,835%%
%86,173%%
0%
50,000%
100,000%
150,000%
Electricity%
Gasoline%
Diesel%
Electricity%
Gasoline%
Diesel%
Electricity%
Gasoline%
Diesel%
NOx%Emissions%(grams)%per%Year%per%Vendor%%
FoodFreaks!%3,000%WaK%Generator%
Wafels%&%Dinges%6,500%WaK%Generator%
The%Cinnamon%Snail%7,000%WaK%Generator%
Food for Thought: Considering most vendors operate food carts with small generators, the City should have enough existing electrical capacity to provide grid power to most of these vendors. Therefore, designing an electrification pilot project for just food carts will be the simplest path forward, but would not be comprehensive. Trucks' needs may be harder to meet, but for precisely that reason they offer the most potential. They are the biggest energy users, and switching them to grid power would have the biggest benefits on a per-unit basis. The calculations suggest that the trucks studied with 6,500- and 7,000-watt generators may be capable of operating below the 40 amp cut-off criteria. This report illustrates that both energy consumption and generator size should determine if a vendor makes the cut-off. Power use surges that can occur when equipment is turned on could be tested in a pilot by measuring actual, real-time power needs using an industrial grade energy measurement and data logging device. A pilot should require zero modification for vendors, just a 3-phase extension cord. It should also be made clear that electricity access is a benefit and not a right. Vendors that benefit from grid power in the future should always be ready to use their generators in case an outlet is unavailable. The key challenges to execute a pilot or scale a program will be operational and economic. Operational challenges are beyond the scope of this study. The potential economic challenges we mention refer to the cost to set up and execute the pilot. The City is investigating these costs now since the approval of the pilot program.
Conclusion: The combination of in-depth analysis of energy usage along with results from a high-level, broader canvass indicates the potential size for electrification is substantial. The analysis of energy use and emissions demonstrate that per-unit pollution reductions would be significant. Reducing local emissions in particular embodies the spirit of PlaNYC. For vendors, the costs of gasoline are high and variable. Providing grid power would establish more stable and attractive energy pricing for the vendors. Electrification of food cars and trucks is an exciting opportunity for the City to engage small businesses and offer them a way to operate in a more cost-effective and environmentally responsible manner.
APPENDIX A
Canvassing Vendors to Gather Additional Data
Assumptions, Boundaries, and Methodology: To inform decision-making, high-level information was sought about generator use by mobile food vendors. Information from a sample of vendors provided context to support the energy analysis of specific vendors, including an estimate of the number of vendors that operate generators and among those, the distribution of generator size. The question was posed of how to obtain this information. A survey was considered, but the logistics of administering a survey that would yield reliable results proved challenging. After thinking through the survey options another approach was chosen: to canvass vendors instead. Interns working for the City visited various neighborhoods of known food cart and truck vending and recorded observations about generators and visible electrical equipment. Eleven neighborhoods were canvassed in Manhattan, Queens, and the Bronx. One hundred fifty observations were recorded, equaling 5% of the universe of NYC’s 3,000 citywide and borough-specific permitted mobile food vendors.2 This canvassing study focused on geographic locations to capture the nomadic nature of food carts and trucks. Trucks may vend from two or more locations throughout the day. Carts are removed from place of business each day and reappear in the morning sometimes at a new location. The self-reported location of food carts is largely unavailable making food cart density in New York City very hard to predict. Because canvassing every neighborhood in the five boroughs would be impractical, the most effective approach was to target specific areas given the time and resources available. Canvassers were sent to known areas of food cart concentration such as Midtown as well as areas assumed to have less concentrated food cart spots like neighborhoods in Queens and the Bronx. Despite the geographic limits of the sample, the information gathered from the observations in the neighborhoods canvassed seems broadly applicable to NYC. For example, information collected about generator size is not affected by the location of the vendor. Electricity use is consistent across vendors that sell similar foods and use comparable cooking tools. While some vendors use more 2 While NYC grants 3,000 citywide and borough-specific mobile food vendor licenses, an unknown number of vendors operate illegally. It was outside the scope of this project to determine if the vendors canvassed possessed up-to-date licenses.
electricity for air conditioning, compressors, lights, advertising and other non-cooking related uses, these vendors are outliers and some of these heavy users are identified in our geographic sample.
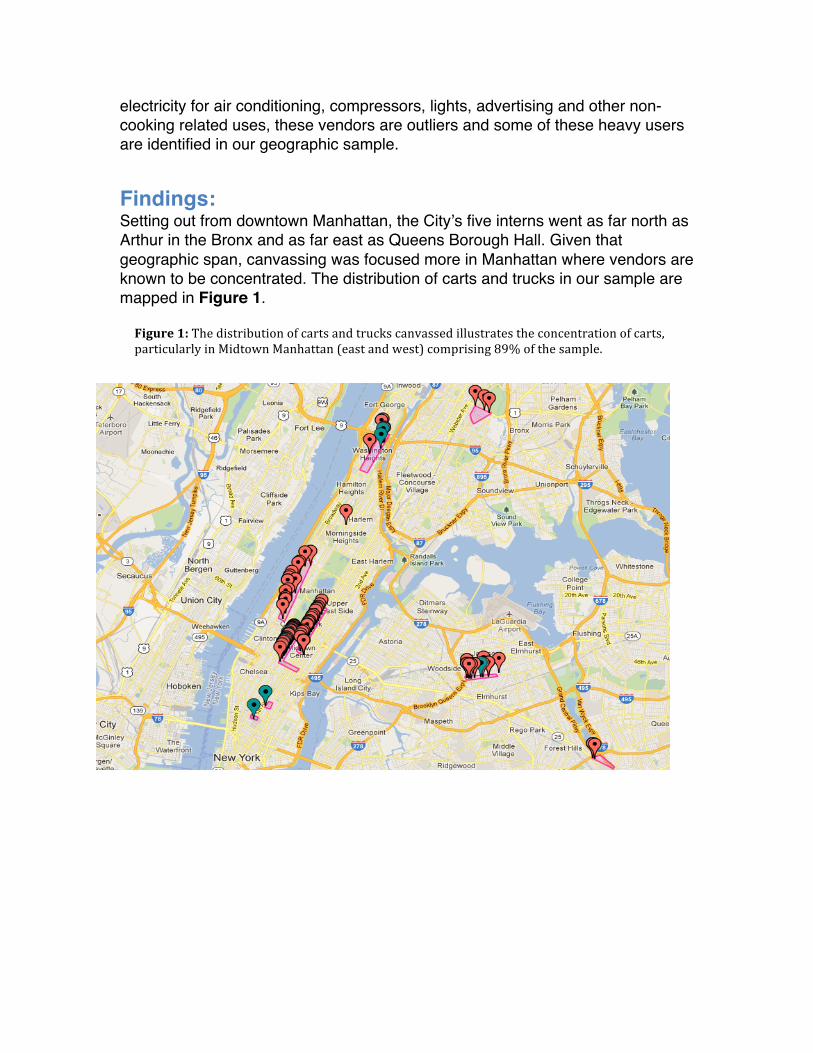
Findings: Setting out from downtown Manhattan, the City’s five interns went as far north as Arthur in the Bronx and as far east as Queens Borough Hall. Given that geographic span, canvassing was focused more in Manhattan where vendors are known to be concentrated. The distribution of carts and trucks in our sample are mapped in Figure 1. Figure 1: The distribution of carts and trucks canvassed illustrates the concentration of carts, particularly in Midtown Manhattan (east and west) comprising 89% of the sample.
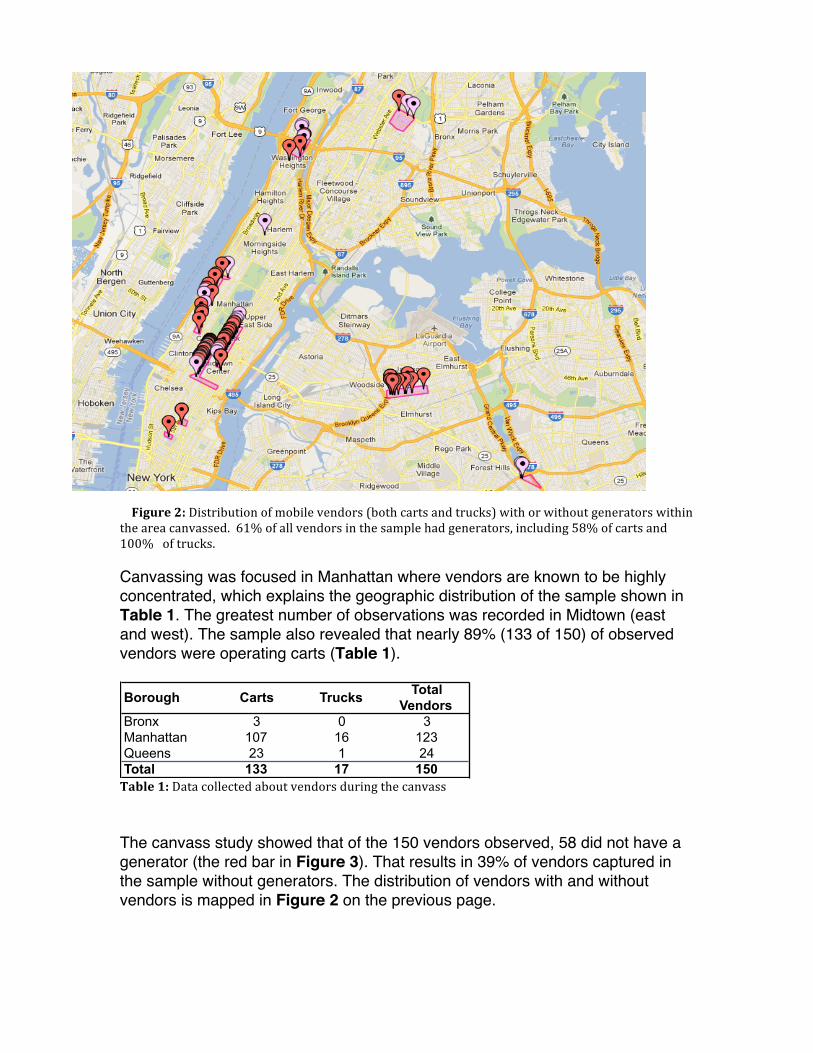
Figure 2: Distribution of mobile vendors (both carts and trucks) with or without generators within the area canvassed. 61% of all vendors in the sample had generators, including 58% of carts and 100% of trucks. Canvassing was focused in Manhattan where vendors are known to be highly concentrated, which explains the geographic distribution of the sample shown in Table 1. The greatest number of observations was recorded in Midtown (east and west). The sample also revealed that nearly 89% (133 of 150) of observed vendors were operating carts (Table 1).
Table 1: Data collected about vendors during the canvass The canvass study showed that of the 150 vendors observed, 58 did not have a generator (the red bar in Figure 3). That results in 39% of vendors captured in the sample without generators. The distribution of vendors with and without vendors is mapped in Figure 2 on the previous page.
Borough Carts Trucks Total Vendors
Bronx 3 0 3Manhattan 107 16 123Queens 23 1 24Total 133 17 150
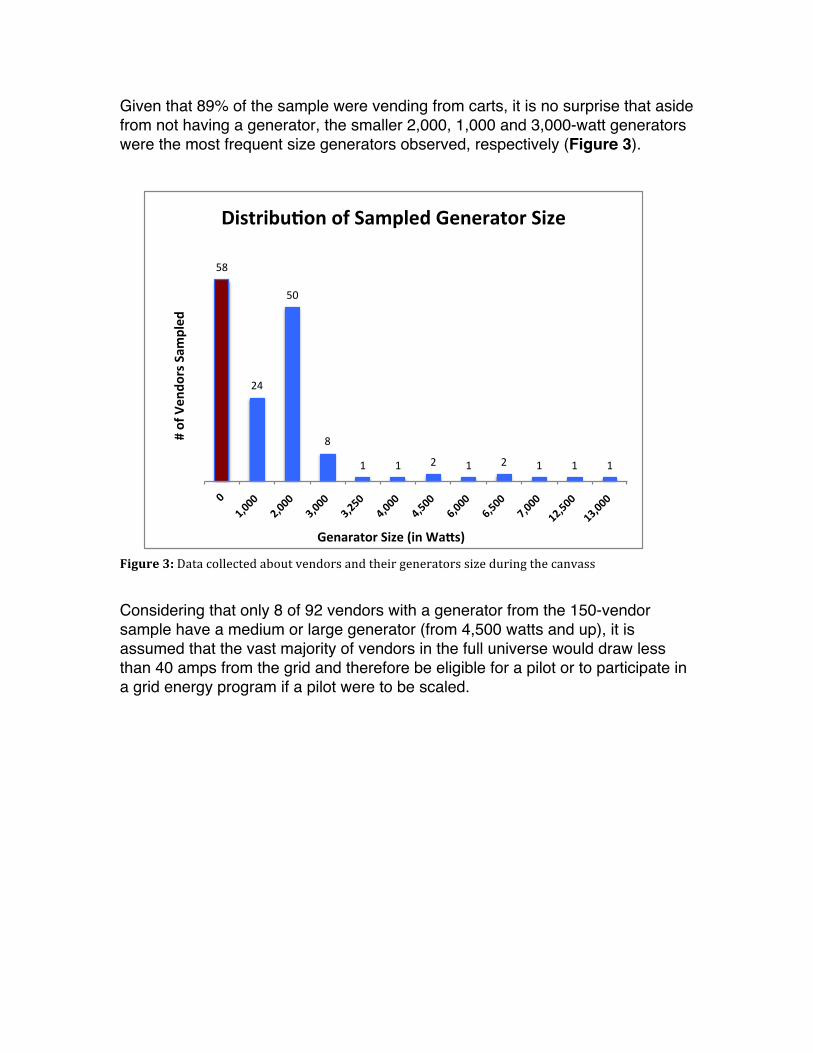
Given that 89% of the sample were vending from carts, it is no surprise that aside from not having a generator, the smaller 2,000, 1,000 and 3,000-watt generators were the most frequent size generators observed, respectively (Figure 3).
Figure 3: Data collected about vendors and their generators size during the canvass
Considering that only 8 of 92 vendors with a generator from the 150-vendor sample have a medium or large generator (from 4,500 watts and up), it is assumed that the vast majority of vendors in the full universe would draw less than 40 amps from the grid and therefore be eligible for a pilot or to participate in a grid energy program if a pilot were to be scaled.
58#
24#
50#
8#
1# 1# 2# 1# 2# 1# 1# 1#
0"
"1,000""
"2,000""
"3,000""
"3,250""
"4,000""
"4,500""
"6,000""
"6,500""
"7,000""
"12,500""
"13,000""
#"of"Ven
dors"Sam
pled
"
Genarator"Size"(in"Wa?s)"
DistribuDon"of"Sampled"Generator"Size"
APPENDIX B Methodology: A combination of inputs informed the energy analysis: on-site information gathering of the energy profiles of equipment used by volunteering vendors, interviews with owners and operators, an interview with one food truck builder, records of fuel consumption, generator specification sheets, EPA regulations, The Inventory of New York City Greenhouse Gas Emissions, and regional grid and gasoline prices. Generator size and energy intensity of the electrical equipment they power varies depending on food type and cart or truck size. A wide array of electrical equipment was observed on the carts or trucks studied and through observations of other vendors. The most commonly used equipment included lights, water pumps/heaters and refrigerators. Additional equipment types regularly encountered were freezers, speakers and vents (passive vents are another popular option). As noted with Kelvin, vendors of frozen treats (especially unpackaged treats), require much more electricity than others. An interview of Jay Celona, the Director of Engineering and Design at Custom Mobile Food Equipment, helped inform this study’s early stages. Mr. Celona’s experience matching generator size with electricity needs provided background information of how vendors outfit their vehicles. Similarly, consultations with two electrical engineers validated early findings. Generator size became the driver for choosing vendors to help with this study. Because Honda was by far the most common make of generator encountered (see the Canvassing section), specifications on Honda’s website were used to determine FLA and run load amps (RLA) of generator sizes ranging from 2,000 to 6,500 watts. Both Wafels & Dinges and FoodFreaks! operate Honda generators, so those specifications were used for the 6,500-watt and 3,000-watt calculations and Cummins specifications were used for the 7,000-watt generator used by the Cinnamon Snail. Honda specifications were compared to those of other manufacturers as part of the process for choosing a primary source for average generator performance (most manufacturers produce equivalent sized generators up to 7,000 watts). Performance in terms of amps and kWh were similar across manufacturers.
On-site visits were arranged during convenient times for vendors. These visits involved inspecting generators, assessing onboard electrical equipment, reading faceplates of electrical equipment, and interviewing operators about equipment usage (how often, hours of operation, etc.) and generator maintenance schedule. The maintenance schedule was discussed because regularly maintained equipment (oil and filter changes) operates more efficiently. Measuring actual energy usage began with asking owners or managers to save receipts when filling up their generators. Some trucks have a shared fuel tank to operate both the truck engine and the generator. In such instances, it’s necessary to isolate gasoline usage to move the truck versus to power the generator. A start and end odometer reading were taken to coincide with the period of receipt tracking to calculate average daily mileage. Multiplying the vehicle’s estimated miles per gallon by the total miles travelled created an estimate for the fuel used for travel that could be subtracted from the total. The remaining usage was assumed to be for the generator. Manufacturer specifications were used as the starting point to analyze generators of participating vendors. Specifications such as tank size were combined with the number of tank fill-ups, gallons purchased and both days and hours of operation. Other specifications such as output in kW were employed to estimate the electricity or kWh equivalent produced by each generator if it were to run on grid power rather than gasoline. Figures from The Inventory of New York City Greenhouse Gas Emissions were used to determine pollutants and greenhouse gas emissions for the different power sources (kWh from the regional grid versus gasoline). NOx emissions were calculated by using the emission profiles of the NYC region electricity providers. The analysis required a conversion of energy used per day by the gasoline generators into an equivalent amount of kWh. Generally accepted standards (e.g. The Inventory of New York City Greenhouse Gas Emissions) allowed us to use pounds (lbs) of CO2 per kWh to calculate the equivalent CO2 emissions scenario if each volunteer vendor were to use grid-generated electricity instead of gasoline to fuel their generators. Similarly, gallons actually consumed by the generators studied and the lbs of CO2 per gallon gasoline and diesel were used to calculate the associated amount of CO2 emissions for each vendor. Data from the canvassing of vendors (see pages 5-7) were used to project emissions for the universe of all mobile food vendors. It was estimated that roughly 1,700 - 2,000 of the 3,000 permitted vendors have generators. This range was calculated by multiplying the 61% of vendors in the sample of 150 vendors that had generators by 3,000. A certain amount of error was assumed, hence the range. The percentage of all vendors that operate carts was assumed
to vary from 85% to 93%, based on the proportion in the sample comprised of carts (89% +/- 5% error). The median generator size for the sample set could be as much as 10% higher or lower than the entire population. To calculate emissions based on generator size, manufacturer specifications for the generators in our sample were applied to the daily duration of operation (8-13 hours based on information gathered from and about vendors). Grid electricity emissions were subtracted from the equivalent gasoline-based emissions to calculate emissions avoided (based on NYC’s Carbon Inventory). Lastly, data from NYSERDA was employed for regional gasoline prices and data from U.S. Bureau of Labor Statistics (BLS) was utilized for regional electricity prices. A 12-month average was applied to pricing to account for market fluctuations.