Embed Size (px)
Citation preview

International Journal of Automotive and Mechanical Engineering
ISSN: 2229-8649 (Print); ISSN: 2180-1606 (Online);
Volume 14, Issue 4 pp. 4805-4825 December 2017
©Universiti Malaysia Pahang Publishing
DOI: https://doi.org/10.15282/ijame.14.4.2017.15.0376
4805
Energy analysis of a stepped cascade solar still connected to photovoltaic thermal
collector
E. Hedayati-Mehdiabadi, F. Sarhaddi* and F. Sobhnamayan
Research Laboratory of Renewable Energies and Electromagnetic Fluids,
Department of Mechanical Engineering, University of Sistan and Baluchestan,
Zahedan, Iran
Phone: +98 54 31136465; Fax: +98 54 33447092 *E-mail: [email protected]
ABSTRACT
In this paper, the performance evaluation of a stepped cascade solar still connected to
photovoltaic thermal (PV/T) collector was carried out. The governing equations of
problem was a set of initial value ordinary differential equations which were obtained by
writing energy balance for the various components of solar still system (i.e. glass cover,
brackish water, absorber plate, and PV/T collector). The numerical model of problem was
solved by the 4th-order Runge-Kutta method under real climatic conditions sample. The
validation of numerical model was carried out by the experimental data of previous
literature. Parametric studies showed that the energy efficiency of stepped cascade solar
still maximised in the desired brackish water flow of 0.03 kg/min and the PV/T collector
area of 1.3 m2. The daily energy efficiency and accumulated freshwater were about 26%
and 5.71 kg/(m2.day), respectively. An increase of about 20% was obtained in freshwater
productivity by the connection of PV/T collector to the stepped cascade solar still. Also,
PV/T collector, in addition to providing pumping power, can supply electrical power of
about 0.918 kW/day for other uses. In order to produce freshwater during the night time,
the usage of the phase change materials below the absorber plate was suggested.
Keywords: Solar still; stepped cascade; PV/T collector; energy efficiency.
INTRODUCTION
In recent years, many parts of the world face freshwater scarcity crisis. Three-quarters of
the Earth's surface is covered by oceans and seawater. However, the sources of drinking
water are limited and include 3 percent of all the Earth's water. Only one percent of
drinking water sources is available and the rest of them are frozen in polar glaciers (2%)
[1]. Some industrial processes such as the ozonation of wastewater [2] , wastewater
purification by graphene oxide [3], wastewater purification by biological oscillatory flow
reactor [4], wastewater filtration by nano tube bundles filters [5, 6], etc. are the main
candidates for freshwater production from wastewater sources. Generally, the mentioned
processes are used for wastewater purification or freshwater production in an industrial
scale and not used for freshwater production in a domestic scale due to high cost and high
energy consumption. Most of the arid and remote areas of the world have high solar
potential and abundance of undesirable groundwater resources [7]. Therefore, in these
regions, the direct solar desalination can be an appropriate way to produce freshwater in
a domestic scale. Two common types of direct solar desalination system include stepped

Energy analysis of a stepped cascade solar still connected to photovoltaic thermal collector
4806
cascade solar still and basin solar still. The freshwater production efficiency of stepped
cascade solar still is more than the basin solar still [8]. Its main reasons are thin layer of
brackish water, the forced mode of brackish water flow and higher evaporation rate in the
stepped cascade solar still. However, the need for an external electrical source for water
circulation is the main deficiency of the stepped cascade solar still. In order to overcome
this shortage, the photovoltaic thermal (PV/T) collector can be connected to the cascade
solar still. In addition to providing electrical power, the PV/T collector also plays the role
of brackish water preheater and increases the average temperature of brackish water at
the entrance to the solar still. On the other hand, the electrical performance of the PV/T
collector improves by cooling the brackish water. Figure 1 shows the photograph of a
stepped cascade solar still, basin solar still and PV/T collector.
(a)
(b)
(c)
Figure 1. (a) Stepped cascade solar still [9]; (b) Basin solar still [10]; (c) PV/T collector
[11].

Hedayati-Mehdiabadi et al. / International Journal of Automotive and Mechanical Engineering 14(4) 2017 4805-4825
4807
The performance evaluation of stepped cascade solar still connected to PV/T
collector can provide the criteria for improving freshwater production efficiency. The
study on the performance assessment of cascade solar stills has been done by many
researchers. The start of research on cascade solar stills was done in the first half of the
1970s by Headley [12]. He designed a cascade solar still for distilled water production.
His design gave higher freshwater productivity than the conventional basin solar stills due
to short distillation gap, high condensing ratio and low thermal inertia. Sadineni et al.
have shown experimentally that the freshwater productivity of a cascade solar still is 20%
more than the basin solar still [8]. Dashtban and Farshchi Tabrizi have demonstrated that
the reduction of air gap in the cascade solar still improved the freshwater productivity by
35% [13]. Alaudeen et al. have pointed out that the connection of flat plate collector to
stepped solar still caused a significant increase in freshwater productivity [14]. Hansen et
al. have investigated the usage of various wick materials on the performance of an
inclined type solar still, experimentally [15]. The wick materials included wood pulp
paper wick, wicking water, coral fleece fabric and polystyrene sponge. They reported that
the inclined type solar still, with coral fleece and weir mesh-stepped absorber plate had,
more productivity. Its freshwater productivity was 4.28 l/day. El-Samadony et al. have
studied the effect of radiation shape factor between hot saline water and glass cover on
the performance of a stepped solar still, theoretically [16]. They found that freshwater
productivity was very sensitive to the radiation shape at low solar insolation and/or high
glass cover inclination angle. Sathyamurthy et al. have investigated the effect of various
operating parameters (i.e. mass flow, feed water temperature, internal heat transfer
coefficient, absorber plate temperature, and baffle plates) on the freshwater productivity
of an inclined solar still [17]. They have introduced a modified analytical model for the
prediction of the average water temperature in stepped and weir cascade solar stills. Their
results showed that the insert of baffle plates on absorber plate increased freshwater
productivity due to the higher absorption of solar radiation intensity. Bhalara et al. have
designed, fabricated and tested a modified stepped solar still [18]. Their modification
included fabricating steps on which small earthen lamps were placed. Their modification
caused an increase of 326.66% in freshwater productivity. Saettone et al. have designed
and studied a stepped solar still with internal reflective walls and attached a set of heat
pipes [19]. The use of the set of heat pipes enhanced solar still performance by 32.4%.
Nagarajan et al. have investigated the performance of an inclined solar still with and
without baffles[20]. Their results showed that the fresh water productivity of the solar
still with baffles was1.68 times the fresh water productivity of the solar still without
baffles. Abujazar et al. have done the efficiency evaluation of an inclined copper-stepped
solar still experimentally [21]. They pointed out that the use of inclined trays in the
stepped solar still increased the freshwater productivity to 605 mL/m2. Rashidi et al. have
investigated the effect of nanofluid on the productivity of a stepped solar still numerically
[22]. Also, they have optimised the geometry of steps. Their results showed an
enhancement of 22% in hourly productivity. The abovementioned literature review
showed that the effects of various design and operating parameters (i.e. air gap [13], mass
flow rate [7, 17], wick material [15], internal reflector [19], baffle [17, 20], inclined tray
[21], steps geometry optimisation [22] and nanofluid [5, 6]) on the freshwater
productivity of stepped cascade solar still have been investigated. However, the effect of
PV/T collector connection to stepped cascade solar still to enhance freshwater
productivity is not investigated. PV/T collector provides the pumping power and pre-
heats the brackish water at the entrance of cascade solar still. Also, the electrical
performance of PV/T collector improves by cooling the brackish water.
Energy analysis of a stepped cascade solar still connected to photovoltaic thermal collector
4808
METHODS AND MATERIALS
The present research is based on numerical simulation. The governing equations of
problem were obtained by writing energy balance for the various components of solar
still system (i.e. glass cover, brackish water, absorber plate, PV/T collector). A computer
simulation programme was developed in order to solve the governing equations.
Validation of numerical simulation was carried out. Finally, some parametric studies were
carried out in order to investigate the effect of design and operating parameters on energy
efficiency, freshwater productivity and electrical power output. Figure 2 shows the
schematic view of stepped cascade solar still connected to PV/T collector.
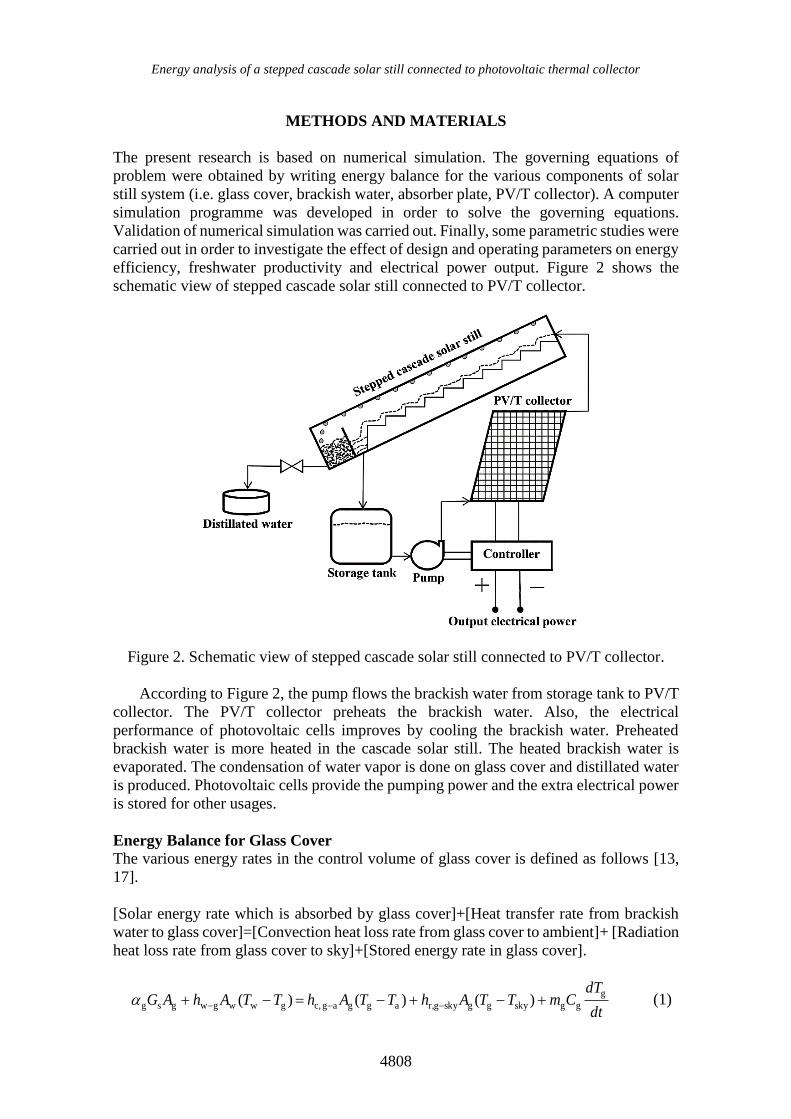
Figure 2. Schematic view of stepped cascade solar still connected to PV/T collector.
According to Figure 2, the pump flows the brackish water from storage tank to PV/T
collector. The PV/T collector preheats the brackish water. Also, the electrical
performance of photovoltaic cells improves by cooling the brackish water. Preheated
brackish water is more heated in the cascade solar still. The heated brackish water is
evaporated. The condensation of water vapor is done on glass cover and distillated water
is produced. Photovoltaic cells provide the pumping power and the extra electrical power
is stored for other usages.
Energy Balance for Glass Cover
The various energy rates in the control volume of glass cover is defined as follows [13,
17].
[Solar energy rate which is absorbed by glass cover]+[Heat transfer rate from brackish
water to glass cover]=[Convection heat loss rate from glass cover to ambient]+ [Radiation
heat loss rate from glass cover to sky]+[Stored energy rate in glass cover].
dt
dTCmTTAhTTAhTTAhAG
g
ggskyggskygr,aggag c,gwwgwgsg )()()( (1)

Hedayati-Mehdiabadi et al. / International Journal of Automotive and Mechanical Engineering 14(4) 2017 4805-4825
4809
where gT , wT , aT , skyT , sG , gm , gC , gA , wA and g are the glass cover temperature,
brackish water temperature, ambient temperature, sky temperature, solar radiation
intensity on solar still, mass of glass cover, heat capacity of glass cover, area of glass
cover, area of water surface and absorptivity of glass cover, respectively. Also, gwh ,
agc, h and skygr, h are the overall heat transfer coefficient from water to glass cover,
convective heat transfer coefficient from the glass cover to ambient and radiative heat
transfer coefficient from glass cover to sky, respectively. It should be mentioned that the
related heat transfer coefficients are given in the APPENDIX.
Energy Balance for Brackish Water
The various energy rates in the control volume of brackish water is defined as follows
[13, 17].
[Solar energy rate which is absorbed by brackish water]+[Convection heat transfer rate
from absorber plate to brackish water]+[Useful heat gain of PV/T collector]=[Heat
transfer rate from brackish water to glass cover]+[Stored energy rate in brackish water]
dt
dTCmTTAhQTTAhAG w
wwgwwgwcwppwpwswg )()( (2)
where pT , pA , wm , wC , w , g and cQ are the absorber plate temperature, area of
absorber plate, mass of brackish water, heat capacity of brackish water, absorptivity of
brackish water, transmissivity of glass cover and the useful heat gain of PV/T collector,
respectively. Besides, wph is the convective heat coefficient between absorber plate and
brackish water and it is given in Table 1.
Tiwari and Sodha [23] have given an expression for the useful heat gain of PV/T
collector as follows
)]()([ awcceffp2p1cc TTUGhhAFQ R (3)
ww
cc
cc
ww exp1Cm
AUF
AU
CmFR
(4)
where cA , cG , cU , wm , RF , F and eff)( are the PV/T collector area, solar radiation
intensity on PV/T collector, overall heat loss coefficient of PV/T collector, the mass flow
rate of brackish water in PV/T collector, heat removal factor, fin efficiency factor and the
product of effective absorptivity and transmissivity, respectively. Also, p1h and p2h are
the penalty factors. They are given in Table 1.
Energy Balance for Absorber Plate
The various energy rates in the control volume of absorber plate is defined as follows [13,
17].
[Solar energy rate which is absorbed by absorber plate]=[Convection heat transfer rate
from absorber plate to brackish water]+[Bottom heat loss rate from absorber plate to
ambient]+[Stored energy rate in absorber plate]

Energy analysis of a stepped cascade solar still connected to photovoltaic thermal collector
4810
dt
dTCmTTAhTTAhAG
p
ppappapwppwppspwg )()( (5)
where p , w , pm , pC and aph are the absorptivity of absorber plate, transmissivity of
brackish water, mass of absorber plate, heat capacity of absorber plate and overall heat
loss coefficient from absorber plate to ambient, respectively.
Table 1. Design parameters of cascade solar still and PV/T collector [7, 11, 13, 17, 23].
Cascade solar still PV/T collector
Parameter Value Parameter Value
pA 0.72 m2
cA 0.77 m2
wA 0.45 m2 refa,T
C 25
gA 0.53 m2
refel, 0.1
gm 4.1 kg p1h
0.8772
wm 3.9 kg p2h 0.9841
pm 4.1 kg eff)( 0.66
gC C.kgJ 008 F 0.895
wC C.kgJ 4190 cU C.mW .68 2
pC C.kgJ 698
tU C.mW .249 2
aph C.mW 41 2
TU C.mW 66 2
wph C.mW 901 2
tTU C.mW .10288 2
wg 0.95 wU C.mW 005 2
wg 0.05 pump 0.8
g 0.88 fC 0.38
w 0.95
p 0.9
Energy Efficiency
The energy efficiency is defined as the ratio of net output (desired) energy rate to net
input energy rate.
rateenergy input Net
rateenergy Desireden (6)
According to Figure 1, the output desired energy rate of stepped cascade solar still
connected to PV/T collector includes the rate of evaporative energy of solar still and the
electrical power output of PV/T collector.
elevdesout, EnEnEn (7)
The rate of evaporative energy and freshwater productivity are given as [13, 17].

Hedayati-Mehdiabadi et al. / International Journal of Automotive and Mechanical Engineering 14(4) 2017 4805-4825
4811
)( gwwgwev,ev TTAhEn (8)
fg
evev
3600
h
Enm
(9)
where gwev, h and fgh are the evaporative heat transfer coefficient and the latent heat of
water vaporisation, respectively. They are given in the APPENDIX.
The electrical power output of PV/T collector is given as [11, 23].
pumpw
wrefa,crefel,ccel )](0045.0[1
PmTTGAEn
(10)
It should be mentioned that the second term on the right-hand side of Eq. (10) is the
consumed electrical power of pump to circulate brackish water through the solar still
system. In Eq. (10), refel, , refa,T , P , w and pump are the electrical efficiency of PV
module in reference conditions, ambient temperature in reference conditions, pressure
drop through the system, density of brackish water and pump efficiency, respectively.
Also, cT is the PV/T collector temperature and it is given as [23]
Tt
atceff
wtTTt
wwatTceffp1T
c
)(
))((
])([
UU
TUG
UUUU
TUTUGhUT
(11)
where the terms U are some of the overall heat transfer coefficients. Their details are
given by Tiwari and Sodha [23].
In our problem, the net input energy rate included solar radiation intensity received
by the cascade solar still and PV/T collector.
ccspcsolar,ssolar,netin, GAGAEnEnEn (12)
The energy efficiency of stepped cascade solar still connected to PV/T collector was
obtained by substituting Eqs. (7) to (12) into Eq. (6) as follows
)(
)](0045.0[1)(
ccspf
pumpw
wrefa,crefel,cc
ccsp
gwwgwev,
netin,
desout,
enGAGAC
PmTTGA
GAGA
TTAh
En
En
(13)
The quality of thermal energy and electrical energy were not the same. Here, fC is a
conversion factor which converts the electrical power output of PV/T collector to its
equivalent thermal power [23].
Validation
Equations (1), (2) and (5) constitute a set of nonlinear ordinary differential equations for
unknown temperatures gT , wT and pT . This set was solved by 4th-order Runge-Kutta
Energy analysis of a stepped cascade solar still connected to photovoltaic thermal collector
4812
method, numerically. It was necessary to validate the numerical model of the present
research with respect to experimental data. Since there was no experimental data for the
stepped cascade solar still connected to PV/T collector, the validation was carried out in
two steps. First, the validation of the simulation results of the stepped cascade solar still
was carried out with the experimental data of Farshchi Tabrizi et al. [7]. Then, the results
of numerical simulation of PV/T collector were validated by the experimental data of
Yazdanpanahi et al. [11]. The design parameters of cascade solar still and PV/T collector
are given in Table 1.
In order to compare the simulation results with the experimental data, an average
relative error has been evaluated by the following equation:
1001
1i iexp,
iexp,isim,
n
X
XX
nEr
(14)
where n is the number of the experiments carried out.
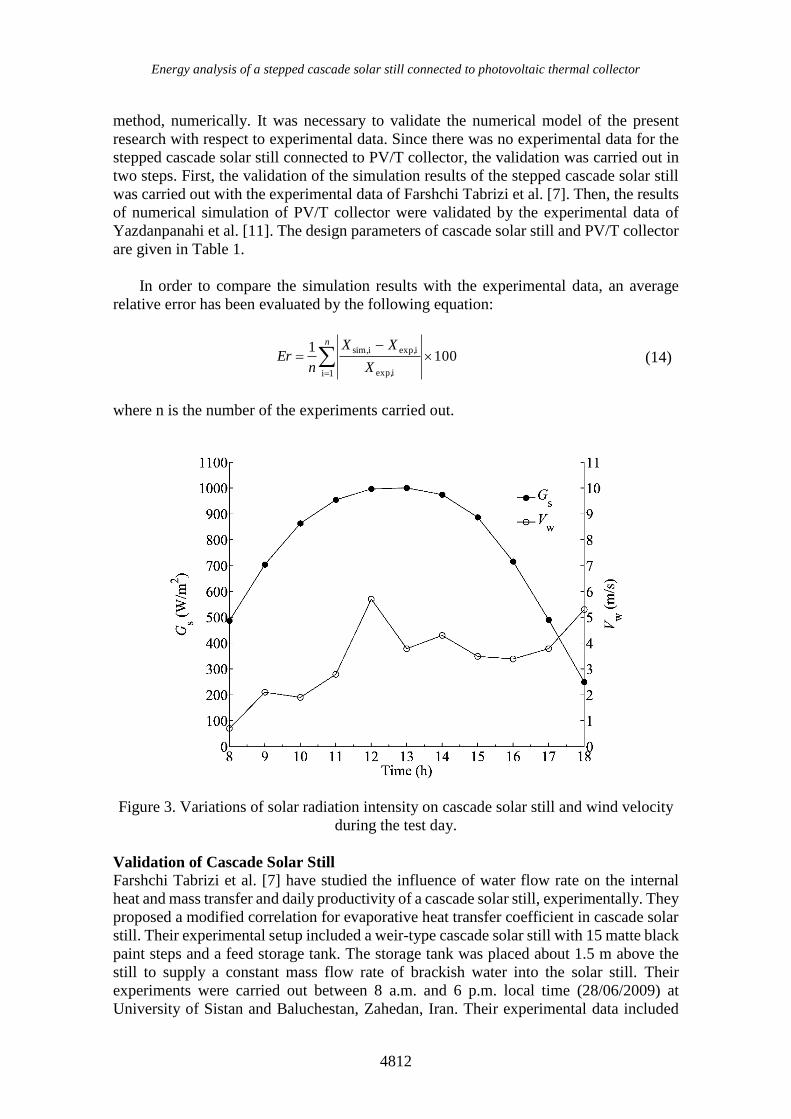
Figure 3. Variations of solar radiation intensity on cascade solar still and wind velocity
during the test day.
Validation of Cascade Solar Still Farshchi Tabrizi et al. [7] have studied the influence of water flow rate on the internal
heat and mass transfer and daily productivity of a cascade solar still, experimentally. They
proposed a modified correlation for evaporative heat transfer coefficient in cascade solar
still. Their experimental setup included a weir-type cascade solar still with 15 matte black
paint steps and a feed storage tank. The storage tank was placed about 1.5 m above the
still to supply a constant mass flow rate of brackish water into the solar still. Their
experiments were carried out between 8 a.m. and 6 p.m. local time (28/06/2009) at
University of Sistan and Baluchestan, Zahedan, Iran. Their experimental data included

Hedayati-Mehdiabadi et al. / International Journal of Automotive and Mechanical Engineering 14(4) 2017 4805-4825
4813
solar radiation intensity, wind velocity, ambient temperature, glass cover temperature,
brackish water temperature and freshwater productivity. The variations of solar radiation
intensity on solar still and wind velocity during the test day are shown in Figure 3. It can
be seen that Figure 3 shows that the solar radiation intensity increased with time and
achieved its maximum value at 1 p.m. and then its value decreased with time. The
maximum value of solar radiation intensity is about 1000 W/m2, which is greater than the
daily average value of 756.2 W/m2. Figure 3 also shows that the test day was a windy
day. The daily average value of wind velocity is 3.38 m/s. The various temperatures of
cascade solar still (absorber plate temperature, brackish water temperature, glass cover
temperature and ambient temperature) during the test day are shown in Figure 4.
Figure 4. Various temperatures of cascade solar still during the test day.
In Figure 4, the simulated values of brackish water temperature and glass cover
temperature were validated with the corresponding experimental temperatures. The
relative errors of these temperatures were 5.18% and 6.66%, respectively. Also, the
average value of ambient temperature for the test day was 33.4 oC. Unfortunately, the
experimental values of absorber plate temperature were not given by Farshchi Tabrizi et
al. [7]. Therefore, its simulated values were only reported. The simulated and
experimental values of freshwater productivity during the test day are shown in Figure 5.
According to Figure 5, it was observed that there was a fair agreement between the
simulated and experimental value of this parameter with a relative error of 15.16%. When
the variations range of a parameter was very low, the relative error was not suitable

Energy analysis of a stepped cascade solar still connected to photovoltaic thermal collector
4814
criterion for the comparison process. Therefore, the linear coefficient of regression was
evaluated.
2
1i
isim,
1i
2isim,
2
1i
iexp,
1i
2iexp,
1i
isim,
1i
iexp,
1i
isim,iexp,
.
..
nnnn
nnn
XXnXXn
XXXXn
R
(15)
The value of ‘R’ closer to 1 is preferred. According to Figure 6, the linear
coefficient of regression between the simulated and experimental values of freshwater
productivity is 0.94.
Figure 5. Simulated and experimental values of freshwater productivity during the test
day.
Validation of PV/T collector
Yazdanpanahi et al. [11] have investigated the exergy efficiency of a water PV/T
collector, experimentally. They have proposed a modified equation for the energy
efficiency of PV/T collector which was based on exergy losses. Their experimental setup
consisted of one mono-crystalline silicon PV module (90W) integrated with a solar water
collector. Their measurements were carried out during a clear day (November 2012) from
8:00 a.m. to 4:00 p.m. local time at University of Sistan and Baluchestan, Zahedan, Iran.
Their measured data included solar radiation intensity, ambient temperature, average
water temperature, PV/T collector temperature and electrical power output. Figure 7
shows the variations of solar radiation intensity on PV/T collector during the test day.
Hedayati-Mehdiabadi et al. / International Journal of Automotive and Mechanical Engineering 14(4) 2017 4805-4825
4815
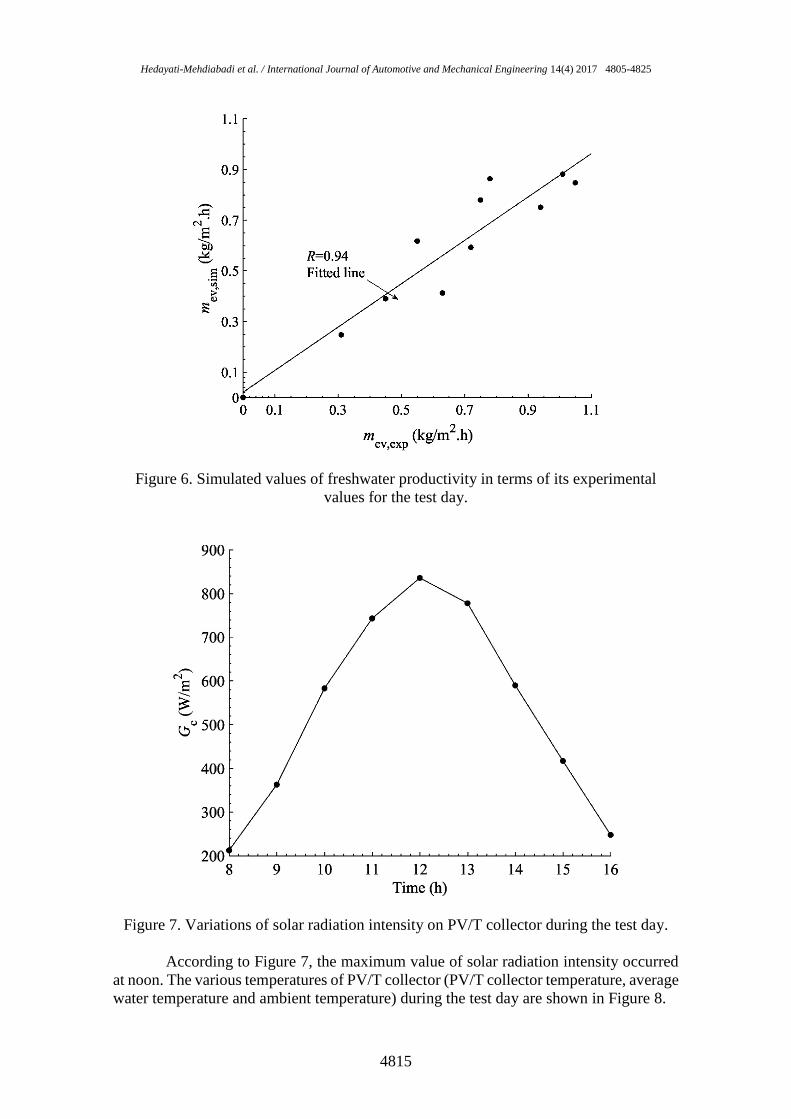
Figure 6. Simulated values of freshwater productivity in terms of its experimental
values for the test day.
Figure 7. Variations of solar radiation intensity on PV/T collector during the test day.
According to Figure 7, the maximum value of solar radiation intensity occurred
at noon. The various temperatures of PV/T collector (PV/T collector temperature, average
water temperature and ambient temperature) during the test day are shown in Figure 8.
Energy analysis of a stepped cascade solar still connected to photovoltaic thermal collector
4816
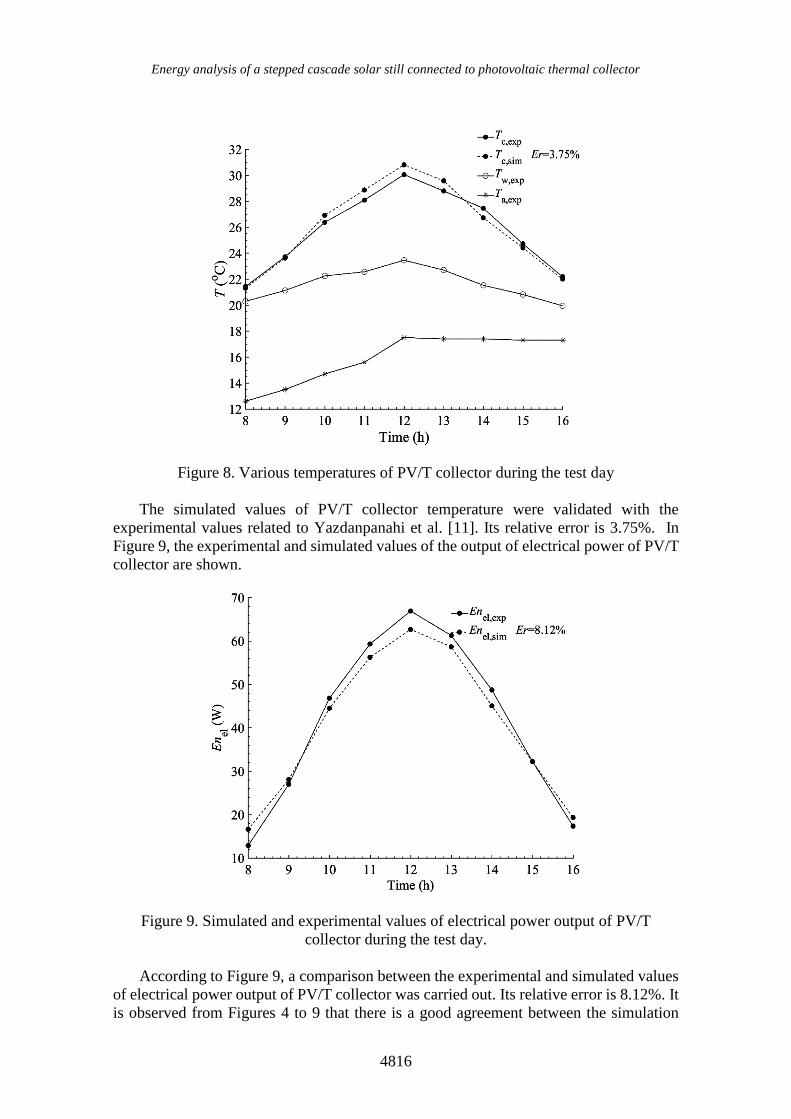
Figure 8. Various temperatures of PV/T collector during the test day
The simulated values of PV/T collector temperature were validated with the
experimental values related to Yazdanpanahi et al. [11]. Its relative error is 3.75%. In
Figure 9, the experimental and simulated values of the output of electrical power of PV/T
collector are shown.
Figure 9. Simulated and experimental values of electrical power output of PV/T
collector during the test day.
According to Figure 9, a comparison between the experimental and simulated values
of electrical power output of PV/T collector was carried out. Its relative error is 8.12%. It
is observed from Figures 4 to 9 that there is a good agreement between the simulation

Hedayati-Mehdiabadi et al. / International Journal of Automotive and Mechanical Engineering 14(4) 2017 4805-4825
4817
results of the present study and the experimental data of Farshchi Tabrizi et al. [7] and
Yazdanpanahi et al. [11].
RESULTS AND DISCUSSION
In this section, parametric studies were carried out and the effect of various operating and
design parameters on the energy efficiency, freshwater productivity and electrical power
output was investigated. Figure 10 shows the variations of the energy efficiency versus
the area of PV/T collector for the different values of the mass flow rate of brackish water.
In order to plot Figure 10, the daily average value of solar radiation intensity, ambient
temperature and wind velocity of Farshchi Tabrizi et al. [7] were used which are reported
above in the figure.
Figure 10. Variations of the energy efficiency versus the area of PV/T collector for the
different values of the mass flow rate of brackish water.
According to Figure 10, it was observed that there was a desired point for the mass
flow rate of brackish water and the PV/T collector area which maximised the energy
efficiency. The desired value of the mass flow rate of brackish water and the PV/T
collector area is 0.03 kg/min and 1.3 m2, respectively. The area of 1.3 m2 is equivalent to
about two PV/T collectors of Yazdanpanahi et al. [11]. The larger PV/T collector area
after the desired point caused the long piping system in PV/T collector. Therefore, the
pressure drop and pumping power increases. According to Eq. (10), the pumping power
is subtracted from electrical power output of PV/T collector. Also, the consumed
electrical power of pump is a negative term in the numerator of Eq. (13). Therefore, the
high value of pumping power after the desired point decreased the energy efficiency.
Yazdanpanahi et al. [11] have shown that the pumping power is an incremental function
of PV/T collector area. On the other hand, the increase of the mass flow rate of brackish
water after the desired point increased the Reynolds number of the brackish water flow
and the water layer thickness on steps. The increase of the Reynolds number increased
Energy analysis of a stepped cascade solar still connected to photovoltaic thermal collector
4818
the pressure drop and pumping power, while the increase of water layer thickness
decreased the evaporation rate. The simultaneous effect of these factors reduced the
efficiency. The next figures investigate the daily behaviour of the energy efficiency,
freshwater productivity and electrical power output. It should be mentioned that the
climatic conditions of Farshchi Tabrizi et al. [7] were used to plot the next figures.
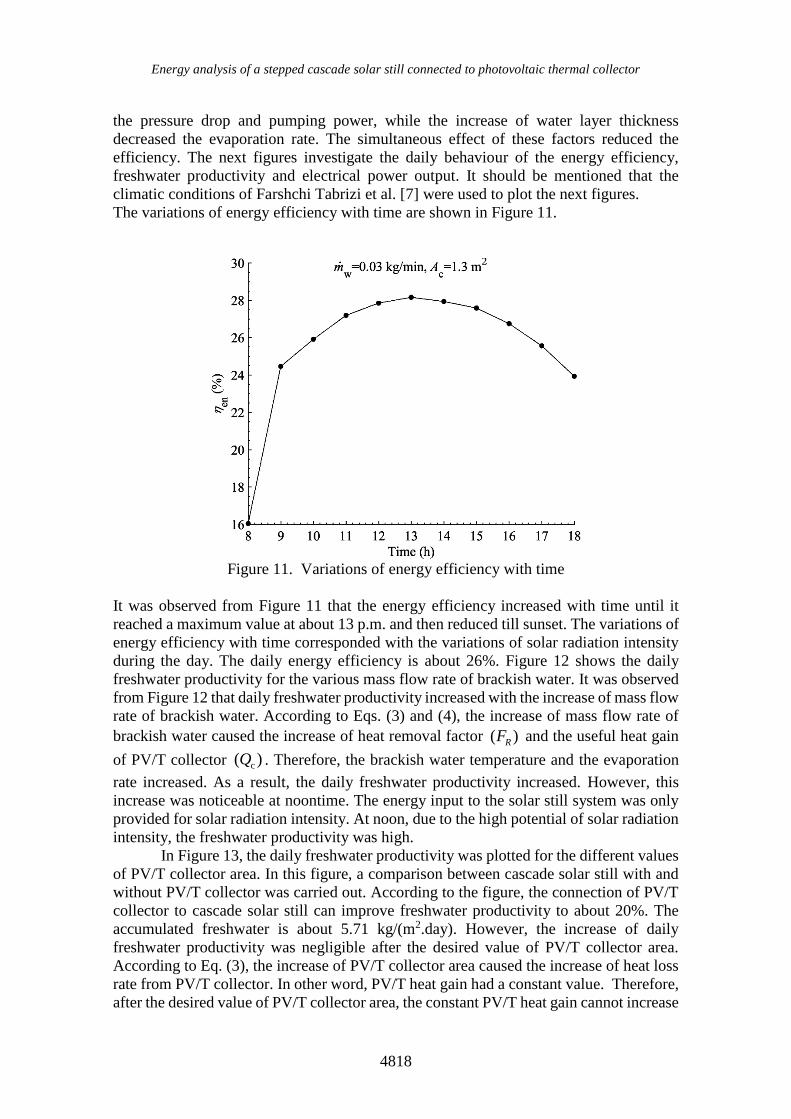
The variations of energy efficiency with time are shown in Figure 11.
Figure 11. Variations of energy efficiency with time
It was observed from Figure 11 that the energy efficiency increased with time until it
reached a maximum value at about 13 p.m. and then reduced till sunset. The variations of
energy efficiency with time corresponded with the variations of solar radiation intensity
during the day. The daily energy efficiency is about 26%. Figure 12 shows the daily
freshwater productivity for the various mass flow rate of brackish water. It was observed
from Figure 12 that daily freshwater productivity increased with the increase of mass flow
rate of brackish water. According to Eqs. (3) and (4), the increase of mass flow rate of
brackish water caused the increase of heat removal factor )( RF and the useful heat gain
of PV/T collector )( cQ . Therefore, the brackish water temperature and the evaporation
rate increased. As a result, the daily freshwater productivity increased. However, this
increase was noticeable at noontime. The energy input to the solar still system was only
provided for solar radiation intensity. At noon, due to the high potential of solar radiation
intensity, the freshwater productivity was high.
In Figure 13, the daily freshwater productivity was plotted for the different values
of PV/T collector area. In this figure, a comparison between cascade solar still with and
without PV/T collector was carried out. According to the figure, the connection of PV/T
collector to cascade solar still can improve freshwater productivity to about 20%. The
accumulated freshwater is about 5.71 kg/(m2.day). However, the increase of daily
freshwater productivity was negligible after the desired value of PV/T collector area.
According to Eq. (3), the increase of PV/T collector area caused the increase of heat loss
rate from PV/T collector. In other word, PV/T heat gain had a constant value. Therefore,
after the desired value of PV/T collector area, the constant PV/T heat gain cannot increase

Hedayati-Mehdiabadi et al. / International Journal of Automotive and Mechanical Engineering 14(4) 2017 4805-4825
4819
the brackish water temperature. Therefore, the daily freshwater productivity did not
change.
Figure 12. Daily freshwater productivity for the various mass flow rate of brackish
water.
Figure 13. Daily freshwater productivity for the different values of area of PV/T
collector.
The daily electrical power output for the different mass flow rate of brackish water is
shown in Figure 14. It was observed from Figure 14 that by increasing the mass flow rate
of brackish water, the daily electrical power output decreased. According to Eqs. (3) and
(4), the increase of mass flow rate of brackish water caused the increase of heat removal

Energy analysis of a stepped cascade solar still connected to photovoltaic thermal collector
4820
factor and the useful heat gain of PV/T collector. Therefore, the brackish water
temperature increased. According to Eq. (11), by increasing brackish water temperature,
the PV/T collector temperature increased. As a result, daily electrical power output
reduced. On the other hand, the increase of mass flow rate of brackish water caused the
increase of pumping power and reduced the daily electrical power output.
Figure 14. Daily electrical power output for the different mass flow rate of brackish
water
Figure 15. Daily electrical power output for the different values of PV/T collector area.
Figure 15 shows the daily electrical power output for the different values of PV/T
collector area. It is clear from Figure 15 that by increasing the PV/T collector area, the
number of PV cells in PV/T collector increased. Therefore, daily electrical power output

Hedayati-Mehdiabadi et al. / International Journal of Automotive and Mechanical Engineering 14(4) 2017 4805-4825
4821
increased. A PV/T collector with an area of 1.3 m2 in addition to providing pumping
power can give the electrical power of about 0.918 kW/day for other uses.
CONCLUSIONS
The important findings of the present study can be summarised as follows:
the maximum energy efficiency of stepped cascade solar still was obtained in the
desired brackish water flow of 0.03 kg/min and the PV/T collector area of 1.3 m2;
the connection of PV/T collector to cascade solar still improved freshwater
productivity by 20%;
PV/T collector in addition to providing pumping power gave the electrical power
of about 0.918 kW/day for other uses.
the daily energy efficiency of stepped cascade solar still connected to PV/T
collector is about 26%.
The performance of stepped cascade solar still was limited to sunny hours. For further
study, the addition of the phase change materials below the absorber plate in order to
produce freshwater during the night time is suggested.
ACKNOWLEDGEMENTS
The authors would like to acknowledge the financial support of University of Sistan and
Baluchestan for this research under grant number 9401.
REFERENCES
[1] Velmurugan V, Gopalakrishnan M, Raghu R, Srithar K. Single basin solar still
with fin for enhancing productivity. Energy Conversion and Management.
2008;49:2602-8.
[2] Abidin C, Ong S, Makhtar SM, Rahmat N, Ahmad R. Decolourization and cod
reduction of textile wastewater by ozonation in combination with biological
treatment. International Journal of Automotive and Mechanical Engineering.
2016;13:3141.
[3] Alias A, Kinoshita H, Nishina Y, Fujii M. Dependence of pH level on tribological
effect of graphene oxide as an additive in water lubrication. International Journal
of Automotive and Mechanical Engineering. 2016;13:3150.
[4] Azaini N, Masngut N. Oscillatory flow reactor design for biological process.
[5] Tahseen TA, Ishak M, Rahman M. Laminar forced convection heat transfer over
staggered circular tube banks: A CFD approach. Journal of Mechanical
Engineering and Sciences. 2013;4:418-30.
[6] Ehsan MM, Salehin M, Islam A. Investigation of thermal and hydrodynamic
behaviour of Al2O3-water nanofluid through a rough parallel plate.
[7] Tabrizi FF, Dashtban M, Moghaddam H, Razzaghi K. Effect of water flow rate
on internal heat and mass transfer and daily productivity of a weir-type cascade
solar still. Desalination. 2010;260:239-47.
[8] Sadineni SB, Hurt R, Halford CK, Boehm RF. Theory and experimental
investigation of a weir-type inclined solar still. Energy. 2008;33:71-80.
[9] Montazeri M, Banakar A, Ghobadian B. Design and evaluation of a new absorber
plate for cascade solar still. Technical Journal of Engineering and Applied
Sciences Available online at www tjeas com. 2013:1666-75.
Energy analysis of a stepped cascade solar still connected to photovoltaic thermal collector
4822
[10] Kumar S, Tiwari A. Design, fabrication and performance of a hybrid
photovoltaic/thermal (PV/T) active solar still. Energy Conversion and
Management. 2010;51:1219-29.
[11] Yazdanpanahi J, Sarhaddi F, Adeli MM. Experimental investigation of exergy
efficiency of a solar photovoltaic thermal (PVT) water collector based on exergy
losses. Solar Energy. 2015;118:197-208.
[12] Headley OSC. Cascade solar still for distilled water production. Solar Energy.
1973;15:245-58.
[13] Dashtban M, Tabrizi FF. Thermal analysis of a weir-type cascade solar still
integrated with PCM storage. Desalination. 2011;279:415-22.
[14] Alaudeen A, Johnson K, Ganasundar P, Abuthahir AS, Srithar K. Study on
stepped type basin in a solar still. Journal of King Saud University-Engineering
Sciences. 2014;26:176-83.
[15] Hansen RS, Narayanan CS, Murugavel KK. Performance analysis on inclined
solar still with different new wick materials and wire mesh. Desalination.
2015;358:1-8.
[16] El-Samadony Y, El-Maghlany WM, Kabeel A. Influence of glass cover
inclination angle on radiation heat transfer rate within stepped solar still.
Desalination. 2016;384:68-77.
[17] Sathyamurthy R, Samuel DH, Nagarajan P. Theoretical analysis of inclined solar
still with baffle plates for improving the fresh water yield. Process Safety and
Environmental Protection. 2016;101:93-107.
[18] Bhalara B, Varshney R, Yadav AK. Experimental Analysis of Modified Stepped
Solar Still.
[19] Saettone E, Valencia-Tovar Y, Gómez-de-la-Torre-Gastello A. Preliminary
overview and evaluation of a stepped solar distiller with internal reflective walls
and borosilicate vacuum tubes. Desalination. 2017;413:136-43.
[20] Nagarajan P, El-Agouz S, DG HS, Edwin M, Madhu B, Sathyamurthy R, et al.
Analysis of an inclined solar still with baffles for improving the yield of fresh
water. Process Safety and Environmental Protection. 2017;105:326-37.
[21] Abujazar MSS, Fatihah S, Lotfy E, Kabeel A, Sharil S. Performance evaluation
of inclined copper-stepped solar still in a wet tropical climate. Desalination.
2018;425:94-103.
[22] Rashidi S, Bovand M, Rahbar N, Esfahani JA. Steps optimization and productivity
enhancement in a nanofluid cascade solar still. Renewable Energy. 2018;118:536-
45.
[23] Tiwari A, Sodha M. Performance evaluation of solar PV/T system: an
experimental validation. Solar Energy. 2006;80:751-9.
NOMENCLATURES
A (m2) area
C (J/kg.oC) specific heat capacity
Cf energy conversion factor
d (m) distance between glass cover and water surface
Er (%) relative error
En (W) energy rate
FR heat removal factor

Hedayati-Mehdiabadi et al. / International Journal of Automotive and Mechanical Engineering 14(4) 2017 4805-4825
4823
F fin efficiency factor
g (m/s2) gravity acceleration
G (W/m) solar radiation intensity
rG modified Grashof number
h (W/m2.K) overall heat transfer
hfg (J/kg) latent heat of water
hp1 penalty factor due to the presence of solar cell material, glass
and EVA
hp2 penalty factor due to the presence of interface between absorber
plate and working fluid
k (W/m.oC) thermal conductivity
m (kg) mass
mev (kg/m2.h) mass of distillated m (kg/s) mass flow rate of water
n number of the experiment carried out
Q (W) useful heat gain of PV/T collector
P (Pa) pressure
Pr Prandtl number
R linear coefficient of regression
t (s) time
T (oC) temperature
T (oC) temperature
iT (oC) average temperature
U (W/m2.K) overall heat loss coefficient
V (m/s) wind speed
X experimental or simulated parameter
Greek symbols absorptivity
eff)( product of effective absorptivity and transmissivity
(1/K) thermal expansion coefficient
difference in pressure, temperature, time emissivity (%) efficiency (kg/m3) density
(W/m2.K4) Stefan–Boltzmann’s constant (N.s/m2) viscosity
transmissivity
Subscripts
a ambient
c collector, convective
des desired
eff effective
el electrical
en energy
ev evaporative
exp experimental
g glass cover
i i-th parameter
in inlet

Energy analysis of a stepped cascade solar still connected to photovoltaic thermal collector
4824
loss loss
net net
out outlet
p absorber plate
pump pump
r radiative
ref reference
t top
T tedlar
tT tedlar to top
s still
sim Simulated
sky Sky
solar Solar
v humid air
APPENDIX
The related heat transfer coefficients are defined as follows [7, 13, 17]
5for 38.2 wwagc, VVh
5for 8.27.5 wwac,g VVh
skyg
4
sky
4
g
gskygr,
)273()273(
TT
TTh
6asky TT
gwc,gwev,gwr,gw hhhh
)546]()273()273[( gw
2
g
2
weffgwr, TTTTh
1
gw
eff 111
gw
gw
gwc,gwev, 01623.0TT
PPhh
22.0
vv
gwc, Pr22.1 rGd
kh
2
v
2
v
3
v
TgdrG
)109.268(
)273)(()(
w
3
wgwgw
P
TPPTTT
273
5144317.25exp
w
wT
P
273
5144317.25exp
g
gT
P
Hedayati-Mehdiabadi et al. / International Journal of Automotive and Mechanical Engineering 14(4) 2017 4805-4825
4825
v
vvvPr
k
C
2
gw
i
TTT
273
44.353
i
v
T
3
i
82
i
4
iv 107581.6100101.11434.02.999 TTTC
i
4
v 107673.00244.0 Tk
273
1
i
v
T
70for ) 0047974.0 13132.0 79.94710( 4935.2 i
3
i
2
ii
6
fg TTTTh
70for )6.76110( 1615.3 ii
6
fg TTh


![and... · Web viewA plastic water purifier was designed by Ward [18]. Velmurugan et al [19] designed and analyzed a stepped still. Also Velmurugan et al [20] used a stepped still](https://img.pdfslide.us/doc/110x75/5e8b88112b43e83205338b1a/and-web-view-a-plastic-water-purifier-was-designed-by-ward-18-velmurugan.jpg)