Embed Size (px)
Citation preview
Energy Policy 45 (2012) 142–151
Contents lists available at SciVerse ScienceDirect
Energy Policy
0301-42
doi:10.1
n Corr
E-m
journal homepage: www.elsevier.com/locate/enpol
Energy analysis and environmental impacts of microalgal biodiesel in China
Liao Yanfen n, Huang Zehao, Ma Xiaoqian
Electric Power College, South China University of Technology, Guangzhou, China
a r t i c l e i n f o
Article history:
Received 21 May 2011
Accepted 3 February 2012Available online 15 March 2012
Keywords:
Life cycle assessment
Microalgae
Biodiesel
15/$ - see front matter & 2012 Elsevier Ltd. A
016/j.enpol.2012.02.007
esponding author: Tel.: þ86 20 87110281; fa
ail address: [email protected] (L. Yanfen).
a b s t r a c t
The entire life cycle of biodiesel produced by microalgal biomasses was evaluated using the method of
life cycle assessment (LCA) to identify and quantify the fossil energy requirements and environmental
impact loading of the system. The life cycle considers microalgae cultivation, harvesting, drying, oil
extraction, anaerobic digestion, oil transportation, esterification, biodiesel transportation and biodiesel
combustion. The investigation results show that the fossil energy requirement for the biodiesel
production is 0.74 MJ/MJ biodiesel, indicating that 1 MJ of biodiesel requires an input of 0.74 MJ of
fossil energy. Accordingly, biodiesel production is feasible as an energy producing process. The
environmental impact loading of microalgal biodiesel is 3.69 PET2010 (Person Equivalents, Targeted,
in 2010) and the GWP is 0.16 kg CO2-eq/MJ biodiesel. The effects of photochemical ozone formation
were greatest among all calculated categorization impacts. The fossil energy requirement and GWP in
this operation were found to be particularly sensitive to oil content, drying rate and esterification rate.
Overall, the results presented herein indicate that the cultivation of microalgae has the potential to
produce an environmentally sustainable feedstock for the production of biodiesel.
& 2012 Elsevier Ltd. All rights reserved.
1. Introduction
Global warming has become an important environmentalconcern, and the renewable clean energy is required to replacefossil fuels and reduce CO2 emissions (Amin, 2009). Microalgae isa prospective feedstock for biodiesel production that has receiveda great deal of interest owing to its many advantages over otherfeedstocks. Specifically, microalgae can be produced year round;therefore, the oil productivity of microalgae cultivation exceedsthe yield of the best oilseed crops. Furthermore, microalgae haverapid growth potential and their oil content ranges from 20 to 50%(Brennan and Owende, 2010) of their dry weight. Moreover, theexponential growth rates of microalgae enable them to doubletheir biomass in periods as short as 3.5 h. Finally, microalgae canbe cultivated in brackish water on non-arable land. As a result,microalgae cultivation may not result in land-use changes,thereby without compromising the production of food, fodderand other products derived from crops (Brennan and Owende,2010).
Owing to these advantages, many countries including Canadaand the United States have shown great interest in the use ofmicroalgae for practical applications. Government organizations andmajor corporations are beginning to invest in the biofuels marketfor both research and commercial production (Campbell, 2008).
ll rights reserved.
x: þ86 20 87110613.
It has been reported that the concentrations of microalgalbiomass could reach 2–7.7 kg (dry biomass)/m3 (Mata et al.,2010), while the oil content could reach 35–40% of the dry cellmass (Stephenson et al., 2010a). Moreover, it has been estimatedthat microalgae can produce 40 t ha�1 year�1 of biodiesel withfurther optimization of their cultivation, harvesting and oilextraction (Stephenson et al., 2010b).
However, there are still some controversial issues associatedwith microalgae. For example, it is not clear if microalgalbiodiesel can produce positive net energy since there are manyenergy consumption processes involved in the entire productionchain of biodiesel made from microalgal biomass, especially thedrying process (Campbell et al., 2011; Stephenson et al., 2010b).Additionally, the global warming potential (GWP) of microalgalbiodiesel is unknown, and it is not clear if it is environmentallyfriendly. Some studies have been conducted to assess the envir-onmental performance of microalgal biodiesel. Lardon et al.(2009) reported that the GWP of biodiesel from Chlorella vulgaris
cultivated under nitrogen-deprived conditions was lower thanthat of fossil-derived diesel, but higher than that of biodieselproduced from oilseed rape or palm oil. Sialve et al. (2009)pointed out that anaerobic digestion of microalgal residue couldbalance the economy and energy, as well as solve the problem ofwaste disposal. When the oil content of microalgal cell does notexceed 40% of its dry weight, anaerobic digestion of the entirebiomass appears to be the optimal strategy for energetic recoveryof the cell biomass on an energy balance basis. Stephenson et al.(2010b) found that if a microalgal oil yield of 40 t ha�1 year�1
L. Yanfen et al. / Energy Policy 45 (2012) 142–151 143
could be achieved, cultivation in typical raceways would besignificantly more environmentally sustainable than in closedair-lift tubular bioreactors.
In China, especially South China, there are excellent conditionsfor microalgae cultivation because of the vast sea area. Indeed,Guangdong Province alone has more than 8500 km of coastline.Furthermore, the annual average temperature in this region isgreater than 20 1C, which is appropriate for large-scale microalgaecultivation. Some investigations related to the utilization ofmicroalgae for biofuel have been conducted; however, no energyanalyses or environmental impact assessments of microalgalbiodiesel have been conducted to date. Therefore, this studywas conducted to identify and quantify the fossil energy require-ment and environmental impacts of microalgal biodiesel in China.The life-cycle assessment method was adopted to analyzethe energy requirements and total air pollutant emissions of theentire production process from microalgae cultivation to thedisposal of residual waste, and sensitivity analysis was conductedto identify the most significant impact sources.
2. Methodology
2.1. Overall approach
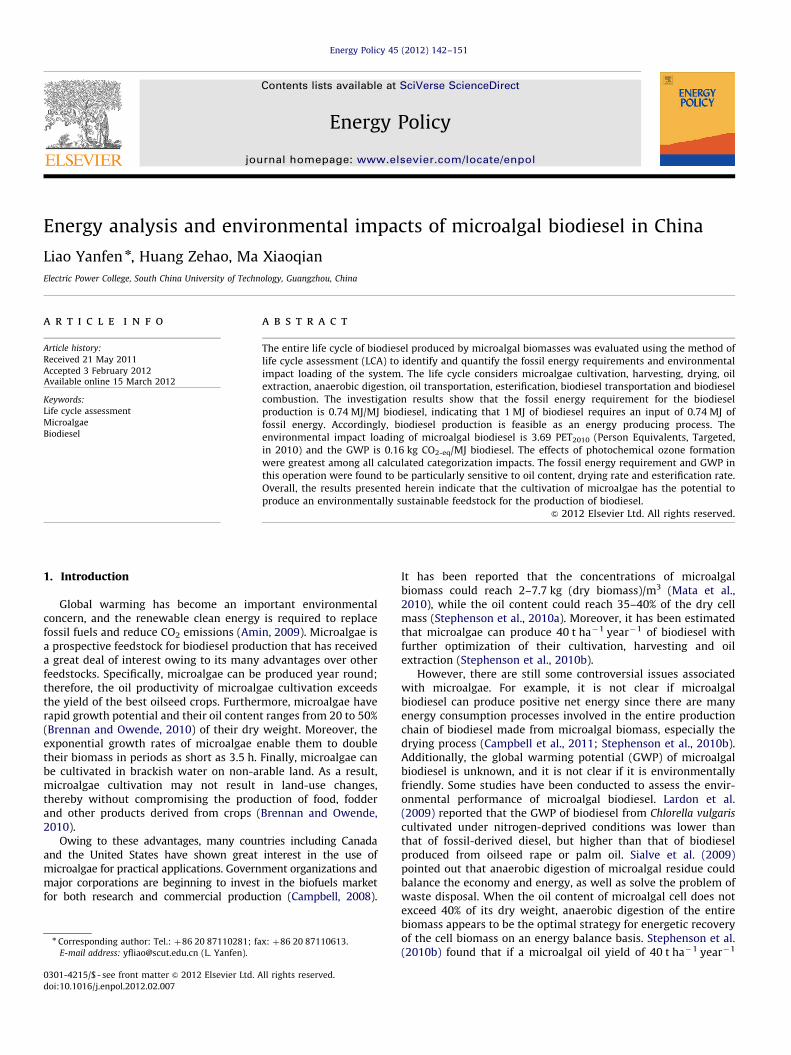
Currently, there is no commercial microalgae cultivation forbiodiesel production in China; therefore, a hypothetical scenariofor a likely processing method was developed based on thefollowing assumptions (Fig. 1):
(1)
The biodiesel from microalgae was burned in a car byblending with conventional fossil derived diesel according toa given volume ratio.(2)
After oil extraction, the algae-residue was sent to anaerobicdigestion for biogas generation. The biogas from anaerobicdigestion would be burned onsite to satisfy the heat require-ments of the drying process. If the amount of biogas wasinsufficient, natural gas would be used to supplement the heat.(3)
The control volume was expanded by incorporating thecombustion of biogas mentioned above into the system.(4)
The flue gas from a nearby power plant was used as thecarbon source for microalgae cultivation.(5)
The operational lifetime of the system was designed to be aslong as 20 years, and the environmental impacts from theinitial construction and other small factors could be ignoredalgae-residue
Drying
Oil Extraction(cell disruption andsolvent extraction)
Anaerobic digestion(hydrdysis, fermentation
and methanogenesis)
Transport ofOil
Algal Cultivation & Harvesting
Fertilizer
Electricity
direct emission during these processes
indirect emission associated with the production o
HeatingBiogas
CO
Fig. 1. Simplified process chain for micro
when compared with the operational emissions. Therefore,the system boundaries of LCA were set to exclude theproduction facility and its construction.
2.2. Definition of goal and scope
In this paper, the chosen functional unit was defined as 1 t ofmicroalgal biodiesel.
The scope of the study included the entire life cycle ofmicroalgal biodiesel, which began with microalgae culture, tothe use of biodiesel, and ended with the final disposal of residues.Therefore, the control volume in this study encompassed allstages concerned with microalgal biodiesel production: micro-algae cultivation, harvesting, drying, oil extraction, anaerobicdigestion, oil transportation, esterification, biodiesel transporta-tion and biodiesel combustion. The environmental impactsincluded both the direct emissions during these processes andthe indirect emissions associated with the production of rawmaterials and energy, such as electricity, steam and fertilizer.
The goal of this study was to identify the energy requirementsand environmental impact loading of microalgal biodiesel, and toseek ways to reduce energy consumption, thereby supporting thedecision-making policy for the Chinese government. The objec-tives of the environmental impact assessment include: (1) green-house gas emissions, (2) acid gas emissions, (3) nutrient-richemissions, (4) photochemical ozone formation.
3. Unit process and life cycle inventory
3.1. Data collection and validation of data
In an LCA study, substantial data collection is required todetermine the quantitative mass and energy balances related toeach process in the system. Currently, no microalgal biodieselplants are in operation; therefore, a large amount of data relatedto microalgae culture, harvesting, drying, and extraction werecollected from literature surveys or laboratory data. The netenergy consumption and waste gas emissions of electricity gen-eration were taken from statistical data generated in China, aswell as the Chinese industrial standards. Additionally, some datapertaining to diesel combustion in vehicles was obtained fromjournals and books published in China. The data references areshown in Table 1.
EsterficationTransport of
BiodieselBiodiesel
Combustion
MethanolDiesel oil
f the raw material and energy
By-product glycerol
algal biodiesel production.

Table 1Data resource.
Unit process Item Data source
Feedstock production Cultivation, harvest and treatment Stephenson et al. (2010a), Stephenson et al. (2010b),
Lardon et al. (2009), Chisti (2007), Collet and Helias (2011)
Assistant material production (Fertilizer) Xing et al. (2010b), Zhu (2008)
Microalgal oil production Microalgal oil extraction and refining Stephenson et al. (2010b), Xing et al. (2010a)
Biodiesel production Esterification Stephenson et al. (2010b)
Assistant material production (methanol) Xing et al. (2010a), Zhu (2008)
Co-product (glycerol) Stephenson et al. (2010b)
Anaerobic digestion Digestion and biogas combustion Campbell et al. (2011), Tian et al. (2002)
Transport Energy consumption and waste gas emissions Yang et al. (2002)
Biodiesel combustion Data in car Stephenson et al. (2010b), Zhu, (2008),
Xin et al. (2001), GB 18352.3-2005
Electricity (by coal and natural gas) Energy consumption and waste gas emissions Zhu (2008)
CO2 Solar
Algae cultivationFertilizer: N,P,K
Flocculant Harvesting(Sedimentation,centrifugation)
Drying
Dried Microalgae
Heating
ElectricityCentrifuge, Pumps,
Compress, et,al
Biogas production(hydrolysis,
fermentation andmethanogenesis)
Fig. 2. Flow diagram of microalgae cultivation and treatment.
L. Yanfen et al. / Energy Policy 45 (2012) 142–151144
Based on the site investigation and presented surveys, somegeneral assumptions were set for the production system:
(1)
Microalgae biomass growing rate (Chisti, 2007): 0.035 kg(dry)/(m2 d);(2)
The oil content in microalgae (Stephenson et al., 2010a): 40%of the dry cell mass;(3)
After drying, the dry cell mass content (Lardon et al., 2009):90 wt%;(4)
Cell disruption rate for homogenization (Stephenson et al.,2010b): 96%;(5)
Oil extraction rate from dry cell mass (Stephenson et al.,2010b): 99%;(6)
Esterification rate (Xing et al., 2010a): 85%; (7) Functional unit: 1000 kg microalgal biodiesel; (8) Microalgal biodiesel calorific value (Stephenson et al., 2010b):37.2 MJ/kg;
(9) Microalgal biodiesel consumption: 8.4 L/100 km based on usein a compression-ignition direct injection vehicle.
According to the assumptions, 3.1 t dry microalgae wasneeded to produce one unit of microalgal biodiesel.
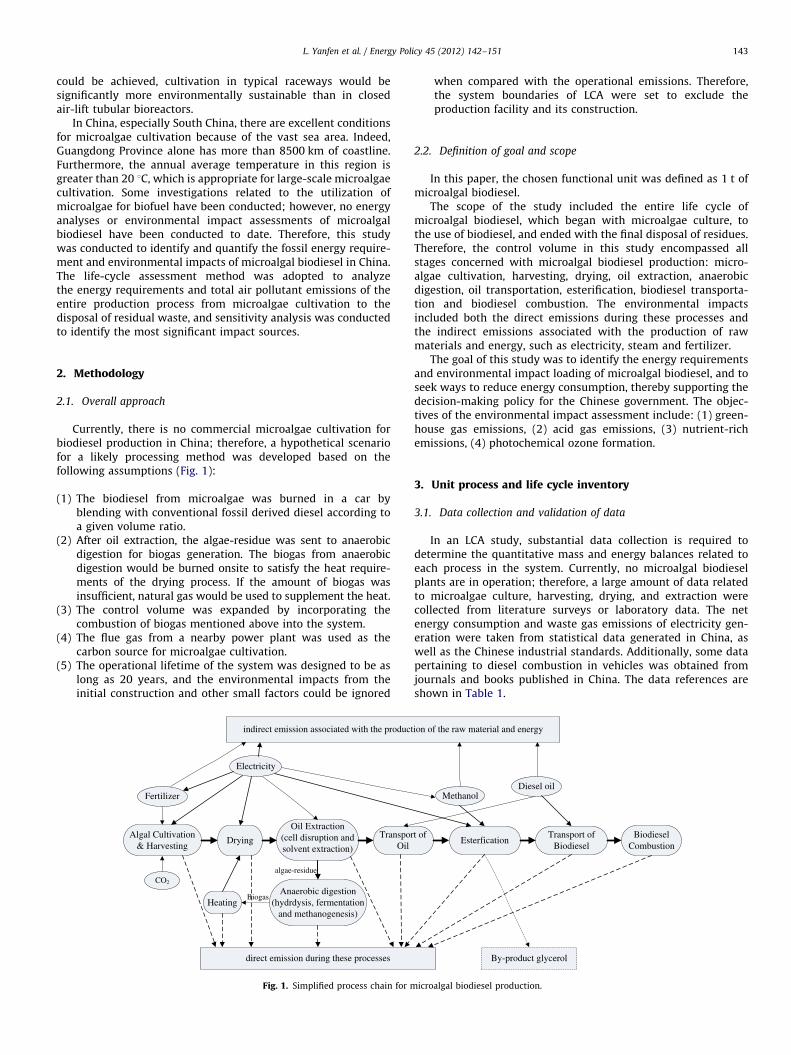
3.2. Cultivation and treatment of microalgae
Temperature and sunlight are the most important factorsaffecting photosynthesis, metabolic activities, and the oil contentof microalgae; thus, waterfront cities in South China are suitablefor large-scale microalgae cultivation. For example, in ZhanjiangCity, the coastline is about 1244 km and the shallow beach area isgreater than 10 million hectares.
Assuming 5% of the shallow beach was used for algae cultiva-tion, a microalgal biodiesel production base with a biodiesel
capacity of 200,000–300,000 t/year could be constructed, thus, a200,000 t/year microalgal biodiesel project was assumed in thisstudy. Before microalgal oil extraction and refining, the wetmicroalgae biomass was harvested by sedimentation ponds andcentrifuges, after which it was dried. Fig. 2 shows the systemdiagram for production of dried microalgae.
3.2.1. Cultivation of microalgae
Currently, there are two main methods used for large-scalecultivation of microalgae: raceway ponds culture and tubularphoto-bioreactor culture. In this study, the former was adoptedbased on construction and operating expenses, and the exhaustCO2 from a gas-fired power plant was used as a carbon source.Chlorella was selected as the raw material, and was cultivatedusing a two-stage method (Courchesne et al., 2009; Schenk et al.,2008). The microalgal cells were first grown under nitrogen-sufficient conditions until a high concentration of biomass wasobtained, after which the supply of nitrogen was discontinued;thus, the cells accumulated triglycerides. To ensure good trans-parency, the depth of the ponds was designed to be 30 cm.
The quantities of carbon dioxide and fertilizers required formicroalgae culture were determined based on the experimentallymeasured microalgae composition. For 1 t of dry microalgae,1833.33 kg, 61 kg, 8.1 kg and 6.59 kg of CO2, N, P and K wererequired, respectively (Collet and Helias, 2011; Lardon et al.,2009). Assuming that the nutrients were urea (CON2H4), P2O5
and K2O, the amounts of urea, P2O5 and K2O required for 1 t ofmicroalgal biodiesel production were 404.52 kg, 57.41 kg and24.58 kg, respectively. The energy consumption and waste gasemissions from chemical fertilizers used for 1 t of microalgalbiodiesel based on the available data describing fertilizer produc-tion in China are shown in Table 2 (Xing et al., 2010b; Zhu, 2008).

Table 2Energy consumption and waste gas emissions from chemical fertilizers for production of 1 t biodiesel.
Fertilizer Total
CON2H4 P2O5 K2O
Energy consumption Electricity kWh ton�1 1.24 3.39 0.9 5.53
Coal kg/ton 5.59 16.1 4.1 25.79
Diesel kg/ton 0.78 9.7 1.29 11.77
Natural gas m3/ton 21.88 11.21 0.74 33.83
Waste gas emissions HC g/ton 234.62 70.59 14.33 319.54
CO g/ton 1735.38 47.65 7.77 1790.8
NOx g/ton 13074.02 272.7 85.31 13432.03
PM10 g/ton 14566.69 22.39 29.69 14618.77
SOx g/ton 2103.49 161.33 91.16 2355.98
CH4 g/ton 4819.11 163.73 22.02 5004.86
N2O g/ton 1650.68 1.45 0.17 1652.3
CO2 g/ton 4193232.22 90996.69 16110.19 4300339.1
Table 3Energy consumption and waste gas emissions in the microalgae cultivation, harvesting and drying process for production of 1 t
biodiesel.
Microalgae cultivation and harvesting Drying
Energy consumption Standard coal (kg/ton of biodiesel) 401.42 42.08
Natural gas (m3/ton of biodiesel) / 805.08
Diesel (kg/ton of biodiesel) / /
Waste gas emissions
(g/ton of biodiesel)
VOC 103.05 100.10
CO 1168.95 1481.68
NOx 9152.70 3604.96
PM10 3380.73 476.75
SOx 10347.27 1084.67
CH4 1356.50 178.59
N2O 12.55 37.70
CO2 �4424298.56a 2889925.51
a CO2 is taken out of the atmosphere during growth of the microalgae.
L. Yanfen et al. / Energy Policy 45 (2012) 142–151 145
The exhaust gas from the power plant that would be utilized asthe carbon source has a CO2 content of 11.7 vol%. To utilize theexhaust, it would be pressurized and injected into the pond throughPVC pipes (Campbell et al., 2011). It was assumed that 75% of theCO2 was captured by the microalgae. Furthermore, 0.0222 kWh ofelectricity was required per kg of CO2 (Lardon et al., 2009).
In the raceway pond, a paddle wheel was used to mix freshmicroalgae and fertilizers, and baffles were located around theturnings for guiding the flow. The energy consumption of thepaddle wheel was 35 kWh for 1 t dry microalgae (Collet andHelias, 2011).
3.2.2. Harvesting
After the second growing stage, the final concentration ofbiomass could reach 1.7 kg/m3 (Stephenson et al., 2010b), and thebiomass would be harvested behind the paddle wheel (Chisti,2007).
The microalgal slurry would first be sent to sedimentation pondsto increase the microalgae concentration to about 42.5 kg/m3.Aluminum sulfate would be applied at about 0.1 kg/m3 as aflocculant, which is known to be effective for Chlorella. The liquidwith flocculant and remnant microalgae would be pumped back tothe cultivation facilities, while the microalgal slurry would bepumped to the centrifugation stage and the mechanical energyconsumption would be 720 kJ/m3 (Stephenson et al., 2010b).
After centrifugation, the outlet density of the microalgal slurrywould be 220 kg/m3, requiring about 28.8 MJ/m3 of electricity(Stephenson et al., 2010b). The flocculant dosage was small andcould be recycled; thus, the energy consumption and environmentalemissions associated with the flocculant were ignored in this study.
3.2.3. Drying
To improve oil extraction efficiency, the concentrated microalgalslurry was subjected to the drying process (Grima et al., 2003). Theheating temperature was controlled at about 150–170 1C to preventpyrolysis of the microalgae. The weight of dry biomass after thisprocess could reach up to 90% (Lardon et al., 2009).
The heating requirement would be supplied by biogas combus-tion in an industrial furnace, which would be produced from thealgae-residue anaerobic digestion. If the biogas produced was notsufficient, natural gas would be used to supplement the biogas.The heat transfer efficiency of the dryer was assumed to be 90%.
In the above three unit process, there were a large amount ofmaterial inputs, energy consumption and waste gas emissions(Table 3). In order to show the carbon sink function of the growthof microalgae, the total energy consumption and waste gas emissionsfrom microalgae cultivation and harvesting were added, excludingthose from chemical fertilizers, which are shown in Table 2.
3.3. Microalgal oil extraction and refining
The microalgal oil was extracted and refined on site. Homo-genization would be used to break open the cells to make thetriglycerides accessible to solvent extraction. The electricityrequired to operate the homogenizer was calculated to be18.61 kWh/m3 of microalgal slurry. Experiments indicated that79 wt% (Stephenson et al., 2010b) of Chlorella cells were dis-rupted per pass; therefore, it was assumed that two passes wouldbe employed and 96% of the cells would be disrupted.
The microalgal oil would be extracted from the lysed cellsusing hexane as a solvent. The volumetric flow rate ratio of thesolvent to microalgal slurry was set as 0.5 and the temperature
L. Yanfen et al. / Energy Policy 45 (2012) 142–151146
was controlled at 50 1C. After being mixed, stratified and sepa-rated, the equilibrium between the extraction phase and theraffinate phase could be reached at each stage, resulting in99 wt% recovery of the triglycerides after five equilibrium stages.The electricity required was calculated to be 22.4 MJ/m3 ofmicroalgal slurry (Stephenson et al., 2010b).
The solvent stream containing the dissolved oil would be sentto a stripper column for separation. This oil-refining process wasassumed to be the same as that used for rapeseed oil in China. Therefined microalgal oil was collected from the bottom of thestrippers, and the total heating requirement would be 1.88 MJ(Stephenson et al., 2010b).
Since more than 99.5% of the hexane would be recovered fromthe top of stripper, the consumption of hexane was low; thus, theenvironmental impacts associated with hexane were ignored.
In this unit process, raw coal and electricity were the majorenergy sources consumed. These compounds were converted tostandard coal according to the energy conversion coefficients. Theenergy consumption and waste gas emissions are shown in Table 4.
3.4. Transport of microalgal oil and biodiesel
The refined oil would be transported to a biodiesel productionplant, and the biodiesel product would subsequently be transportedto a petrochemical company, where it would be blended withfossil-derived diesel to be used as a vehicle fuel. Some assumptionswere made to simplify this unit process.
(1)
TablEner
refin
En
co
W
em
(g/
bio
All transportation is by truck (5 t capacity, diesel only);
(2) The average transportation distance from the microalgalculture plant to the biodiesel production plant is 100 km;
e 4gy consumption and waste gas emissions in the microalgal oil extraction and
ing process for production of 1 t biodiesel.
Microalgal oil extraction and
refining
ergy
nsumption
Standard coal (kg/ton of
biodiesel)
50.85
Natural gas (m3/ton of
biodiesel)
/
Diesel (kg/ton of biodiesel) /
aste gas
issions
ton of
diesel)
VOC 13.04
CO 147.96
NOx 1157.98
PM10 427.66
SOx 1308.90
CH4 171.60
N2O 1.59
CO2 158155.01
Table 5Energy consumption and waste gas emissions in the transport of mic
Energy consumption Standard coal (kg/ton of biodiesel)
Natural gas (m3/ton of biodiesel)
Diesel (kg/ton of biodiesel)
Waste gas emissions
(g/ton of biodiesel)
VOC
CO
NOx
PM10
SOx
CH4
N2O
CO2
(3)
roalg
The average transportation distance from the microalgalbiodiesel plant to the petrochemical company is 25 km;
According to the average level of road transport in China, theunit diesel consumption is 0.067 L/(t km).
In this unit process, waste gas emissions were due to thetransport of refined microalgal oil and biodiesel by truck. Energyconsumption and waste gas emissions from the transport ofmicroalgal oil and biodiesel based on the former assumptionsare shown in Table 5.
3.5. Anaerobic digestion and biogas combustion
The anaerobic digestion process occurred in three sequentialstages, hydrolysis, fermentation and methanogenesis.
It was assumed that the algae-residue was mainly composedof protein and carbohydrate in a mass ratio of 1:1.75. Theanaerobic digestion method was employed to produce methane.Based on large and medium-sized biogas projects in China,980 m3 biogas, approximately 50% of which is methane, can beproduced from 1 t of protein, while 750 m3 biogas, about 49%of which is methane, could be generated from 1 t of sugar(Tian et al., 2002). In addition, the waste gas emission duringthe anaerobic digestion process cited the data from a biomassanaerobic digestion project in China.
Based on the above assumptions, the biogas would be burnedonsite to provide heat for the drying process. Therefore, themethod of allocation by substitution was employed in the study.In the biogas combustion process, the CO2 emission was calcu-lated from the carbon balance, and other waste gas emissionswere determined according to the reported industrial furnaceemissions in China (Zhu, 2008).
The energy consumption and waste gas emissions associatedwith this process are shown in Table 6.
3.6. Esterification
In the esterification process, microalgal oil would be reactedwith methanol to produce biodiesel, and the acid (sulfuric acid)catalyst method would be adopted owing to the high levels of freefatty acids contained in microalgal oil. Because the amount ofcatalyst consumed was small, the corresponding environmentalimpact was ignored.
It was assumed that the steps and equipment required formicroalgal biodiesel production were similar to those used forrapeseed biodiesel. The esterification rate was set as 85%, themethanol consumption for 1 t of biodiesel production was 0.1 tand the power consumption for equipment operation was8.04 kWh (Xing et al., 2010a). According to China’s currentproduction and energy consumption of methanol, the totalstandard coal consumption for production of 1 t of methanol
al oil and biodiesel process for production of 1 t biodiesel.
Microalgal oil transport Biodiesel transport
/ /
/ /
6.68 1.42
11.38 2.42
41.16 8.75
105.10 22.33
2.81 0.60
6.20 1.32
0.54 0.12
1.03 0.22
19547.82 4153.91
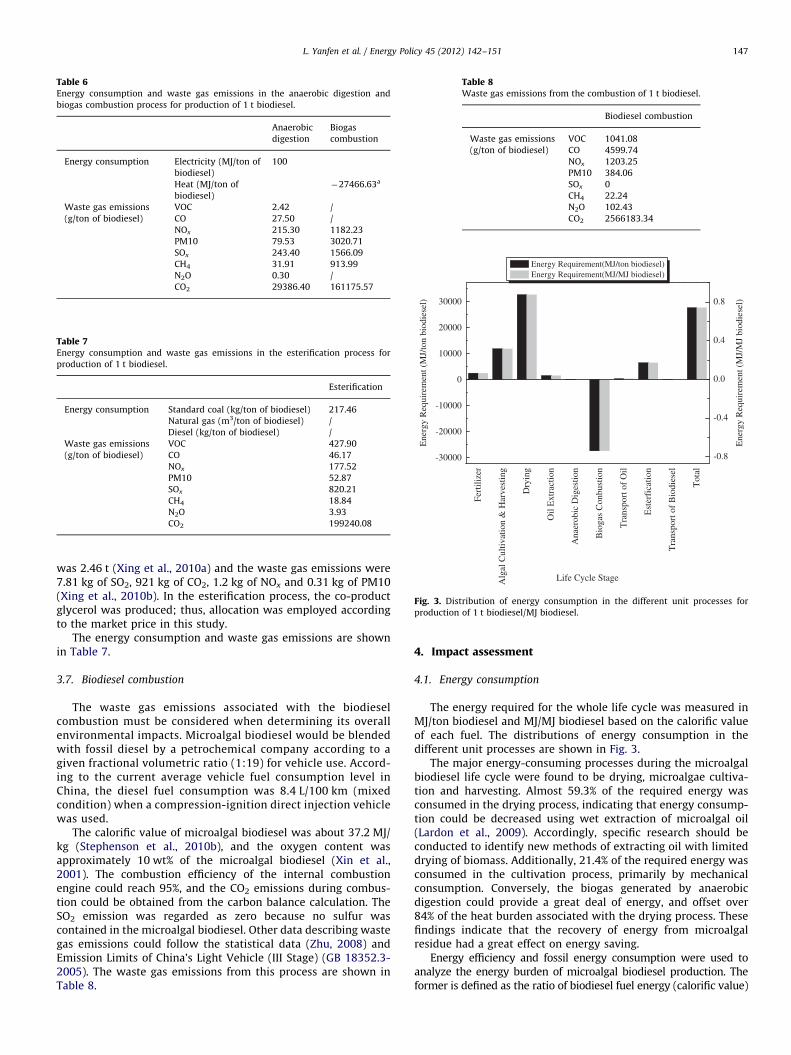
Table 7Energy consumption and waste gas emissions in the esterification process for
production of 1 t biodiesel.
Esterification
Energy consumption Standard coal (kg/ton of biodiesel) 217.46
Natural gas (m3/ton of biodiesel) /
Diesel (kg/ton of biodiesel) /
Waste gas emissions
(g/ton of biodiesel)
VOC 427.90
CO 46.17
NOx 177.52
PM10 52.87
SOx 820.21
CH4 18.84
N2O 3.93
CO2 199240.08
Table 8Waste gas emissions from the combustion of 1 t biodiesel.
Biodiesel combustion
Waste gas emissions
(g/ton of biodiesel)
VOC 1041.08
CO 4599.74
NOx 1203.25
PM10 384.06
SOx 0
CH4 22.24
N2O 102.43
CO2 2566183.34
-0.8
-0.4
0.0
0.4
0.8
Fert
ilize
r
Alg
al C
ultiv
atio
n &
Har
vest
ing
Dry
ing
Oil
Ext
ract
ion
Ana
erob
ic D
iges
tion
Bio
gas
Con
bust
ion
Tra
nspo
rt o
f O
il
Est
erfi
catio
n
Tra
nspo
rt o
f B
iodi
esel
Tot
al
-30000
-20000
-10000
0
10000
20000
30000
Ene
rgy
Req
uire
men
t (M
J/to
n bi
odie
sel)
Life Cycle Stage
Energy Requirement(MJ/ton biodiesel) Energy Requirement(MJ/MJ biodiesel)
Ene
rgy
Req
uire
men
t (M
J/M
J bi
odie
sel)
Fig. 3. Distribution of energy consumption in the different unit processes for
production of 1 t biodiesel/MJ biodiesel.
Table 6Energy consumption and waste gas emissions in the anaerobic digestion and
biogas combustion process for production of 1 t biodiesel.
Anaerobic
digestion
Biogas
combustion
Energy consumption Electricity (MJ/ton of
biodiesel)
100
Heat (MJ/ton of
biodiesel)
�27466.63a
Waste gas emissions
(g/ton of biodiesel)
VOC 2.42 /
CO 27.50 /
NOx 215.30 1182.23
PM10 79.53 3020.71
SOx 243.40 1566.09
CH4 31.91 913.99
N2O 0.30 /
CO2 29386.40 161175.57
L. Yanfen et al. / Energy Policy 45 (2012) 142–151 147
was 2.46 t (Xing et al., 2010a) and the waste gas emissions were7.81 kg of SO2, 921 kg of CO2, 1.2 kg of NOx and 0.31 kg of PM10(Xing et al., 2010b). In the esterification process, the co-productglycerol was produced; thus, allocation was employed accordingto the market price in this study.
The energy consumption and waste gas emissions are shownin Table 7.
3.7. Biodiesel combustion
The waste gas emissions associated with the biodieselcombustion must be considered when determining its overallenvironmental impacts. Microalgal biodiesel would be blendedwith fossil diesel by a petrochemical company according to agiven fractional volumetric ratio (1:19) for vehicle use. Accord-ing to the current average vehicle fuel consumption level inChina, the diesel fuel consumption was 8.4 L/100 km (mixedcondition) when a compression-ignition direct injection vehiclewas used.
The calorific value of microalgal biodiesel was about 37.2 MJ/kg (Stephenson et al., 2010b), and the oxygen content wasapproximately 10 wt% of the microalgal biodiesel (Xin et al.,2001). The combustion efficiency of the internal combustionengine could reach 95%, and the CO2 emissions during combus-tion could be obtained from the carbon balance calculation. TheSO2 emission was regarded as zero because no sulfur wascontained in the microalgal biodiesel. Other data describing wastegas emissions could follow the statistical data (Zhu, 2008) andEmission Limits of China’s Light Vehicle (III Stage) (GB 18352.3-2005). The waste gas emissions from this process are shown inTable 8.
4. Impact assessment
4.1. Energy consumption
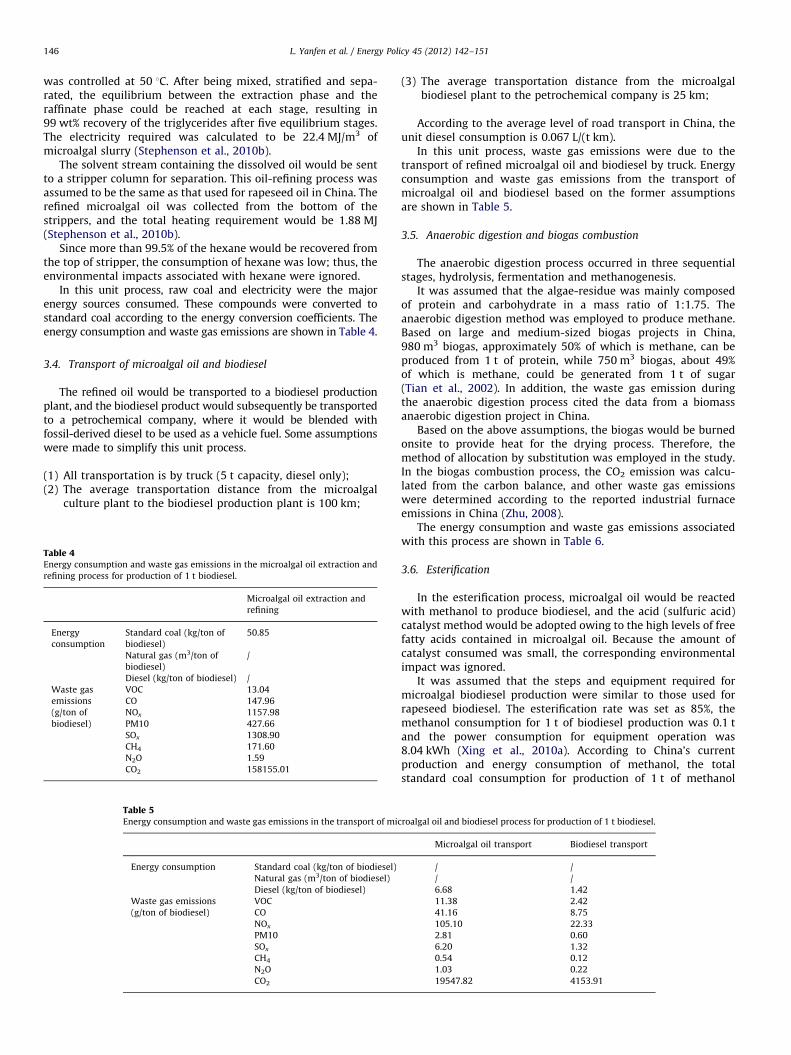
The energy required for the whole life cycle was measured inMJ/ton biodiesel and MJ/MJ biodiesel based on the calorific valueof each fuel. The distributions of energy consumption in thedifferent unit processes are shown in Fig. 3.
The major energy-consuming processes during the microalgalbiodiesel life cycle were found to be drying, microalgae cultiva-tion and harvesting. Almost 59.3% of the required energy wasconsumed in the drying process, indicating that energy consump-tion could be decreased using wet extraction of microalgal oil(Lardon et al., 2009). Accordingly, specific research should beconducted to identify new methods of extracting oil with limiteddrying of biomass. Additionally, 21.4% of the required energy wasconsumed in the cultivation process, primarily by mechanicalconsumption. Conversely, the biogas generated by anaerobicdigestion could provide a great deal of energy, and offset over84% of the heat burden associated with the drying process. Thesefindings indicate that the recovery of energy from microalgalresidue had a great effect on energy saving.
Energy efficiency and fossil energy consumption were used toanalyze the energy burden of microalgal biodiesel production. Theformer is defined as the ratio of biodiesel fuel energy (calorific value)
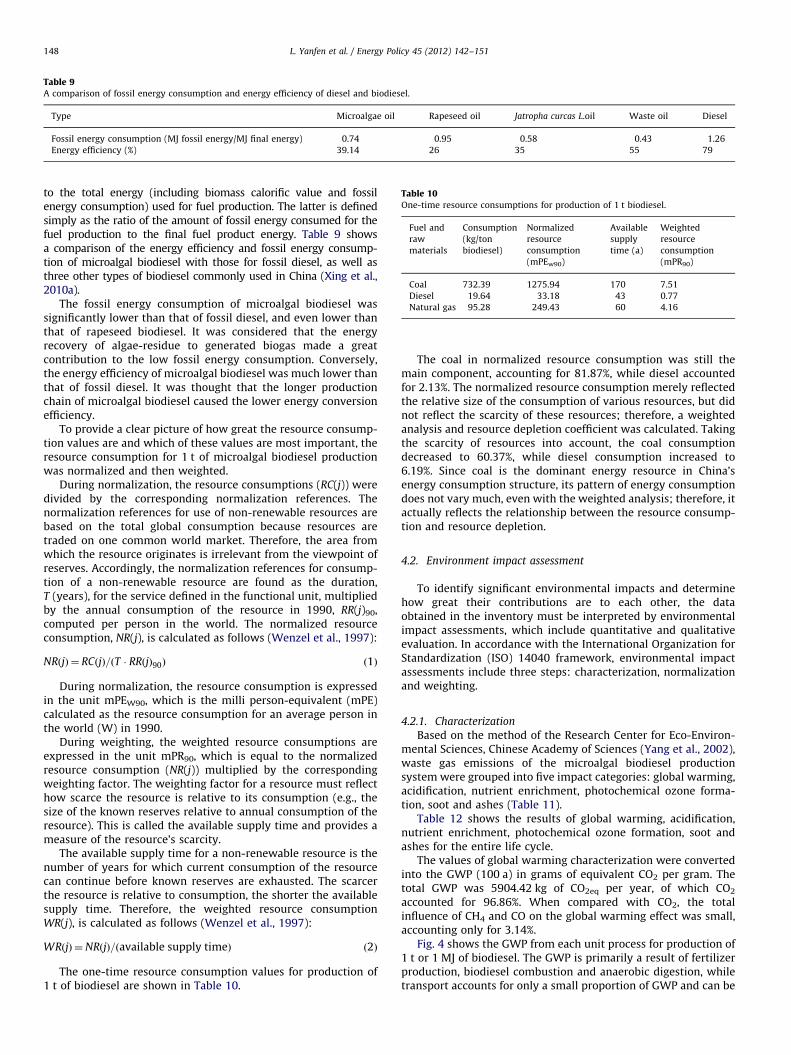
Table 9A comparison of fossil energy consumption and energy efficiency of diesel and biodiesel.
Type Microalgae oil Rapeseed oil Jatropha curcas L.oil Waste oil Diesel
Fossil energy consumption (MJ fossil energy/MJ final energy) 0.74 0.95 0.58 0.43 1.26
Energy efficiency (%) 39.14 26 35 55 79
Table 10One-time resource consumptions for production of 1 t biodiesel.
Fuel and
raw
materials
Consumption
(kg/ton
biodiesel)
Normalized
resource
consumption
(mPEw90)
Available
supply
time (a)
Weighted
resource
consumption
(mPR90)
Coal 732.39 1275.94 170 7.51
Diesel 19.64 33.18 43 0.77
Natural gas 95.28 249.43 60 4.16
L. Yanfen et al. / Energy Policy 45 (2012) 142–151148
to the total energy (including biomass calorific value and fossilenergy consumption) used for fuel production. The latter is definedsimply as the ratio of the amount of fossil energy consumed for thefuel production to the final fuel product energy. Table 9 showsa comparison of the energy efficiency and fossil energy consump-tion of microalgal biodiesel with those for fossil diesel, as well asthree other types of biodiesel commonly used in China (Xing et al.,2010a).
The fossil energy consumption of microalgal biodiesel wassignificantly lower than that of fossil diesel, and even lower thanthat of rapeseed biodiesel. It was considered that the energyrecovery of algae-residue to generated biogas made a greatcontribution to the low fossil energy consumption. Conversely,the energy efficiency of microalgal biodiesel was much lower thanthat of fossil diesel. It was thought that the longer productionchain of microalgal biodiesel caused the lower energy conversionefficiency.
To provide a clear picture of how great the resource consump-tion values are and which of these values are most important, theresource consumption for 1 t of microalgal biodiesel productionwas normalized and then weighted.
During normalization, the resource consumptions (RC(j)) weredivided by the corresponding normalization references. Thenormalization references for use of non-renewable resources arebased on the total global consumption because resources aretraded on one common world market. Therefore, the area fromwhich the resource originates is irrelevant from the viewpoint ofreserves. Accordingly, the normalization references for consump-tion of a non-renewable resource are found as the duration,T (years), for the service defined in the functional unit, multipliedby the annual consumption of the resource in 1990, RR(j)90,computed per person in the world. The normalized resourceconsumption, NR(j), is calculated as follows (Wenzel et al., 1997):
NRðjÞ ¼ RCðjÞ=ðT � RRðjÞ90Þ ð1Þ
During normalization, the resource consumption is expressedin the unit mPEW90, which is the milli person-equivalent (mPE)calculated as the resource consumption for an average person inthe world (W) in 1990.
During weighting, the weighted resource consumptions areexpressed in the unit mPR90, which is equal to the normalizedresource consumption (NR(j)) multiplied by the correspondingweighting factor. The weighting factor for a resource must reflecthow scarce the resource is relative to its consumption (e.g., thesize of the known reserves relative to annual consumption of theresource). This is called the available supply time and provides ameasure of the resource’s scarcity.
The available supply time for a non-renewable resource is thenumber of years for which current consumption of the resourcecan continue before known reserves are exhausted. The scarcerthe resource is relative to consumption, the shorter the availablesupply time. Therefore, the weighted resource consumptionWR(j), is calculated as follows (Wenzel et al., 1997):
WRðjÞ ¼NRðjÞ=ðavailable supply timeÞ ð2Þ
The one-time resource consumption values for production of1 t of biodiesel are shown in Table 10.
The coal in normalized resource consumption was still themain component, accounting for 81.87%, while diesel accountedfor 2.13%. The normalized resource consumption merely reflectedthe relative size of the consumption of various resources, but didnot reflect the scarcity of these resources; therefore, a weightedanalysis and resource depletion coefficient was calculated. Takingthe scarcity of resources into account, the coal consumptiondecreased to 60.37%, while diesel consumption increased to6.19%. Since coal is the dominant energy resource in China’senergy consumption structure, its pattern of energy consumptiondoes not vary much, even with the weighted analysis; therefore, itactually reflects the relationship between the resource consump-tion and resource depletion.
4.2. Environment impact assessment
To identify significant environmental impacts and determinehow great their contributions are to each other, the dataobtained in the inventory must be interpreted by environmentalimpact assessments, which include quantitative and qualitativeevaluation. In accordance with the International Organization forStandardization (ISO) 14040 framework, environmental impactassessments include three steps: characterization, normalizationand weighting.
4.2.1. Characterization
Based on the method of the Research Center for Eco-Environ-mental Sciences, Chinese Academy of Sciences (Yang et al., 2002),waste gas emissions of the microalgal biodiesel productionsystem were grouped into five impact categories: global warming,acidification, nutrient enrichment, photochemical ozone forma-tion, soot and ashes (Table 11).
Table 12 shows the results of global warming, acidification,nutrient enrichment, photochemical ozone formation, soot andashes for the entire life cycle.
The values of global warming characterization were convertedinto the GWP (100 a) in grams of equivalent CO2 per gram. Thetotal GWP was 5904.42 kg of CO2eq per year, of which CO2
accounted for 96.86%. When compared with CO2, the totalinfluence of CH4 and CO on the global warming effect was small,accounting only for 3.14%.
Fig. 4 shows the GWP from each unit process for production of1 t or 1 MJ of biodiesel. The GWP is primarily a result of fertilizerproduction, biodiesel combustion and anaerobic digestion, whiletransport accounts for only a small proportion of GWP and can be
-0.2
-0.1
0.0
0.1
0.2
0.3
-4000
-2000
0
2000
4000
6000
GW
P (k
g/M
J bi
odie
sel)
GW
P (k
g/to
n bi
odie
sel)
GWP (kg/ton biodiesel)
GWP (kg/MJ biodiesel)
L. Yanfen et al. / Energy Policy 45 (2012) 142–151 149
ignored. If the fertilizer consumption could be reduced, the GWPwould also be reduced. The low-N culture can reduce fertilizerconsumption, but will reduce microalgae yields and potentiallyincrease the GWP associated with production of 1 kg of micro-algae. The growth of microalgae absorbs CO2 from flue gas, whichcan offset almost 42.62% of carbon emissions throughout thelife cycle.
The acidification values were expressed in grams of equivalentSO2/g, which was associated with the emission of SO2 and NOx.The total influence of SO2 on the acidification effect was 42.62%,which was slightly smaller than the contribution of NOx.
The main sources of nutrient enrichment were NOx and NH3
emitted into the atmosphere (Yang and Nielsen, 2001), whichwere expressed in grams of equivalent NO�3eq/g. The nutrientenrichment environmental effect potential was 41.46 kg of NO�3eq/year.
In China, non methane volatile organic compounds (NMVOC),CO and CH4 are considered to be the main contributors tophotochemical ozone formation, which can be expressed in gramsof equivalent C2H4/g. The total influence of NMVOC, 78.57%, madea large contribution to the formation of photochemical ozone.
4.2.2. Normalization and weighting
An appropriate standardized baseline should be selected tonormalize the environmental impact potential (global, regionaland local) and compare their relative sizes. Evaluation of theweighted environment potential of each effect is calculated basedon the simple formula:
weighted environment potential¼equivalent mass
normalization reference�weighting factor ð3Þ
Politically determined environmental targets were selected forweighting by the EDIP method, and 2010 was chosen as the
Table 11Categorization of the impacts.
Resource depletion Energy depletion Global
Environmental
impacts
Global warming (GW) Global
Acidification (AC) Regional
Nutrient enrichment (NE) Regional
Photochemical ozone formation (PO) Regional
Soot and ashes (SA) Local
Table 12The values of different environmental impact categories for production of 1 t biodiesel
Global warming Total emissions (k
CO2 5719.09
CO 9.29
CH4 6.76
Total
Acidification Total emissions (k
SO2 15.97
NOx 30.71
Total
Nutrient enrichment Total emissions (k
NOx 30.71
Photochemical ozone formation Total emissions (k
VOC 2.02
CO 9.29
CH4 6.76
Total
Soot and ashes Dust 19.36
common target year. The weighting was used to produce aweighted environmental impact potential, with the unit of personequivalents, targeted, PET2010.
The weighting factors indicated how important various envir-onmental impacts were in China. The normalization referencesand weighting factors differ among countries, and in this studythe data reported by Yang and Nielsen (2001) were adopted.Table 13 summarizes the results of the weighted environmentalpotentials for different environmental impact categories.
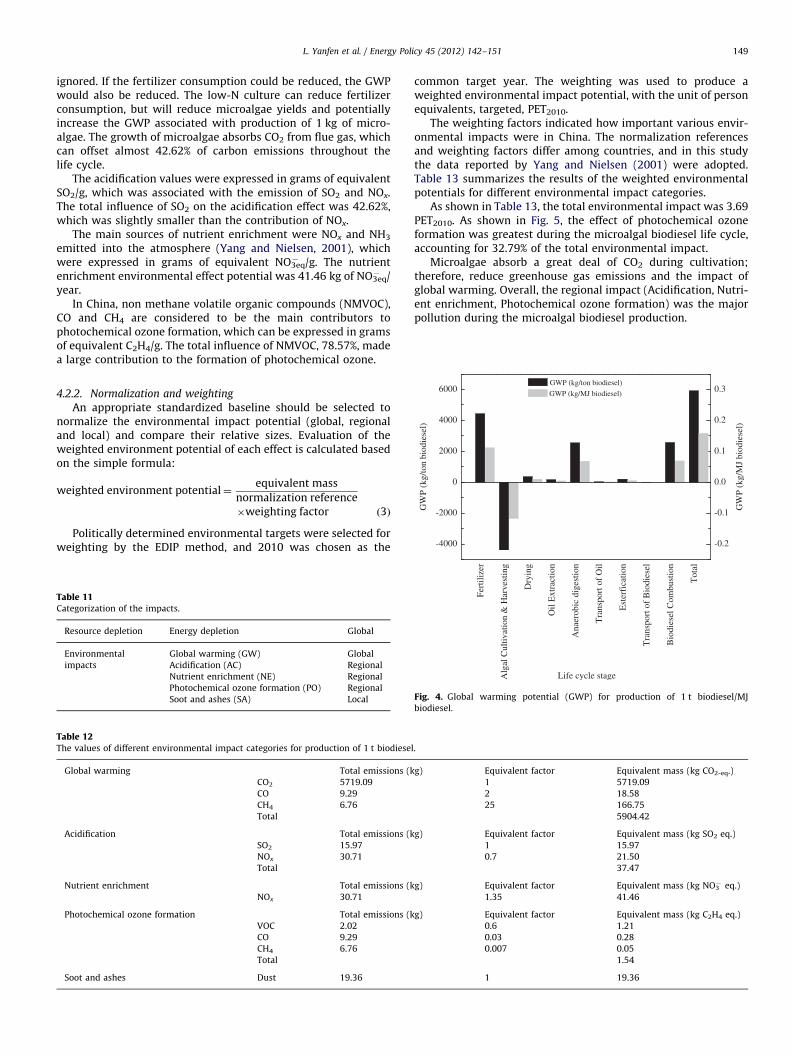
As shown in Table 13, the total environmental impact was 3.69PET2010. As shown in Fig. 5, the effect of photochemical ozoneformation was greatest during the microalgal biodiesel life cycle,accounting for 32.79% of the total environmental impact.
Microalgae absorb a great deal of CO2 during cultivation;therefore, reduce greenhouse gas emissions and the impact ofglobal warming. Overall, the regional impact (Acidification, Nutri-ent enrichment, Photochemical ozone formation) was the majorpollution during the microalgal biodiesel production.
.
g) Equivalent factor Equivalent mass (kg CO2-eq.)
1 5719.09
2 18.58
25 166.75
5904.42
g) Equivalent factor Equivalent mass (kg SO2 eq.)
1 15.97
0.7 21.50
37.47
g) Equivalent factor Equivalent mass (kg NO�3 eq.)
1.35 41.46
g) Equivalent factor Equivalent mass (kg C2H4 eq.)
0.6 1.21
0.03 0.28
0.007 0.05
1.54
1 19.36
Fert
ilize
r
Alg
al C
ultiv
atio
n &
Har
vest
ing
Dry
ing
Oil
Ext
ract
ion
Ana
erob
ic d
iges
tion
Tra
nspo
rt o
f O
il
Est
erfi
catio
n
Tra
nspo
rt o
f B
iodi
esel
Bio
dies
el C
ombu
stio
n
Tot
al
Life cycle stage
Fig. 4. Global warming potential (GWP) for production of 1 t biodiesel/MJ
biodiesel.
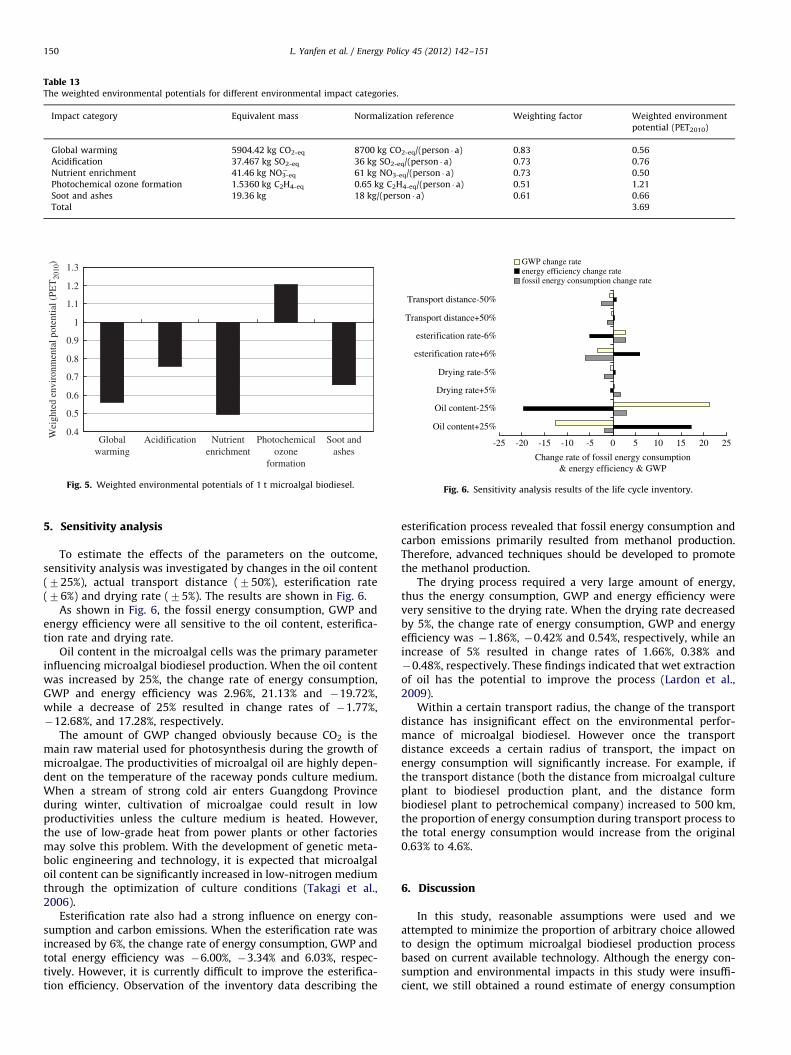
Table 13The weighted environmental potentials for different environmental impact categories.
Impact category Equivalent mass Normalization reference Weighting factor Weighted environment
potential (PET2010)
Global warming 5904.42 kg CO2-eq 8700 kg CO2-eq/(person � a) 0.83 0.56
Acidification 37.467 kg SO2-eq 36 kg SO2-eq/(person � a) 0.73 0.76
Nutrient enrichment 41.46 kg NO�3-eq 61 kg NO3-eq/(person � a) 0.73 0.50
Photochemical ozone formation 1.5360 kg C2H4-eq 0.65 kg C2H4-eq/(person � a) 0.51 1.21
Soot and ashes 19.36 kg 18 kg/(person � a) 0.61 0.66
Total 3.69
0.4
0.5
0.6
0.7
0.8
0.9
1
1.1
1.2
1.3
Globalwarming
Acidification Photochemicalozone
formation
Soot andashes
Wei
ghte
d en
viro
nmen
tal p
oten
tial (
PET
2010
)
Nutrientenrichment
Fig. 5. Weighted environmental potentials of 1 t microalgal biodiesel.
-25 -20 -15 -10 -5 0 5 10 15 20 25
Oil content+25%
Oil content-25%
Drying rate+5%
Drying rate-5%
esterification rate+6%
esterification rate-6%
Transport distance+50%
Transport distance-50%
Change rate of fossil energy consumption& energy efficiency & GWP
GWP change rateenergy efficiency change ratefossil energy consumption change rate
Fig. 6. Sensitivity analysis results of the life cycle inventory.
L. Yanfen et al. / Energy Policy 45 (2012) 142–151150
5. Sensitivity analysis
To estimate the effects of the parameters on the outcome,sensitivity analysis was investigated by changes in the oil content(725%), actual transport distance (750%), esterification rate(76%) and drying rate (75%). The results are shown in Fig. 6.
As shown in Fig. 6, the fossil energy consumption, GWP andenergy efficiency were all sensitive to the oil content, esterifica-tion rate and drying rate.
Oil content in the microalgal cells was the primary parameterinfluencing microalgal biodiesel production. When the oil contentwas increased by 25%, the change rate of energy consumption,GWP and energy efficiency was 2.96%, 21.13% and �19.72%,while a decrease of 25% resulted in change rates of �1.77%,�12.68%, and 17.28%, respectively.
The amount of GWP changed obviously because CO2 is themain raw material used for photosynthesis during the growth ofmicroalgae. The productivities of microalgal oil are highly depen-dent on the temperature of the raceway ponds culture medium.When a stream of strong cold air enters Guangdong Provinceduring winter, cultivation of microalgae could result in lowproductivities unless the culture medium is heated. However,the use of low-grade heat from power plants or other factoriesmay solve this problem. With the development of genetic meta-bolic engineering and technology, it is expected that microalgaloil content can be significantly increased in low-nitrogen mediumthrough the optimization of culture conditions (Takagi et al.,2006).
Esterification rate also had a strong influence on energy con-sumption and carbon emissions. When the esterification rate wasincreased by 6%, the change rate of energy consumption, GWP andtotal energy efficiency was �6.00%, �3.34% and 6.03%, respec-tively. However, it is currently difficult to improve the esterifica-tion efficiency. Observation of the inventory data describing the
esterification process revealed that fossil energy consumption andcarbon emissions primarily resulted from methanol production.Therefore, advanced techniques should be developed to promotethe methanol production.
The drying process required a very large amount of energy,thus the energy consumption, GWP and energy efficiency werevery sensitive to the drying rate. When the drying rate decreasedby 5%, the change rate of energy consumption, GWP and energyefficiency was �1.86%, �0.42% and 0.54%, respectively, while anincrease of 5% resulted in change rates of 1.66%, 0.38% and�0.48%, respectively. These findings indicated that wet extractionof oil has the potential to improve the process (Lardon et al.,2009).
Within a certain transport radius, the change of the transportdistance has insignificant effect on the environmental perfor-mance of microalgal biodiesel. However once the transportdistance exceeds a certain radius of transport, the impact onenergy consumption will significantly increase. For example, ifthe transport distance (both the distance from microalgal cultureplant to biodiesel production plant, and the distance formbiodiesel plant to petrochemical company) increased to 500 km,the proportion of energy consumption during transport process tothe total energy consumption would increase from the original0.63% to 4.6%.
6. Discussion
In this study, reasonable assumptions were used and weattempted to minimize the proportion of arbitrary choice allowedto design the optimum microalgal biodiesel production processbased on current available technology. Although the energy con-sumption and environmental impacts in this study were insuffi-cient, we still obtained a round estimate of energy consumption
L. Yanfen et al. / Energy Policy 45 (2012) 142–151 151
and environmental impacts of microalgal biodiesel produced inChina, which helped identify which processes have the greatestimpact on the energy balance and environmental performance ofthe entire chain. As a result, the findings presented here canfacilitate the decision-making process of countries or companiesthat are considering microalgal biodiesel production as an avenuefor energy crisis and greenhouse gas (GHG) mitigation.
The ability for microalgae to be cultivated on non-arable landusing saltwater greatly reduces its impact on the environmentrelative to other biofuels and fossil fuels. Moreover, the cultiva-tion of microalgae does not require it to compete with food crops,which is a social benefit that may be underestimated by manypolicymakers. The high-yield and reduced greenhouse gas emis-sions of microalgae make it a good candidate for reducingtransportation related pollution.
However, the energy analysis and environmental impactassessments of microalgal biodiesel conducted in this study showthat microalgal biodiesel production suffers from several bottle-necks at the current level of technology, such as the need foroptimization of microalgae harvesting, selection of microalgaespecies that can maintain high productivity under nitrogen-limit-ing conditions and development of a new method of extractingoil. Therefore, future efforts of microalgal biodiesel productionshould concentrate on increasing existing stains or selecting newstrains with high oil content, and development of a new efficientoil-extraction method. However, such efforts may lead to highcosts for enterprises. Therefore, the government should developsome favorable policies that can attract more investors in micro-algal biodiesel industry, such as tax exemptions, price controlsand direct subsidies.
7. Conclusions
This study showed the results of an LCA of microalgal biodieselproduction. Microalgae cultivation, harvesting, drying, oil extrac-tion, anaerobic digestion, oil transportation, esterification, biodie-sel transportation and biodiesel combustion were investigatedand the following conclusions were made.
(1)
The microalgal biodiesel had a fossil energy requirement of0.74 MJ/MJ, which was 41.27% lower than that of fossil-derived diesel. The energy consumed during the dryingprocess was found to make the greatest contribution, almost59.3% of the required energy was used in this process.(2)
The environmental impact loading of microalgal biodiesel wascalculated to be 3.69 PET2010. The effect of photochemicalozone formation was greatest during the microalgal biodiesellife cycle, accounting for 32.79% of the total environmentalimpact.(3)
The environmental performance of microalgal biodiesel washighly sensitive to the oil content, esterification rate anddrying rate. The amount of GHG decreases when the micro-algae yield increases, primarily because CO2 is the main rawmaterial utilized in photosynthesis during the growth ofmicroalgae. Therefore, it is important to achieve high yieldsof biomass and oil in the cultivation plant.(4)
Utilization of microalgae as the raw material for producingbiodiesel is beneficial to the production of renewable fuelsand improvement of the ecological environment. The cultiva-tion of microalgae in raceways has the potential to produce anenvironmentally sustainable feedstock for the production ofbiodiesel.Acknowledgments
This work was supported by National Basic Research Programof China(973 Program) (2011CB201500); the National NaturalScience Foundation of China (no. 50906025); the FundamentalResearch Funds for the Central Universities(2012ZZ0022); KeyLaboratory of Efficient and Clean Energy Utilization of GuangdongHigher Education Institutes (KLB10004); Key Laboratory of NewLithium-ion Battery and Mesoporous Materials (20110213).
References
Amin, S., 2009. Review on biofuel oil and gas production processes from micro-algae. Energy Conversion and Management 50, 1834–1840.
Ai-hua, Xing, MA, Jie, Zhang, Ying-hao, et al., 2010a. Life cycle assessment ofresource and energy consumption for production of biodiesel. The ChineseJournal of Process Engineering 10 (2), 314–320. (in Chinese).
Ai-hua, Xing, Jie, M.A., Ying-hao, Zhang, et al., 2010b. Life cycle assessment ofbiodiesel environmental effects. Tsinghua University (Science and Technology)50 (6), 917–922. (in Chinese).
Brennan, L., Owende, P., 2010. Biofuels from microalgae-A review of technologiesfor production, processing, and extractions of biofuels and co-products.Renewable and Sustainable Energy Reviews 14, 557–577.
Campbell, M.N., 2008. Biodiesel: algae as a renewable source for liquid fuel.Guelph Engineering Journal 1, 2–7.
Campbell, P.K., Beer, T., Batten, D., 2011. Life cycle assessment of biodieselproduction from microalgae in ponds. Bioresource Technology 102, 50–56.
Chisti, Y., 2007. Biodiesel from microalgae. Biotechnology Advances 25 (3),294–306.
Collet, P., Helias, A., Lardon, L, et al., 2011. Life-cycle assessment of microalgaeculture coupled to biogas production. Bioresource Technology 102 (1), 207–214.
Courchesne, N.M.D., Parisien, A., Bei, Wang, et al., 2009. Enhancement of lipidproduction using biochemical, genetic and transcription factor engineeringapproaches. Biotechnology 141 (1-2), 31–41.
GB 18352.3-2005. Limits and Measurement Methods for Emissions from Light-Duty Vehicles (III, IV) [S] (in Chinese).
Grima, E.M., Belarbi, E.H., Fernandez, F.G.A., et al., 2003. Recovery of microalgalbiomass and metabolites: process options and economics. BiotechnologyAdvances 20 (7–8), 491–515.
Jian-xin, Yang, Nielsen Per, H., 2001. Chinese life cycle impact assessment factors.Journal of Environmental Sciences 13 (2), 205–209.
Lardon, L., Helias, A., Sialve, B., et al., 2009. Life-cycle assessment of biodieselproduction from microalgae. Environmental Science Technology 43 (17),6475–6481.
Mata, T.M., Martins, A.A., Caetano, N.S., 2010. Microalgae for biodiesel productionand other applications: a review. Renewable and Sustainable Energy Reviews14 (1), 217–232.
Schenk, P.M., Thomas-Hall, S.R., Stephens, E., et al., 2008. Second generationbiofuels: high-efficiency microalgae for biodiesel production. BioenergyResearch 1 (1), 20–43.
Sialve, B., Bernet, N., Bernard, O., 2009. Anaerobic digestion of microalgae as anecessary step to make microalgal biodiesel sustainable. BiotechnologyAdvances 27, 409–416.
Stephenson, A.L., Dennis, J.S., Howe, C.J., et al., 2010a. Influence of nitrogen-limitation regime on the production by Chlorella vulgaris of lipids for biodieselfeedstocks. Biofuels 1 (1), 47–58.
Stephenson, A.L., Kazamia, E., Dennis, J.S., et al., 2010b. Life-cycle assessment ofpotential algal biodiesel production in the United Kingdom: a comparison ofraceways and air-lift tubular bioreactors. Energy Fuels 24, 4062–4077.
Takagi, M., Karseno, Yoshida T, 2006. Effect of salt concentration on intracellularaccumulation of lipids and triacylglyceride in marine microalgae dunaliellacells. Bioscience and Bioengineering 101 (3), 223–226.
Tian, Xiao-dong, Jian, Qiang, Jun, L.U., 2002. Technology lectures of large andmedium-sized biogas projects (1) anaerobic fermentation and technologicalconditions. Renewable Energy 5, 35–39. (in Chinese).
Wenzel, H., Hauschild, M., Alting, L., 1997. Environmental Assessment of Products.Volume 1: Methodology, Tools and Case Studies in Product Development.Chapman & Hall, London, United Kingdom.
Xin, Yao-nian, Sondermann, B., Emersleben, B., 2001. Production and application ofbiodiesel fuel. China Oils and Fats 26 (5), 72–77. (in Chinese).
Yang, Jian-xin, Cheng, Xu, Ru-song, Wang, 2002. Methodology and Application ofLife Cycle Assessment. China Meteorological Press, Beijing (in Chinese).
Zhu, Qi, 2008. Study of life cycle energy consumption, environmental emission andeconomics of biodiesel. Shanghai Jiao Tong University, Shanghai (in Chinese).