Embed Size (px)
Citation preview
SCALING AND REFINING FINANCE IN COUNTRIES WITH LARGE ENERGY ACCESS GAPS
ENERGIZING FINANCE
ENERGIZING FINANCE
REPORT SERIES
ENERGIZING FINANCE: SCALING AND REFINING FINANCE IN COUNTRIES WITH LARGE ENERGY ACCESS GAPS
COPYRIGHT AND DISCLAIMER
ACKNOWLEDGEMENTS
© 2017 Sustainable Energy for All
Washington, DC Office 1750 Pennsylvania Ave NW, Suite 300 Washington, DC 20006, USA
Telephone: +1 202 390 0078 Website: SEforALL.org
This report, Energizing Finance – Scaling and Refining Finance in Countries with Large Energy Access Gaps, is a result of contributions from a range of experts in a colla-borative research partnership among Sustainable Energy for All, the World Bank, the African Development Bank, Climate Policy Initiative, E3 Analytics and Practical Action Consulting that explores finance for energy access. We thank everyone who contributed to the development of the approach, data, analysis and the richness of this re-search and its results.
The report was written by a team from Sustainable Energy for All: Peyton Flemming, Fiona Messent, Christine Eibs Singer, and Stacy Swann. The SEforALL team was led by Jane Olga Ebinger.
The report received insightful comments from Corin-na Bordewieck (World Bank), Cameron Carswell (CPI), Malcolm Cosgrove-Davies (World Bank), Toby Couture (E3 Analytics), Vivien Foster (World Bank), Alp Katalan (CPI), Federico Mazza (CPI) and Dana Rysankova (World Bank).
Valuable guidance and oversight was provided by Rachel Kyte, Chief Executive Officer and Special Representative of the UN Secretary-General for Sustainable Energy for All.
We would like to thank SEforALL staff for their support: Sameer Ahmad, Varadan Atur, Juan Cerda, Callum Grieve, Maeve Hogel, Bertrand Magne, Monika Weber-Fahr and Beth Woodthorpe-Evans.
We are grateful to: Paula Keogh (editor), Natalie Lan-ham-Parker (designer), and Beyond Words Studio and Phoenix Design Aid (both supporting graphic and data design).
We acknowledge with gratitude financial assistance of the European Union for this report and the financial assistan-ce of the European Union and the Energy Sector Mana-gement Assistance Program (ESMAP) for the Energizing Finance report series.
0302
This work is a product of Sustainable Energy for All (SEforALL). The findings, interpretations, and conclusions expressed in this work do not necessarily reflect the views of SEforALL, its Administrative Board or its donors.
SEforALL does not guarantee the accuracy of the data included in this work. The boundaries, colors, denomi-nations and other information shown on any map in this work do not imply any judgment on the part of SEforALL concerning the legal status of any territory or the endor-sement or acceptance of such boundaries.
This work forms part of the Energizing Finance report se-ries that has been produced with the financial assistance of the European Union and Energy Sector Management Assistance Program (ESMAP).
This document has been produced with the financial assis-
tance of the European Union. The views expressed herein can in no way be taken to reflect the official opinion of the European Union.
RIGHTS AND PERMISSIONS
The material in this work is subject to copyright. Because SEforALL encourages dissemination of their knowledge, this work may be reproduced, in whole or in part, for non-commercial purposes if full attribution to this work is given to Sustainable Energy for All (SEforALL). Energi-zing Finance: Scaling and refining finance in countries with large energy access gaps. SEforALL, Washington, DC. Li-cense: NonCommercial-NoDerivatives 4.0 International (CC BY-NC-ND 4.0).
To view this report and the Energizing Finance report se-ries online, please visit SEforALL.org/EnergizingFinance.
Vienna Office Andromeda Tower 15th floor Donau City Strasse 6 1220, Vienna, Austria
ENERGIZING FINANCE: SCALING AND REFINING FINANCE IN COUNTRIES WITH LARGE ENERGY ACCESS GAPS
FOREWORD
Many studies have estimated the amount of investment that is needed to meet energy access goals, but none have attempted to systematically analyze what finance these countries are actually committing to energy access, what is known about the disbursement of development finance for energy access or the challenges facing energy access enterprises in delivering modern energy services to more people, more affordably.
This new report, “Energizing Finance: Scaling and Re-fining Finance in Countries with Large Energy Access Gaps,” does exactly that.
Energizing Finance explores these questions and offers in-sights and pathways to help governments, development finance institutions and other decision-makers to accele-rate progress on energy access.
The research—a series of reports done in partnership with the African Development Bank, Climate Policy Initiative, E3 Analytics, Practical Action Consulting and the World Bank Group—tracks and analyzes finance flows for elec-tricity and clean cooking access in 20 countries predomi-nantly in Sub-Saharan Africa and Asia that have signifi-cant energy access gaps. These countries—which we call ‘high-impact’—cannot afford delays in making progress on energy access.
Our research looks at several specific issues: the amount and type of international and domestic finance flowing to these countries for electricity and clean cooking, inclu-
ding a deep dive analysis to explore finance flowing at the domestic level in Bangladesh, Ethiopia and Kenya; how quickly development finance for electricity access is being disbursed and absorbed in these high-impact countries; and the finance needs and challenges of energy enter-prises offering decentralized energy solutions in five of these countries.
The data reveals some encouraging developments, inclu-ding rapid progress in several countries that have made energy access a political priority. There have also been more recent important shifts in the financing strategies of governments and development finance institutions, bila-teral and multilateral, and the promise of greater climate finance flows.
But, importantly, this series of reports shows that overall investment in these countries is not nearly at the levels needed to meet the UN Sustainable Development Goal of ensuring access to affordable, reliable, sustainable and modern energy for all by 2030. Finance commitments for clean cooking access are especially abysmal. More finance for electricity is also needed, especially on renewable en-ergy solutions, which will also help countries meet pol-lution-reducing commitments under the Paris Climate Agreement.
Data and evidence underpin all our work at Sustainable Energy for All. We are aware of the limitations of data tracking and the uncertainties this incurs. This work, a col-laboration across many different organizations that track
04
different pieces of the financing puzzle, provides a ba-sis for building a more complete picture, now and as we move towards achieving our goals.
Our findings and recommendations are specifically geared to those who, together, can drive policy, regulation, in-vestment and community engagement towards greater speed and scale of efforts to close energy access gaps. Government leaders, in particular in energy and finance, private investors, development finance officials and entre-preneurs, including social entrepreneurs and community leaders, all play a critical role in providing electricity and clean cooking in these high-impact countries.
It is my hope that insights from this research cause us to work more urgently with more targeted and refined strate-gies to increase investment in integrated solutions – both large grid-scale projects as well as decentralized energy services which are especially important for getting electri-city to rural parts of Sub-Saharan Africa with large under-served populations.
And on clean cooking, my wish is that this opens-up a frank new dialogue around bold market-based strategies that can deploy clean fuels and technologies for cooking,
rapidly and at the required scale. If this does not happen, the millions of women and children who suffer and die every year from dirty cooking fuels will not diminish. We will have fallen at the first hurdle of leaving no one behind.
Imagining a world where everyone has access to affor-dable, reliable, and sustainable electricity and clean cooking services means imagining the time saved for a mother to use in support of her own enterprise or a job outside the house; a stronger daughter no longer constantly fighting lung infections; greater revenue for a small milling business that can now run on power from a village mini-grid; a clinic with nighttime light as a nurse cleans a wound; a child warm in school able to concen-trate on a math problem.
This imagined world is the one we are investing in: it brings measurable returns. Our focus and discipline will bring results.
We can and must do better. At Sustainable Energy for All, we will be stepping up action. We hope this “Energizing Finance” research series provides a pathway for others to do so, too.
05
RACHEL KYTE Chief Executive Officer of Sustainable Energy for All (SEforALL),
and Special Representative of the UN Secretary-General for Sustainable Energy for All.
ENERGIZING FINANCE: SCALING AND REFINING FINANCE IN COUNTRIES WITH LARGE ENERGY ACCESS GAPS
CONTENTS
COPYRIGHT AND DISCLAIMER . . . . . . . . . . . . . . . . . . . . . . . . . . . . . . . . . . . . . . . . . . . . . . . . . . . . . . . . . . . . . . . . . . . . . . . . . . . . . . . . . . . . . . . . . . . . . . . . . . . . . . . . . . . . . . . . . . 02Rights and Permissions . . . . . . . . . . . . . . . . . . . . . . . . . . . . . . . . . . . . . . . . . . . . . . . . . . . . . . . . . . . . . . . . . . . . . . . . . . . . . . . . . . . . . . . . . . . . . . . . . . . . . . . . . . . . . . . . . . . . 02
ACKNOWLEDGEMENTS . . . . . . . . . . . . . . . . . . . . . . . . . . . . . . . . . . . . . . . . . . . . . . . . . . . . . . . . . . . . . . . . . . . . . . . . . . . . . . . . . . . . . . . . . . . . . . . . . . . . . . . . . . . . . . . . . . . . . . . . . . . 03
FOREWORD . . . . . . . . . . . . . . . . . . . . . . . . . . . . . . . . . . . . . . . . . . . . . . . . . . . . . . . . . . . . . . . . . . . . . . . . . . . . . . . . . . . . . . . . . . . . . . . . . . . . . . . . . . . . . . . . . . . . . . . . . . . . . . . . . . . . . . . . . . . . 04
CONTENTS . . . . . . . . . . . . . . . . . . . . . . . . . . . . . . . . . . . . . . . . . . . . . . . . . . . . . . . . . . . . . . . . . . . . . . . . . . . . . . . . . . . . . . . . . . . . . . . . . . . . . . . . . . . . . . . . . . . . . . . . . . . . . . . . . . . . . . . . . . . . . 06
EXECUTIVE SUMMARY . . . . . . . . . . . . . . . . . . . . . . . . . . . . . . . . . . . . . . . . . . . . . . . . . . . . . . . . . . . . . . . . . . . . . . . . . . . . . . . . . . . . . . . . . . . . . . . . . . . . . . . . . . . . . . . . . . . . . . . . . . . . . . 08 The Findings . . . . . . . . . . . . . . . . . . . . . . . . . . . . . . . . . . . . . . . . . . . . . . . . . . . . . . . . . . . . . . . . . . . . . . . . . . . . . . . . . . . . . . . . . . . . . . . . . . . . . . . . . . . . . . . . . . . . . . . . . . . . . . . . . 10 Pathway for the Future . . . . . . . . . . . . . . . . . . . . . . . . . . . . . . . . . . . . . . . . . . . . . . . . . . . . . . . . . . . . . . . . . . . . . . . . . . . . . . . . . . . . . . . . . . . . . . . . . . . . . . . . . . . . . . . . . . . . 13 For Electricity . . . . . . . . . . . . . . . . . . . . . . . . . . . . . . . . . . . . . . . . . . . . . . . . . . . . . . . . . . . . . . . . . . . . . . . . . . . . . . . . . . . . . . . . . . . . . . . . . . . . . . . . . . . . . . . . . . . . . . . . . . . . . . . . 13 For Clean Cooking . . . . . . . . . . . . . . . . . . . . . . . . . . . . . . . . . . . . . . . . . . . . . . . . . . . . . . . . . . . . . . . . . . . . . . . . . . . . . . . . . . . . . . . . . . . . . . . . . . . . . . . . . . . . . . . . . . . . . . . . . 14 For Tracking Finance . . . . . . . . . . . . . . . . . . . . . . . . . . . . . . . . . . . . . . . . . . . . . . . . . . . . . . . . . . . . . . . . . . . . . . . . . . . . . . . . . . . . . . . . . . . . . . . . . . . . . . . . . . . . . . . . . . . . . . . 14
ABBREVIATIONS . . . . . . . . . . . . . . . . . . . . . . . . . . . . . . . . . . . . . . . . . . . . . . . . . . . . . . . . . . . . . . . . . . . . . . . . . . . . . . . . . . . . . . . . . . . . . . . . . . . . . . . . . . . . . . . . . . . . . . . . . . . . . . . . . . . . . . 16
GLOSSARY . . . . . . . . . . . . . . . . . . . . . . . . . . . . . . . . . . . . . . . . . . . . . . . . . . . . . . . . . . . . . . . . . . . . . . . . . . . . . . . . . . . . . . . . . . . . . . . . . . . . . . . . . . . . . . . . . . . . . . . . . . . . . . . . . . . . . . . . . . . . . . 17
THE ENERGY ACCESS CHALLENGE . . . . . . . . . . . . . . . . . . . . . . . . . . . . . . . . . . . . . . . . . . . . . . . . . . . . . . . . . . . . . . . . . . . . . . . . . . . . . . . . . . . . . . . . . . . . . . . . . . . . . . . . . . . 20Finance for Electricity . . . . . . . . . . . . . . . . . . . . . . . . . . . . . . . . . . . . . . . . . . . . . . . . . . . . . . . . . . . . . . . . . . . . . . . . . . . . . . . . . . . . . . . . . . . . . . . . . . . . . . . . . . . . . . . . . . . . . . 23 Financing Commitments . . . . . . . . . . . . . . . . . . . . . . . . . . . . . . . . . . . . . . . . . . . . . . . . . . . . . . . . . . . . . . . . . . . . . . . . . . . . . . . . . . . . . . . . . . . . . . . . . . . . . . . . . . . . . 23 Financing Disbursements . . . . . . . . . . . . . . . . . . . . . . . . . . . . . . . . . . . . . . . . . . . . . . . . . . . . . . . . . . . . . . . . . . . . . . . . . . . . . . . . . . . . . . . . . . . . . . . . . . . . . . . . . . . 26 Financing Commitments in Bangladesh, Ethiopia and Kenya . . . . . . . . . . . . . . . . . . . . . . . . . . . . . . . . . . . . . . . . . . . . . . . . . . . . . . . . . . . . 26 The Financing Needs of Enterprises Providing Decentralized Electricity . . . . . . . . . . . . . . . . . . . . . . . . . . . . . . . . . . . . . . . . . . . . . 29 Recommendations . . . . . . . . . . . . . . . . . . . . . . . . . . . . . . . . . . . . . . . . . . . . . . . . . . . . . . . . . . . . . . . . . . . . . . . . . . . . . . . . . . . . . . . . . . . . . . . . . . . . . . . . . . . . . . . . . . . . 29
Finance for Clean Cooking . . . . . . . . . . . . . . . . . . . . . . . . . . . . . . . . . . . . . . . . . . . . . . . . . . . . . . . . . . . . . . . . . . . . . . . . . . . . . . . . . . . . . . . . . . . . . . . . . . . . . . . . . . . . . . . 33 Financing Commitments . . . . . . . . . . . . . . . . . . . . . . . . . . . . . . . . . . . . . . . . . . . . . . . . . . . . . . . . . . . . . . . . . . . . . . . . . . . . . . . . . . . . . . . . . . . . . . . . . . . . . . . . . . . . 33 Financing Commitments in Bangladesh, Ethiopia and Kenya . . . . . . . . . . . . . . . . . . . . . . . . . . . . . . . . . . . . . . . . . . . . . . . . . . . . . . . . . . . . 35 The Financing Needs of Enterprises Providing Clean Cooking Solutions . . . . . . . . . . . . . . . . . . . . . . . . . . . . . . . . . . . . . . . . . . . . 36 Recommendations . . . . . . . . . . . . . . . . . . . . . . . . . . . . . . . . . . . . . . . . . . . . . . . . . . . . . . . . . . . . . . . . . . . . . . . . . . . . . . . . . . . . . . . . . . . . . . . . . . . . . . . . . . . . . . . . . . . . 38
ADDRESSING DATA LIMITATIONS . . . . . . . . . . . . . . . . . . . . . . . . . . . . . . . . . . . . . . . . . . . . . . . . . . . . . . . . . . . . . . . . . . . . . . . . . . . . . . . . . . . . . . . . . . . . . . . . . . . . . . . . . . . . . . 40
ANNEX FINANCING COMMITMENTS FOR ENERGY ACCESS IN HIGH-IMPACT COUNTRIES . . . . . . . . . . . . . . . . . . . . . . . . . . . . . 42
BIBLIOGRAPHY . . . . . . . . . . . . . . . . . . . . . . . . . . . . . . . . . . . . . . . . . . . . . . . . . . . . . . . . . . . . . . . . . . . . . . . . . . . . . . . . . . . . . . . . . . . . . . . . . . . . . . . . . . . . . . . . . . . . . . . . . . . . . . . . . . . . . . . . . 46
FIGURES Figure ES1 - Access to modern energy services in high-impact countries . . . . . . . . . . . . . . . . . . . . . . . . . . . . . . . . . . . . . . . . . . . . . . . . . . . . . . . . . . . 08 Figure 1 - Instruments financing commitments to electricity access, average of 2013 and 2014 . . . . . . . . . . . . . . . . . . . . . . . . . . . . . 24 Figure 2 - Finance commitments supporting residential electricity, by Tiers of energy access (average in 2013-14) . . . 25 Figure 3 - Development finance flows to the electricity sector, 2002-15 . . . . . . . . . . . . . . . . . . . . . . . . . . . . . . . . . . . . . . . . . . . . . . . . . . . . . . . . . . . . . 27 Figure A1 - Tracked finance for electricity . . . . . . . . . . . . . . . . . . . . . . . . . . . . . . . . . . . . . . . . . . . . . . . . . . . . . . . . . . . . . . . . . . . . . . . . . . . . . . . . . . . . . . . . . . . . . . . . . . . . . 42 Figure A2 - Tracked finance for clean cooking . . . . . . . . . . . . . . . . . . . . . . . . . . . . . . . . . . . . . . . . . . . . . . . . . . . . . . . . . . . . . . . . . . . . . . . . . . . . . . . . . . . . . . . . . . . . . . . 44
TABLES Table 1 - Comparison across country case studies of finance for electricity . . . . . . . . . . . . . . . . . . . . . . . . . . . . . . . . . . . . . . . . . . . . . . . . . . . . . . . . . 28 Table 2 - Key market features and enterprise challenges, electricity . . . . . . . . . . . . . . . . . . . . . . . . . . . . . . . . . . . . . . . . . . . . . . . . . . . . . . . . . . . . . . . . . . 30 Table 3 - Estimated costs of meeting clean cooking targets, Tiers 1-5 . . . . . . . . . . . . . . . . . . . . . . . . . . . . . . . . . . . . . . . . . . . . . . . . . . . . . . . . . . . . . . . . 34 Table 4 - Comparison of finance for clean cooking for country case studies . . . . . . . . . . . . . . . . . . . . . . . . . . . . . . . . . . . . . . . . . . . . . . . . . . . . . . . . 35 Table 5 - Key market features and enterprise challenges, clean cooking . . . . . . . . . . . . . . . . . . . . . . . . . . . . . . . . . . . . . . . . . . . . . . . . . . . . . . . . . . . . . 37
BOXES Box 1 - High-impact countries . . . . . . . . . . . . . . . . . . . . . . . . . . . . . . . . . . . . . . . . . . . . . . . . . . . . . . . . . . . . . . . . . . . . . . . . . . . . . . . . . . . . . . . . . . . . . . . . . . . . . . . . . . . . . . . . . . . . . 20 Box 2 - Data challenges . . . . . . . . . . . . . . . . . . . . . . . . . . . . . . . . . . . . . . . . . . . . . . . . . . . . . . . . . . . . . . . . . . . . . . . . . . . . . . . . . . . . . . . . . . . . . . . . . . . . . . . . . . . . . . . . . . . . . . . . . . . . . 21 Box 3 - Methodological approach . . . . . . . . . . . . . . . . . . . . . . . . . . . . . . . . . . . . . . . . . . . . . . . . . . . . . . . . . . . . . . . . . . . . . . . . . . . . . . . . . . . . . . . . . . . . . . . . . . . . . . . . . . . . . . . 22 Box 4 - China’s influence in financing electricity access . . . . . . . . . . . . . . . . . . . . . . . . . . . . . . . . . . . . . . . . . . . . . . . . . . . . . . . . . . . . . . . . . . . . . . . . . . . . . . . . . . . . 23 Box 5 - The Multi-Tier Framework (MTF) . . . . . . . . . . . . . . . . . . . . . . . . . . . . . . . . . . . . . . . . . . . . . . . . . . . . . . . . . . . . . . . . . . . . . . . . . . . . . . . . . . . . . . . . . . . . . . . . . . . . . . . 23
0706
ENERGIZING FINANCE: SCALING AND REFINING FINANCE IN COUNTRIES WITH LARGE ENERGY ACCESS GAPS
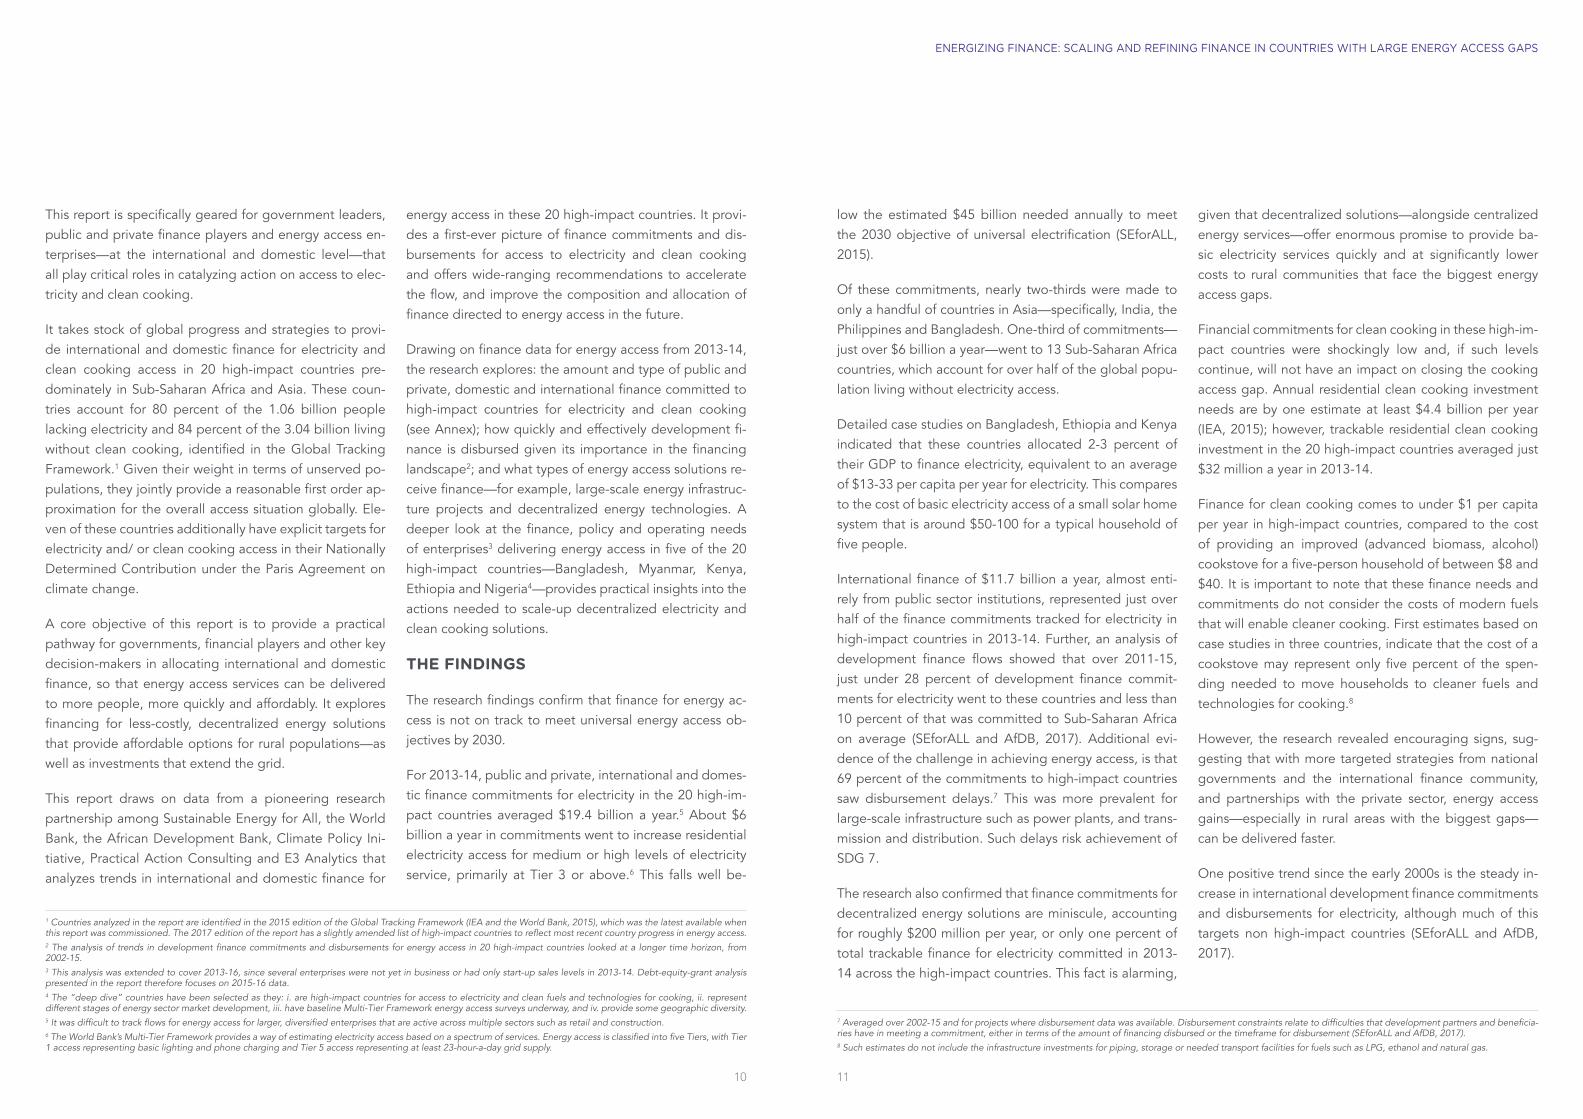
EXECUTIVE SUMMARY In September 2015, countries worldwide came together on a new set of commitments to end global poverty, pro-tect the planet and ensure sustainable economic growth for all. A centerpiece of the new Sustainable Development Goals (SDGs) was SDG 7, which calls for universal access to affordable, reliable, sustainable and modern energy—including access to electricity and clean cooking—by 2030, a mere 13 years from now.
The importance of these goals cannot be overstated. Lacking access to electricity means food cannot be refrige-rated and school children cannot do homework at night. Indoor air pollution from burning charcoal and other fuels for cooking kills several million people every year. There are broader consequences as well. Countries that fail to provide modern energy services stifle opportunities for in-clusive economic development and overall security.
0908
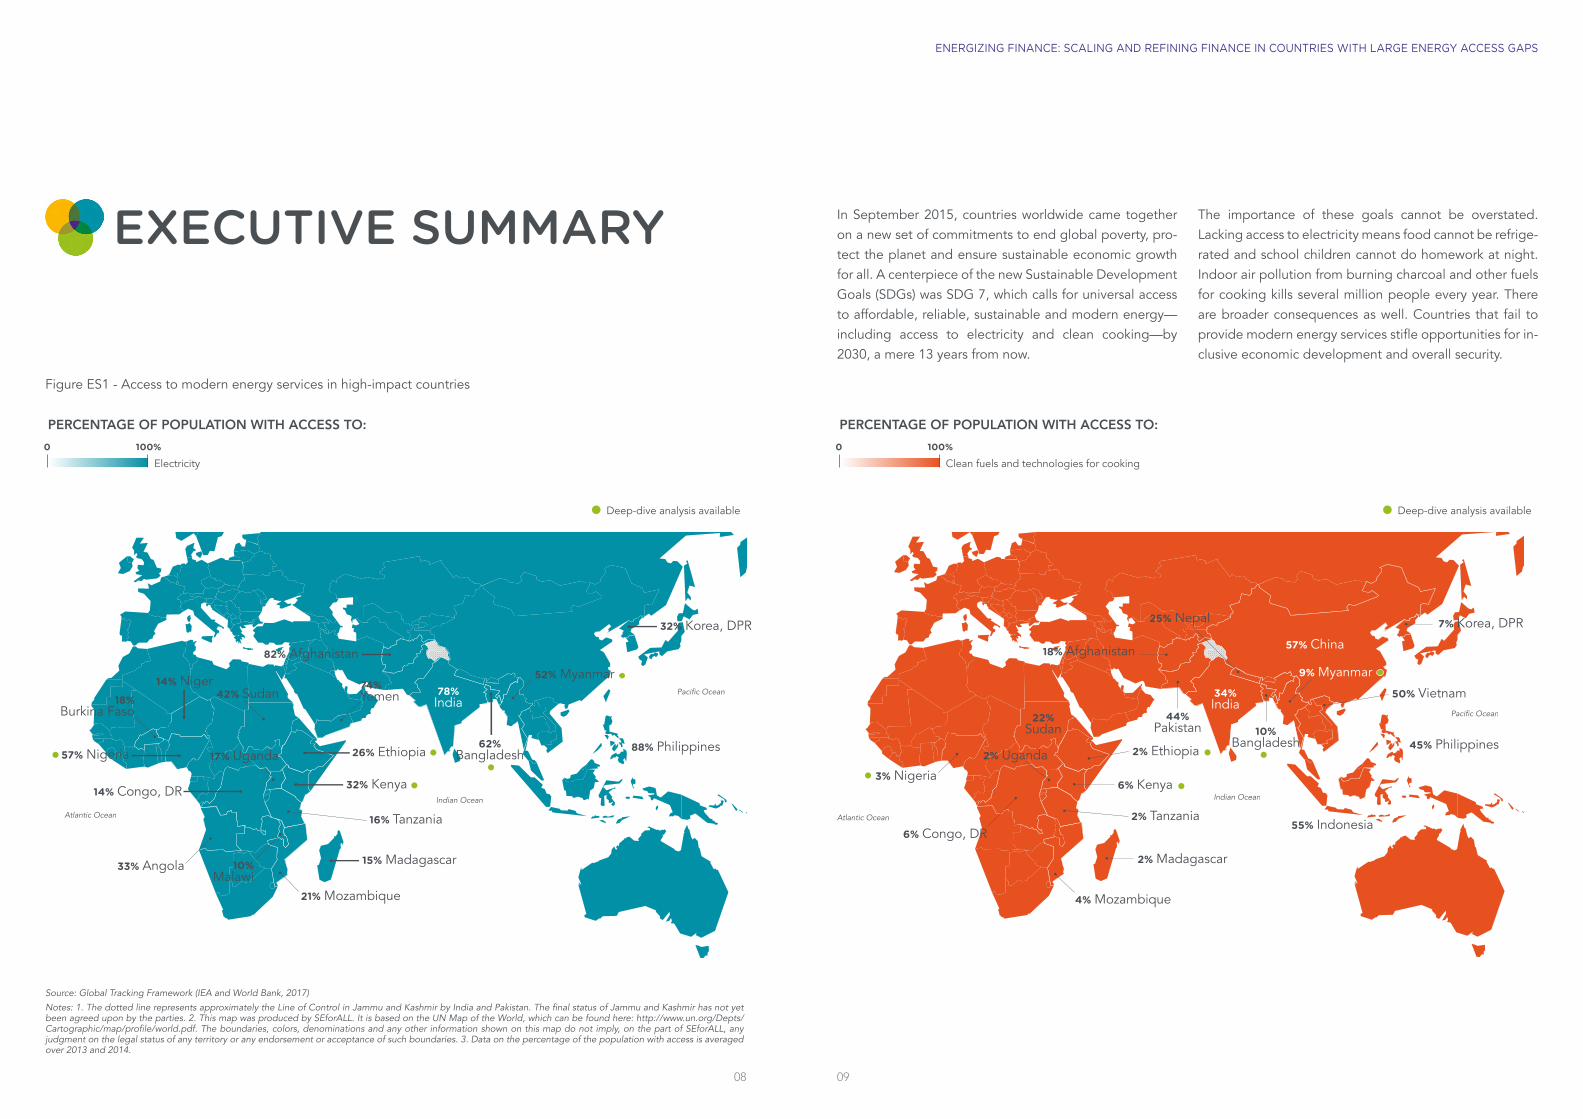
Figure ES1 - Access to modern energy services in high-impact countries
82% Afghanistan
78%India
62%Bangladesh
Indian Ocean
Atlantic Ocean
Pacific Ocean
Indian Ocean
Atlantic Ocean
Pacific Ocean
14% Congo, DR
17% Uganda
14% Niger42% Sudan
74%Yemen
21% Mozambique
26% Ethiopia
52% Myanmar
88% Philippines
32% Kenya
15% Madagascar10%Malawi
16% Tanzania
32% Korea, DPR
33% Angola
18%Burkina Faso
57% Nigeria
18% Afghanistan
34%India
44%Pakistan
55% Indonesia
50% Vietnam
10%Bangladesh
6% Congo, DR
2% Uganda
22%Sudan
4% Mozambique
9% Myanmar
2% Ethiopia
6% Kenya
2% Tanzania
2% Madagascar
45% Philippines
7% Korea, DPR
3% Nigeria
57% China
25% Nepal
Deep-dive analysis available
Source: Global Tracking Framework (IEA and World Bank, 2017)
Notes: 1. The dotted line represents approximately the Line of Control in Jammu and Kashmir by India and Pakistan. The final status of Jammu and Kashmir has not yet been agreed upon by the parties. 2. This map was produced by SEforALL. It is based on the UN Map of the World, which can be found here: http://www.un.org/Depts/Cartographic/map/profile/world.pdf. The boundaries, colors, denominations and any other information shown on this map do not imply, on the part of SEforALL, any judgment on the legal status of any territory or any endorsement or acceptance of such boundaries. 3. Data on the percentage of the population with access is averaged over 2013 and 2014.
PERCENTAGE OF POPULATION WITH ACCESS TO:
Electricity
0 100%
PERCENTAGE OF POPULATION WITH ACCESS TO:
Clean fuels and technologies for cooking
0 100%
Deep-dive analysis available
This report is specifically geared for government leaders, public and private finance players and energy access en-terprises—at the international and domestic level—that all play critical roles in catalyzing action on access to elec-tricity and clean cooking.
It takes stock of global progress and strategies to provi-de international and domestic finance for electricity and clean cooking access in 20 high-impact countries pre-dominately in Sub-Saharan Africa and Asia. These coun-tries account for 80 percent of the 1.06 billion people lacking electricity and 84 percent of the 3.04 billion living without clean cooking, identified in the Global Tracking Framework.1 Given their weight in terms of unserved po-pulations, they jointly provide a reasonable first order ap-proximation for the overall access situation globally. Ele-ven of these countries additionally have explicit targets for electricity and/ or clean cooking access in their Nationally Determined Contribution under the Paris Agreement on climate change.
A core objective of this report is to provide a practical pathway for governments, financial players and other key decision-makers in allocating international and domestic finance, so that energy access services can be delivered to more people, more quickly and affordably. It explores financing for less-costly, decentralized energy solutions that provide affordable options for rural populations—as well as investments that extend the grid.
This report draws on data from a pioneering research partnership among Sustainable Energy for All, the World Bank, the African Development Bank, Climate Policy Ini-tiative, Practical Action Consulting and E3 Analytics that analyzes trends in international and domestic finance for
energy access in these 20 high-impact countries. It provi-des a first-ever picture of finance commitments and dis-bursements for access to electricity and clean cooking and offers wide-ranging recommendations to accelerate the flow, and improve the composition and allocation of finance directed to energy access in the future.
Drawing on finance data for energy access from 2013-14, the research explores: the amount and type of public and private, domestic and international finance committed to high-impact countries for electricity and clean cooking (see Annex); how quickly and effectively development fi-nance is disbursed given its importance in the financing landscape2; and what types of energy access solutions re-ceive finance—for example, large-scale energy infrastruc-ture projects and decentralized energy technologies. A deeper look at the finance, policy and operating needs of enterprises3 delivering energy access in five of the 20 high-impact countries—Bangladesh, Myanmar, Kenya, Ethiopia and Nigeria4—provides practical insights into the actions needed to scale-up decentralized electricity and clean cooking solutions.
THE FINDINGS
The research findings confirm that finance for energy ac-cess is not on track to meet universal energy access ob-jectives by 2030.
For 2013-14, public and private, international and domes-tic finance commitments for electricity in the 20 high-im-pact countries averaged $19.4 billion a year.5 About $6 billion a year in commitments went to increase residential electricity access for medium or high levels of electricity service, primarily at Tier 3 or above.6 This falls well be-
low the estimated $45 billion needed annually to meet the 2030 objective of universal electrification (SEforALL, 2015).
Of these commitments, nearly two-thirds were made to only a handful of countries in Asia—specifically, India, the Philippines and Bangladesh. One-third of commitments—just over $6 billion a year—went to 13 Sub-Saharan Africa countries, which account for over half of the global popu-lation living without electricity access.
Detailed case studies on Bangladesh, Ethiopia and Kenya indicated that these countries allocated 2-3 percent of their GDP to finance electricity, equivalent to an average of $13-33 per capita per year for electricity. This compares to the cost of basic electricity access of a small solar home system that is around $50-100 for a typical household of five people.
International finance of $11.7 billion a year, almost enti-rely from public sector institutions, represented just over half of the finance commitments tracked for electricity in high-impact countries in 2013-14. Further, an analysis of development finance flows showed that over 2011-15, just under 28 percent of development finance commit-ments for electricity went to these countries and less than 10 percent of that was committed to Sub-Saharan Africa on average (SEforALL and AfDB, 2017). Additional evi-dence of the challenge in achieving energy access, is that 69 percent of the commitments to high-impact countries saw disbursement delays.7 This was more prevalent for large-scale infrastructure such as power plants, and trans-mission and distribution. Such delays risk achievement of SDG 7.
The research also confirmed that finance commitments for decentralized energy solutions are miniscule, accounting for roughly $200 million per year, or only one percent of total trackable finance for electricity committed in 2013-14 across the high-impact countries. This fact is alarming,
given that decentralized solutions—alongside centralized energy services—offer enormous promise to provide ba-sic electricity services quickly and at significantly lower costs to rural communities that face the biggest energy access gaps.
Financial commitments for clean cooking in these high-im-pact countries were shockingly low and, if such levels continue, will not have an impact on closing the cooking access gap. Annual residential clean cooking investment needs are by one estimate at least $4.4 billion per year (IEA, 2015); however, trackable residential clean cooking investment in the 20 high-impact countries averaged just $32 million a year in 2013-14.
Finance for clean cooking comes to under $1 per capita per year in high-impact countries, compared to the cost of providing an improved (advanced biomass, alcohol) cookstove for a five-person household of between $8 and $40. It is important to note that these finance needs and commitments do not consider the costs of modern fuels that will enable cleaner cooking. First estimates based on case studies in three countries, indicate that the cost of a cookstove may represent only five percent of the spen-ding needed to move households to cleaner fuels and technologies for cooking.8
However, the research revealed encouraging signs, sug-gesting that with more targeted strategies from national governments and the international finance community, and partnerships with the private sector, energy access gains—especially in rural areas with the biggest gaps—can be delivered faster.
One positive trend since the early 2000s is the steady in-crease in international development finance commitments and disbursements for electricity, although much of this targets non high-impact countries (SEforALL and AfDB, 2017).
1110
ENERGIZING FINANCE: SCALING AND REFINING FINANCE IN COUNTRIES WITH LARGE ENERGY ACCESS GAPS
1 Countries analyzed in the report are identified in the 2015 edition of the Global Tracking Framework (IEA and the World Bank, 2015), which was the latest available when this report was commissioned. The 2017 edition of the report has a slightly amended list of high-impact countries to reflect most recent country progress in energy access.2 The analysis of trends in development finance commitments and disbursements for energy access in 20 high-impact countries looked at a longer time horizon, from 2002-15.3 This analysis was extended to cover 2013-16, since several enterprises were not yet in business or had only start-up sales levels in 2013-14. Debt-equity-grant analysis presented in the report therefore focuses on 2015-16 data.4 The “deep dive” countries have been selected as they: i. are high-impact countries for access to electricity and clean fuels and technologies for cooking, ii. represent different stages of energy sector market development, iii. have baseline Multi-Tier Framework energy access surveys underway, and iv. provide some geographic diversity.5 It was difficult to track flows for energy access for larger, diversified enterprises that are active across multiple sectors such as retail and construction.6 The World Bank’s Multi-Tier Framework provides a way of estimating electricity access based on a spectrum of services. Energy access is classified into five Tiers, with Tier 1 access representing basic lighting and phone charging and Tier 5 access representing at least 23-hour-a-day grid supply.
7 Averaged over 2002-15 and for projects where disbursement data was available. Disbursement constraints relate to difficulties that development partners and beneficia-ries have in meeting a commitment, either in terms of the amount of financing disbursed or the timeframe for disbursement (SEforALL and AfDB, 2017).8 Such estimates do not include the infrastructure investments for piping, storage or needed transport facilities for fuels such as LPG, ethanol and natural gas.
Another encouraging sign that this research shows is that two-thirds of finance for grid-connected generation in 2013-14 is being directed towards renewable energy re-sources, mostly for hydropower and wind projects. This is twice as much as for fossil fuels, which implies that most finance tracked for electricity is also helping to meet cli-mate change goals.
Further, case studies of domestic and international finance commitments in three high-impact countries indicated that national governments can be a significant source of finance for electricity, drawing on their own budgets. In Ethiopia and Kenya, around 21-24 percent of finance for electricity was domestically sourced, and in Bangladesh this was around 44 percent. Around 50 percent of trac-kable finance went to grid-connected generation in each country, reflecting the importance of expanding genera-ting capacity to keep pace with the demands of growing and industrializing economies.
But perhaps the biggest positive indicator is the rapid pro-gress made by a handful of countries on energy access. Of the countries studied in detail,9 Bangladesh and Kenya have made encouraging inroads in urban and rural areas by using policy-driven, integrated electrification strate-gies that incorporate central electric grids, mini-grids and other decentralized solar approaches. They are also put-ting supportive policies in place that will help attract di-verse types of public and private finance for centralized and decentralized energy access projects and companies; for example, Infrastructure Development Co., Ltd (IDCOL) in Bangladesh that supports broad access to local debt
and the rise in pay-as-you-go (PAYGO) companies in Kenya. It is no coincidence that Kenya and Bangladesh are among the top scorers of the high-impact countries on energy access in the Regulatory Indicators for Sustainable Energy (World Bank, 2016), showing that most elements of a strong policy framework are in place.
There have also been several important developments since 2013-14, the focus of this analysis, in addition to the adoption of the SDGs and the Paris Agreement on climate change in 2015. For example, the market for off-grid solar power has accelerated significantly, although the entire market sector remains small,10 and, in 2016, enterprises providing PAYGO solar systems alone raised $223 million in commitments (BNEF, 2017).
Development finance institutions and governments are also refining their financing strategies, particularly in Afri-ca, although most of these efforts are still in the early stages. These include for example, the African Develop-ment Bank’s New Deal for Energy in Africa including the Facility for Energy Inclusion,11 the European Union’s Elec-triFI Program,12 the U.K. Energy Africa Program,13 the Afri-ca Renewable Energy Initiative14 and recent World Bank country programs targeting last mile energy access.15
There is also some positive progress in clean cooking in-vestments, particularly in India, Indonesia and a handful of other countries that have been rolling out strategies using liquefied petroleum gas (LPG) as a clean cooking “transition” fuel.
PATHWAY FOR THE FUTURE
There’s much we can learn from this analysis about how finance for energy access needs to be prioritized as coun-tries manage the delivery of energy services to meet the SDGs and the Paris Agreement. When combined with in-sights on the policy, regulatory and investment context set out in related research,16 these findings can support governments and the finance community identify more targeted, refined strategies to increase investment in grid-scale projects and decentralized energy solutions. By working collaboratively on shared objectives, capital can be leveraged from all types of investors for all types of projects and enterprise needs. It can also lead to quicker, more effective disbursement of finance flows.
The clean cooking challenges are far bigger and more profound. Bold, market-based strategies that focus on fuels and technologies are urgently needed to meet 2030 objectives.
In both cases, structural changes—such as reforming and aligning government policies on energy access and banking-related financing barriers that inhibit energy ac-cess enterprises—are important to ensure that exponen-tially more finance is being allocated for electricity and clean cooking, more quickly.
To accelerate momentum in the high-impact countries, most importantly Sub-Saharan African countries, the fol-lowing recommendations—with details provided in the main body of this report—are offered for key participants in the energy access ecosystem, including policymakers, financial institutions, businesses and civil society organi-zations. They draw on Sustainable Energy for All’s Strate-gic Framework for Results (SEforALL, 2016), partnership engagement and the more granular characteristics of fi-nance for energy access that this collaborative research has produced.
FOR ELECTRICITY
In addition to greater volumes of financing, more targe-ted, collaborative and scaled-up policies, strategies and products are needed to address structural issues in the business-enabling environment, in local financial markets, and in a country’s energy policies.
To support this:
Governments should consider an integrated approach to policy and regulation in the electricity sector that em-braces centralized and decentralized energy technologies and solutions and provides confidence to private inves-tors, particularly for the decentralized energy sector. This should be accomplished by policy, planning and regula-tory approaches that enable access for the most vulne-rable and hardest to reach people. This would require enhanced collaboration between energy ministries and other ministries—such as finance, education, health, rural development and environment—to ensure policy cohe-rence across a range of policy areas in the economy, e.g., across business, banking and investment regulations.
Given the large access and finance gaps in Sub-Saharan Africa, African governments as well as bilateral and multi-lateral financiers should consider developing a shared vi-sion and targeted program of work that embraces energy access goals, enabling policies, utility participation and financing, to deliver SDG 7.
Governments, development finance institutions and other financiers should consider increased support to accelerate residential energy access, primarily for rural and off-grid segments. This should include financing support for the roll-out of innovative business models for electricity pro-ducts and services serving Tiers 1-3, such as mini-grid de-velopers, consumer finance facilities and distributed en-ergy service company business models in countries with large access gaps.
1312
ENERGIZING FINANCE: SCALING AND REFINING FINANCE IN COUNTRIES WITH LARGE ENERGY ACCESS GAPS
9 Bangladesh, Ethiopia and Kenya were selected for detailed analysis on the domestic financing landscape and, together with Nigeria and Myanmar, were targeted for enterprise market surveys.10 Off-grid solar attracted globally $511 million in investment from 2008 to 2015 (BNEF, 2016).11 The Facility for Energy Inclusion (FEI), a pan-African renewable energy debt fund will focus on providing senior and mezzanine debt to off-grid, mini-grid and small-scale Independent Power Producers (IPP).12 Electrification Financing Initiative. Available at: http://electrifi.org/13 The Energy Africa program includes the signing of compacts with national governments that support the acceleration of the off-grid solar market by addressing policy and finance issues that will lead to increased business opportunities, more jobs and improved access to electricity for poor people.14 Africa Renewable Energy Initiative. Available at: http://www.arei.org/15 This includes an approved $150 million credit in Kenya for off-grid access to marginalized communities, a $118 million energy access project in the Congo, DR and proposed projects in Ethiopia and Nigeria of $375 million and $350 million respectively.
16 For example, the Regulatory Indicators for Sustainable Energy (World Bank, 2016), Doing Business (World Bank, 2017a) and the Poor People’s Energy Outlook (Practical Action, 2017).
15
FOR CLEAN COOKING
Stronger emphasis is needed to create “big market” rather than incremental solutions in country. Given the ur-gency and scale of the clean cooking access and finance gap, governments, financiers and other decision-makers should immediately prioritize efforts and financing to scale and accelerate clean cooking solutions that address the needs of all consumers in rural and urban areas. Tran-sitioning to cleaner fuels—including ethanol, LPG and natural gas—will require long-term, “industry-building” initiatives, which must begin immediately to meet 2030 clean cooking goals. These efforts will also require signifi-cant consumer awareness efforts on the opportunities and benefits of clean cooking.
FOR TRACKING FINANCE
Better data is needed to improve understanding of com-plex financial cycles and to identify additional action areas. To varying degrees the research encountered limi-tations in data tracking systems, such as the availability of data on private finance for decentralized energy systems, or the means to distinguish between finance that gene-rates new electricity connections versus improved services for existing connections. Limitations like these could be addressed, for example, by expanding existing internatio-nal data reporting systems such as the OECD DAC CRS to include energy access-relevant information.17
14
17 Such as the segment of the population served and the number of new connections created.
ENERGIZING FINANCE
REPORT SERIES
To find out more, please visit SEforALL.org/EnergizingFinance
17
ENERGIZING FINANCE: SCALING AND REFINING FINANCE IN COUNTRIES WITH LARGE ENERGY ACCESS GAPS
16
GLOSSARY
Centralized electricity solutions: extensions of a country’s electricity grid and/or power sources connected to a country’s existing electricity grid.
Clean and improved fuels and technologies for cooking: The report tracks financial commitments for: advanced biomass stoves and fuel infrastructure; alcohol stoves and fuel infrastructure; biogas digesters; electric stoves; improved biomass stoves; LPG stoves and fuel infrastruc-ture; natural gas stoves and fuel infrastructure; solar coo-kers. These are referred to as “clean cooking solutions” or “clean fuels and technologies for cooking” throughout the report.
Finance for clean cooking: the portion of energy finance commitments supporting clean and improved fuels and technologies for cooking.
Commitments: a firm pledge to provide funds to a spe-cific investment project with the expectation that the pro-ject will go ahead.
Concessional finance: finance where the investing or len-ding party provides financing at rates and/or terms better than or below standard market rates/terms. Often conces-sional finance is provided in exchange for non-financial
goals, such as promoting low-carbon investment.
Decentralized electricity solutions: provision of electri-city, which does not take place through a country’s centra-lized grid. Examples of decentralized electricity solutions would include off-grid solar home systems and local mi-ni-grids not connected to the main electricity grid.
Domestic finance: finance where the funding institution is primarily based in the country where the project is being developed or constructed.
Disbursements: funds that are transferred to a project af-ter a commitment is made. For example, where a funder commits to invest in a project in 2014 but the project can only commence construction in 2015, funds transferred to the projects’ builders and consultants in 2015 are classed as disbursements.
Energy access: the ability of the end user to utilize energy supplies, used here to cover both access to electricity and to clean fuels and technologies for cooking.
Finance for energy: investment commitments for specific technologies, assets and market support activities within the energy sector, regardless of the ultimate end user of the energy supply.
ABBREVIATIONS
% Percent
$ United States Dollars
Bn Billion
CPI Climate Policy Initiative
D: E: G Debt: Equity: Grant
DFIs Development Finance Institutions
GACC Global Alliance for Clean Cookstoves
GDP Gross Domestic Product
IDCOL Infrastructure Development Co., Ltd, Bangladesh
IEA International Energy Agency
kW kilowatt
kWh kilowatts per hour
LPG Liquefied petroleum gas
M Million
MTF Multi-Tier Framework
NGO Non-governmental organizations
OECD Organisation for Economic Cooperation and Development
OECD DAC CRS OECD’s Development Assistance Committee Creditor Reporting System
SDG Sustainable Development Goal
W Watts
Wh Watts per hour
1918
Energy infrastructure: any assets used in the genera-tion or transmission of electricity, transportation of clean cooking fuels or cooking itself.
Finance for electricity: the portion of energy finance com-mitments supporting all grid-connected plants, electricity transmission and distribution infrastructure and mini-grid and off-grid solutions.
Financial value: the value of something in US dollars at the time of measurement.
High-impact countries: the 20 countries with the highest absolute gaps in access to electricity and/or clean fuels and technologies for cooking measured by population, as identified in the 2015 Global Tracking Framework (IEA and the World Bank, 2015). For electricity access, the coun-tries are: Afghanistan, Angola, Bangladesh, Burkina Faso, Congo (DR), Ethiopia, India, Kenya, Korea (DPR), Mada-gascar, Malawi, Mozambique, Myanmar, Niger, Nigeria, the Philippines, Sudan, Tanzania, Uganda and Yemen. For clean cooking access, the countries are: Afghanistan, Ban-gladesh, China, Congo (DR), Ethiopia, India, Indonesia, Kenya, Korea (DPR), Madagascar, Mozambique, Myanmar, Nepal, Nigeria, Pakistan, the Philippines, Sudan, Tanzania, Uganda and Vietnam.
Finance for residential clean cooking access: the esti-mated portion of finance for clean cooking for which the residential sector is the ultimate end user, i.e., finance that can be considered as increasing residential access to clean and improved fuels and technologies for cooking.
Finance for residential electricity access: the estimated portion of finance for electricity where the residential sec-
tor is the ultimate end user, i.e., finance that can be consi-dered as increasing residential access to electricity.
International finance: finance where the funding institu-tion is primarily based outside the country where the pro-ject is being developed or constructed.
Multi-Tier Framework (MTF): measures the level of en-ergy access provided by energy finance to residential consumers. Rather than using binary measures of energy access (e.g., having or not having a household electrical connection), which do not consider the quality, regularity, or affordability of service, the MTF instead recognizes that access to electricity is a continuum. Finance is therefore allocated to five “Tiers,” from Tier 0 (“no access”) to Tier 5 (“very high level of access”), based on the Multi-Tier Framework (MTF) developed by the World Bank (Bhatia and Angelou, 2015) and supported by SEforALL.
Non-concessional finance: finance provided on market terms and rates.
Public finance/private finance: whether a finance flow is classed as public or private is determined by who is un-dertaking a project. In alignment with the OECD (2013), finance qualifies as public if carried out by central, state or local governments and their agencies at their own risk and responsibility.
Residential consumers: all consumers in a country aside from any business or government consumers. The inten-tion is broadly to capture residential consumption, dis-counting business consumption where businesses are run from households where possible.
ENERGIZING FINANCE
REPORT SERIES
To find out more, please visit SEforALL.org/EnergizingFinance
20
In 2014, 1.06 billion people still lacked access to electricity and more than 3.04 billion lacked access to clean cooking. Most these populations are in developing countries, pre-dominantly in Sub-Saharan Africa and Asia (IEA and World Bank, 2017).
The connection between access to energy, and economic growth and prosperity, is irrefutable (IEA, 2016). Research shows that access to modern energy services is critical for reducing poverty, improving health, increasing producti-vity and promoting a country’s overall economic develop-
ment (SEAR, 2017). Access to energy services is important for providing clean water, sanitation and healthcare, and reliable and efficient lighting, heating, cooking, mecha-nical power, transport and telecommunications services.
The challenges inherent in achieving universal access to affordable, reliable, sustainable and modern energy ser-vices by 2030 (SDG 7)—a mere 13 years from now—are enormous, particularly for the 20 high-impact countries (Box 1).
THE ENERGY ACCESSCHALLENGE
ENERGIZING FINANCE: SCALING AND REFINING FINANCE IN COUNTRIES WITH LARGE ENERGY ACCESS GAPS
21
Also eleven high-impact countries have adopted speci-fic energy access targets in their Nationally Determined Contributions, highlighting their importance for delivering the Paris Agreement on climate change. Despite this, re-latively little is known about the volume or composition of finance directed to the energy sectors in developing countries (Box 2).
Having an accurate assessment of current financing flows and gaps will help ensure that the right volume and com-position of finance is committed and disbursed to the right types of projects and enterprises, with the right risk profile, in the right locations, at an accelerated pace to meet these goals.
Sustainable Energy for All’s pioneering research partnership with the World Bank, the African Development Bank, Cli-mate Policy Initiative, Practical Action Consulting and E3 Analytics looks at the challenges inherent in closing ener-
gy access gaps and how finance is provided for residential energy services in high-impact countries (Box 3).
The research aims to develop a first consistent, robust, transparent and replicable approach to answer the fol-lowing questions:
• What is being committed by public and private, in-ternational and domestic sources of finance to sup-port access to electricity and clean cooking? How much finance supports residential energy access?
• What is known about the types of finance that are being committed, the finance channels and the finan-cing needs of enterprises providing decentralized en-ergy services?
• What barriers impede the effective disbursement of development finance to the energy sector?
Box 1 - High-impact countries
The SEforALL Global Tracking Framework identifies 20 high-impact countries for electricity and clean cooking access whose efforts are critical to achieve the SEforALL objectives globally by 2030. This report uses the list of high-impact countries identified in the 2015 Global Tracking Framework (IEA and World Bank, 2015)–that was the most up-to-date source when this research was commissioned.
Energy access in the high-impact countries Electricity Clean cooking
Total global population without access (billion) 1.06 3.04
Population without access in the high-impact countries (billion) 0.84 2.56
Population without access in the high-impact countries as a share of total population without access (%)
80 84
Box 2 - Data challenges
There have been few studies that attempt to systematically capture what countries are spending from all sources—public and private, domestic and international—for electricity and clean cooking access. This research attempt to fill this gap. It draws on international databases for finance commitments and explores what portion of finance commitments support residential access. Development finance disbursement trends are examined, given their importance for high-impact countries.
Data on domestic finance is poor and case studies in Kenya, Ethiopia and Bangladesh aim to fill this gap. They draw on existing databases and surveys of governments, utilities and other local institutions to capture domestic public finance. Complementary analysis is conducted of energy access enterprise needs in these markets plus Nigeria and Myanmar.
Inevitably, when piloting a new approach, data limitations are encountered that can offer insights on where to strengthen data tracking systems in the future. For example, better data tracking is needed for private finance of decentralized energy systems and for clean cooking. Also, there is a need to better distinguish between finance that generates new electricity connections versus improved service for existing connections.
FINANCE FOR ELECTRICITY
FINANCING COMMITMENTS
Investments in electricity access are not keeping pace with needs estimated at $45 billion annually (SEforALL, 2015). Over 2013-14, finance commitments for electricity in the 20 high-impact countries were at least $19.4 billion a year on average—increasing from $18.7 billion in 2013 to $20.1 billion in 2014 (see Annex, Figure A1).
International finance made up just over half of all commit-ments tracked, or an average of $11.7 billion per year. This was largely driven by multilateral institutions (36 percent), donors and investors in developed countries (38 percent) and other developing countries (27 percent). Twenty-one percent of finance originated in China, the largest bilateral donor across the high-impact countries.
This average annual commitment from all sources—pu-blic, private, international and domestic—consisted of:
• Grid-connected renewables ($10 billion per year)
• Transmission and distribution ($3.6 billion per year18)
• Grid-connected fossil fuel power19 ($4 billion per year)
• Market support ($1.6 billion per year)
• Decentralized energy ($200 million per year)
Almost all trackable financial commitments for electricity were aimed at grid electricity, with two-thirds of this to renewable energy and one-third to fossil fuels. Only one
2322
ENERGIZING FINANCE: SCALING AND REFINING FINANCE IN COUNTRIES WITH LARGE ENERGY ACCESS GAPS
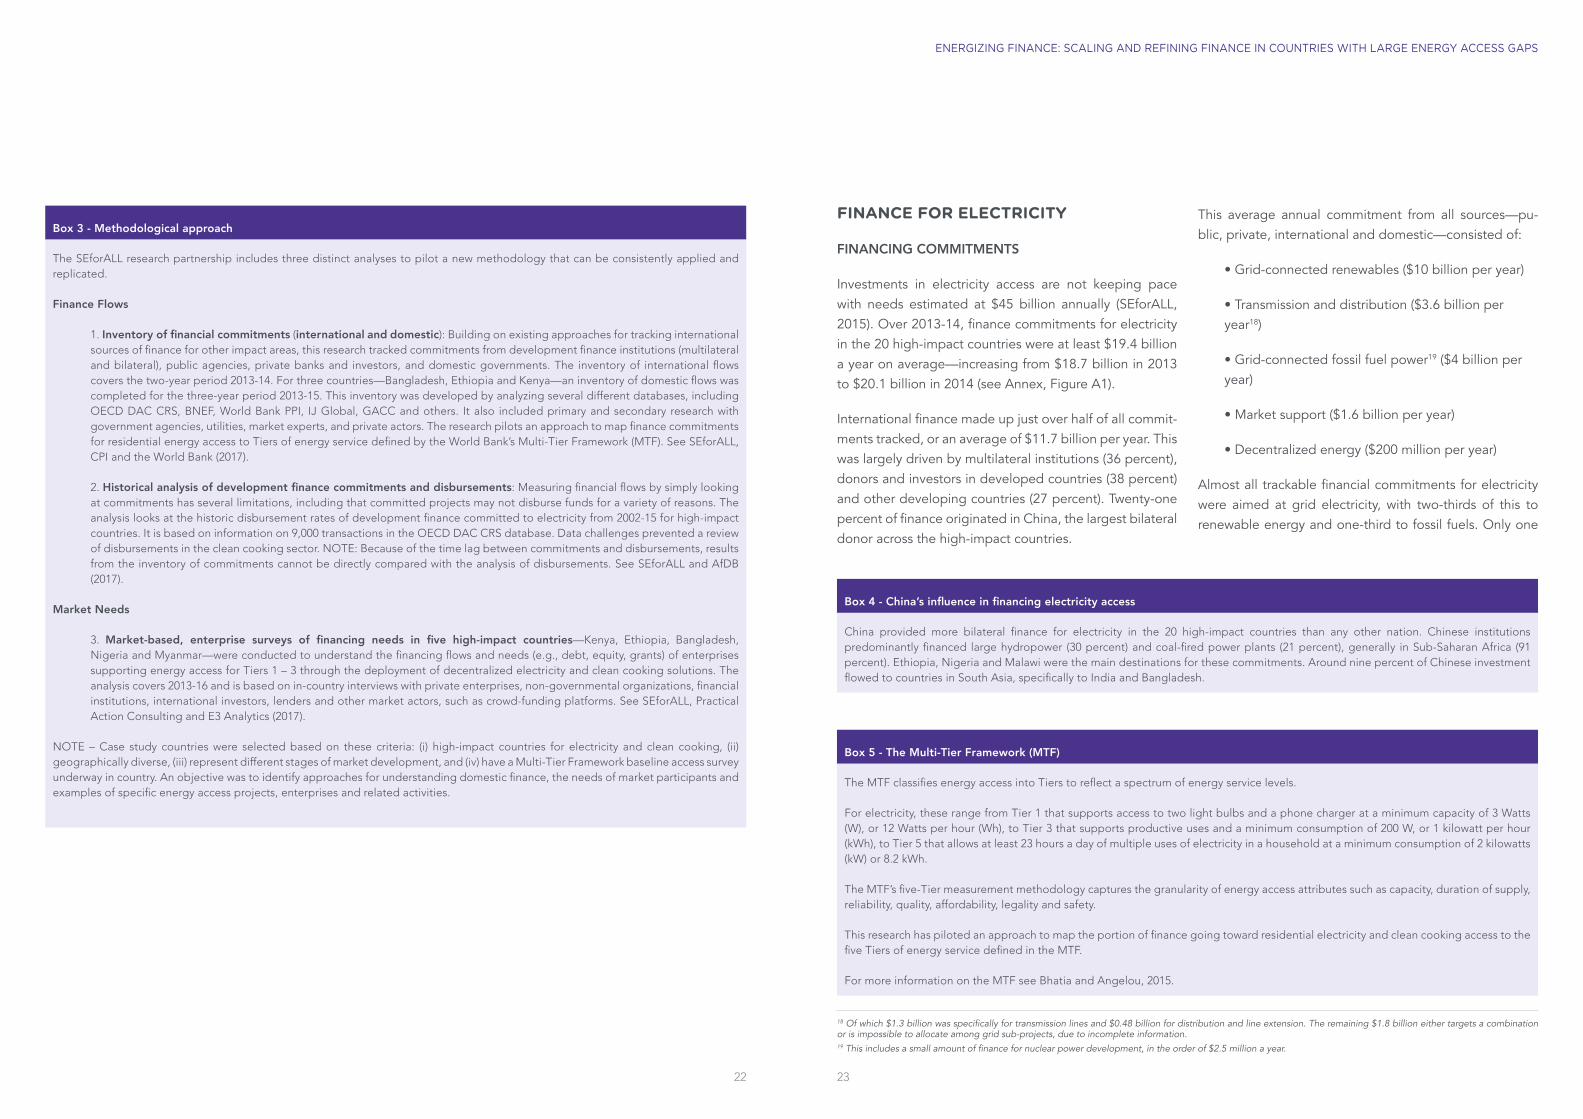
Box 3 - Methodological approach
The SEforALL research partnership includes three distinct analyses to pilot a new methodology that can be consistently applied and replicated.
Finance Flows
1. Inventory of financial commitments (international and domestic): Building on existing approaches for tracking international sources of finance for other impact areas, this research tracked commitments from development finance institutions (multilateral and bilateral), public agencies, private banks and investors, and domestic governments. The inventory of international flows covers the two-year period 2013-14. For three countries—Bangladesh, Ethiopia and Kenya—an inventory of domestic flows was completed for the three-year period 2013-15. This inventory was developed by analyzing several different databases, including OECD DAC CRS, BNEF, World Bank PPI, IJ Global, GACC and others. It also included primary and secondary research with government agencies, utilities, market experts, and private actors. The research pilots an approach to map finance commitments for residential energy access to Tiers of energy service defined by the World Bank’s Multi-Tier Framework (MTF). See SEforALL, CPI and the World Bank (2017).
2. Historical analysis of development finance commitments and disbursements: Measuring financial flows by simply looking at commitments has several limitations, including that committed projects may not disburse funds for a variety of reasons. The analysis looks at the historic disbursement rates of development finance committed to electricity from 2002-15 for high-impact countries. It is based on information on 9,000 transactions in the OECD DAC CRS database. Data challenges prevented a review of disbursements in the clean cooking sector. NOTE: Because of the time lag between commitments and disbursements, results from the inventory of commitments cannot be directly compared with the analysis of disbursements. See SEforALL and AfDB (2017).
Market Needs
3. Market-based, enterprise surveys of financing needs in five high-impact countries—Kenya, Ethiopia, Bangladesh, Nigeria and Myanmar—were conducted to understand the financing flows and needs (e.g., debt, equity, grants) of enterprises supporting energy access for Tiers 1 – 3 through the deployment of decentralized electricity and clean cooking solutions. The analysis covers 2013-16 and is based on in-country interviews with private enterprises, non-governmental organizations, financial institutions, international investors, lenders and other market actors, such as crowd-funding platforms. See SEforALL, Practical Action Consulting and E3 Analytics (2017).
NOTE – Case study countries were selected based on these criteria: (i) high-impact countries for electricity and clean cooking, (ii) geographically diverse, (iii) represent different stages of market development, and (iv) have a Multi-Tier Framework baseline access survey underway in country. An objective was to identify approaches for understanding domestic finance, the needs of market participants and examples of specific energy access projects, enterprises and related activities.
18 Of which $1.3 billion was specifically for transmission lines and $0.48 billion for distribution and line extension. The remaining $1.8 billion either targets a combination or is impossible to allocate among grid sub-projects, due to incomplete information. 19 This includes a small amount of finance for nuclear power development, in the order of $2.5 million a year.
Box 4 - China’s influence in financing electricity access
China provided more bilateral finance for electricity in the 20 high-impact countries than any other nation. Chinese institutions predominantly financed large hydropower (30 percent) and coal-fired power plants (21 percent), generally in Sub-Saharan Africa (91 percent). Ethiopia, Nigeria and Malawi were the main destinations for these commitments. Around nine percent of Chinese investment flowed to countries in South Asia, specifically to India and Bangladesh.
Box 5 - The Multi-Tier Framework (MTF)
The MTF classifies energy access into Tiers to reflect a spectrum of energy service levels.
For electricity, these range from Tier 1 that supports access to two light bulbs and a phone charger at a minimum capacity of 3 Watts (W), or 12 Watts per hour (Wh), to Tier 3 that supports productive uses and a minimum consumption of 200 W, or 1 kilowatt per hour (kWh), to Tier 5 that allows at least 23 hours a day of multiple uses of electricity in a household at a minimum consumption of 2 kilowatts (kW) or 8.2 kWh.
The MTF’s five-Tier measurement methodology captures the granularity of energy access attributes such as capacity, duration of supply, reliability, quality, affordability, legality and safety.
This research has piloted an approach to map the portion of finance going toward residential electricity and clean cooking access to the five Tiers of energy service defined in the MTF.
For more information on the MTF see Bhatia and Angelou, 2015.
2524
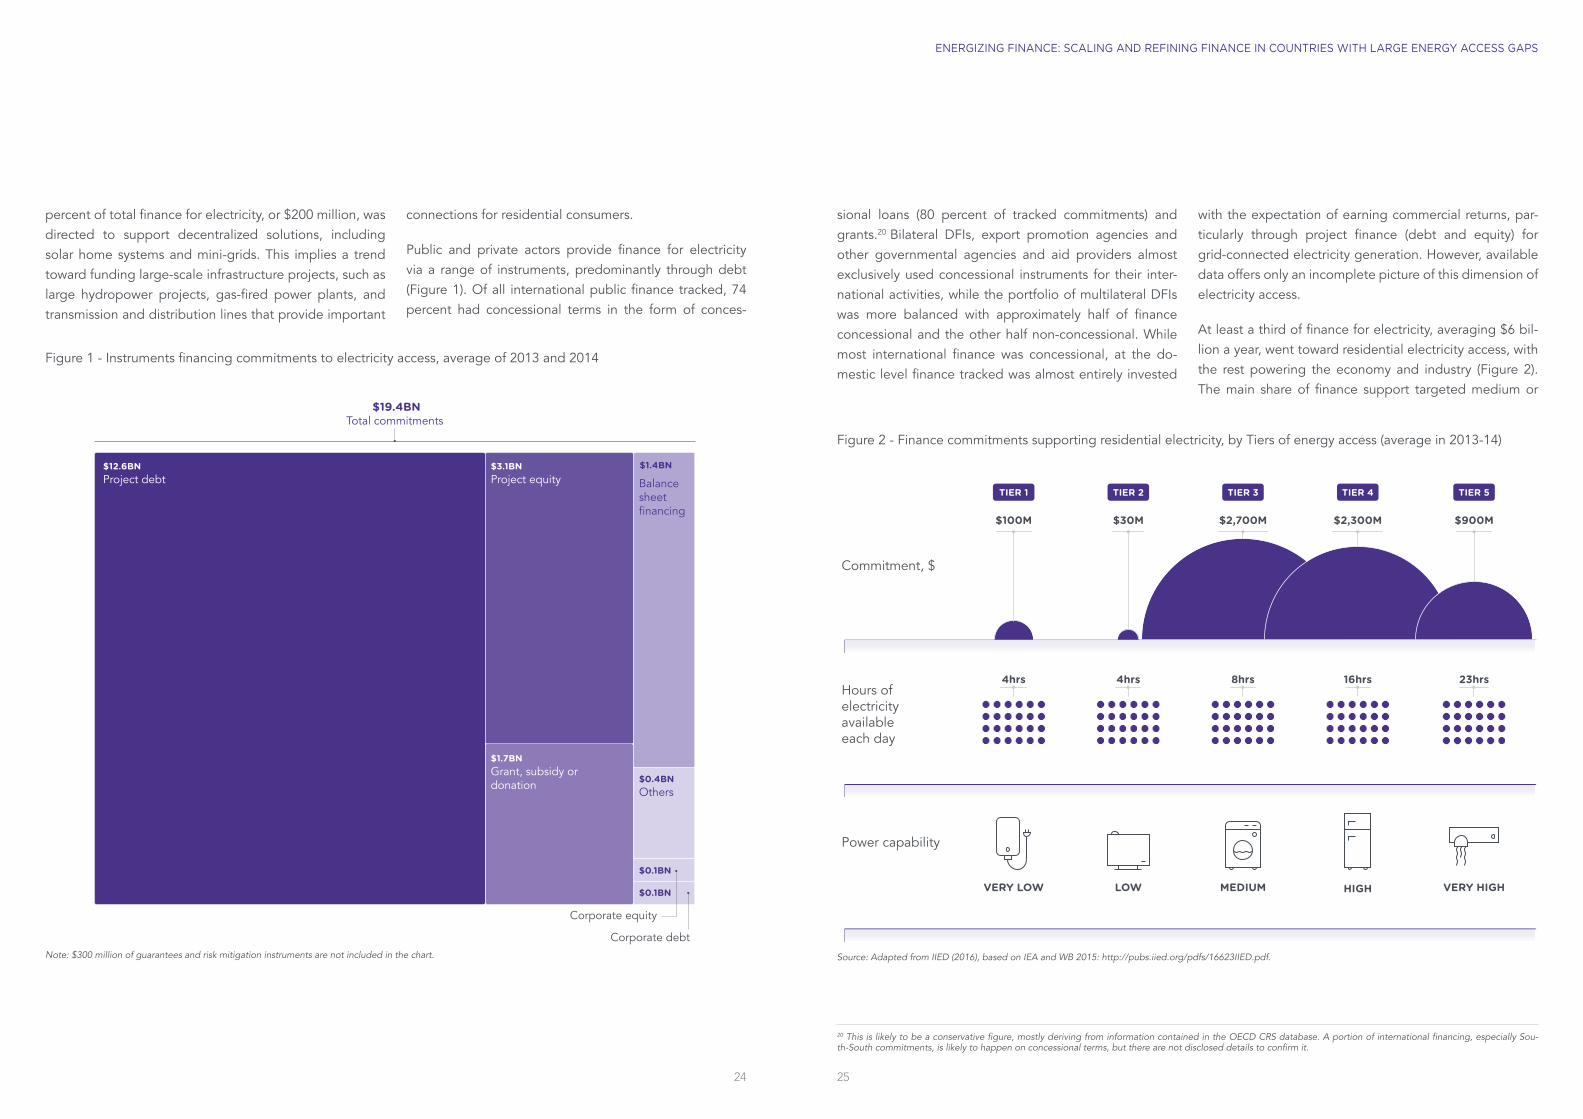
percent of total finance for electricity, or $200 million, was directed to support decentralized solutions, including solar home systems and mini-grids. This implies a trend toward funding large-scale infrastructure projects, such as large hydropower projects, gas-fired power plants, and transmission and distribution lines that provide important
connections for residential consumers.
Public and private actors provide finance for electricity via a range of instruments, predominantly through debt (Figure 1). Of all international public finance tracked, 74 percent had concessional terms in the form of conces-
sional loans (80 percent of tracked commitments) and grants.20 Bilateral DFIs, export promotion agencies and other governmental agencies and aid providers almost exclusively used concessional instruments for their inter-national activities, while the portfolio of multilateral DFIs was more balanced with approximately half of finance concessional and the other half non-concessional. While most international finance was concessional, at the do-mestic level finance tracked was almost entirely invested
with the expectation of earning commercial returns, par-ticularly through project finance (debt and equity) for grid-connected electricity generation. However, available data offers only an incomplete picture of this dimension of electricity access.
At least a third of finance for electricity, averaging $6 bil-lion a year, went toward residential electricity access, with the rest powering the economy and industry (Figure 2). The main share of finance support targeted medium or
ENERGIZING FINANCE: SCALING AND REFINING FINANCE IN COUNTRIES WITH LARGE ENERGY ACCESS GAPS
Figure 1 - Instruments financing commitments to electricity access, average of 2013 and 2014
Figure 2 - Finance commitments supporting residential electricity, by Tiers of energy access (average in 2013-14)
Commitment, $
Hours of electricity available each day
Power capability
$100M $30M $2,700M $2,300M $900M
VERY LOW LOW MEDIUM HIGH VERY HIGH
4hrs 4hrs 8hrs 16hrs 23hrs
TIER 1 TIER 2 TIER 3 TIER 4 TIER 5
Note: $300 million of guarantees and risk mitigation instruments are not included in the chart. Source: Adapted from IIED (2016), based on IEA and WB 2015: http://pubs.iied.org/pdfs/16623IIED.pdf.
Balance sheet financing
Corporate debt
Corporate equity
$1.7BNGrant, subsidy or donation
$12.6BN Project debt
$3.1BN Project equity
$1.4BN
$0.4BN Others
$0.1BN
$0.1BN
$19.4BNTotal commitments
20 This is likely to be a conservative figure, mostly deriving from information contained in the OECD CRS database. A portion of international financing, especially Sou-th-South commitments, is likely to happen on concessional terms, but there are not disclosed details to confirm it.
higher levels of residential electricity access (at Tier 3 and above) and improvements in service to households that were already electrified. Finance flows to Tier 1 and 2, while much smaller, are an important source of finance for low-cost decentralized solutions that can be rapidly de-ployed particularly in rural areas.
Electricity financing commitments showed significant bias towards countries in Asia. India, the Philippines and Ban-gladesh were the top three recipients, receiving approxi-mately 60 percent or $11.6 billion a year over 2013-14. While these three countries represent a significant portion of the populations without electricity and clean cooking, Nigeria and Ethiopia were the next largest recipients with combined commitments of $2.4 billion a year. Finance commitments for electricity in the other 15 high-impact countries stood below $1 billion a year across all technolo-gies, including grid-connected and decentralized energy technologies. Eleven of these countries are in Sub-Saha-ran Africa.
FINANCING DISBURSEMENTS
Financing from multilateral and bilateral development ins-titutions has historically made up a significant portion of the finance commitments to electricity access in high-im-pact countries. While the mix of financing sources may be changing as new sources of financing become more relevant, a look at how effectively development finance has been disbursing to on-the-ground projects—such as transmission and distribution, large hydropower and fos-sil-based power generation, renewables (both large and small) and energy sector reform projects—is important for countries with large, underserved populations.
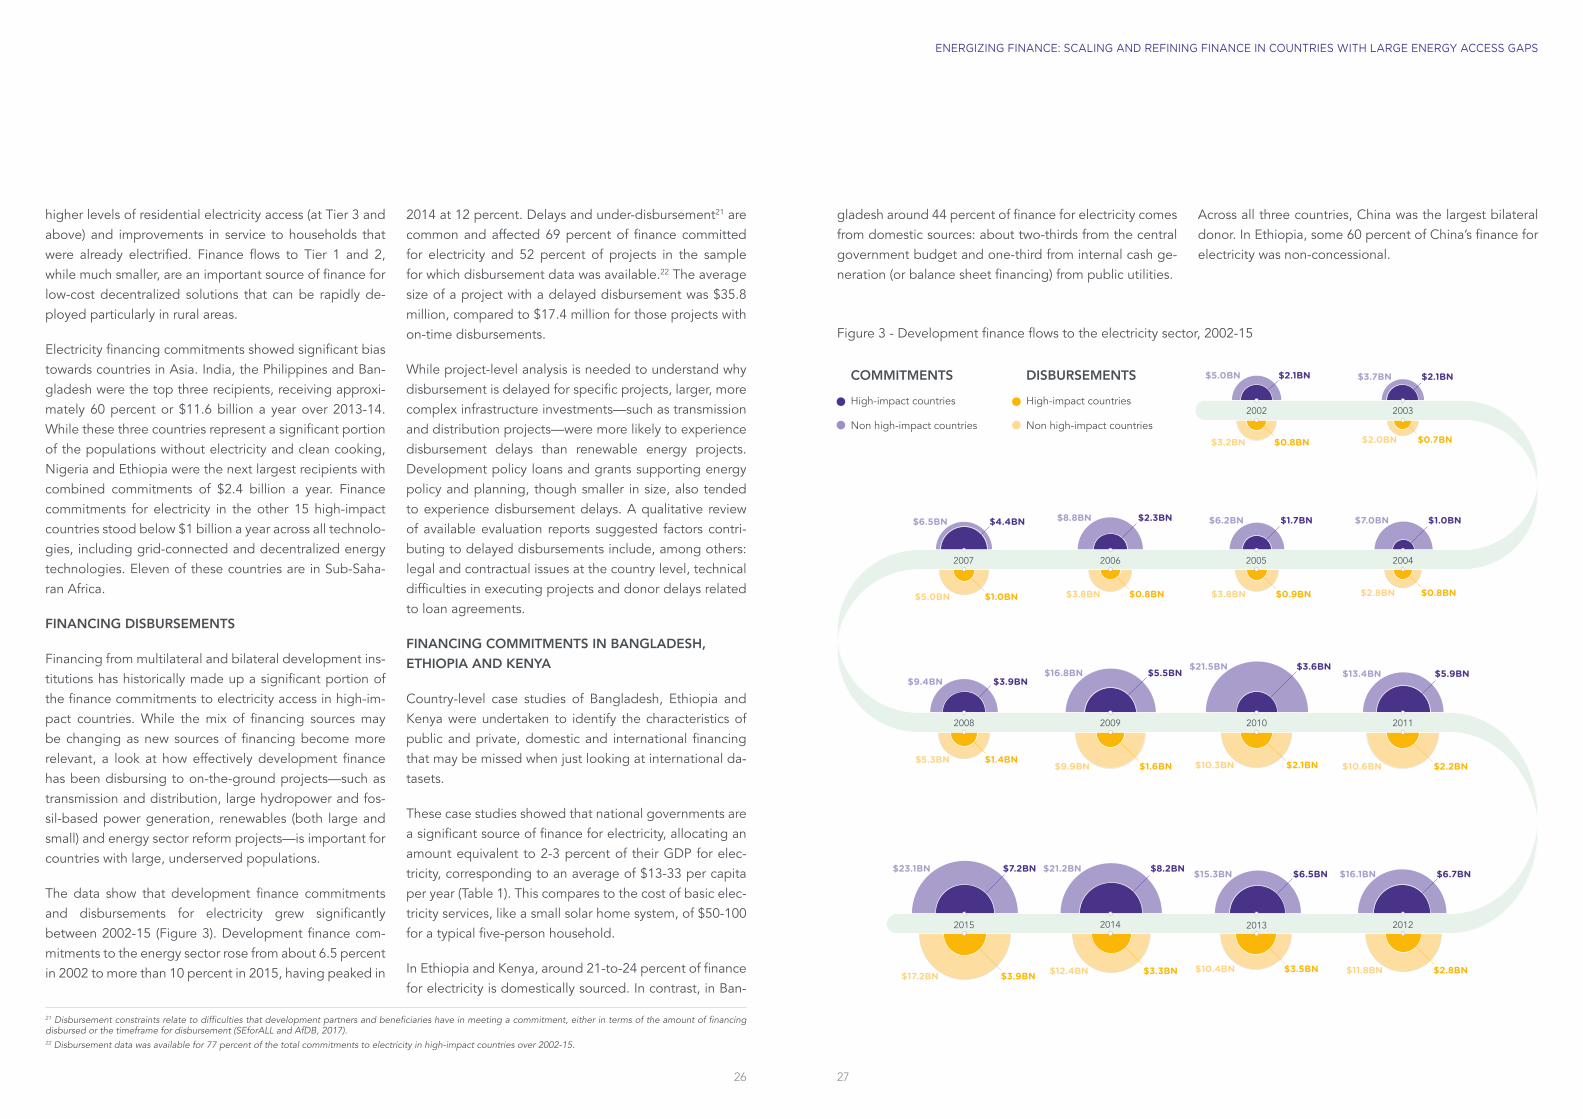
The data show that development finance commitments and disbursements for electricity grew significantly between 2002-15 (Figure 3). Development finance com-mitments to the energy sector rose from about 6.5 percent in 2002 to more than 10 percent in 2015, having peaked in
2014 at 12 percent. Delays and under-disbursement21 are common and affected 69 percent of finance committed for electricity and 52 percent of projects in the sample for which disbursement data was available.22 The average size of a project with a delayed disbursement was $35.8 million, compared to $17.4 million for those projects with on-time disbursements.
While project-level analysis is needed to understand why disbursement is delayed for specific projects, larger, more complex infrastructure investments—such as transmission and distribution projects—were more likely to experience disbursement delays than renewable energy projects. Development policy loans and grants supporting energy policy and planning, though smaller in size, also tended to experience disbursement delays. A qualitative review of available evaluation reports suggested factors contri-buting to delayed disbursements include, among others: legal and contractual issues at the country level, technical difficulties in executing projects and donor delays related to loan agreements.
FINANCING COMMITMENTS IN BANGLADESH, ETHIOPIA AND KENYA
Country-level case studies of Bangladesh, Ethiopia and Kenya were undertaken to identify the characteristics of public and private, domestic and international financing that may be missed when just looking at international da-tasets.
These case studies showed that national governments are a significant source of finance for electricity, allocating an amount equivalent to 2-3 percent of their GDP for elec-tricity, corresponding to an average of $13-33 per capita per year (Table 1). This compares to the cost of basic elec-tricity services, like a small solar home system, of $50-100 for a typical five-person household.
In Ethiopia and Kenya, around 21-to-24 percent of finance for electricity is domestically sourced. In contrast, in Ban-
gladesh around 44 percent of finance for electricity comes from domestic sources: about two-thirds from the central government budget and one-third from internal cash ge-neration (or balance sheet financing) from public utilities.
Across all three countries, China was the largest bilateral donor. In Ethiopia, some 60 percent of China’s finance for electricity was non-concessional.
2726
ENERGIZING FINANCE: SCALING AND REFINING FINANCE IN COUNTRIES WITH LARGE ENERGY ACCESS GAPS
21 Disbursement constraints relate to difficulties that development partners and beneficiaries have in meeting a commitment, either in terms of the amount of financing disbursed or the timeframe for disbursement (SEforALL and AfDB, 2017).22 Disbursement data was available for 77 percent of the total commitments to electricity in high-impact countries over 2002-15.
Figure 3 - Development finance flows to the electricity sector, 2002-15
COMMITMENTS
High-impact countries
Non high-impact countries
DISBURSEMENTS
High-impact countries
Non high-impact countries
$5.0BN $2.1BN $2.1BN$3.7BN
$6.2BN $1.7BN$8.8BN $2.3BN$4.4BN$6.5BN
$3.9BN$9.4BN$5.5BN$16.8BN $5.9BN$13.4BN
$3.6BN$21.5BN
$16.1BN $6.7BN$15.3BN $6.5BN$21.2BN $8.2BN$23.1BN $7.2BN
$7.0BN $1.0BN
$5.3BN $1.4BN$9.9BN $1.6BN
$3.2BN $0.8BN $2.0BN $0.7BN
$2.8BN $0.8BN$3.8BN $0.9BN$3.8BN $0.8BN$5.0BN $1.0BN
$10.3BN $2.1BN $10.6BN $2.2BN
$11.8BN $2.8BN$10.4BN $3.5BN$12.4BN $3.3BN$17.2BN $3.9BN
2013 20122015 2014
2003
2007 2006 2005
2010 20112008 2009
2004
2002
THE FINANCING NEEDS OF ENTERPRISES PROVIDING DECENTRALIZED ELECTRICITY
Bottom-up market assessments were conducted including more than 100 in-depth interviews with senior-level offi-cials from enterprises, non-governmental organizations (NGOs) and development finance institutions in Ban-gladesh, Ethiopia, Kenya, Myanmar and Nigeria. These showed a diverse ecosystem of energy access enter-prises—across the for-profit, social enterprise and NGO spectrum—providing Tiers 1-3 electricity services through decentralized technologies. Many face challenges in ac-cessing finance, affecting their ability to grow and expand customer reach.
Energy enterprises delivering Tiers 1-3 electricity ac-cess faced significant challenges in obtaining reasonably priced financing to maintain or grow their companies over 2013-16. In most countries, enterprises operate on thin margins in high-risk environments with few safeguards and little forward guidance. They are primarily financed through corporate equity, with little access to local debt. The exception is Bangladesh where a state entity, the In-frastructure Development Co, Ltd (IDCOL), has blended capital from multiple international development finance sources to provide local enterprises with business support and local currency debt. This has helped to expand en-ergy access to rural areas and improve energy services in urban areas.
In Kenya, the expansion of the pay-as-you-go (PAYGO) mo-del has been driven primarily through equity investment and by the private sector. The combination of sophisti-cated real-time analytics, large networks of on-the-ground sales representatives, customized consumer finance solu-tions and the spread of mobile money, has proved to be a powerful combination that is helping to make significant gains in Tiers 1-3 of electricity access. While the other four countries surveyed show varying levels of adaption and replication of the PAYGO business model, none is nearly
as advanced in this regard as Kenya, which remains a mar-ket leader. The latter’s success was contingent on a range of factors, including policy clarity, a well-developed finan-cial sector, an active mobile money market, ready access to foreign exchange and a relatively stable currency, as well as simplified import procedures.
Table 2 identifies some of the variations of the market and enterprise characteristics across the five countries sur-veyed.
The five-country market needs research examined the composition of capital the enterprises have received to date and surveyed future expectations. This research sug-gests that enterprises delivering Tiers 1-3 electricity solu-tions will require future financing shares of approximately 59 percent debt, 33 percent equity and 8 percent grant to scale operations and meet 2030 targets. These D:E:G ra-tios reflect what would be expected as the markets mature and debt and working capital needs continue to increase to support customer growth. At the time of the country le-vel surveys, only Bangladesh registered this level of debt.
RECOMMENDATIONS
This research allows a first insight on the characteristics of the sources, volumes and type of financial commitments for electricity access in high-impact countries. Coupled with the more detailed understanding of market trends, policy frameworks, national planning requirements23 and resource availability, it can help refine the focus of finance and support more effective and strategic decision-making by key stakeholders supporting SDG 7.
For electricity access, the following insights are derived from this initial assessment of finance flows and needs in high-impact countries:
• Electricity projects providing Tiers 3 to 5 energy services receive 90 percent of commitments and are characterized by:
2928
ENERGIZING FINANCE: SCALING AND REFINING FINANCE IN COUNTRIES WITH LARGE ENERGY ACCESS GAPS
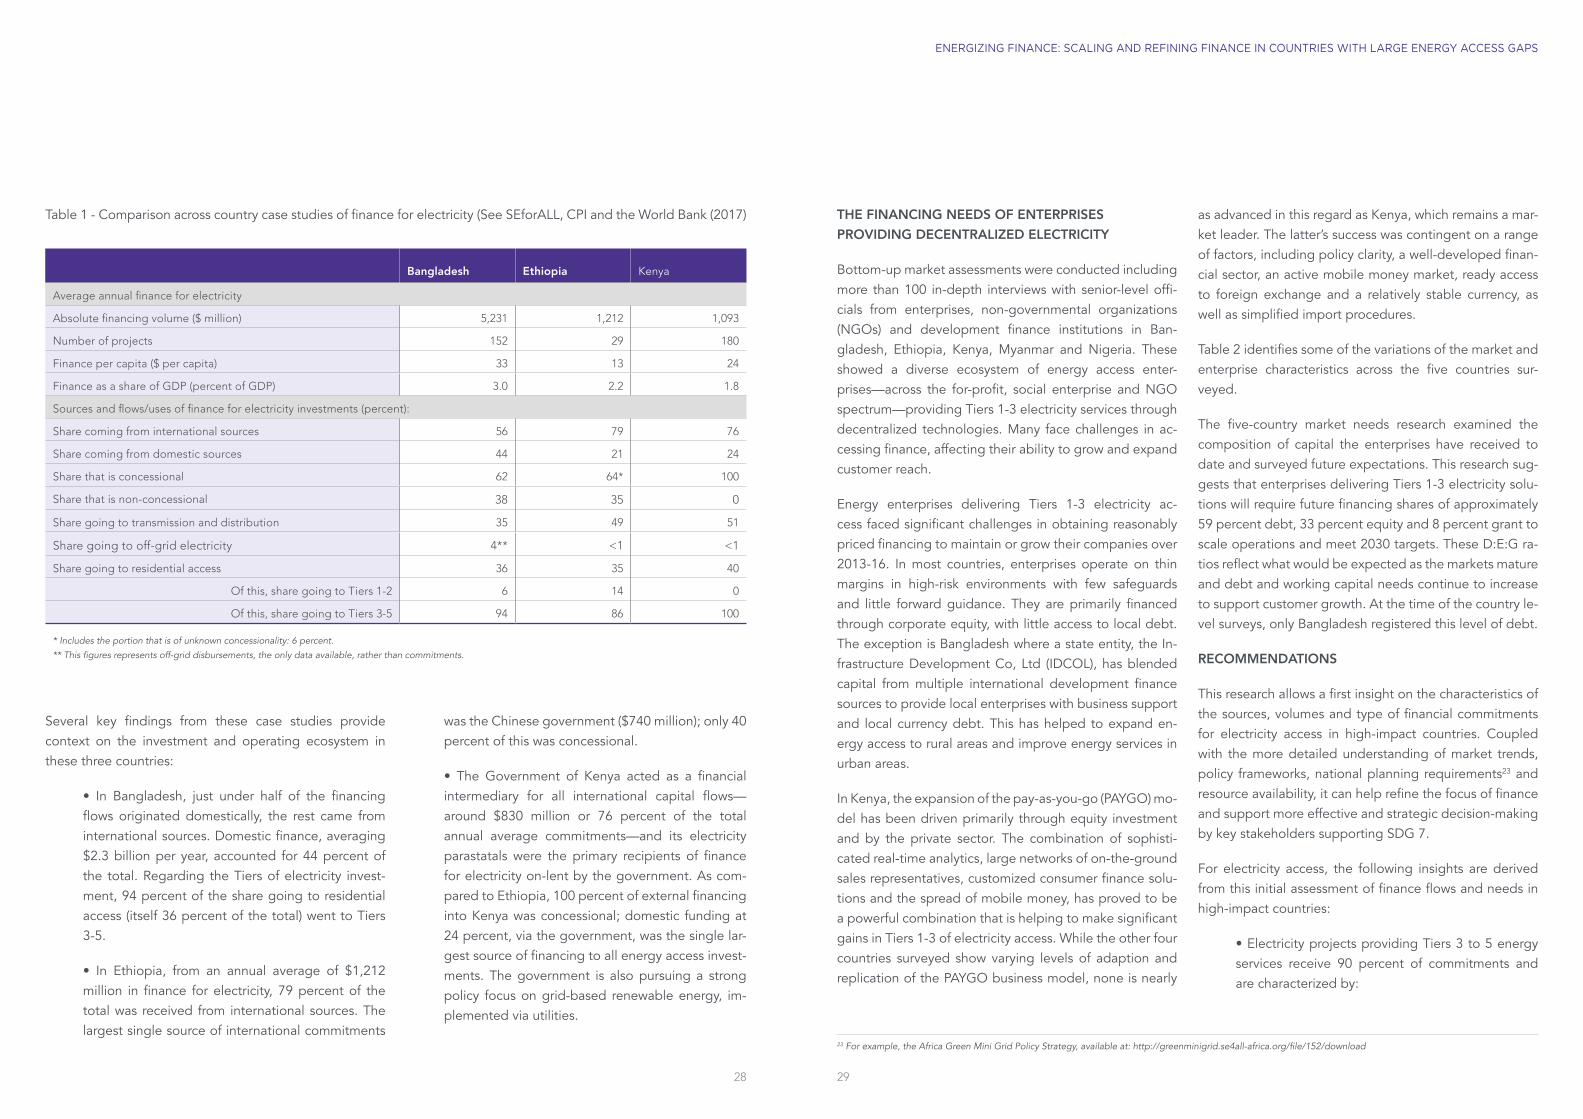
Table 1 - Comparison across country case studies of finance for electricity (See SEforALL, CPI and the World Bank (2017)
Bangladesh Ethiopia Kenya
Average annual finance for electricity
Absolute financing volume ($ million) 5,231 1,212 1,093
Number of projects 152 29 180
Finance per capita ($ per capita) 33 13 24
Finance as a share of GDP (percent of GDP) 3.0 2.2 1.8
Sources and flows/uses of finance for electricity investments (percent):
Share coming from international sources 56 79 76
Share coming from domestic sources 44 21 24
Share that is concessional 62 64* 100
Share that is non-concessional 38 35 0
Share going to transmission and distribution 35 49 51
Share going to off-grid electricity 4** <1 <1
Share going to residential access 36 35 40
Of this, share going to Tiers 1-2 6 14 0
Of this, share going to Tiers 3-5 94 86 100
* Includes the portion that is of unknown concessionality: 6 percent.
** This figures represents off-grid disbursements, the only data available, rather than commitments.
Several key findings from these case studies provide context on the investment and operating ecosystem in these three countries:
• In Bangladesh, just under half of the financing flows originated domestically, the rest came from international sources. Domestic finance, averaging $2.3 billion per year, accounted for 44 percent of the total. Regarding the Tiers of electricity invest-ment, 94 percent of the share going to residential access (itself 36 percent of the total) went to Tiers 3-5.
• In Ethiopia, from an annual average of $1,212 million in finance for electricity, 79 percent of the total was received from international sources. The largest single source of international commitments
was the Chinese government ($740 million); only 40 percent of this was concessional.
• The Government of Kenya acted as a financial intermediary for all international capital flows—around $830 million or 76 percent of the total annual average commitments—and its electricity parastatals were the primary recipients of finance for electricity on-lent by the government. As com-pared to Ethiopia, 100 percent of external financing into Kenya was concessional; domestic funding at 24 percent, via the government, was the single lar-gest source of financing to all energy access invest-ments. The government is also pursuing a strong policy focus on grid-based renewable energy, im-plemented via utilities.
23 For example, the Africa Green Mini Grid Policy Strategy, available at: http://greenminigrid.se4all-africa.org/file/152/download
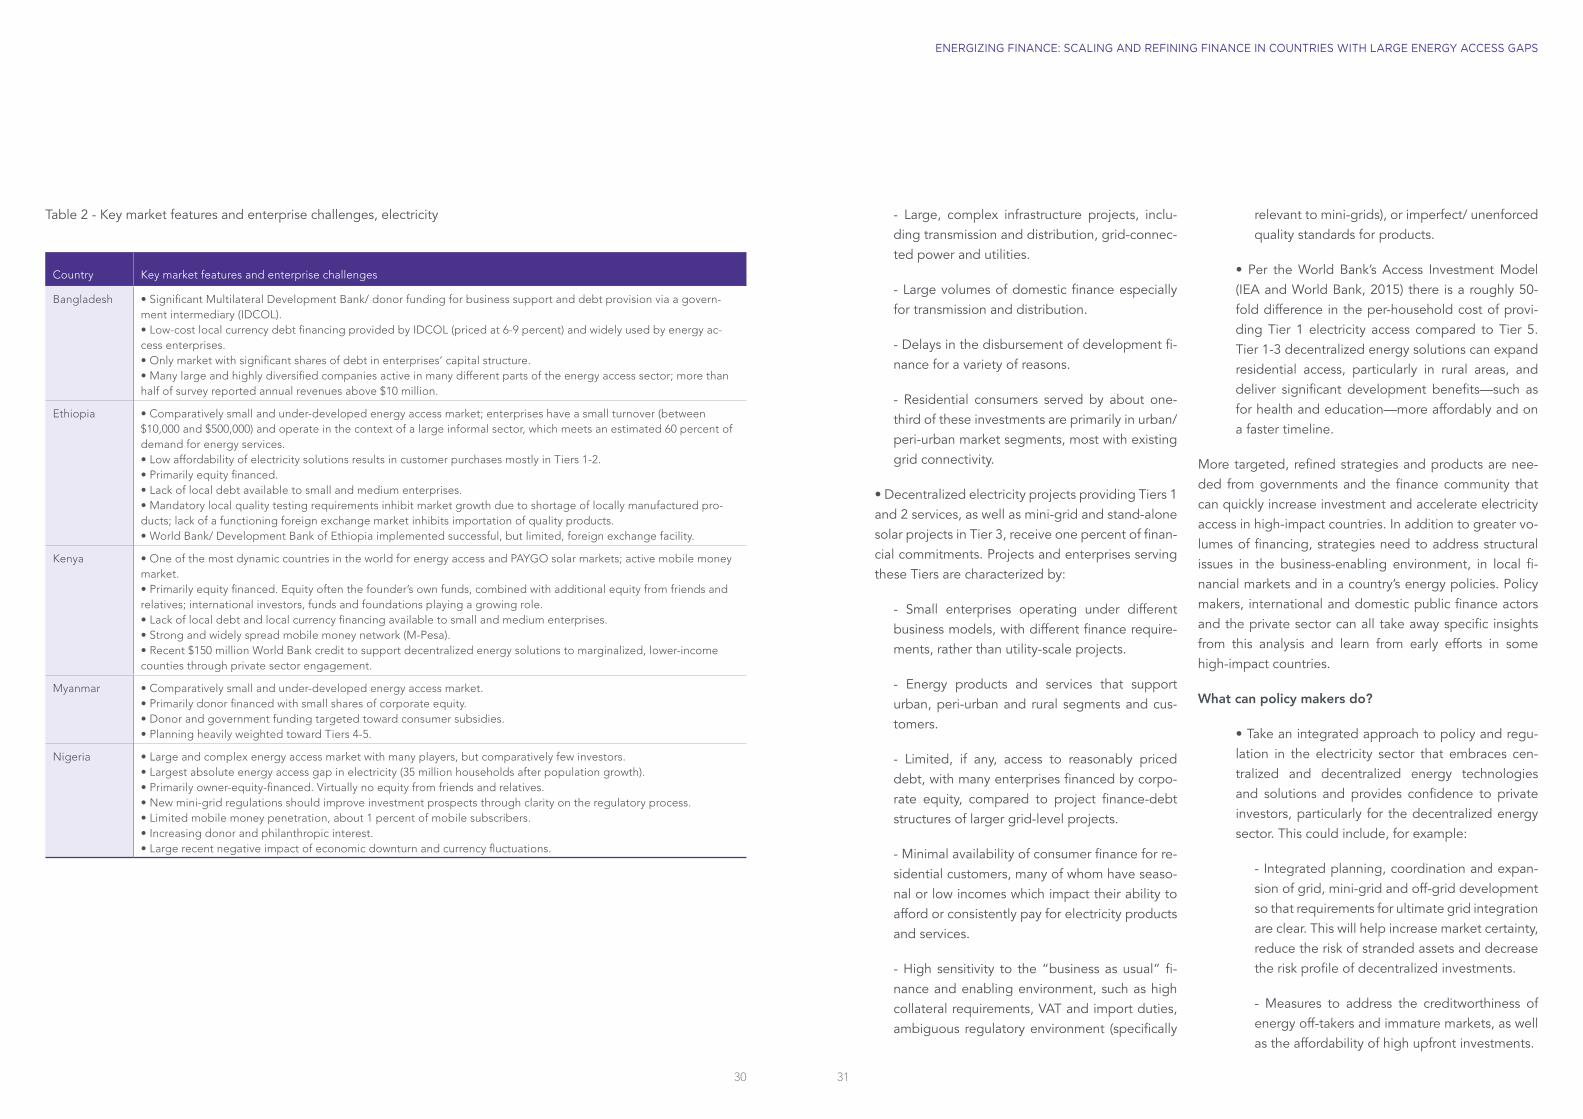
3130
ENERGIZING FINANCE: SCALING AND REFINING FINANCE IN COUNTRIES WITH LARGE ENERGY ACCESS GAPS
- Large, complex infrastructure projects, inclu-ding transmission and distribution, grid-connec-ted power and utilities.
- Large volumes of domestic finance especially for transmission and distribution.
- Delays in the disbursement of development fi-nance for a variety of reasons.
- Residential consumers served by about one-third of these investments are primarily in urban/ peri-urban market segments, most with existing grid connectivity.
• Decentralized electricity projects providing Tiers 1 and 2 services, as well as mini-grid and stand-alone solar projects in Tier 3, receive one percent of finan-cial commitments. Projects and enterprises serving these Tiers are characterized by:
- Small enterprises operating under different business models, with different finance require-ments, rather than utility-scale projects.
- Energy products and services that support urban, peri-urban and rural segments and cus-tomers.
- Limited, if any, access to reasonably priced debt, with many enterprises financed by corpo-rate equity, compared to project finance-debt structures of larger grid-level projects.
- Minimal availability of consumer finance for re-sidential customers, many of whom have seaso-nal or low incomes which impact their ability to afford or consistently pay for electricity products and services.
- High sensitivity to the “business as usual” fi-nance and enabling environment, such as high collateral requirements, VAT and import duties, ambiguous regulatory environment (specifically
relevant to mini-grids), or imperfect/ unenforced quality standards for products.
• Per the World Bank’s Access Investment Model (IEA and World Bank, 2015) there is a roughly 50-fold difference in the per-household cost of provi-ding Tier 1 electricity access compared to Tier 5. Tier 1-3 decentralized energy solutions can expand residential access, particularly in rural areas, and deliver significant development benefits—such as for health and education—more affordably and on a faster timeline.
More targeted, refined strategies and products are nee-ded from governments and the finance community that can quickly increase investment and accelerate electricity access in high-impact countries. In addition to greater vo-lumes of financing, strategies need to address structural issues in the business-enabling environment, in local fi-nancial markets and in a country’s energy policies. Policy makers, international and domestic public finance actors and the private sector can all take away specific insights from this analysis and learn from early efforts in some high-impact countries.
What can policy makers do?
• Take an integrated approach to policy and regu-lation in the electricity sector that embraces cen-tralized and decentralized energy technologies and solutions and provides confidence to private investors, particularly for the decentralized energy sector. This could include, for example:
- Integrated planning, coordination and expan-sion of grid, mini-grid and off-grid development so that requirements for ultimate grid integration are clear. This will help increase market certainty, reduce the risk of stranded assets and decrease the risk profile of decentralized investments.
- Measures to address the creditworthiness of energy off-takers and immature markets, as well as the affordability of high upfront investments.
Country Key market features and enterprise challenges
Bangladesh • Significant Multilateral Development Bank/ donor funding for business support and debt provision via a govern-ment intermediary (IDCOL). • Low-cost local currency debt financing provided by IDCOL (priced at 6-9 percent) and widely used by energy ac-cess enterprises. • Only market with significant shares of debt in enterprises’ capital structure. • Many large and highly diversified companies active in many different parts of the energy access sector; more than half of survey reported annual revenues above $10 million.
Ethiopia • Comparatively small and under-developed energy access market; enterprises have a small turnover (between $10,000 and $500,000) and operate in the context of a large informal sector, which meets an estimated 60 percent of demand for energy services. • Low affordability of electricity solutions results in customer purchases mostly in Tiers 1-2. • Primarily equity financed. • Lack of local debt available to small and medium enterprises. • Mandatory local quality testing requirements inhibit market growth due to shortage of locally manufactured pro-ducts; lack of a functioning foreign exchange market inhibits importation of quality products. • World Bank/ Development Bank of Ethiopia implemented successful, but limited, foreign exchange facility.
Kenya • One of the most dynamic countries in the world for energy access and PAYGO solar markets; active mobile money market. • Primarily equity financed. Equity often the founder’s own funds, combined with additional equity from friends and relatives; international investors, funds and foundations playing a growing role. • Lack of local debt and local currency financing available to small and medium enterprises. • Strong and widely spread mobile money network (M-Pesa). • Recent $150 million World Bank credit to support decentralized energy solutions to marginalized, lower-income counties through private sector engagement.
Myanmar • Comparatively small and under-developed energy access market. • Primarily donor financed with small shares of corporate equity. • Donor and government funding targeted toward consumer subsidies. • Planning heavily weighted toward Tiers 4-5.
Nigeria • Large and complex energy access market with many players, but comparatively few investors. • Largest absolute energy access gap in electricity (35 million households after population growth). • Primarily owner-equity-financed. Virtually no equity from friends and relatives. • New mini-grid regulations should improve investment prospects through clarity on the regulatory process. • Limited mobile money penetration, about 1 percent of mobile subscribers. • Increasing donor and philanthropic interest. • Large recent negative impact of economic downturn and currency fluctuations.
Table 2 - Key market features and enterprise challenges, electricity
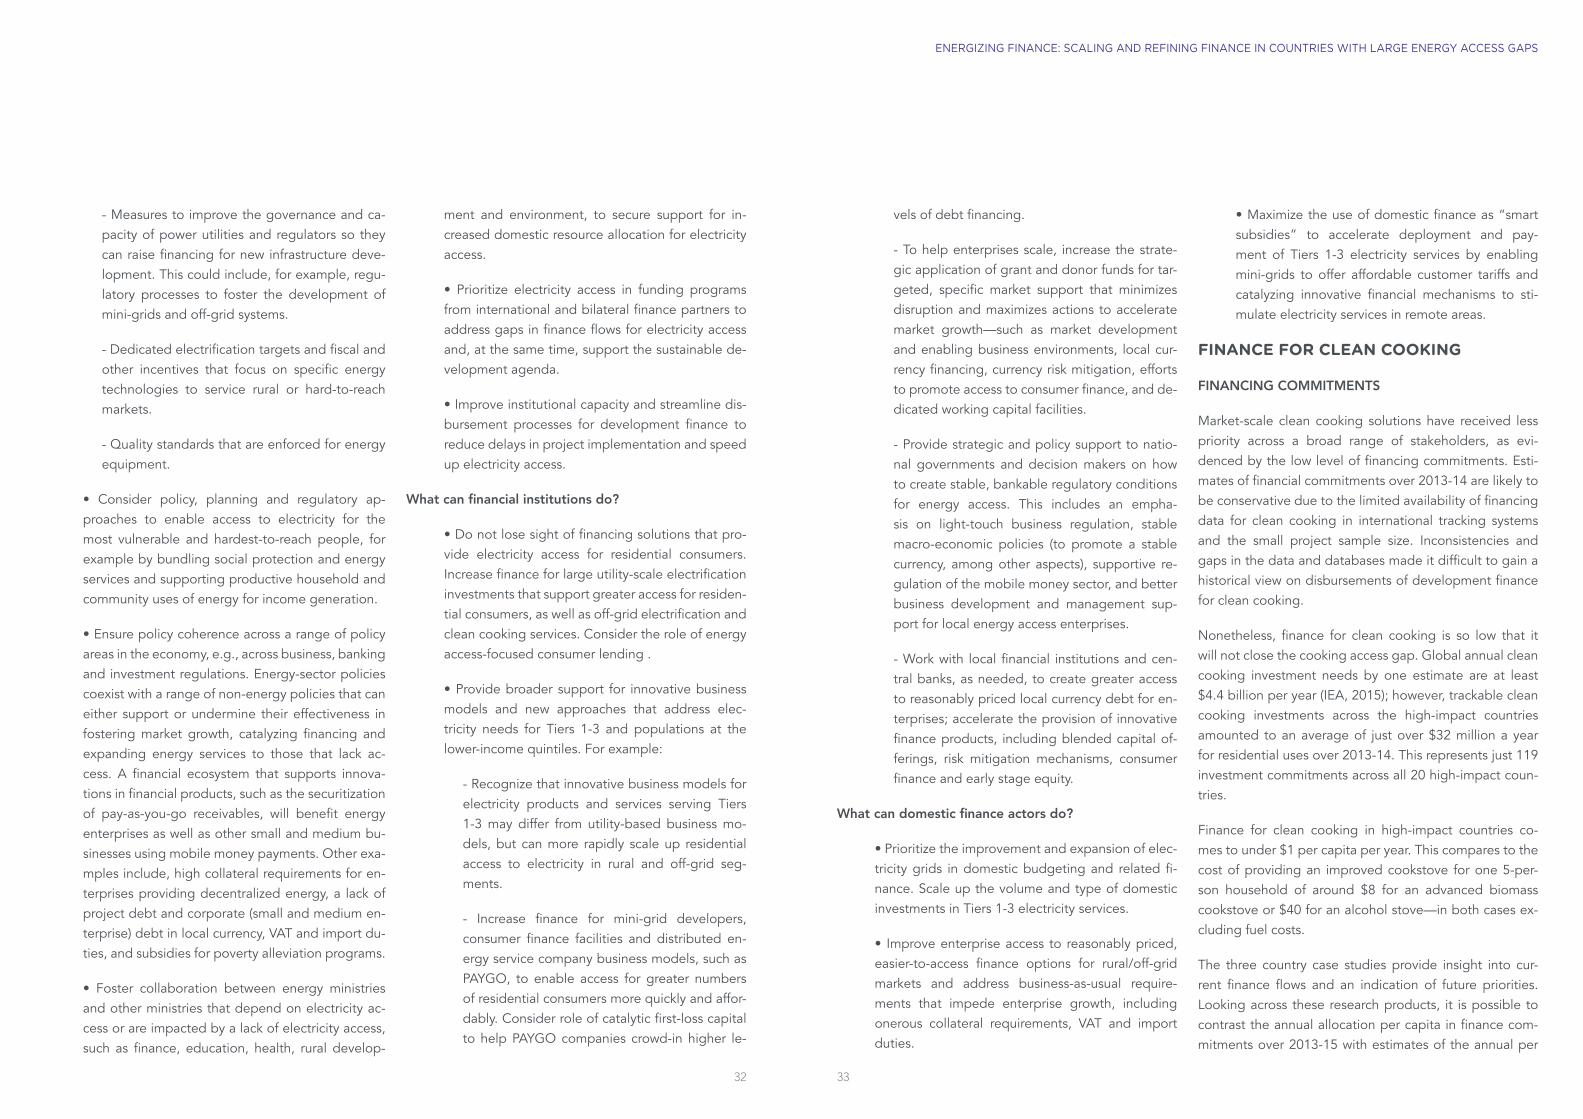
- Measures to improve the governance and ca-pacity of power utilities and regulators so they can raise financing for new infrastructure deve-lopment. This could include, for example, regu-latory processes to foster the development of mini-grids and off-grid systems.
- Dedicated electrification targets and fiscal and other incentives that focus on specific energy technologies to service rural or hard-to-reach markets.
- Quality standards that are enforced for energy equipment.
• Consider policy, planning and regulatory ap-proaches to enable access to electricity for the most vulnerable and hardest-to-reach people, for example by bundling social protection and energy services and supporting productive household and community uses of energy for income generation.
• Ensure policy coherence across a range of policy areas in the economy, e.g., across business, banking and investment regulations. Energy-sector policies coexist with a range of non-energy policies that can either support or undermine their effectiveness in fostering market growth, catalyzing financing and expanding energy services to those that lack ac-cess. A financial ecosystem that supports innova-tions in financial products, such as the securitization of pay-as-you-go receivables, will benefit energy enterprises as well as other small and medium bu-sinesses using mobile money payments. Other exa-mples include, high collateral requirements for en-terprises providing decentralized energy, a lack of project debt and corporate (small and medium en-terprise) debt in local currency, VAT and import du-ties, and subsidies for poverty alleviation programs.
• Foster collaboration between energy ministries and other ministries that depend on electricity ac-cess or are impacted by a lack of electricity access, such as finance, education, health, rural develop-
ment and environment, to secure support for in-creased domestic resource allocation for electricity access.
• Prioritize electricity access in funding programs from international and bilateral finance partners to address gaps in finance flows for electricity access and, at the same time, support the sustainable de-velopment agenda.
• Improve institutional capacity and streamline dis-bursement processes for development finance to reduce delays in project implementation and speed up electricity access.
What can financial institutions do?
• Do not lose sight of financing solutions that pro-vide electricity access for residential consumers. Increase finance for large utility-scale electrification investments that support greater access for residen-tial consumers, as well as off-grid electrification and clean cooking services. Consider the role of energy access-focused consumer lending .
• Provide broader support for innovative business models and new approaches that address elec-tricity needs for Tiers 1-3 and populations at the lower-income quintiles. For example:
- Recognize that innovative business models for electricity products and services serving Tiers 1-3 may differ from utility-based business mo-dels, but can more rapidly scale up residential access to electricity in rural and off-grid seg-ments.
- Increase finance for mini-grid developers, consumer finance facilities and distributed en-ergy service company business models, such as PAYGO, to enable access for greater numbers of residential consumers more quickly and affor-dably. Consider role of catalytic first-loss capital to help PAYGO companies crowd-in higher le-
vels of debt financing.
- To help enterprises scale, increase the strate-gic application of grant and donor funds for tar-geted, specific market support that minimizes disruption and maximizes actions to accelerate market growth—such as market development and enabling business environments, local cur-rency financing, currency risk mitigation, efforts to promote access to consumer finance, and de-dicated working capital facilities.
- Provide strategic and policy support to natio-nal governments and decision makers on how to create stable, bankable regulatory conditions for energy access. This includes an empha-sis on light-touch business regulation, stable macro-economic policies (to promote a stable currency, among other aspects), supportive re-gulation of the mobile money sector, and better business development and management sup-port for local energy access enterprises.
- Work with local financial institutions and cen-tral banks, as needed, to create greater access to reasonably priced local currency debt for en-terprises; accelerate the provision of innovative finance products, including blended capital of-ferings, risk mitigation mechanisms, consumer finance and early stage equity.
What can domestic finance actors do?
• Prioritize the improvement and expansion of elec-tricity grids in domestic budgeting and related fi-nance. Scale up the volume and type of domestic investments in Tiers 1-3 electricity services.
• Improve enterprise access to reasonably priced, easier-to-access finance options for rural/off-grid markets and address business-as-usual require-ments that impede enterprise growth, including onerous collateral requirements, VAT and import duties.
• Maximize the use of domestic finance as “smart subsidies” to accelerate deployment and pay-ment of Tiers 1-3 electricity services by enabling mini-grids to offer affordable customer tariffs and catalyzing innovative financial mechanisms to sti-mulate electricity services in remote areas.
FINANCE FOR CLEAN COOKING
FINANCING COMMITMENTS
Market-scale clean cooking solutions have received less priority across a broad range of stakeholders, as evi-denced by the low level of financing commitments. Esti-mates of financial commitments over 2013-14 are likely to be conservative due to the limited availability of financing data for clean cooking in international tracking systems and the small project sample size. Inconsistencies and gaps in the data and databases made it difficult to gain a historical view on disbursements of development finance for clean cooking.
Nonetheless, finance for clean cooking is so low that it will not close the cooking access gap. Global annual clean cooking investment needs by one estimate are at least $4.4 billion per year (IEA, 2015); however, trackable clean cooking investments across the high-impact countries amounted to an average of just over $32 million a year for residential uses over 2013-14. This represents just 119 investment commitments across all 20 high-impact coun-tries.
Finance for clean cooking in high-impact countries co-mes to under $1 per capita per year. This compares to the cost of providing an improved cookstove for one 5-per-son household of around $8 for an advanced biomass cookstove or $40 for an alcohol stove—in both cases ex-cluding fuel costs.
The three country case studies provide insight into cur-rent finance flows and an indication of future priorities. Looking across these research products, it is possible to contrast the annual allocation per capita in finance com-mitments over 2013-15 with estimates of the annual per
3332
ENERGIZING FINANCE: SCALING AND REFINING FINANCE IN COUNTRIES WITH LARGE ENERGY ACCESS GAPS
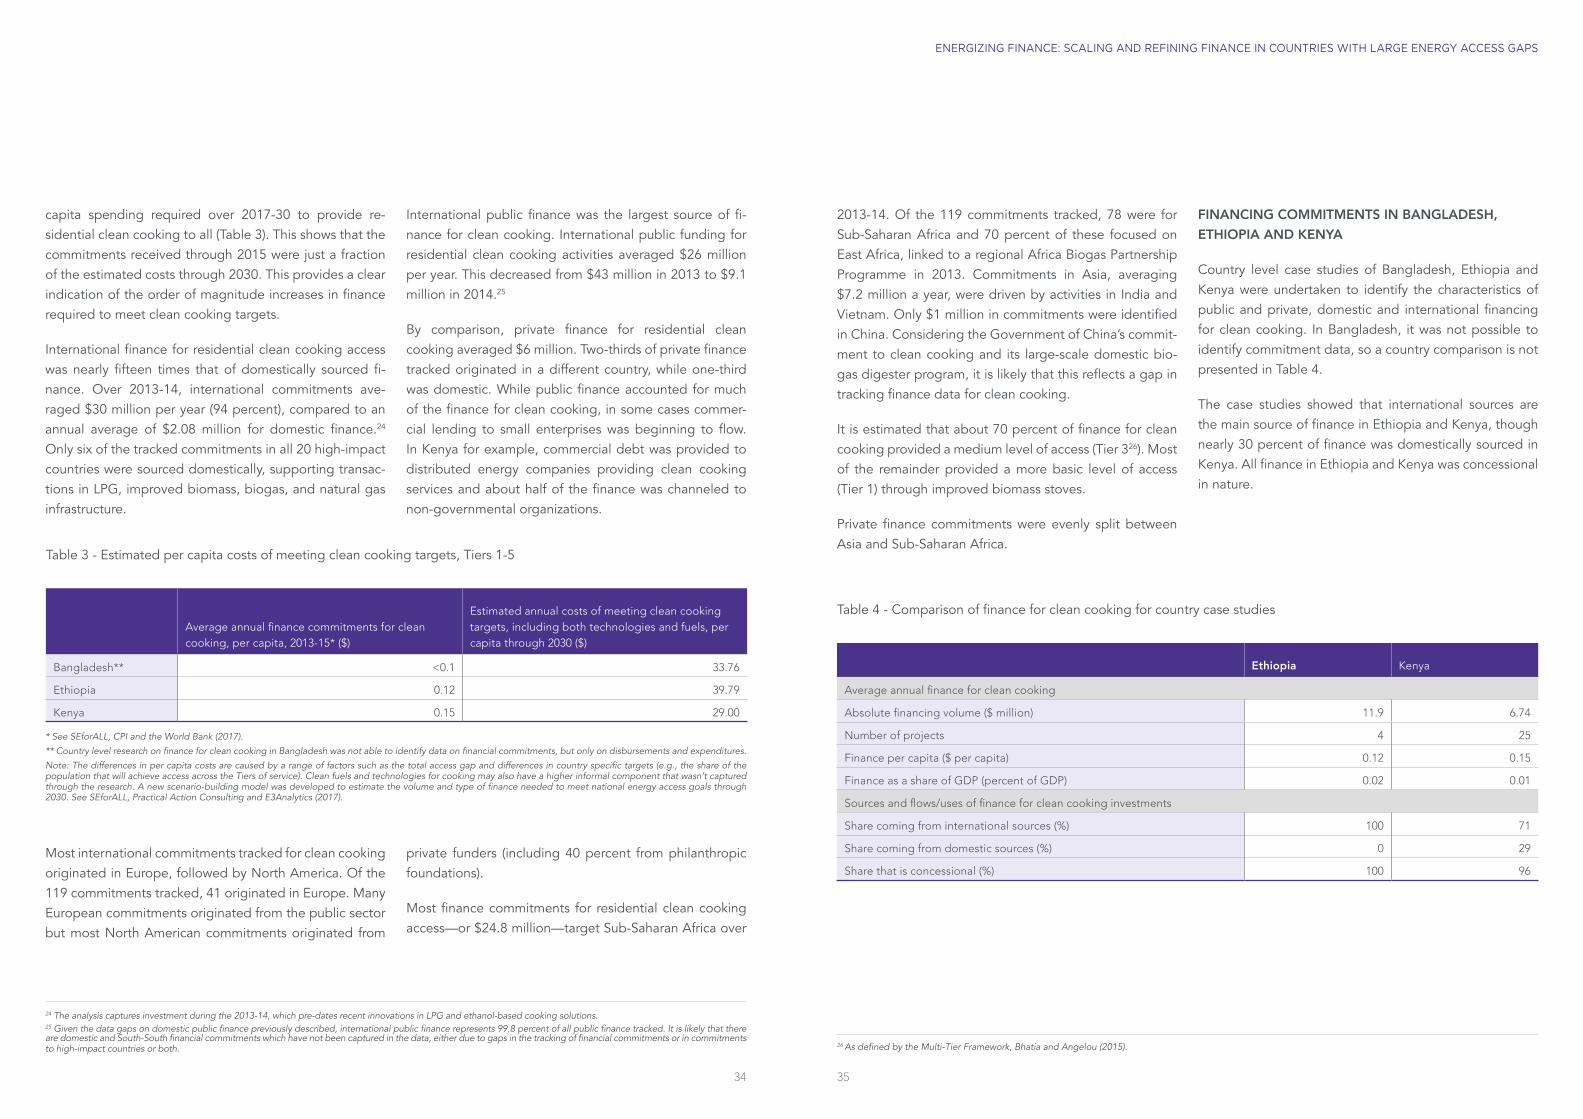
capita spending required over 2017-30 to provide re-sidential clean cooking to all (Table 3). This shows that the commitments received through 2015 were just a fraction of the estimated costs through 2030. This provides a clear indication of the order of magnitude increases in finance required to meet clean cooking targets.
International finance for residential clean cooking access was nearly fifteen times that of domestically sourced fi-nance. Over 2013-14, international commitments ave-raged $30 million per year (94 percent), compared to an annual average of $2.08 million for domestic finance.24
Only six of the tracked commitments in all 20 high-impact countries were sourced domestically, supporting transac-tions in LPG, improved biomass, biogas, and natural gas infrastructure.
International public finance was the largest source of fi-nance for clean cooking. International public funding for residential clean cooking activities averaged $26 million per year. This decreased from $43 million in 2013 to $9.1 million in 2014.25
By comparison, private finance for residential clean cooking averaged $6 million. Two-thirds of private finance tracked originated in a different country, while one-third was domestic. While public finance accounted for much of the finance for clean cooking, in some cases commer-cial lending to small enterprises was beginning to flow. In Kenya for example, commercial debt was provided to distributed energy companies providing clean cooking services and about half of the finance was channeled to non-governmental organizations.
2013-14. Of the 119 commitments tracked, 78 were for Sub-Saharan Africa and 70 percent of these focused on East Africa, linked to a regional Africa Biogas Partnership Programme in 2013. Commitments in Asia, averaging $7.2 million a year, were driven by activities in India and Vietnam. Only $1 million in commitments were identified in China. Considering the Government of China’s commit-ment to clean cooking and its large-scale domestic bio-gas digester program, it is likely that this reflects a gap in tracking finance data for clean cooking.
It is estimated that about 70 percent of finance for clean cooking provided a medium level of access (Tier 326). Most of the remainder provided a more basic level of access (Tier 1) through improved biomass stoves.
Private finance commitments were evenly split between Asia and Sub-Saharan Africa.
FINANCING COMMITMENTS IN BANGLADESH, ETHIOPIA AND KENYA
Country level case studies of Bangladesh, Ethiopia and Kenya were undertaken to identify the characteristics of public and private, domestic and international financing for clean cooking. In Bangladesh, it was not possible to identify commitment data, so a country comparison is not presented in Table 4.
The case studies showed that international sources are the main source of finance in Ethiopia and Kenya, though nearly 30 percent of finance was domestically sourced in Kenya. All finance in Ethiopia and Kenya was concessional in nature.
3534
ENERGIZING FINANCE: SCALING AND REFINING FINANCE IN COUNTRIES WITH LARGE ENERGY ACCESS GAPS
24 The analysis captures investment during the 2013-14, which pre-dates recent innovations in LPG and ethanol-based cooking solutions.25 Given the data gaps on domestic public finance previously described, international public finance represents 99.8 percent of all public finance tracked. It is likely that there are domestic and South-South financial commitments which have not been captured in the data, either due to gaps in the tracking of financial commitments or in commitments to high-impact countries or both.
* See SEforALL, CPI and the World Bank (2017).
** Country level research on finance for clean cooking in Bangladesh was not able to identify data on financial commitments, but only on disbursements and expenditures.
Note: The differences in per capita costs are caused by a range of factors such as the total access gap and differences in country specific targets (e.g., the share of the population that will achieve access across the Tiers of service). Clean fuels and technologies for cooking may also have a higher informal component that wasn’t captured through the research. A new scenario-building model was developed to estimate the volume and type of finance needed to meet national energy access goals through 2030. See SEforALL, Practical Action Consulting and E3Analytics (2017).
Average annual finance commitments for clean cooking, per capita, 2013-15* ($)
Estimated annual costs of meeting clean cooking targets, including both technologies and fuels, per capita through 2030 ($)
Bangladesh** <0.1 33.76
Ethiopia 0.12 39.79
Kenya 0.15 29.00
Table 3 - Estimated per capita costs of meeting clean cooking targets, Tiers 1-5
Most international commitments tracked for clean cooking originated in Europe, followed by North America. Of the 119 commitments tracked, 41 originated in Europe. Many European commitments originated from the public sector but most North American commitments originated from
private funders (including 40 percent from philanthropic foundations).
Most finance commitments for residential clean cooking access—or $24.8 million—target Sub-Saharan Africa over
26 As defined by the Multi-Tier Framework, Bhatia and Angelou (2015).
Ethiopia Kenya
Average annual finance for clean cooking
Absolute financing volume ($ million) 11.9 6.74
Number of projects 4 25
Finance per capita ($ per capita) 0.12 0.15
Finance as a share of GDP (percent of GDP) 0.02 0.01
Sources and flows/uses of finance for clean cooking investments
Share coming from international sources (%) 100 71
Share coming from domestic sources (%) 0 29
Share that is concessional (%) 100 96
Table 4 - Comparison of finance for clean cooking for country case studies
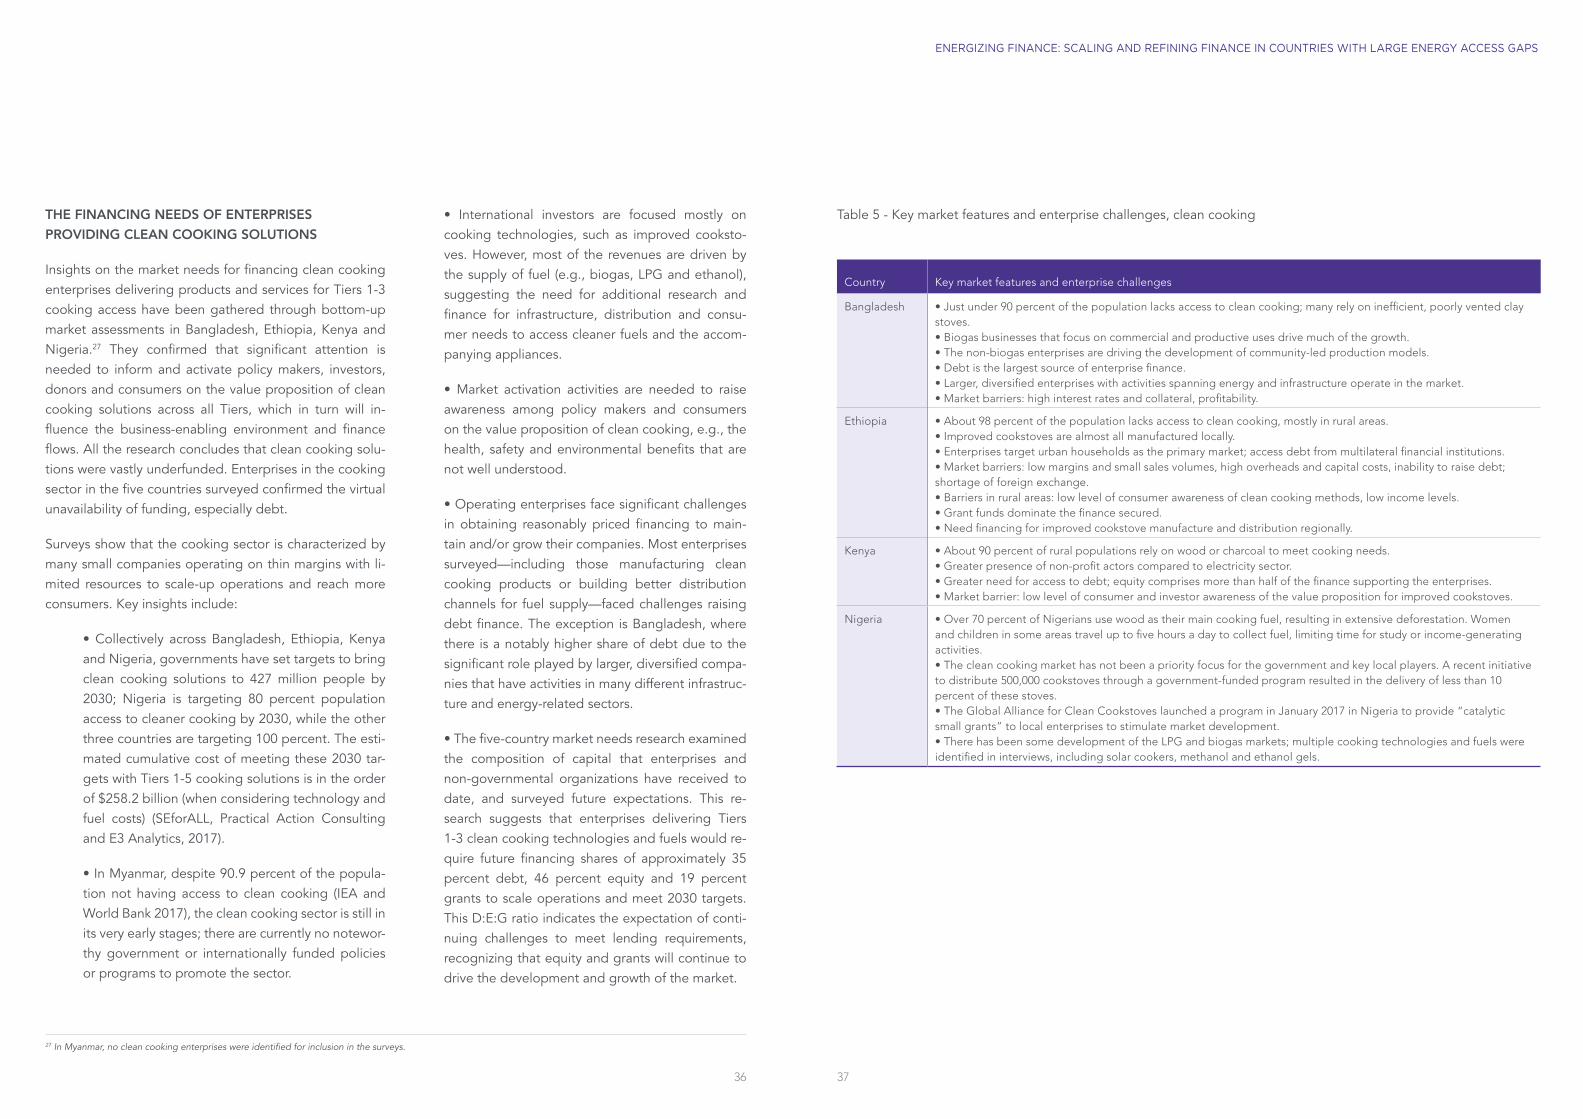
THE FINANCING NEEDS OF ENTERPRISES PROVIDING CLEAN COOKING SOLUTIONS
Insights on the market needs for financing clean cooking enterprises delivering products and services for Tiers 1-3 cooking access have been gathered through bottom-up market assessments in Bangladesh, Ethiopia, Kenya and Nigeria.27 They confirmed that significant attention is needed to inform and activate policy makers, investors, donors and consumers on the value proposition of clean cooking solutions across all Tiers, which in turn will in-fluence the business-enabling environment and finance flows. All the research concludes that clean cooking solu-tions were vastly underfunded. Enterprises in the cooking sector in the five countries surveyed confirmed the virtual unavailability of funding, especially debt.
Surveys show that the cooking sector is characterized by many small companies operating on thin margins with li-mited resources to scale-up operations and reach more consumers. Key insights include:
• Collectively across Bangladesh, Ethiopia, Kenya and Nigeria, governments have set targets to bring clean cooking solutions to 427 million people by 2030; Nigeria is targeting 80 percent population access to cleaner cooking by 2030, while the other three countries are targeting 100 percent. The esti-mated cumulative cost of meeting these 2030 tar-gets with Tiers 1-5 cooking solutions is in the order of $258.2 billion (when considering technology and fuel costs) (SEforALL, Practical Action Consulting and E3 Analytics, 2017).
• In Myanmar, despite 90.9 percent of the popula-tion not having access to clean cooking (IEA and World Bank 2017), the clean cooking sector is still in its very early stages; there are currently no notewor-thy government or internationally funded policies or programs to promote the sector.
• International investors are focused mostly on cooking technologies, such as improved cooksto-ves. However, most of the revenues are driven by the supply of fuel (e.g., biogas, LPG and ethanol), suggesting the need for additional research and finance for infrastructure, distribution and consu-mer needs to access cleaner fuels and the accom-panying appliances.
• Market activation activities are needed to raise awareness among policy makers and consumers on the value proposition of clean cooking, e.g., the health, safety and environmental benefits that are not well understood.
• Operating enterprises face significant challenges in obtaining reasonably priced financing to main-tain and/or grow their companies. Most enterprises surveyed—including those manufacturing clean cooking products or building better distribution channels for fuel supply—faced challenges raising debt finance. The exception is Bangladesh, where there is a notably higher share of debt due to the significant role played by larger, diversified compa-nies that have activities in many different infrastruc-ture and energy-related sectors.
• The five-country market needs research examined the composition of capital that enterprises and non-governmental organizations have received to date, and surveyed future expectations. This re-search suggests that enterprises delivering Tiers 1-3 clean cooking technologies and fuels would re-quire future financing shares of approximately 35 percent debt, 46 percent equity and 19 percent grants to scale operations and meet 2030 targets. This D:E:G ratio indicates the expectation of conti-nuing challenges to meet lending requirements, recognizing that equity and grants will continue to drive the development and growth of the market.
3736
ENERGIZING FINANCE: SCALING AND REFINING FINANCE IN COUNTRIES WITH LARGE ENERGY ACCESS GAPS
27 In Myanmar, no clean cooking enterprises were identified for inclusion in the surveys.
Country Key market features and enterprise challenges
Bangladesh • Just under 90 percent of the population lacks access to clean cooking; many rely on inefficient, poorly vented clay stoves. • Biogas businesses that focus on commercial and productive uses drive much of the growth. • The non-biogas enterprises are driving the development of community-led production models. • Debt is the largest source of enterprise finance. • Larger, diversified enterprises with activities spanning energy and infrastructure operate in the market. • Market barriers: high interest rates and collateral, profitability.
Ethiopia • About 98 percent of the population lacks access to clean cooking, mostly in rural areas. • Improved cookstoves are almost all manufactured locally. • Enterprises target urban households as the primary market; access debt from multilateral financial institutions. • Market barriers: low margins and small sales volumes, high overheads and capital costs, inability to raise debt; shortage of foreign exchange. • Barriers in rural areas: low level of consumer awareness of clean cooking methods, low income levels. • Grant funds dominate the finance secured. • Need financing for improved cookstove manufacture and distribution regionally.
Kenya • About 90 percent of rural populations rely on wood or charcoal to meet cooking needs. • Greater presence of non-profit actors compared to electricity sector. • Greater need for access to debt; equity comprises more than half of the finance supporting the enterprises. • Market barrier: low level of consumer and investor awareness of the value proposition for improved cookstoves.
Nigeria • Over 70 percent of Nigerians use wood as their main cooking fuel, resulting in extensive deforestation. Women and children in some areas travel up to five hours a day to collect fuel, limiting time for study or income-generating activities. • The clean cooking market has not been a priority focus for the government and key local players. A recent initiative to distribute 500,000 cookstoves through a government-funded program resulted in the delivery of less than 10 percent of these stoves. • The Global Alliance for Clean Cookstoves launched a program in January 2017 in Nigeria to provide “catalytic small grants” to local enterprises to stimulate market development. • There has been some development of the LPG and biogas markets; multiple cooking technologies and fuels were identified in interviews, including solar cookers, methanol and ethanol gels.
Table 5 - Key market features and enterprise challenges, clean cooking
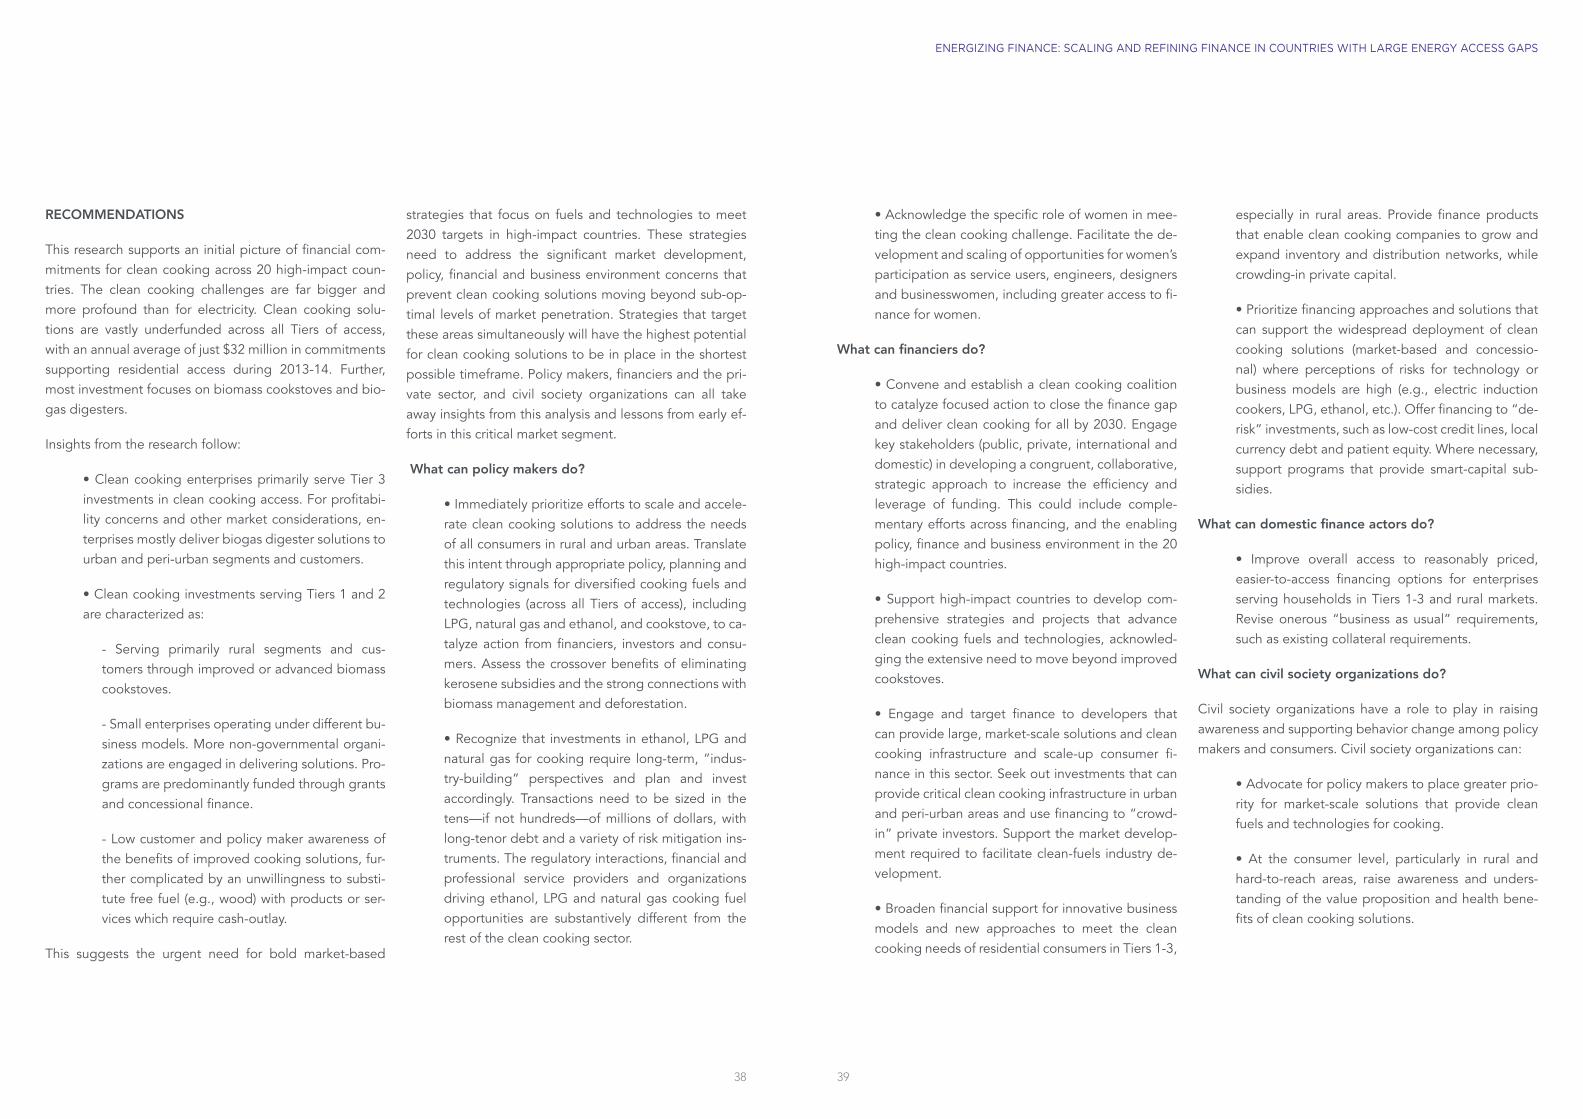
• Acknowledge the specific role of women in mee-ting the clean cooking challenge. Facilitate the de-velopment and scaling of opportunities for women’s participation as service users, engineers, designers and businesswomen, including greater access to fi-nance for women.
What can financiers do?
• Convene and establish a clean cooking coalition to catalyze focused action to close the finance gap and deliver clean cooking for all by 2030. Engage key stakeholders (public, private, international and domestic) in developing a congruent, collaborative, strategic approach to increase the efficiency and leverage of funding. This could include comple-mentary efforts across financing, and the enabling policy, finance and business environment in the 20 high-impact countries.
• Support high-impact countries to develop com-prehensive strategies and projects that advance clean cooking fuels and technologies, acknowled-ging the extensive need to move beyond improved cookstoves.
• Engage and target finance to developers that can provide large, market-scale solutions and clean cooking infrastructure and scale-up consumer fi-nance in this sector. Seek out investments that can provide critical clean cooking infrastructure in urban and peri-urban areas and use financing to “crowd-in” private investors. Support the market develop-ment required to facilitate clean-fuels industry de-velopment.
• Broaden financial support for innovative business models and new approaches to meet the clean cooking needs of residential consumers in Tiers 1-3,
especially in rural areas. Provide finance products that enable clean cooking companies to grow and expand inventory and distribution networks, while crowding-in private capital.
• Prioritize financing approaches and solutions that can support the widespread deployment of clean cooking solutions (market-based and concessio-nal) where perceptions of risks for technology or business models are high (e.g., electric induction cookers, LPG, ethanol, etc.). Offer financing to “de-risk” investments, such as low-cost credit lines, local currency debt and patient equity. Where necessary, support programs that provide smart-capital sub-sidies.
What can domestic finance actors do?
• Improve overall access to reasonably priced, easier-to-access financing options for enterprises serving households in Tiers 1-3 and rural markets. Revise onerous “business as usual” requirements, such as existing collateral requirements.
What can civil society organizations do?
Civil society organizations have a role to play in raising awareness and supporting behavior change among policy makers and consumers. Civil society organizations can:
• Advocate for policy makers to place greater prio-rity for market-scale solutions that provide clean fuels and technologies for cooking.
• At the consumer level, particularly in rural and hard-to-reach areas, raise awareness and unders-tanding of the value proposition and health bene-fits of clean cooking solutions.
3938
ENERGIZING FINANCE: SCALING AND REFINING FINANCE IN COUNTRIES WITH LARGE ENERGY ACCESS GAPS
RECOMMENDATIONS
This research supports an initial picture of financial com-mitments for clean cooking across 20 high-impact coun-tries. The clean cooking challenges are far bigger and more profound than for electricity. Clean cooking solu-tions are vastly underfunded across all Tiers of access, with an annual average of just $32 million in commitments supporting residential access during 2013-14. Further, most investment focuses on biomass cookstoves and bio-gas digesters.
Insights from the research follow:
• Clean cooking enterprises primarily serve Tier 3 investments in clean cooking access. For profitabi-lity concerns and other market considerations, en-terprises mostly deliver biogas digester solutions to urban and peri-urban segments and customers.
• Clean cooking investments serving Tiers 1 and 2 are characterized as:
- Serving primarily rural segments and cus-tomers through improved or advanced biomass cookstoves.
- Small enterprises operating under different bu-siness models. More non-governmental organi-zations are engaged in delivering solutions. Pro-grams are predominantly funded through grants and concessional finance.
- Low customer and policy maker awareness of the benefits of improved cooking solutions, fur-ther complicated by an unwillingness to substi-tute free fuel (e.g., wood) with products or ser-vices which require cash-outlay.
This suggests the urgent need for bold market-based
strategies that focus on fuels and technologies to meet 2030 targets in high-impact countries. These strategies need to address the significant market development, policy, financial and business environment concerns that prevent clean cooking solutions moving beyond sub-op-timal levels of market penetration. Strategies that target these areas simultaneously will have the highest potential for clean cooking solutions to be in place in the shortest possible timeframe. Policy makers, financiers and the pri-vate sector, and civil society organizations can all take away insights from this analysis and lessons from early ef-forts in this critical market segment.
What can policy makers do?
• Immediately prioritize efforts to scale and accele-rate clean cooking solutions to address the needs of all consumers in rural and urban areas. Translate this intent through appropriate policy, planning and regulatory signals for diversified cooking fuels and technologies (across all Tiers of access), including LPG, natural gas and ethanol, and cookstove, to ca-talyze action from financiers, investors and consu-mers. Assess the crossover benefits of eliminating kerosene subsidies and the strong connections with biomass management and deforestation.
• Recognize that investments in ethanol, LPG and natural gas for cooking require long-term, “indus-try-building” perspectives and plan and invest accordingly. Transactions need to be sized in the tens—if not hundreds—of millions of dollars, with long-tenor debt and a variety of risk mitigation ins-truments. The regulatory interactions, financial and professional service providers and organizations driving ethanol, LPG and natural gas cooking fuel opportunities are substantively different from the rest of the clean cooking sector.
ENERGIZING FINANCE
REPORT SERIES
4140
Inevitably, when piloting a new approach, data limitations are encountered. For example, better data tracking is needed for private finance of decentralized energy sys-tems. Also, there is a need to better distinguish between finance that generates new electricity connections versus improved service for existing connections.
Better data tracking is essential to improve the coverage and granularity of financial information in such areas. It can support better understanding of complex financial cycles and help identify additional action areas. Such gaps could be addressed for example, by expanding existing inter-national data reporting systems such as the OECD DAC
CRS, to include energy access-relevant information.28 Fur-ther, pilot methodologies for allocating finance commit-ments across different types of energy assets and Tiers of energy service can be more tailored to the local context as baseline access surveys from the Multi-Tier Framework become available.
Nevertheless, the research demonstrates the value of combining the global approach to mapping international finance with a more extended set of detailed country case studies in a future iteration of this work, to yield additio-nal information on domestic financing that is an important channel of finance for energy.
ADDRESSING DATA LIMITATIONS
28 Such as the segment of the population served and the number of new connections created. To find out more, please visit SEforALL.org/EnergizingFinance
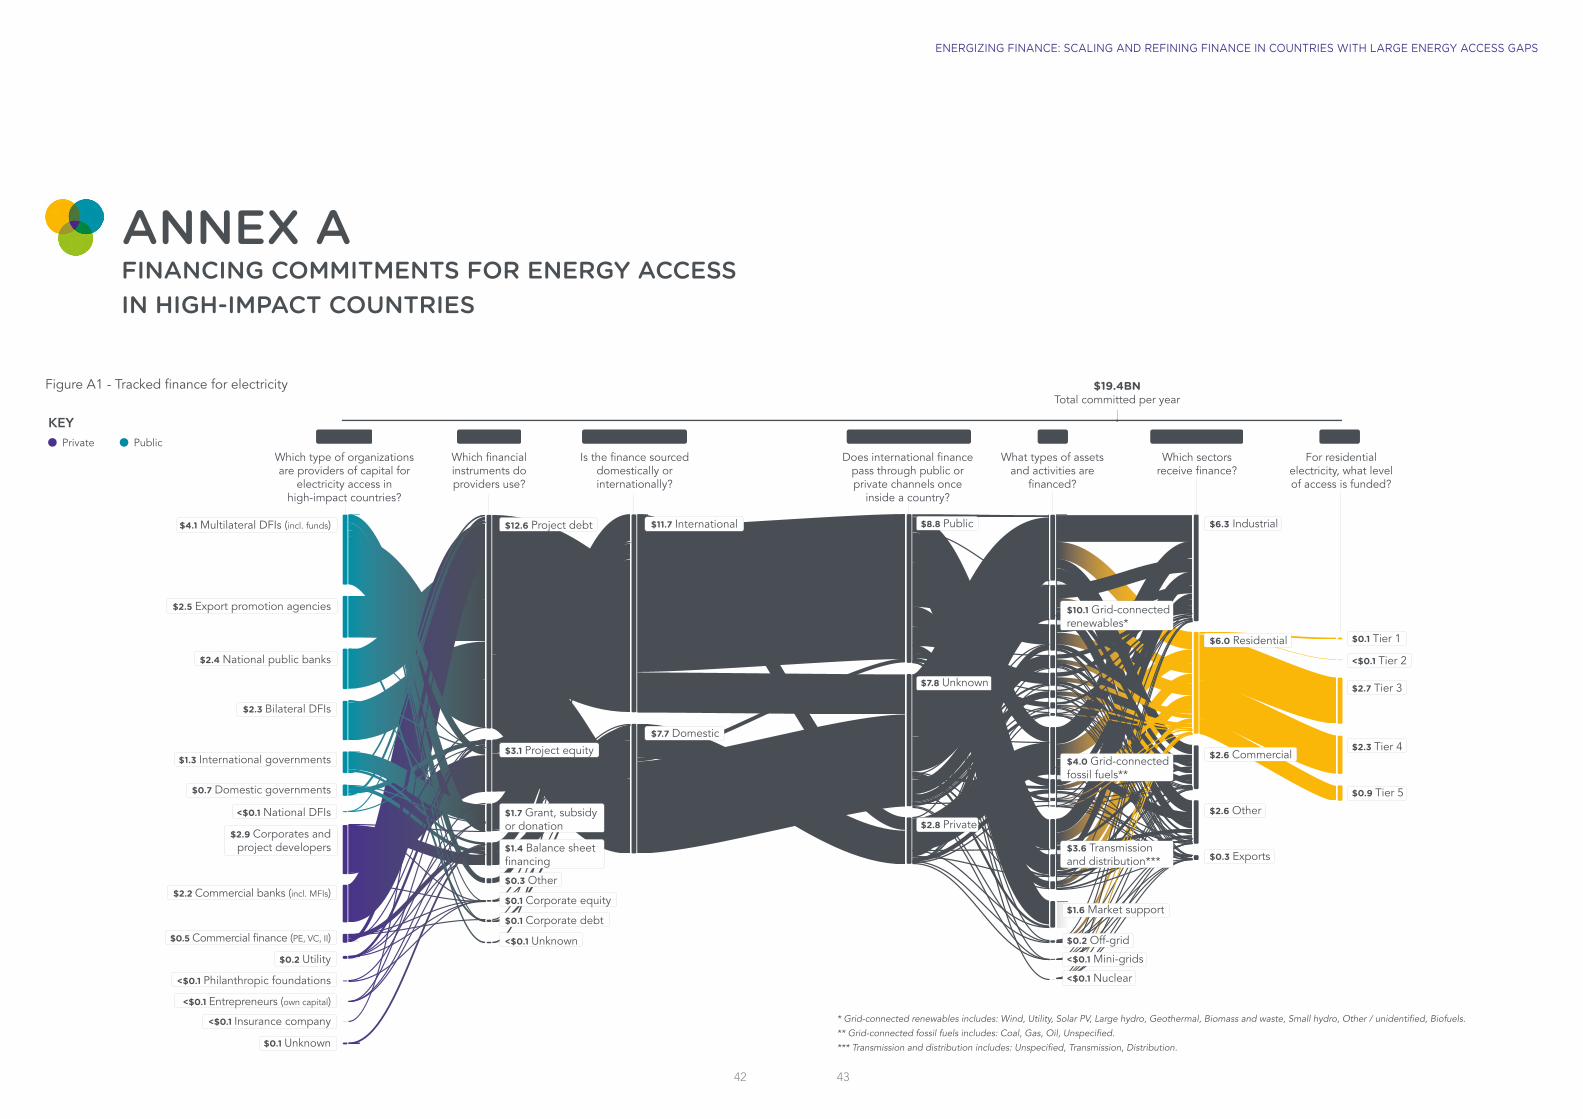
$2.3 Bilateral DFIs
$2.2 Commercial banks (incl. MFIs)
$0.5 Commercial finance (PE, VC, II)
$2.9 Corporates andproject developers
<$0.1 Entrepreneurs (own capital)
$2.5 Export promotion agencies
<$0.1 Insurance company
$1.3 International governments
$4.1 Multilateral DFIs (incl. funds)
$2.4 National public banks
<$0.1 Philanthropic foundations
$0.1 Unknown
$0.2 Utility
$0.1 Tier 1
<$0.1 Tier 2
$2.7 Tier 3
$2.3 Tier 4
$0.9 Tier 5
$2.6 Commercial
$0.3 Exports
$6.3 Industrial
$2.6 Other
$6.0 Residential
<$0.1 Mini-grids
<$0.1 Nuclear
$0.2 Off-grid
$10.1 Grid-connected renewables*
$4.0 Grid-connectedfossil fuels**
$3.6 Transmission and distribution***
$1.4 Balance sheet financing
$0.1 Corporate debt
$0.1 Corporate equity
$1.7 Grant, subsidy or donation
$0.3 Other
$12.6 Project debt
$3.1 Project equity
<$0.1 Unknown
$7.7 Domestic
$11.7 International
$2.8 Private
$8.8 Public
$7.8 Unknown
INSTRUMENTS PROVIDER GEOGRAPHY CONSUMER SECTOR ACCESSRECIPIENTS AND CHANNELS USESPROVIDERS
Which financial instruments do providers use?
Which type of organizations are providers of capital for
electricity access in high-impact countries?
Is the finance sourced domestically or internationally?
What types of assets and activities are
financed?
Which sectors receive finance?
$19.4BNTotal committed per year
Does international finance pass through public or private channels once
inside a country?
<$0.1 National DFIs
$0.7 Domestic governments
For residential electricity, what level of access is funded?
$1.6 Market support
4342
ENERGIZING FINANCE: SCALING AND REFINING FINANCE IN COUNTRIES WITH LARGE ENERGY ACCESS GAPS
ANNEX AFINANCING COMMITMENTS FOR ENERGY ACCESS IN HIGH-IMPACT COUNTRIES
Figure A1 - Tracked finance for electricity
Private Public
KEY
* Grid-connected renewables includes: Wind, Utility, Solar PV, Large hydro, Geothermal, Biomass and waste, Small hydro, Other / unidentified, Biofuels.
** Grid-connected fossil fuels includes: Coal, Gas, Oil, Unspecified.
*** Transmission and distribution includes: Unspecified, Transmission, Distribution.
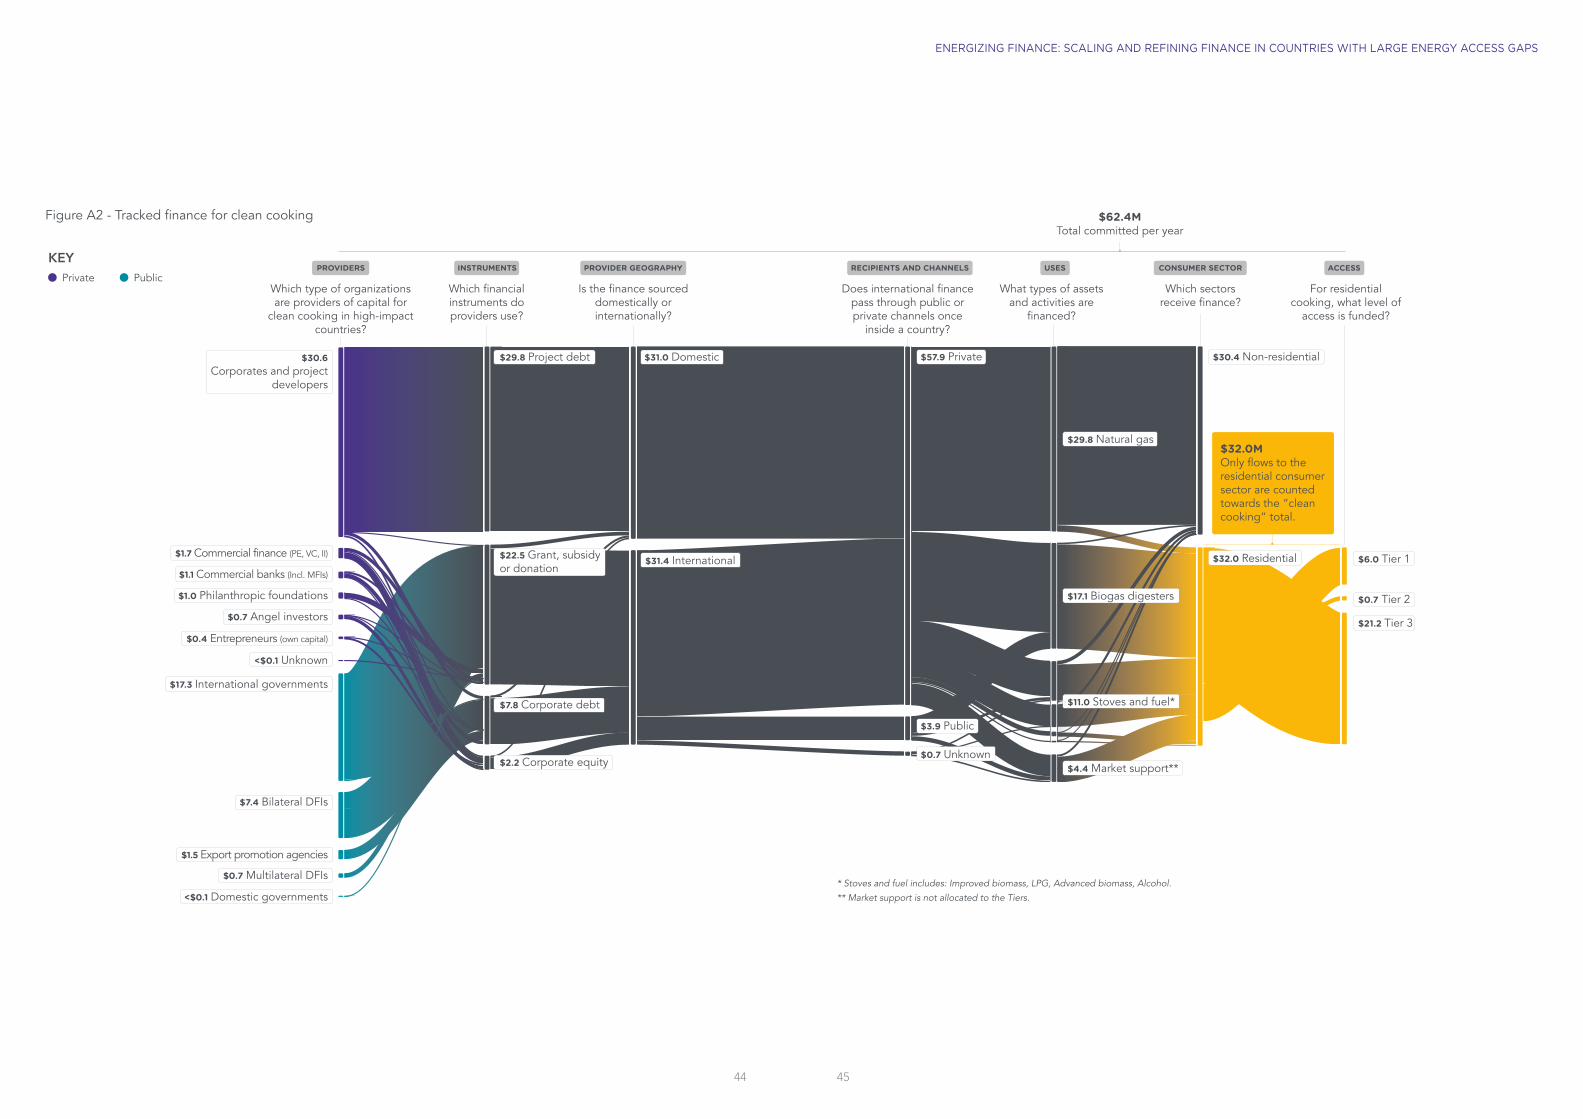
4544
ENERGIZING FINANCE: SCALING AND REFINING FINANCE IN COUNTRIES WITH LARGE ENERGY ACCESS GAPS
Figure A2 - Tracked finance for clean cooking
$29.8 Project debt
$7.8 Corporate debt
$2.2 Corporate equity
$30.4 Non-residential
$17.1 Biogas digesters
$11.0 Stoves and fuel*
$4.4 Market support**
$29.8 Natural gas
$32.0 Residential$22.5 Grant, subsidy or donation
$30.6Corporates and project
developers
$17.3 International governments
$7.4 Bilateral DFIs
$1.7 Commercial finance (PE, VC, II)
$1.5 Export promotion agencies
$1.1 Commercial banks (Incl. MFIs)
$1.0 Philanthropic foundations
$0.7 Multilateral DFIs
$0.7 Angel investors
$0.4 Entrepreneurs (own capital)
<$0.1 Domestic governments
<$0.1 Unknown
$31.0 Domestic
$31.4 International
$3.9 Public
$0.7 Unknown
$57.9 Private
$6.0 Tier 1
$0.7 Tier 2
$21.2 Tier 3
Which type of organizations are providers of capital for
clean cooking in high-impact countries?
Which financial instruments do providers use?
Is the finance sourced domestically or internationally?
What types of assets and activities are
financed?
Which sectors receive finance?
For residential cooking, what level of
access is funded?
Does international finance pass through public or private channels once
inside a country?
INSTRUMENTS PROVIDER GEOGRAPHY CONSUMER SECTOR ACCESSRECIPIENTS AND CHANNELS USESPROVIDERS
$62.4MTotal committed per year
$32.0M Only flows to the residential consumer sector are counted towards the “clean cooking” total.
Private Public
KEY
* Stoves and fuel includes: Improved biomass, LPG, Advanced biomass, Alcohol.
** Market support is not allocated to the Tiers.
BIBLIOGRAPHY
AREI. Africa Renewable Energy Initiative. Available at: http://www.arei.org/
Bhatia, M. and Angelou, N. (2015). Beyond Connec-tions: Energy Access Redefined. ESMAP Technical Re-port. Washington, DC: World Bank. Available at: https://openknowledge.worldbank.org/handle/10986/24368
Bloomberg New Energy Finance (BNEF), Lighting Global, and Global Off-Grid Lighting Association (GOGLA). (2016). Off-grid solar market trends report 2016. Utrecht, the Netherlands. Available at: https://data.bloomberglp.com/bnef/sites/4/2016/03/20160303_BNEF_WorldBankIFC_Off-GridSolarReport_.pdf
Bloomberg New Energy Finance (BNEF). (2017). Q1 2017 Off-Grid and Mini-Grid Market Outlook. Available at: https://about.bnef.com/blog/off-grid-mini-grid-q1-2017-market-outlook/
ElectriFi. Electrification Financing Initiative. Available at: http://electrifi.org/
International Energy Agency (IEA). (2015). World Energy Outlook 2015. Paris: IEA Publishing. Available at: https://www.iea.org/publications/freepublications/publication/WEO2015.pdf
International Energy Agency (IEA). (2016). World Energy Outlook 2016. Paris: IEA Publishing. Available at: http://www.worldenergyoutlook.org/publications/weo-2016/
International Energy Agency (IEA) and the World Bank. (2015). Global Tracking Framework—Progress Toward Sus-tainable Energy. Washington, DC: World Bank. Available at: http://seforall.org/sites/default/files/GTF-2105-Full-Re-port.pdf
International Energy Agency (IEA) and the World Bank. (2017). Global Tracking Framework—Progress Toward Sus-tainable Energy. Washington, DC: World Bank. Available at: http://gtf.esmap.org/data/files/download-documents/eegp17-01_gtf_full_report_for_web_0516.pdf
Practical Action. (2017). Poor People’s Energy Outlook. Available at: https://policy.practicalaction.org/policy-the-mes/energy/poor-peoples-energy-outlook/poor-people-s-energy-outlook-2017
Sustainable Energy for All (SEforALL). (2015). Scaling up Fi-nance for Sustainable Energy Investments: Report of the SE4All Advisory Board’s Finance Committee. Available at: http://www.se4all.org/sites/default/files/SE4All-Adviso-ry-Board-Finance-Committee-Report.pdf
SEforALL. 2016. Strategic Framework for Results (2016-21), Going Further, Faster – Together. Available at: http://www.se4all.org/content/strategic-framework-results-2016-sefo-rall
SEforALL and the African Development Bank (AfDB). 2017. Missing the Mark - Gaps and lags in disbursement of deve-lopment finance for energy access. SEforALL, Washington, DC. License: NonCommercial-NoDerivatives 4.0, Interna-tional (CC BY-NC-ND 4.0).
SEforALL, Climate Policy Initiative (CPI) and the World Bank. (2017). Understanding the Landscape - Tracking finance for electricity and clean cooking access in high-impact coun-tries. SEforALL, Washington, DC. License: NonCommer-cial-NoDerivatives 4.0 International (CC BY-NC-ND 4.0).
47
ENERGIZING FINANCE: SCALING AND REFINING FINANCE IN COUNTRIES WITH LARGE ENERGY ACCESS GAPS
46
SEforALL, Practical Action Consulting and E3 Analytics. (2017). Taking the Pulse - Understanding energy access market needs in five high-impact countries. SEforALL, Was-hington, DC. License: NonCommercial-NoDerivatives 4.0 International (CC BY-NC-ND 4.0).
World Bank. (2016). Regulatory Indicators for Sustainable Energy. Available at: http://rise.esmap.org
World Bank. (2017). State of Energy Access Report. Avai-lable at: http://www.worldbank.org/en/topic/energy/publi-cation/sear
World Bank. (2017a). Doing Business. Available at: http://www.doingbusiness.org/
ENERGIZING FINANCE REPORT SERIES
This report is part of the Energizing Finance series, produced by Sustainable Energy for All in partnership with the Afri-can Development Bank, Climate Policy Initiative, E3 Analytics, Practical Action Consulting and the World Bank Group. All reports are available at SEforALL.org/EnergizingFinance. Follow the conversation online using #SDG7Finance.
MISSING THE MARK: GAPS AND LAGS IN DISBURSEMENT OF DEVELOP-MENT FINANCE FOR ENERGY ACCESS Authors: Sustainable Energy for All and the African Development Bank. 2017.
UNDERSTANDING THE LANDSCAPE: TRACKING FINANCE FOR ELEC-TRICITY AND CLEAN COOKING AC-CESS IN HIGH-IMPACT COUNTRIES Authors: Sustainable Energy for All, Climate Policy Initiative and the World Bank. 2017.
TAKING THE PULSE: UNDERSTANDING ENERGY ACCESS MARKET NEEDS IN FIVE HIGH-IMPACT COUNTRIES Authors: Sustainable Energy for All, Prac-tical Action Consulting and E3 Analytics. 2017.
ENERGIZING FINANCE: SCALING AND REFINING FINANCE IN COUN-TRIES WITH LARGE ENERGY ACCESS GAPS
Authors: Sustainable Energy for All. 2017.
Consulting
Funding support Research partners
ENERGIZING FINANCE
REPORT SERIES
To find out more, please visit SEforALL.org/EnergizingFinance