Embed Size (px)
Citation preview

Energies 2011, 4, 1010-1024; doi:10.3390/en4071010
energies ISSN 1996-1073
www.mdpi.com/journal/energies
Article
Towards an Analysis of Daylighting Simulation Software
Ignacio Acosta *, Jaime Navarro and Juan J. Sendra
Institute of Architecture and Building Science, University of Seville, Seville 41012, Spain; E-Mails: [email protected] (J.N.); [email protected] (J.J.S.)
* Author to whom correspondence should be addressed; E-Mail: [email protected]; Tel.: +34-647-550-654; Fax: +34-954-457-234.
Received: 20 April 2011; in revised form: 14 June 2011 / Accepted: 23 June 2011 / Published: 29 June 2011
Abstract: The aim of this article was to assess some of the main lighting software programs habitually used in architecture, subjecting them to a series of trials and analyzing the light distribution obtained in situations with different orientations, dates and geometry. The analysis examines Lightscape 3.2, Desktop Radiance 2.0, Lumen Micro 7.5, Ecotect 5.5 and Dialux 4.4.
Keywords: daylighting; architectural environment; overcast sky; lighting software
1. Introduction
In 1966 Hopkinson, Petherbridge and Longmore published the book “Daylighting” [1], which is a true compendium of the information on natural lighting which existed until that point. This book clearly shows the great complexity of the procedures for quantifying natural light, and how the information on offer there, such as the value of estimated average lighting or lighting for a concrete point in an interior space, was limited.
In 1970, the CIE published document No. 16 [2] on calculation methods available for natural lighting. This document detailed the existence of more than fifty calculation procedures. In addition, this text highlights the narrow scope of these procedures, as well as the poor results attained, usually following drawn-out and tedious processes.
One of the methods most frequently used to assess light distribution within buildings is the analysis of scale models, which are studied in an artificial sky simulator. This avoids laborious calculation
OPEN ACCESS

Energies 2011, 4
1011
procedures. However, as studies by Thanachareonkit, Scartezzini and Andersen [3] show, there is a wide divergence between results obtained from a scale model and those observed in a real model.
The invention of personal computers brought about the appearance of an entire range of computer programs capable of providing full reports on natural lighting within any type of space, under any sort of sky and in any geographical location, measured on a specific day and time. A common feature of all these is their extreme vagueness as they offer practically no information on their basis and hypotheses for calculation and do not even mention the sources used for data calculation on the conditions of the sky.
As a result of this situation, several publications have appeared with comparative analyses of the more widely used programs, designed to help lighting designers choose the most suitable programs.
2. Antecedents and Objectives
As was mentioned earlier, many studies have been carried out to prove which is the most suitable form of lighting software. Some of the most relevant ones are described below.
The study by Kopylov and Khodulev [4] resolves the analysis of three calculation programs, Lightscape 3.1, Inspirer 5.3 and Desktop Radiance, although little analysis is offered of the last of these in this study. As a result of this, most of the results shown relate to Lightscape and Inspirer. The first part of the study consists in the analysis of a cube of certain measurements where the luminance values of six points of one of its faces are established using a physical formulation. Subsequently, the luminance obtained thanks to the formulation is compared with the results produced by the Lightscape and Inspirer programs, and some tables are created defining the margin of error in relation with the calculation time.
Susan Ubbelohde’s study [5] analyses the following programs: Lumen Micro, Super Lite, Radiance and Lightscape. A truly fascinating prior analysis is carried out for all the programs, describing the different qualities of each.
Following the description, trials of all programs are carried out on a specific model: building 1022 of Natoma Street in San Francisco, by the architect Stanley Saitowitz. The results obtained with each program are also contrasted with the measurements carried out on the original building.
The work of Roy [6] carries out an extensive description both of the history of lighting calculation programs and of the programs themselves. This test analyses the most common programs at the time of study, Adeline, equivalent to Radiance 2.0 in Windows 2000 version, Lightscape, Microstation and RadioRay.
Bryan’s article [7] begins with a brief description of the more common simulation programs among which it is worth noting Lightscape 3.2, Desktop Radiance 1.02, Lumen Micro 2000 and FormZ Radiozity 3.8. Subsequently, the article details the virtues and flaws of the different calculation programs in relation with different aspects.
The article by Lau and Mistrick [8] begins with an extensive introduction on the different variables for choosing a lighting calculation program. It is surprising to note that without prior analysis or reference to any sort of trial, the article in question categorically states that without a doubt Desktop Radiance is the best calculation program.
In 2005, the CIE published [9] a series of trials that were to act as a basis for the evaluation of the precision of calculation programs. One of the authors who used the CIE proposals for his own work

Energies 2011, 4
1012
was Maamari [10], who compares the precision of the Lightscape 3.2 and Relux 2004 programs. The author concludes that it is advisable to carry out complementary tests in addition to those established by the CIE, in order to cover other aspects of light propagation.
Chang-Sum and Seung-Jin [11] established one of the most interesting proposals in terms of computer simulation studies. Taking into account that Desktop Radiance is the most widely-used tool in this field of research they compared this program with a scale model with ten photometers. The results of these trials show significant differences between Radiance and the measurements on the scale model. As a result, the authors established a correction factor, applicable to the results provided by Radiance.
In addition to the articles summarized above, there are many more with the same objective, such as the article by Ng [12] of the University of Hong Kong, or that of Houser [13] of the University of Pennsylvania. Other relevant studies are those carried out by Mardaljevic [14,15], comparing the results of lighting software under real sky conditions, and those by Reinhart [16], which focus mainly on the application of calculation tools to architectural design.
It is hard to obtain an overall picture of the efficiency and precision of the aforementioned software from all the articles observed. This conclusion is reached while observing that all the trials carry out lighting analyses for very specific conditions, and rule out the variable of studying the model on different dates and times.
This is why it is necessary to express the results in values relating to the levels of exterior lighting, using the concept of DF (Daylight Factor) [17], which shows the quotient of lighting levels inside the model and those obtained outside. This enables the observation of light distribution regardless of day and time of study.
There are another two fundamental absences in the studies examined previously; firstly, with the exception of the study carried out by Ubbelohde [5], there is a lack of comparison with a real model. Secondly, none of the works mentioned take into account the orientation or geometric variations of the model. The variation in the model’s dimensions helps to study how the calculation program responds to different calculation situations: the simpler the model, the easier the distribution of lighting levels, while if the model is more complex, the distribution of lighting can heighten certain margins of error which condition the software’s evaluation. This aspect is mentioned exclusively in the work of Kopylov-Khodulev [4].
It cannot be denied that it is hard to find information on the calculation systems of each program. Some articles, like that by Ubbelohde [5], do carry out an exhaustive description of each calculation program, although it must be said that much of the data provided by this article lacks contrasting views. As a result of this it is hard to describe the calculation system for each program, which demonstrates the lack of literature on the foundations and algorithms used.
In addition, the analyses mentioned earlier do not contemplate any of the current calculation programs, such as Ecotect 5.5 or Dialux 4.4. We must remember that the field of technological development through computers is rapidly progressing, with many programs becoming obsolete in very short periods of time.
In consequence, this article aims to carry out a series of trials on an ensemble of widely-used programs, assessing them according to the theoretical principles of lighting. This article falls within the lines of research on Daylighting which the Institute of Architecture and Building Science of the University of Seville has been carrying out for many years [18,19].

Energies 2011, 4
1013
3. Methodology for Calculation
In the trial explained below we will consider a simple model which can be easily reproduced and permits quick and precise calculation. We rule out the use of the clear sky hypothesis, as in this context a high number of variables preventing universal conclusions are introduced. Analyses in overcast sky conditions are more advisable for contrasting time variations as in these conditions the coefficients of uniformity and the daylight factors remain invariable. The overcast sky model, used in this article, is supported by the definition coined by Moon-Spencer [20], where the luminance values are distributed in accordance with the following law:
Lθ = Lz(1 + 2sinθ)/3
which implies that the lowest luminance value in an overcast sky vault occurs in the horizon, and is equivalent to a third of the maximum luminance at the zenith:
L0 = Lz/3
The model for calculation is defined as a cube of 3 × 3 × 3 meters, with an opening of 1 × 1 meters on one of its sides (Figure 1). The location of this opening is variable, as we will study in this first trial. The surfaces of this cube are perfectly diffuse and their reflection coefficients vary in accordance with their location: the value of the ceiling will be 0.80, the walls 0.50 and the floor 0.2. The opening of 1 × 1 meters is centered on one of the sides, letting the light into the interior of the model completely, without filtering it.
Figure 1. Trial model described.
Energies 2011, 4
1014
This model will be studied over different trials, which will be described subsequently:
• Orientation Trial; • Temporary Variation Trial; • Geometric Variation Trial.
Extensive research has been carried out on the programs to be analyzed in this study, evaluating those with greatest representation and presence worldwide. For the selection criteria for programs for the trial we have ruled out those which are not employed professionally for the calculation of lighting. As a final condition we employed the same programs which feature prominently in the aforementioned articles. For the definitive selection, we decided to use Lightscape 3.2, Desktop Radiance 2.0, Lumen Micro 7.5, Ecotect 5.5 and Dialux 4.4.
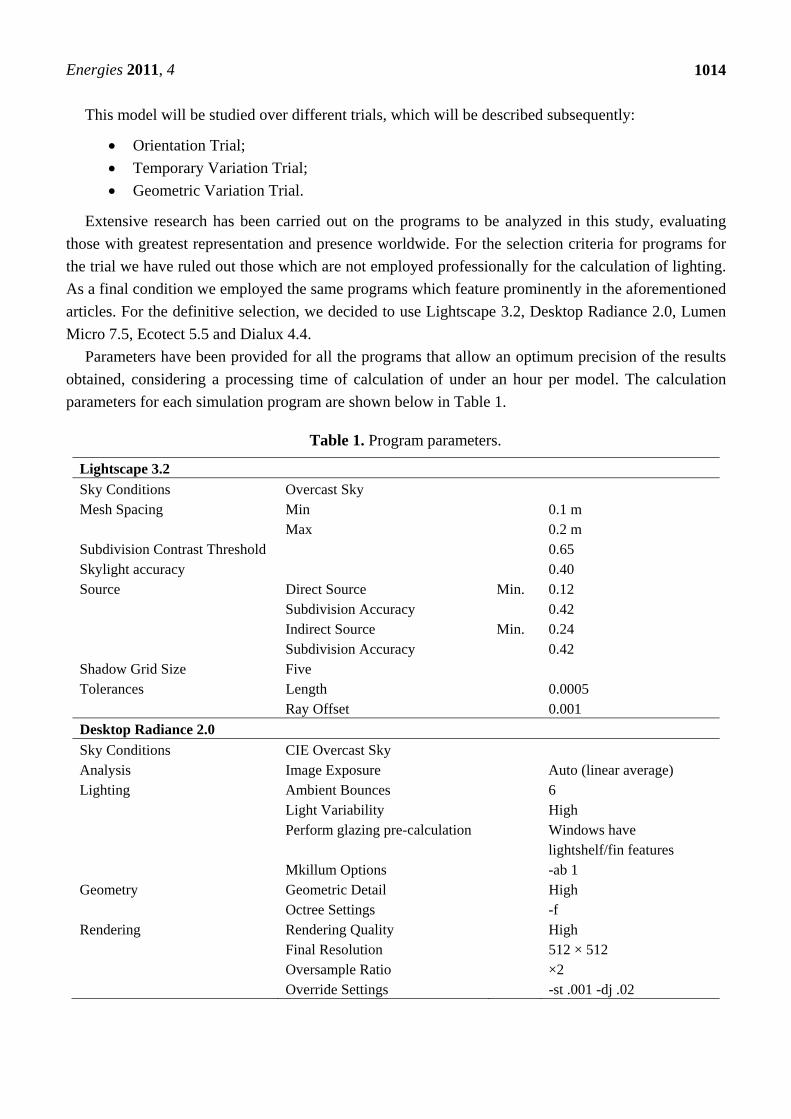
Parameters have been provided for all the programs that allow an optimum precision of the results obtained, considering a processing time of calculation of under an hour per model. The calculation parameters for each simulation program are shown below in Table 1.
Table 1. Program parameters.
Lightscape 3.2 Sky Conditions Overcast Sky Mesh Spacing Min 0.1 m Max 0.2 m Subdivision Contrast Threshold 0.65 Skylight accuracy 0.40 Source Direct Source Min. 0.12 Subdivision Accuracy 0.42 Indirect Source Min. 0.24 Subdivision Accuracy 0.42 Shadow Grid Size Five Tolerances Length 0.0005 Ray Offset 0.001 Desktop Radiance 2.0 Sky Conditions CIE Overcast Sky Analysis Image Exposure Auto (linear average) Lighting Ambient Bounces 6 Light Variability High Perform glazing pre-calculation Windows have
lightshelf/fin features Mkillum Options -ab 1 Geometry Geometric Detail High Octree Settings -f Rendering Rendering Quality High Final Resolution 512 × 512 Oversample Ratio ×2 Override Settings -st .001 -dj .02

Energies 2011, 4
1015
Table 1. Cont.
Lumen Micro 7.5 Sky Conditions Cloudy Calculation Detailed Calculation Rendering Detail 1.0/0.3 m × 0.3 m Ecotect 5.5 Sky Conditions CIE Overcast Sky 8500lx Type of Calculation Natural Light Levels Calculation Over de Analysis Grid Ray-Tracing Precision Full Window cleanliness Clear x1.00 Calculate Room Averaged Window Areas
Yes
Grid Data & Scale Minimum 0.20 Maximum 0.40 Contours 0.15 Dialux 4.4 Sky Conditions Overcast Sky Calculation options Very accurate Calculation procedures Automatic Daylight Factors Calculate Daylight Factors
4. Orientation Trial
The first trial carries out a study on the model and analyses levels of lighting in overcast sky conditions in accordance with the position of the window. Accordingly, a specific day for study, common to all calculations, will be set and five analyses will be carried out for each program. For each analysis the window will be situated in a different position, North, South, East, West and finally in the ceiling.
The development of this trial has two main aims:
• On the one hand, to confirm that the different programs give equal results for the different orientations of the side opening.
• Secondly, to contrast the difference of the levels of illuminance obtained for the gap at the zenith position with those observed for the gaps in a side position.
The results obtained in this trial are shown in Figures 2,3. The graph shown highlights the Average Daylight Factors for each program on an overcast sky calculation, where the variable is the position of the opening on the model. The following conclusion is reached:
The illuminance levels reached with the five programs do not vary with the orientation of the window, that is to say, all programs interpret the overcast sky as a vault which emits luminance which is constant on each parallel of its surface, regardless of the day and time of study.
In this way, all five programs have acceptable results, although the differences in the values obtained are striking, as Desktop Radiance 2.0 doubles the illuminance levels in side openings when compared with Lightscape and Ecotect.

Energies 2011, 4
1016
The graph for Maximum Daylight Factors shows that the illuminance at the zenith for Desktop Radiance 2.0, Lumen Micro 7.5 and Dialux 4.4 programs is not much higher than the levels in the side openings. Nevertheless, with the Lightscape 3.2 and Ecotect 5.5 programs it is observed that the illuminance levels at the zenith are almost double those of the side openings. From this it is possible to deduce that overcast sky interpretation differs according to the program used.
Figure 2. Daylight Factor of Average levels of Illuminance. June 21st, overcast sky.
Figure 3. Daylight Factor of Maximum Illuminance Levels. June 21st, overcast sky.

Energies 2011, 4
1017
5. Temporary Variation Trial
The second trial consists in analyzing how light is distributed according to the time on a specific day. As was shown in the previous study, in overcast sky conditions the orientation of the window makes no difference, so we will place it for instance at the South. Subsequently, the trial will measure the coefficients of uniformity and the natural lighting factors. The analyses will be for a specific day, in this case, June 21st, and the results obtained every hour between 9:00 and 18:00 will be examined.
Figure 4 shows the different coefficients of uniformity, according to program and time. As is observed, the uniformity values are fixed or slightly variable in Lightscape, Lumen Micro, Ecotect and Dialux. However, for Desktop Radiance, the uniformity coefficients resulting from the program’s measurements vary visibly with the time of study. These coefficients range from 7.53 at 9:00 am, reaching a maximum at 11:00 am with a value of 8.65, and falling progressively until 18:00 with a value of 2.66. This is due to Desktop Radiance using algorithms that add the factor of the turbidity of the sky to the definition of overcast sky established by Moon and Spencer.
Figure 4. Coefficients of Uniformity (Max/Min illuminance levels). From 9:00 to 18:00 on June 21st, overcast sky.
As is observed, Ecotect and Dialux show overly elevated uniformity coefficients compared with other programs; their values range between 13.66 and 15.23. That is to say, the maximum illuminance levels are up to fifteen times higher than the minimum levels.
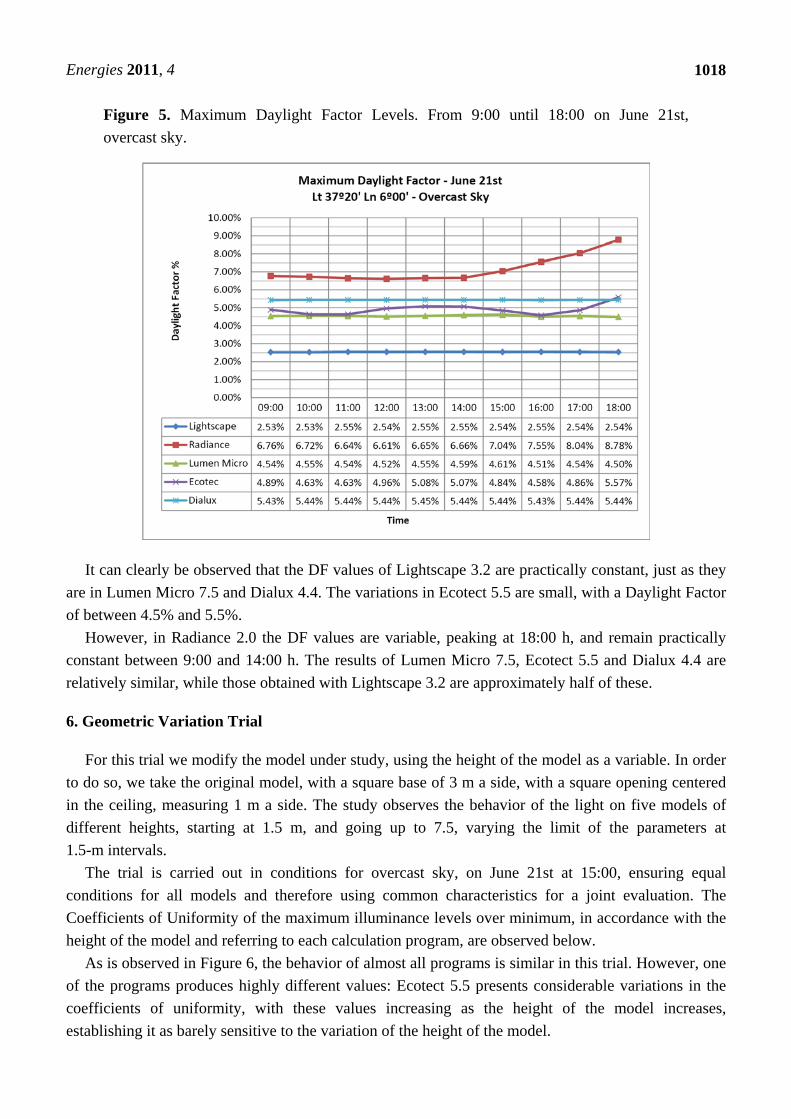
Calculations for the Daylight Factor for each program at the times on the day of study are carried out below. Figure 5 shows the results of the DF values of each program, in accordance with the time.
Energies 2011, 4
1018
Figure 5. Maximum Daylight Factor Levels. From 9:00 until 18:00 on June 21st, overcast sky.
It can clearly be observed that the DF values of Lightscape 3.2 are practically constant, just as they are in Lumen Micro 7.5 and Dialux 4.4. The variations in Ecotect 5.5 are small, with a Daylight Factor of between 4.5% and 5.5%.
However, in Radiance 2.0 the DF values are variable, peaking at 18:00 h, and remain practically constant between 9:00 and 14:00 h. The results of Lumen Micro 7.5, Ecotect 5.5 and Dialux 4.4 are relatively similar, while those obtained with Lightscape 3.2 are approximately half of these.
6. Geometric Variation Trial
For this trial we modify the model under study, using the height of the model as a variable. In order to do so, we take the original model, with a square base of 3 m a side, with a square opening centered in the ceiling, measuring 1 m a side. The study observes the behavior of the light on five models of different heights, starting at 1.5 m, and going up to 7.5, varying the limit of the parameters at 1.5-m intervals.
The trial is carried out in conditions for overcast sky, on June 21st at 15:00, ensuring equal conditions for all models and therefore using common characteristics for a joint evaluation. The Coefficients of Uniformity of the maximum illuminance levels over minimum, in accordance with the height of the model and referring to each calculation program, are observed below.
As is observed in Figure 6, the behavior of almost all programs is similar in this trial. However, one of the programs produces highly different values: Ecotect 5.5 presents considerable variations in the coefficients of uniformity, with these values increasing as the height of the model increases, establishing it as barely sensitive to the variation of the height of the model.

Energies 2011, 4
1019
Figure 6. Coefficients of Uniformity (Max/Min illuminance levels) varying the height of the model from 1.5 m to 7.5 m. June 21st at 15:00, overcast sky.
7. Trial with Artificial Sky
Subsequently, comparisons are made of each program with the artificial sky, thus ensuring a comparison which makes it possible to properly determine the validity of the tools used.
The artificial sky used in this trial belongs to the laboratory of the Department of Architectural Constructions I of the Higher Technical School of Architecture of Seville. Its design corresponds with that of a parallelepiped model of artificial sky, where a constant luminance reflector emits light inside a cube adapted to the lamp’s measurements. On the reflector there are 16 fluorescent tubes providing a homogeneous emission of light flux. The walls of the hexahedron are mirrors simulating the location of the horizon in the infinite, just like the conditions of a real sky. The reproduction of the model under study is placed on the floor of the cube, which is matte white.
A parallelepiped sky, contrasted and calibrated following the study by Navarro, Sendra and Barros [21], where the model to be studied is placed, will be used (Figure 7). An appropriate artificial sky simulates the conditions of an overcast sky of the Moon-Spencer type.
A cube measuring 30 × 30 × 30 cm with a 10 × 10 cm opening centered in the ceiling is placed inside the artificial sky (Figure 8). The scale model simulates the model which has been tested throughout this article, on a 1:10 scale. This scale model has been manufactured in lightweight white cardboard as this is considered a reflector with a 0.95 reflection coefficient. To prevent the transmission of light through the cardboard, the scale model has been lined with aluminum foil, thus rendering the walls of the model completely opaque. A multiway Megatron Limited photometer with twelve measurement points has been used.

Energies 2011, 4
1020
The results of the measurement, which was carried out using the photometer inside the model exposed to the artificial sky, are shown below.
Figure 7. Parallelepiped artificial sky used in the trial.
Figure 8. Model of calculation for artificial sky.
Figure 9 shows the levels of illuminance at the specific point in red, while the daylight factor for each point measured appears in blue. Once results have been obtained for the artificial sky, as is observed in Figure 10, these are contrasted with the measurements provided by each program, reproducing the scale model as a computer model.
Neither Lumen Micro nor Dialux allow reflection coefficients higher than 0.90, and therefore the D.F. values and the uniformity coefficients will be slightly lower than those obtained in the actual model.
The comparison of the daylight factors shows significant differences between the computer calculations and the measurements carried out with the aid of an artificial sky. The highest daylight factors were measured on the scale model, while Figure 11 shows the values obtained with the programs measured approximately half of these.

Energies 2011, 4
1021
Figure 9. Measurements of the photometer in the scale model of artificial sky.
Figure 10. Results of the measurements of artificial sky.
Figure 11. Comparison of Daylight Factor between software and artificial sky.

Energies 2011, 4
1022
Secondly, the uniformity coefficients of the artificial sky and the different programs are checked (Figure 12). As is observed, the coefficients of almost all programs are very close to those obtained with the artificial sky, with the exception of Radiance 2.0, which obtains values of 1.88 for the Max/Min quotient.
Figure 12. Comparison of the Uniformity Coefficients between software and artificial sky.
The uniformity coefficients are similar between the artificial sky and the measurements in the software, with the exception of Desktop Radiance, which shows values for the Max/Min quotients which are higher than the rest.
8. Conclusions
By observing the trials described earlier the following conclusions on the precision of lighting simulation software under overcast sky conditions can be reached:
The application of these five lighting simulation tools produces significant differences in daylight factor results, both for average and maximum illuminance, and coefficients of uniformity.
Calculation programs use very different interpretations of the sky vault in overcast sky conditions. In general it is possible to determine different calculation criteria for each program, as can be observed from the daylight factors shown in Figures 2 and 3 of the orientation trial.
Specifically, it is apparent in Figure 5 that Desktop Radiance does not maintain daylight factors uniformly in the time variation trial.
This observation leads to two deductions. The first of these is that the position of the sun can be considered a variable within the calculation algorithm for overcast sky conditions, as Radiance uses a definition of sky that is more complex than that of other programs, applying the variable of turbidity in the distribution of luminance of the sky. The second deduction is that it is possible that the calculation parameters considered by the authors for this program, see point three, have not been sufficient to determine a precise calculation.

Energies 2011, 4
1023
Both the autonomous program Ecotect and Dialux show very high uniformity coefficients in many of the trials. The results of these uniformity coefficients contrast with those observed when measuring the scale model in artificial sky conditions.
In the geometric variation trial, when models reach a certain degree of complexity, some calculation programs like Ecotect show different readings for the uniformity coefficients.
In conclusion, there is currently a wide range of natural lighting simulation programs, but neither the calculation criteria nor the results reached are uniform. Accordingly, it is advisable to contrast the calculation tests of the computer programs with a scale model in artificial sky conditions, always using several calculation programs with a view to preventing errors in the results obtained.
References
1. Hopkinson, R.G. Daylighting; Butterworth-Heinemann Ltd.: Oxford, UK, 1966. 2. Commission Internationale de l’Eclairage (C.I.E.). Daylight; C.I.E.: Vienna, Austria, 1970. 3. Thanachareonkit, A.; Scartezzini, J.L.; Andersen, M. Comparing daylighting performance
assessment of buildings in scale models and test modules. Sol. Energy 2005, 79, 168–182. 4. Kopylov, E.A.; Khodulev, A.B.; Volevich, V.L. The Comparison of Illumination Maps Technique
in Computer Graphics Software; Keldysh Institute of Applied Mathematics RAS: Moscow, Russia, 1998.
5. Ubbelohde, M.S. Comparative Evaluation of Four Daylighting Software Programs; University of California: Berkley, CA, USA, 1999.
6. Roy, G.G. A Comparative Study of Lighting Simulation Packages Suitable for Use in Architectural Design; School of Engineering Murdoch University: Murdoch, Australia, 2000.
7. Harvey, B. Lighting/daylighting Analysis: A Comparison. In Proceedings of the American Solar Energy Society Conference, Reno, NV, USA, June 2002.
8. Lau, A.S.; Mistrick, R. Advancing the Art & Science of Daylighting Design; Pennsylvania State University: State College, PA, USA, 2002.
9. C.I.E.-TC-3-33. Test Cases to Assess the Accuracy of Lighting Computer Programs, Final draft; Commission Internationale de l’Eclairage: Vienna, Austria, 2005.
10. Maamari, F.; Fontoynont, M.; Adra, N. Application of the CIE test cases to assess the accuracy of lighting computer programs. Energy Build. 2006, 38, 869–877.
11. Chang-Sung, K.; Seung-Jin, C. Daylighting simulation as an architectural design process in museums installed with toplights. Build. Environ. 2011, 46, 210–222.
12. Ng, E. A study of the Accuracy of Daylighting Simulation of Heavily obstructed Buildings in Hong Kong. In Proceedings of the Seventh International IBPSA Conference, Rio de Janeiro, Brazil, January 2001; pp. 1215–1222.
13. Houser, K.W. A Comparison of Luminance Images: Lightscape, Radiance, and an IQCam; Final Report, Contract Number 993-6-018; Department of Architectural Engineering, The Pennsylvania State University: University Park, PA, USA, March 1997.
14. Mardaljevic, J. Validation of a lighting simulation program under real sky conditions. Light. Res. Technol. 1995, 27, 181–188.

Energies 2011, 4
1024
15. Mardaljevic, J. The BRE-IDMP dataset: A new benchmark for the validation of illuminance prediction techniques. Light. Res. Technol. 2001, 33, 117–134.
16. Reinhart, C.F.; Fitz, A. Findings from a survey on the current use of daylight simulations in building design. Energy Build. 2006, 38, 824–835.
17. Commission Internationale de l’Eclairage (C.I.E.). International Lighting Vocabulary; C.I.E.: Vienna, Austria, 1978.
18. Navarro, J.; Sendra, J.J. Daylighting provided by horizontal openings using the illumination vector. Renew. Energy 2006, 31, 2513–2523.
19. Navarro, J.; Sendra, J.J. Determination of the origin of the illumination vector due to vertical windows under Moon-Spencer sky conditions (uniformly overcast). Renew. Energy 2008, 33, 168–172.
20. Moon, P.; Spencer, D.E. Illumination from a non-uniform sky. Illum. Eng. 1942, 37, 707–726. 21. Navarro, J.; Sendra, J.J.; Barros, C. Design and Calculation Method for Natural Lighting in
Architecture, Part I: The Direct Component. In Proceedings of the 3rd European Conference on Architecture: Solar Energy in Architecture and Urban Planning, Florence, Italy, May 1993; pp. 371–373.
© 2011 by the authors; licensee MDPI, Basel, Switzerland. This article is an open access article distributed under the terms and conditions of the Creative Commons Attribution license (http://creativecommons.org/licenses/by/3.0/).