Embed Size (px)
Citation preview

ENERCON SERVICES, INC.
GOTHIC MODEL OF BWR
SECONDARY CONTAINMENT
DRAWDOWN ANALYSES
PREPARED BY PAUL N HANSEN (973)601-0510 x235
ENERCON SERVICES INC. 400 VALLEY RD SUITE 104
MOUNT ARLINGTON NJ 07856

ENERCON SERVICES, INC.
2
Author: Paul N Hansen
Affiliations : Safety Analysis Engineer ENERCON Services, Inc., Member ASME, Former Member BWROG Emergency Procedures Committee, Former Member GOTHIC Users Group, BSME Graduate Old Dominion University, MSME Graduate New York Polytechnic University
Address: ENERCON Services, Inc. 400 Valley Road Suite 104 Mount Arlington, NJ 07856 [email protected] Phone (973)601-0510 Fax (973)601-0515
ENERCON SERVICES, INC.
3
PURPOSE This article introduces a GOTHIC version 7.1 model of the Secondary Containment Reactor Building Post LOCA drawdown analysis for a BWR. GOTHIC is an EPRI sponsored thermal hydraulic code. This analysis is required by the Utility to demonstrate an ability to restore and maintain the Secondary Containment Reactor Building negative pressure condition. The technical and regulatory issues associated with this modeling are presented. The analysis includes the affect of wind, elevation and thermal impacts on pressure conditions. The model includes a multiple volume representation which includes the spent fuel pool. In addition, heat sources and sinks are modeled as one dimensional heat conductors. The leakage into the building is modeled to include both laminar as well as turbulent behavior as established by actual plant test data. The GOTHIC code provides components to model heat exchangers used to provide fuel pool cooling as well as area cooling via air coolers. The results of the evaluation are used to demonstrate the time that the Reactor Building is at a pressure that exceeds external conditions. This time period is established with the GOTHIC model based on the worst case pressure conditions on the building. For this time period the Utility must assume the primary containment leakage goes directly to the environment. Once the building pressure is restored below outside conditions the release to the environment can be credited as a filtered release.
REFERENCES: 1. Standard Review Plan 6.2.3 Revision 2 “Secondary Containment Functional Design” 2. Regulatory Guide 1.183, Rev. 0 “Alternative Radiological Source Terms for Evaluation Design Basis Accidents at Nuclear
Power Reactors” 3. 1997 ASHRAE Fundamentals Chapter 15 Airflow Around Buildings 4. NAA-SR-10100 “Conventional Buildings for Reactor Containment’s” Dated 25 July 1965
RESULTS A number of results are produced as part of this calculation. These are divided into short term and long term analysis. The short term analysis determine the time for the SGTS to restore the Secondary Containment Reactor Building pressure below the negative 0.25inch of Water Gauge. It is demonstrated by these results that with cold outside air and wind from the easterly direction a bounding result was produced given a 70/30 leakage roof to railroad door distribution. This bounding case is used to perform the long term analysis. A total of four long term evaluations are conducted each with a different start time for the fuel pool cooling system.
ENERCON SERVICES, INC.
4
CONCLUSIONS The results of this evaluation demonstrate the ability of the SGTS system to restore and maintain the Secondary Containment Reactor Building pressure below negative 0.25inch water gauge. The sensitivity studies performed as part of the main body of this calculation demonstrate that the 70% to 30% split of leakage between the upper and lower portions of the containment provide the bounding condition. This split is considered to be conservative based on plant specific testing, which demonstrated that leakage into the building is predominantly from the roof elevation. The cold outside air temperature condition produced a more bounding result than the warm outside air. Under worst case conditions the SGTS can restore the Secondary Containment Reactor Building Pressure back below negative 0.25inch water gauge. The fuel pool cooling system must be started within 24 hours to ensure that the Secondary Containment Reactor Building Pressure can be maintained below negative 0.25inch water gauge for long term response of the building. REGULATORY REQUIREMENTS Several of the modeling input assumptions are developed from Regulatory guidance. These modeling input assumptions are outlined below.
1.1 No credit is taken for secondary containment outleakage. This assumption is based on the regulatory guidelines, which specifically states the following. “No credit should be taken for secondary containment outleakage.”
1.2 The wind speed to be assumed will be based on the extreme wind speed for the region that exceeds the 95% compliance value for the time. The 17.2 mph at 33 feet value is selected as the high value. The guidelines provided in Reference 1 state the following. “The negative pressure differential to be maintained in the secondary containment and other contiguous plant area should be no less than 0.25 inches (water) when compared with adjacent regions, under all wind conditions up to the wind speed at which diffusion becomes great enough to assure site boundary exposures less than those calculated for the design basis accident even if exfiltration occurs.” In addition, the guidelines provided in Reference 3 state the following: “The effect of high winds on the ability of the secondary containment to maintain a negative pressure should be evaluated on an individual case basis. The wind speed to be assumed is the 1-hour average value that is exceeded only 5% of the total number of hours in the data set. Ambient temperatures used in these assessments should be the 1-hour average value that is exceeded only 5% or 95% of the total numbers of hours in the data set, whichever is conservative for the intended use (e.g., if the high temperatures are limiting, use those exceeded only 5%).” The outside temperature to be used in the analysis will be selected from the warm (86oF) and the cold (28oF) values. Sensitivity studies will be used to determine which value to use for the long term analysis. The value that provides a more bounding result will be applied.
1.3 The SGTS fan performance characteristics are to be included in this evaluation. The basis for this assumption is found in Reference 1, which states the following. “Fan performance characteristics should be considered in evaluating the depressurization of the secondary containment.”
1.4 For the primary containment thermal conductors, the initial thermal profile will be a linear profile starting on the interior with the containment temperature and dropping across the conductor materials to the reactor building
ENERCON SERVICES, INC.
5
temperature. For conductors with the outside ambient as one of the boundary conditions, the temperature profile will be a constant value equal to that assumed for the Reactor Building. The reason for this is that the outside ambient boundary condition is assumed to be adiabatic, as required by Reference 1. The heat transfer from the building to the surrounding atmosphere is ignored. These boundaries are treated as adiabatic. This assumption is based on Reference 1, which states the following. “Adiabatic boundary conditions should be assumed for the surface of the secondary containment structure exposed to the outside environment.”
1.5 The primary containment structure that is in communication with the secondary containment atmosphere will be assigned a convective boundary condition that uses a temperature profile which corresponds to the most bounding accident profile for the primary containment. To accomplish this the Main Steam Line Break is used for the short term response and the Main Steam Line Break, Large LOCA and Small Break LOCA are used to represent the long term response. The combination profile is a conservative representation of the containment response, which is the basis for the assumption. The need to include this type of boundary condition is found in Reference 1, which states the following. “Heat Transfer from the primary to secondary containment should be considered.” This assumption considers such a phenomena using a bounding temperature profile.
1.6 The Heat Transfer coefficient between the primary containment atmosphere and the primary containment structure is assumed to offer virtually no resistance to heat transfer in the early portion of the accident. This is a reasonable assumption since the highly turbulent blowdown conditions will offer significant heat transfer opportunity in conjunction with condensation on the containment walls. The long term response assumes a constant heat transfer coefficient that is smaller. The value is selected to conservatively represent the heat transfer to the structure. Specifically, the coefficient is assigned to drive heat into the wall while minimizing the cooling benefit that the atmosphere may offer later in the event. This approach is consistent with that documented in Reference 1, which states the following. “Heat transfer from the primary containment atmosphere to the primary containment structure should be calculated using conservative heat transfer coefficients such as those provided in Branch Technical Position CSB 6-1.” This analysis will not directly use the CSB 6-1 values, but will maintain the conservative nature intended by Reference 1. The determination of heat transfer coefficients within primary containment is a dynamic calculation dependent upon fluid and structure temperatures. Further complicating the calculation is the condensation rate, which is influenced by the number of non-condensable gases present. Therefore, to properly implement the CSB 6-1 approach it is necessary to model the primary containment response in detail. Rather than use this complicated approach, a bounding approach will be used. The values selected are established in the heat transfer portion of this calculation. Radiant Heat Transfer between the Primary Containment Outer wall and the Secondary Containment Atmosphere will be accounted for in the analysis. This assumption is based upon Reference 1, which states the following: “ Radiant heat transfer to the secondary containment should be considered.” Radiant heat transfer between other heat structures is ignored as these structures are typically cooler and exclusion of this feature is deemed to be conservative for this type of analysis.
1.7 The total air volume used for Secondary Containment Drawdown analysis is conservatively developed by maximizing the air volume. This assumption is based on two basic issues associated with the drawdown analysis. As addressed by Reference 1, the allowable leakage is based on one air change per day. Therefore, the larger the air volume assumed the larger the air change per day that is to be expected. The second is that the
ENERCON SERVICES, INC.
6
larger the air space volume the more mass that must be removed to reduce the pressure.
MODELING CONSIDERATIONS
A number of modeling input assumptions are used based on plant specific information. These are described below 2.1 The ability of the SGTS to establish the desired negative pressure is based on the greatest negative effect caused
by the wind, while the boundary conditions (used to determine inleakage) will use the average pressure for the four sides. In terms of measurement and control, the negative value is bounding since the SGTS is attempting to drive the building pressure to a value of 0.25 inH2O below that which it measures and therefore, the inside pressure to be controlled is forced to a lower absolute value. The implementation of the control system in the plant compensates for the location of the pressure sensors and the design atmospheric conditions by setting the setpoint at 1.7 inH2O (based on the Analytical limit of –0.71 inH2O) below that which is measured at most limiting location. Similarly, the GOTHIC models’ success will be measured by the greatest negative effect caused by the wind, while the boundary conditions will use the average pressure for the four sides. This is not as great a contradiction as it may sound since the building will in fact experience these different wind pressure effects across its surface, and the pressure control evaluates all four sides and uses the most limiting. The one exception to this approach is the leakage at the railroad door where only one side of the building is involved with leakage.
2.2 The Leakage Flow Split between the upper and lower elevations of the reactor building is assumed to be 70% to 30% split. The selection of this conservative split is established based upon specific testing that was done to determine the relative leakage at different locations into the building. The testing produced a set of results that indicate that leakage from the railroad door is around 10% of the total Reactor Building Secondary Containment Leakage. Since the differential pressure at the railroad door elevation is higher.
2.3 The initial temperature of the volumes in the three volume model is 75oF for the main building, refueling floor and the pump rooms. The initial temperature of the volumes are based on a reasonable operational temperature for the reactor building. The initial temperature is based on a review of the normal ventilation system operation using the initial outside ambient air condition specified for this analysis.
2.4 The Fuel Pool Cooling system is started manually by control room operators. Since actions are required to put this system into service by realigning the Standby Service Water (SW) system. The current requirement is to place the system into operation when the 125oF pool temperature limit is reached if the normal cooling is lost and not expected to be restored. No time limit is stated. Sensitivity studies will be performed to determine what delay if any is acceptable. The criteria associated with an acceptable delay is based on the ability to maintain the secondary containment reactor building below negative 0.25inch water. It is important to note that other restrictions on fuel pool temperature such as fuel temperature and fuel pool structural limits may be more bounding. The delay time established for this analysis may not be acceptable for these other considerations. However, if the other considerations require an early start of the fuel pool cooling system, then the assumption used for this analysis would be bounding since an earlier start time would be required.
2.5 The secondary containment is modeled as three nodes. The first of these nodes is the pump rooms located on the 422.25’ elevation; the second is the main building volume of the reactor building including the railroad bay up to the refueling floor; and the third is the refueling floor. This nodalization was selected to represent the major separations within the reactor building. The refueling floor is selected as one of the volumes since it contains a spent fuel pool and has associated with it, the upper RB siding, which is one of the leakage paths to the outside environment. The pump rooms are all located at the same elevation and contain significant thermal heat loads. They are also in communication with the suppression chamber of the primary containment via heat conduction. The remainder of the reactor building is generally connected by a large open hatch allowing for relatively free
ENERCON SERVICES, INC.
7
communication throughout and thus behaving like a single volume. This region also contains a number of small rooms that contain heat sources and associated safety related room coolers. Combining these rooms with the remainder of the building produces a conservative result. This is based on how the impact of the room heat loads affects the building pressure. Combining these volumes allows the room heat loads to directly impact the main building pressure and temperature. This modeling approach also reduces the effectiveness of the associated room coolers ability to remove this heat, since the resulting temperature is reduced with the increased volume. The air temperature reduction for the rooms artificially minimizes the temperature difference between the air and cooling water that services these coolers. Therefore, the heat removal provided by the coolers is under predicted.
MODELING INPUT DEVELOPMENT BOUNDARY CONDITION INPUTS: The boundary conditions to be used in the model account for the wind conditions, temperature and pressure elevation. The following discussion provides a derivation of the boundary condition pressures established for the door and roof line leakage paths. These pressures are calculated as the total stagnation pressure acting on the building leakage locations. For a given wind speed, wind direction and temperature the dynamic and static pressures are calculated for the building leakage locations. The first step is to calculate the static pressure contribution which is a function of temperature and elevation. This is followed by the determination of the wind pressure contribution which is a function of temperature, elevation and wind velocity. The relationship used to establish the static pressure outside as a function of height is based on the Bernoulli equation. (Equation 1) PoElev(EL,Temp) = Patm - ρ(Temp)*(EL-441ft)*g*C Where EL is the elevation of the location of interest, Temp is the air temperature, g is the gravity constant and C is the unit conversion constant. The wind induced pressure effect is calculated using the Bernoulli Equation along with the appropriate wind pressure coefficients (Reference 3). This analysis assumes the terrain category of the Met Tower is Category 3 and the reactor building is also Category 3.
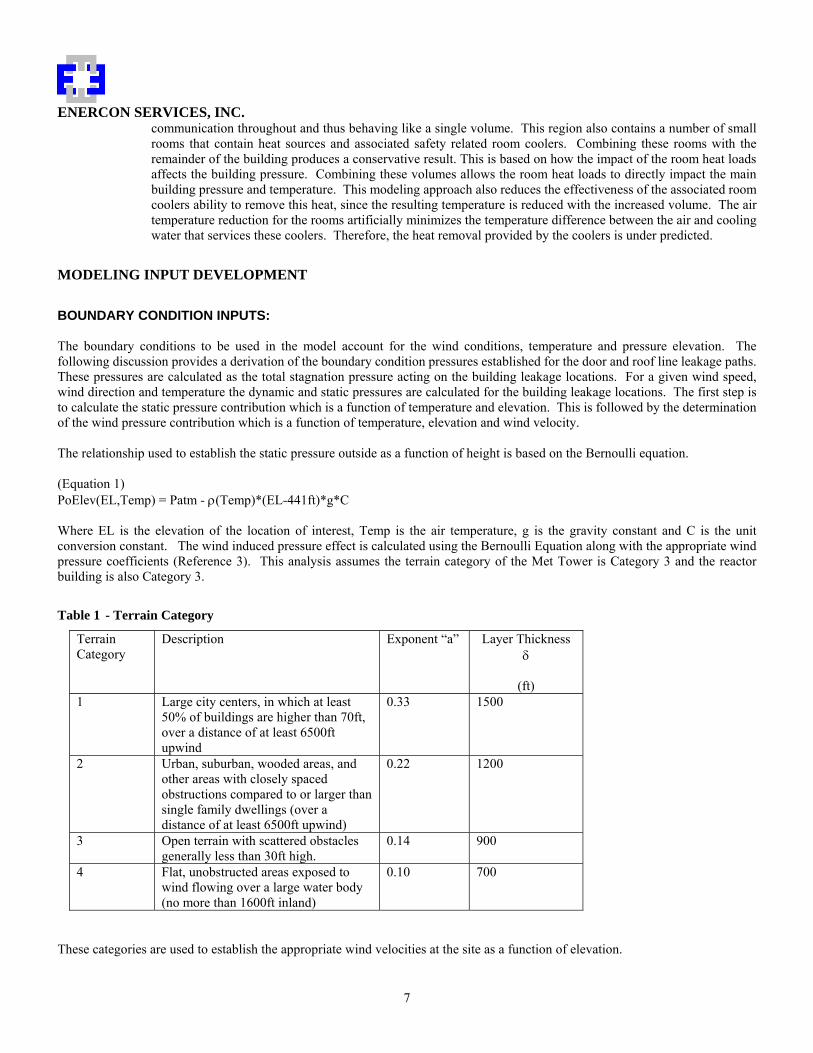
Table 1 - Terrain Category
Terrain Category
Description Exponent “a” Layer Thickness δ
(ft) 1 Large city centers, in which at least
50% of buildings are higher than 70ft, over a distance of at least 6500ft upwind
0.33 1500
2 Urban, suburban, wooded areas, and other areas with closely spaced obstructions compared to or larger than single family dwellings (over a distance of at least 6500ft upwind)
0.22 1200
3 Open terrain with scattered obstacles generally less than 30ft high.
0.14 900
4 Flat, unobstructed areas exposed to wind flowing over a large water body (no more than 1600ft inland)
0.10 700
These categories are used to establish the appropriate wind velocities at the site as a function of elevation.
ENERCON SERVICES, INC.
8
psiin
gbuildmetVuildetU 71.27
*2)(
*Cp Cp)Hbuild, Hmet, Temp, Pw(V,
2)(Equation 2
Η )Η ,Η ,,Β ,Μ(∗= ρ
Where V is the wind velocity in miles per hour, Temp is the outside air temperature (oF), Hmet is the met tower height (ft) where the wind speed is measured, Hbuild is the height (ft) were the pressure effect is calculated, Cp is the wind pressure coefficient, Press and Temp are the pressure and temperature used to establish the air density. UH is a function used to convert the measured wind velocity to wind velocity at the point of interest, such as the door or roof line. Equation 3 provides specifics of the function. Met = 3 and Build = 3 are the Terrain categories (Reference 3).
3)(Equation 900
90014.014.0
⎟⎟⎠
⎞⎜⎜⎝
⎛⎟⎠⎞
⎜⎝⎛=
ftHBuild
HMetftVV METWIND
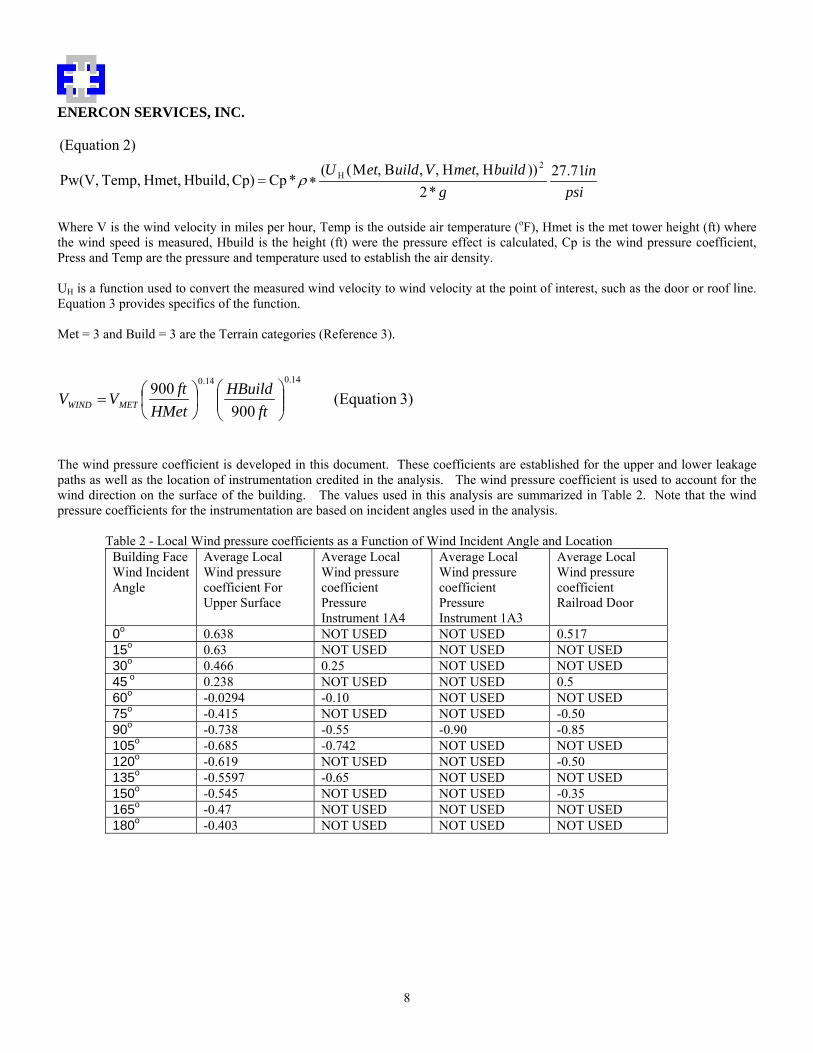
The wind pressure coefficient is developed in this document. These coefficients are established for the upper and lower leakage paths as well as the location of instrumentation credited in the analysis. The wind pressure coefficient is used to account for the wind direction on the surface of the building. The values used in this analysis are summarized in Table 2. Note that the wind pressure coefficients for the instrumentation are based on incident angles used in the analysis.
Table 2 - Local Wind pressure coefficients as a Function of Wind Incident Angle and Location Building Face Wind Incident Angle
Average Local Wind pressure coefficient For Upper Surface
Average Local Wind pressure coefficient Pressure Instrument 1A4
Average Local Wind pressure coefficient Pressure Instrument 1A3
Average Local Wind pressure coefficient Railroad Door
0o 0.638 NOT USED NOT USED 0.517 15o 0.63 NOT USED NOT USED NOT USED 30o 0.466 0.25 NOT USED NOT USED 45 o 0.238 NOT USED NOT USED 0.5 60o -0.0294 -0.10 NOT USED NOT USED 75o -0.415 NOT USED NOT USED -0.50 90o -0.738 -0.55 -0.90 -0.85 105o -0.685 -0.742 NOT USED NOT USED 120o -0.619 NOT USED NOT USED -0.50 135o -0.5597 -0.65 NOT USED NOT USED 150o -0.545 NOT USED NOT USED -0.35 165o -0.47 NOT USED NOT USED NOT USED 180o -0.403 NOT USED NOT USED NOT USED
ENERCON SERVICES, INC.
9
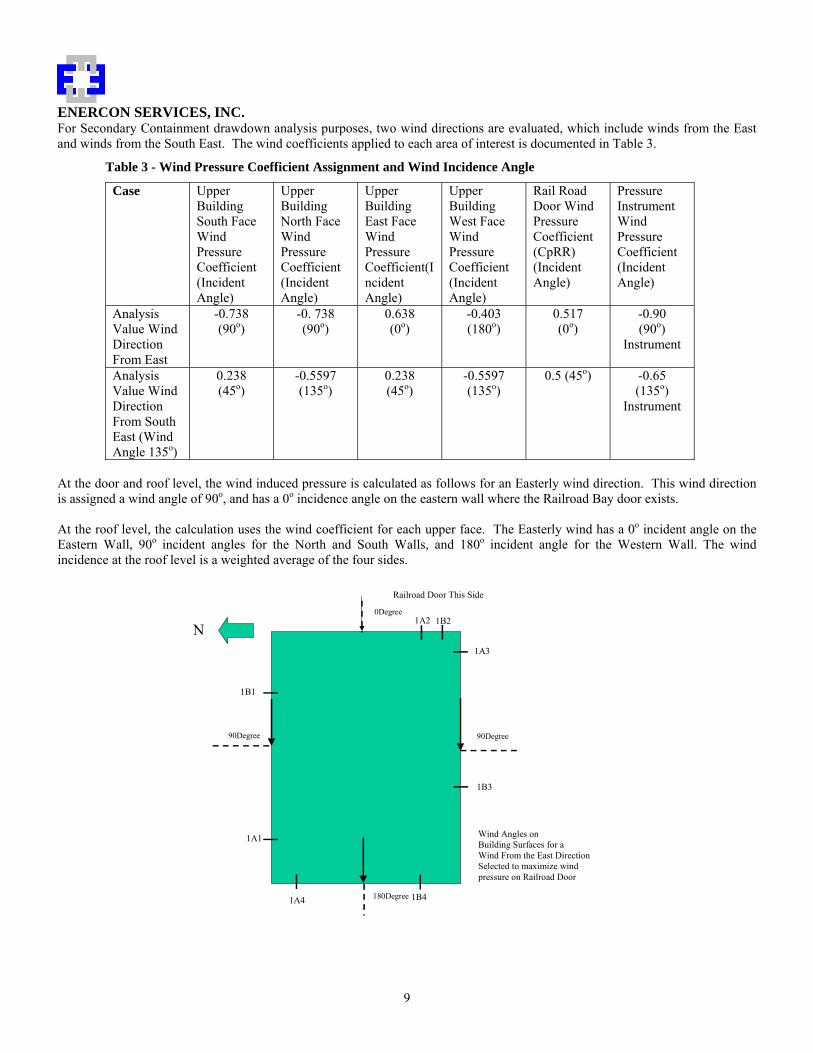
For Secondary Containment drawdown analysis purposes, two wind directions are evaluated, which include winds from the East and winds from the South East. The wind coefficients applied to each area of interest is documented in Table 3.
Table 3 - Wind Pressure Coefficient Assignment and Wind Incidence Angle
Case Upper Building South Face Wind Pressure Coefficient (Incident Angle)
Upper Building North Face Wind Pressure Coefficient (Incident Angle)
Upper Building East Face Wind Pressure Coefficient(Incident Angle)
Upper Building West Face Wind Pressure Coefficient (Incident Angle)
Rail Road Door Wind Pressure Coefficient (CpRR) (Incident Angle)
Pressure Instrument Wind Pressure Coefficient (Incident Angle)
Analysis Value Wind Direction From East
-0.738 (90o)
-0. 738 (90o)
0.638 (0o)
-0.403 (180o)
0.517 (0o)
-0.90 (90o)
Instrument
Analysis Value Wind Direction From South East (Wind Angle 135o)
0.238 (45o)
-0.5597 (135o)
0.238 (45o)
-0.5597 (135o)
0.5 (45o) -0.65 (135o)
Instrument
At the door and roof level, the wind induced pressure is calculated as follows for an Easterly wind direction. This wind direction is assigned a wind angle of 90o, and has a 0o incidence angle on the eastern wall where the Railroad Bay door exists. At the roof level, the calculation uses the wind coefficient for each upper face. The Easterly wind has a 0o incident angle on the Eastern Wall, 90o incident angles for the North and South Walls, and 180o incident angle for the Western Wall. The wind incidence at the roof level is a weighted average of the four sides.
1A3
1A2
1A1
1A4
1B2
1B3
1B4
1B1
N
90Degree
180Degree
0Degree
90Degree
Wind Angles onBuilding Surfaces for aWind From the East DirectionSelected to maximize windpressure on Railroad Door
Railroad Door This Side
ENERCON SERVICES, INC.
10
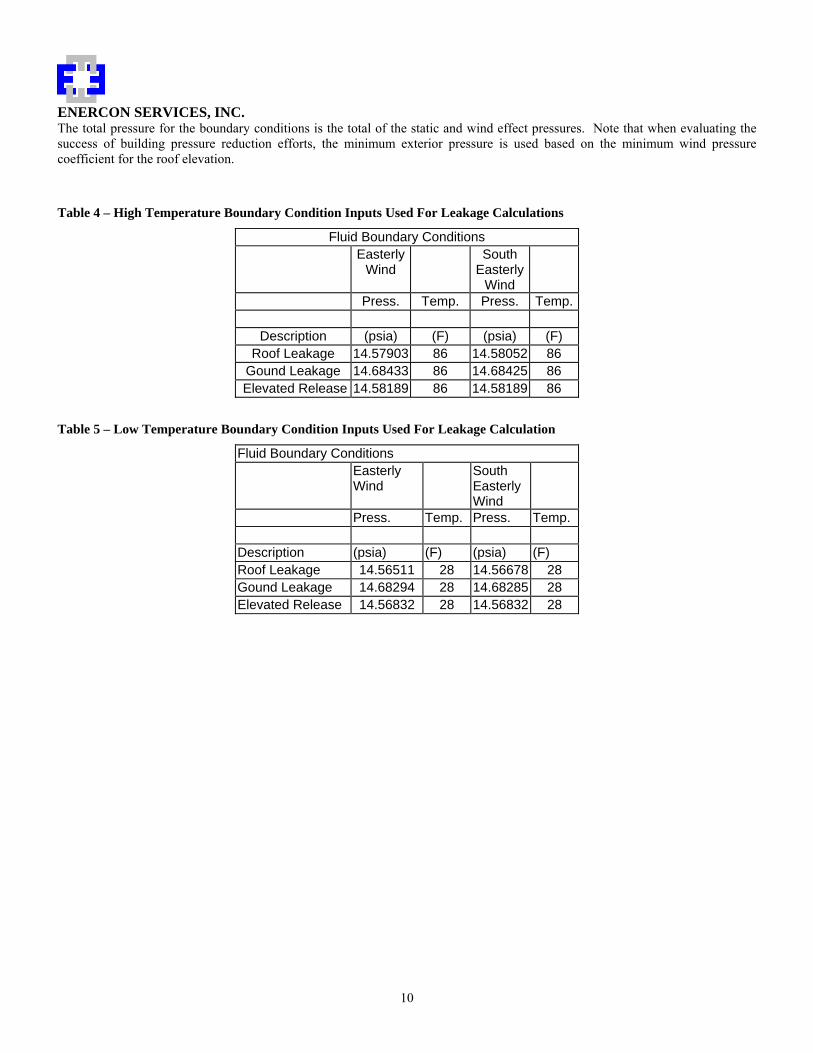
The total pressure for the boundary conditions is the total of the static and wind effect pressures. Note that when evaluating the success of building pressure reduction efforts, the minimum exterior pressure is used based on the minimum wind pressure coefficient for the roof elevation.
Table 4 – High Temperature Boundary Condition Inputs Used For Leakage Calculations
Fluid Boundary Conditions Easterly
Wind South
Easterly Wind
Press. Temp. Press. Temp.
Description (psia) (F) (psia) (F) Roof Leakage 14.57903 86 14.58052 86
Gound Leakage 14.68433 86 14.68425 86 Elevated Release 14.58189 86 14.58189 86
Table 5 – Low Temperature Boundary Condition Inputs Used For Leakage Calculation
Fluid Boundary Conditions Easterly Wind
South Easterly Wind
Press. Temp. Press. Temp. Description (psia) (F) (psia) (F) Roof Leakage 14.56511 28 14.56678 28 Gound Leakage 14.68294 28 14.68285 28 Elevated Release 14.56832 28 14.56832 28
ENERCON SERVICES, INC.
11
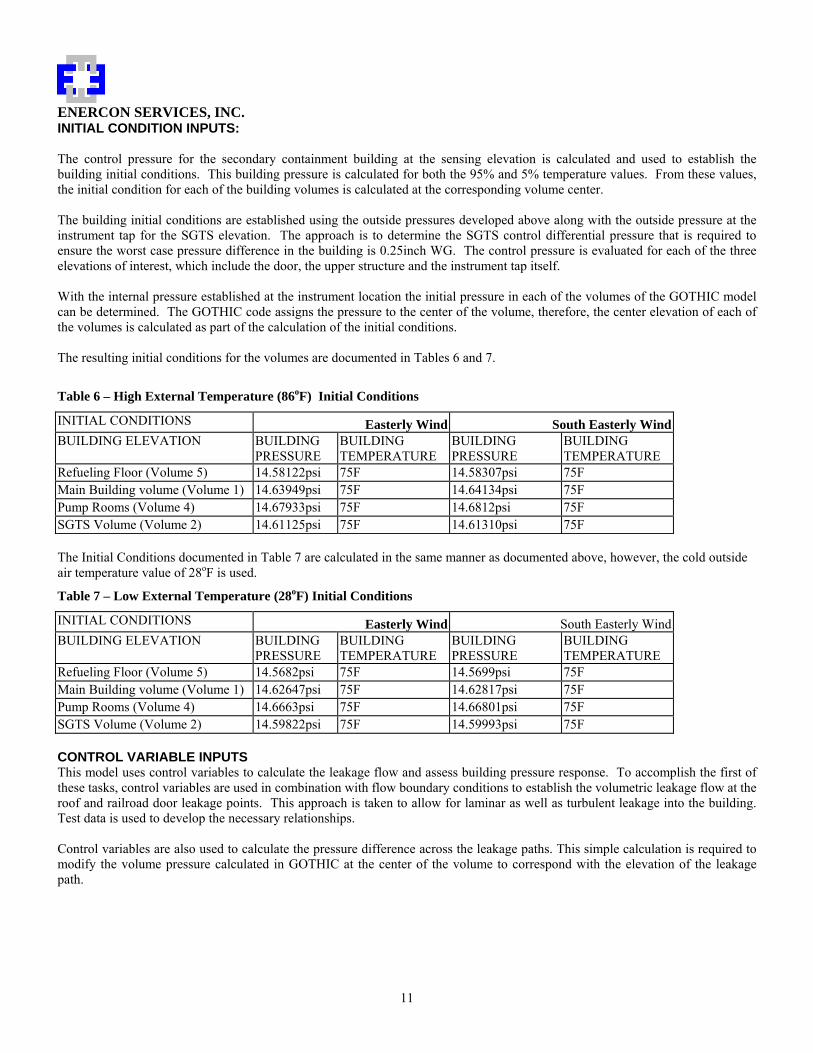
INITIAL CONDITION INPUTS: The control pressure for the secondary containment building at the sensing elevation is calculated and used to establish the building initial conditions. This building pressure is calculated for both the 95% and 5% temperature values. From these values, the initial condition for each of the building volumes is calculated at the corresponding volume center. The building initial conditions are established using the outside pressures developed above along with the outside pressure at the instrument tap for the SGTS elevation. The approach is to determine the SGTS control differential pressure that is required to ensure the worst case pressure difference in the building is 0.25inch WG. The control pressure is evaluated for each of the three elevations of interest, which include the door, the upper structure and the instrument tap itself. With the internal pressure established at the instrument location the initial pressure in each of the volumes of the GOTHIC model can be determined. The GOTHIC code assigns the pressure to the center of the volume, therefore, the center elevation of each of the volumes is calculated as part of the calculation of the initial conditions. The resulting initial conditions for the volumes are documented in Tables 6 and 7.
Table 6 – High External Temperature (86oF) Initial Conditions
INITIAL CONDITIONS Easterly Wind South Easterly WindBUILDING ELEVATION BUILDING
PRESSURE BUILDING TEMPERATURE
BUILDING PRESSURE
BUILDING TEMPERATURE
Refueling Floor (Volume 5) 14.58122psi 75F 14.58307psi 75F Main Building volume (Volume 1) 14.63949psi 75F 14.64134psi 75F Pump Rooms (Volume 4) 14.67933psi 75F 14.6812psi 75F SGTS Volume (Volume 2) 14.61125psi 75F 14.61310psi 75F The Initial Conditions documented in Table 7 are calculated in the same manner as documented above, however, the cold outside air temperature value of 28oF is used.
Table 7 – Low External Temperature (28oF) Initial Conditions
INITIAL CONDITIONS Easterly Wind South Easterly WindBUILDING ELEVATION BUILDING
PRESSURE BUILDING TEMPERATURE
BUILDING PRESSURE
BUILDING TEMPERATURE
Refueling Floor (Volume 5) 14.5682psi 75F 14.5699psi 75F Main Building volume (Volume 1) 14.62647psi 75F 14.62817psi 75F Pump Rooms (Volume 4) 14.6663psi 75F 14.66801psi 75F SGTS Volume (Volume 2) 14.59822psi 75F 14.59993psi 75F CONTROL VARIABLE INPUTS This model uses control variables to calculate the leakage flow and assess building pressure response. To accomplish the first of these tasks, control variables are used in combination with flow boundary conditions to establish the volumetric leakage flow at the roof and railroad door leakage points. This approach is taken to allow for laminar as well as turbulent leakage into the building. Test data is used to develop the necessary relationships. Control variables are also used to calculate the pressure difference across the leakage paths. This simple calculation is required to modify the volume pressure calculated in GOTHIC at the center of the volume to correspond with the elevation of the leakage path.
ENERCON SERVICES, INC.
12
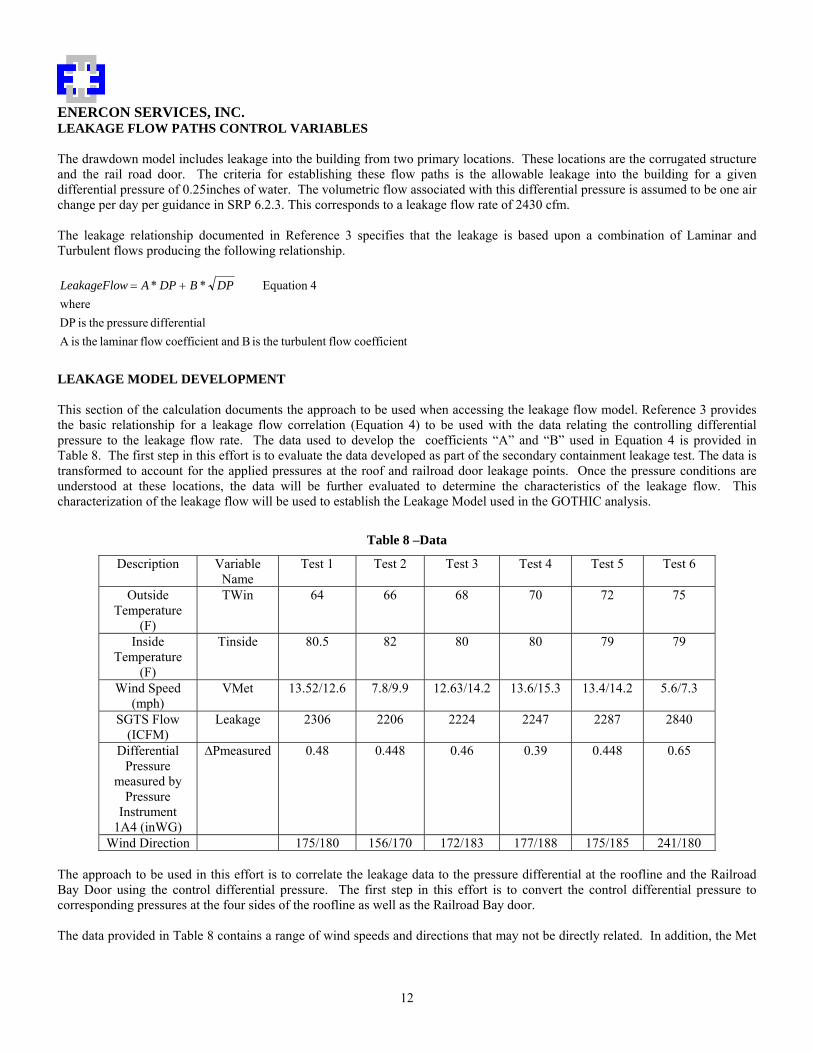
LEAKAGE FLOW PATHS CONTROL VARIABLES The drawdown model includes leakage into the building from two primary locations. These locations are the corrugated structure and the rail road door. The criteria for establishing these flow paths is the allowable leakage into the building for a given differential pressure of 0.25inches of water. The volumetric flow associated with this differential pressure is assumed to be one air change per day per guidance in SRP 6.2.3. This corresponds to a leakage flow rate of 2430 cfm. The leakage relationship documented in Reference 3 specifies that the leakage is based upon a combination of Laminar and Turbulent flows producing the following relationship.
tcoefficien flow turbulent theis B andt coefficien flowlaminar theisA aldifferenti pressure theis DP
where 4Equation ** DPBDPAwLeakageFlo +=
LEAKAGE MODEL DEVELOPMENT This section of the calculation documents the approach to be used when accessing the leakage flow model. Reference 3 provides the basic relationship for a leakage flow correlation (Equation 4) to be used with the data relating the controlling differential pressure to the leakage flow rate. The data used to develop the coefficients “A” and “B” used in Equation 4 is provided in Table 8. The first step in this effort is to evaluate the data developed as part of the secondary containment leakage test. The data is transformed to account for the applied pressures at the roof and railroad door leakage points. Once the pressure conditions are understood at these locations, the data will be further evaluated to determine the characteristics of the leakage flow. This characterization of the leakage flow will be used to establish the Leakage Model used in the GOTHIC analysis.
Table 8 –Data
Description Variable Name
Test 1 Test 2 Test 3 Test 4 Test 5 Test 6
Outside Temperature
(F)
TWin 64 66 68 70 72 75
Inside Temperature
(F)
Tinside 80.5 82 80 80 79 79
Wind Speed (mph)
VMet 13.52/12.6 7.8/9.9 12.63/14.2 13.6/15.3 13.4/14.2 5.6/7.3
SGTS Flow (ICFM)
Leakage 2306 2206 2224 2247 2287 2840
Differential Pressure
measured by Pressure
Instrument 1A4 (inWG)
∆Pmeasured 0.48 0.448 0.46 0.39 0.448 0.65
Wind Direction 175/180 156/170 172/183 177/188 175/185 241/180 The approach to be used in this effort is to correlate the leakage data to the pressure differential at the roofline and the Railroad Bay Door using the control differential pressure. The first step in this effort is to convert the control differential pressure to corresponding pressures at the four sides of the roofline as well as the Railroad Bay door. The data provided in Table 8 contains a range of wind speeds and directions that may not be directly related. In addition, the Met
ENERCON SERVICES, INC.
13
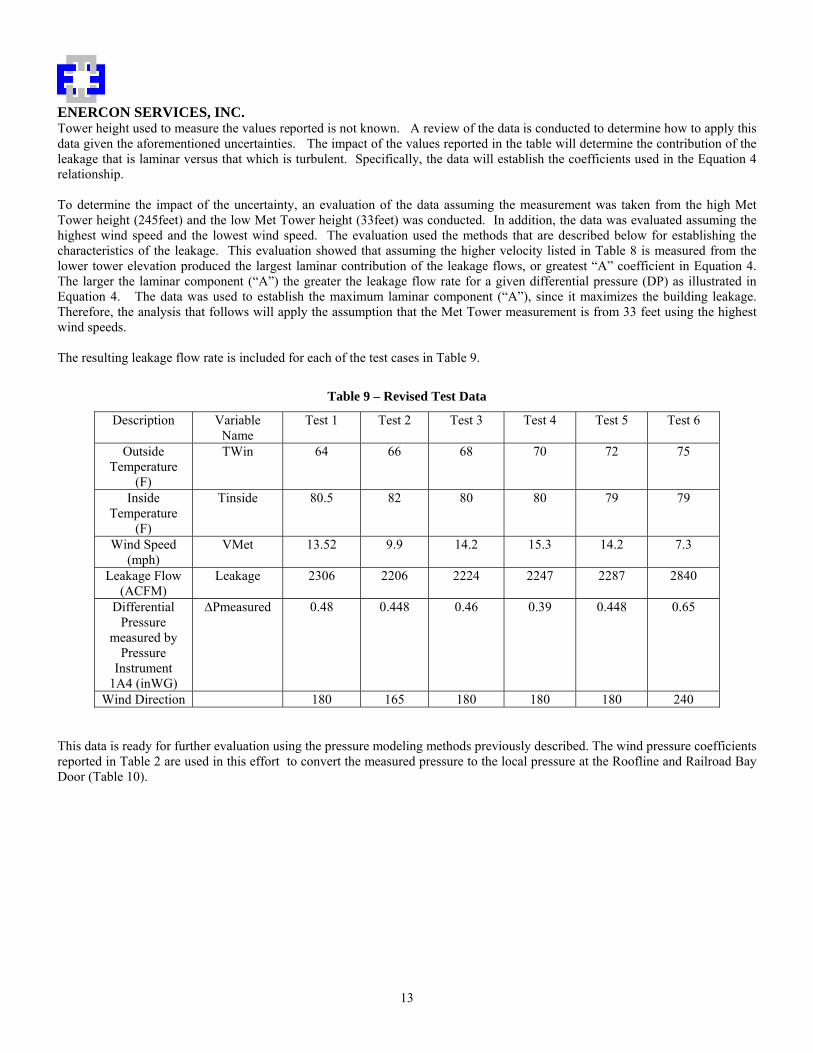
Tower height used to measure the values reported is not known. A review of the data is conducted to determine how to apply this data given the aforementioned uncertainties. The impact of the values reported in the table will determine the contribution of the leakage that is laminar versus that which is turbulent. Specifically, the data will establish the coefficients used in the Equation 4 relationship. To determine the impact of the uncertainty, an evaluation of the data assuming the measurement was taken from the high Met Tower height (245feet) and the low Met Tower height (33feet) was conducted. In addition, the data was evaluated assuming the highest wind speed and the lowest wind speed. The evaluation used the methods that are described below for establishing the characteristics of the leakage. This evaluation showed that assuming the higher velocity listed in Table 8 is measured from the lower tower elevation produced the largest laminar contribution of the leakage flows, or greatest “A” coefficient in Equation 4. The larger the laminar component (“A”) the greater the leakage flow rate for a given differential pressure (DP) as illustrated in Equation 4. The data was used to establish the maximum laminar component (“A”), since it maximizes the building leakage. Therefore, the analysis that follows will apply the assumption that the Met Tower measurement is from 33 feet using the highest wind speeds. The resulting leakage flow rate is included for each of the test cases in Table 9.
Table 9 – Revised Test Data
Description Variable Name
Test 1 Test 2 Test 3 Test 4 Test 5 Test 6
Outside Temperature
(F)
TWin 64 66 68 70 72 75
Inside Temperature
(F)
Tinside 80.5 82 80 80 79 79
Wind Speed (mph)
VMet 13.52 9.9 14.2 15.3 14.2 7.3
Leakage Flow (ACFM)
Leakage 2306 2206 2224 2247 2287 2840
Differential Pressure
measured by Pressure
Instrument 1A4 (inWG)
∆Pmeasured 0.48 0.448 0.46 0.39 0.448 0.65
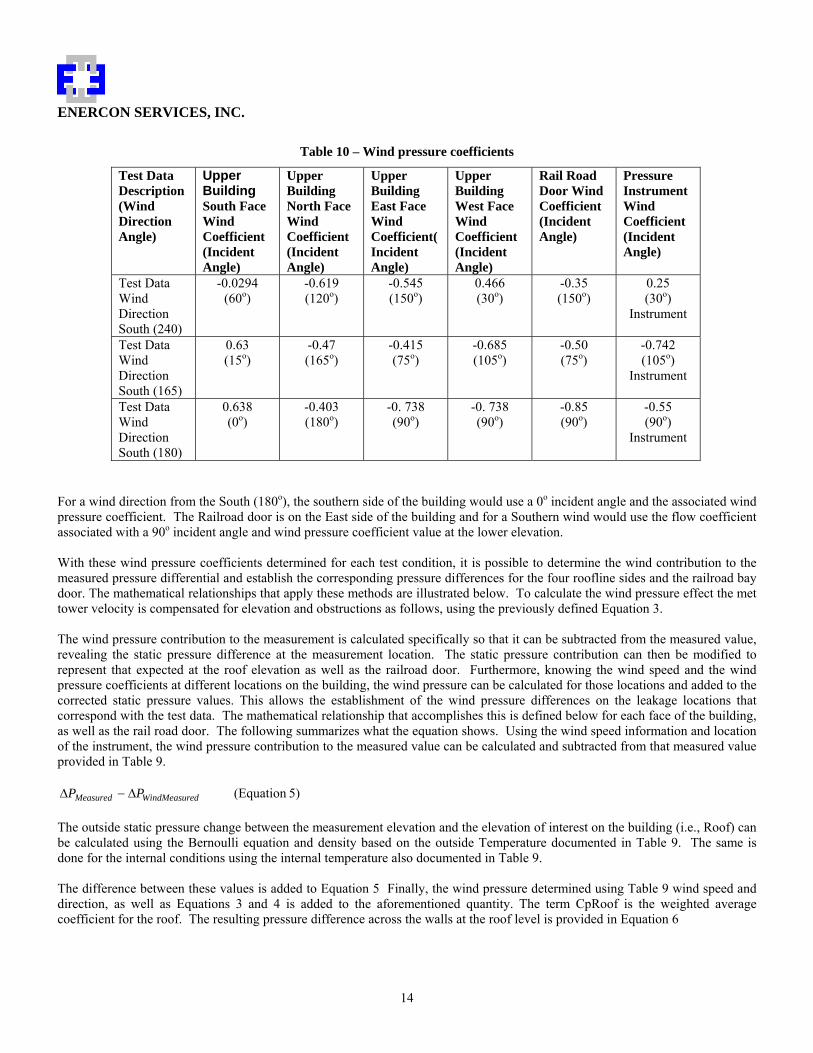
Wind Direction 180 165 180 180 180 240 This data is ready for further evaluation using the pressure modeling methods previously described. The wind pressure coefficients reported in Table 2 are used in this effort to convert the measured pressure to the local pressure at the Roofline and Railroad Bay Door (Table 10).
ENERCON SERVICES, INC.
14
Table 10 – Wind pressure coefficients
Test Data Description (Wind Direction Angle)
Upper Building South Face Wind Coefficient (Incident Angle)
Upper Building North Face Wind Coefficient (Incident Angle)
Upper Building East Face Wind Coefficient(Incident Angle)
Upper Building West Face Wind Coefficient (Incident Angle)
Rail Road Door Wind Coefficient (Incident Angle)
Pressure Instrument Wind Coefficient (Incident Angle)
Test Data Wind Direction South (240)
-0.0294 (60o)
-0.619 (120o)
-0.545 (150o)
0.466 (30o)
-0.35 (150o)
0.25 (30o)
Instrument
Test Data Wind Direction South (165)
0.63 (15o)
-0.47 (165o)
-0.415 (75o)
-0.685 (105o)
-0.50 (75o)
-0.742 (105o)
Instrument
Test Data Wind Direction South (180)
0.638 (0o)
-0.403 (180o)
-0. 738 (90o)
-0. 738 (90o)
-0.85 (90o)
-0.55 (90o)
Instrument
For a wind direction from the South (180o), the southern side of the building would use a 0o incident angle and the associated wind pressure coefficient. The Railroad door is on the East side of the building and for a Southern wind would use the flow coefficient associated with a 90o incident angle and wind pressure coefficient value at the lower elevation. With these wind pressure coefficients determined for each test condition, it is possible to determine the wind contribution to the measured pressure differential and establish the corresponding pressure differences for the four roofline sides and the railroad bay door. The mathematical relationships that apply these methods are illustrated below. To calculate the wind pressure effect the met tower velocity is compensated for elevation and obstructions as follows, using the previously defined Equation 3. The wind pressure contribution to the measurement is calculated specifically so that it can be subtracted from the measured value, revealing the static pressure difference at the measurement location. The static pressure contribution can then be modified to represent that expected at the roof elevation as well as the railroad door. Furthermore, knowing the wind speed and the wind pressure coefficients at different locations on the building, the wind pressure can be calculated for those locations and added to the corrected static pressure values. This allows the establishment of the wind pressure differences on the leakage locations that correspond with the test data. The mathematical relationship that accomplishes this is defined below for each face of the building, as well as the rail road door. The following summarizes what the equation shows. Using the wind speed information and location of the instrument, the wind pressure contribution to the measured value can be calculated and subtracted from that measured value provided in Table 9.
5)(Equation edWindMeasurMeasured PP ∆−∆ The outside static pressure change between the measurement elevation and the elevation of interest on the building (i.e., Roof) can be calculated using the Bernoulli equation and density based on the outside Temperature documented in Table 9. The same is done for the internal conditions using the internal temperature also documented in Table 9. The difference between these values is added to Equation 5 Finally, the wind pressure determined using Table 9 wind speed and direction, as well as Equations 3 and 4 is added to the aforementioned quantity. The term CpRoof is the weighted average coefficient for the roof. The resulting pressure difference across the walls at the roof level is provided in Equation 6

ENERCON SERVICES, INC.
15
EQUATION 6
∆P Roofi∆P Measured i
∆P WindMeasured i−
ρ gas Patm TWini, "air",( ) ρ gas Patm TInsidei, "air",( )−( ) g HBuildMid HBuildUp−( )⋅[ ]⋅27.71 in⋅
psi⋅+
...
Pw VWini TWini, HmetLow, HBuildUp, CpRoofi,( )+
...
⎡⎢⎢⎢⎢⎣
⎤⎥⎥⎥⎥⎦
:=
The resulting pressure difference across the rail road bay door is provided in Equation 7 EQUATION 7 ∆P RRDoori
∆P Measured i∆P WindMeasured i
−
ρ gas Patm TWini, "air",( ) ρ gas Patm TInsidei, "air",( )−( ) g⋅ HBuildMid HBuildL−( )⋅27.71in
psi⋅+
...
Pw VWini TWini, HmetLow, HBuildL, CpRRDoori,( )+
...
⎡⎢⎢⎢⎢⎣
⎤⎥⎥⎥⎥⎦
:=
ENERCON SERVICES, INC.
16
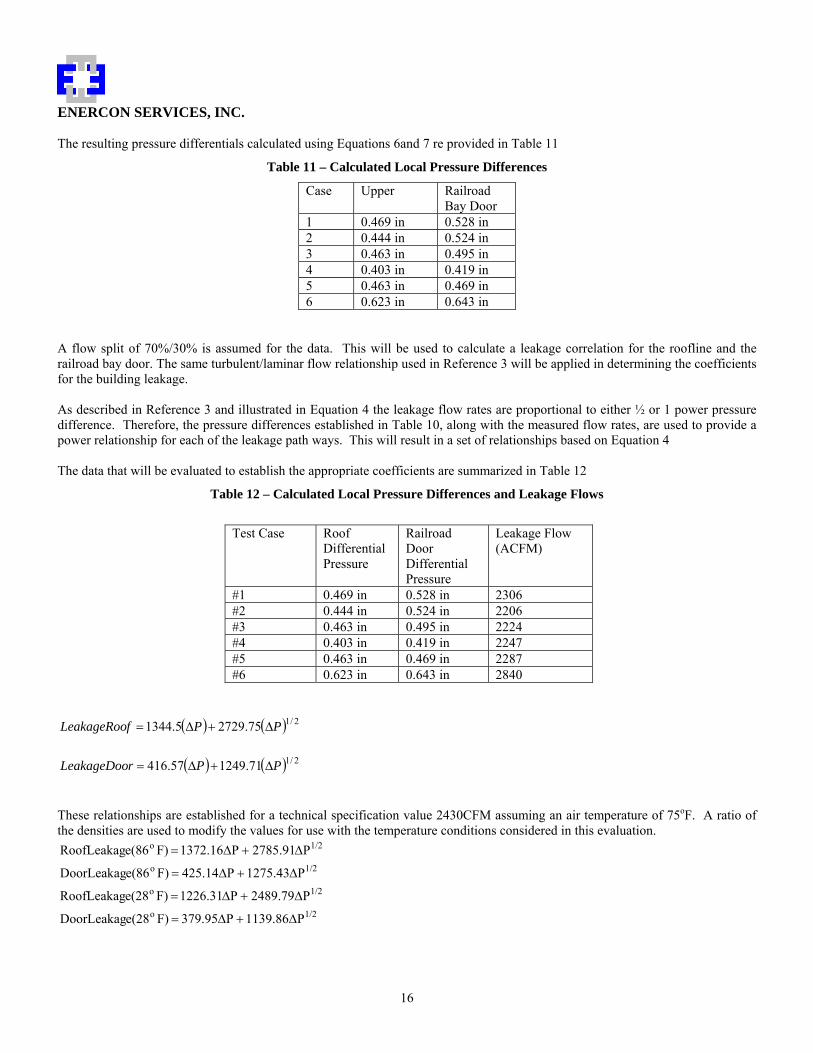
The resulting pressure differentials calculated using Equations 6and 7 re provided in Table 11
Table 11 – Calculated Local Pressure Differences
Case Upper Railroad Bay Door
1 0.469 in 0.528 in 2 0.444 in 0.524 in 3 0.463 in 0.495 in 4 0.403 in 0.419 in 5 0.463 in 0.469 in 6 0.623 in 0.643 in
A flow split of 70%/30% is assumed for the data. This will be used to calculate a leakage correlation for the roofline and the railroad bay door. The same turbulent/laminar flow relationship used in Reference 3 will be applied in determining the coefficients for the building leakage. As described in Reference 3 and illustrated in Equation 4 the leakage flow rates are proportional to either ½ or 1 power pressure difference. Therefore, the pressure differences established in Table 10, along with the measured flow rates, are used to provide a power relationship for each of the leakage path ways. This will result in a set of relationships based on Equation 4 The data that will be evaluated to establish the appropriate coefficients are summarized in Table 12
Table 12 – Calculated Local Pressure Differences and Leakage Flows
Test Case Roof
Differential Pressure
Railroad Door Differential Pressure
Leakage Flow (ACFM)
#1 0.469 in 0.528 in 2306 #2 0.444 in 0.524 in 2206 #3 0.463 in 0.495 in 2224 #4 0.403 in 0.419 in 2247 #5 0.463 in 0.469 in 2287 #6 0.623 in 0.643 in 2840
( ) ( ) 2/175.27295.1344 PPfLeakageRoo ∆+∆=
( ) ( ) 2/11249.7157.416 PPrLeakageDoo ∆+∆= These relationships are established for a technical specification value 2430CFM assuming an air temperature of 75oF. A ratio of the densities are used to modify the values for use with the temperature conditions considered in this evaluation.
1/2o
1/2o
1/2o
1/2o
P1139.86P379.95F)e(28DoorLeakag
P2489.79P1226.31F)e(28RoofLeakag
P1275.43P425.14F)e(86DoorLeakag
P2785.91P1372.16F)e(86RoofLeakag
∆+∆=
∆+∆=
∆+∆=
∆+∆=

ENERCON SERVICES, INC.
17
PRESSURE CRITERIA INPUTS CONTROL VARIABLES The successful depressurization of the secondary containment reactor building is determined by evaluating the pressure at the leakage locations. The leakage locations are at the roof and railroad door elevations. These two extremes in the building elevation provide a bounding look at the pressure difference across the building walls. Two internal pressure values are calculated in this manner one at the roof level and one at the railroad door. These pressures are then compared with the minimum pressures acting on the leakage path. For the railroad door, the minimum pressure is the same as the boundary condition pressure since the pressure is on one side of the building only. For the roof, the minimum side pressure is used as opposed to the weighted pressure used in the boundary condition. The minimum pressures are calculated in Appendix 1 for the roof elevation. FLOW PATH INPUT: Flow paths are used in the GOTHIC model to provide hydraulic connections between volumes and boundary conditions. The upper leakage flow path is associated with the refueling floor, while the lower leakage flow path is associated with the main reactor building volume. These flow path areas and hydraulic diameters are simply calculated to be based upon the anticipated flow with a 0.25inWG pressure difference. VOLUME INPUT: The purpose of this section is to document the basis for the volume inputs developed for the drawdown analysis. The model is composed of three volumes. These volumes represent the refueling floor with its refuel pool, the pump rooms and the remainder of the reactor building. The Pump Room Volume is simply the summation of the Pump Room Volumes located on the lowest building elevation. The main building volume is the sum of the Reactor Building Volumes minus the Pump Room Volume and the refueling floor volume. The total Refueling Floor Volume includes the Spent Fuel Pool normal water volume. This water is assumed to be present in this calculation to allow the modeling of the fuel pool heat input response.
ENERCON SERVICES, INC.
18
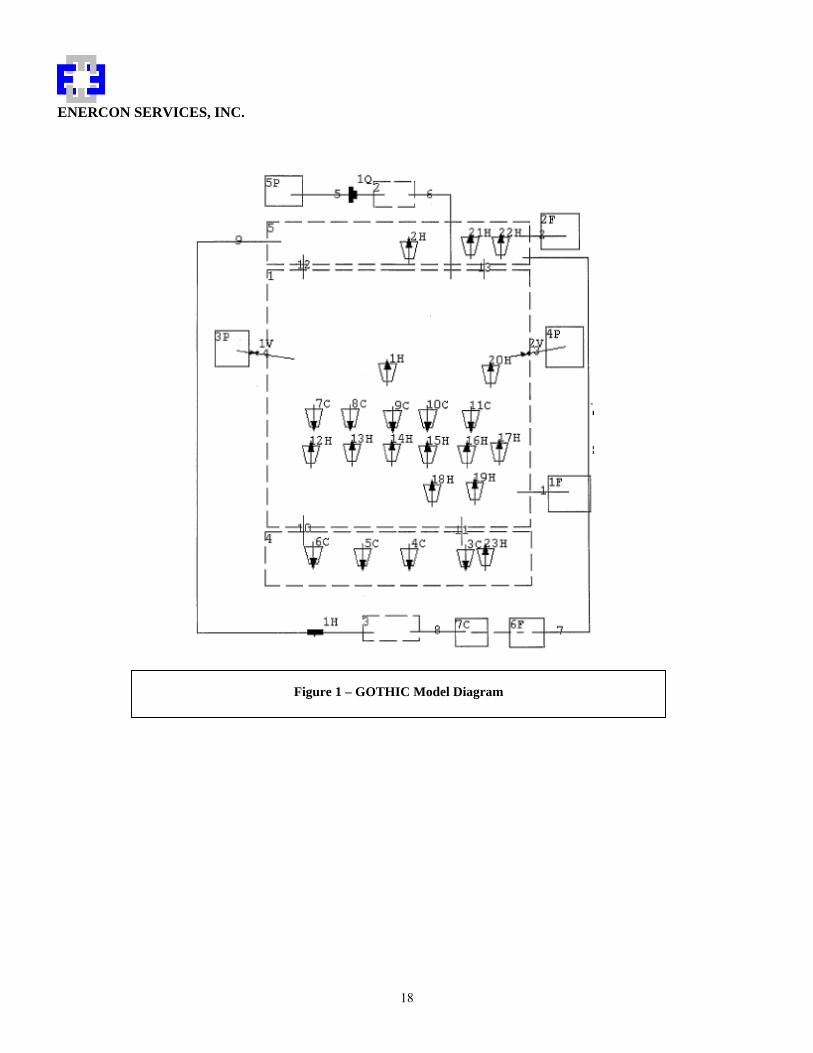
Figure 1 – GOTHIC Model Diagram
ENERCON SERVICES, INC.
19
)
THERMAL CONDUCTOR INPUT: This section documents the basis for the basic heat conductor inputs to be used in the GOTHIC drawdown model. The inputs are developed for the three node model. The three nodes represent the pump rooms, refueling floor and the remainder of the reactor building. The walls are in general concrete and the pipes are carbon steel. PUMP ROOM THERMAL CONDUCTORS The pump rooms contain thermal conductors that have a heated surface (Primary Containment), have an adiabatic surface, communicate with the main reactor building volume and have both surfaces internal to the volume. The conductors that have a heated surface are associated with operational ECCS pipes as well as primary containment walls. These heat structures will be assigned a boundary condition that is a time dependent temperature value that matches the wetwell response to the LOCA conditions. Those conductors within the pump room that are assigned an adiabatic boundary condition are associated with walls and floors that communicate to conditions outside of the reactor building. The thermal conductors that communicate with the main reactor building volume are the pump room ceilings. The conductors that contain both sides within the pump room volume are the walls that adjoin the pump rooms. PIPING HEAT STRUCTURES To establish heat structures that represent the piping system it is necessary to divide these system into those associated with Fuel Pool Cooling and ECCS. The next step is to further sub divided them into insulated and not insulated. The final step is to group the piping by wall thickness. Piping within each group is combined into a heat conductor by calculating an average diameter and thickness that is representative of the total surface area of the group. This approach provides an equivalent heat sink to represent each piping group minimizing the number of heat structures required by the model.
( )(
( )( )( )
( )∑∑
∑∑
=
=
AreaDiaArea
AvgDia
AreaThicknessArea
ssAvgThickne
PUMP ROOM WALLS AND CEILINGS Similar to the piping system assessment described above, the Pump Room has criteria used to establish thermal conductors associated with walls and ceilings. The walls and ceilings are grouped by thickness. Pump Room conductors within each group are combined into thermal conductors by calculating an average thickness that is representative of the total area of the group. This approach provides an equivalent heat sink to represent each Pump Room conductor group minimizing the number of thermal conductors required by the GOTHIC model.
ENERCON SERVICES, INC.
20
)( )(( )∑
∑=AreaThicknessArea
ssAvgThickne
MAIN REACTOR BUILDING THERMAL CONDUCTORS The main reactor building has thermal conductors that have a heated surface (Primary Containment – Drywell above 501’, wetwell below 501’), have an adiabatic surface, communicate with the pump room and refueling floor volumes, and have both surfaces internal to the volume. The conductors that have a heated surface are associated with primary containment walls. These heat structures will be assigned a boundary condition that is a time dependent temperature value that matches the drywell and wetwell response to the LOCA conditions. Those conductors within the main reactor building volume that are assigned an adiabatic boundary condition are associated with walls that communicate to conditions outside of the reactor building. The thermal conductors that communicate with the pump rooms and refueling floor are the pump room ceilings and the refueling floor. The conductors that contain both sides within the main reactor building volume are the walls that adjoin the internal rooms. Main building conductors within each group are combined into a thermal conductors by calculating an average thickness that is representative of the total area of the group. This approach provides an equivalent heat sink to represent each main building conductor group minimizing the number of thermal conductors required by the GOTHIC model.
( )(( )
)∑
∑=AreaThicknessArea
ssAvgThickne
REFUELING FLOOR THERMAL CONDUCTORS Similar to the main reactor building thermal conductors the refueling floor volume thermal conductors are combined. The walls and ceilings are grouped by thickness. THERMAL CONDUCTOR BOUNDARY TEMPERATURES PRIMARY CONTAINMENT DRYWELL CONDUCTOR INNER WALL TEMPERATURE The inner surface of conductors used to represent the primary containment are assigned a temperature that corresponds to the containment accident profile. A composite of the LOCA and MSLB are used. In addition, a conservative representation of the associated heat transfer coefficient will be used to ensure that the heat flow is biased into the structure from the containment atmosphere. The coefficient used is as follows. If the vapor temperature is greater than the wall temperature the value assigned is 1120BTU/hr/ft2/R. This value corresponds to 4 times the maximum UCHIDA heat transfer coefficient documented in Reference 1.10 (280BTU/hr-ft2-F). If the vapor temperature is less than or equal to the wall temperature than the value assigned is 0.1BTU/hr/ft2/R (Heat Transfer Coefficient Type 2 Refer to Table 38). This minimum value is considered to be a representative natural convection heat transfer coefficient that will minimize wall cooling to ensure a conservative result.

ENERCON SERVICES, INC.
21
PRIMARY CONTAINMENT WETWELL CONDUCTOR INNER WALL TEMPERATURE The inner surface of conductors used to represent the primary containment wetwell are assigned a temperature that corresponds to the wetwell pool accident LOCA profile. FUEL POOL CONDUCTOR INNER WALL TEMPERATURE The inner surface of conductors used to represent the fuel pool will be assigned a temperature that corresponds to the calculated fuel pool temperature. The GOTHIC model dynamically calculates this value. NATURAL CONVECTION RELATIONSHIPS Natural Convection Correlation’s used in the analysis and included in the EPRI sponsored GOTHIC code are as follows. Vertical Surface – Flat vertical surface used for internal walls
( ) ( )3125.0 13.0,59.0 RaRaMaxLkh =
Where k is the thermal conductivity of the fluid; L is the characteristic length of the heat sink; Ra is the dimensionless Rayleigh number. Face Up – Flat horizontal surface facing upward such as a floor When the surface is hotter than the surrounding fluid the following is used.
( ) ⎟⎠⎞⎜
⎝⎛= 3
125.0 14.0,54.0 RaRaMaxLkh
When the surface is cooler than the surrounding fluid the following is used.
( ) 25.027.0 RaLkh =
Where k is the thermal conductivity of the fluid; L is the characteristic length of the heat sink; Ra is the dimensionless Rayleigh number. Face Down – Flat horizontal surface facing downward such as a ceiling When the surface is cooler than the surrounding fluid the following is used.
( ) ⎟⎠⎞⎜
⎝⎛= 3
125.0 14.0,54.0 RaRaMaxLkh
When the surface is hotter than the surrounding fluid the following is used.

ENERCON SERVICES, INC.
22
( ) 25.027.0 RaLkh =
Where k is the thermal conductivity of the fluid; L is the characteristic length of the heat sink; Ra is the dimensionless Rayleigh number. Horizontal Cylinder – Horizontal Cylinder such as a pipe.
( ) ⎟⎠⎞⎜
⎝⎛= 3
125.0 126.0,53.0 RaRaMaxLkh
Where k is the thermal conductivity of the fluid; L is the characteristic length of the heat sink; Ra is the dimensionless Rayleigh number. Adiabatic Surface This boundary is assigned a zero heat flux. Radiation Heat Transfer Option The radiation heat transfer option which allows heat transfer between the thermal conductor surface and the air space will be applied to those conductors that represent a potential heat source to the reactor building. Included amongst these are the drywell wall, wetwell wall and the piping conductors.
ENERCON SERVICES, INC.
23
HEAT INPUTS AND FAN COOLER UNITS Direct heat loads are defined to be electrical heat loads that are assumed to be applied directly to the atmosphere without the need to evaluate any physics of heat transfer. The main building electrical equipment that is tripped off at the time of the LOOP will provide residual heat to the building. This heat load decays with time and is described by the Equation 15.
( )( )
volumebuildingreactor main theof perature vapor tem theistair hoursin timeelapsed theis T
Where
15028.266,5
))((28.266,5
50
314,263
15Equation
tairehrFBTUQ
FhrBTU
Fhr
BTUK
T
oo
−=
==
−
Table 13 – Summary of Direct Heat Input Loads
MODEL Volume Heat Load Value
(BTU/hr)
Heat Load Value
(BTU/s)
Time Starts
(seconds)
Time Ends
(seconds) Pump Room 880,089.8 244.5 30 Never Pump Room 43,487.51 12.08 When Associated
Fan Starts Never
Main Building 155,651.4 43.24 0 Never Main Building 39,434.55 10.95 When Associated
Fan Starts Never
Main Building 15,724.04 4.37 When Fuel Pool Cooling Starts
Never
Main Building Equipment Equation 15 Equation 15 0 NA Main Building Emergency Lighting
156,236.08 43.4 0 Never
Refueling Floor 78,479.26 21.8 0 Never Refueling Floor (Fuel Pool)
9,794,000.0 2,720.56 0 Never
It should be noted that the refueling floor fuel pool water heat load described in Table 13 is applied to the liquid in the fuel pool modeled in GOTHIC. Heat transfer from the pool to the rest of the building is accounted for by heat and mass transfer from the pool. All other heat loads listed in Table 13 apply the heat loads to the building volume atmospheres. Rooms within the reactor building are equipped with safety related fan cooler units. These units are cooled by Service Water and provide safety related cooling to those areas with equipment required to mitigate the consequences of an accident. The selection of a three volume model has a conservative impact on the performance of the fan coolers. These coolers are typically located within small compartments within the reactor building. Including these volumes within the main reactor building volume as opposed to providing their own volumes, produces an underestimate of the temperature these coolers will be working against. Assuming that the volume temperature is represented by the main portions of the reactor building will lead to a lower initial temperature (approximately 75oF) and produce overly conservative conditions in terms of the aforementioned room cooler performance. The reason that the performance is overly conservative results from the fact that the rooms where the heat sources

ENERCON SERVICES, INC.
24
and coolers are located would actually experience temperature increases that are greater than that reflected by the overall building temperature rise. This of course is the result of applying the heat inputs to a smaller volume as compared to the main portion of the reactor building. Further aggravating this situation is the assumption that the initial temperature of the area is significantly lower than that anticipated for the rooms, since the coolers would be removing heat from air that is greater than or equal to 104oF. Therefore, the coolers are virtually ineffective with the lower temperature assumption. The arguments provided are applicable to the pump rooms. In the interest of producing a conservative representation of these coolers the 75oF reactor building temperature is assigned to all three volumes included in the model.
ENERCON SERVICES, INC.
25
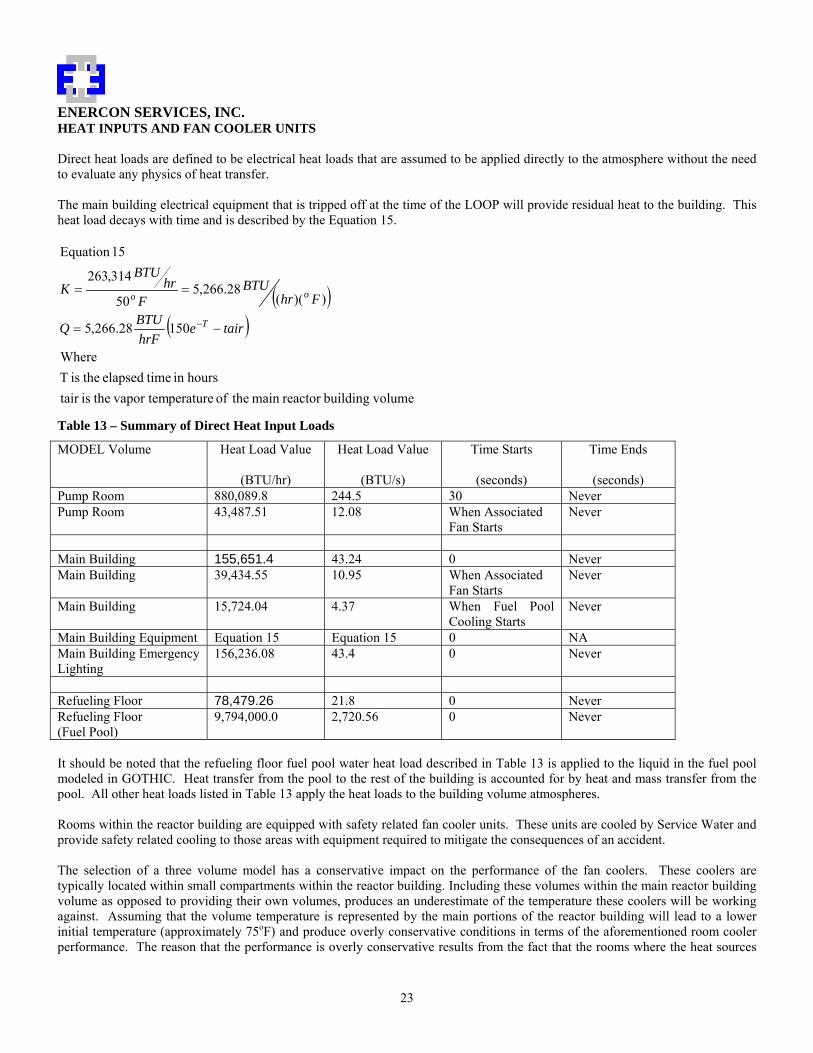
FUEL POOL HEAT EXCHANGER INPUTS The fuel pool heat exchanger will be explicitly modeled using the heat exchanger. The modeling approach is illustrated in Figure 2 where the GOTHIC heat exchanger component will be used to represent a single fuel pool heat exchanger.
Figure 2 – Fuel Pool Cooler Modeling Approach
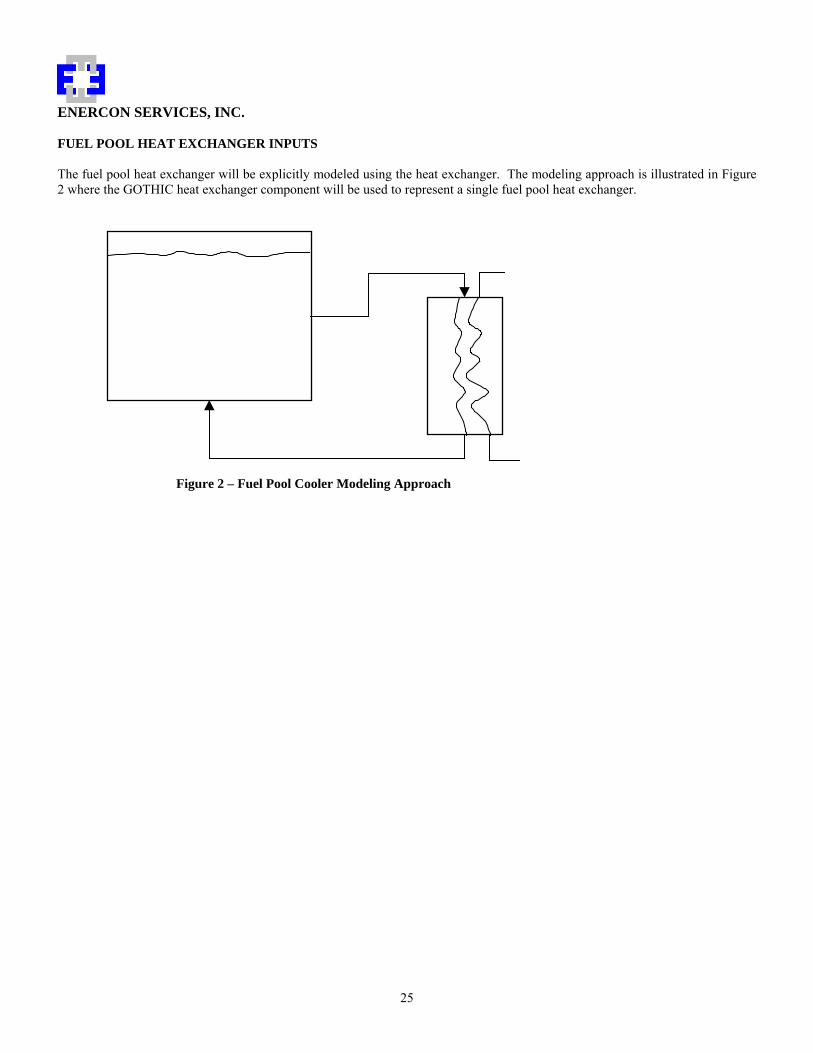
ENERCON SERVICES, INC.
SGTS FAN PERFORMANCE The fan component used to represent the SGTS is provided with the flow characteristics of the fan. SGTS Model Inputs The Standby Gas Treatment system will be modeled as a GOTHIC Volumetric Fan component with an inlet volume a discharge boundary condition and two flow paths (Figure 3).
Elevated Fan Inlet Fan RB Volume
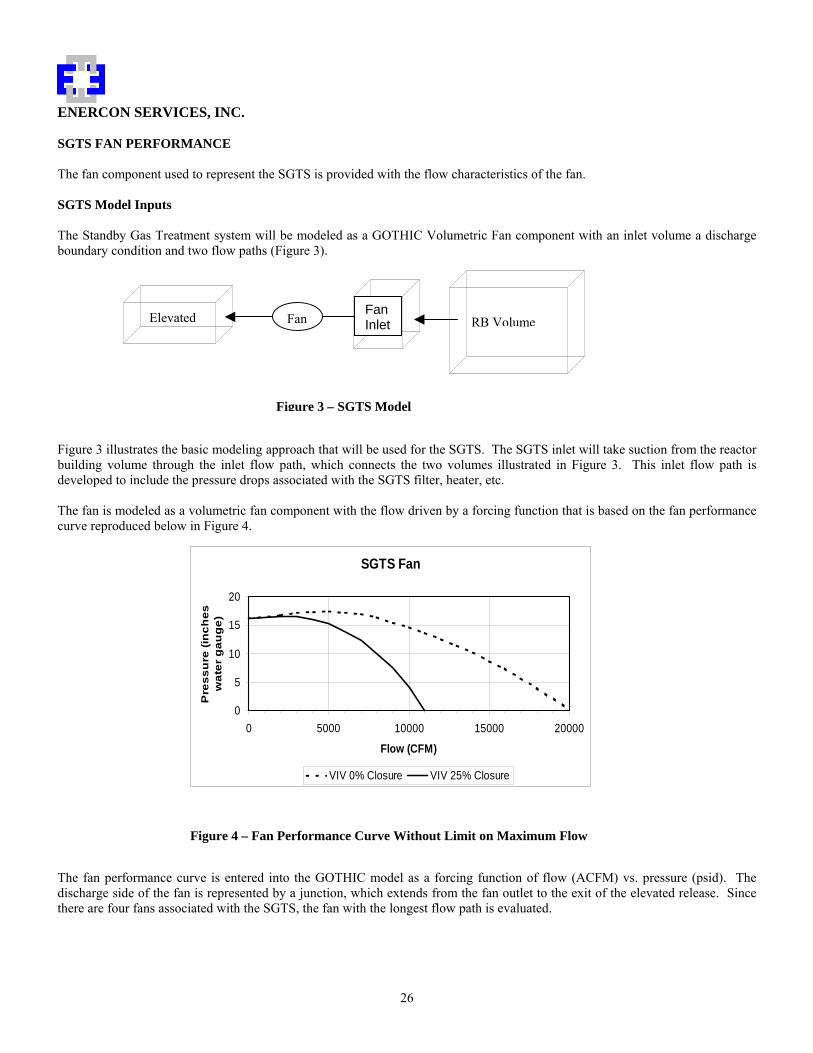
Figure 3 illustrates the basic modeling abuilding volume through the inlet flowdeveloped to include the pressure drops The fan is modeled as a volumetric fancurve reproduced below in Figure 4.
0
5
10
15
20
0
Pre
ssu
re (i
nch
es
wat
er g
aug
e)
Figure 4 – Fa The fan performance curve is entered discharge side of the fan is representedthere are four fans associated with the S
Figure 3 – SGTS Model
26
pproach that will be used for the SGTS. The SGTS inlet will take suction from the reactor path, which connects the two volumes illustrated in Figure 3. This inlet flow path is
associated with the SGTS filter, heater, etc.
component with the flow driven by a forcing function that is based on the fan performance
SGTS Fan
5000 10000 15000 20000
Flow (CFM)
VIV 0% Closure VIV 25% Closure
n Performance Curve Without Limit on Maximum Flow
into the GOTHIC model as a forcing function of flow (ACFM) vs. pressure (psid). The by a junction, which extends from the fan outlet to the exit of the elevated release. Since GTS, the fan with the longest flow path is evaluated.
ENERCON SERVICES, INC.
27
ANALYSES The model developed in the earlier portions of this calculation will be used to evaluate the drawdown effectiveness of the Standby Gas Treatment and Secondary Containment Systems. This analysis will include the short-term recovery of the building to below 0.25”WG as well as an assessment of the long-term ability to maintain the 0.25”WG criteria. The analysis includes all heat loads within the Reactor Building that are pertinent for the LOOP LOCA assessment as documented previously. These loads impact both the short-term response as well as the long-term response. The loads that will impact the short-term response are primarily the electrical heat loads. With the exception of the decaying normal heat loads, all electrical loads will impact the long-term response as they continue to put energy into the building. There are loads that will be involved throughout the analysis, but will not begin to impact the building response until later in the analysis. These loads include decay heat in the fuel pool as well as heat transferred from the primary containment. These sources of energy are delayed by the heat storage capacity of the fuel pool and the primary containment walls, respectively. Coupled with the increase in temperature of the ultimate heat sink, these sources could potentially raise building pressure back above the 0.25”WG. Therefore, the analysis is run for a total analysis time of 30 days. As part of the analysis documented in the main body of this report, several sensitivity studies will be conducted. The first of these will be an assessment of the leakage flow split. The basis of the model will be a 70% to 30% flow split between the roof and the railroad door, respectively. Based upon testing documented in Reference 1.20, this value provides a conservatively high representation for the railroad door leakage contribution and may underestimate the roof leakage. To evaluate the significance of this selection, a case using a 90% to 10% flow split between the roof and the railroad door, respectively, will be performed. The flow split is based on pressures across the roof and railroad bay doors being equal. Since weather conditions will alter the actual pressures across these leakage paths, it is necessary to evaluate the two extremes to fully demonstrate the impact of these conditions.

ENERCON SERVICES, INC.
29
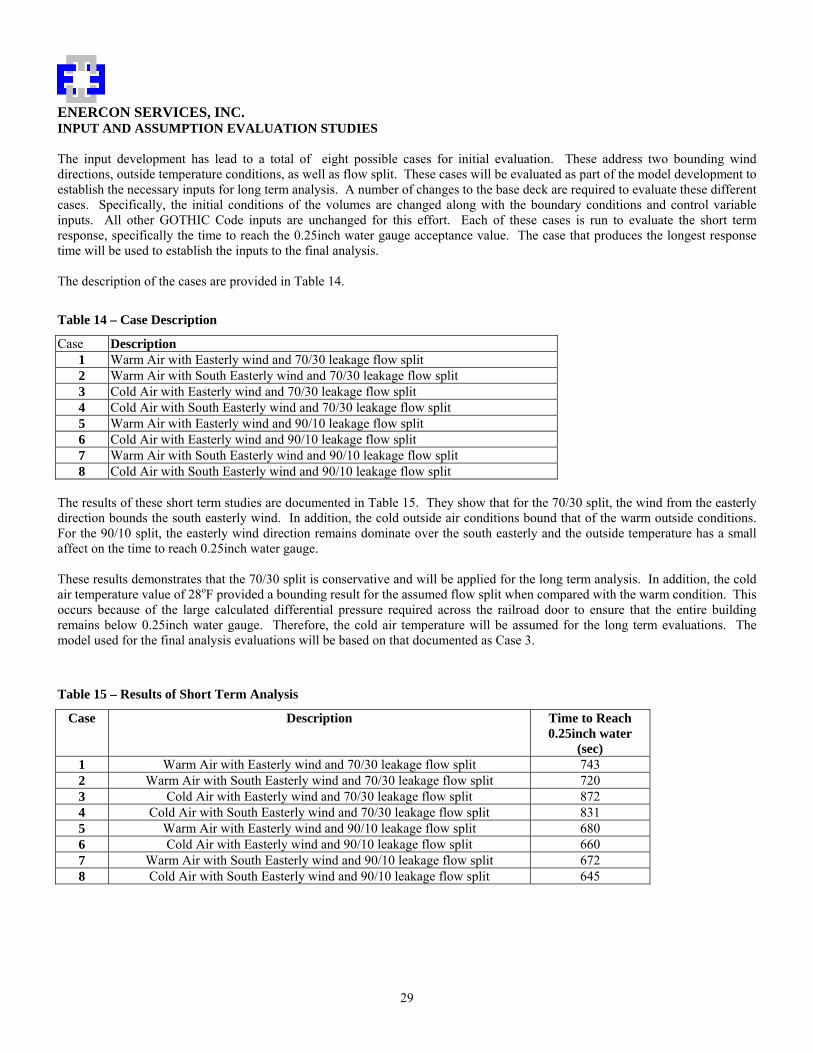
INPUT AND ASSUMPTION EVALUATION STUDIES The input development has lead to a total of eight possible cases for initial evaluation. These address two bounding wind directions, outside temperature conditions, as well as flow split. These cases will be evaluated as part of the model development to establish the necessary inputs for long term analysis. A number of changes to the base deck are required to evaluate these different cases. Specifically, the initial conditions of the volumes are changed along with the boundary conditions and control variable inputs. All other GOTHIC Code inputs are unchanged for this effort. Each of these cases is run to evaluate the short term response, specifically the time to reach the 0.25inch water gauge acceptance value. The case that produces the longest response time will be used to establish the inputs to the final analysis. The description of the cases are provided in Table 14.
Table 14 – Case Description
Case Description 1 Warm Air with Easterly wind and 70/30 leakage flow split 2 Warm Air with South Easterly wind and 70/30 leakage flow split 3 Cold Air with Easterly wind and 70/30 leakage flow split 4 Cold Air with South Easterly wind and 70/30 leakage flow split 5 Warm Air with Easterly wind and 90/10 leakage flow split 6 Cold Air with Easterly wind and 90/10 leakage flow split 7 Warm Air with South Easterly wind and 90/10 leakage flow split 8 Cold Air with South Easterly wind and 90/10 leakage flow split
The results of these short term studies are documented in Table 15. They show that for the 70/30 split, the wind from the easterly direction bounds the south easterly wind. In addition, the cold outside air conditions bound that of the warm outside conditions. For the 90/10 split, the easterly wind direction remains dominate over the south easterly and the outside temperature has a small affect on the time to reach 0.25inch water gauge. These results demonstrates that the 70/30 split is conservative and will be applied for the long term analysis. In addition, the cold air temperature value of 28oF provided a bounding result for the assumed flow split when compared with the warm condition. This occurs because of the large calculated differential pressure required across the railroad door to ensure that the entire building remains below 0.25inch water gauge. Therefore, the cold air temperature will be assumed for the long term evaluations. The model used for the final analysis evaluations will be based on that documented as Case 3.
Table 15 – Results of Short Term Analysis
Case Description Time to Reach 0.25inch water
(sec) 1 Warm Air with Easterly wind and 70/30 leakage flow split 743 2 Warm Air with South Easterly wind and 70/30 leakage flow split 720 3 Cold Air with Easterly wind and 70/30 leakage flow split 872 4 Cold Air with South Easterly wind and 70/30 leakage flow split 831 5 Warm Air with Easterly wind and 90/10 leakage flow split 680 6 Cold Air with Easterly wind and 90/10 leakage flow split 660 7 Warm Air with South Easterly wind and 90/10 leakage flow split 672 8 Cold Air with South Easterly wind and 90/10 leakage flow split 645
ENERCON SERVICES, INC.
30
LONG TERM ANALYSIS AND MANUAL OPERATOR ACTION RESPONSE TIME EVALUATIONS The fuel pool cooling will need to be started manually from the control room since the normal cooling will be lost. The response of the fuel pool will have an impact on the ability to maintain the 0.25inch water gauge pressure requirement. Delay in fuel pool cooling results in pool heat up and ultimately pool boiling. The heat up of the pool by the stored fuel will provide a source of heat and mass to the refueling floor volume. This will lead to a pressure increase of the building if cooling is not restarted. The long term analyses, which are used to demonstrate the ability to maintain the building depressurized will evaluate acceptable operator action times to ensure the building remains depressurized. The results of these studies as well as those associated with stored fuel temperatures and structural limits, which are beyond the scope of this analyses, should be used to establish any procedural operator action criteria. This analysis will define an upper and lower operator action time to be used in the sensitivities. The lower time is set to be 20 minutes. This value is selected to provide a time that exceeds the 10 minute operator action criteria that is in general acceptance in the industry for operator actions associated with manual start of safety systems. The upper limit will be based upon the time required to reach bulk boiling of the fuel pool. To represent this time a pool temperature of 212oF is used in combination with the assumed pool initial temperature of 125oF. Given the previously defined pool volume and decay value, an estimate of the time can be calculated as follows using steam table information.
( )( )
( )( )
hrtime
hrBTU
FFftftlb
lbFBTU
time
QFFVolumePoolFFCptime
DecayHeat
8.24
sec36001
sec56.2720
12521246788814.59998.0
125212)212()212(
33
=∆
⎟⎠⎞
⎜⎝⎛
−=∆
−=∆
ρ
Since this simple calculation does not include heat or mass transfer, the actual time should be longer. However, in the interest of providing margin to the bulk boiling condition, which will challenge the ability of the fuel pool cooling system, 24 hours will be selected.
Table 16 – Long Term Analysis Cases
Case Description Figure 9 Cold Outside Air Easterly Wind Direction
70/30 Leakage Split Fuel Pool Cooling Start Time 20 minutes
Not Included
10 Cold Outside Air Easterly Wind Direction 70/30 Leakage Split Fuel Pool Cooling Start Time 3 hours
Not Included
11 Cold Outside Air Easterly Wind Direction 70/30 Leakage Split Fuel Pool Cooling Start Time 12 hours
5, 6, 7 and 8
12 Cold Outside Air Easterly Wind Direction 70/30 Leakage Split Fuel Pool Cooling Start Time 24 hours
Not Included
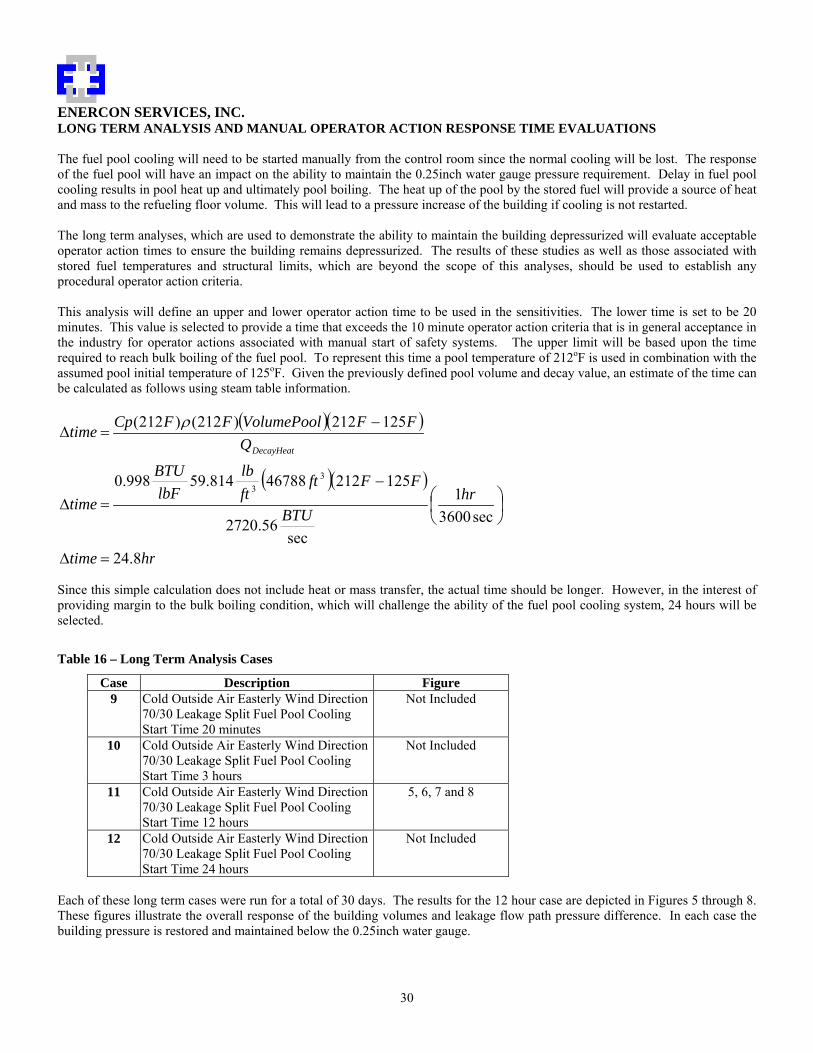
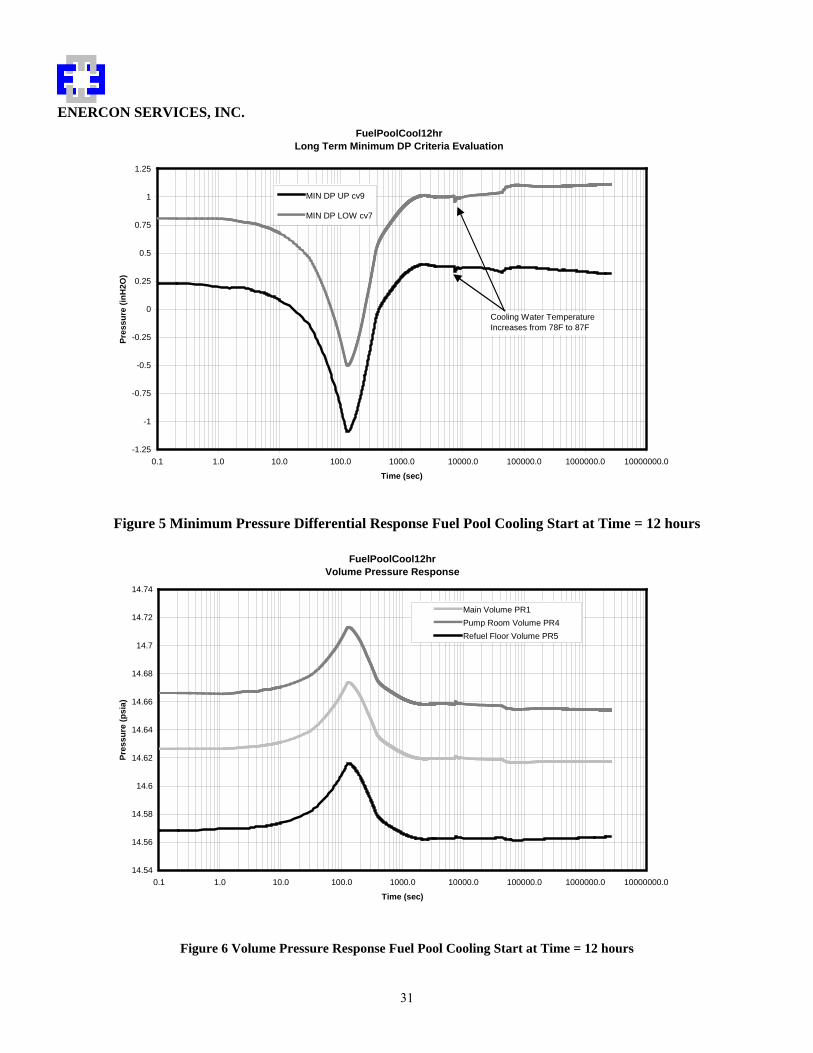
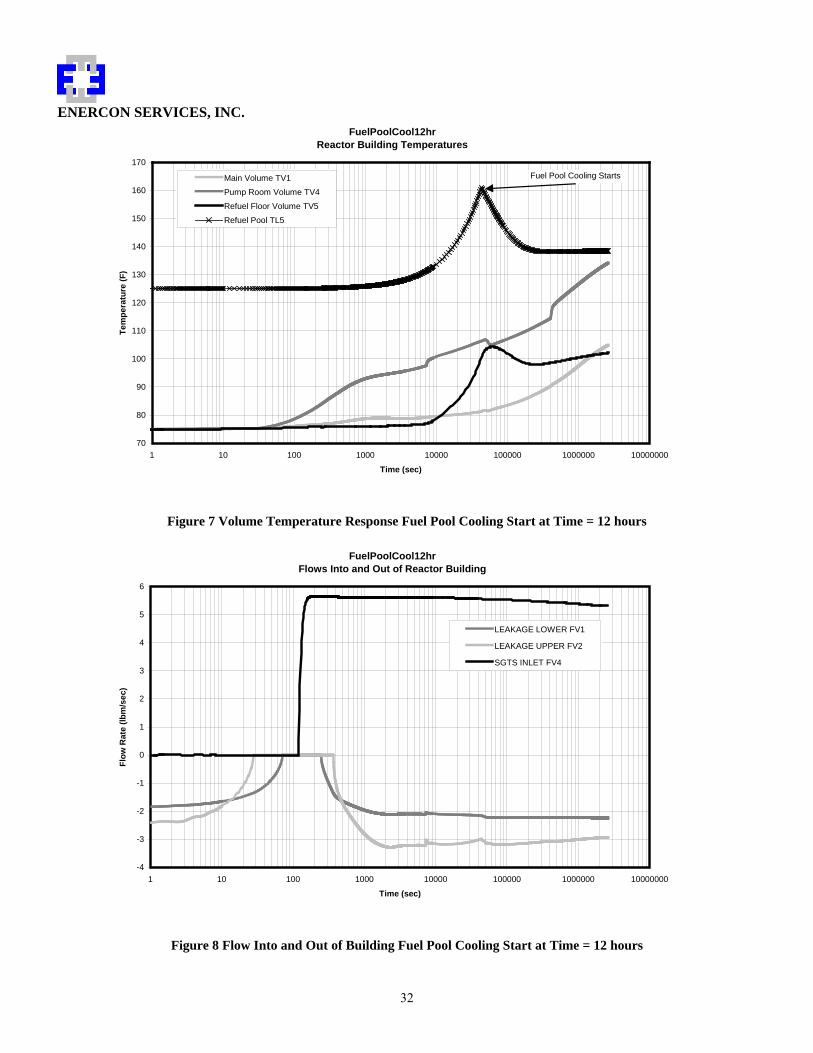
Each of these long term cases were run for a total of 30 days. The results for the 12 hour case are depicted in Figures 5 through 8. These figures illustrate the overall response of the building volumes and leakage flow path pressure difference. In each case the building pressure is restored and maintained below the 0.25inch water gauge.
31
ENERCON SERVICES, INC. FuelPoolCool12hr
Long Term Minimum DP Criteria Evaluation
-1.25
-1
-0.75
-0.5
-0.25
0
0.25
0.5
0.75
1
1.25
0.1 1.0 10.0 100.0 1000.0 10000.0 100000.0 1000000.0 10000000.0
Time (sec)
Pres
sure
(inH
2O)
MIN DP UP cv9
MIN DP LOW cv7
Cooling Water TemperatureIncreases from 78F to 87F
Figure 5 Minimum Pressure Differential Response Fuel Pool Cooling Start at Time = 12 hours
FuelPoolCool12hrVolume Pressure Response
14.54
14.56
14.58
14.6
14.62
14.64
14.66
14.68
14.7
14.72
14.74
0.1 1.0 10.0 100.0 1000.0 10000.0 100000.0 1000000.0 10000000.0
Time (sec)
Pres
sure
(psi
a)
Main Volume PR1Pump Room Volume PR4Refuel Floor Volume PR5
Figure 6 Volume Pressure Response Fuel Pool Cooling Start at Time = 12 hours
32
ENERCON SERVICES, INC. FuelPoolCool12hr
Reactor Building Temperatures
70
80
90
100
110
120
130
140
150
160
170
1 10 100 1000 10000 100000 1000000 10000000
Time (sec)
Tem
pera
ture
(F)
Main Volume TV1
Pump Room Volume TV4
Refuel Floor Volume TV5
Refuel Pool TL5
Fuel Pool Cooling Starts
Figure 7 Volume Temperature Response Fuel Pool Cooling Start at Time = 12 hours
FuelPoolCool12hrFlows Into and Out of Reactor Building
-4
-3
-2
-1
0
1
2
3
4
5
6
1 10 100 1000 10000 100000 1000000 10000000
Time (sec)
Flow
Rat
e (lb
m/s
ec)
LEAKAGE LOWER FV1
LEAKAGE UPPER FV2
SGTS INLET FV4
Figure 8 Flow Into and Out of Building Fuel Pool Cooling Start at Time = 12 hours