Embed Size (px)
Citation preview
1
Endogenous financial literacy, saving and stock market participation
Luca Spataro* and Lorenzo Corsini
†
Abstract
Recent empirical literature provides evidence that financial
literacy, human capital, savings and stock market participation
are interconnected decisions. In this paper we contribute to this
issue by building a framework that includes all these decisions in
an encompassing model. In our model, earnings from work
depend on optimally chosen human capital and financial literacy
allows to access the stock markets and to invest in risky assets.
Our results provide a theoretical foundation for the role and the
determinants of financial literacy and explain several stylized
facts on literacy and stock market participation.
JEL Classification: D14, D91, G11, J24
Keywords: financial literacy, human capital, savings, stock
market participation
* Dipartimento di Economia e Management, Università di Pisa (Italy). Email: [email protected].
† Corresponding author. Dipartimento di Economia e Management, Università di Pisa. Via Ridolfi 10, 56124 Pisa, Italy. Tel: +39
0502216220 Fax: +39 0502210603. Email: [email protected].
We are grateful for their useful comments to the participants of the seminar held at the Dipartimento di Economia e Management
in Pisa, at the PET 13 Conference held in Lisbon and at 11th workshop on Pension, Insurance and Saving in Paris. The usual
disclaimer applies.
2
1. Introduction Recent reforms of pension systems in several countries entail a higher degree of responsibility on workers’
side. This, together with an increasing degree of complexity of individuals’ financial decisions, has induced
both scholars and policymakers to focus on the determinants and the role of financial literacy.
While quite a large number of empirical studies have shed light on the relevance of financial literacy as a
key determinant of crucial life-time decisions such as retirement planning and stock market participation,
(we review these contributions in section 2 and see also Mitchell and Lusardi 2011 for a full coverage on
this subject), the theoretical literature on these issues is extremely thin.
Among the very few studies that cover the theoretical aspects, Jappelli and Padula (2011) develop a model
where financial literacy affects the returns of non-stochastic saving: literacy is costly to acquire and there is
thus a trade-off between the benefits and costs of investing in literacy; their findings show that, once
financial literacy is endogenously determined, its optimal level is positively correlated with wealth and
saving and that the introduction of social security systems reduces the incentives to acquire literacy.
Furthermore, Lusardi et al. (2011) develop a numerically-simulated life cycle model where endogenous
financial literacy affects the stochastic returns from saving and where exogenous education determines
income. Their results show that the acquisition of financial literacy follows a hump-shaped profile through
the life-cycle and that different education groups, receiving different income, find convenient to acquire
different amounts of literacy. Finally, Corsini and Spataro (2011) develop a theoretical model where
individuals’ decisions on pension plans are affected by complexity costs related to more sophisticated plans
and investigate how the acquisition of financial literacy affect thus pension-saving decisions.
In this work we aim at making a step further in the theoretical literature on financial literacy by providing a
unified framework that encompasses human capital formation, financial literacy achievement, savings and
capital market participation. To the best of our knowledge, this has not been done so far.
In particular, differently from previous literature we focus i) on the fact that the acquisition of financial
literacy allows individuals to access the stock market, to invest in risky assets and thus to obtain
diversification of their savings and ii) on the interaction between financial literacy and education, with the
latter being endogenously determined and affecting, at the same time, both the income and the cost to
acquire financial literacy. As a consequence, within our model, savings, financial literacy, education and
investment decisions strictly interact and are endogenously determined.
The results that we obtain from our model appear to explain well the observed evidence and also stir some
further empirical questions that would be worth to address.
The work is organized as follows. In section 2 we sketch some stylized facts on financial literacy acquisition
and stock market participation, stemming from the existing empirical literature. In section 3 we lay out the
model concerning human capital investment, savings and financial literacy acquisition. In section 4 we
derive the determinants of financial literacy investments and of stock market participation. In section 5 we
describe the role of financial literacy in the accumulation of wealth. Concluding remarks end the work.
3
2. Some stylized facts on financial literacy and stock market participation A number of empirical studies have analyzed the determinants of financial literacy and their consequences
on investment behavior. Usually, literacy is assessed and measured through surveys that contain questions
on the concepts of compound interest, inflation, purchasing power and risk diversification: on the basis of
the correct answers to these questions a literacy score is computed for each individual. Some of these
studies are single-country analyses1 while others like Jappelli (2010) and Lusardi and Mitchell (2011a)
contain cross-countries assessments. These studies highlight some common patterns in the determinants
and the effects of financial literacy and they indicate that financial literacy:
- is lower among younger and older individuals.
- is lower among female individuals
- is usually higher for self-employed and individuals working in business related sectors
- is higher for higher income individuals
- is higher for individuals that are good in math and in numeracy
- increases with education (schooling) but the actual relationship can be complex
- affects positively the probability to plan for retirement
- affects positively, other things being equal, the accumulation of wealth
- is positively correlated with the degree of portfolio diversification
- is positively correlated with the participation to the stock market.
Some comments on the above list are worth doing.
First, education and financial literacy appear to be correlated but there is evidence that the field of study is
also relevant in explaining how the level of schooling actually affects financial literacy (see Almenberg and
Save-Soderbergh 2011). Moreover, when education and literacy are used contemporaneously as explicative
variables in econometric regressions, they are usually both significant so that literacy appears to have an
effect above and beyond education (see Lusardi and Mitchell 2011a). Second, literacy affects positively,
other things being equal, wealth accumulation and in particular this causal effect persists even after
controlling for factors like income, age and education.
The issue of participation to stock markets, apart for the above mentioned positive correlation with
financial literacy, has also been the object of specific empirical analyses. Among the more recent studies,
Bertaut and Haliassos (1995), Christiansen et al. (2007) and van Rooij et al. (2011) have highlighted some
common features in participation. Summarizing, financial literacy has a positive effect on participation and,
even after controlling for this aspect, participation to the stock market:
- increases in the level of income
- increases in the level of education
- decreases in the degree of risk aversion
1 Analyses from Alessie et al. (2011), Almenberg and Säve-Söderbergh, (2011), Crossan et al. (2011), Bucher-Koenen
and Lusardi (2011), Fornero and Monticone (2011), Klapper and Panos (2011), Lusardi and Mitchell (2011b) and Sekita
(2011) cover, respectively, Netherlands, Sweden, New Zeland, Germany, Italy, Russia, United States and Japan.
Evidence from United States on the effect of financial literacy on planning and wealth accumulation is also contained
in Lusardi and Mitchell (2007). Finally, evidence from Italy on the effect of literacy on portfolio diversification is
contained Guiso and Jappelli (2009) while evidence from Sweden on how less-sophisticated investors tend to achieve
under-diversification is contained in Anderson (2013).

4
Moreover, the field of study is, even in this case, also relevant: in fact, Christiansen et al. (2007) find that
individuals with higher education in economics-related disciplines are, all things considered, more likely to
invest in the stock market.
These stylized facts highlight how financial literacy, education and participation to stock markets are strictly
related, not only because the former appears to be a determinant of the latter, but also because several
factors appear to concurrently have a role in the determination of all of them.
In the work that follows we provide a model that encompasses all these issues in an unified framework.
3. A Theoretical Model of Human Capital and Saving We imagine an economy populated by individuals that live for two periods: in the first one they choose
how much human capital to acquire and, depending on the latter, they receive an income that is partly
consumed and partly saved; then, in the second period, they consume what they have saved.
Within this basic structure, we add three characterizing features to our model: (i) savings can be invested
either in a safe or in a risky asset (or both); (ii) in order to invest in the risky asset, it is necessary to acquire
financial literacy, which is costly and (iii) this literacy cost is an opportunity cost (given by the time lost to
obtain literacy) but the share of time needed is decreasing in the level of human capital and education.
Points (ii) and (iii) reflect the fact that investments in the risky assets require some knowledge of the
mechanism behind stocks (something that is also suggested in Bertaut and Haliassos 1995) as well as some
effort to track the performance of the assets. It follows that some time has to be lost to acquire financial
literacy and our assumption is that the knowledge obtained from generic education effectively reduces the
amount of time needed.
Education is thus particularly important within our model and, to all extent, time spent in education has
three effects: 1) it increases human capital and thus the wage rate, 2) it decreases the amount of time
spent working, 3) it decreases the amount of time needed to obtain financial literacy.
As for investment decisions, in our model individuals not only choose how much to save but they also
decide whether to invest in financial literacy, thus differentiating their savings between two assets (i.e.
participating in the stock market) or not to invest in financial literacy, thus saving only through the safe
asset. We assume that risky assets provide higher returns although they entail higher volatility. To all extent
the acquisition of financial literacy can be seen as an investment that allows diversification of the financial
portfolio.
3.1 Basic Definitions
We now characterize the basic structure of the model and define its components.
3.1.1 Lifetime utility
Individuals live for two periods (representing working life and retirement) and their lifetime utility is given
by
1) � = −����� − �����
where c₁ and c₂ are consumption in period one and two respectively, a is the absolute risk aversion
coefficient and measures time preferences. The above utility function displays the CARA property and is

5
chosen to obtain closed form solutions: however, as we describe in details in sub-section 3.1.5, we also
allow for an inverse relationship between the risk coefficient a and income, which is in line with observed
evidence.
3.1.2 Human Capital
During their working life, individuals can invest part of their time in education to acquire human capital h.
We assume that each individual is endowed with one unit of time and that human capital production
function is given by
2) ℎ = �/�
where represents the time (or the share of time) devoted to education and x measures how effective
education is in producing human capital. We assume that x>1 so that human capital production displays
decreasing returns.
3.1.3 Income
The income per time-unit w depends on the amount of human capital acquired through education and on a
scale factor k>1. The amount of income per unit of time is
3) � = �ℎ.
3.1.4 Working life income
The working life income W is the product of income per time-unit w and time spent working (i.e. time not
spent in education):
4) � = �ℎ�1 − �.
Given eq. (2), the above can also be written as
5a)� = �ℎ�1 − ℎ��.
Note that working life income W is an increasing function of x and k and has an inverted U-shape with
respect to h.
3.1.5 Risk aversion
To make our model more realistic we also allow for an inverse relationship between risk aversion and
income and therefore we assume that
5) � = ���
where� > 0 is the elasticity of risk aversion with respect to income.2 Given the above function, we are
assuming that only the exogenous component of income (that is, the parameter k) influences risk aversion.
We make this latter assumption to guarantee that human capital and education do not influence directly
2 This methodology to deal with income-decreasing risk aversion has been first proposed by Makarov and Schornick
(2010) and can help explain the empirical finding that richer individuals have a preference for riskier assets (see
Vissing-Jorgensen 2002).
6
risk aversion and to avoid that individuals, when determining their optimal human capital investment, are
also choosing their own risk aversion.
Given eq. (5), an increase in � implies, other things being equal, a decrease in risk aversion. The parameter � also determines the behaviour of relative risk aversion with respect to income: relative risk aversion is
increasing for0 < � < 1, constant for � = 1 and decreasing for� > 1.
3.1.6 Savings
Individuals can save through two possible assets. A safe asset whose rate of return is s and a risky asset
whose rate of return is normally distributed with mean r and variance σ². Given the complexity of financial
markets, individuals that choose to invest in the risky asset have to spend some time to acquire financial
literacy and to evaluate and track the performance of their asset. We indicate with S the amount invested
in the safe asset and with R the amount invested in the risky asset.
3.1.6 Financial Literacy Costs
Financial literacy costs represent the amount of time needed to acquire the knowledge necessary to invest
in the risky assets and to handle and track that investment. Consequentially, they are an opportunity cost
as they represent the amount of time c lost to invest in financial literacy formation and to manage the risky
assets. This amount of time depends inversely on the human capital (and thus on education) of the
individual and, in particular:
6� ��ℎ� = 1 − ℎ���where the parameter 0<z<1 is a measure on how effective human capital (and education) is in facilitating
the acquisition of financial literacy. Our idea is that different fields of education have different degree of
complementarity with financial literacy skills and such a degree of closeness of human capital to financial
education is captured by the parameter z. In the description of our model we assume that z is smaller than
one: the case in which this parameter is equal to one is a special case which we will treat separately.
The specific form of equation (6) is chosen for analytical simplicity: however, it can be micro-funded using a
more complex set-up where individuals invest time to acquire financial literacy which, in turn, abates the
amount of time lost in understanding, evaluating and tracking the risky investments. In particular, eq. (6)
can be directly derived assuming that individuals invest an optimal amount of time to acquire financial
literacy and that literacy reduces the costs to access the financial markets: we show this in appendix C.
Finally, given that each individual has got one unit of time, ��ℎ� directly represents the share of time spent
to acquire literacy and enter the financial markets the literacy and, from eq. (6), the actual cost paid is
given by� ∙ ��ℎ�.
3.2 The optimization problem
Each individual faces the decision on how much human capital to acquire and how much to save during
working-life (which also determines consumption in period one and two). In addition, individuals have to
choose whether to acquire financial literacy or not. Basically in the first case each individual has to choose
the optimal amount of h, S and R whereas in the second case only h and S are chosen. These optimal
amounts determine two different indirect expected utilities, one for each investment strategy. By

7
comparing these two indirect utilities, individuals will choose whether or not to invest in financial literacy
and, accordingly, the optimal amount of education and savings. By convention, we assume that individuals
do not invest in financial literacy when the two indirect utility are equal. We start describing the case where
the individual chooses not to acquire financial literacy and we then move to the other case. At the end of
this subsection we will be able to show the optimal choice of human capital, consumption and saving in the
two cases and the resulting indirect expected utilities.
3.2.1 Safe assets only
If an individual does not acquire financial literacy then no literacy cost has to be paid but savings will be
invested into the safe asset only. The individual budget constraint implies then
7) �� = � − ! = �ℎ�1 − ℎ�� − !
and
7a)�" = !�1 + $�.
Given the above equations for consumption, the individual maximizes the expected utility and the
maximization problem is
8) max(,* −���+,(���(-��*. − ���+*��/0�.. The solution of the above allows us to obtain the indirect expected utility of an individual that chooses not
to invest in financial literacy, which we will indicate with1�∗. In particular, the optimal solution implies
9) ℎ∗ = 3 ��/�4�-
and
10) !∗ = 5�ℎ∗�1 − �ℎ∗��� + 678 9��/0�� : �"/0
where ℎ∗ and !∗ are the optimal levels of human capital and saving: the derivation of eqs. (9) and (10) can
be found in Appendix A.
The above equations also imply the following optimal lifetime income�∗
11) �∗ = �ℎ∗�1 − ℎ∗� = � 3 ��/�4 3 ��/�4�-.
Finally, the indirect utility in this case is
12) 1�∗ = − 3"/0�/04 ���3 ��;<4=��/0�>∗�?@A B��;<�C D.
3.2.2 Safe and Risky assets
An individual that has invested in financial literacy can invest savings in either the safe or risky asset, or
both. However the individual needs to pay the cost to obtain literacy. Given the presence of this cost the
budget constraint implies

8
13) �� = � − ��ℎ�� − ! − E = �ℎ�−ℎ� + ℎ���� − ! − E
and
13a) �"~G�!�1 + $� + E�1 + H�, E"I"�
where �" is now a stochastic variable (in fact, r is a stochastic variable).
Given the above equations for consumption, the maximization problem (for the expected utility1�J) the
individual is facing becomes3
14) max(,*,J −���K,(L�(-/(�MNO�*�JP − ���Q*��/0�/J��/R��CS�T�� U
.
The solution of the above allows us to obtain the indirect expected utility when an individual chooses to
invest in financial literacy (and participate in the stock market), which we indicate with1�V∗. In particular,
the optimal solution implies
15) ℎV∗ = 3"���/�4 �-M�;N
where ℎV∗ is the optimal amount of human capital when the individual decides to acquire the required
financial literacy. Interestingly, if we compare eqs. (9) and (15) we have thatℎV∗ > ℎ∗: in fact, given that
human capital is also useful to abate financial literacy costs, individuals that choose to acquire financial
literacy also find convenient to acquire more education. The above also yields the following lifetime net
income (that is, life income net of the financial literacy costs).
16) �V∗ = � 3���/�"�� 4 3"���/�4 �;--M�;N.
In addition, the optimal solution also implies:
17) EV∗ = R�0�W�
and
18) !V∗ = 5�V∗ + 678 9��/0�� − 32 + R/0" 4 R�0�W�: 3 �"/04
where !V∗ andEV∗ are, respectively, the optimal amount of safe and risky investments. The derivation of eqs.
(15), (17) and (18) can be found in Appendix A.
The indirect utility in this case is
19) 1�V∗ = − "/0�/0 ���Q��/0�>Y∗�?@A B��;<�C /�ZM<���CS� U3 ��;<4
.
3 We exploit here a well-known property by which, for any given stochastic variable nj distributed normally with mean
n and varianceI[", we have that1����[\� = ���L[��W]�/"O: see Varian (1993).
9
4 Acquisition of financial literacy and participation to the stock market In the previous section we derived the optimal level of human capital, consumption and savings and the
resulting indirect expected utilities. Within our set-up, individuals choose to acquire financial literacy and
invest in the stock market when the resulting indirect utility is higher than the one obtaining in the
alternative strategy. In terms of our model this happens when1�V∗ > 1�∗, that is, given eqs. (11) and (18),
for
20) − 3"/0�/04 ���Q��/0�>Y∗�?@A B��;<�C /�ZM<���CS� U3 ��;<4 > − 3"/0�/04 ���3 ��;<45��/0�>∗�?@A B��;<�C :
which implies
20a) �∗ − �V∗ < ��/0 �R�0��"�W�
and exploiting eq. (6) and inserting the value for the optimal lifetime incomes as given by eqs. (11) and (16)
we obtain:
20b) 3 ��/�4 3 ��/�4�- − 3���/�"�� 4 3"���/�4 �;--M�;N < �,�M^ 5 ��/0 �R�0��"W� :
The above equation determines univocally whether individuals acquire financial literacy and, similarly,
whether they invest in the stock market.
The left hand side of the eq. (20b) is decreasing in x and z for all the relevant values of the parameters (and
for z=1, the LHS is always zero): therefore, individuals whose education is more effective in producing
human capital or in abating financial literacy costs are more likely to acquire financial literacy and
participate to the stock market. The analytical proof that the LHS (and�∗ − �V∗) are decreasing in x and z
is contained in Appendix B.
The right hand side of the equation is increasing in the risk premium (r-s) and decreasing in the degree of
risk aversion (in fact, the RHS is increasing in �), variance of the risky asset returns and returns from the
safe asset, which implies that individuals are more likely to acquire financial literacy when the excess return
of the risky asset is high, when its volatility is low and when their risk aversion is low. Basically these results
tell us that when risky assets are more attractive individuals find more convenient investing in financial
literacy.
The RHS also depends on income, as the latter influences both risk aversion and the opportunity costs to
obtain literacy. However these effects are only due to the component k of income and the sign of the total
effect depends on the value of�: for �<1 the component k has a negative effect on the RHS, for � > 1 it
has a positive effect and for � = 1 it has no effect. Accordingly, for a given level of education, higher
income individuals are more/less likely to acquire the literacy depending on the value of the elasticity of
risk aversion with respect to income.
10
Figure 1
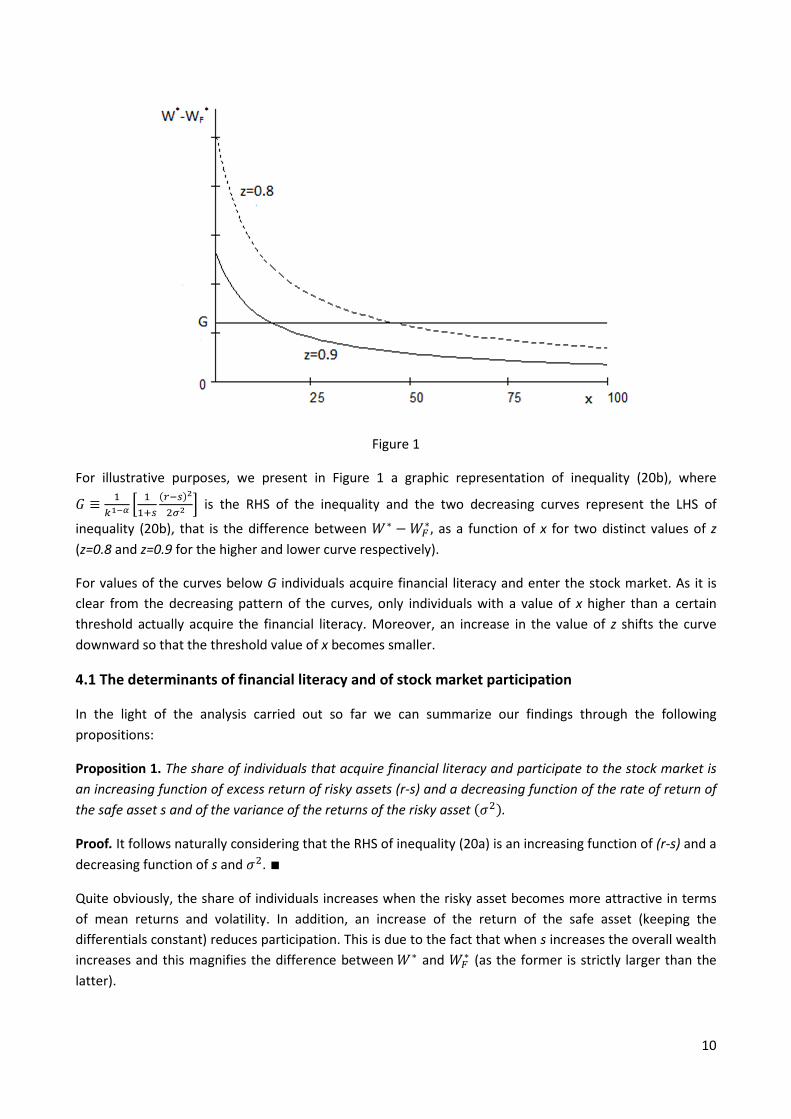
For illustrative purposes, we present in Figure 1 a graphic representation of inequality (20b), where
_ ≡ �,�M^ 5 ��/0 �R�0��"W� : is the RHS of the inequality and the two decreasing curves represent the LHS of
inequality (20b), that is the difference between �∗ ��V∗, as a function of x for two distinct values of z
(z=0.8 and z=0.9 for the higher and lower curve respectively).
For values of the curves below G individuals acquire financial literacy and enter the stock market. As it is
clear from the decreasing pattern of the curves, only individuals with a value of x higher than a certain
threshold actually acquire the financial literacy. Moreover, an increase in the value of z shifts the curve
downward so that the threshold value of x becomes smaller.
4.1 The determinants of financial literacy and of stock market participation
In the light of the analysis carried out so far we can summarize our findings through the following
propositions:
Proposition 1. The share of individuals that acquire financial literacy and participate to the stock market is
an increasing function of excess return of risky assets (r-s) and a decreasing function of the rate of return of
the safe asset s and of the variance of the returns of the risky asset �I"�. Proof. It follows naturally considering that the RHS of inequality (20a) is an increasing function of (r-s) and a
decreasing function of s and I". ∎
Quite obviously, the share of individuals increases when the risky asset becomes more attractive in terms
of mean returns and volatility. In addition, an increase of the return of the safe asset (keeping the
differentials constant) reduces participation. This is due to the fact that when s increases the overall wealth
increases and this magnifies the difference between�∗ and �V∗ (as the former is strictly larger than the
latter).
11
Proposition 2. Individuals bestowed with larger values of x and z are more likely to acquire financial literacy
and to participate the stock market.
Proof. See Appendix B.
We can give a direct economic interpretation of these results. In fact, the variable x measures how effective
individuals are in acquiring education and human capital (or the education system is in providing them):
individuals with larger values of x acquire more human capital and thus, as a side effect of human capital
and education, their cost to acquire financial literacy shrinks. Thus, they are more likely to acquire financial
literacy and enter the stock market. The variable z measures how effective human capital and education
are in abating the cost to acquire financial literacy: individuals with higher value of z have trained in
education sectors closer to finance and their cost to acquire the financial literacy is smaller.
We now provide e corollary for a particular value of z, which helps to better interpret our results.
Corollary 1. Forb = 1 it descends:� = 0,�∗ − �V∗ = 0 and 1�V∗ > 1�∗ so that r>s is a sufficient condition
for individuals to obtain financial literacy and enter the stock market.
Proof. Consider the case b = 1. From eq. (6) we have: ��ℎ� = 1 − ℎ��� = 0. From eqs. (11) and (16) we
have�∗ − �V∗ = � 3 ��/�4 3 ��/�4�- − � 3���/�"�� 4 3"���/�43 �;--M�;�4 = 0. Finally, we know from (20a) that
1�V∗ > 1�∗ if and only if �∗ − �V∗ < ��/0 �R�0��"�W� and given that, forb = 1, �∗ − �V∗ = 0 then r>s is a
sufficient condition to obtain 1�V∗ > 1�∗ and for individuals to obtain financial literacy and enter the stock
market. ∎In words, whenb = 1, we are depicting a case in which the main concepts of finance are taught and learnt
within the standard education career of individuals and therefore the latter do not have to pay any extra
costs to obtain financial literacy. In this case all individuals automatically obtain the financial literacy and
find convenient to enter the stock market (though the amount of risky assets bought may be extremely
low).
5 Savings and Wealth accumulation In this section we explore the role that financial literacy has in determining wealth accumulation.
Differently from what we have seen in previous section, where we analyzed the factors that determined
the likelihood to acquire financial literacy for a given individual, we now assess whether individuals with
financial literacy have a tendency, other things being equals, to accumulate more wealth than individuals
without it. From this point of view, we need thus to compare individuals with and without the required
literacy to invest in the risky assets.
For sake of simplicity, we define wealth as the total amount that has been accumulated during working-life,
net of capitalization of interests: at the end of the section we discuss how our results are even more robust
if we also include the capitalization of interests.
Preliminarily, we compute the total amount saved according to whether an individual acquires or not the
literacy (and thus enters the stock market). In particular, if an individual does not acquire financial literacy
the resulting total lifetime savings are equal to the amount invested in the safe asset:
12
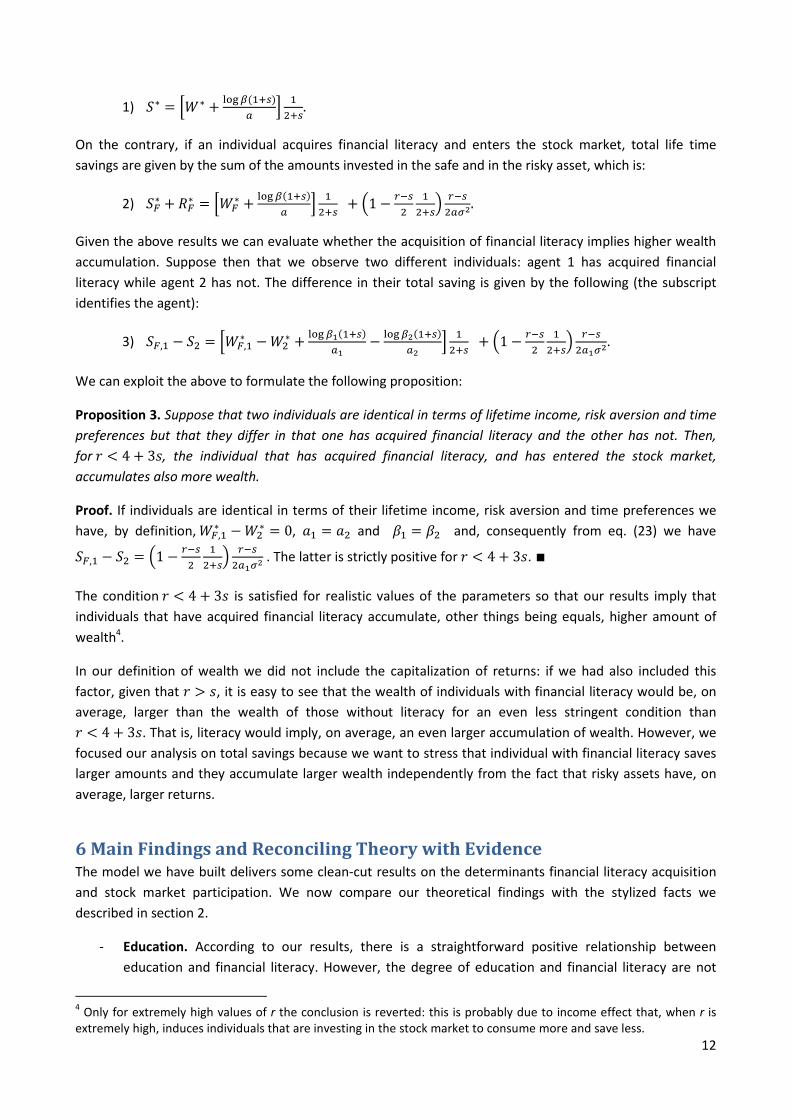
1) !∗ = 5�∗ + 678 9��/0�� : �"/0. On the contrary, if an individual acquires financial literacy and enters the stock market, total life time
savings are given by the sum of the amounts invested in the safe and in the risky asset, which is:
2) !V∗ + EV∗ = 5�V∗ + 678 9��/0�� : �"/0 + 31 − R�0" �"/04 R�0"�W�. Given the above results we can evaluate whether the acquisition of financial literacy implies higher wealth
accumulation. Suppose then that we observe two different individuals: agent 1 has acquired financial
literacy while agent 2 has not. The difference in their total saving is given by the following (the subscript
identifies the agent):
3) !V,� − !" = 5�V,�∗ − �"∗ + 678 9���/0��� − 678 9���/0��� : �"/0 + 31 − R�0" �"/04 R�0"��W�.
We can exploit the above to formulate the following proposition:
Proposition 3. Suppose that two individuals are identical in terms of lifetime income, risk aversion and time
preferences but that they differ in that one has acquired financial literacy and the other has not. Then,
forH < 4 + 3$, the individual that has acquired financial literacy, and has entered the stock market,
accumulates also more wealth.
Proof. If individuals are identical in terms of their lifetime income, risk aversion and time preferences we
have, by definition,�V,�∗ − �"∗ = 0, �� = �" and � = " and, consequently from eq. (23) we have
!V,� − !" = 31 − R�0" �"/04 R�0"��W� . The latter is strictly positive forH < 4 + 3$. ∎
The conditionH < 4 + 3$ is satisfied for realistic values of the parameters so that our results imply that
individuals that have acquired financial literacy accumulate, other things being equals, higher amount of
wealth4.
In our definition of wealth we did not include the capitalization of returns: if we had also included this
factor, given that H > $, it is easy to see that the wealth of individuals with financial literacy would be, on
average, larger than the wealth of those without literacy for an even less stringent condition than H < 4 + 3$. That is, literacy would imply, on average, an even larger accumulation of wealth. However, we
focused our analysis on total savings because we want to stress that individual with financial literacy saves
larger amounts and they accumulate larger wealth independently from the fact that risky assets have, on
average, larger returns.
6 Main Findings and Reconciling Theory with Evidence The model we have built delivers some clean-cut results on the determinants financial literacy acquisition
and stock market participation. We now compare our theoretical findings with the stylized facts we
described in section 2.
- Education. According to our results, there is a straightforward positive relationship between
education and financial literacy. However, the degree of education and financial literacy are not
4 Only for extremely high values of r the conclusion is reverted: this is probably due to income effect that, when r is
extremely high, induces individuals that are investing in the stock market to consume more and save less.
13
perfectly correlated as the field of study (represented by z in our model) is also a key determinant.
This is in line with the observed facts that schooling exerts a positive effect on financial knowledge
although with a wide variability of financial literacy for a given level of schooling attainment and
with literacy having an effect that goes beyond mere education level. Our model also indicates that
education systems that are more effective in providing human capital (i.e. higher x) not only
improve human capital accumulation, but also capital market participation and financial literacy
acquirement.
- Numeracy and math scores. Within our model, individuals that have developed good abilities in
these fields can be thought as having a higher z and thus, they should be more likely to acquire
financial literacy, which is line with observed evidence.
- Income. Our results display a complex relationship between income and literacy, a relationship that
can be broken down in three components. First, both income and literacy are positively influenced
by education: this component implies a positive correlation but not a causal relationship between
income and literacy. Beyond this correlation, however, we have a second component that is due to
the fact risk aversion is decreasing income and thus, individuals with higher income would like to
buy a higher amount of stocks and, consequentially, they find more convenient to acquire literacy
in order to enter the stock market: therefore, this component implies then a causal positive
relationship between income and literacy. Finally, higher income also implies higher opportunity
costs and this induces a negative effect of income on the incentives to acquire financial literacy.
Our model allows us to determine the overall effect of the latter two components and in particular
we have that for � ≥ 1 (that is, when relative risk aversion is non-increasing in income) the overall
effect is non-negative whereas it is negative otherwise. Consequentially, if we consider all the three
components we can be certain that for � ≥ 1 income and literacy are positively correlated
whereas for � < 1 the sign of the relationship is undetermined. The assumption that relative risk
aversion is non-increasing in income is usually the most realistic one (see MasColell et al. 2006,
chapter 6) and thus, our model fully explains the observed positive correlation. Further empirical
analysis aimed at disentangling the role of income from that of education would however be
helpful to shed further lights on the ultimate nature of the relationship between these two factors.
- Employment condition. Individuals that are employed in sectors close to the business one are likely
to have acquired forms of human capital which display higher complementarities with financial
knowledge. In analytical terms, this implies higher z and thus, they should be more likely to acquire
financial literacy. Similarly, self-employed should have higher z and, given the entrepreneurship
nature of self-employment, they should probably have lower risk aversion (higher � in our model)
further implying a higher probability of acquiring literacy. This mechanism is in line with the
observed evidence.
- Gender. Our model does not include any gender differences and as such, it cannot account for
gender gaps. However, our model shows how higher risk aversion reduces the incentive to acquire
financial literacy. Given that there exists some evidence that female individuals have higher risk
aversion (see Borghans et al. 2009) and are less likely to take risks in financial investments (see
Powell and Ansic 1997), this could explain the gender differences in financial literacy. Further
empirical analyses are in any case needed to discern whether risk aversion fully explains the gender
gap or if a “pure” gender effect is present.
- Wealth. Our analysis shows that, for realistic values of the parameters, individuals that have
acquired financial literacy accumulate, other things being equal, larger amounts of wealth. This
result is due to the fact that these individuals save larger amounts and is therefore even more true
if the access to stock market grants returns that are, on average, higher. These implications fit well
14
with observed evidence: in fact, Lusardi et al. 2007 shows that once we control for age, education
and income, financial literacy affect positively wealth accumulation and several empirical analyses
stress how individuals with literacy are more likely to plan to save more generously for their
retirement.
- Stock Market Participation. Our model strongly relates the participation to stock markets to the
acquisition of financial literacy. As such education and income, influencing literacy, also increase
the likelihood to acquire stocks, something that has been observed in reality. Moreover, we
highlight how schooling attainment alone is not enough to explain participation as the field of study
is also a key determinant in participating in the stock market. Finally, and somehow obviously, risk
aversion reduces the likelihood to acquire stocks. All these theoretical results find confirmation in
the empirical evidence on stock market participation.
- The attractiveness of risky assets. Within our model, the more attractive (in terms of returns and
volatility) the risky assets are, the larger the incentives to acquire financial literacy are. This aspect
has not been explored empirically and it would be interesting to assess it, possibly exploiting
differences in the attractiveness of financial markets of different countries.
6 Conclusions In the present paper we have built a model that encompasses in a unified framework human capital
investment, financial literacy acquirement, saving behavior and participation to the stock market. Our
model seems to give precise account on the effects that education, field of study, income and employment
conditions have on financial literacy and stock market participation. In addition, even if we do not include it
directly in our model, the observed effect of gender can find a rationale within the framework we propose.
Some of our theoretical results actually stimulate further empirical analysis: a first empirical implication is
that individuals or countries with education systems that perform better in accumulating human capital
should also have higher levels of financial literacy and higher participation rates to stock markets. A second
empirical implication is that individuals from countries with education systems that allow for basic financial
education should display higher participation rates to the stock market or higher financial literacy. Finally, it
would be interesting to explore to what extent institutional factors such as gender wage-gap or more
attractive capital markets can further explain differences in financial literacy attainment or stock market
participation among individuals and countries. All these empirical implications are left for future empirical
research.

15
APPENDIX A – Optimal levels of human capital and investment in safe and
risky assets We derive here the optimal levels ℎ∗ and!∗ as given, respectively, by eqs. (9) and (10) and the optimal
levels ℎV∗ , EV∗ and !V∗ as given, respectively, by eqs. (15), (17) and (18).
A.1 Derivation ofg∗ andh∗
Consider the optimization problemmax(,* −���+,(���(-��*. − ���+*��/0�.. The f.o.c imply
A1) ij�kMCKlmL�Mm-OMnP�9kMC+n��;<�.o
i( = 0 ⇒ ��ℎ+1 − �1 + q�ℎ�.���+,(���(-��*. = 0
and
A2)ij�kMCKlmL�Mm-OMnP�9kMC+n��;<�.oi* = 0 ⇒ ����+,(���(-��*. − ��1 + $����+*��/0�. = 0.
From (A1) we obtain ℎ∗:
A3)ℎ∗ = 3 ��/�4�- . ∎
and from (A3), inserting ℎ∗, we obtain !∗:
A4)!∗ = 5�ℎ∗�1 − ℎ∗�� + 678 9��/0�� : �"/0.∎
A.2 Derivation ofgr∗ , sr∗ and hr∗
Consider the optimization problemmax(,*,J −���K,(L�(-/(�MNO�*�JP − ���Q*��/0�/J��/R��CS�T�� U
. The
f.o.c imply
A5)
tuvwMxMCKlmLm�MNMm-OMnMTPMBxMCyn��;<�;T��;Z�MCS�T�� z
{|}
tm = 0 ⇒
��+�2 − b�ℎ��� − �1 + q�ℎ�.���K,(L(�MN�(-O�*�JP = 0;
A6)
tuvwMxMCKlmLMm-;m�MNOMnMTPMBxMCyn��;<�;T��;Z�MCS�T�� z
{|}
tn = 0 ⇒
����+,(L�(-/(�MNO�*�J. = ��1 + $����Q*��/0�/J��/R���W�J�" U; and
A7)
tuvwMxMCKlmLMm-;m�MNOMnMTPMBxMCyn��;<�;T��;Z�MCS�T�� z
{|}
tT = 0 ⇒
����K,(L�(-/(�MNO�*�JP = �+�1 + H� − �I"E.���Q*��/0�/J��/R���W�J�" U.

16
From (A5) we obtainℎV∗ :
A8)ℎV∗ = 3"���/�4 �-M�;N.∎
Moreover, combining (A6) and (A7) we obtainEV∗ :
A9) EV∗ = R�0�W�. ∎
Finally, inserting (A9) in (A6) we obtain!V∗:
A10) !V∗ = 5�V∗ + 678 9��/0�� − 32 + R/0" 4 R�0�W�: 3 �"/04 . ∎
APPENDIX B – Proof of Proposition 2 We prove here Proposition 2. From inequality (20a) we know that individuals acquire financial literacy and
enter the stock market if �∗ − �V∗ is lower than ��/0 �R�0��"�W� . Here we prove that �∗ − �V∗ is a decreasing
function of x and z and, therefore, individuals with higher x or z are more likely to acquire financial literacy
and enter the stock market.
Formally, we need to prove that
B1) i�>∗�>Y∗�i� < 0
and
B2)i�>∗�>Y∗�i� < 0.
Preliminarily, we define the following:
B3) � ≡ ��;-
B4) � ≡ �MN�;-
B5) ���� = ln � + 1 � �
B6) ���� = � ��M�
B7) ℎ��� = ��������. Note that by definition, we have that 0 < � < � < 1 and that, for� > 0, ���� > 0 andℎ��� > 0.
Starting from eq. (11) and given definition (B3), we have
B8) �∗ = � 31 − ��/�4 3 ��/�4�- = ��1 − ����� ��M�.

17
Similarly, starting from eq. (16) and given definition (B3) and (B4) we have
B9) �V∗ = � 31 − "���/�4 3"���/�4 �MN-M�;N = ��1 − ����� ��M�
�V∗ = � �1 − 2 − b1 + q� �2 − b1 + q� "�����/� = ��1 − ������ ����
We now present four lemmas and we use them to prove eqs. (B1) and (B2).
Lemma 1 The following properties hold true: � > 0 ⇒ ���� ≤ 0 and� > 0 ∩ � ≠ 1 ⇒ ���� < 0. Proof. Starting from definition (B5), we have that
i����i� = i�6� �/����i� = �� − 1. Therefore i+����.i� is positive
for y<1, zero for y=1 and negative for y>1. It follows that ���� has a global maximum for y=1. We have then
that max� ���� = ��1� = 0 which implies that ���� ≤ 0. Moreover, given that ���� is zero only for y=1,
we also have that ���� < 0∀� > 0 ∩ � ≠ 1.∎
Lemma 2. The following property holds true: � > 0 ∩ � ≠ 1 ⇒ i����i� < 0. Proof. From definition (B5) and (B6) we computei����i� = � ��M��6� �/���������� = � ��M����������� . From Lemma 1 we
know that���� > 0∀� > 0 ∩ � ≠ 1, thus: i����i� < 0∀� > 0 ∩ � ≠ 1. ∎
Lemma 3. The following property holds true: 1/� < ���� < ����. Proof. Given that0 < � < � < 1, from Lemma 2 we necessarily have���� < ����. Moreover, given
Lemma 2, the infimum of ���� is obtained for the supremum of p, which, given the definition of p, is
obtained for z=0 andq → 1. Therefore,inf ���� = lim�⟶� 3 "�/�4�;--M� . We prove now that
lim�⟶� 3 "�/�4�;--M� = 1/�. We define � ≡ ����/� and rearranging lim�⟶� 3 "
�/�4�;--M�
we obtain lim�⟶� y31 +��4
��z��
that, by definition, is equal to1/�. We then have 1/� < ���� < ����.∎
Lemma 4. The following property holds true: 0 < � ≤ � ⇒ i(���i� < 0.
Proof. From definitions (B5), (B6) and (B7) we compute i(���i� = (���t����t� +�/6� ����.
� . For 0 < � ≤ � we know:
i) by definition, that y>0 and h(y)>0 are positive; ii) from Lemma 2, that i����i� < 0; and iii) from Lemma 3,
that +1 + ln ����. > 0. Therefore we necessarily have that, for 0 < � ≤ �, i(���i� < 0. ∎
We use now the four lemmas to prove (B1) and (B2).
18
Proof of A1. We can rearrange i�>∗�>Y∗�i� asi�>∗�>Y∗�i� = 3i>∗
i� i�i� − i>Y∗i� i�i�4. From the latter, using
definition (B3), and (B4) and eqs. (B8) and (B9), we obtain i�>∗�>Y∗�i� = −�� �� ��M� ln � ��M� − � ��M� ln � ��M��
and, from definitions (B6) and (B7), we
obtaini�>∗�>Y∗�i� = −��Kln �������� − ln ��������P = −��+ln ℎ��� − ln ℎ���.. Consider now +ln ℎ��� −ln ℎ���.: we know from Lemma 4 that 0 < � ≤ � ⇒ i(���i� < 0 and given that � < � it follows that
ℎ��� > ℎ��� and +ln ℎ��� − ln ℎ���. > 0. Then i�>∗�>Y∗�i� = −��+ln ℎ��� − ln ℎ���. < 0. ∎
Proof of A2. We can rearrange i�>∗�>Y∗�i� as
i�>∗�>Y∗�i� = 3i>∗i� i�i� − i>Y∗i� i�i�4. From the latter, given that
i�i� = 0 and given eq. (B9), we obtaini�>∗�>Y∗�i� = −� � ��M���� i�i� ln �. From definition (B4) we have that
i�i� = −� < 0 and since 0<p<1 we have that−� � ��M���� i�i� ln � < 0.∎
APPENDIX C – Financial literacy costs equation and the optimal financial
literacy In this appendix we provide a micro-foundation for eq. (6), which describes the opportunity costs that
individuals face when entering financial market. The basic idea is that investments in risky assets are
complex and they require time to evaluate, choose and keep track of the assets. Moreover, the time lost in
this process depends, inversely, on the financial literacy of individuals. Therefore, individuals choosing to
invest in risky assets may find convenient to invest part of their time also to acquire financial literacy to
abate, through this, the time lost to participate to the financial market.
In particular, we show here that eq. (6) can be seen as the opportunity costs to enter the financial market
once individuals have chosen, optimally, financial literacy.
Our assumption is that the time lost to participate to the financial markets is made of two components. The
first one represents the time lost to evaluate, choose and track the risky assets and it thus depends
inversely on the level of financial literacy L: in particular, we assume that the time lost for this reason, q, is
given by the following function
C1) � = 1 − 2
which is clearly decreasing in the level of financial literacy.
In addition, individuals can invest part of their time to acquire financial literacy and this makes up the
second component related to the time lost when entering financial markets. In particular, we assume that
individuals that invest f units of time to acquire literacy obtain the latter according to the following
production function:
C2) L= ��ℎ�����/".
19
Clearly, the outcome in terms of literacy is increasing in time invested and, moreover, the marginal
productivity of time depends on the education of individuals (h) and on how useful the specific education is
in the acquisition of literacy (something that, as we have already seen, is measured by z). Basically,
individuals with higher education or with a field of study closer to finance acquire more literacy per unit of
time invested. Finally, we assume that the marginal productivity of time is decreasing.
Given these premises, the cost c to enter the financial markets is given by the sum of q and f which, from
eq. (C1) and (C2) is thus given by:
C3) c� , ℎ� = � + � = 1 − 2 + "ℎ���.
Eq. (C3) is the equivalent of eq. (6) once we explicitly consider the investment in financial literacy.
Moreover, if we allow individuals to optimally choose financial literacy L we can reformulate the
maximization problem of expected utility 1�V that individual face when investing in risky assets as follows:
C4) max(,¡,*,J −���K,(L��"¡/¡�(NM�O�*�JP − ���Q*��/0�/J��/R��CS�T�� U
.
The above maximization problem is equivalent to the one described by eq. (14) with the only difference
that individuals now also choose their optimal level of financial literacy L.
From the above maximization problem of 1�J we can obtain the optimal value ∗ of financial literacy, in
particular:
C5)i¢£Ti¡ = 0 ⇒ −��ℎ�−2 + 2 ℎ�������K,(L��"¡/¡�(NM�O�*�JP = 0.
From which we obtain:
C6) ∗ = ℎ���
which, together with eq. (C3), implies:
C7) c� ∗, ℎ� = 1 − ℎ���.
The above equation is identical to eq. (6) and it shows how the latter describe the costs to participate to
financial markets once financial literacy is chosen optimally.
Moreover, eq. (C6) directly determines the optimal degree of financial literacy chosen by individual that
invest in the financial markets, which is a positive function of education h (and thus of x) and of z.
References Alessie, R., Van Rooij, M. and Lusardi, A., 2011, "Financial literacy and retirement preparation in the
Netherlands", Journal of Pension Economics and Finance, 10(04), pp. 527-545.
Almenberg, J. and Säve-Söderbergh, J., 2011, "Financial literacy and retirement planning in Sweden",
Journal of Pension Economics and Finance, 10(04), pp. 585-598.
Anderson, A., 2013, “Trading and under-diversification”, Review of Finance, pp. 1-33.
20
Bertaut, C. C. and Haliassos, M., 1995, "Why Do So Few Hold Stocks?," Economic Journal, 105(432), pp.
1110-1129.
Borghans, L., Golsteyn, B., Heckman, J. and Meijers, H., 2009, "Gender Differences in Risk Aversion and
Ambiguity Aversion", Journal of the European Economic Association, 7(2-3), pp. 649-658. Christiansen, C., Joensen, J.S. and Rangvid J., "Are economists more likely to hold stocks?",2008, Review of
Finance", 12(3), pp. 465-496.
Crossan, D., Feslier, D., Hurnard, R., 2011, “Financial literacy and retirement planning in New Zealand",
Journal of Pension Economics and Finance, 10(04), pp. 619-635.
Bucher-Koenen, T. and Lusardi, A., 2011. "Financial literacy and retirement planning in Germany", Journal
of Pension Economics and Finance, 10(04), pp. 565-58.
Fornero, E. and Monticone, C., 2011, "Financial literacy and pension plan participation in Italy", Journal of
Pension Economics and Finance, 10(04), pp. 547-564.
Guiso, L. and Jappelli, T. 2009. "Financial literacy and portfolio diversification", CSEF Working Papers 212.
Jappelli, T., 2010, "Economic Literacy: An International Comparison", Economic Journal, 120(548), pp. 429-
451.
Jappelli, T. and Padula, M., 2011, “Investment in Financial Literacy and Saving Decisions”, CEPR Discussion
Papers 8220, Centre for Economic Policy Research.
Klapper, L. and Panos, G. A., 2011, "Financial literacy and retirement planning: the Russian case", Journal of
Pension Economics and Finance, 10(04), pp. 599-618.
Lusardi, A. and Mitchell, O. S., 2011, Financial Literacy: Implications for Retirement Security and the
Financial Marketplace, Oxford University Press, Oxford.
Lusardi, A. and Mitchell, O. S., 2011a, “Financial literacy around the world: an overview”, Journal of Pension
Economics and Finance, 10(04), pp. 497-508.
Lusardi, A. and Mitchell, O.S., 2011b, "Financial literacy and retirement planning in the United States",
Journal of Pension Economics and Finance, 10(04), pp. 509-525.
Lusardi A., Michaud, P. and Mitchell, O. S., 2011, "Optimal Financial Literacy and Saving for Retirement,"
Working Papers 905, RAND Corporation Publications Department.
Makarov, D. and Schornick, A. V., 2010, “A note on wealth effect under CARA utility, Finance Research
Letters”, 7(3), pp. 170-77.
Mas-Colell, A., Whinsthon, M. D. and Green, J. R., 1995, “Microeconomic Theory”, Oxford University Press.
Powell, M. and Ansic, D., 1997. "Gender differences in risk behaviour in financial decision-making: An
experimental analysis", Journal of Economic Psychology, 18(6), pp. 605-628.
Sekita, S., 2011, "Financial literacy and retirement planning in Japan", Journal of Pension Economics and
Finance, 10(04), pp. 637-656.

21
van Rooij, M., Lusardi, A. and Alessie, R, 2011, “Financial literacy and stock market participation”, Journal of
Financial Economics, 101(2), pp. 449-472.
Varian, H. R., 1992, Microeconomic Analysis, New York : Norton.
Vissing-Jorgensen, A., 2002, “Limited asset market participation and the elasticity of intertemporal
substitution”, Journal of Political Economics, 110, pp. 825–53.


![Optimal Financial Literacy and Saving for Retirement...individualswithbusinessassets.10 [Figure1here] Ourevidence,consistentwithotherstudies(e.g. CampbellandViceira,2002),indicates](https://img.pdfslide.us/doc/110x75/61426953d9e4dc11f47f08c4/optimal-financial-literacy-and-saving-for-retirement-individualswithbusinessassets10.jpg)