Embed Size (px)
Citation preview
2015 First Quarter Results
Ended 31st March 2015 CONFERENCE CALL
Cesena
15 May 2015
1. TREVI Group
2. 1Q 2015 Financial Results
3. Q&A
4. Appendix
2
3
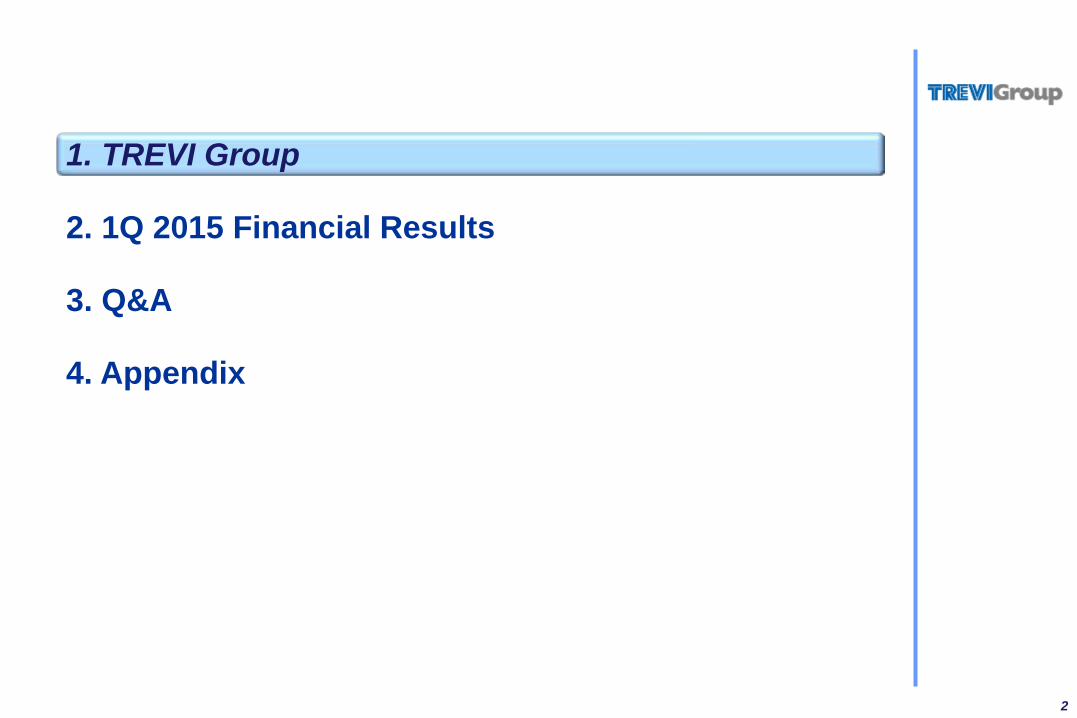
Special foundation services
€137,2m
Oil drilling rigs
€79,8m
Oil drilling services
€34,3m
Special foundation rigs
€55,1m
1Q15 Revenues
4
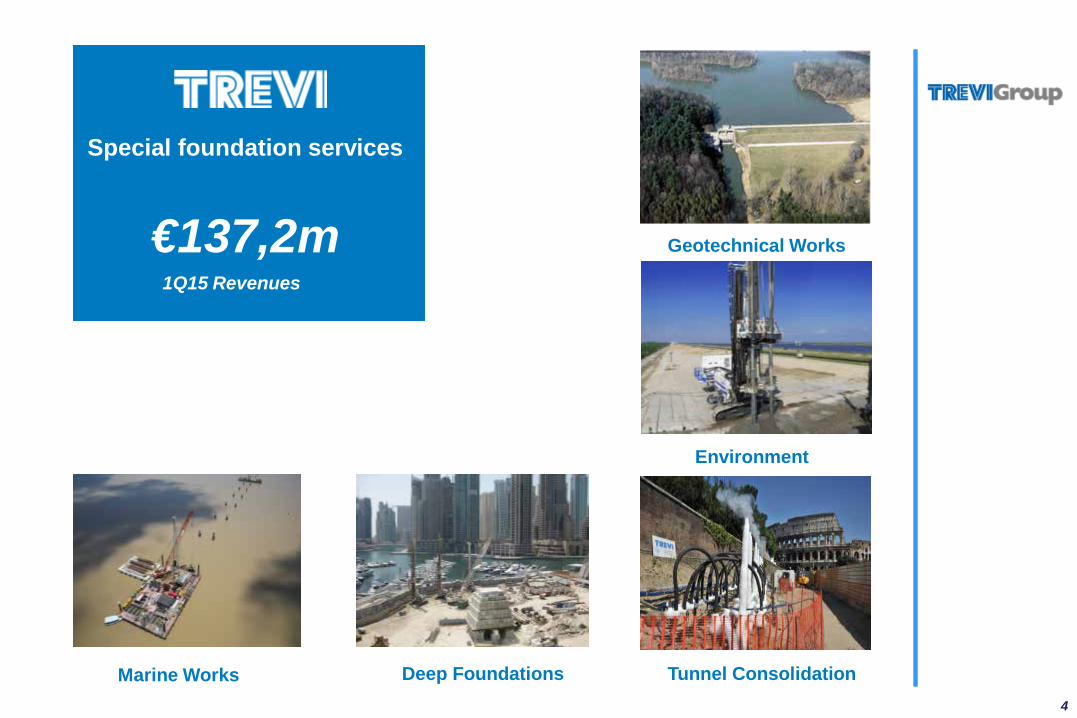
Special foundation services
€137,2m
Geotechnical Works
Marine Works Deep Foundations Tunnel Consolidation
Environment
1Q15 Revenues
5
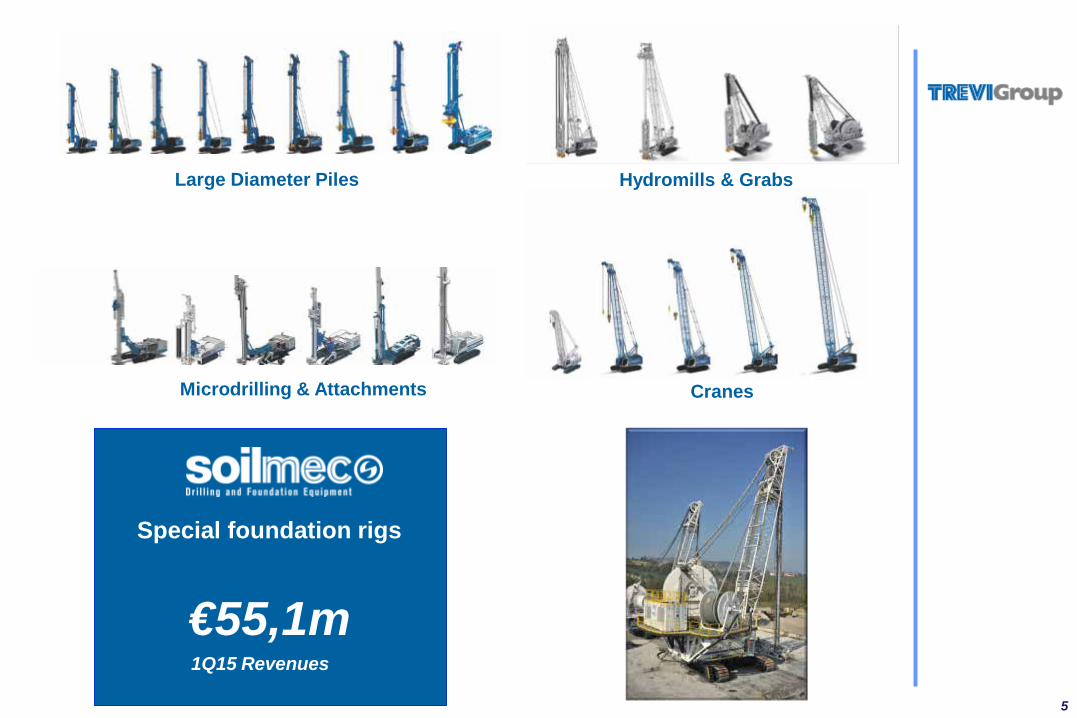
Special foundation rigs
€55,1m
Large Diameter Piles Hydromills & Grabs
Microdrilling & Attachments Cranes
1Q15 Revenues
6
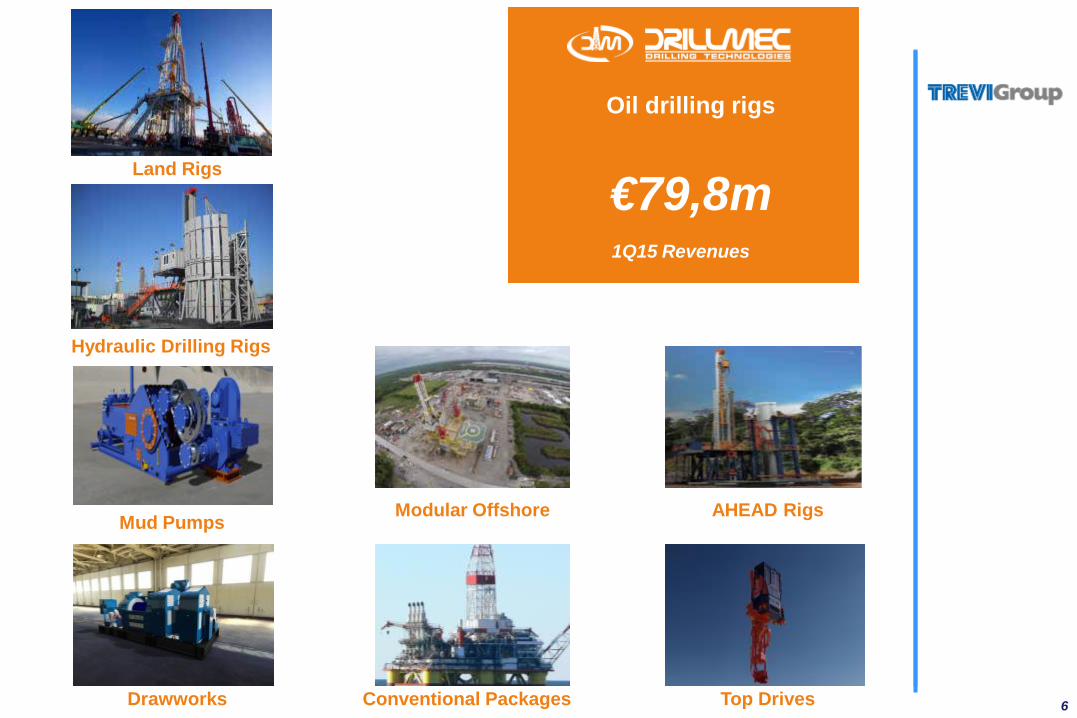
Oil drilling rigs
€79,8m Land Rigs
Hydraulic Drilling Rigs
Mud Pumps
Drawworks Top Drives
AHEAD Rigs Modular Offshore
Conventional Packages
1Q15 Revenues
7
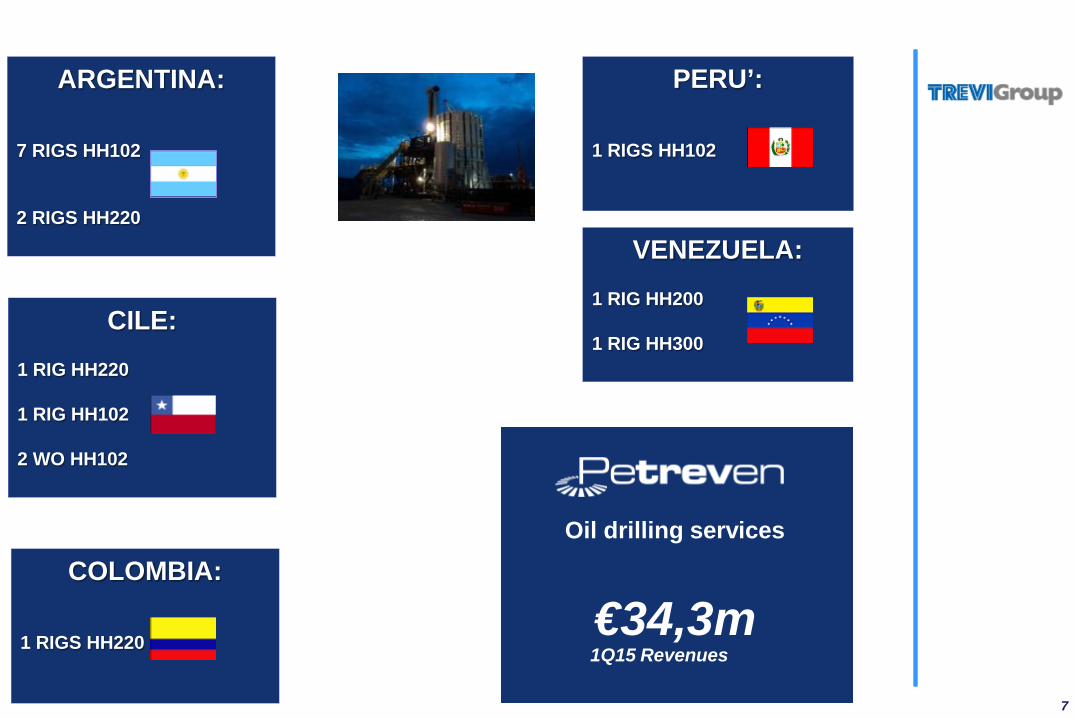
Oil drilling services
€34,3m
CILE:
1 RIG HH220 1 RIG HH102 2 WO HH102
VENEZUELA:
1 RIG HH200 1 RIG HH300
ARGENTINA:
7 RIGS HH102 2 RIGS HH220
PERU’:
1 RIGS HH102
COLOMBIA:
1 RIGS HH220
1Q15 Revenues
8
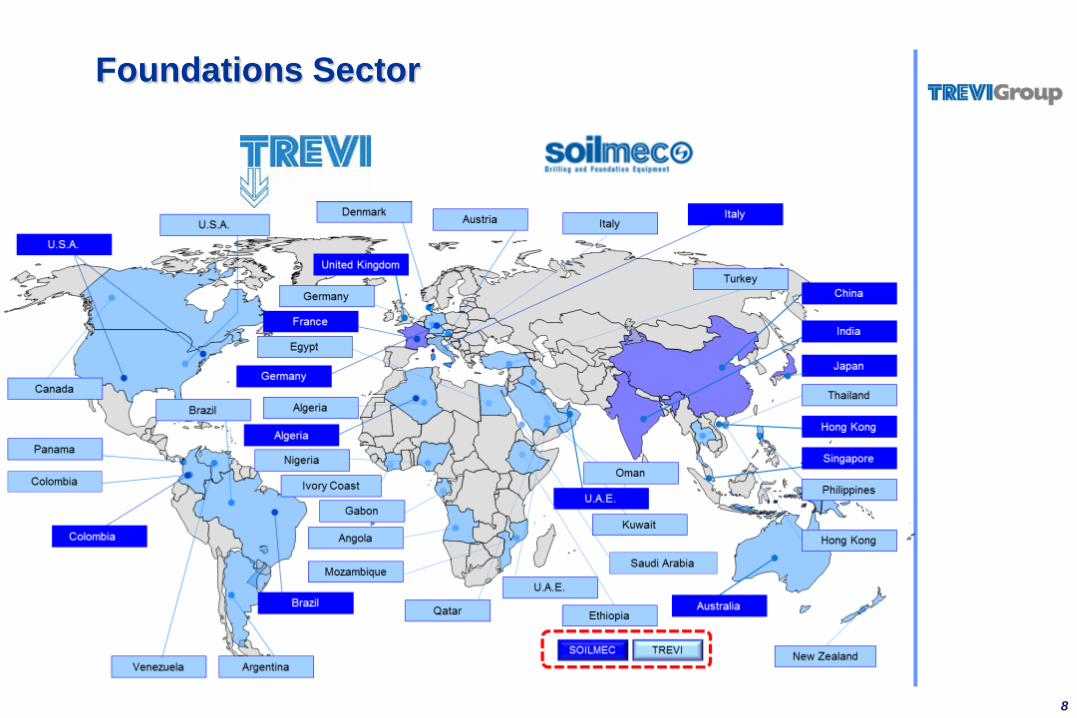
Foundations Sector
9
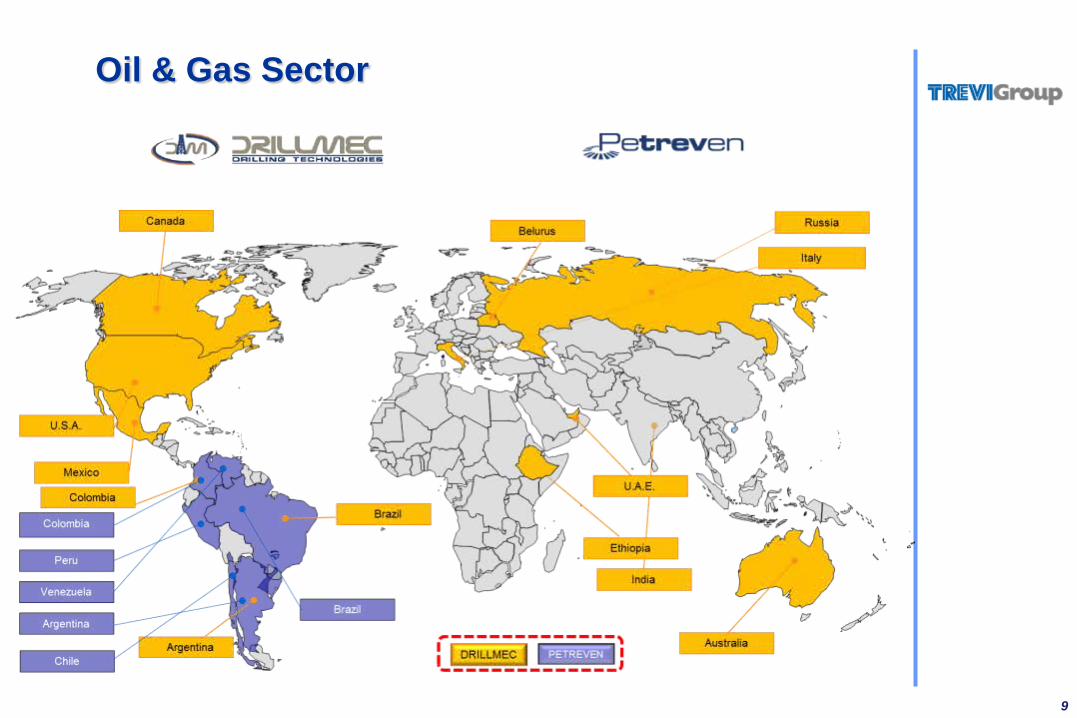
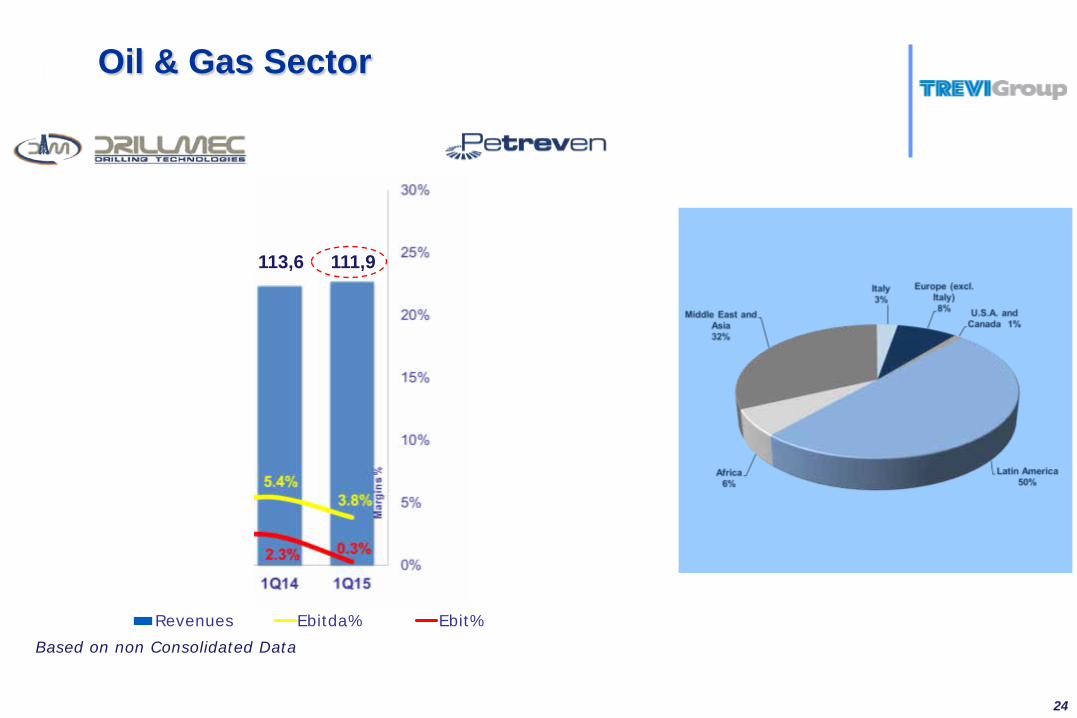
Oil & Gas Sector
1. TREVI Group
2. 1Q 2015 Financial Results
3. Q&A
4. Appendix
10
11
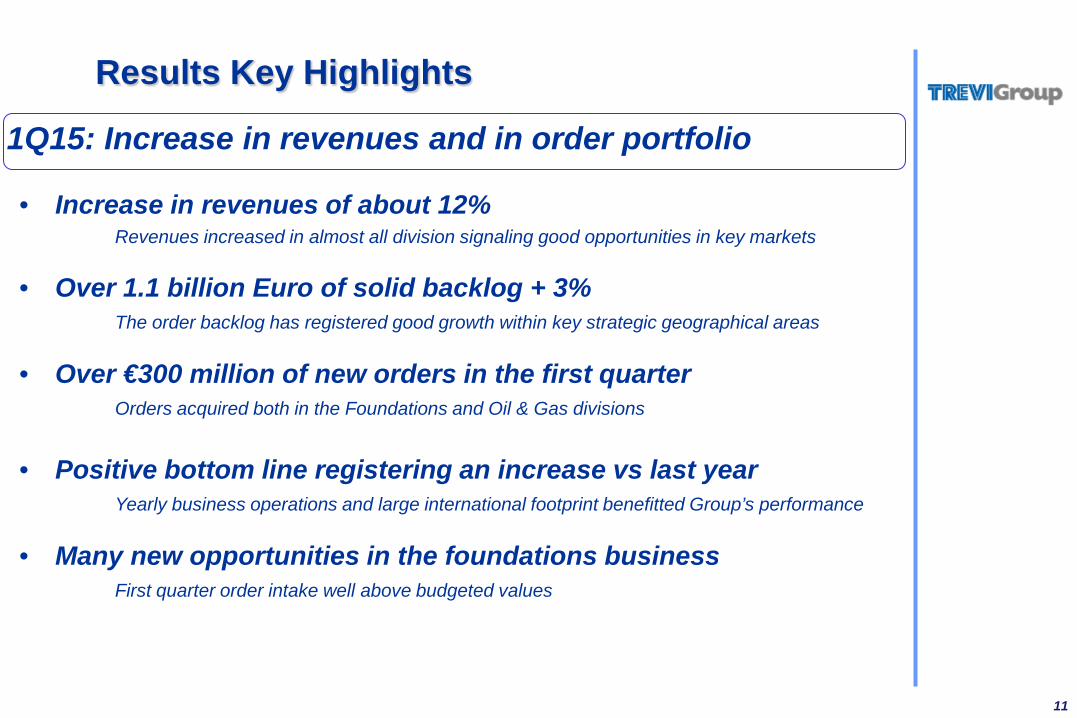
Results Key Highlights
• Increase in revenues of about 12% Revenues increased in almost all division signaling good opportunities in key markets • Over 1.1 billion Euro of solid backlog + 3% The order backlog has registered good growth within key strategic geographical areas • Over €300 million of new orders in the first quarter Orders acquired both in the Foundations and Oil & Gas divisions
• Positive bottom line registering an increase vs last year Yearly business operations and large international footprint benefitted Group’s performance
• Many new opportunities in the foundations business First quarter order intake well above budgeted values
1Q15: Increase in revenues and in order portfolio
12
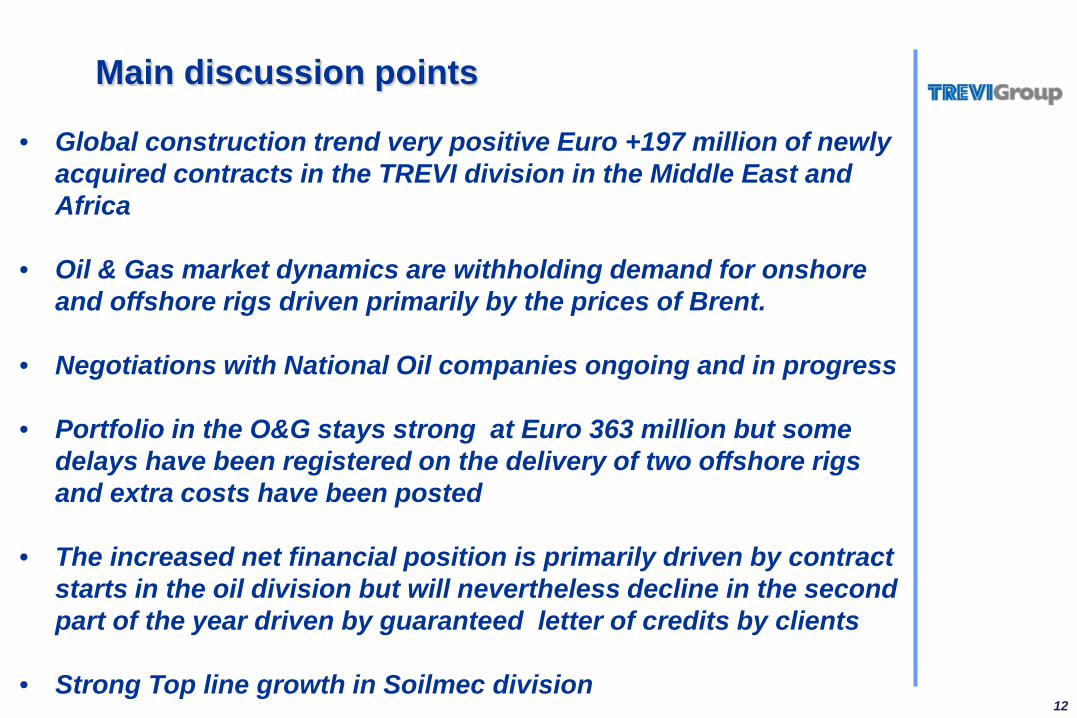
• Global construction trend very positive Euro +197 million of newly
acquired contracts in the TREVI division in the Middle East and Africa
• Oil & Gas market dynamics are withholding demand for onshore
and offshore rigs driven primarily by the prices of Brent.
• Negotiations with National Oil companies ongoing and in progress
• Portfolio in the O&G stays strong at Euro 363 million but some delays have been registered on the delivery of two offshore rigs and extra costs have been posted
• The increased net financial position is primarily driven by contract starts in the oil division but will nevertheless decline in the second part of the year driven by guaranteed letter of credits by clients
• Strong Top line growth in Soilmec division
Main discussion points
13
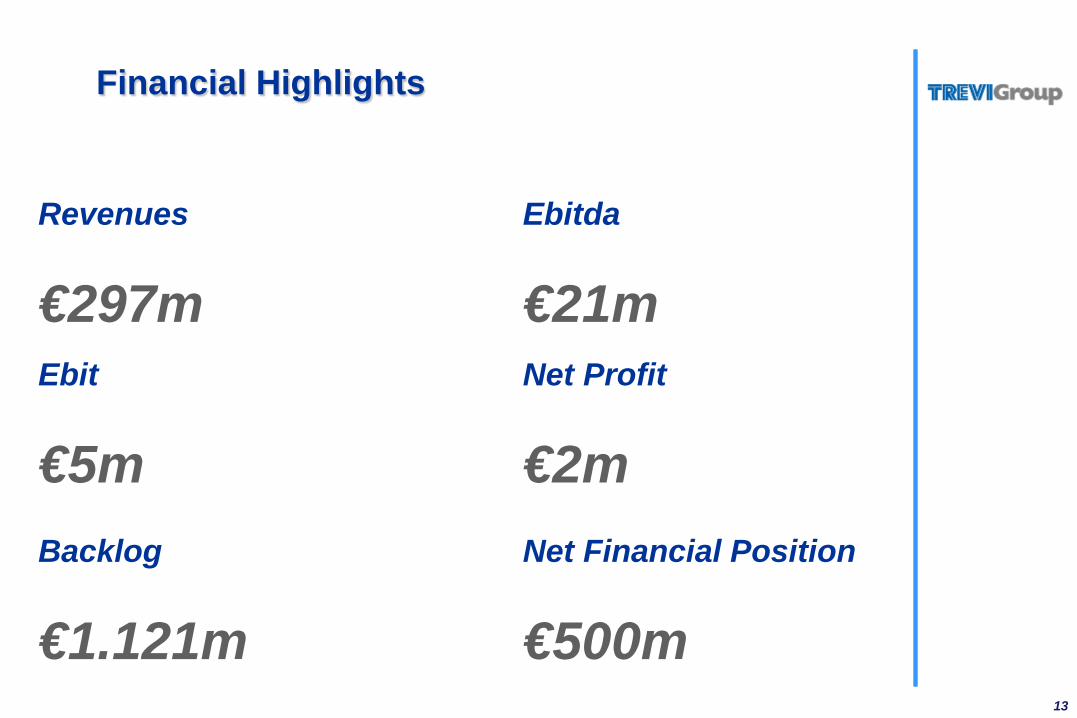
Financial Highlights
Revenues
€297m
Ebitda
€21m Ebit
€5m Backlog
€1.121m
Net Profit
€2m Net Financial Position
€500m
14
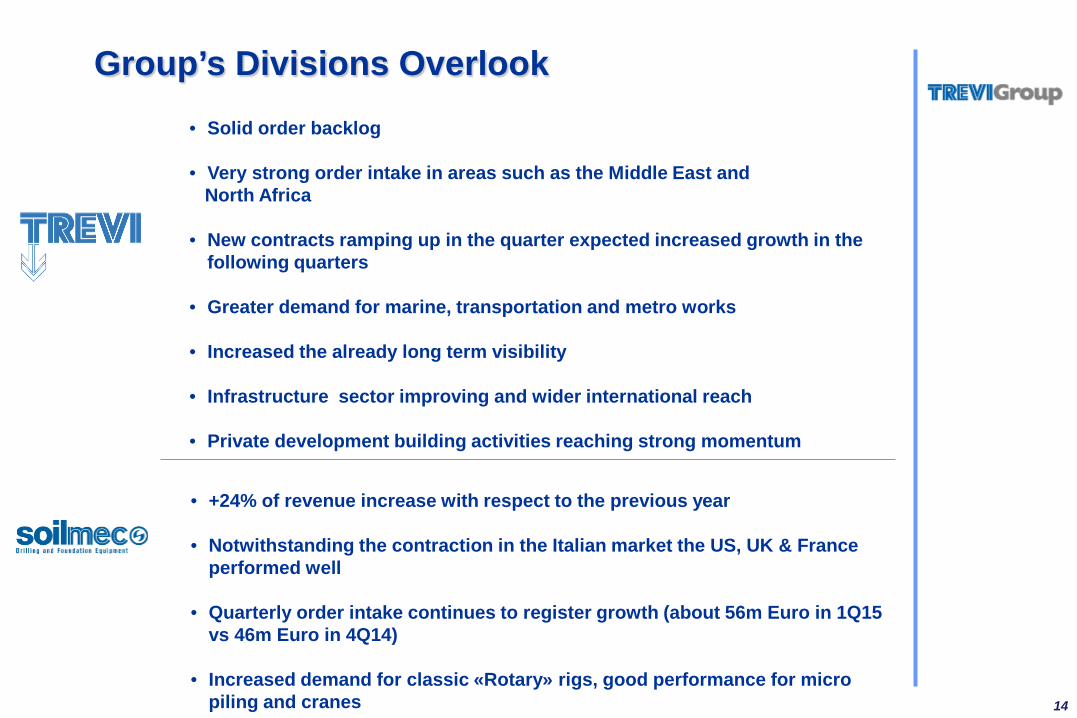
• Solid order backlog
• Very strong order intake in areas such as the Middle East and North Africa • New contracts ramping up in the quarter expected increased growth in the
following quarters
• Greater demand for marine, transportation and metro works • Increased the already long term visibility • Infrastructure sector improving and wider international reach
• Private development building activities reaching strong momentum
Group’s Divisions Overlook
• +24% of revenue increase with respect to the previous year
• Notwithstanding the contraction in the Italian market the US, UK & France performed well
• Quarterly order intake continues to register growth (about 56m Euro in 1Q15 vs 46m Euro in 4Q14)
• Increased demand for classic «Rotary» rigs, good performance for micro piling and cranes
15
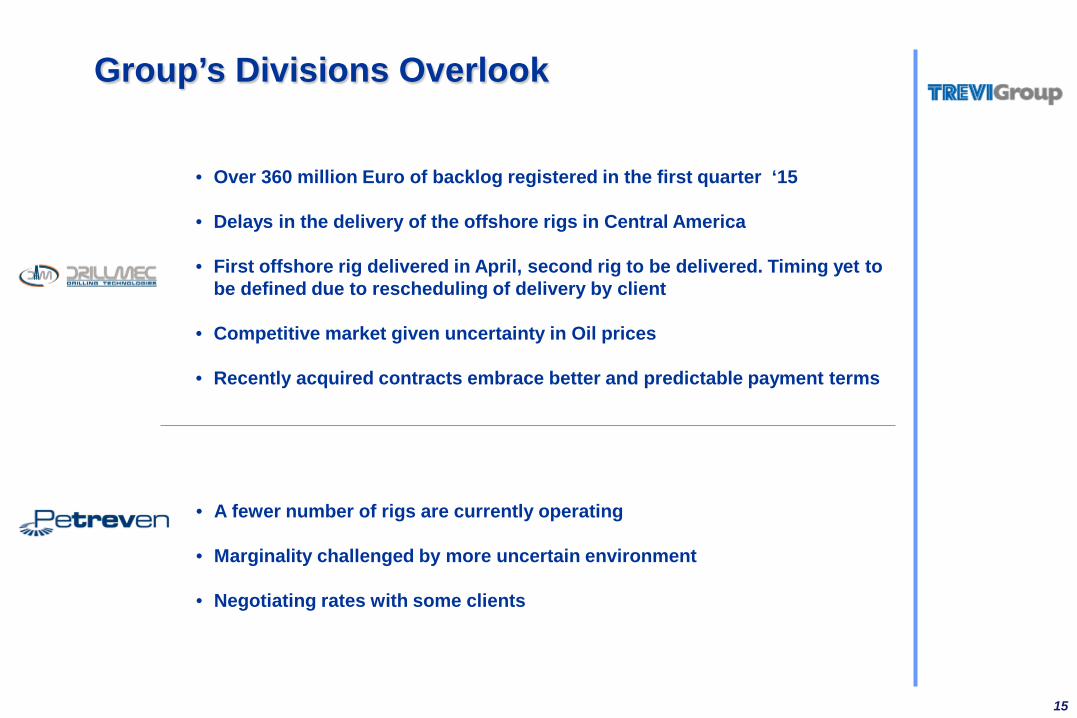
Group’s Divisions Overlook
• Over 360 million Euro of backlog registered in the first quarter ‘15
• Delays in the delivery of the offshore rigs in Central America
• First offshore rig delivered in April, second rig to be delivered. Timing yet to be defined due to rescheduling of delivery by client
• Competitive market given uncertainty in Oil prices
• Recently acquired contracts embrace better and predictable payment terms
• A fewer number of rigs are currently operating
• Marginality challenged by more uncertain environment
• Negotiating rates with some clients
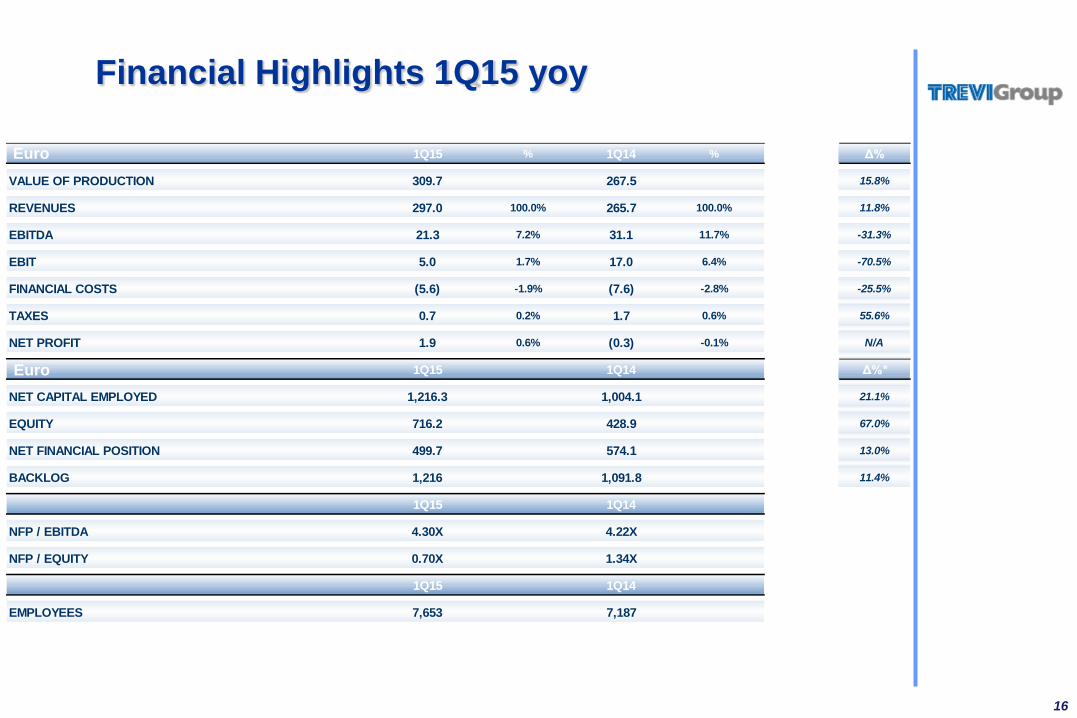
1Q15 % 1Q14 % Δ%
VALUE OF PRODUCTION 309.7 267.5 15.8%
REVENUES 297.0 100.0% 265.7 100.0% 11.8%
EBITDA 21.3 7.2% 31.1 11.7% -31.3%
EBIT 5.0 1.7% 17.0 6.4% -70.5%
FINANCIAL COSTS (5.6) -1.9% (7.6) -2.8% -25.5%
TAXES 0.7 0.2% 1.7 0.6% 55.6%
NET PROFIT 1.9 0.6% (0.3) -0.1% N/A
1Q15 1Q14 Δ%*
NET CAPITAL EMPLOYED 1,216.3 1,004.1 21.1%
EQUITY 716.2 428.9 67.0%
NET FINANCIAL POSITION 499.7 574.1 13.0%
BACKLOG 1,216 1,091.8 11.4%
1Q15 1Q14
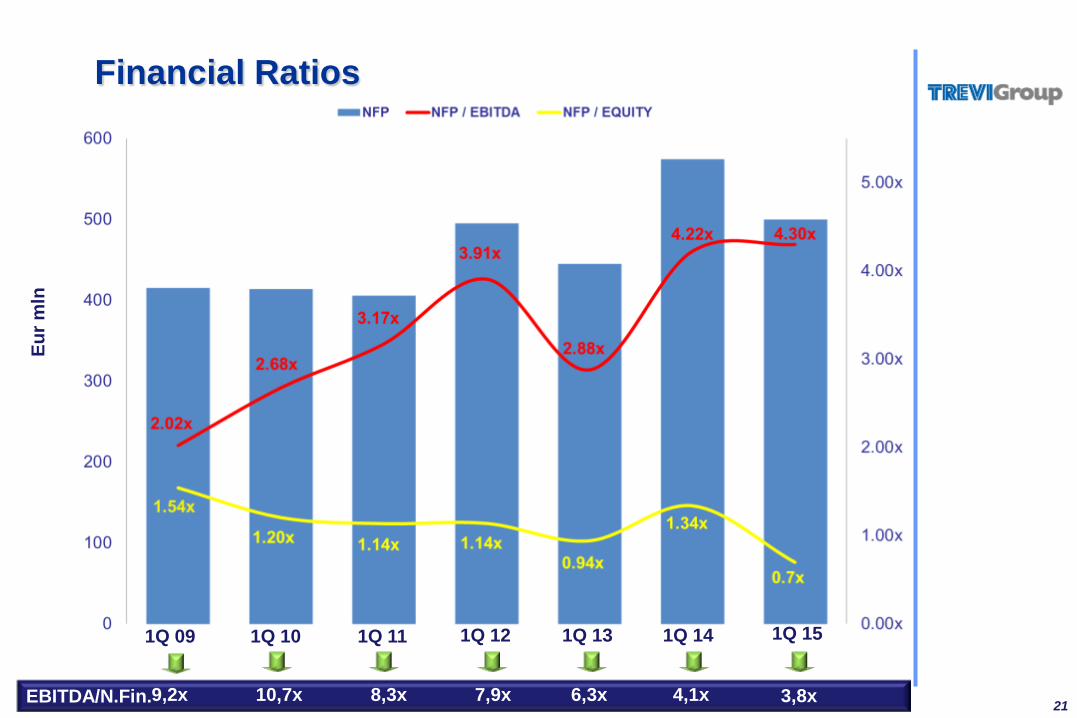
NFP / EBITDA 4.30X 4.22X
NFP / EQUITY 0.70X 1.34X
1Q15 1Q14
EMPLOYEES 7,653 7,187
16
Financial Highlights 1Q15 yoy
Euro
Euro
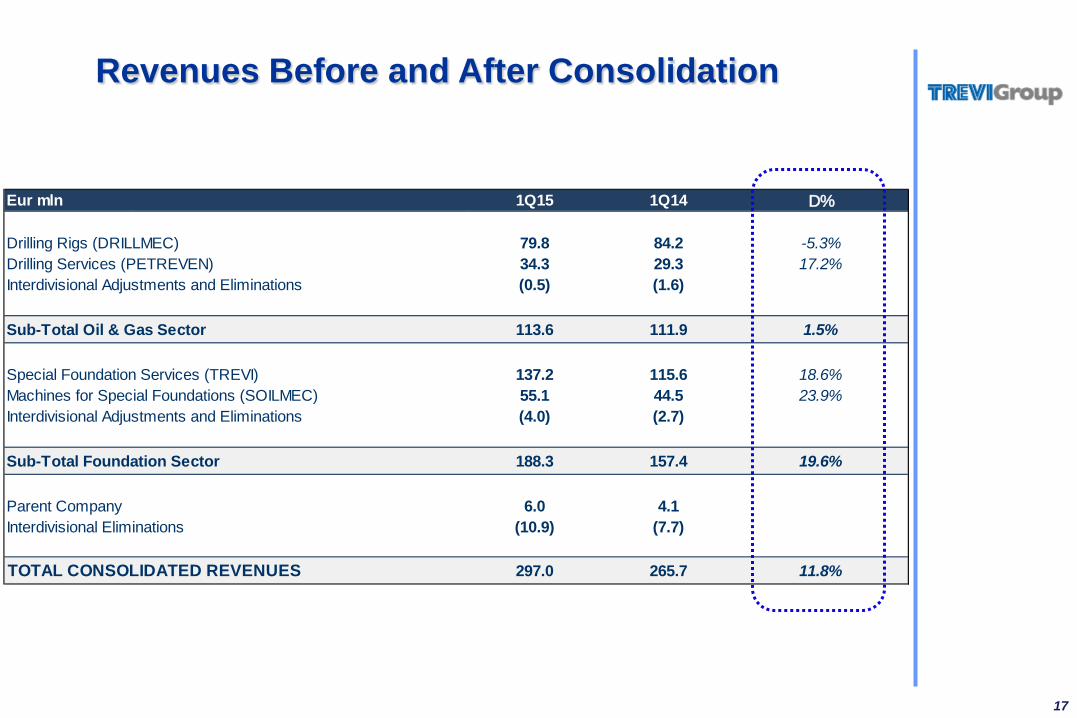
Eur mln 1Q15 1Q14 D%
Drilling Rigs (DRILLMEC) 79.8 84.2 -5.3%Drilling Services (PETREVEN) 34.3 29.3 17.2%Interdivisional Adjustments and Eliminations (0.5) (1.6)
Sub-Total Oil & Gas Sector 113.6 111.9 1.5%
Special Foundation Services (TREVI) 137.2 115.6 18.6%Machines for Special Foundations (SOILMEC) 55.1 44.5 23.9%Interdivisional Adjustments and Eliminations (4.0) (2.7)
Sub-Total Foundation Sector 188.3 157.4 19.6%
Parent Company 6.0 4.1Interdivisional Eliminations (10.9) (7.7)
TOTAL CONSOLIDATED REVENUES 297.0 265.7 11.8%
17
Revenues Before and After Consolidation
18
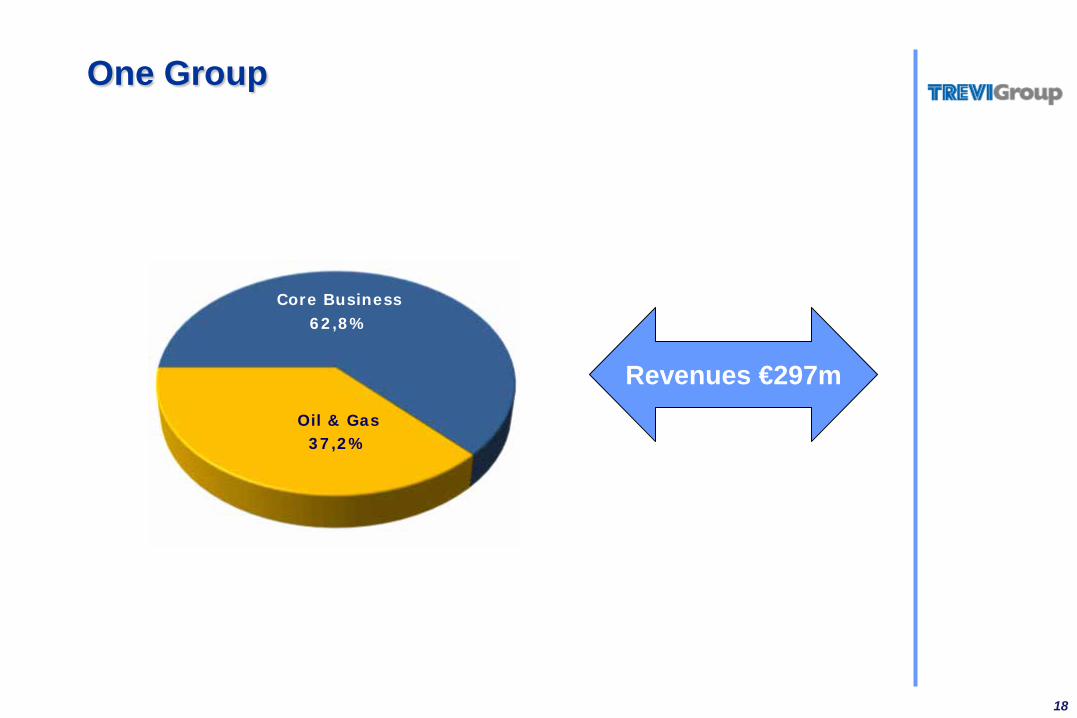
One Group
Oil & Gas 37,2%
Core Business 62,8%
Revenues €297m
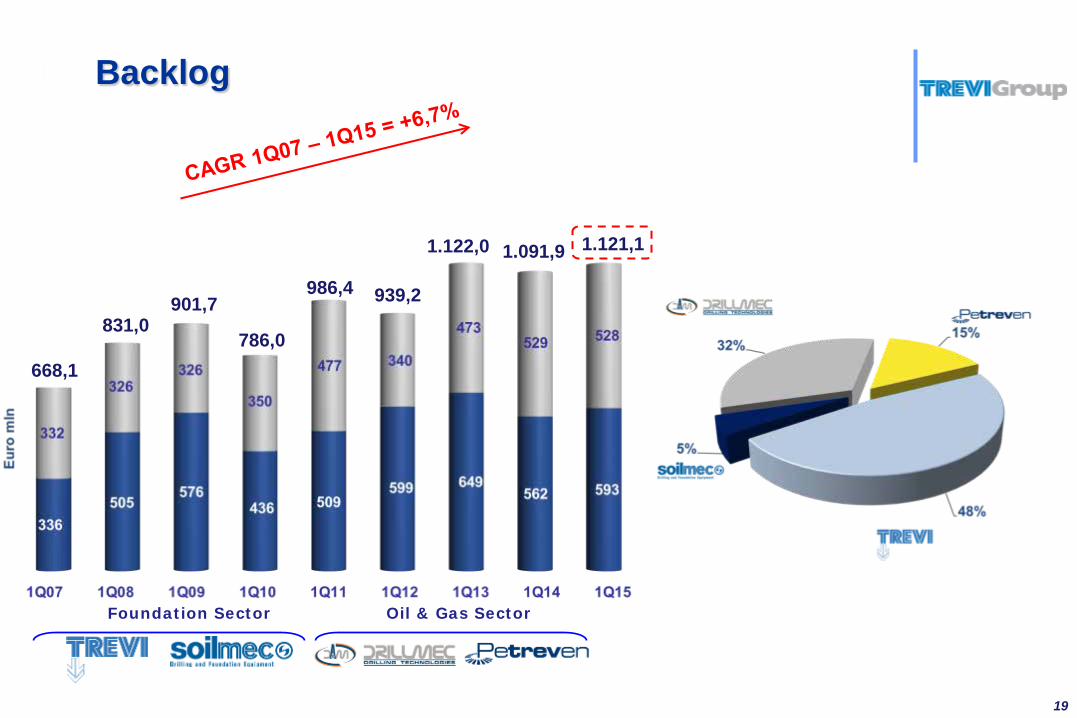
The Group Backlog
Foundation Sector Oil & Gas Sector
19
668,1
901,7 831,0
786,0
986,4 939,2
1.122,0 1.091,9 1.121,1
20
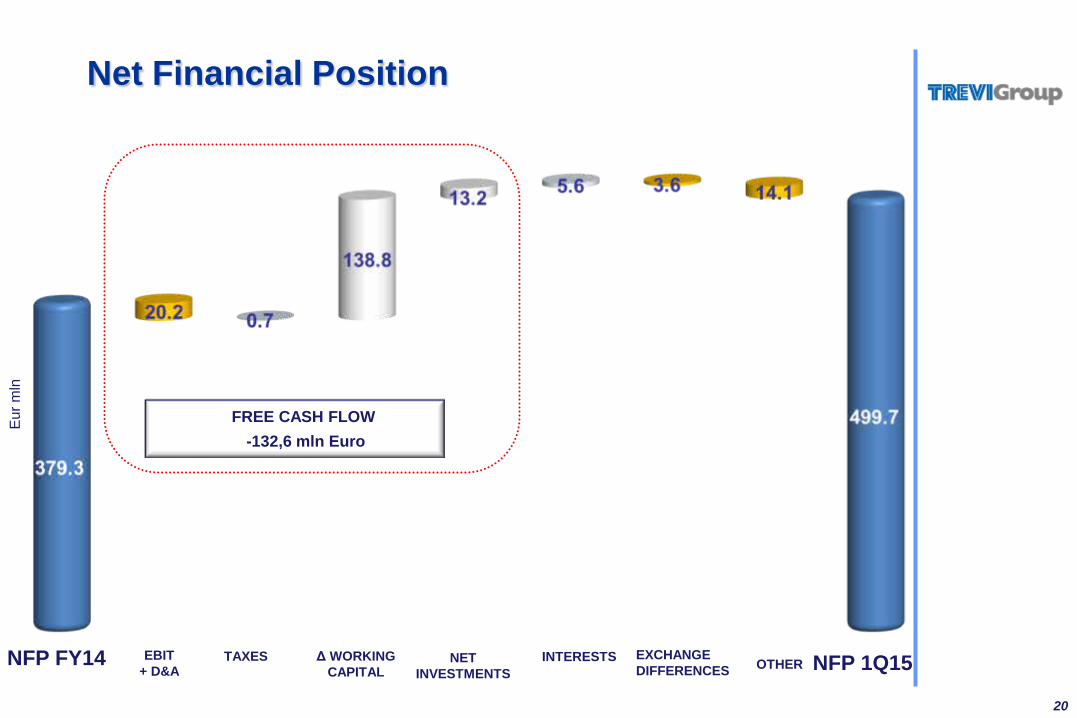
Net Financial Position
NFP 1Q15 NFP FY14 EBIT + D&A
Eur m
ln
NET INVESTMENTS
INTERESTS EXCHANGE DIFFERENCES OTHER TAXES Δ WORKING
CAPITAL
FREE CASH FLOW -132,6 mln Euro
21
Financial Ratios Eu
r mln
1Q 11 1Q 12 1Q 13 1Q 14 1Q 15 1Q 10 1Q 09
EBITDA/N.Fin. 3,8x 4,1x 6,3x 7,9x 8,3x 10,7x 9,2x
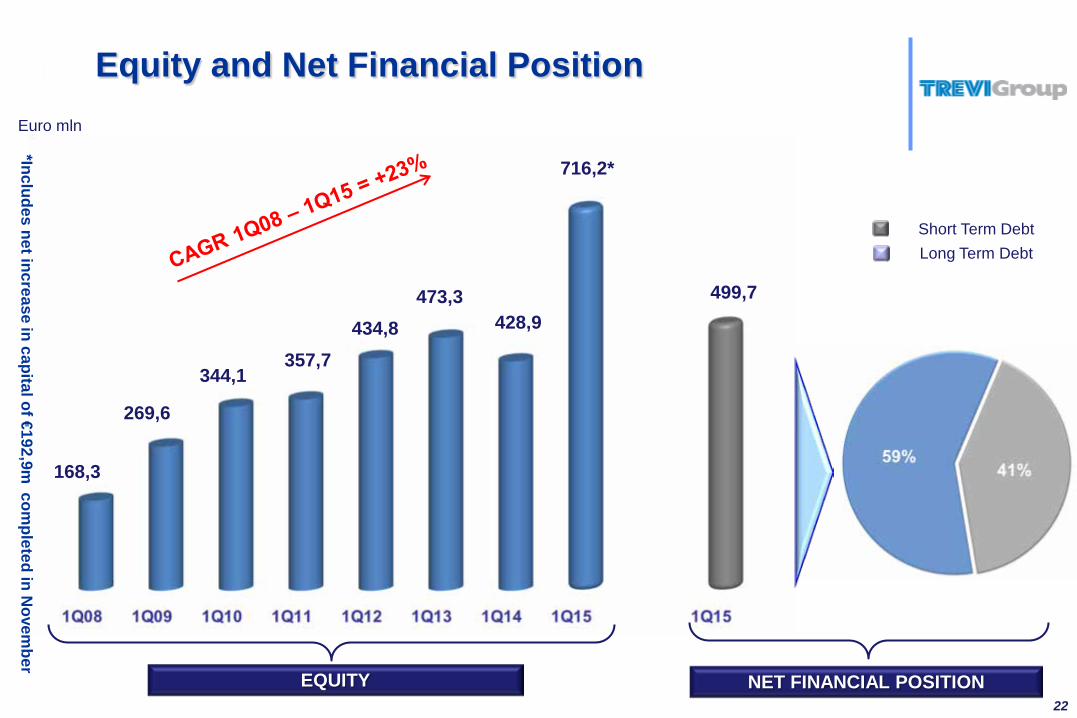
Equity and Net Financial Position
EQUITY NET FINANCIAL POSITION
Short Term Debt Long Term Debt
22
Euro mln
269,6
357,7 344,1
434,8
716,2*
168,3
428,9 473,3 499,7
*Includes net increase in capital of €192,9m com
pleted in Novem
ber
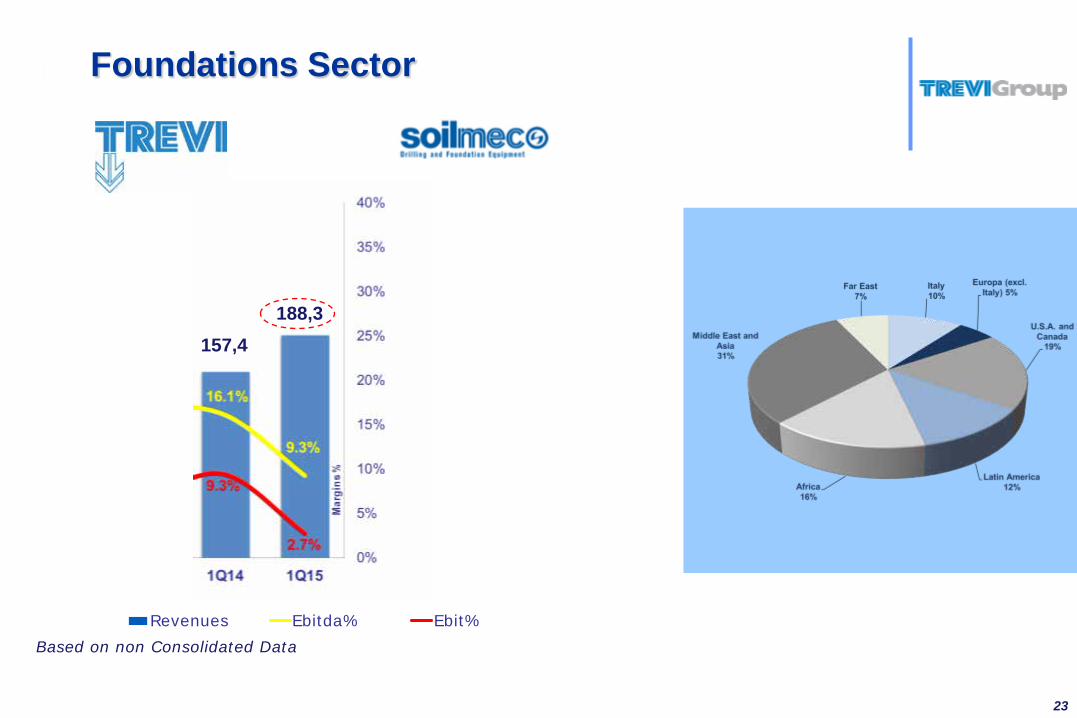
The Group
Ebitda%
Ebit%
RevenuesBased on non Consolidated Data
Foundations Sector
23
157,4 188,3
The Group
Based on non Consolidated Data
Ebitda%
Ebit%
Revenues
Oil & Gas Sector
24
113,6 111,9
The Group
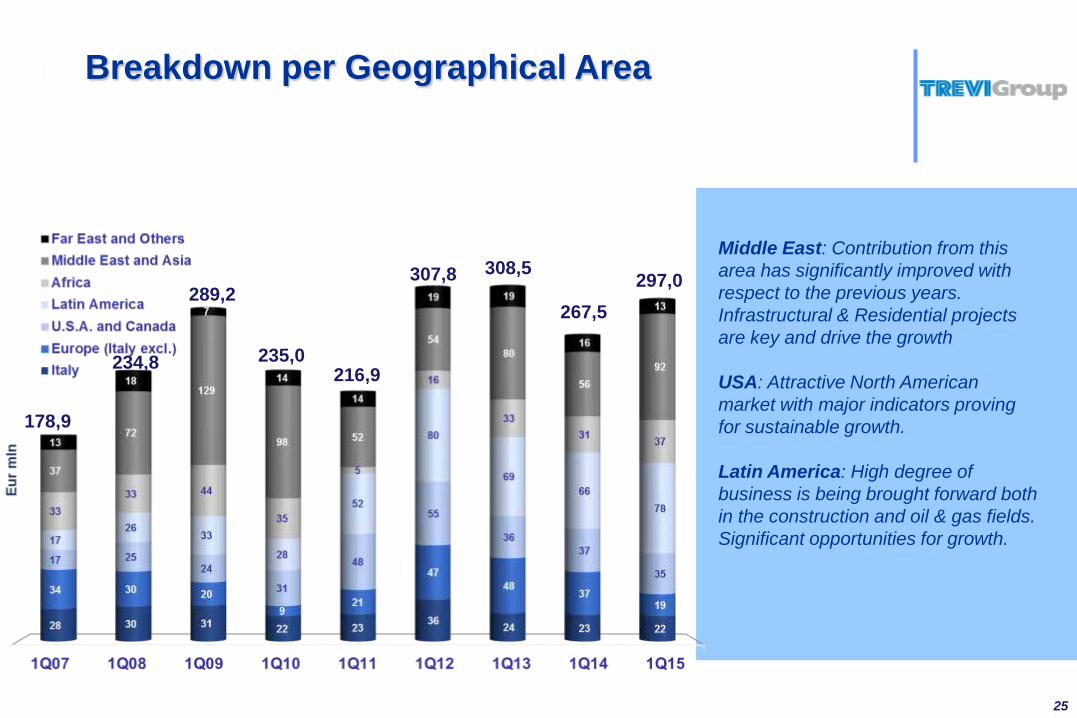
Middle East: Contribution from this area has significantly improved with respect to the previous years. Infrastructural & Residential projects are key and drive the growth USA: Attractive North American market with major indicators proving for sustainable growth. Latin America: High degree of business is being brought forward both in the construction and oil & gas fields. Significant opportunities for growth.
Breakdown per Geographical Area
25
178,9
234,8
289,2
235,0 216,9
307,8 308,5
267,5 297,0
26
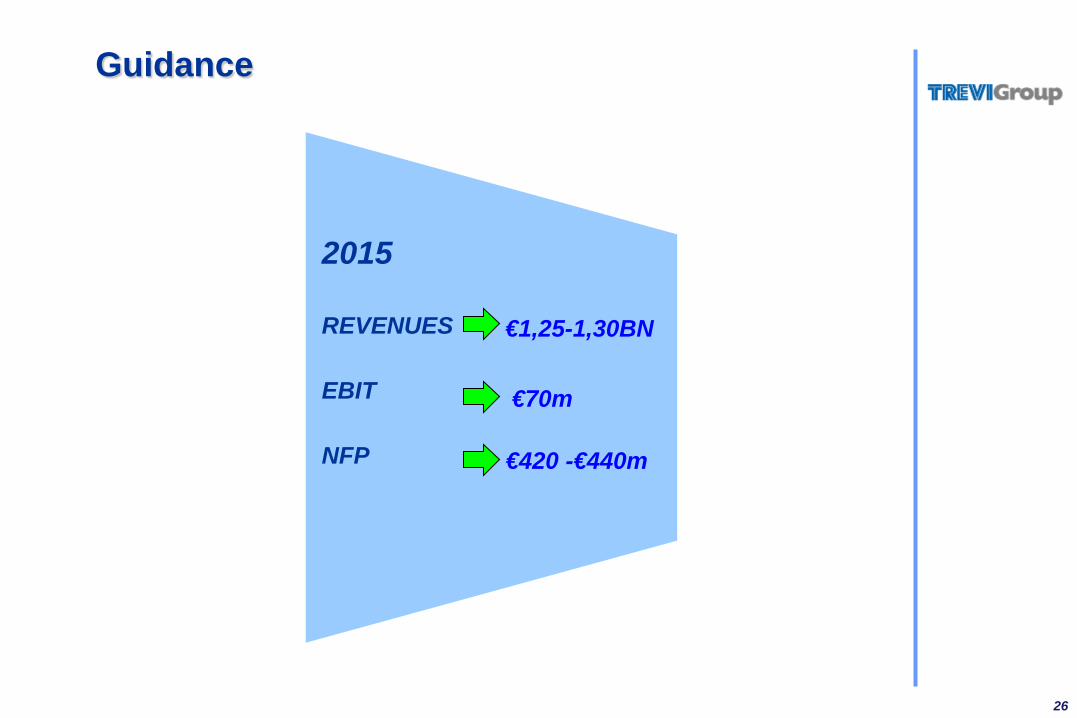
Guidance
2015 REVENUES EBIT NFP
€420 -€440m
€70m
€1,25-1,30BN
27
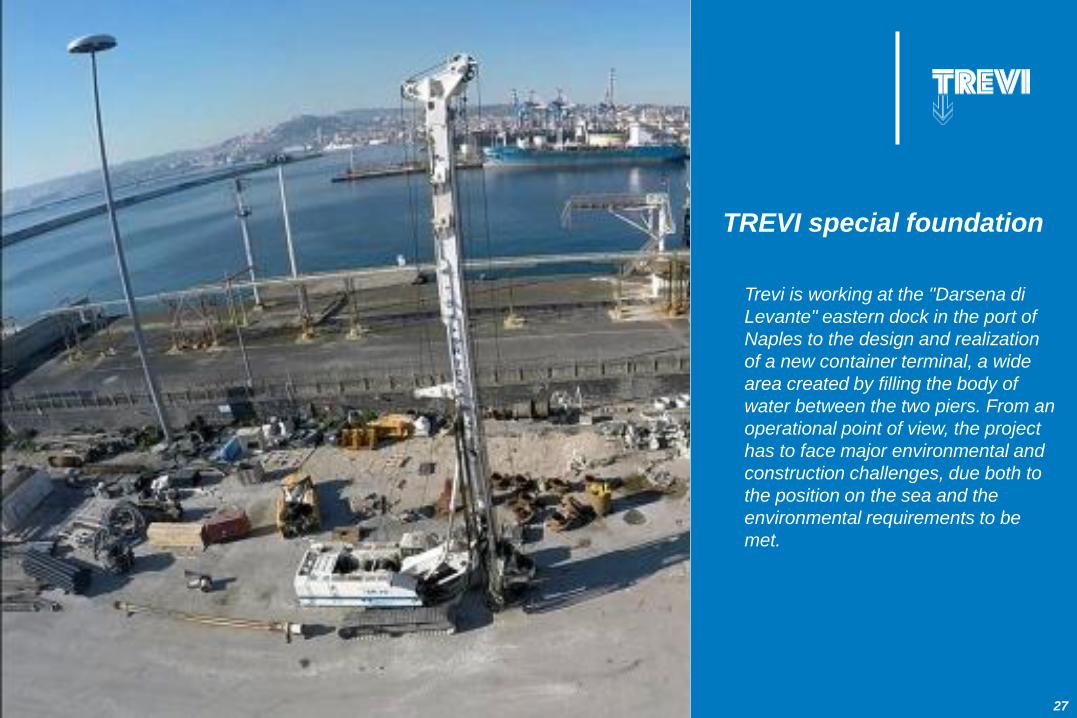
TREVI special foundation Trevi is working at the "Darsena di
Levante" eastern dock in the port of Naples to the design and realization of a new container terminal, a wide area created by filling the body of water between the two piers. From an operational point of view, the project has to face major environmental and construction challenges, due both to the position on the sea and the environmental requirements to be met.
28
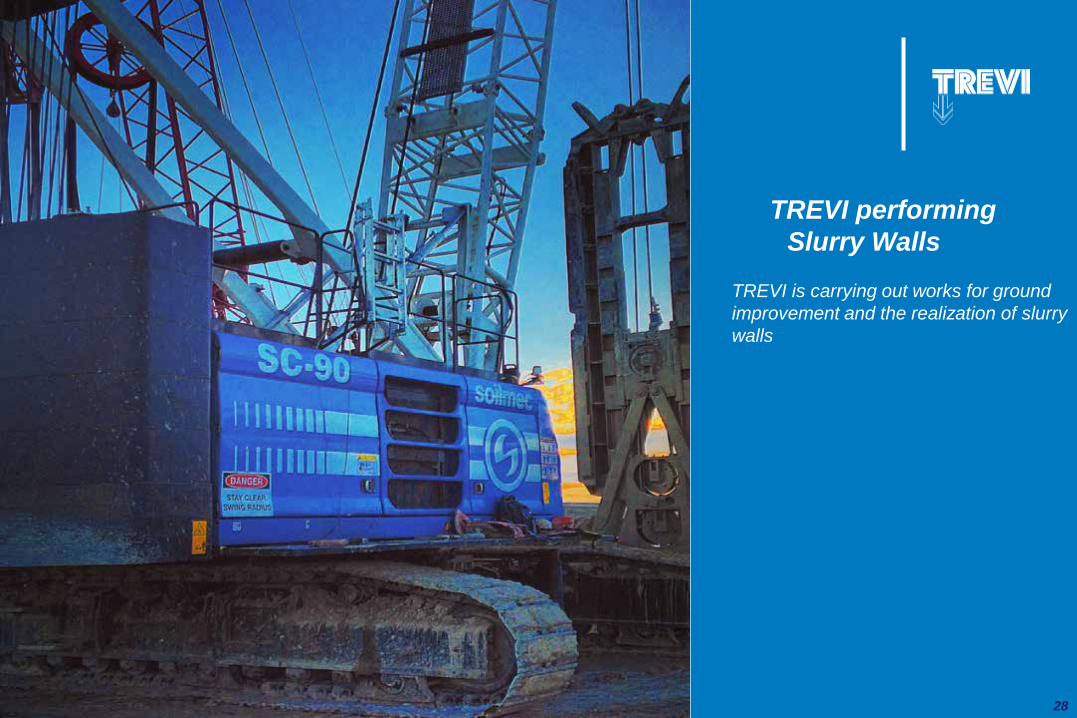
TREVI performing Slurry Walls
TREVI is carrying out works for ground
improvement and the realization of slurry walls
29
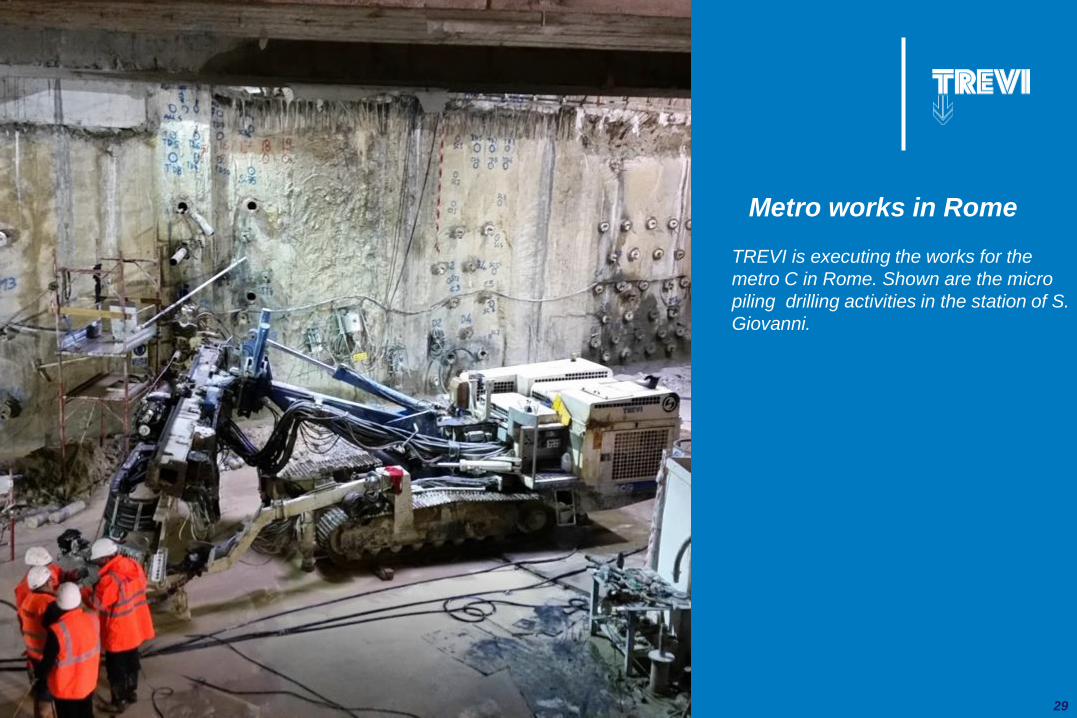
Metro works in Rome TREVI is executing the works for the
metro C in Rome. Shown are the micro piling drilling activities in the station of S. Giovanni.
30
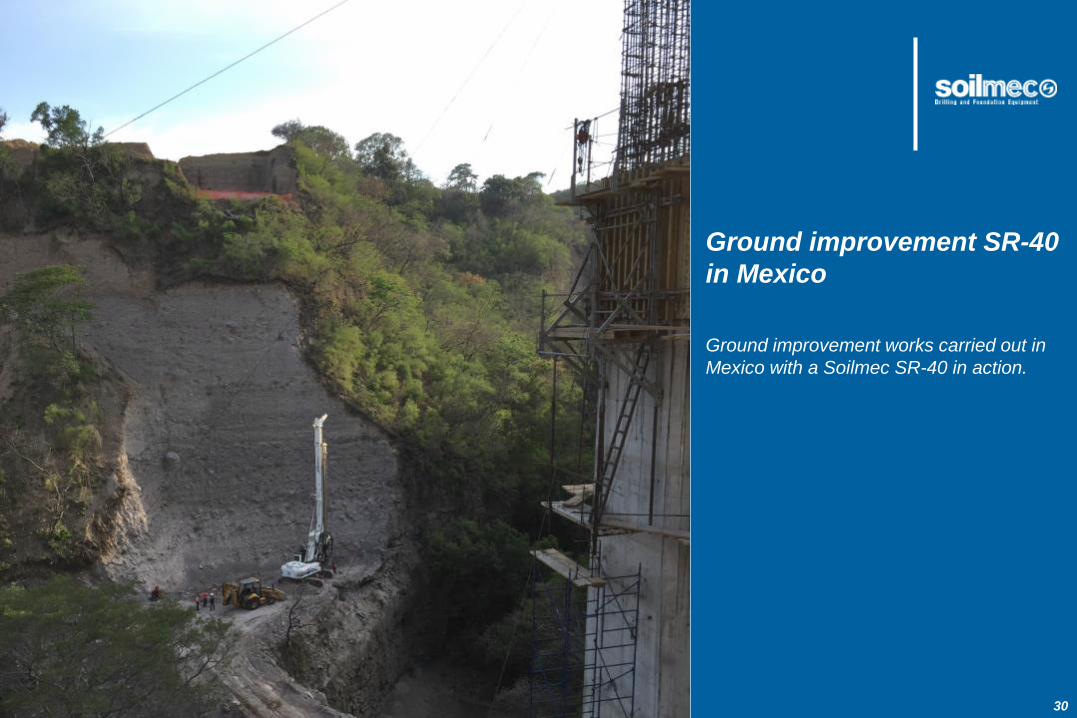
Ground improvement SR-40 in Mexico Ground improvement works carried out in Mexico with a Soilmec SR-40 in action.
31
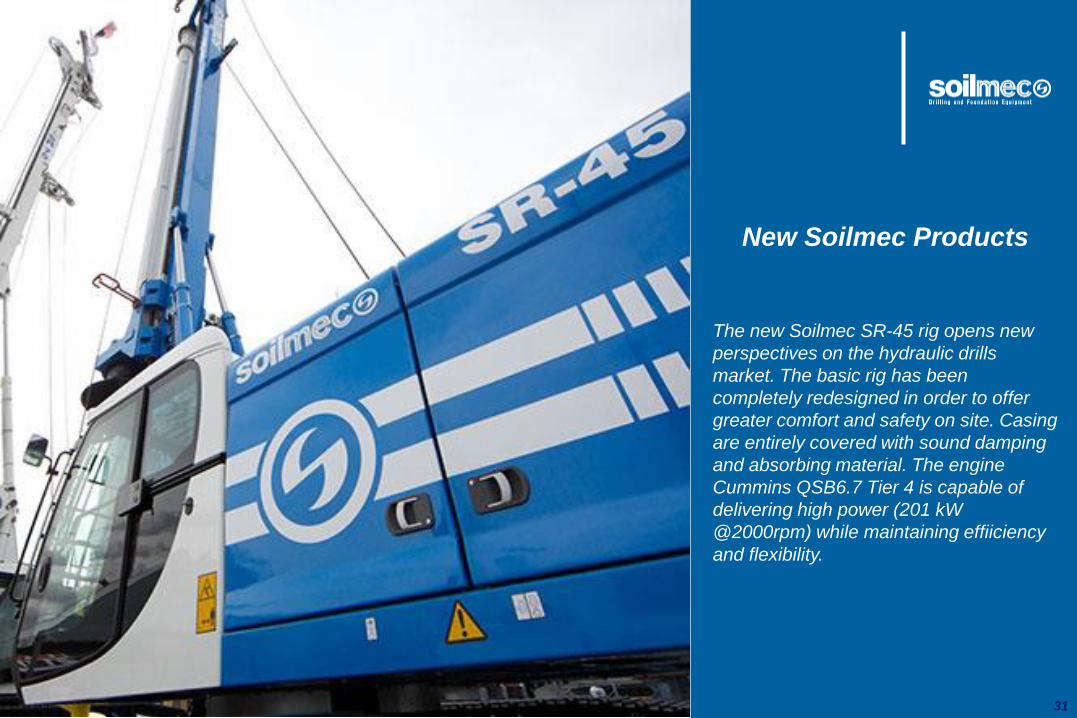
New Soilmec Products The new Soilmec SR-45 rig opens new perspectives on the hydraulic drills market. The basic rig has been completely redesigned in order to offer greater comfort and safety on site. Casing are entirely covered with sound damping and absorbing material. The engine Cummins QSB6.7 Tier 4 is capable of delivering high power (201 kW @2000rpm) while maintaining effiiciency and flexibility.
32
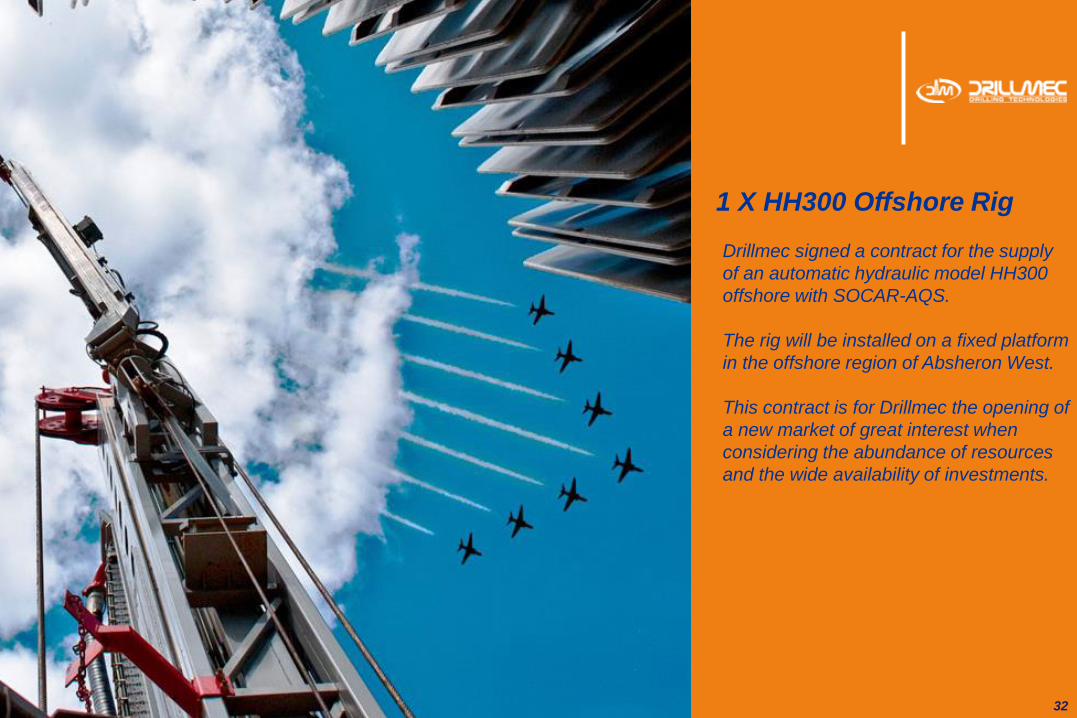
1 X HH300 Offshore Rig Drillmec signed a contract for the supply
of an automatic hydraulic model HH300 offshore with SOCAR-AQS.
The rig will be installed on a fixed platform
in the offshore region of Absheron West. This contract is for Drillmec the opening of
a new market of great interest when considering the abundance of resources and the wide availability of investments.
33
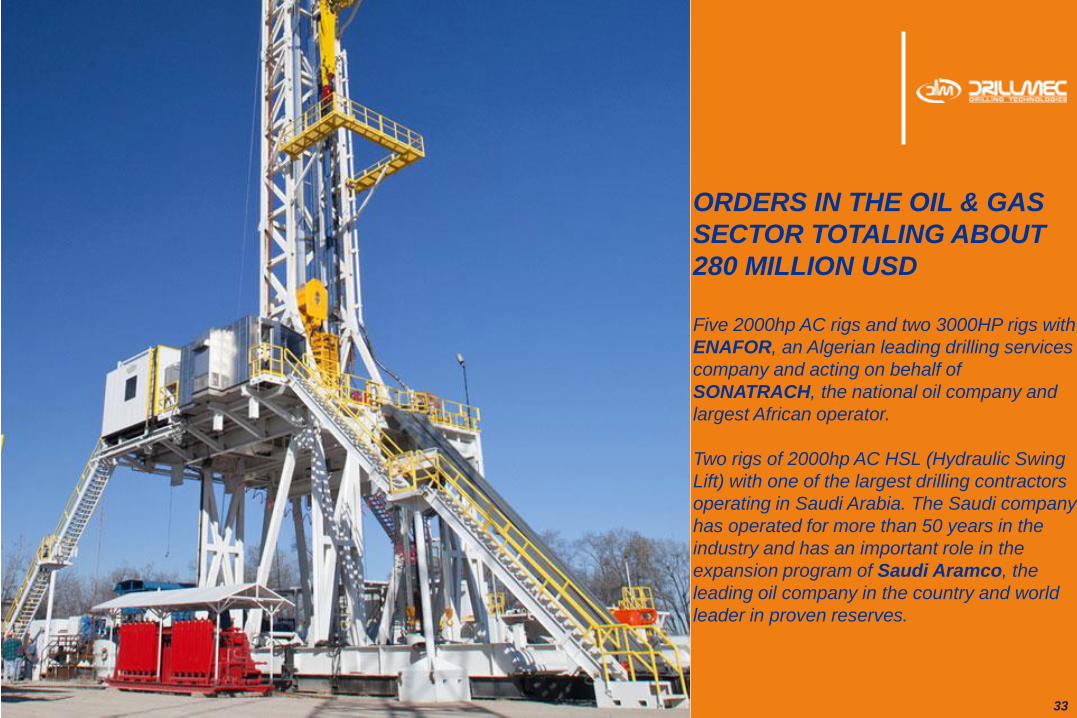
ORDERS IN THE OIL & GAS SECTOR TOTALING ABOUT 280 MILLION USD Five 2000hp AC rigs and two 3000HP rigs with ENAFOR, an Algerian leading drilling services company and acting on behalf of SONATRACH, the national oil company and largest African operator. Two rigs of 2000hp AC HSL (Hydraulic Swing Lift) with one of the largest drilling contractors operating in Saudi Arabia. The Saudi company has operated for more than 50 years in the industry and has an important role in the expansion program of Saudi Aramco, the leading oil company in the country and world leader in proven reserves.
34
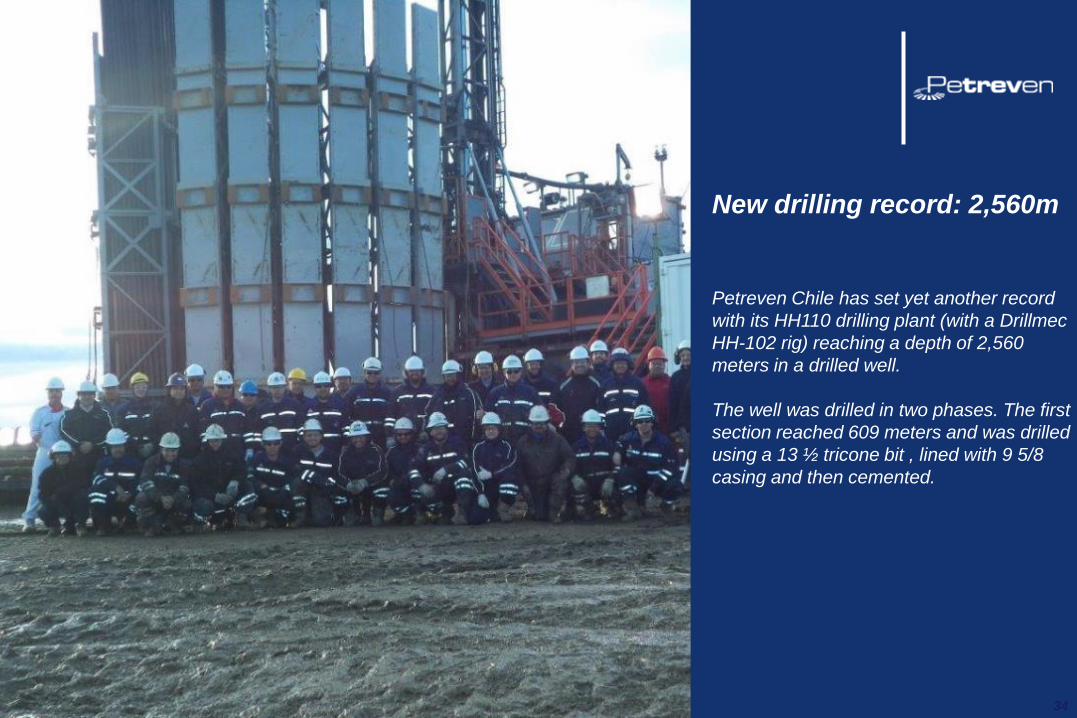
New drilling record: 2,560m Petreven Chile has set yet another record with its HH110 drilling plant (with a Drillmec HH-102 rig) reaching a depth of 2,560 meters in a drilled well. The well was drilled in two phases. The first section reached 609 meters and was drilled using a 13 ½ tricone bit , lined with 9 5/8 casing and then cemented.
1. TREVI Group
2. 1Q 2015 Financial Results
3. Q&A
4. Appendix
35
36
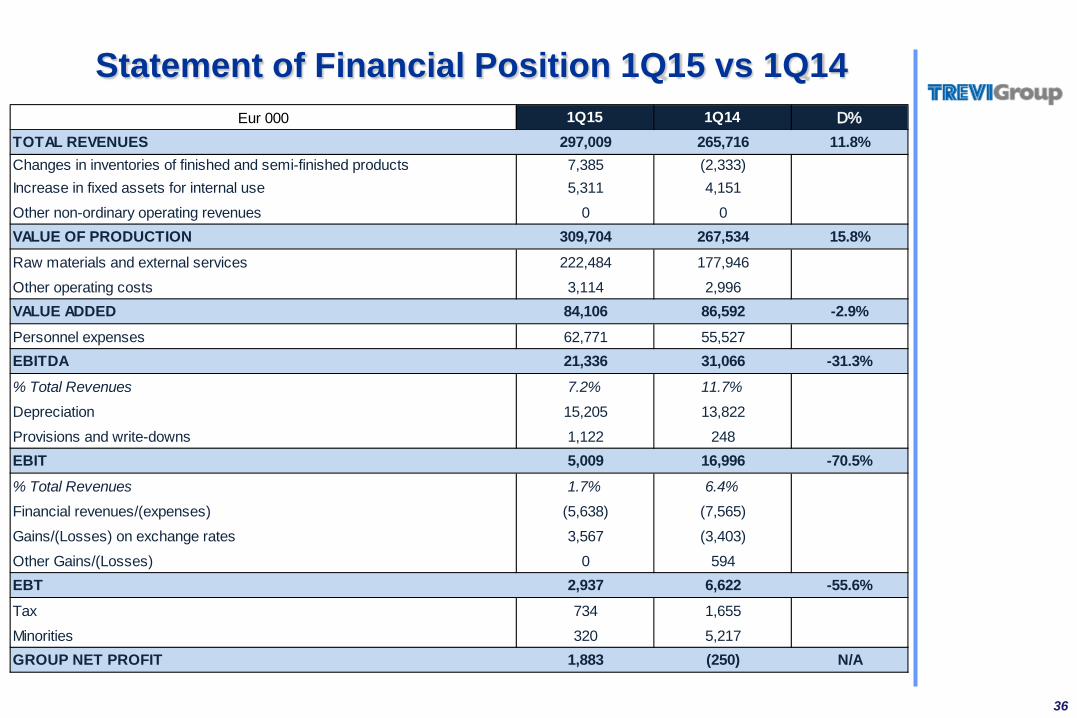
Statement of Financial Position 1Q15 vs 1Q14 Eur 000 1Q15 1Q14 D%
TOTAL REVENUES 297,009 265,716 11.8%Changes in inventories of finished and semi-finished products 7,385 (2,333)Increase in fixed assets for internal use 5,311 4,151
Other non-ordinary operating revenues 0 0VALUE OF PRODUCTION 309,704 267,534 15.8%Raw materials and external services 222,484 177,946
Other operating costs 3,114 2,996VALUE ADDED 84,106 86,592 -2.9%Personnel expenses 62,771 55,527EBITDA 21,336 31,066 -31.3%% Total Revenues 7.2% 11.7%
Depreciation 15,205 13,822
Provisions and write-downs 1,122 248EBIT 5,009 16,996 -70.5%% Total Revenues 1.7% 6.4%
Financial revenues/(expenses) (5,638) (7,565)
Gains/(Losses) on exchange rates 3,567 (3,403)
Other Gains/(Losses) 0 594EBT 2,937 6,622 -55.6%Tax 734 1,655
Minorities 320 5,217GROUP NET PROFIT 1,883 (250) N/A
37
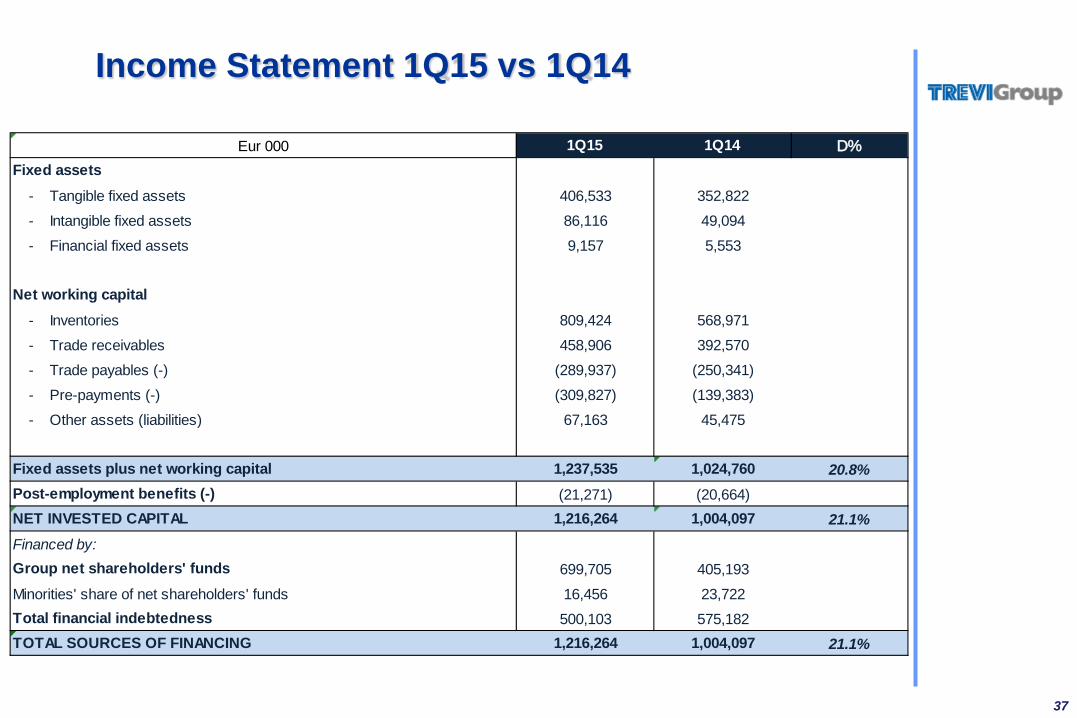
Income Statement 1Q15 vs 1Q14
Eur 000 1Q15 1Q14 D% Fixed assets - Tangible fixed assets 406,533 352,822
- Intangible fixed assets 86,116 49,094
- Financial fixed assets 9,157 5,553
Net working capital - Inventories 809,424 568,971
- Trade receivables 458,906 392,570
- Trade payables (-) (289,937) (250,341)
- Pre-payments (-) (309,827) (139,383)
- Other assets (liabilities) 67,163 45,475
Fixed assets plus net working capital 1,237,535 1,024,760 20.8%Post-employment benefits (-) (21,271) (20,664)NET INVESTED CAPITAL 1,216,264 1,004,097 21.1%Financed by:Group net shareholders' funds 699,705 405,193
Minorities' share of net shareholders' funds 16,456 23,722Total financial indebtedness 500,103 575,182TOTAL SOURCES OF FINANCING 1,216,264 1,004,097 21.1%
1. TREVI Group
2. 1Q 2015 Financial Results
3. Q&A
4. Appendix
38
39
The Group
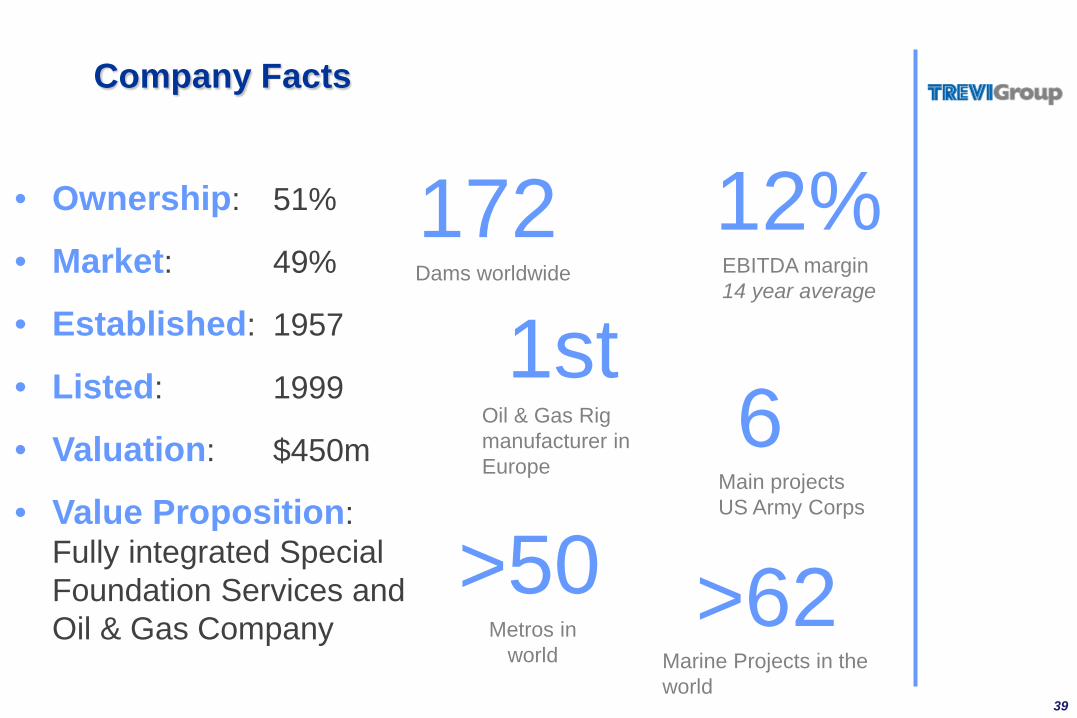
172 Dams worldwide
1st Oil & Gas Rig manufacturer in Europe
>62 Marine Projects in the world
>50 Metros in
world
12% EBITDA margin 14 year average
• Ownership: 51%
• Market: 49%
• Established: 1957
• Listed: 1999
• Valuation: $450m
• Value Proposition: Fully integrated Special Foundation Services and Oil & Gas Company
6 Main projects US Army Corps
Company Facts
40
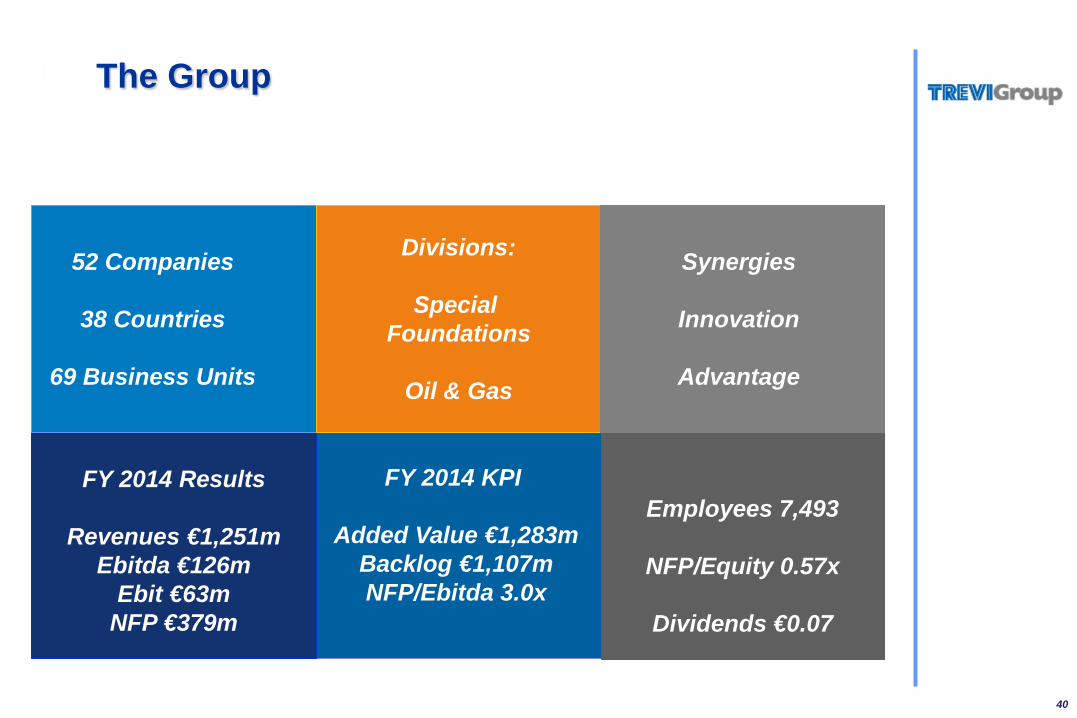
The Group
52 Companies
38 Countries
69 Business Units
Divisions:
Special Foundations
Oil & Gas
Synergies
Innovation
Advantage
FY 2014 Results
Revenues €1,251m Ebitda €126m
Ebit €63m NFP €379m
FY 2014 KPI
Added Value €1,283m Backlog €1,107m NFP/Ebitda 3.0x
Employees 7,493
NFP/Equity 0.57x
Dividends €0.07
41
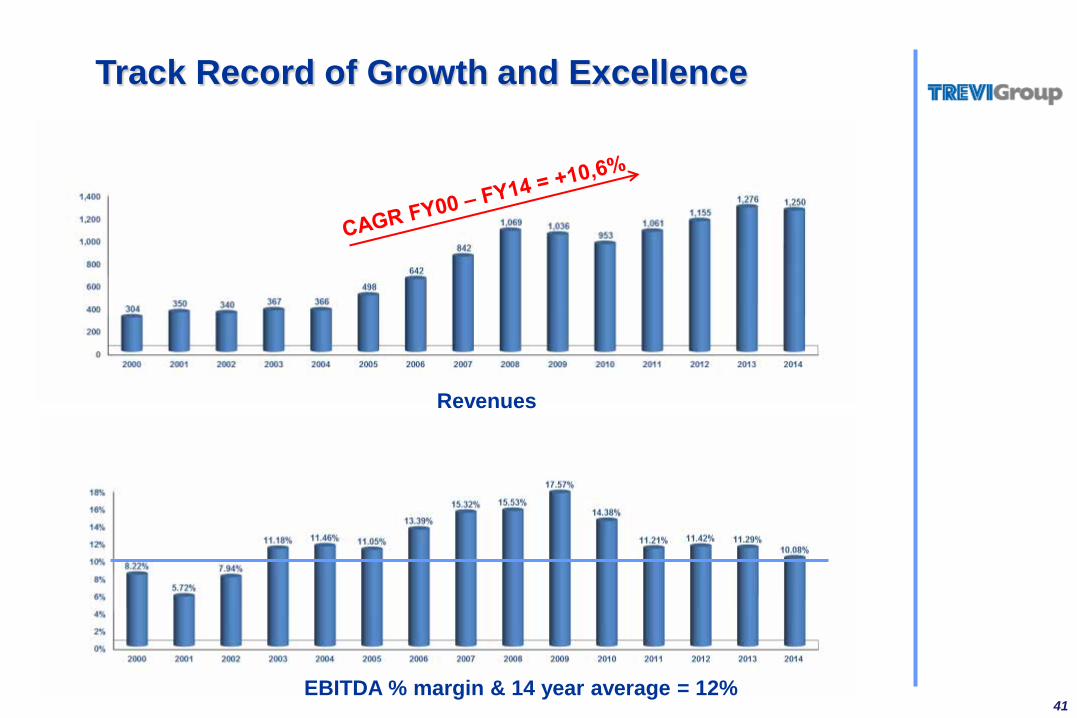
Track Record of Growth and Excellence
Revenues
EBITDA % margin & 14 year average = 12%
42
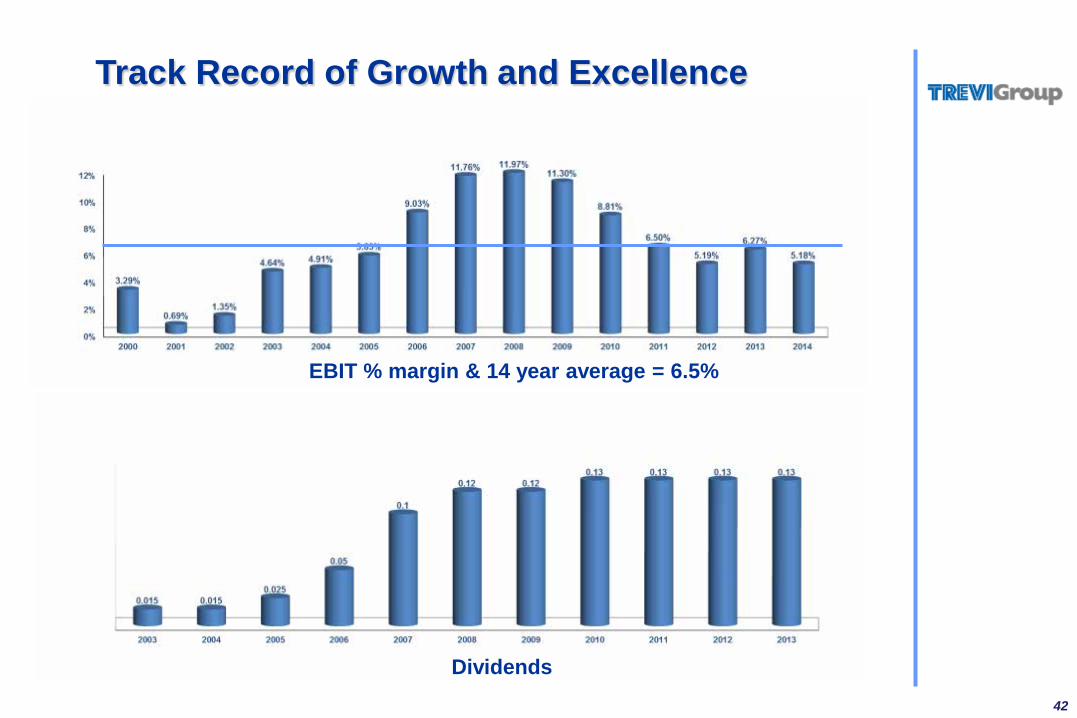
Track Record of Growth and Excellence
EBIT % margin & 14 year average = 6.5%
Dividends
The Executive in charge of the preparation of accounting documents “Daniele Forti” declares, pursuant to paragraph 2 of article 154-bis of the consolidated law on finance, that the accounting information contained in this presentation corresponds to the document results, books and accounting records. This presentation, prepared by TREVI – Finanziaria Industriale SpA, contains forward looking information and statements about the group and in no case may it be interpreted as an offer or an invitation to sell or purchase any security issued by the company or its subsidiaries. These statements include financial projections and estimates and their underlying assumptions, statements regarding plans, objectives and expectations to future operations, products and services, and statements regarding future performance. Forward looking statements involve inherent risks and uncertainties are current only at the date they are made. However, the management of TREVI – Finanziaria Industriale SpA believes that the expectations are reasonable, but, at the same time, points out to holders and investors that all the information and all the statements are subject to various risk and many of which are very difficult to predict and to control. TREVI – Finanziaria Industriale SpA does not undertake any obligation to update forward looking statements to reflect any changes in own expectations with regard thereto or any changes in events.
43
Disclaimer