Embed Size (px)
Citation preview
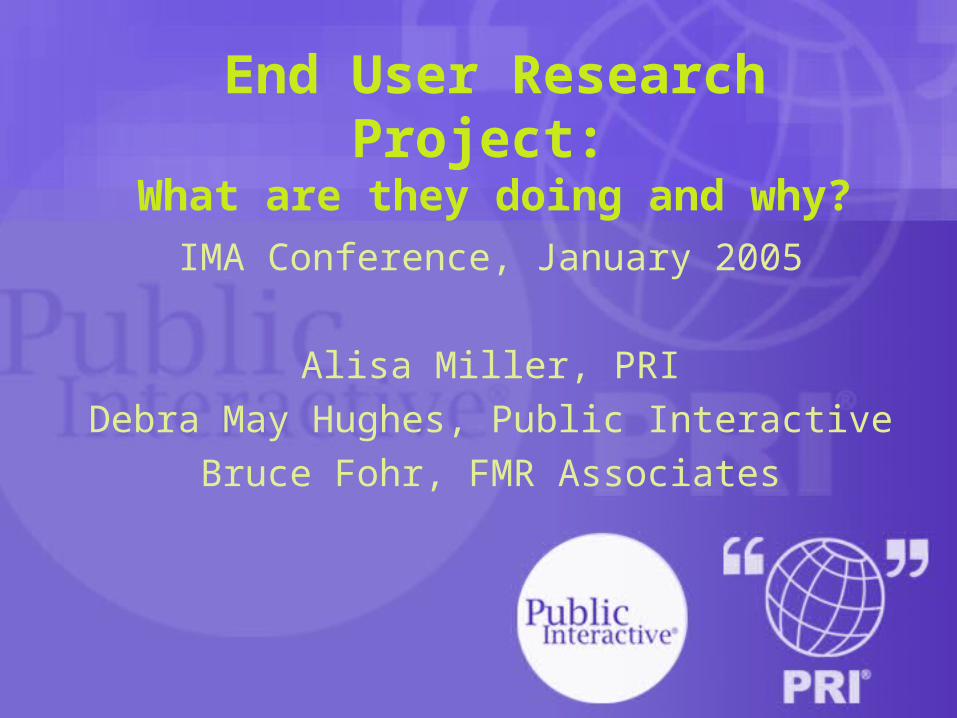
End User Research Project: What are they doing and why?
IMA Conference, January 2005
Alisa Miller, PRI
Debra May Hughes, Public Interactive
Bruce Fohr, FMR Associates
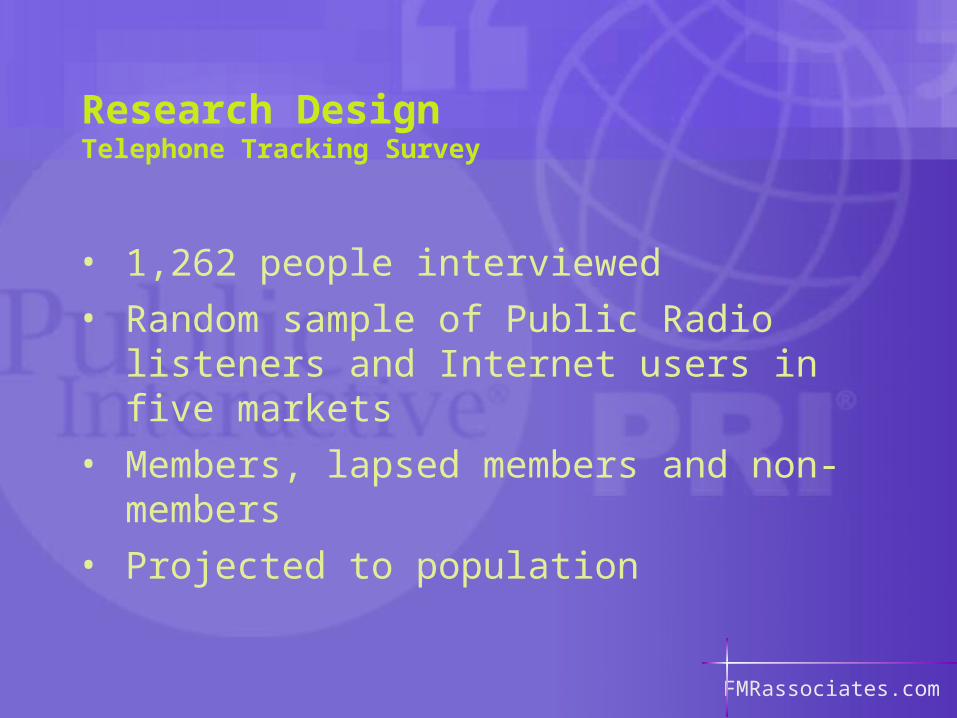
• 1,262 people interviewed
• Random sample of Public Radio listeners and Internet users in five markets
• Members, lapsed members and non-members
• Projected to population
FMRassociates.com
Research DesignTelephone Tracking Survey
Summary of Key Findings
Since 2002, there have been measurable increases in Internet usage and specific visitation or utilities of Public Radio websites:
FMRassociates.com
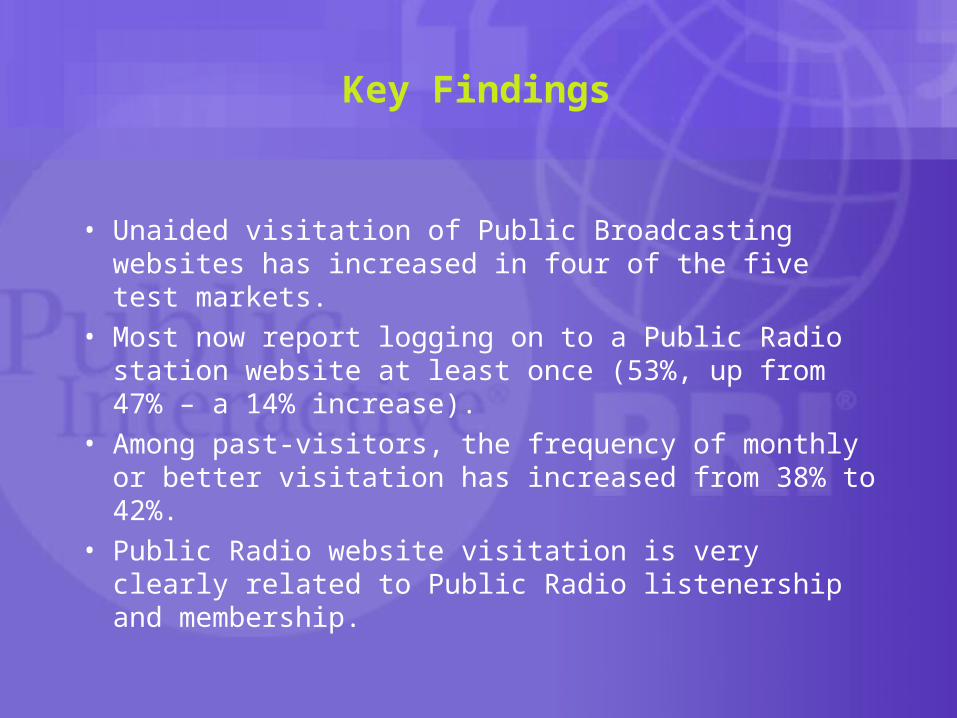
Key Findings
• Unaided visitation of Public Broadcasting websites has increased in four of the five test markets.
• Most now report logging on to a Public Radio station website at least once (53%, up from 47% – a 14% increase).
• Among past-visitors, the frequency of monthly or better visitation has increased from 38% to 42%.
• Public Radio website visitation is very clearly related to Public Radio listenership and membership.
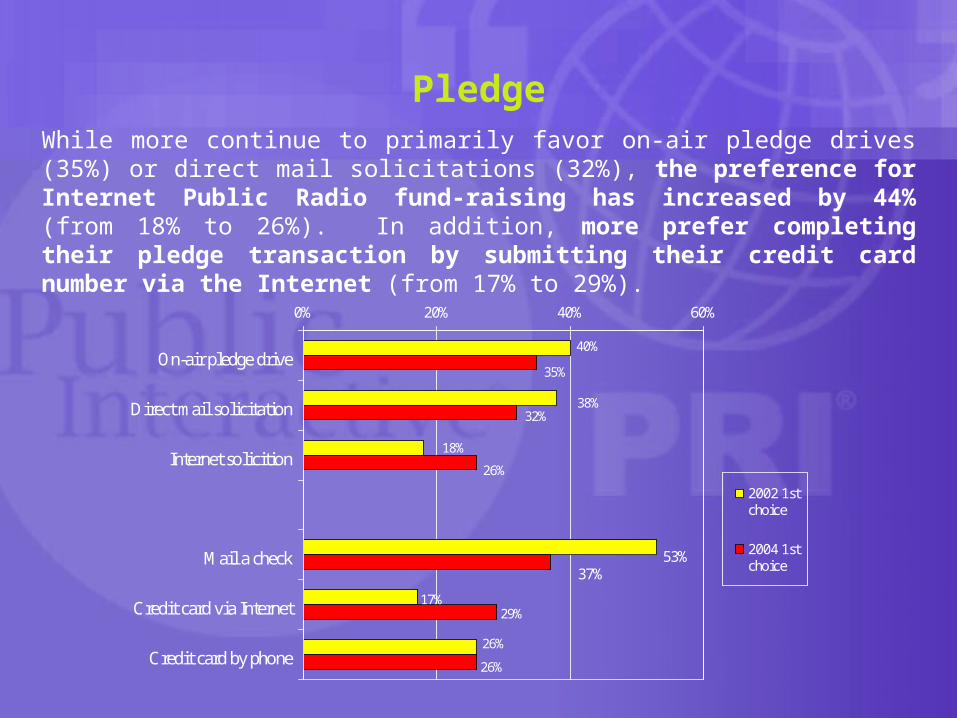
17%29%
26%
40%
53%
38%
18%
26%
35%
26%
32%
37%
0% 20% 40% 60%
On-air pledge drive
Direct mail solicitation
Internet solicition
Mail a check
Credit card via Internet
Credit card by phone
2002 1stchoice
2004 1stchoice
PledgeWhile more continue to primarily favor on-air pledge drives (35%) or direct mail solicitations (32%), the preference for Internet Public Radio fund-raising has increased by 44% (from 18% to 26%). In addition, more prefer completing their pledge transaction by submitting their credit card number via the Internet (from 17% to 29%).
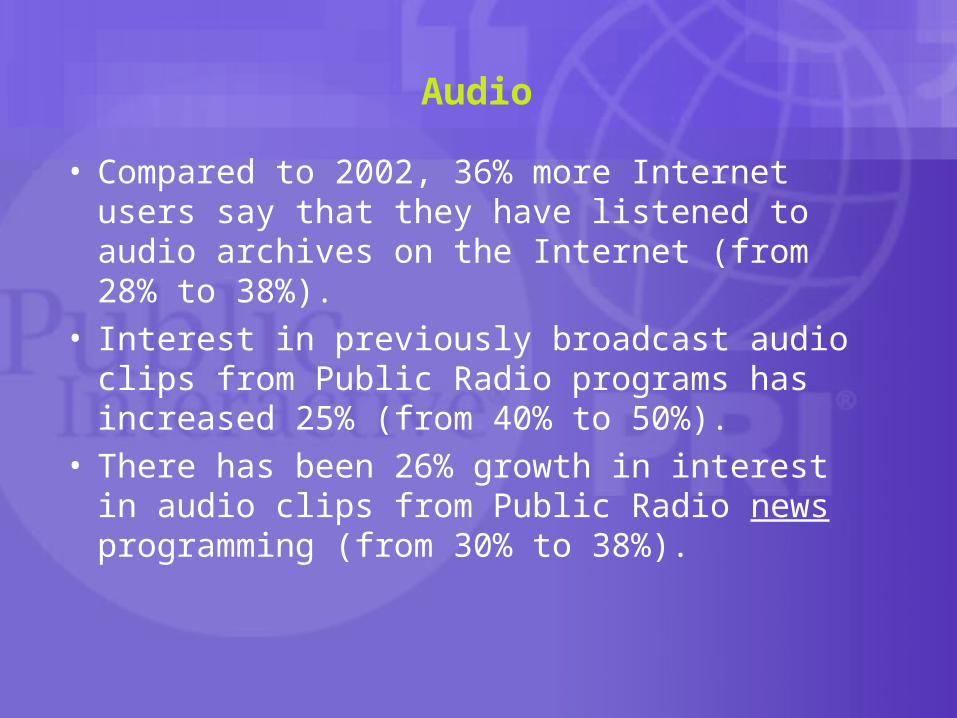
Audio
• Compared to 2002, 36% more Internet users say that they have listened to audio archives on the Internet (from 28% to 38%).
• Interest in previously broadcast audio clips from Public Radio programs has increased 25% (from 40% to 50%).
• There has been 26% growth in interest in audio clips from Public Radio news programming (from 30% to 38%).
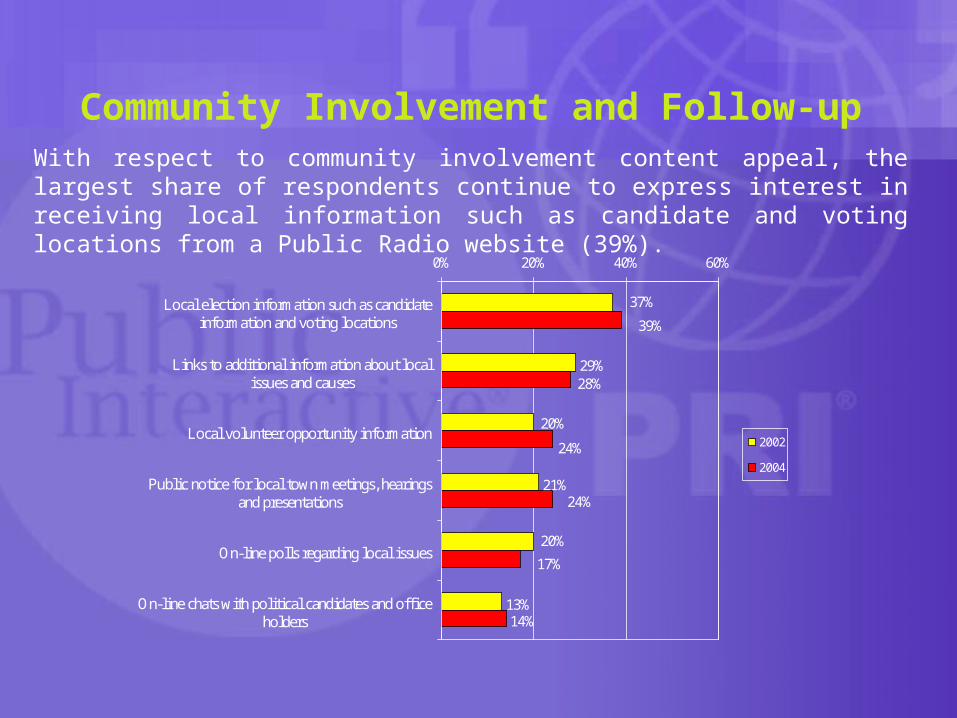
Community Involvement and Follow-upWith respect to community involvement content appeal, the largest share of respondents continue to express interest in receiving local information such as candidate and voting locations from a Public Radio website (39%).
29%
21%
13%14%
20%
20%
37%
17%
28%
24%
24%
39%
0% 20% 40% 60%
Local election information such as candidateinformation and voting locations
Links to additional information about localissues and causes
Local volunteer opportunity information
Public notice for local town meetings, hearingsand presentations
On-line polls regarding local issues
On-line chats with political candidates and officeholders
2002
2004
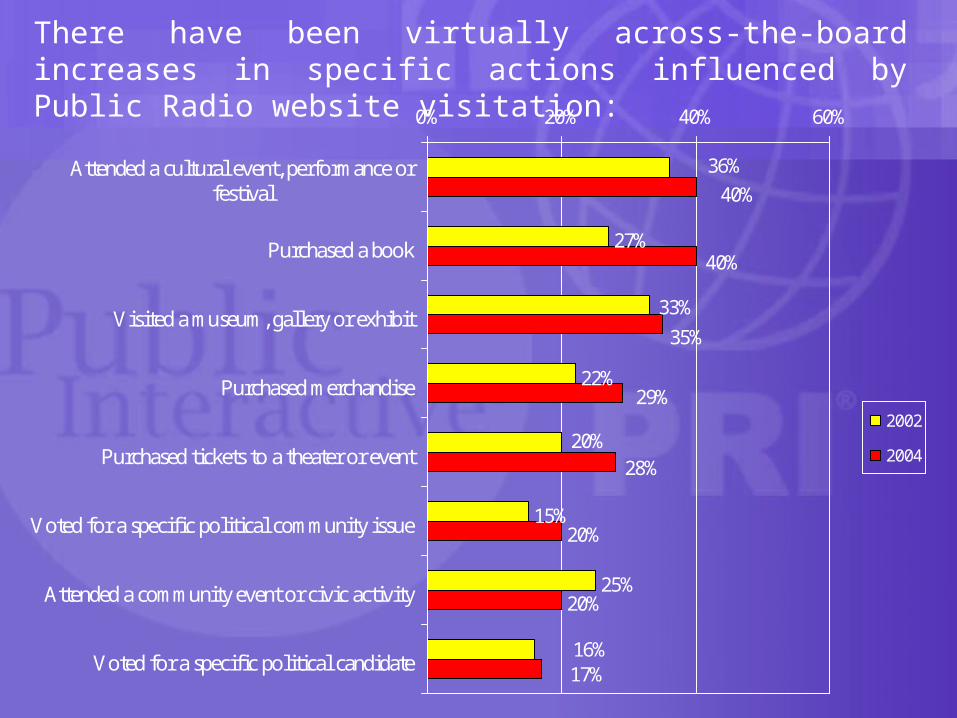
There have been virtually across-the-board increases in specific actions influenced by Public Radio website visitation:
27%
22%
15%
25%
20%
20%
16%
33%
20%
36%
17%
28%
40%
35%
29%
40%
0% 20% 40% 60%
Attended a cultural event, performance orfestival
Purchased a book
Visited a museum, gallery or exhibit
Purchased merchandise
Purchased tickets to a theater or event
Voted for a specific political community issue
Attended a community event or civic activity
Voted for a specific political candidate
2002
2004
FMRassociates.com
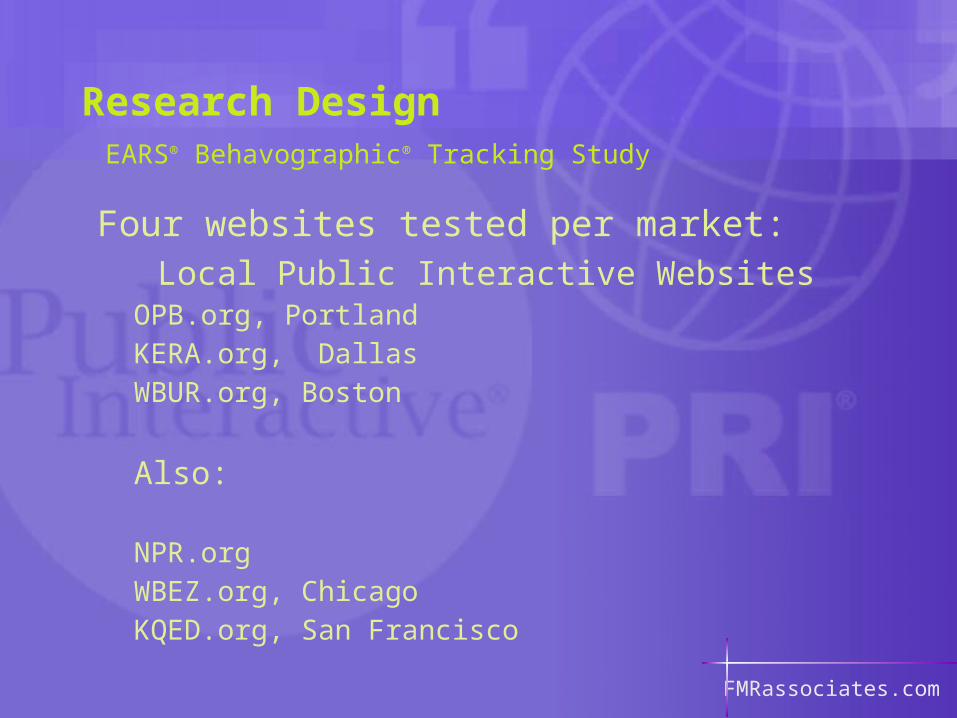
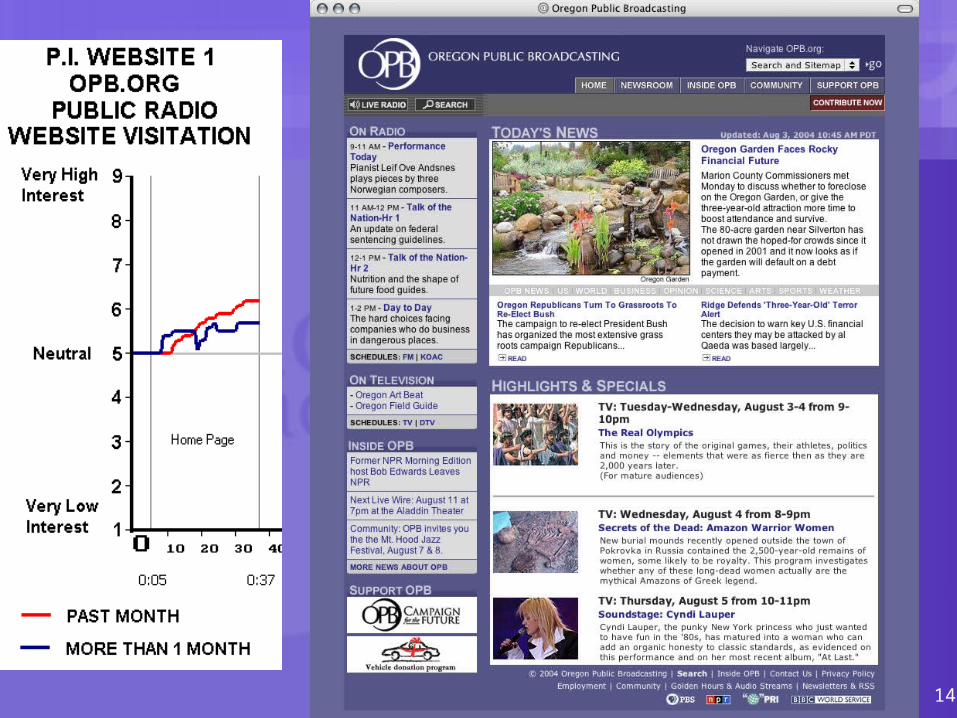
Research Design EARS® Behavographic® Tracking Study
Four websites tested per market: Local Public Interactive Websites
OPB.org, PortlandKERA.org, DallasWBUR.org, Boston
Also:
NPR.orgWBEZ.org, ChicagoKQED.org, San Francisco
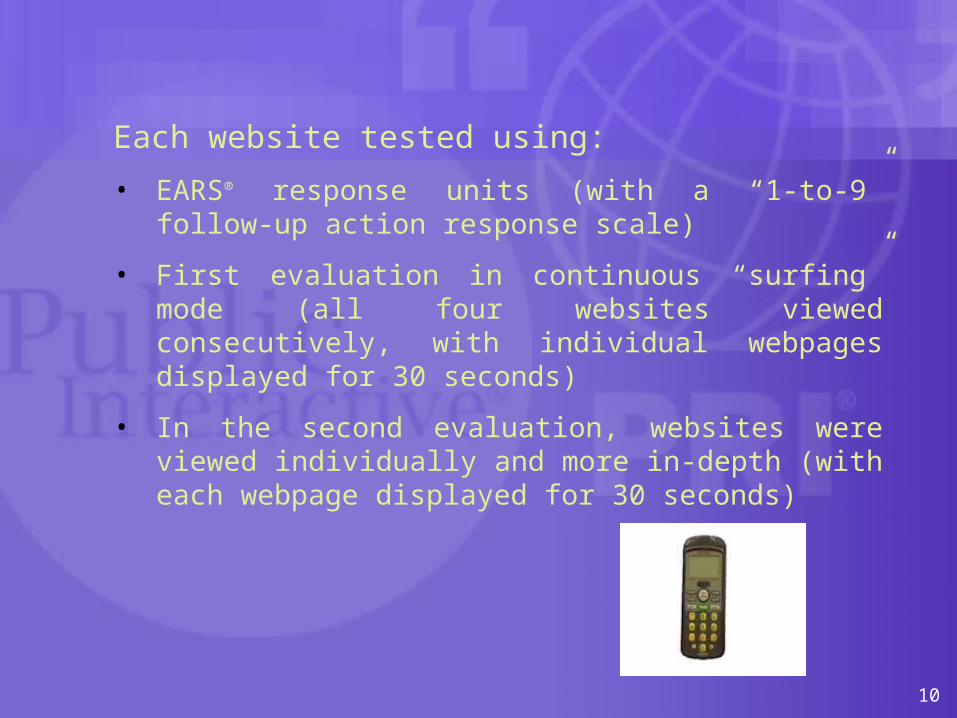
Each website tested using:
• EARS® response units (with a “1-to-9” follow-up action response scale)
• First evaluation in continuous “surfing” mode (all four websites viewed consecutively, with individual webpages displayed for 30 seconds)
• In the second evaluation, websites were viewed individually and more in-depth (with each webpage displayed for 30 seconds)
10
11
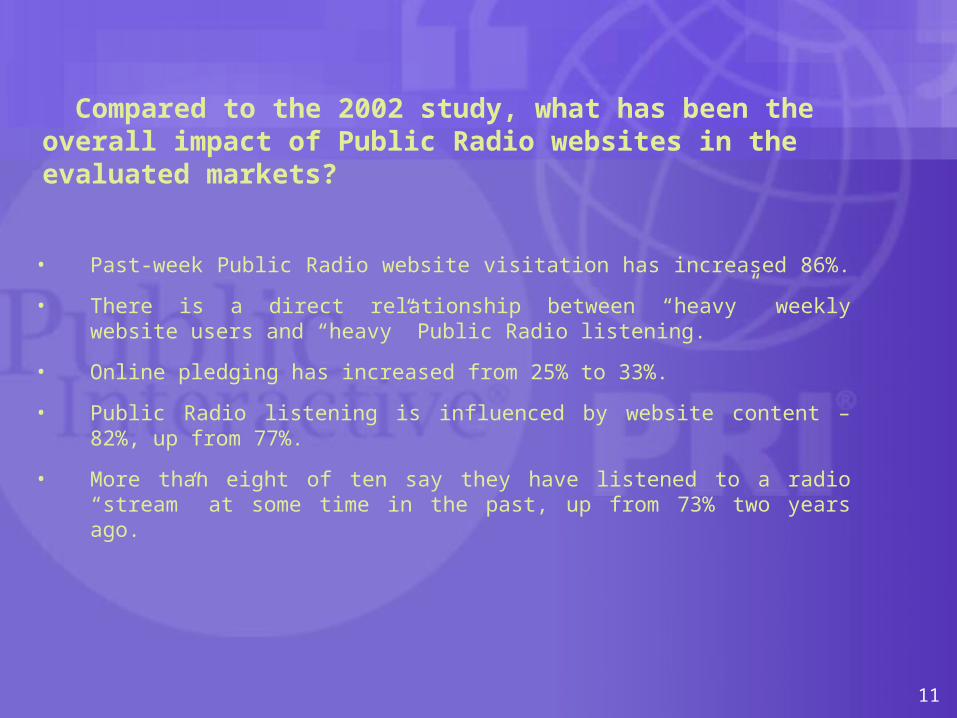
Compared to the 2002 study, what has been the overall impact of Public Radio websites in the evaluated markets?
• Past-week Public Radio website visitation has increased 86%.
• There is a direct relationship between “heavy” weekly website users and “heavy” Public Radio listening.
• Online pledging has increased from 25% to 33%.
• Public Radio listening is influenced by website content – 82%, up from 77%.
• More than eight of ten say they have listened to a radio “stream” at some time in the past, up from 73% two years ago.
12
Of the various events/activities evaluated two years ago, there has been an average increase of 13% in participation (from 40% to 46%) as a result of information found on a Public Radio website, including:
Attending a cultural event (54%)
Purchasing a book (52%)
Making a pledge to a Public Radio station (52%)
Visiting a museum/gallery/exhibit (45%)
Purchasing tickets to a theater/event (36%) Attending a community event (36%)
13
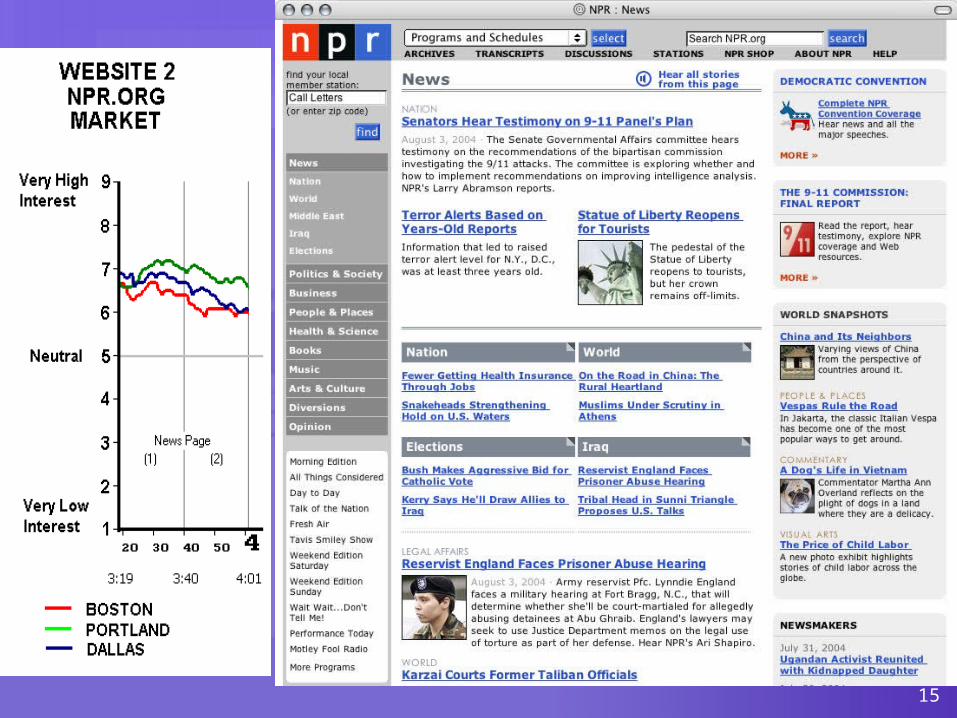
4. Which of the websites evaluated are most likely to encourage Public Radio listenership?
The three Local Public Interactive websites tested the highest for three of the four pages evaluated. NPR.org is also strong, especially its News Page.
14
15
16
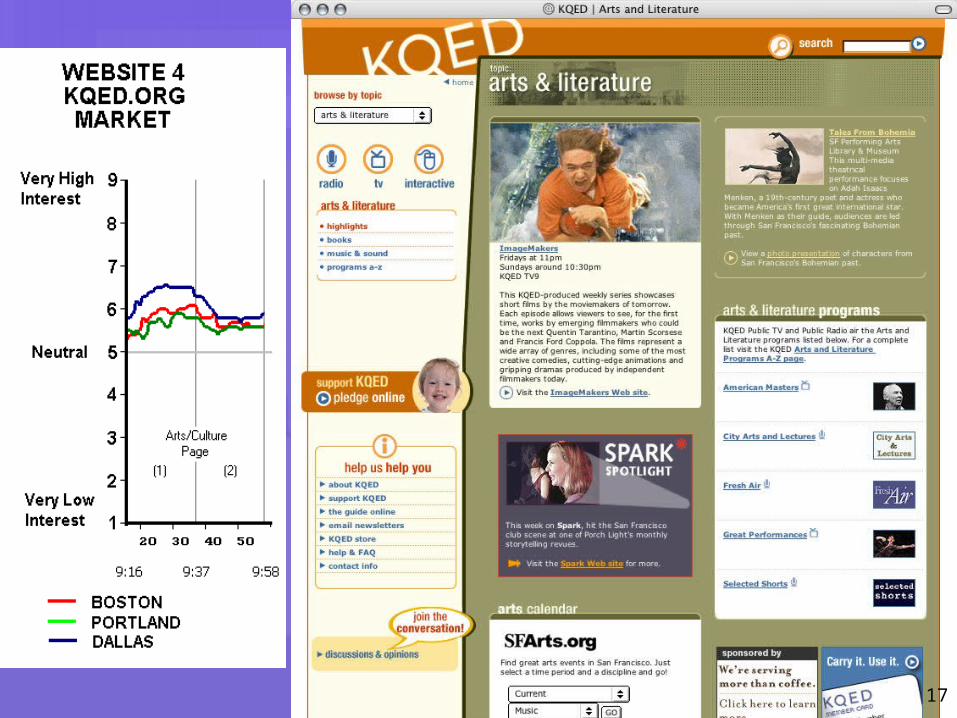
5. Which of the websites evaluated are most likely to encourage support for Public Radio?
KQED.org for three of the four pages tested.
17
18
6. Which of the websites evaluated are most likely to encourage attendance at local community events?
The Local Public Interactive websites showed the most improvement – especially in Portland.
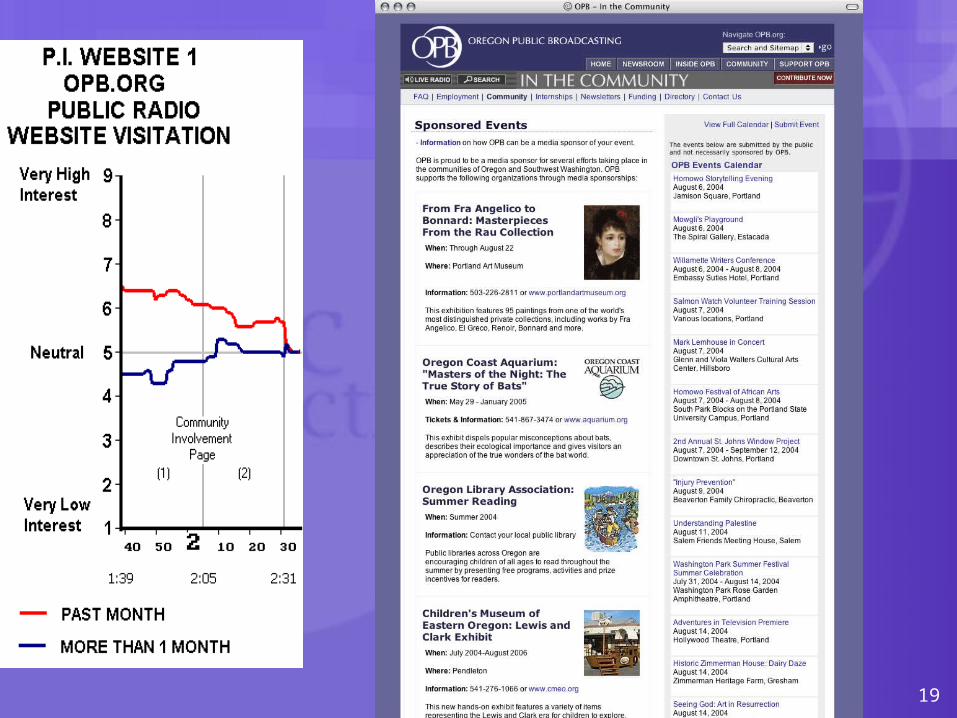
19
20
Recommendations for Website Content to Increase listenership to Public Radio: More bold, colorful pictures or graphics
Better layout and organization (more white space and clarity – less clutter)
Better background colors (more contrast to help readability)
More descriptive listings – not just titles of shows (and more information about upcoming shows during the day)
Topics of information and program content uniquely available on radio (not same type of info in newspapers)
21
Recommendations for Website Content to Increase Support for Public Radio: NPR.org and KQED.org were most likely to be mentioned as
encouraging greater support for Public Radio. Why? Many mention the NPR “image” – because it gives visitors the sense that “the station is really doing a lot,” and its association with an organization “worthy of support.”
KQED.org’s consistent graphics related to online support. It is important to be able to have a clear-cut and consistent way to allow for on-line pledging – as best seen on the KQED.org and WBEZ.org websites.
Respondents indicated that “none” of the websites overly “push” support for Public Broadcasting or on-air pledging. And this could be increased
End User Research Project: What are they doing and why?
IMA Conference
January 2005