Embed Size (px)
Citation preview

Molecular Recognition in a Diverse Set of Protein-LigandInteractions Studied with Molecular Dynamics Simulations andEnd-Point Free Energy Calculations
Bo Wang2,3, Liwei Li1, Thomas D. Hurley1, and Samy O. Meroueh1,2,3,4
1Indiana University Department of Biochemistry and Molecular Biology, Indiana University Schoolof Medicine, 535 Barnhill Drive, Indianapolis, IN, 46202
2Center for Computational Biology and Bioinformatics, Indiana University School of Medicine, 535Barnhill Drive, Indianapolis, IN, 46202
3Department of Chemistry and Chemical Biology (IUPUI), Indiana University School of Medicine,535 Barnhill Drive, Indianapolis, IN, 46202
4Stark Neurosciences Research Institute, Indiana University School of Medicine, 535 BarnhillDrive, Indianapolis, IN, 46202
Abstract
End-point free energy calculations using MM-GBSA and MM-PBSA provide a detailed
understanding of molecular recognition in protein-ligand interactions. The binding free energy can
be used to rank-order protein-ligand structures in virtual screening for compound or target
identification. Here, we carry out free energy calculations for a diverse set of 11 proteins bound to
14 small molecules using extensive explicit-solvent MD simulations. The structure of these
complexes was previously solved by crystallography and their binding studied with isothermal
titration calorimetry (ITC) data enabling direct comparison to the MM-GBSA and MM-PBSA
calculations. Four MM-GBSA and three MM-PBSA calculations reproduced the ITC free energy
within 1 kcal•mol−1 highlighting the challenges in reproducing the absolute free energy from end-
point free energy calculations. MM-GBSA exhibited better rank-ordering with a Spearman ρ of
0.68 compared to 0.40 for MM-PBSA with dielectric constant (ε = 1). An increase in ε resulted in
significantly better rank-ordering for MM-PBSA (ρ = 0.91 for ε = 10). But larger ε significantly
reduced the contributions of electrostatics, suggesting that the improvement is due to the non-polar
and entropy components, rather than a better representation of the electrostatics. SVRKB scoring
function applied to MD snapshots resulted in excellent rank-ordering (ρ = 0.81). Calculations of
the configurational entropy using normal mode analysis led to free energies that correlated
significantly better to the ITC free energy than the MD-based quasi-harmonic approach, but the
computed entropies showed no correlation with the ITC entropy. When the adaptation energy is
taken into consideration by running separate simulations for complex, apo and ligand (MM-
Corresponding Author: Samy Meroueh Department of Biochemistry and Molecular Biology Indiana University School of Medicine410 W. 10th Street, HITS 5000 Indianapolis, IN 46202 Tel. (317) 274-8315 Fax: (317) 278-9217 [email protected].
SUPPORTING INFORMATION. Supporting information includes tables listing parameters that were used for the SVMSP andSVRKB scoring as well as MM-PBSA and MM-GBSA calculations. Root-mean-square deviations are also provided for the structuressubjected to molecular dynamics simulations. This material is available free of charge via the Internet at http://pubs.acs.org.
NIH Public AccessAuthor ManuscriptJ Chem Inf Model. Author manuscript; available in PMC 2014 October 28.
Published in final edited form as:J Chem Inf Model. 2013 October 28; 53(10): 2659–2670. doi:10.1021/ci400312v.
NIH
-PA
Author M
anuscriptN
IH-P
A A
uthor Manuscript
NIH
-PA
Author M
anuscript

PBSAADAPT), there is less agreement with the ITC data for the individual free energies, but
remarkably good rank-ordering is observed (ρ = 0.89). Interestingly, filtering MD snapshots by
pre-scoring protein-ligand complexes with a machine learning-based approach (SVMSP) resulted
in a significant improvement in the MM-PBSA results (ε = 1) from ρ = 0.40 to ρ = 0.81. Finally,
the non-polar components of MM-GBSA and MM-PBSA, but not the electrostatic components,
showed strong correlation to the ITC free energy; the computed entropies did not correlate with
the ITC entropy.
INTRODUCTION
Molecular Dynamics (MD) simulation-based free energy calculations have been used
extensively to predict the strength of protein-ligand interactions. Accurate rank-ordering of
small molecules bound to protein structures can benefit every step of drug discovery from
hit identification to lead optimization. When applied to a compound docked to the human
proteome, free energy calculations can be used for target discovery.1 Several rigorous
methods such as free energy perturbation and thermodynamic integration have been
developed for accurate free energy calculations.2-8 But these methods cannot easily be used
for virtual screening of large chemical or combinatorial libraries that typically contain
highly diverse compounds.9 End-point methods such as molecular dynamics (MD)-based
MM-GBSA or MM-PBSA10 offer an alternative to rigorous free energy methods.
Structurally diverse molecules can be considered in the calculations. The free energy
consists of several terms that include a potential energy, a polar and non-polar solvation
energy, and an entropy.
The MM-GBSA or MM-PBSA free energy consists of several components that can be
determined independently. There exists more than one approach for each of these
components. For example, the potential energy, which typically includes electrostatic and
van der Waals energies, can be obtained using different force fields.11 The electrostatic
component of the solvation energy can be performed using either Poisson-Boltzmann12 (PB)
or Generalized-Born (GB) models.13 Two approaches are commonly used for the entropy,
namely a normal mode analysis or a quasiharmonic approximation.14, 15 Finally, the
calculations are performed on multiple snapshots collected from MD simulations.16-18 The
selection of different collections of structures is expected to affect the predicted free energy
of binding.19
Here, we apply MM-GBSA and MM-PBSA calculations to determine the free energy of
binding and rank-order a diverse set of protein-ligand complexes. The diversity in the
structures of the ligand and targets distinguishes this work from previous efforts that have
typically been limited to calculations on congeneric series of compounds on the same target
protein. In addition, the use of structures whose binding was characterized with a single
method, namely ITC, is expected to reduce the uncertainties in the comparisons between
predicted and experimental data. We select 14 protein-ligand structures obtained from the
PDBcal database (http://pdbcal.iu.edu) to provide high quality structural and thermodynamic
binding data.20 Extensive explicit-solvent MD simulations were performed and binding to
these proteins was studied using various implementations of MM-GBSA and MM-PBSA.
Wang et al. Page 2
J Chem Inf Model. Author manuscript; available in PMC 2014 October 28.
NIH
-PA
Author M
anuscriptN
IH-P
A A
uthor Manuscript
NIH
-PA
Author M
anuscript

We also tested our previously-developed scoring functions for their ability to rank-order
complexes by scoring MD structures. The effect of induced-fit conformational changes on
rank-ordering these complexes was studied by performing separate simulations for ligand,
protein and protein-ligand complexes. Components of the MM-GBSA and MM-PBSA free
energy are compared with the ITC free energy, enthalpy and entropy. To the best of our
knowledge, this is the first comparison of MM-GBSA and MM-PBSA calculations to ITC
data for a diverse set of proteins.
MATERIALS AND METHODS
Scoring Protein Ligand Complexes
We previously reported the Support Vector Machine Target SPecific (SVMSP) model21 for
enriching databases and Support Vector Regression Knowledge-Based (SVRKB) scoring22
for rank-ordering protein-compound complexes based on their binding affinity. Unlike
SVRKB, SVMSP is developed for each individual target protein as described previously.21
SVMSP model was developed by using protein-ligand crystal structures from the sc-PDB
database v2010 for the positive set and randomly selected compounds docked to the target
of interest as the negative set. The positive set was refined by removing crystal structures in
which the ligand contains highly charged moieties such as sulfate or phosphate groups,
resulting in a set of 4,677 structures. The negative set consisted of docking 5,000 randomly
selected compounds from the ChemDiv library to a pocket within the target of interest. The
random selection of these compounds from a large chemical library reduces the likelihood
that active compounds exist in the negative set.
To develop the SVMSP or SVRKB models, we extended on our previous work knowledge-
based descriptors by using 14 distinct protein atom types and 16 ligand atom types (Table
S1).21 This resulted in 224 atom-pairs based potentials. We used 76 pair potentials for the
vectors of SVMSP. A higher SVMSP score corresponds to a higher probability that the
compound is active.
MD Simulations
A set of 14 complexes of small molecules bound to a protein were selected from the PDBcal
database (Table 1).20 The structures of proteins were obtained from RCSB and prepared
using BIOPOLYMER in SYBYL 8.0 (Tripos International, St. Louis, Missouri, USA).
Hydrogen atoms were added. Missing gaps were modeled. Residue orientation and
protonation states were further adjusted using the REDUCE23 program to optimize the
hydrogen bonding network. The ligand structures extracted from crystal structures were
prepared and visually checked in SYBYL. The compound was assigned AM1-BCC24
charges using the antechamber program from the AMBER9 package.25 Water molecules
from crystal structures within 5 Å to any atoms on the protein or compound were retained.
To perform MD simulations, the protein-ligand complexes were immersed in a box of
TIP3P26 water molecules such that no atom on the protein or ligand was within 14 Å from
any side of the box. The solvated box was further neutralized with Na+ or Cl− counterions
using the leap program from the AMBER9 package.
Wang et al. Page 3
J Chem Inf Model. Author manuscript; available in PMC 2014 October 28.
NIH
-PA
Author M
anuscriptN
IH-P
A A
uthor Manuscript
NIH
-PA
Author M
anuscript

Simulations were carried out using the pmemd program in AMBER9 with ff03 force field27
in periodic boundary conditions. All bonds involving hydrogen atoms were constrained by
using the SHAKE algorithm,28 and a 2 fs time step was used in simulation. The particle
mesh Ewald (PME) method was used to treat long range electrostatics. Simulations were run
at 298 K under 1 atm in NPT ensemble employing Langevin thermostat and Berendsen
barostat. Water molecules were first energy-minimized and equilibrated by running a short
simulation with the complex fixed using Cartesian restraints. This was followed by a series
of energy minimizations in which the Cartesian restraints were gradually relaxed from 500
kcal·Å−2 to 0 kcal·Å−2, and the system was subsequently gradually heated to 298 K via a 48
ps MD run. By assigning different initial velocities, 6 independent simulations in length of 4
ns were performed for each of the crystal structure. The first 2 ns in each trajectory were
discarded. MD snapshots were saved every 1 ps yielding 4,000 structures per trajectory.
MD-Based Free Energy Calculations
MM-PBSA and MM-GBSA calculations were carried out as described previously.29-31 It
combines internal energy, solvation energy based on electrostatic and nonpolar
contributions, and the entropy. These calculations are carried out on snapshots collected
from an MD simulation. The binding free energy is expressed as:
where ΔGMM-PBSA and ΔGMM-GBSA are binding free energies calculated by MM-PBSA and
MM-GBSA method, ΔEPBTOT and ΔEGBTOT are the combined internal and solvation
energies, T is system temperature. ΔSNM or QHA is entropy determined by normal mode
calculation or quasiharmonic analysis. The internal energy is determined using the Lennard-
Jones and Coulomb potentials in the Amber force-field (ΔEGAS). The solvation energy is
determined using Poisson-Boltzmann or Generalized-Born solvation models (ΔEPBSOL or
ΔEPBSOL):
where ΔEPBSOL and ΔEGBSOL are the solvation free energies calculated with PB or GB
model, and ΔEGAS is the molecular mechanical energies. The molecular mechanical energies
are composed of three components:
where ΔEELE is the non-bonded electrostatic energy, ΔEVDW is non-bonded van der Waals
energy, and ΔEINT is the internal energies composed of bond, angle, and dihedral energies.
The solvation free energies can be calculated using PB or GB model, expressed respectively
by:
Wang et al. Page 4
J Chem Inf Model. Author manuscript; available in PMC 2014 October 28.
NIH
-PA
Author M
anuscriptN
IH-P
A A
uthor Manuscript
NIH
-PA
Author M
anuscript

where ΔEPBSUR and ΔEGBSUR are hydrophobic contribution to desolvation energy, ΔEPBCAL
and ΔEGB are reaction field energies.32
All the binding energies are determined by:
where EPL, EP and EL are total energies corresponding to protein-ligand complex (PL),
protein (P) and ligand (L), respectively.
The molecular mechanical gas phase energies were calculated by sander program from
AMBER9 package, including the internal energy, van der Waals and electrostatic
interactions. Dielectric constant for electrostatic interactions was set to 1.0. The polar
contributions of the solvation free energy were calculated with Poisson-Boltzmann (PB)
method using the pbsa program12 and generalized Born (GB) method implemented in
sander. The nonpolar contributions of the desolvation energy were determined with solvent-
accessible surface area (SASA) dependent terms.33 The surface area was calculated by
molsurf program.34 The surface tension used to calculate the non-polar contribution to the
free energy of solvation is 0.0072. In the PB method, reaction field energy was calculated
with dielectric constant for protein and solvent as 1.0 and 80.0 respectively. In the test of the
contribution of dielectric constant, we use various dielectric constant for the solute from 1 to
10, 15 and 20. The default value of the dielectric constant is 1. Solvent probe radius was set
to 1.6 Å, which was optimized by Tan and Luo.35 Atomic radii used were also optimized by
Tan and Luo.35 The calculation based on GB method was performed with the Onufriev's GB
model.36, 37 SASA calculation was switched to ICOSA method, surface area was computed
by recursively approximating a sphere around an atom, starting from an icosahedra. Two
different methods were applied for the calculation of entropies of the protein-ligand
complexes. Quasiharmonic approximation was analyzed using the ptraj program in
AMBER. Normal mode conformational entropies were estimated with the nmode module
from AMBER. Distance-dependent dielectric constant was set to 4. Maximum number of
cycles of minimization was set to 10,000. The convergence criterion for the energy gradient
to stop minimization was 0.0001. Parameters for the MM-PBSA and MM-GBSA free
energy calculation are summarized in Table S2.
For the MM-PBSA or MM-GBSA free energy calculations, a set of 500 structures for each
protein-ligand complex was extracted from trajectories of MD simulations at regular
intervals. For ΔGSVMSP//MMPBSA and ΔGSVMSP//MM-GBSA, all snapshots from MD
simulations were first scored by SVMSP. The top scored 500 structures were selected for
free energy. For ΔGMM-SVRKB, all snapshots were scored by SVRKB first, the mean value
of SVRKB score of all snapshots was used for calculated binding affinity (pKd) of the
complex using:
Wang et al. Page 5
J Chem Inf Model. Author manuscript; available in PMC 2014 October 28.
NIH
-PA
Author M
anuscriptN
IH-P
A A
uthor Manuscript
NIH
-PA
Author M
anuscript

where R is the gas constant, T is room temperature (298.15 K).
Correlation Analysis
Three correlation metrics, Pearson's correlation coefficient Rp, Spearman correlation
coefficient ρ, and Kendall tau τ, were used in model parameterization and performance
assessment. All the correlation analysis was done using packages in R (version 1.12.1). The
95% confidence interval was calculated using 5000 replicate bootstrap sampling.
Pearson product-moment correlation coefficient Rp is a measure of linear dependence
between two variables x and y, giving a value between +1 and −1 inclusive. It was given by:
where x̄ and ȳ are the mean value for xi and yi respectively. The Spearman's rank correlation
coefficient ρ assesses how well the association of two variables can be described using a
monotonic function. It was given by
where and denote the ranks of xi and yi, n is the total number of x-y pairs. A perfect
Spearman correlation of +1 or −1 occurs when each of the variables is a perfect monotone
function of the other. Kendall tau rank correlation coefficient τ is a measure of the
association between two measured quantities. It was given by
when the values of xi and yi are unique.
RESULTS
Calculations of Binding Free Energies and Comparison to ITC Data
Free energy calculations were carried out for a set of 14 protein-ligand interactions using
MM-GBSA and MM-PBSA (Fig. 2). The structure of these complexes was previously
solved by crystallography and characterization of the binding was done by ITC. The set
contains 11 unique proteins and 14 structurally different ligands. The ligands include a
cyclic peptide (1), peptidomimetics (2-4), small organic molecules (5-10, and 13),
Wang et al. Page 6
J Chem Inf Model. Author manuscript; available in PMC 2014 October 28.
NIH
-PA
Author M
anuscriptN
IH-P
A A
uthor Manuscript
NIH
-PA
Author M
anuscript

carbohydrates (10 and 11), a nucleoside (12) and a fatty acid (14) (Fig. 1). Among the small
organic molecules, four were fragment-like (6-8, and 13) with molecular weight less than
200 Da. Calculations were carried out using the MM-GBSA and MM-PBSA approach on
multiple MD structures collected from 12 ns of simulation. The computed MM-GBSA or
MM-PBSA free energies were compared to experimental binding affinity data ΔGITC (Table
1, Fig. 3A). Among the 14 complexes, the predicted ΔGMM-PBSA were excellent (less than 1
kcal•mol−1) for three of the ligands, namely for (i) 3 binding to HIV-1 protease (PDB code:
1HPX; |ΔΔG| = 0.8); (ii) 8 binding to mouse major urinary protein 1 (PDB code: 1QY1; |
ΔΔG| = 0.4); and (iii) binding of 5 to human leukocyte function-associated antigen-1 (PDB
code: 1RD4; |ΔΔG| = 0.9). The predicted binding affinities for another five ligands were
between 2 and 4 kcal•mol−1, namely for (i) 1 binding to human cyclophilin A (PDB code:
1CWA; |ΔΔG| = 2.2); (ii) 6 binding to porcine odorant-binding protein (PDB code: 1DZK; |
ΔΔG| = 2.2); (iii) 14 binding to human brain fatty acid-binding protein (PDB code: 1FDQ; |
ΔΔG| = 2.7); (iv) 4 binding to HIV-1 protease (PDB code: 1HXW; |ΔΔG| = 3.7); and (v) 11bound to human galectin-3 (PDB code: 1KJL). The remaining predicted affinities for
compounds 2, 7, 9, 10, and 13 were larger than 4 kcal•mol−1. An overall measure of the
deviation of the MM-PBSA free energy from the ITC free energy is provided by the root-
mean-square of the calculated free energy deviation from experimental energy ΔΔGRMS,
which was 4.4 kcal•mol−1. The median ΔΔG (ΔΔGMED) for MM-PBSA is 3.5. The effect of
the dielectric constant on the MM-PBSA calculations was also investigated (Table 5).
Doubling the dielectric constant from 1 to 2 resulted in significantly worse agreement
between the MM-PBSA and ITC free energy as evidenced by a five-fold increase in
ΔΔGRMS and a 7-fold increase in (ΔΔGMED). This was also observed for calculations
performed with larger dielectric constants (Table 5).
The above calculations are repeated using a GB model for the electrostatic solvation free
energy (MM-GBSA). MM-GBSA free energies were significantly larger than MM-PBSA
free energies. In some cases, MM-GBSA energies exceeded 18 kcal•mol−1. Seven of the
MM-GBSA free energies deviated from the ITC free energies by 5 kcal•mol−1 compared
with only two for MM-PBSA. Overall the MM-GBSA free energy showed greater deviation
from the ITC free energy (ΔΔGRMS = 9.2 kcal•mol−1) compared with MM-PBSA (ΔΔGRMS
= 4.4 kcal•mol−1). The median ΔΔG for MM-GBSA is 5.2 kcal•mol−1. Despite the large
absolute values, MM-GBSA reproduced the free energy of binding remarkably well in four
cases with ΔΔG less than 1 kcal•mol−1: (i) 7 binding to the mouse major urinary protein 1
(PDB code: 1QY1; |ΔΔG| = 0.6); (ii) 10 binding to hen lysozyme C (PDB code: 1LZB; |
ΔΔG| = 0.7); (iii) 13 binding to the bovine pancreatic trypsin (PDB code: 1S0R; |ΔΔG| =
0.3); and finally (iv) 14 bound to human brain fatty acid binding protein (PDB code: 1FDQ;
|ΔΔG| = 0.3).
Typically, MM-GBSA calculations are carried out by running a single simulation for the
complex. Implicit in this approach is that the ligand will only select conformations of the
apo protein that are similar to those that are sampled by the protein in the protein-ligand
complex. However, there are numerous examples of ligand binding that leads to
conformational change of the protein. The free energy of this conformational change, also
known as adaptation energy, contributes to the overall free energy of binding.38 We
Wang et al. Page 7
J Chem Inf Model. Author manuscript; available in PMC 2014 October 28.
NIH
-PA
Author M
anuscriptN
IH-P
A A
uthor Manuscript
NIH
-PA
Author M
anuscript

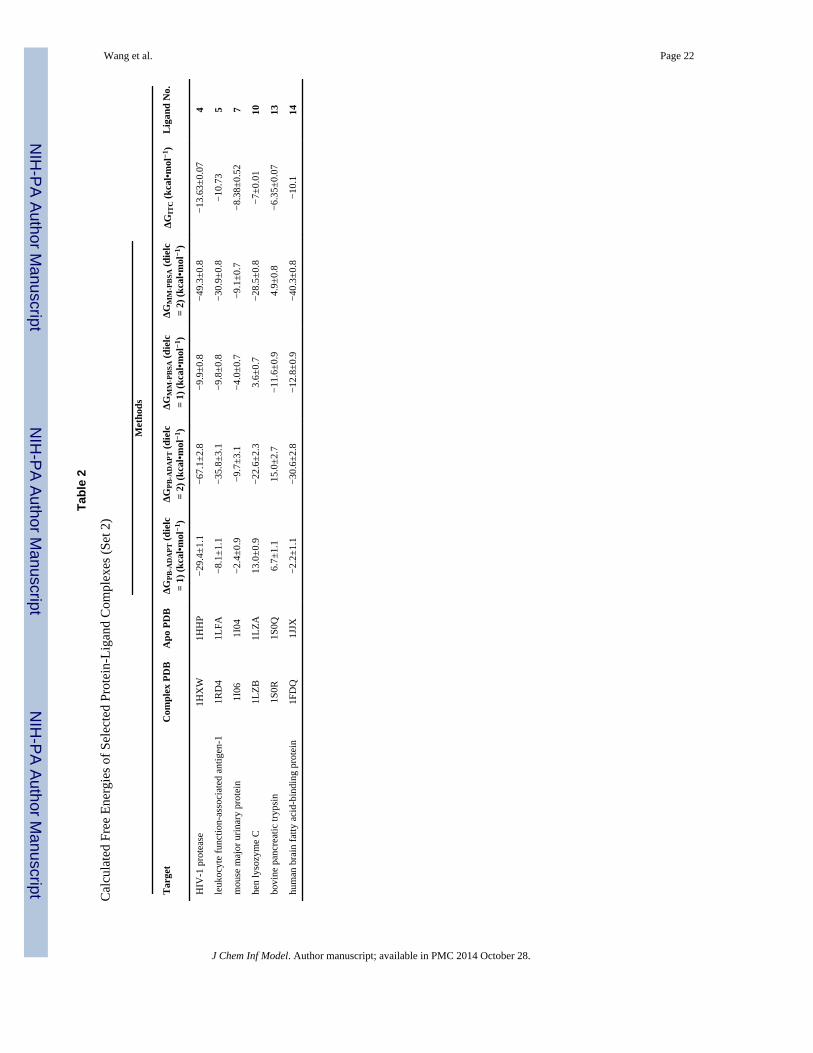
investigate the role of this adaptation energy for 6 of the 14 complexes (Table 2 and Fig. 3B)
for which the crystal structure of the apo was solved independently from the complex
structure. Starting with the structure of complex, apo and ligand, three separate MD
simulations were carried out. The root-mean-square deviation (RMSD) of the free protein
and ligand were determined with respect to the crystal structure of the protein and ligand in
the complex crystal structure (Supporting Information Fig. S1). The protein and ligand
sampled different structures in the free-state compared to the bound state.
The snapshots from the three separate simulations of complex, apo and ligand are used to
carry out MM-PBSA free energy calculations (ΔGPB-ADAPT) (Table 2). These are compared
with the standard MM-PBSA free energies (ΔGMM-PBSA) (Table 2, Fig. 3B). Overall, the
root-mean-square deviation of ΔGPB-ADAPT from the ITC free energies is ΔΔGRMS = 12.4
kcal•mol−1 with a median ΔΔG of 7.6 kcal•mol−1 (Table 3). Hence, ΔGPB-ADAPT resulted in
overall greater deviation from the experimental free energy than both MM-GBSA
(ΔGMM-GBSA) and MM-PBSA (ΔGMM-PBSA). Only one out of the 6 complexes, namely 5 in
complex with human leukocyte function-associated antigen-1 (PDB code: 1RD4; |ΔΔG| =
2.6), showed reasonable agreement with experiment (<3 kcal•mol−1). The remaining five
exhibited binding free energies that were substantially different from the ITC data.
A question of interest is whether scoring functions can generate reliable binding affinities
when carried out on multiple structures sampled from MD simulations instead of crystal
structures. To address this question, we applied our recently-developed scoring function,
SVRKB,22 to snapshots from MD simulations. The empirical scoring function is trained on
three-dimensional protein-ligand crystal structures and experimentally-measured binding
affinity data. SVRKB is used to score MD snapshots of the 14 complexes considered for
MM-GBSA and MM-PBSA calculations (Table 1 and 2). We refer to this approach as MM-
SVRKB to emphasize the use of multiple MD structures in the scoring. MM-SVRKB
(ΔΔGRMS= 2.1 kcal•mol−1) showed better agreement with the experimental free energies
than MM-PBSA (ΔΔGRMS = 4.4 kcal•mol−1). In fact, |ΔΔGMM-SVRKB| was less than 2
kcal•mol−1 for 10 of the targets, compared with three for the MM-PBSA calculations. None
of the predicted MM-SVRKB binding affinities were greater than 5 kcal·mol−1 than the
experimentally-measured affinity.
Finally, we compared calculations performed using harmonic versus quasiharmonic
approaches for the entropy of binding. Two approaches were considered, namely normal
mode analysis, or the use of a quasiharmonic approach where the entropies are determined
by a covariance analysis of the fluctuations obtained from the MD simulations. The MM-
PBSA free energies obtained with the normal mode analysis resulted in a ΔΔGRMS= 4.4
kcal•mol−1 when compared with the ITC free energy, and a median of 3.5 kcal•mol−1 for
ΔΔG (Fig. 3C). On the other hand, the MM-PBSA free energies for the quasiharmonic
approach led to a ΔΔGRMS of 10.1 kcal•mol−1 and a median value of 6.1 kcal•mol−1.
Rank Ordering Protein Ligand Complexes
Performance to rank-order complexes was evaluated using three correlation metrics, namely
the Pearson's correlation coefficient (Rp), Spearman's rho (ρ), and Kendall's tau (τ).
Pearson's coefficient is the more traditional metric used to measure the correlation between
Wang et al. Page 8
J Chem Inf Model. Author manuscript; available in PMC 2014 October 28.
NIH
-PA
Author M
anuscriptN
IH-P
A A
uthor Manuscript
NIH
-PA
Author M
anuscript

observed and predicted affinities. Spearman's rho is a non-parametric measure of the
correlation between the ranked lists of the experimental binding affinities and the scores. It
ranges between −1 and 1. A negative value corresponds to anti-correlation while a positive
value suggests correlation between the variables. Kendall's tau (τ) was also considered to
assess rank-ordered correlation as suggested by Jain and Nicholls.39 τ has the advantage of
being more robust and can be more easily interpreted. It corresponds to the probability of
having the same trend between two rank-ordered lists.
It is interesting that despite the better performance of MM-PBSA in predicting the absolute
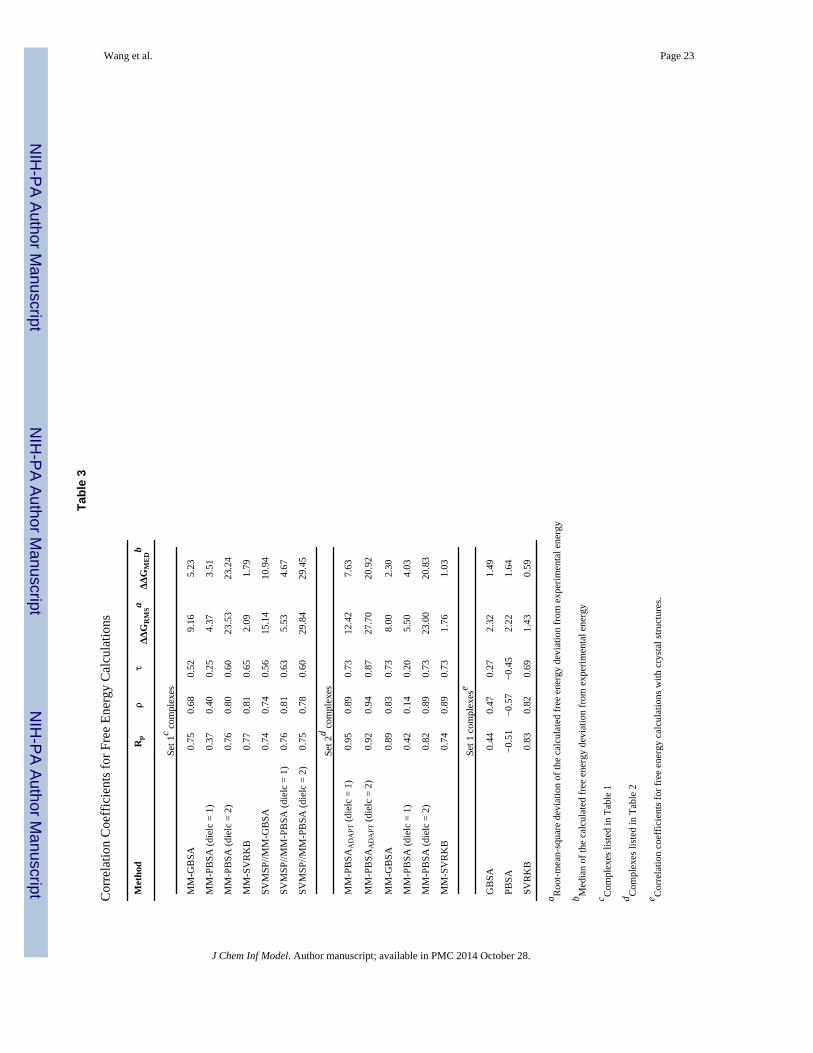
free energy, the opposite is observed for rank-ordering. All three correlation coefficients
metrics were significantly higher for MM-GBSA (Rp = 0.75; ρ = 0.68; τ = 0.52) compared
with MM-PBSA (Rp = 0.37; ρ = 0.40; τ = 0.25) (Table 3, Fig. 4A). At higher dielectric
constants, the correlations for MM-PBSA significantly improves (Table 5). A mere doubling
of the dielectric onstant from 1 to 2 led to a similar increase in the correlation factors (Rp =
0.77; ρ = 0.81; τ = 0.65). Further increase of the dielectric beyond two results in smaller
increases in performance, as illustrated by the correlations at a dielectric constant of 20 (Rp
= 0.90; ρ = 0.91; τ = 0.76). But inspection of the components of the free energy (Table 6)
reveals that this increase in performance is not due to more accurate representation of the
electrostatic component of the free energy. Instead, it is attributed to the significantly
smaller contributions of the electrostatic energy at higher dielectric constants. An increase in
the dielectric constant reduced ΔEELE and ΔEPB by a factor of 1/ε and 1/ε 2, respectively,
where ε is the dielectric constant. As a results, the lower contributions from the electrostatic
component results in a free energy component that is dominated by the non-polar and
entropy terms. SVRKB applied to MD structures (MM SVRKB) showed better performance
than MM-GBSA (Rp = 0.77; ρ = 0.81; τ = 0.65) (Fig. 4C, Fig. 6A). Interestingly, free
energies that included the adaptation energy (ΔGPB-ADAPT) exhibited dramatic improvement
over MM-PBSA (Rp = 0.95; ρ = 0.89; τ = 0.73) (Table 3, Set 2, Fig.4B). ΔGPB-ADAPT
correlations are also better than MM-SVRKB (Rp = 0.74; ρ = 0.89; τ = 0.73).
MM-GBSA and MM-PBSA calculations are performed on multiple structures collected
from MD simulations. Typically, snapshots are selected at regular intervals. We wondered
how MD snapshots can be pre-scored to improve the MM-PBSA or MM-SVRKB results.
We had previously developed a scoring approach (SVMSP) to distinguish between native
and non native binding modes.21 Scoring of MD snapshots with SVMSP is expected to
enrich these structures for native-like complexes. SVMSP was used to score all snapshots
from MD simulations for each of the 14 targets considered in this work. A total of 500
complexes with the top SVMSP scores were selected for MM-GBSA calculations. The
combined SVMSP//MM-GBSA scoring did not improve the predictive abilities of MM-
GBSA suggesting that the GB method is less sensitive to the structure used in the calculation
(Table 3, Fig. 6B). However, a dramatic boost in performance is observed for SVMSP//MM-
PBSA (Table 3, Fig. 6B). In fact, an increase of 0.39, 0.41, and 0.38 is seen for Rp, ρ and τ,
respectively. In Set 2, SVMSP//MMPBSA's prediction of the binding affinity trend is as
good as MM-PBSAADAPT. Components of the MM-PBSA or MM-GBSA calculations are
insightful as they provide insight into the free energy of binding (Table 6). But an important
question is whether these components correlate with the experimentally-determined
Wang et al. Page 9
J Chem Inf Model. Author manuscript; available in PMC 2014 October 28.
NIH
-PA
Author M
anuscriptN
IH-P
A A
uthor Manuscript
NIH
-PA
Author M
anuscript

thermodynamic parameters provided by ITC. Each component of the MM-GBSA and MM-
PBSA calculations is plotted against the ITC free energy. It was interesting, but not
completely surprising38, 40 that the non-polar components of the binding affinity correlated
with the ITC free energy (Table 4 and Fig. 5). The correlation coefficients were Rp = 0.89, ρ
= 0.90, τ = 0.76 and Rp = 0.88, ρ = 0.89, τ = 0.74 for the van der Waals energy (ΔEVDW)
and the non-polar component of the solvation free energy (ΔENP), respectively. There was
no correlation between the electrostatic components of the free energy (ΔEELE) and the ITC
free energy. There was also no correlation between the reaction field energy calculated by
PB (ΔEPB) and the ITC free energy. This is consistent with previous results that showed that
the non-polar component of the free energy was a significantly better predictor of the
stability of protein-protein complexes than the electrostatic component.38, 40 Finally, there
was no correlation between molecular weight of ligand and binding affinity (Rp = −0.51, ρ =
−0.65, τ = −0.51).
The entropy component of the MM-GBSA and MM-PBSA calculations follows a similar
trend to the true entropy of binding. The availability of ITC data for each of our systems
provides an opportunity to compare computed versus experimental entropy. For MM-PBSA
and MM-GBSA, the entropy is typically determined using either normal modes or a
quasiharmonic analysis. Fig. 3C shows that these two approaches result in different free
energies with overall better agreement for the free energy from the normal mode analysis.
The correlations MM-PBSA free energies using normal mode was Rp = 0.37, ρ = 0.40, τ =
0.25, compared with Rp = −0.20, ρ = −0.30, τ = −0.25 for the quasiharmonic analysis. The
normal mode and quasiharmonic entropies are compared to the experimental entropy. A plot
of TΔSITC versus TΔSNM or TΔSQHA shows that computed and experimental entropies are
anti-correlated with correlation coefficients of (Rp = −0.63; ρ = −0.55; τ = −0.43) and (Rp =
−0.47; ρ = −0.45; τ = −0.30), respectively (Fig. 5E and 5F). No change is observed when the
entropy change of ligand only (TΔSNMLig), or receptor only (TΔSNM
Apo) are compared to
the ITC entropy (Table 4).
The performance of MM-GBSA and MM-PBSA is compared to GBSA and PBSA, which
correspond to calculations performed on a single crystal structure for each of the complexes
in Table 1. Correlation coefficients reveal that both GBSA and PBSA perform poorly in
rank-ordering complexes when a single crystal structure is used (Fig. 6C). For GBSA all
three correlation factors were smaller than 0.5 (Rp = 0.44; ρ = 0.47; τ = 0.27), and for PBSA,
predicted and experimental data were anti-correlated (Rp = −0.51; ρ = −0.57; τ = −0.45).
SVRKB, on the other hand, performed well consistent with our previous study 22 (Rp =
0.83; ρ = 0.82; τ = 0.69).
DISCUSSION
MM-GBSA and MM-PBSA calculations are applied to a diverse set of 14 ligands bound to
11 different proteins. A unique aspect of this work is that (i) a diverse set of proteins and
ligands are used in contrast to most studies that compare ligands bound to the same protein;
(ii) all complexes were previously solved by x-ray crystallography and binding was
characterized by ITC. The ligands included small organic compounds, cyclic and linear
peptides, fragment like small molecules, and carbohydrates. Most free energy calculations
Wang et al. Page 10
J Chem Inf Model. Author manuscript; available in PMC 2014 October 28.
NIH
-PA
Author M
anuscriptN
IH-P
A A
uthor Manuscript
NIH
-PA
Author M
anuscript

did not accurately reproduce the ITC free energy. But there were several cases that were in
excellent agreement with ITC: Three complexes for MM-PBSA calculations, and four for
MM-GBSA. Overall, MM-PBSA resulted in less deviation from the experimental data than
MM-GBSA. But the opposite was observed for rank-ordering. MM-GBSA correlated
significantly better with the ITC free energy (Rp = 0.75; ρ = 0.68; τ = 0.52) when compared
to MM-PBSA (Rp = 0.37; ρ = 0.40; τ = 0.25). The non-polar terms (ΔGVDW and ΔGNP)
showed strong correlation with the experimental free energy (Rp = 0.89; ρ = 0.90; τ = 0.76
and Rp = 0.88; ρ = 0.89; τ = 0.74 for ΔGVDW and ΔGNP, respectively). An increase in the
dielectric constant for the MM-PBSA calculations worsened agreement of the computed and
experimental free energies. However, rank-ordering appeared to significantly improve upon
increase of the dielectric constant. But close inspection of the components of the free energy
reveals that this increase is attributed to the lower contribution of electrostatics as a results
of an increase of the dielectric constant. The Coulomb and electrostatic terms are inversely
proportional to the dielectric constant and to the square of the dielectric constant,
respectively. Less contribution from electrostatics leads to a free energy that is dominated by
the non-polar and entropy components resulting to better performance. There was no
correlation between the electrostatic components of the MM-GBSA and MM-PBSA free
energy and the ITC free energy.
Two models for the entropy were considered, normal mode and quasiharmonic. Normal
mode analysis assumes that each structure is at a potential energy minimum. Quasiharmonic
analysis is based on a covariance analysis of the atomic fluctuation. Our data showed that
the free energies using normal mode analysis correlated significantly better than free
energies using quasiharmonic analysis. A possible explanation is that the simulations used in
this study may not have been sufficiently long to ensure convergence of quasiharmonic
analysis. Neither the normal mode entropy nor the quasiharmonic entropies correlated with
the ITC entropy. This is likely due to the fact that the ITC entropy includes both solvation
and configurational entropy,41 while the computed entropy only includes the configurational
entropy. The solvation entropies may be indirectly captured by the other terms of the MM-
GBSA or MM-PBSA free energy.
Small-molecule binding often induces conformational change to the target protein. This
adaptation energy is often ignored in MM-GBSA or MM-PBSA calculations as a single
simulation is carried out starting with the complex structure. The structure of the apo protein
is extracted from the complex. We studied the effect of this adaptation energy by running a
separate simulation for ligand, apo and complex structures. We did this for 6 of the 14
complexes whose apo structure was solved independently by x-ray crystallography. Overall,
this resulted in poorer agreement with the ITC data when comparing the absolute values of
the free energies. However, the adaptation energy resulted in a significant boost in rank-
ordering. The ΔGPB-ADAPT resulted in a Pearson (Spearman) correlation of 0.95 (0.89)
compared with 0.89 (0.83) for ΔGMM-GBSA and 0.42 (0.14) for ΔGMM-PBSA. The
ΔGPB-ADAPT showed the best rank-ordering among all methods that were tested in this
work.
Typically snapshots for MM-GBSA or MM-PBSA calculations are selected at regular
intervals in an MD simulation. We wondered whether different approaches for selecting
Wang et al. Page 11
J Chem Inf Model. Author manuscript; available in PMC 2014 October 28.
NIH
-PA
Author M
anuscriptN
IH-P
A A
uthor Manuscript
NIH
-PA
Author M
anuscript

structures will influence the free energy of binding. We used a recently-developed machine
learning-based scoring approach (SVMSP) to pre-score all the snapshots in a trajectory.
SVMSP is trained from crystallography and docked protein-decoy structures to classify
protein-ligand complexes.21 It is therefore expected that the method will enrich MD
snapshots for native-like structures. Rank-ordering of snapshots (Table 3) had little
influence on the MM-GBSA free energies (Table 3). However, rank-ordering with MM-
PBSA calculations improved significantly from Rp = 0.37, ρ = 0.40, τ = 0.25 for snapshots
selected at regular intervals to Rp = 0.76, ρ = 0.81, τ = 0.63 for SVMSP-selected snapshots.
These results indicate that the Poisson-Boltzmann calculations are more sensitive to the
quality of the structure than MM-GBSA.
In sum, MM-GBSA and MM-PBSA methods come short in reliably reproducing the free
energy of binding. However, these methods can perform remarkably well for rank-ordering
diverse set of compounds. MM-GBSA can perform well by merely using snapshots from an
MD simulation of the complex, while MM-PBSA is significantly more sensitive to the
structures used. Filtering MD structures with scoring functions to enrich for native-like
complexes results in excellent rank-ordering by MM-PBSA. In addition, running separate
simulations of the receptor also improves the rank-ordering abilities of MM-PBSA. While
previous studies have found that rank-ordering performance for MM-PBSA improves with
increasing dielectric constant, we found that this is mainly due to the smaller contributions
of electrostatics as a result of increasing the dielectric constant (at ε = 5, for example, the
Coulomb energy is reduced by a factor of 1/5 and the PB solvation energy by 1/25). It was
remarkable that the non-polar components correlated very well with the free energy. The
combination of non-polar and entropy also correlated very well with the free energy, which
is why overall correlation improved at higher dielectric constants for MM-PBSA. Finally,
the MM-PBSA entropy does not correlation with the ITC entropy.
Supplementary Material
Refer to Web version on PubMed Central for supplementary material.
Acknowledgments
The research was supported by the NIH (CA135380 and AA0197461) and the INGEN grant from the LillyEndowment, Inc. (SOM). Computer time on the Big Red supercomputer at Indiana University is funded by theNational Science Foundation and by Shared University Research grants from IBM, Inc. to Indiana University.
REFERENCES
1. Li L, Li J, Khanna M, Jo I, Baird JP, Meroueh SO. Docking to erlotinib off-targets leads toinhibitors of lung cancer cell proliferation with suitable in vitro pharmacokinetics. ACS Med.Chem. Lett. 2010; 1:229–233. [PubMed: 20824148]
2. De Ruiter A, Oostenbrink C. Efficient and accurate free energy calculations on trypsin inhibitors. J.Chem. Theory Comput. 2012; 8:3686–3695.
3. Wan S, Coveney PV, Flower DR. Peptide recognition by the T cell receptor: Comparison of bindingfree energies from thermodynamic integration, Poisson-Boltzmann and linear interaction energyapproximations. Phil. Trans. R. Roc. A. 2005; 363:2037–2053.
4. Golemi-Kotra D, Meroueh SO, Kim C, Vakulenko SB, Bulychev A, Stemmler AJ, Stemmler TL,Mobashery S. The importance of a critical protonation state and the fate of the catalytic steps in
Wang et al. Page 12
J Chem Inf Model. Author manuscript; available in PMC 2014 October 28.
NIH
-PA
Author M
anuscriptN
IH-P
A A
uthor Manuscript
NIH
-PA
Author M
anuscript

class A β-lactamases and penicillin-binding proteins. J. Biol. Chem. 2004; 279:34665–34673.[PubMed: 15152012]
5. Oostenbrink CB, Pitera JW, Van Lipzig MMH, Meerman JHN, Van Gunsteren WF. Simulations ofthe estrogen receptor ligand-binding domain: Affinity of natural ligands and xenoestrogens. J. Med.Chem. 2000; 43:4594–4605. [PubMed: 11101351]
6. Lawrenz M, Wereszczynski J, Ortiz-Sánchez J, Nichols S, McCammon JA. Thermodynamicintegration to predict host-guest binding affinities. J. Comput-Aided. Mol. Des. 2012; 26:569–576.[PubMed: 22350568]
7. Steinbrecher T, Case DA, Labahn A. Free energy calculations on the binding of novelthiolactomycin derivatives to E. coli fatty acid synthase I. Bioorg. Med. Chem. 2012; 20:3446–3453. [PubMed: 22560835]
8. Lawrenz M, Wereszczynski J, Amaro R, Walker R, Roitberg A, McCammon JA. Impact of calciumon N1 influenza neuraminidase dynamics and binding free energy. Proteins: Struct., Funct., Bioinf.2010; 78:2523–2532.
9. Irwin JJ, Sterling T, Mysinger MM, Bolstad ES, Coleman RG. ZINC: A free tool to discoverchemistry for biology. J. Chem. Inf. Model. 2012; 52:1757–1768. [PubMed: 22587354]
10. Chong LT, Dempster SE, Hendsch ZS, Lee L-P, Tidor B. Computation of electrostaticcomplements to proteins: A case of charge stabilized binding. Protein Sci. 1998; 7:206–210.[PubMed: 9514276]
11. Ponder JW, Case DA. Force fields for protein simulations. Adv. Protein Chem. 2003; 66:27–85.[PubMed: 14631816]
12. Luo R, David L, Gilson MK. Accelerated Poisson-Boltzmann calculations for static and dynamicsystems. J. Comput. Chem. 2002; 23:1244–1253. [PubMed: 12210150]
13. Still CW, Tempczyk A, Hawley RC, Hendrickson T. Semianalytical treatment of solvation formolecular mechanics and dynamics. J. Am. Chem. Soc. 1990; 112:6127–6129.
14. Karplus M, Kushick JN. Method for estimating the configurational entropy of macromolecules.Macromolecules. 1981; 14:325–332.
15. Wang J, Morin P, Wang W, Kollman PA. Use of MM-PBSA in reproducing the binding freeenergies to HIV-1 RT of TIBO derivatives and predicting the binding mode to HIV-1 RT ofefavirenz by docking and MM-PBSA. J. Am. Chem. Soc. 2001; 123:5221–5230. [PubMed:11457384]
16. Gohlke H, Hendlich M, Klebe G. Knowledge-based scoring function to predict protein-ligandinteractions. J. Mol. Biol. 2000; 295:337–356. [PubMed: 10623530]
17. Basdevant N, Weinstein H, Ceruso M. Thermodynamic basis for promiscuity and selectivity inprotein-protein interactions: PDZ domains, a case study. J. Am. Chem. Soc. 2006; 128:12766–12777. [PubMed: 17002371]
18. Grünberg R, Nilges M. Leckner, J. Flexibility and conformational entropy in protein-proteinbinding. Structure. 2006; 14:683–693. [PubMed: 16615910]
19. Lill MA, Thompson JJ. Solvent interaction energy calculations on molecular dynamics trajectories:Increasing the efficiency using systematic frame selection. J. Chem. Inf. Model. 2011; 51:2680–2689. [PubMed: 21870864]
20. Li L, Dantzer JJ, Nowacki J, O'Callaghan BJ, Meroueh SO. PDBcal: A comprehensive dataset forreceptor-ligand interactions with three-dimensional structures and binding thermodynamics fromisothermal titration calorimetry. Chem. Biol. Drug Des. 2008; 71:529–532. [PubMed: 18482338]
21. Li L, Khanna M, Jo I, Wang F, Ashpole NM, Hudmon A, Meroueh SO. Target-specific supportvector machine scoring in structure-based virtual screening: Computational validation, in vitrotesting in kinases, and effects on lung cancer cell proliferation. J. Chem. Inf. Model. 2011;51:755–759. [PubMed: 21438548]
22. Li L, Wang B, Meroueh SO. Support vector regression scoring of receptor–ligand complexes forrank-ordering and virtual screening of chemical libraries. J. Chem. Inf. Model. 2011; 51:2132–2138. [PubMed: 21728360]
23. Word JM, Lovell SC, Richardson JS, Richardson DC. Asparagine and glutamine: Using hydrogenatom contacts in the choice of side-chain amide orientation. J. Mol. Biol. 1999; 285:1735–1747.[PubMed: 9917408]
Wang et al. Page 13
J Chem Inf Model. Author manuscript; available in PMC 2014 October 28.
NIH
-PA
Author M
anuscriptN
IH-P
A A
uthor Manuscript
NIH
-PA
Author M
anuscript

24. Jakalian A, Jack DB, Bayly CI. Fast, efficient generation of high-quality atomic charges. AM1-BCC model: II. Parameterization and validation. J. Comput. Chem. 2002; 23:1623–1641.[PubMed: 12395429]
25. Case, DA.; Darden, TA.; T.E. Cheatham, I.; Simmerling, CL.; Wang, J.; Duke, RE.; Luo, R.; Merz,KM.; Pearlman, DA.; Crowley, M.; Walker, RC.; Zhang, W.; Wang, B.; Hayik, S.; Roitberg, A.;Seabra, G.; Kolossváry, I.; Wong, KF.; Paesani, F.; Wu, X.; Brozell, SR.; Tsui, V.; Schafmeister,H.; Ross, WS.; Kollman, PA. AMBER9. University of California; San Fransico: 2006.
26. Jorgensen WL, Chandrasekhar J, Madura JD, Impey RW, Klein ML. Comparison of simplepotential functions for simulating liquid water. J. Chem. Phys. 1983; 79:926–935.
27. Duan Y, Wu C, Chowdhury S, Lee MC, Xiong G, Zhang W, Yang R, Cieplak P, Luo R, Lee T,Caldwell J, Wang J, Kollman P. A point-charge force field for molecular mechanics simulations ofproteins based on condensed-phase quantum mechanical Calculations. J. Comput. Chem. 2003;24:1999–2012. [PubMed: 14531054]
28. Ryckaert J-P, Ciccotti G, Berendsen HJC. Numerical integration of the cartesian equations ofmotion of a system with constraints: Molecular dynamics of n-alkanes. J. Comput. Phys. 1977;23:327–341.
29. Srinivasan J, Cheatham TE, Cieplak P, Kollman PA, Case DA. Continuum solvent studies of thestability of DNA, RNA, and phosphoramidate-DNA helices. J. Am. Chem. Soc. 1998; 120:9401–9409.
30. Massova I, Kollman PA. Combined molecular mechanical and continuum solvent approach (MM-PBSA/GBSA) to predict ligand binding. Perspect. Drug Discovery Des. 2000; 18:113–135.
31. Wang W, Lim WA, Jakalian A, Wang J, Wang J, Luo R, Bayly CI, Kollman PA. An analysis ofthe interactions between the Sem-5 SH3 domain and its ligands using molecular dynamics, freeenergy calculations, and sequence analysis. J. Am. Chem. Soc. 2001; 123:3986–3994. [PubMed:11457149]
32. Honig B, Nicholls A. Classical electrostatics in biology and chemistry. Science. 1995; 268:1144–1149. [PubMed: 7761829]
33. Sitkoff D, Sharp KA, Honig B. Accurate calculation of hydration free energies using macroscopicsolvent models. J. Phys. Chem. 1994; 98:1978–1988.
34. Connolly ML. Analytical molecular surface calculation. J. Appl. Crystallogr. 1983; 16:548–558.
35. Tan C, Yang L, Luo R. How well does Poisson-Boltzmann implicit solvent agree with explicitsolvent? A quantitative analysis. J. Phys. Chem. B. 2006; 110:18680–18687. [PubMed: 16970499]
36. Onufriev A, Bashford D, Case DA. Exploring protein native states and large-scale conformationalchanges with a modified Generalized Born model. Proteins: Struct., Funct., Bioinf. 2004; 55:383–394.
37. Onufriev A, Bashford D, Case DA. Modification of the Generalized Born model suitable formacromolecules. J. Phys. Chem. B. 2000; 104:3712–3720.
38. Liang S, Li L, Hsu W-L, Pilcher MN, Uversky V, Zhou Y, Dunker KA, Meroueh SO. Exploringthe molecular design of protein interaction sites with molecular dynamics simulations and freeenergy calculations. Biochemistry. 2008; 48:399–414. [PubMed: 19113835]
39. Jain A, Nicholls A. Recommendations for evaluation of computational methods. J. Comput-Aided.Mol. Des. 2008; 22:133–139. [PubMed: 18338228]
40. Li L, Liang S, Pilcher MM, Meroueh SO. Incorporating receptor flexibility in the molecular designof protein interfaces. Protein Eng., Des. Sel. 2009; 22:575–586. [PubMed: 19643976]
41. Lee KH, Xie D, Freire E, Amzel ML. Estimation of changes in side chain configurational entropyin binding and folding: General methods and application to helix formation. Proteins Struct. Funct.Bioinformat. 1994; 20:68–84.
Wang et al. Page 14
J Chem Inf Model. Author manuscript; available in PMC 2014 October 28.
NIH
-PA
Author M
anuscriptN
IH-P
A A
uthor Manuscript
NIH
-PA
Author M
anuscript
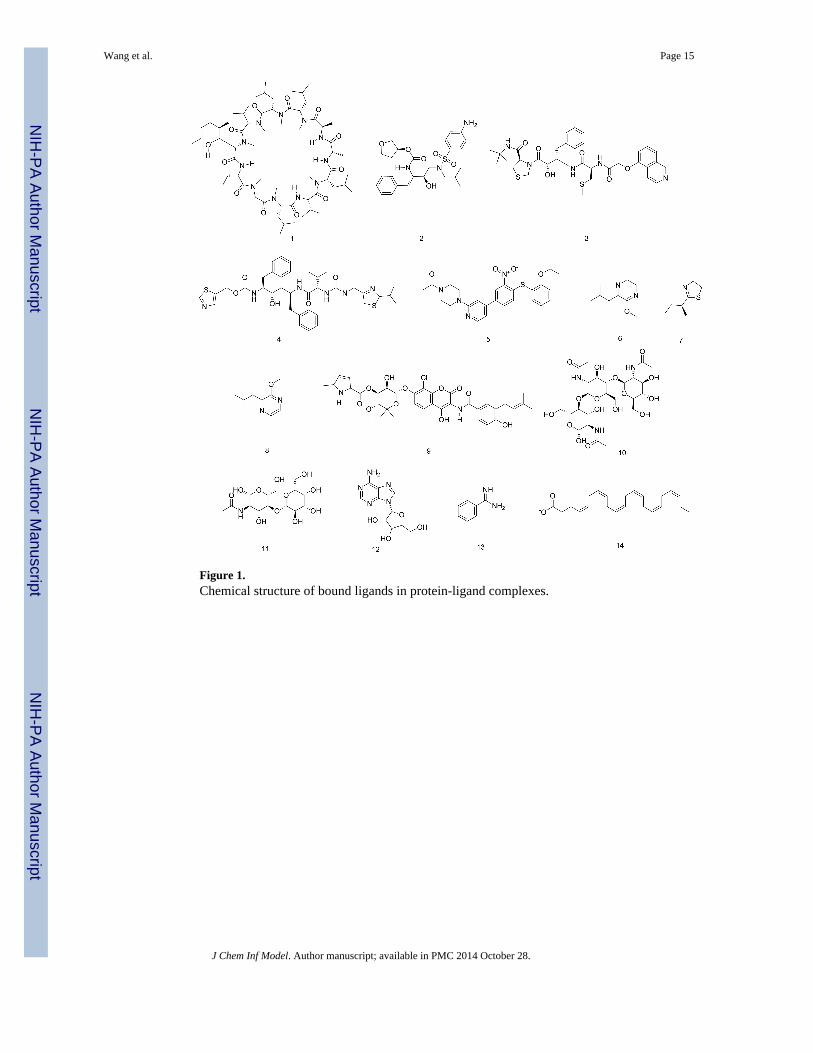
Figure 1.Chemical structure of bound ligands in protein-ligand complexes.
Wang et al. Page 15
J Chem Inf Model. Author manuscript; available in PMC 2014 October 28.
NIH
-PA
Author M
anuscriptN
IH-P
A A
uthor Manuscript
NIH
-PA
Author M
anuscript

Figure 2. Stereoview of three-dimensional structures for apo proteins and protein-ligandcomplexesThe protein structure in complex is illustrated as a cartoon representation in cyan. The apo
protein structure (if available) is illustrated as a cartoon representation in blue. Atoms within
5.5 Å of the ligands in complex is considered as pocket atoms and illustrated in a surface
representation in orange. The ligand is illustrated as sticks representation in the color-coded
by atom types (yellow, red, and blue for carbon, oxygen and nitrogen). All illustrations were
generated by PyMOL (The PyMOL Molecular Graphics System, Version 1.5.0.4
Schrödinger, LLC).
Wang et al. Page 16
J Chem Inf Model. Author manuscript; available in PMC 2014 October 28.
NIH
-PA
Author M
anuscriptN
IH-P
A A
uthor Manuscript
NIH
-PA
Author M
anuscript

Figure 3. Calculated free energy deviation from experimental energy in ΔGITC-ΔGCalc ofselected protein-ligand complexes with different methods(A) ΔGMM-GBSA, ΔGMM-PBSA, and ΔGMM-SVRKB for complexes in Set 1; (B) ΔGMM-PBSA
and ΔGPB-ADAPT for complexes in Set 2; and (C) ΔGMM-PBSA with normal mode calculated
entropy and ΔGMM-PBSA with quasiharmonic analysis estimated entropy for complexes in
Set 1.
Wang et al. Page 17
J Chem Inf Model. Author manuscript; available in PMC 2014 October 28.
NIH
-PA
Author M
anuscriptN
IH-P
A A
uthor Manuscript
NIH
-PA
Author M
anuscript

Figure 4. Regression plots between experimental free energy (ΔGITC) and different calculatedfree energy of selected protein-ligand complexes(A) ΔGMM-GBSA, ΔGMM-PBSA (dielc = 1) and ΔGMM-PBSA (dielc = 2) for complexes in Set
1; (B) ΔGMM-PBSA and ΔGPB-ADAPT for complexes in Set 2; and (C) ΔGMM-SVRKB for
complexes in Set 1.
Wang et al. Page 18
J Chem Inf Model. Author manuscript; available in PMC 2014 October 28.
NIH
-PA
Author M
anuscriptN
IH-P
A A
uthor Manuscript
NIH
-PA
Author M
anuscript

Figure 5. Regression plots between experimental free energy (ΔGITC) and different componentof calculated free energy(A) ΔEVDW; (B) ΔENP; (C) ΔEELE; (D) ΔEPB; (E) TΔSNM; and (F) TΔSQHA.
Wang et al. Page 19
J Chem Inf Model. Author manuscript; available in PMC 2014 October 28.
NIH
-PA
Author M
anuscriptN
IH-P
A A
uthor Manuscript
NIH
-PA
Author M
anuscript

Figure 6. Performance on Pearson's correlation coefficient Rp, Spearman's ρ and Kendall's τcorrelation coefficients(A) ΔGMM-GBSA, ΔGMM-PBSA (dielc = 1), ΔGMM-PBSA (dielc = 2), and ΔGMM-SVRKB for
multiple MD structures; (B) ΔGMM-GBSA, ΔGSVMSP//MM-GBSA, ΔGMM-PBSA and
ΔGSVMSP//MM-PBSA for multiple MD structures; and (C) ΔGGBSA, ΔGPBSA, and ΔGSVRKB
for single crystal structure.
Wang et al. Page 20
J Chem Inf Model. Author manuscript; available in PMC 2014 October 28.
NIH
-PA
Author M
anuscriptN
IH-P
A A
uthor Manuscript
NIH
-PA
Author M
anuscript

NIH
-PA
Author M
anuscriptN
IH-P
A A
uthor Manuscript
NIH
-PA
Author M
anuscript
Wang et al. Page 21
Tab
le 1
Cal
cula
ted
Free
Ene
rgie
s of
Sel
ecte
d Pr
otei
n-L
igan
d C
ompl
exes
(Se
t 1) M
etho
ds
Tar
get
Com
plex
PD
BΔ
GM
M-G
BSA
(kca
l•m
ol−1
)Δ
GM
M-P
BSA
(die
lc =
1)
(kca
l•m
ol−1
)
ΔG
MM
-PB
SA(d
ielc
= 2
)(k
cal•
mol
−1 )
ΔG
MM
-SV
RK
B
(kca
l•m
ol−1
)Δ
GSV
MSP
//
MM
-PB
SA(d
ielc
= 1
)(k
cal•
mol
−1 )
ΔG
SVM
SP//
MM
-PB
SA(d
ielc
= 2
)(k
cal•
mol
−1 )
ΔG
ITC
(kca
l•m
ol−1
)L
igan
dN
o.
hum
an c
yclo
phili
n A
1CW
A−
17.4
±0.
7−
13.1
±0.
8−
36.6
±0.
7−
7.3
−17
.0±
0.4
−41
.0±
0.7
−10
.9±
0.03
1
HIV
-1 p
rote
ase
1HPV
−18
.9±
0.8
−8.
2±0.
8−
38.5
±0.
8−
10.1
−15
.6±
0.3
−43
.7±
0.8
−12
.62
HIV
-1 p
rote
ase
1HPX
−31
.1±
0.8
−12
.5±
0.8
−49
.0±
0.8
−11
.5−
21.1
±0.
4−
58.9
±0.
8−
13.3
3
HIV
-1 p
rote
ase
1HX
W−
32.4
±0.
8−
9.9±
0.8
−49
.3±
0.8
−10
.1−
24.6
±0.
4−
65.8
±0.
8−
13.6
3±0.
074
leuk
ocyt
e fu
nctio
n-as
soci
ated
ant
igen
-11R
D4
−14
.9±
0.8
−9.
8±0.
8−
30.9
±0.
8−
11.1
−17
.9±
0.2
−39
.5±
0.8
−10
.73
5
porc
ine
odor
ant-
bind
ing
prot
ein
1DZ
K−
6.2±
0.6
−5.
9±0.
6−
13.2
±0.
6−
5.8
−6.
0±0.
2−
13.0
±0.
6−
9.2
6
mou
se m
ajor
uri
nary
pro
tein
1I06
−4.
4±0.
7−
4.0±
0.7
−9.
1±0.
7−
7.2
−3.
2±0.
2−
9.0±
0.7
−8.
38±
0.52
7
mou
se m
ajor
uri
nary
pro
tein
1QY
1−
7.5±
0.7
−7.
7±0.
7−
13.9
±0.
7−
6.3
−8.
8±0.
3−
14.9
±0.
7−
8.1±
0.07
8
DN
A g
yras
e su
buni
t B1K
ZN
−24
.1±
0.9
−4.
7±1.
0−
41.7
±0.
9−
8.8
−14
.0±
0.6
−49
.8±
0.9
−9.
785
9
hen
lyso
zym
e C
1LZ
B−
7.67
±0.
73.
6±0.
7−
28.5
±0.
8−
9.0
−5.
7±0.
3−
39.9
±0.
7−
7±0.
0110
hum
an g
alec
tin-3
1KJL
−13
.7±
0.6
−8.
1±0.
7−
22.3
±0.
6−
5.2
−12
.1±
0.3
−25
.1±
0.6
−5.
611
puri
ne n
ucle
osid
e re
cept
or A
2FQ
Y−
19.4
±1.
0−
13.1
±1.
1−
33.8
±1.
0−
6.9
−11
.3±
0.6
−35
.3±
1.0
−8.
81±
0.09
12
bovi
ne p
ancr
eatic
tryp
sin
1S0R
−6.
6±0.
8−
11.6
±0.
94.
9±0.
8−
5.5
−10
.9±
0.5
5.2±
0.8
−6.
35±
0.07
13
hum
an b
rain
fat
ty a
cid-
bind
ing
prot
ein
1FD
Q−
10.4
±0.
7−
12.8
±0.
9−
40.3
±0.
8−
9.8
−14
.9±
0.6
−41
.7±
0.7
−10
.114
J Chem Inf Model. Author manuscript; available in PMC 2014 October 28.
NIH
-PA
Author M
anuscriptN
IH-P
A A
uthor Manuscript
NIH
-PA
Author M
anuscript
Wang et al. Page 22
Tab
le 2
Cal
cula
ted
Free
Ene
rgie
s of
Sel
ecte
d Pr
otei
n-L
igan
d C
ompl
exes
(Se
t 2)
Met
hods
Tar
get
Com
plex
PD
BA
po P
DB
ΔG
PB
-AD
AP
T (
diel
c=
1) (
kcal
•mol
−1)
ΔG
PB
-AD
AP
T (
diel
c=
2) (
kcal
•mol
−1)
ΔG
MM
-PB
SA (
diel
c=
1) (
kcal
•mol
−1)
ΔG
MM
-PB
SA (
diel
c=
2) (
kcal
•mol
−1)
ΔG
ITC
(kc
al•m
ol−1
)L
igan
d N
o.
HIV
-1 p
rote
ase
1HX
W1H
HP
−29
.4±
1.1
−67
.1±
2.8
−9.
9±0.
8−
49.3
±0.
8−
13.6
3±0.
074
leuk
ocyt
e fu
nctio
n-as
soci
ated
ant
igen
-11R
D4
1LFA
−8.
1±1.
1−
35.8
±3.
1−
9.8±
0.8
−30
.9±
0.8
−10
.73
5
mou
se m
ajor
uri
nary
pro
tein
1I06
1I04
−2.
4±0.
9−
9.7±
3.1
−4.
0±0.
7−
9.1±
0.7
−8.
38±
0.52
7
hen
lyso
zym
e C
1LZ
B1L
ZA
13.0
±0.
9−
22.6
±2.
33.
6±0.
7−
28.5
±0.
8−
7±0.
0110
bovi
ne p
ancr
eatic
tryp
sin
1S0R
1S0Q
6.7±
1.1
15.0
±2.
7−
11.6
±0.
94.
9±0.
8−
6.35
±0.
0713
hum
an b
rain
fat
ty a
cid-
bind
ing
prot
ein
1FD
Q1J
JX−
2.2±
1.1
−30
.6±
2.8
−12
.8±
0.9
−40
.3±
0.8
−10
.114
J Chem Inf Model. Author manuscript; available in PMC 2014 October 28.
NIH
-PA
Author M
anuscriptN
IH-P
A A
uthor Manuscript
NIH
-PA
Author M
anuscript
Wang et al. Page 23
Tab
le 3
Cor
rela
tion
Coe
ffic
ient
s fo
r Fr
ee E
nerg
y C
alcu
latio
ns
Met
hod
Rp
ρτ
ΔΔ
GR
MSa
ΔΔ
GM
ED
b
Set 1
c com
plex
es
MM
-GB
SA0.
750.
680.
529.
165.
23
MM
-PB
SA (
diel
c =
1)
0.37
0.40
0.25
4.37
3.51
MM
-PB
SA (
diel
c =
2)
0.76
0.80
0.60
23.5
323
.24
MM
-SV
RK
B0.
770.
810.
652.
091.
79
SVM
SP//M
M-G
BSA
0.74
0.74
0.56
15.1
410
.94
SVM
SP//M
M-P
BSA
(di
elc
= 1
)0.
760.
810.
635.
534.
67
SVM
SP//M
M-P
BSA
(di
elc
= 2
)0.
750.
780.
6029
.84
29.4
5
Set 2
d com
plex
es
MM
-PB
SAA
DA
PT (
diel
c =
1)
0.95
0.89
0.73
12.4
27.
63
MM
-PB
SAA
DA
PT (
diel
c =
2)
0.92
0.94
0.87
27.7
020
.92
MM
-GB
SA0.
890.
830.
738.
002.
30
MM
-PB
SA (
diel
c =
1)
0.42
0.14
0.20
5.50
4.03
MM
-PB
SA (
diel
c =
2)
0.82
0.89
0.73
23.0
020
.83
MM
-SV
RK
B0.
740.
890.
731.
761.
03
Set 1
com
plex
ese
GB
SA0.
440.
470.
272.
321.
49
PBSA
−0.
51−
0.57
−0.
452.
221.
64
SVR
KB
0.83
0.82
0.69
1.43
0.59
a Roo
t-m
ean-
squa
re d
evia
tion
of th
e ca
lcul
ated
fre
e en
ergy
dev
iatio
n fr
om e
xper
imen
tal e
nerg
y
b Med
ian
of th
e ca
lcul
ated
fre
e en
ergy
dev
iatio
n fr
om e
xper
imen
tal e
nerg
y
c Com
plex
es li
sted
in T
able
1
d Com
plex
es li
sted
in T
able
2
e Cor
rela
tion
coef
fici
ents
for
fre
e en
ergy
cal
cula
tions
with
cry
stal
str
uctu
res.
J Chem Inf Model. Author manuscript; available in PMC 2014 October 28.

NIH
-PA
Author M
anuscriptN
IH-P
A A
uthor Manuscript
NIH
-PA
Author M
anuscript
Wang et al. Page 24
Tab
le 4
Cor
rela
tion
Coe
ffic
ient
s fo
r C
ompo
nent
s of
Fre
e E
nerg
y C
alcu
latio
ns
Com
pone
ntR
pρ
τ
Set 1
com
plex
es
ΔE
VD
W0.
890.
900.
76
ΔE
NP
0.88
0.89
0.74
ΔE
EL
E0.
200.
130.
16
ΔE
PB−
0.47
−0.
46−
0.38
TΔ
S NM
−0.
63−
0.55
−0.
43
TΔ
S QH
A−
0.47
−0.
45−
0.30
TΔ
S NM
Lig
−0.
45−
0.10
−0.
07
TΔ
S NM
Apo
0.02
−0.
12−
0.07
J Chem Inf Model. Author manuscript; available in PMC 2014 October 28.

NIH
-PA
Author M
anuscriptN
IH-P
A A
uthor Manuscript
NIH
-PA
Author M
anuscript
Wang et al. Page 25
Tab
le 5
Cor
rela
tion
Coe
ffic
ient
s fo
r M
M-P
BSA
Cal
cula
tions
with
Dif
fere
nt D
iele
ctri
c C
onst
ants
Die
lect
ric
Con
stan
tR
pρ
τΔ
ΔG
RM
SaΔ
ΔG
ME
Db
Set 1
com
plex
es
10.
370.
400.
254.
373.
51
20.
760.
800.
6023
.53
23.2
4
30.
810.
830.
6525
.04
23.6
9
40.
840.
850.
6924
.63
23.1
3
50.
850.
890.
7624
.03
21.8
9
60.
860.
890.
7623
.49
20.4
4
70.
870.
890.
7623
.04
19.2
9
80.
880.
890.
7622
.67
18.3
6
90.
880.
910.
7822
.36
17.5
9
100.
890.
910.
7822
.10
16.9
6
150.
890.
910.
7621
.26
14.9
2
200.
900.
910.
7620
.82
13.8
3
a Roo
t-m
ean-
squa
re d
evia
tion
of th
e ca
lcul
ated
fre
e en
ergy
dev
iatio
n fr
om e
xper
imen
tal e
nerg
y
b Med
ian
of th
e ca
lcul
ated
fre
e en
ergy
dev
iatio
n fr
om e
xper
imen
tal e
nerg
y.
J Chem Inf Model. Author manuscript; available in PMC 2014 October 28.

NIH
-PA
Author M
anuscriptN
IH-P
A A
uthor Manuscript
NIH
-PA
Author M
anuscript
Wang et al. Page 26
Tab
le 6
Com
pone
nts
of F
ree
Ene
rgy
Cal
cula
tions
PD
BL
igan
d N
o.Δ
EE
LE
ΔE
VD
WΔ
EN
PΔ
EP
BT
ΔS N
MT
ΔS Q
HA
diel
c =
1di
elc
=2di
elc
= 1
diel
c =2
1CW
A1
−34
.5±
0.3
−17
.2±
0.2
−58
.1±
0.1
−6.
7±0.
0154
.9±
0.3
14.4
±0.
1−
31.3
±0.
7−
54.7
1HPV
2−
35.2
±0.
3−
17.4
±0.
1−
60.4
±0.
2−
6.8±
0.01
63.4
±0.
215
.2±
0.0
−30
.9±
0.8
−14
.9
1HPX
3−
43.9
±0.
4−
21.3
±0.
2−
70.7
±0.
2−
8.1±
0.01
77.6
±0.
418
.0±
0.1
−32
.7±
0.8
−35
.8
1HX
W4
−41
.8±
0.3
−20
.9±
0.2
−75
.2±
0.2
−8.
5±0.
0179
.4±
0.3
19.0
±0.
1−
36.2
±0.
7−
30.9
1RD
45
−7.
4±0.
2−
4.2±
0.1
−53
.9±
0.2
−6.
4±0.
0133
.3±
0.2
8.8±
0.1
−24
.6±
0.8
−41
.3
1DZ
K6
−3.
3±0.
1−
1.6±
0.0
−27
.5±
0.1
−3.
9±0.
0113
.0±
0.1
4.0±
0.0
−15
.8±
0.6
−43
.1
1I06
7−
1.3±
0.1
−0.
6±0.
0−
21.4
±0.
1−
3.6±
0.01
7.7±
0.1
2.2±
0.0
−14
.6±
0.7
−13
.4
1QY
18
−3.
5±0.
1−
1.7±
0.0
−26
.9±
0.1
−3.
9±0.
0110
.8±
0.1
3.0±
0.0
−15
.9±
0.7
−22
.1
1KZ
N9
−38
.1±
0.4
−18
.5±
0.2
−63
.5±
0.2
−6.
8±0.
0274
.2±
0.4
17.8
±0.
1−
29.4
±0.
9−
43.0
1LZ
B10
−57
.3±
0.9
−28
.9±
0.4
−38
.5±
0.3
−5.
3±0.
0278
.4±
0.9
18.7
±0.
2−
26.5
±0.
6−
26.9
1KJL
11−
61.6
±0.
3−
31.2
±0.
2−
21.2
±0.
1−
3.7±
0.01
57.7
±0.
313
.0±
0.1
−20
.7±
0.6
−18
.5
2FQ
Y12
−65
.1±
0.3
−32
.4±
0.1
−34
.7±
0.1
−4.
3±0.
0169
.7±
0.4
16.6
±0.
1−
21.2
±0.
9−
35.3
1S0R
1342
.7±
0.6
21.0
±0.
3−
19.3
±0.
1−
3.0±
0.01
−48
.9±
0.5
−11
.2±
0.1
−16
.9±
0.8
−15
.2
1FD
Q14
−93
.8±
1.0
−45
.4±
0.5
−41
.2±
0.2
−5.
8±0.
0110
0.7±
0.6
24.5
±0.
1−
27.3
±0.
6−
24.0
J Chem Inf Model. Author manuscript; available in PMC 2014 October 28.


![Quantum Monte Carlo Calculations of Point Defects in Alumina · Many types of point defect in crystals, “frozen” in during crystallisation: Concentrations [X] of each species](https://img.pdfslide.us/doc/110x75/607fcf44a49c6c53464525a7/quantum-monte-carlo-calculations-of-point-defects-in-alumina-many-types-of-point.jpg)


![AFRANK-STARLING MECHANISM NIH Public Access Author ... · content – coronary venous O2 content)]. For these calculations, LAD perfusion territory was estimated to be 30% of total](https://img.pdfslide.us/doc/110x75/5f0e39aa7e708231d43e36ce/afrank-starling-mechanism-nih-public-access-author-content-a-coronary-venous.jpg)