Embed Size (px)
Citation preview
-4
End-of-Life Supply Chain Strategy for High-Performance Servers
Don J. Lee
Bachelor of Science and Master of Science, Mechanical EngineeringMassachusetts Institute of Technology (1993)
Submitted to the Sloan School of Management andthe Department of Civil and Environmental Engineering
in Partial Fulfillment of the Requirements for the Degrees of
Master of Business Administrationand
Master of Science in Civil and Environmental Engineering
in Conjunction with the Leaders for Manufacturing Program at theMassachusetts Institute of Technology
June 2003
© 2003 Massachusetts Institute of echnologyAll rights reserved
MASSACHUSElTS INSTITUTEMASSACUSTE HILNSTITUTE
OF TECHNOLOGY
AUG 4 203
I BRAR IES
Signature of Author................................................... -................................ ....... .. ..Sloan School of Management
Department of Civil and Environmental EngineeringMay 1, 2003
C ertified by ................................... :: . .. ............. <........................... ...............Stephen C. Graves, Thesis Advisor
Professor of Management, Sloan School of Management
Certified by ................... .................................................David Simchi-Levi, Thesis Advisor
Professor of Engineering Systems, Department of Civil and Environmental Engineering
C.Accepted by ..................... zI 4 ---- --- --- --- -.. ... ... ... ... ....................................
Margaret AndrewsExecutive Director of Master's Program
Sloan School of Management
Accepte r.....................Oral Buyukozturk
Chairman, Departmental Committee on Graduate StudiesProfessor, Department of Civil and Environmental Engineering
1 &ARKER

End-of-Life Supply Chain Strategy for High-Performance Serversby
Don J. Lee
Submitted to the Sloan School of Management and the Department of Civil Engineeringon May 14, 2003 in Partial Fulfillment of the Requirements for the Degrees of
Master of Business Administrationand
Master of Science in Civil Engineering
ABSTRACTAlpha microprocessor chips are the basis for the most reliable and highest performing servers inthe industry. Compaq, now part of the new HP, has been facing inventory and supply chainchallenges especially as Alpha servers approaches end of life in 2006. The approach to the thesisresearch was to investigate end-of-life supply chain strategy in an effort to find a specific area tohelp minimize inventory risk in the Alpha Server Division supply chain operations group.
The primary objective of this thesis was to examine strategic supply chain issues associated withbringing the Alpha server business line to its end of life. A strategic end-of-life framework isproposed that includes identifying strategic intent, assessing market and product risks, andaligning supplier contracts, production, and fulfillment. Having learned about the end-of-lifestrategy using this framework, research was then focused on identifying potential cost avoidanceopportunities by minimizing inventory risk using the concept of real options. This conceptinvestigates opportunities to obtain the flexibility to purchase unique server components on an as-needed basis in light of demand uncertainty during the remainder of the product lifecycle. Thiscontractual method is in contrast to making commitments on unique components based ondemand forecasts that could result in significant excess inventory at end of life. A methodologyfor estimating option premium is described in detail. An example of procuring Alpha chips forthe latest Marvel server program is used to show its potential cost avoidance of 9.9% to 14.0%from using real options when compared to current commitment-based contracts if actual demandturned out to be the lowest expected demand as opposed to average expected demand.
Another part of my thesis was to improve and simplify a previous LFM intern's research. Thetask involved separating the supplier and Compaq supply chain cost saving opportunities forAlpha server components by having suppliers ship certain components directly to customersinstead of having the supplier ship to a regional hub and then to a regional factory to fulfill acustomer order. Cost saving areas for the supplier and Compaq are identified. From a detailedanalysis of about ten different options from seven different suppliers for North American demand,annual cost savings ranged from -1% to +32% with a savings distribution of 80% and 20% forHP and suppliers, respectively. For heavy and low cost components, the cost drivers wereshipping and hub-related costs. For light and expensive components, the cost driver wasinventory carry cost.
Thesis Advisor: Stephen C. GravesTitle: Professor of Management
Thesis Advisor: David Simchi-LeviTitle: Professor of Civil Engineering
3

This page intentionally left blank
4
ACKNOWLEDGEMENTS
The author wishes to acknowledge the Leaders for Manufacturing Program and Hewlett-
Packard Corporation for its support of this work.
I would like to acknowledge Don Rosenfield, Bill Hanson, all my professors, and fellow
students for the educational opportunity they have provided me and for their commitment
to leadership in manufacturing and operations.
I would like to show gratitude to my thesis advisors Prof. Stephen C. Graves and Prof.
David Simchi-Levi for their interest, input and guidance on this thesis and for their
thoughtful classroom instructions in operations and supply chain management.
I would also like to recognize pre-merger Compaq Computer Corporation, now part of
the new-HP, for their support of this thesis. I would like to extend many thanks to Lisa
Midttun, Doug Kellogg, and Frank Fallon for their continued support of the LFM
program. I would also like to thank Gianpaolo Callioni, Director of Supply Chain
Planning and Modeling team, and Dr. Thomas Olavson, Manager of Procurement Risk
Management team, for their guidance, feedback and input.
Most importantly, I am grateful for my wife's patience, support, and devotion even while
carrying our new son during my hectic time at MIT that did not even draw a salary.
5
TABLE OF CONTENTS
A bstract..............................................................................................................................3Acknow ledgem ents ....................................................................................................... 5Table of Contents....................................................................................................... 6List of Figures.................................................................................................................... 7Preface................................................................................................................................81 Introduction.......................................................................................................... 9
1.1 The "new-HP" ................................................................................................... 91.2 Alpha server product line and m arket............................................................... 111.3 High perform ance server roadm ap ................................................................... 131.4 Alpha Server Division organization ................................................................. 141.5 Thesis project.................................................................................................... 15
2 Cost Reduction Opportunities of Options........................................................... 172.1 A SD supply chain operations overview .......................................................... 172.2 Current hub-based options supply chain .......................................................... 172.3 Direct ship benefits.......................................................................................... 182.4 An exam ple...................................................................................................... 202.5 Results ................................................................................................................. 22
3 EOL Supply Chain Strategic Framework .......................................................... 243.1 Establishing strategic intent............................................................................. 253.2 Determ ine m arket risk factors .......................................................................... 273.3 Assess product risk and align supplier contracts............................................. 283.4 Align production and fulfillment...................................................................... 323.5 Conclusion........................................................................................................... 33
4 Real O ptions for Part Procurem ent ................................................................... 354.1 Introduction ..................................................................................................... 354.2 Real option premium estimation using Black-Scholes formula............ 364.3 Real options prem ium estim ation example ......................................................... 394.4 Supplier contract points.................................................................................... 424.5 Alpha chip real options analysis...................................................................... 444.6 Future research ................................................................................................. 474.7 Conclusion........................................................................................................... 48
Bibliography.................................................... 50
6
LIST OF FIGURES
Figure 1. Alpha server product exam ples ........................................................................ 11
Figure 2. HP high-performance server roadmap.......................................................... 14
Figure 3. ASD Supply Chain Operations organization................................................. 15
Figure 4. Current hub-based shipment process.............................................................. 18
Figure 5. Benefits of direct shipping independent components.................................... 19
Figure 6. Direct chip cost savings components ............................................................ 19
Figure 7. A example set of component parameters for analyzing direct ship.............. 21
Figure 8. Direct ship savings for a component ............................................................ 22
Figure 10. Procurement options for commodity or unique EOL parts ........................ 30
Figure 11. Black-Scholes formula variables................................................................. 37
Figure 12. Historical forecast vs. actual shipments example........................................ 39
Figure 13. Expected demand estimation example ....................................................... 40
Figure 14. Example set of parameters (not all parameters are actual)........................... 40
Figure 15. Example option premium calculation.......................................................... 41
Figure 16. A lpha chip param eters................................................................................. 44
Figure 17. Real Option Premium for Alpha chip worldwide demand........................... 45
Figure 18. Potential cost avoidance if actual demand is low forecasted demand......... 46
7
PREFACE
As I began my internship in the Alpha Server Division's Supply Chain Operation group
in June one month after the merger closed, it seemed chaotic and the mood somewhat
somber. The supply chain organization, as they were part of Digital Equipment
Corporation back in 1998, was once again trying to learn another company's culture and
processes. Most have been through one merger into Compaq Computer Corporation in
1998. Four years later, they are being merged again, this time into HP, in one of history's
largest technology mergers. Regardless of these mergers, many employees are proud to
adhere to the Digital legacy.
The organizational restructuring was in flux for a few months with managers trying hard
to become integrated with their counterparts in the pre-merger HP organization. There
were headcount reductions occurring through voluntary early retirement in this group of
which many were eligible; this was to be completed by the end of August with
involuntary layoffs soon to follow to fulfill the 15,000 head count reduction goal. If all
that was not enough, the Alpha server product family - a major business in the New
England area - was being discontinued with the last shipment expected sometime in 2006.
As one can imagine, and understandably so, providing support for an LFM student trying
to do a thesis project was not of high priority. However, there were interesting research
opportunities that did not require significant involvement from the organization but could
potentially add some value to the organization during the organization's remaining years.
I pursued a couple of these opportunities for this thesis. Despite the difficult environment
that the organization was under, I am grateful for the support that was provided.
8
1 INTRODUCTION
1.1 The "new-HP"
On May 3 rd, 2002, Hewlett-Packard Corporation legally completed its merger with
Compaq forming the "new-HP." The merger was one of the largest in technology history
with a stock-swap deal estimated to be about $19 billion. HP's Chairman and CEO
Carleton "Carly" S. Fiorina summed up her rationale for the merger in the following
customer statement:
"We believe this merger offers you important benefits. By combining our
strengths, we not only create the industry's leading portfolio of products,
technologies and solutions, we're putting an extraordinary set of people, skills and
processes at your disposal. We more than double the number of IT architects,
consultants and professionals available to help you get the most out of your
technology investments. We are now the leader in the technologies that are
essential to running businesses: servers, fault-tolerant systems, storage solutions,
network management software, imaging and printing solutions and personal
computers. We have doubled the size of our sales force, enabling us to serve you
more effectively and deliver greater value. We have increased our research and
development capabilities so that we continue to make meaningful advances in
technology that benefit you. And we have strengthened our position as the world's
most innovative and successful consumer IT company, which gives us a unique
opportunity to help our customers bridge the world between digital content and
commerce."
HP seems to gain significantly from acquiring Compaq, the market share leader in servers
and storage in 2001 according to the Gartner Group. HP and Compaq with combined
2001 revenue of $81.7B have suddenly become the largest consumer IT company and
9
largest IT supplier to small and medium sized businesses.' With a drive towards
operational efficiency from merger synergies of about $2.5 billion and to adapt to current
weak market conditions due to the recession, HP will reduce headcount by 15,000 (10%)
by early 2003.
The new-HP will have five core business groups and operations:
- Imaging and Printing Group - IPG will produce printers, digital imaging devices,
digital projectors, and associated supplies and accessories.
- Personal Systems Group - PSG will provide personal computers, notebooks,
workstations, thin clients, handhelds, and Internet appliances.
- Enterprise Systems Group - ESG will provide enterprise storage, servers, and
software products.
- HP Services - HP's services arm of 65,000 professionals will provide customer
support, consulting, outsourcing, and other solutions.
- Worldwide Operations - This group will provide corporate strategic direction,
drive efficiencies, capture value, and lead professional development throughout
the organization.
These groups are currently headed by Michael Capellas, former CEO of Compaq and
now the president and chief operating officer of the new-HP. 2 The new-HP's central
message is to drive industry standard rather than proprietary technology across all
product lines.3
1 Altherr, Mark and Cheon Gene, HP and Compaq Analyst Report, Credit-Suisse First Boston, May 10,
2002.2 As of November 11,2003, Michael Capellas moved to MCI Worldcom to become its CEO to turnaround
the distressed telecommunications company.
3 Fortuna, Steve and Hillmeyer, Michael, "Fireside Chat with Michael Capellas," Merrill Lynch company
update, May 3, 2002.
10
1.2 Alpha server product line and market
Alpha servers range from entry-level servers to massive custom-designed multi-Teraflops
(trillions of floating-point operations per second) supercomputers to support some of the
world's most computing-intensive applications in government, research, and financial,
healthcare, and telecom sectors.
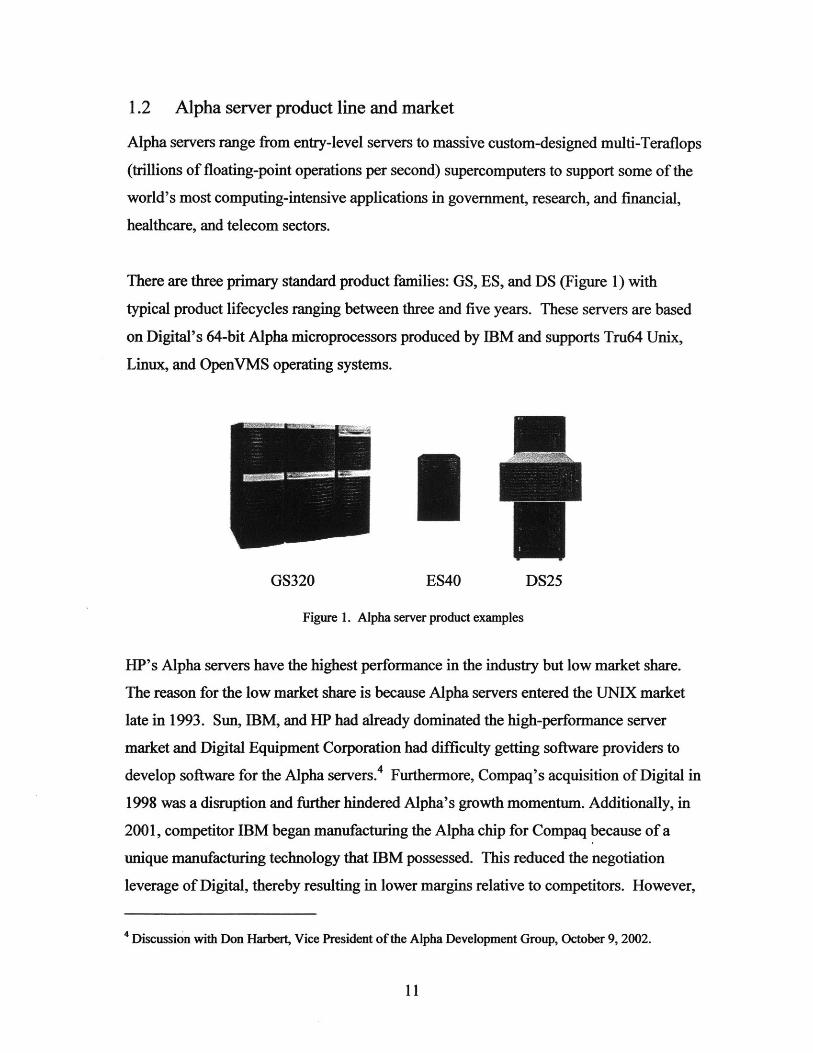
There are three primary standard product families: GS, ES, and DS (Figure 1) with
typical product lifecycles ranging between three and five years. These servers are based
on Digital's 64-bit Alpha microprocessors produced by IBM and supports Tru64 Unix,
Linux, and OpenVMS operating systems.
GS320 ES40 DS25
Figure 1. Alpha server product examples
HP's Alpha servers have the highest performance in the industry but low market share.
The reason for the low market share is because Alpha servers entered the UNIX market
late in 1993. Sun, IBM, and HP had already dominated the high-performance server
market and Digital Equipment Corporation had difficulty getting software providers to
develop software for the Alpha servers.4 Furthermore, Compaq's acquisition of Digital in
1998 was a disruption and further hindered Alpha's growth momentum. Additionally, in
2001, competitor IBM began manufacturing the Alpha chip for Compaq because of a
unique manufacturing technology that IBM possessed. This reduced the negotiation
leverage of Digital, thereby resulting in lower margins relative to competitors. However,
4 Discussion with Don Harbert, Vice President of the Alpha Development Group, October 9, 2002.
11
'g - 4M I
since the New-HP is now IBM's largest customer in semiconductor products, HP's
buying power suddenly increased to potentially help drive Alpha chip costs down during
the end-of-life phase.
The new-HP's major competitors are IBM and Sun in the high performance server
market. Sun is the dominant player in the Unix server market by revenue with 42% of
Unix-RISC server market followed by the new-HP with 27% and IBM with 17%.5 IBM
has an extensive enterprise customer base with the ability to provide integrated system
solutions comprising professional services, management software such as Tivoli, and
hardware with their RS/6000 and pSeries servers based on IBM's RS64 and POWER
microprocessors in IBM's AIX UNIX operating environment. Sun is primarily focused
on proprietary server technology with UltraSparc 64-bit microprocessors and Solaris
UNIX operating environment.
The server industry is gradually moving towards using industry standard Intel-
Architecture (IA) microprocessors especially as reliability and performance continues to
improve. World-wide Unix/RISC-based server revenue share is expected to begin
decreasing from about 51% in 2002 to 42% by 2006 while industry standard IA based
servers are expected to continue increasing at a rate of 5.2% compounded annually during
the same time horizon.6 The new-HP's strategic reasons for using an industry-standard
Itanium server processor for their high-end servers is associated with increased
availability of software, better reliability, improved scalability, and lower total cost of
ownership. 7 Using Itanium processors is in alignment with the new-HP's corporate-wide
direction of using industry-standard components.
However, the new-HP will face another formidable competitor: Dell. Although the new-
HP currently dominates the IA server market with about 35% of the market, Dell has had
5 Scconaghi, Jr, A.M. and Chiang, H. Eric, "New Unix Servers Unlikely to Alter Competitive Landscape,"Berstein Research weekly notes, September 28, 2001.6 Melenovsky, Mark and Humphreys, John, "Maximizing Flexibility and Minimizing Costs," IDCWhitepaper, 2002.7 Gantz, John and Turner, Vernon, "Standardization: The Secret to IT Leverage," IDC Whitepaper, 2002.
12
the fastest market share growth in the standard Intel-architecture server market gaining
19% of the market in 2001 from just about 3% in 1996 directly at the expense of Compaq
and HP.8 With their announcement on February 4h, 2002 to enter the high-performance
computing market with its partnership with Cray, Dell is a competitor who can't be
overlooked in this space.9 Apparently customers in the predominantly UNIX high-
performance technical computing market are gradually considering Linux instead. This
shift toward Linux makes Dell a competitive option in the near-term future for many of
these customers in this high-end market segment.' 0
Even Sun, who has been focused on selling their proprietary systems, finally admitted
that IA microprocessors might dominate the entry-level server industry by introducing an
entry-level 32-bit Intel processor server supporting both Linux and Solaris operating
systems in August 2002. IBM already entered the entry-level server market with Intel
microprocessors in November 2001 realizing this customer trend toward industry
standard Intel Architecture.
1.3 High performance server roadmap
HP will begin transitioning Alpha to Intel's 64-bit Itanium microprocessors beginning
with a server that supports OpenVMS operating system around 2004; support for other
operating systems HP-UX, Windows64, and Linux will follow. HP will complete the
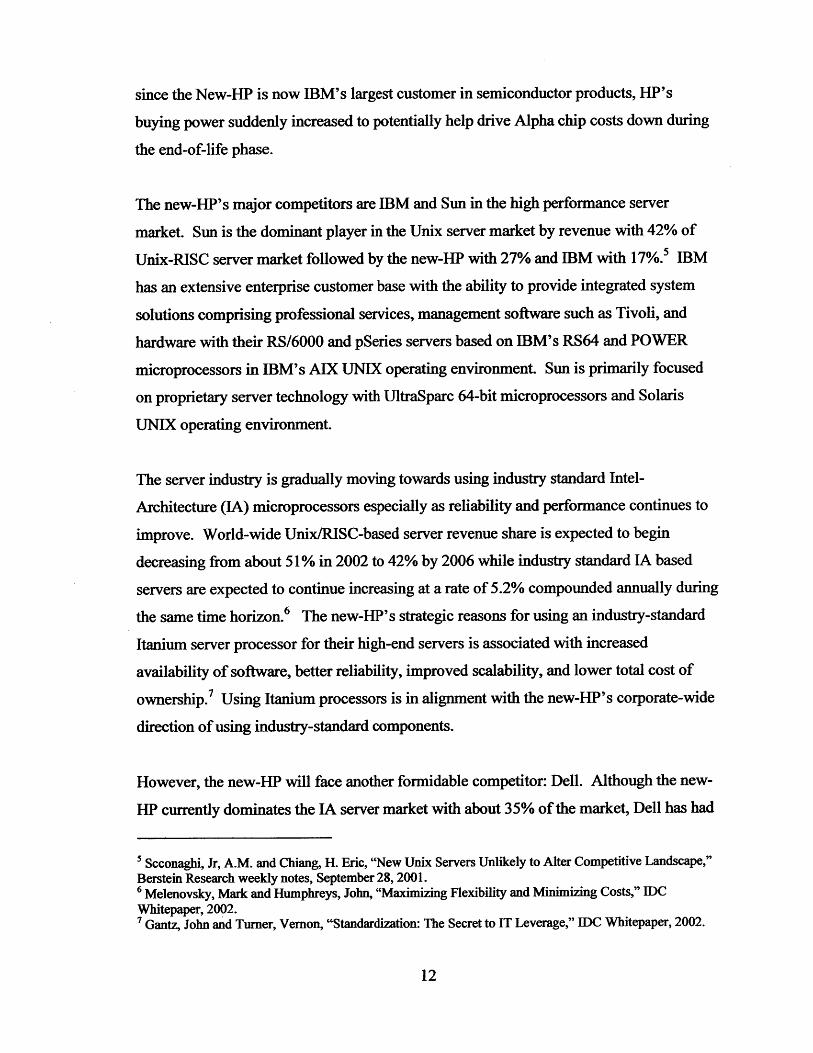
transition to Itanium-based servers and will begin discontinuing production of the Alpha
server product family in 2006 with services ending in 2011 (Figure 2). The 2011
timeframe was defined five years from the end-of-production in 2006 because customers
typically have a five to six year IT project lifespan; between 2006 and 2011, HP will try
to migrate existing Alpha customers to HP's Itanium servers." The major challenges,
however, in transitioning customers to the new Intel platform will be in reducing software
a Melenovsky, Mark and Humphreys, John, "Maximizing Flexibility and Minimizing Costs," IDCWhitepaper, 2002.9 Yokley, Kara, et.al., "Dell's New Target -HPC", IDC Bulletin #26562, February 2002.
1 Discussion with Don Harbert, Vice President of the Alpha Development Group, October 9, 2002.
"O'brien, Bill, "Alpha preps for grand finale," Tech Update, August 19, 2002.
13
compatibility issues, lowering technical hurdles, and thoughtful planning in an effort to
minimize cost impact on existing software investments.
02 03 04 05
HPAlphaServer EV68 EW7 EV79
Itanium* Itaniunt \ltaniumV-based McKinley Madison processor processorHP server family family
upgrades upgrades
Paform transition peod---
Figure 2. HP high-performance server roadmap
HP will roll out its final Alpha servers using the next generation RISC-based EV7
processors code named "Marvel" by the end of 2002. The EV7 has self-healing
technology that reduces user intervention required to minimize potential system
downtime to compete against IBM's eLiza's self-healing technology, which currently
ships in all IBM UNIX servers. A speed-enhanced EV79 processor that will become
available mid-2004 will be the last processor sold.
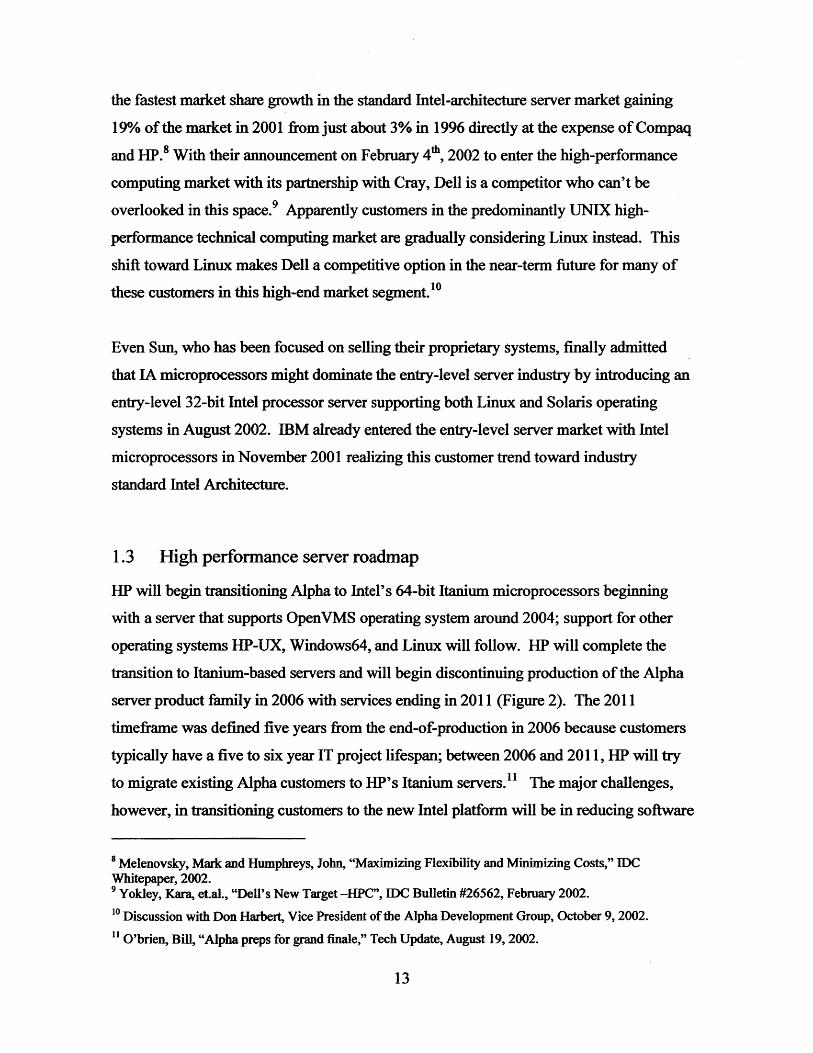
1.4 Alpha Server Division organization
The Alpha Server Division (ASD) of the New-HP was originally part of the Digital
Equipment Corporation (DEC) before DEC was merged into Compaq Computer
Corporation in 1998. This thesis work was performed within the ASD Supply Chain
Operations team that supports the Alpha Server Division and High Performance
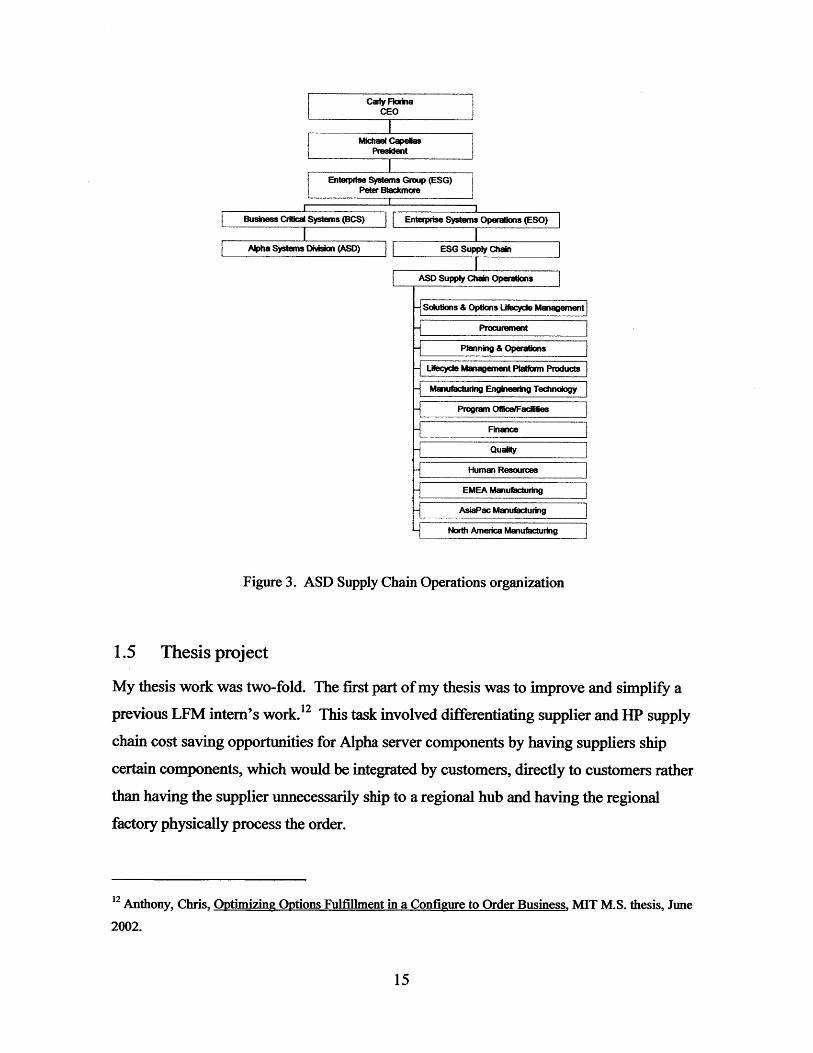
Technical Computing Division. The organizational chart is shown on
Figure 3.
14
Carly FlodnaCEO
ichae CapelasPreskdent
Enterprise Systems Group (ESG)Peter Blackmore
Business Critical Systems (BCS)
Alpha Systems Division (ASM)
Enterprise Systems Operations (ESO)
ESG Supply Chain
ASD Supply Chain Operations
-Solutions & Options Litecycle Management
Pocurement
Planning & Operations
Lifecycle Management Plakfrm Products
Manufacturing Engineeudg Technology
Progran Ofce/Facities
Finance
Quality
Human Resources
EMEA Manufacturing
AsiaPac Manufacturing
North America Manufacturing
Figure 3. ASD Supply Chain Operations organization
1.5 Thesis project
My thesis work was two-fold. The first part of my thesis was to improve and simplify a
previous LFM intern's work.' 2 This task involved differentiating supplier and HP supply
chain cost saving opportunities for Alpha server components by having suppliers ship
certain components, which would be integrated by customers, directly to customers rather
than having the supplier unnecessarily ship to a regional hub and having the regional
factory physically process the order.
1 2 Anthony, Chris, Optimizing Options Fulfillment in a Configure to Order Business MIT M.S. thesis, June
2002.
15
The second part of my thesis was to investigate an end-of-life (EOL) supply chain
strategy for the Alpha server business to minimize costs and maintain customer
satisfaction with special emphasis on using real options for part procurement. This
involved researching available best practices especially from pre-merger HP who are
open to new ideas and readily willing to adapt to latest best industry practices. The pre-
merger HP's supply chain strategy organizations, Procurement Risk Management (PRM)
and Supply Chain Planning and Modeling (SPaM), were consulted to develop an end-of-
life strategic framework.
16
2 COST REDUCTION OPPORTUNITIES OF OPTIONS
This chapter investigates potential cost savings from having suppliers ship independent
options, which would be integrated by customers, directly to customers rather than
having the supplier ship to a regional hub and having the regional factory physically
process the order. The supplier and HP costs savings are separated to determine how the
supplier cost savings can be applied in driving down supplier part prices. The analysis is
limited to North American demand for several options.
2.1 ASD supply chain operations overview
There are a couple of thousand different parts for the Alpha systems including "options"
that are sourced from hundreds of suppliers. Options are customer-selected saleable
components that can be installed by the customer as opposed to standard components that
are integrated into a system at the factory. For example, options include: memory, CPU
upgrade, cabinets, hard drive, storage adapters and switches, graphics cards, network
cards. There are about 600 different component options within about 30 families.
Options are bucketed into two categories: independent and configure-to-order (CTO).
Independent options are those purchased separately from a system and installed by the
customer and CTO options are those that are purchased for factory integration into a
system. Options, in total, account for a significant portion of total Alpha revenues.
2.2 Current hub-based options supply chain
Currently, all but a couple of Alpha server options are shipped to third-party or supplier
hubs located near the regional manufacturing facilities. The supplier is responsible for
shipping, handling, and inventory up to the hub and HP is responsible for shipping,
handling, and inventory from the hub to the final customer destination less the regional
customer shipping cost (Figure 4). The use of hubs allows HP to reduce inventory from
their balance sheet.
17
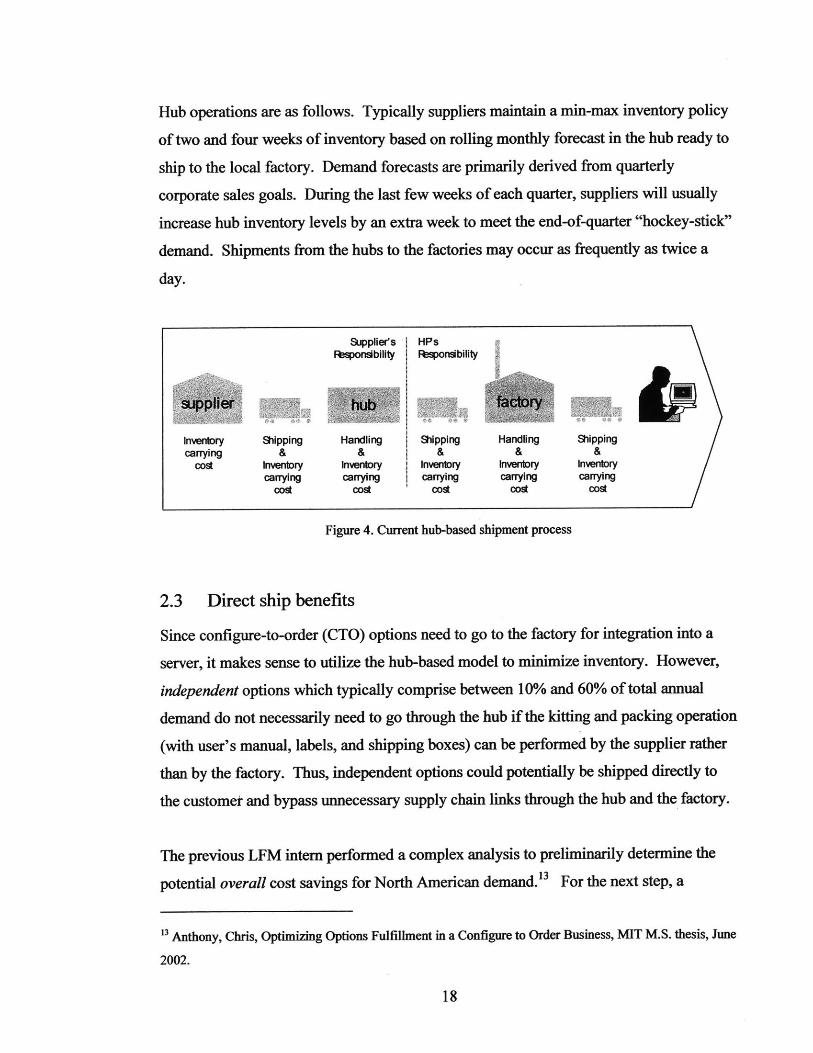
Hub operations are as follows. Typically suppliers maintain a min-max inventory policy
of two and four weeks of inventory based on rolling monthly forecast in the hub ready to
ship to the local factory. Demand forecasts are primarily derived from quarterly
corporate sales goals. During the last few weeks of each quarter, suppliers will usually
increase hub inventory levels by an extra week to meet the end-of-quarter "hockey-stick"
demand. Shipments from the hubs to the factories may occur as frequently as twice a
day.
Supplier's | HPsFesponsibility Responsibility
Suple huar_Inventory Shipping Handling Shipping Handling Shippingcarrying & & & & &
cost Inventory Inventory Inventbry Inventory Inventorycarrying carrying icarrying carrying carrying
cost cost cost cost cost
Figure 4. Current hub-based shipment process
2.3 Direct ship benefits
Since configure-to-order (CTO) options need to go to the factory for integration into a
server, it makes sense to utilize the hub-based model to minimize inventory. However,
independent options which typically comprise between 10% and 60% of total annual
demand do not necessarily need to go through the hub if the kitting and packing operation
(with user's manual, labels, and shipping boxes) can be performed by the supplier rather
than by the factory. Thus, independent options could potentially be shipped directly to
the customet and bypass unnecessary supply chain links through the hub and the factory.
The previous LFM intern performed a complex analysis to preliminarily determine the
potential overall cost savings for North American demand.' 3 For the next step, a
" Anthony, Chris, Optimizing Options Fulfillment in a Configure to Order Business, MIT M.S. thesis, June
2002.
18
M _TZ 4R4
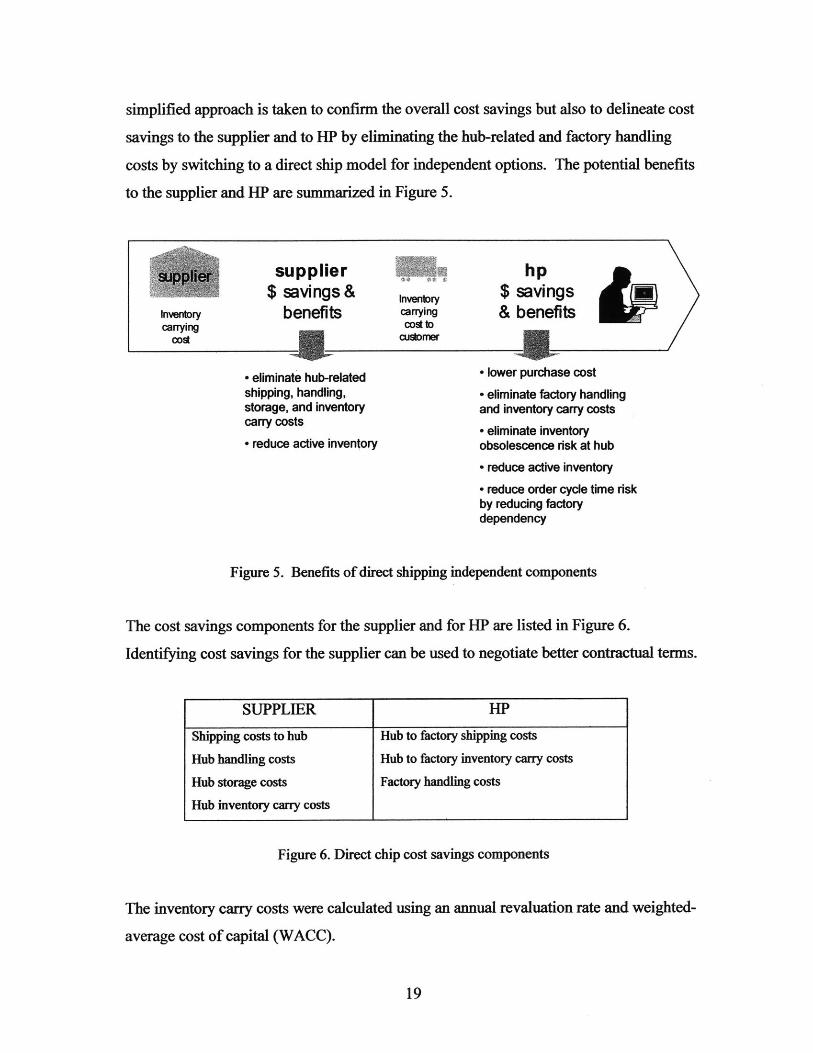
simplified approach is taken to confirm the overall cost savings but also to delineate cost
savings to the supplier and to HP by eliminating the hub-related and factory handling
costs by switching to a direct ship model for independent options. The potential benefits
to the supplier and HP are summarized in Figure 5.
Inventorycarrying
cost
supplier$ savings&
benefitsInventorycarryingcost to
customer
- eliminate hub-relatedshipping, handling,storage, and inventorycarry costs
- reduce active inventory
hp$ savings& benefits
- lower purchase cost
" eliminate factory handlingand inventory carry costs
- eliminate inventoryobsolescence risk at hub
" reduce active inventory
" reduce order cycle time riskby reducing factorydependency
Figure 5. Benefits of direct shipping independent components
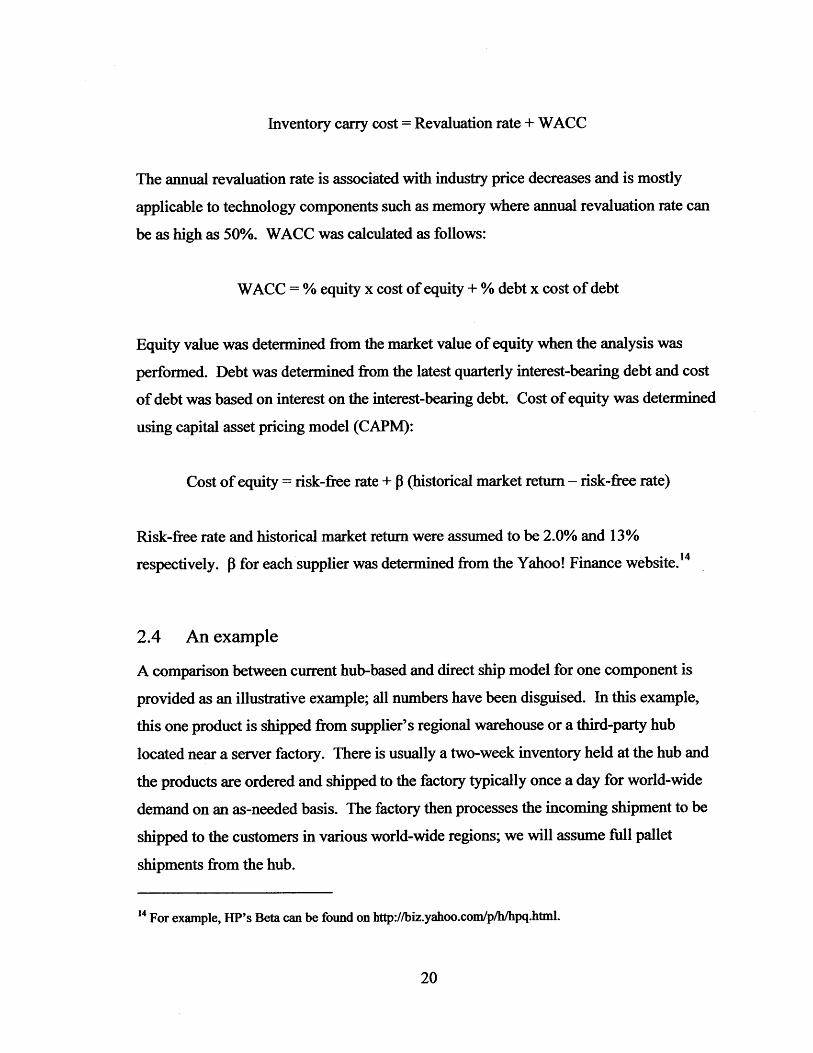
The cost savings components for the supplier and for HP are listed in Figure 6.
Identifying cost savings for the supplier can be used to negotiate better contractual terms.
Figure 6. Direct chip cost savings components
The inventory carry costs were calculated using an annual revaluation rate and weighted-
average cost of capital (WACC).
19
SUPPLIER HP
Shipping costs to hub Hub to factory shipping costs
Hub handling costs Hub to factory inventory carry costs
Hub storage costs Factory handling costs
Hub inventory carry costs
Inventory carry cost = Revaluation rate + WACC
The annual revaluation rate is associated with industry price decreases and is mostly
applicable to technology components such as memory where annual revaluation rate can
be as high as 50%. WACC was calculated as follows:
WACC = % equity x cost of equity + % debt x cost of debt
Equity value was determined from the market value of equity when the analysis was
performed. Debt was determined from the latest quarterly interest-bearing debt and cost
of debt was based on interest on the interest-bearing debt. Cost of equity was determined
using capital asset pricing model (CAPM):
Cost of equity = risk-free rate + 3 (historical market return - risk-free rate)
Risk-free rate and historical market return were assumed to be 2.0% and 13%
respectively. 1 for each supplier was determined from the Yahoo! Finance website.14
2.4 An example
A comparison between current hub-based and direct ship model for one component is
provided as an illustrative example; all numbers have been disguised. In this example,
this one product is shipped from supplier's regional warehouse or a third-party hub
located near a server factory. There is usually a two-week inventory held at the hub and
the products are ordered and shipped to the factory typically once a day for world-wide
demand on an as-needed basis. The factory then processes the incoming shipment to be
shipped to the customers in various world-wide regions; we will assume full pallet
shipments from the hub.
" For example, HP's Beta can be found on http://biz.yahoo.com/p/h/hpq.html.
20
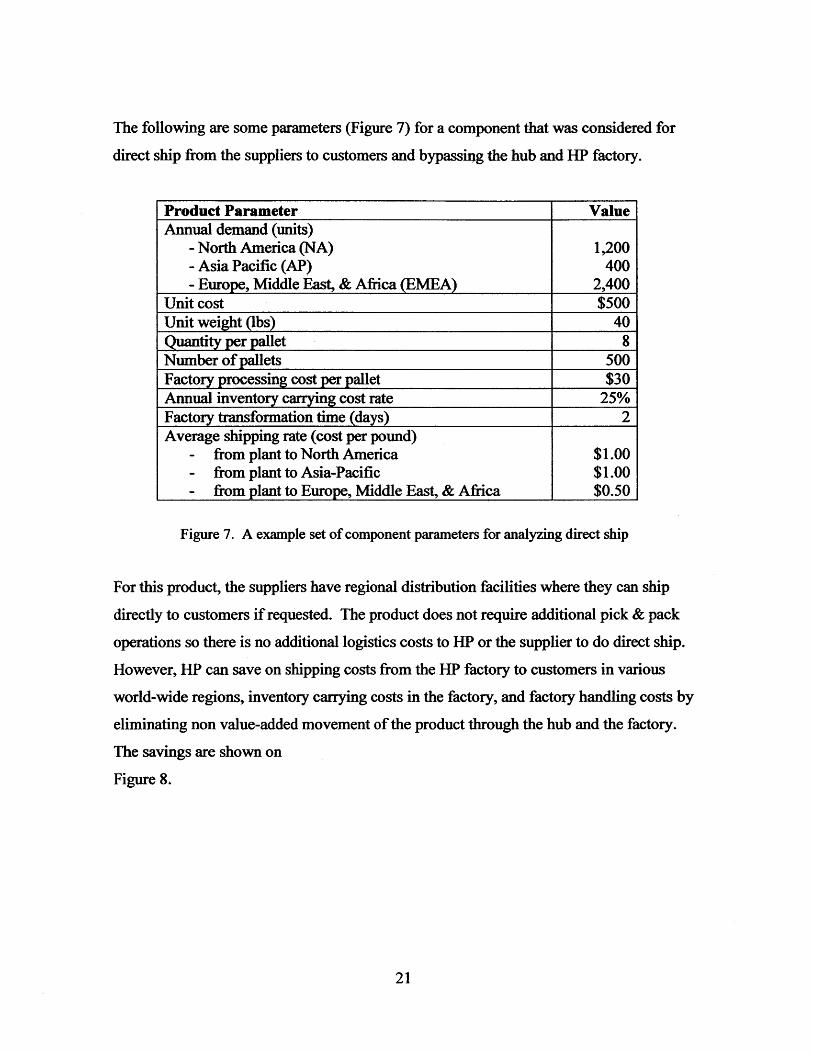
The following are some parameters (Figure 7) for a component that was considered for
direct ship from the suppliers to customers and bypassing the hub and HP factory.
Product Parameter ValueAnnual demand (units)
- North America (NA) 1,200- Asia Pacific (AP) 400- Europe, Middle East, & Africa (EMEA) 2,400
Unit cost $500Unit weight (lbs) 40Quantity per pallet 8Number of pallets 500Factory processing cost per pallet $30Annual inventory carrying cost rate 25%Factory transformation time (days) 2Average shipping rate (cost per pound)
- from plant to North America $1.00- from plant to Asia-Pacific $1.00- from plant to Europe, Middle East, & Africa $0.50
Figure 7. A example set of component parameters for analyzing direct ship
For this product, the suppliers have regional distribution facilities where they can ship
directly to customers if requested. The product does not require additional pick & pack
operations so there is no additional logistics costs to HP or the supplier to do direct ship.
However, HP can save on shipping costs from the HP factory to customers in various
world-wide regions, inventory carrying costs in the factory, and factory handling costs by
eliminating non value-added movement of the product through the hub and the factory.
The savings are shown on
Figure 8.
21
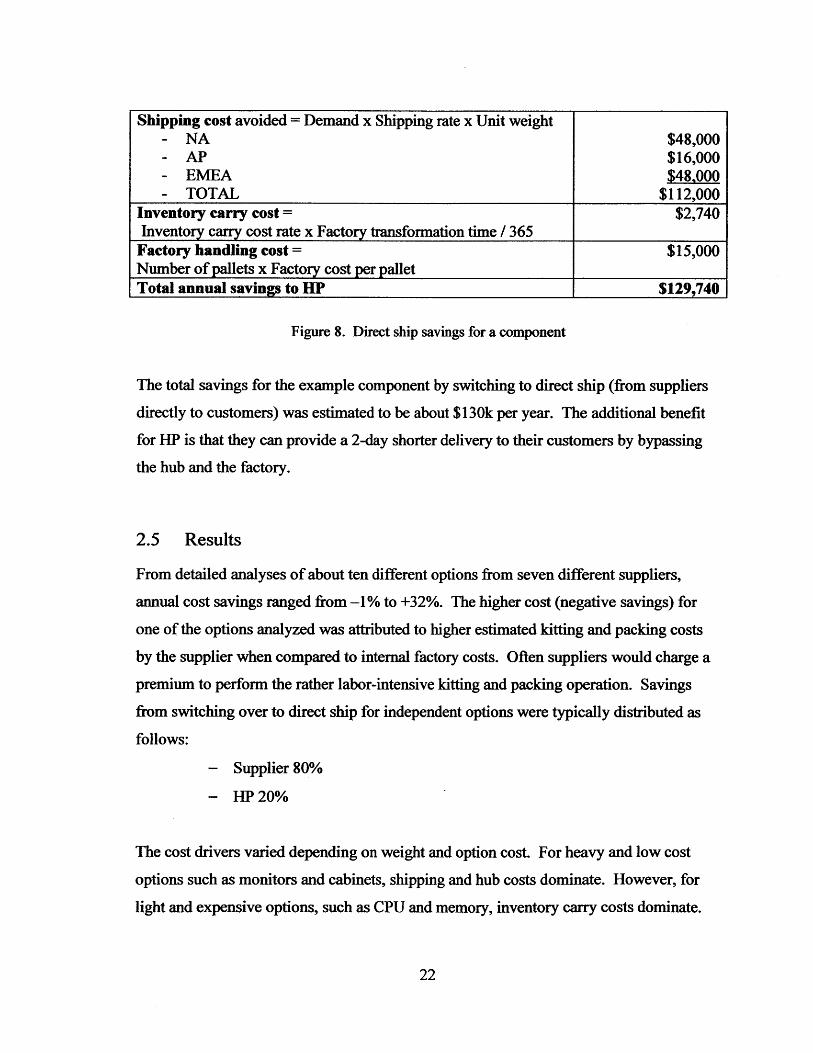
Shipping cost avoided = Demand x Shipping rate x Unit weight- NA $48,000- AP $16,000- EMEA $48,000- TOTAL $112,000
Inventory carry cost = $2,740Inventory carry cost rate x Factory transformation time / 365
Factory handling cost = $15,000Number of pallets x Factory cost per palletTotal annual savings to HP $129,740
Figure 8. Direct ship savings for a component
The total savings for the example component by switching to direct ship (from suppliers
directly to customers) was estimated to be about $130k per year. The additional benefit
for HP is that they can provide a 2-day shorter delivery to their customers by bypassing
the hub and the factory.
2.5 Results
From detailed analyses of about ten different options from seven different suppliers,
annual cost savings ranged from -1% to +32%. The higher cost (negative savings) for
one of the options analyzed was attributed to higher estimated kitting and packing costs
by the supplier when compared to internal factory costs. Often suppliers would charge a
premium to perform the rather labor-intensive kitting and packing operation. Savings
from switching over to direct ship for independent options were typically distributed as
follows:
- Supplier 80%
- HP 20%
The cost drivers varied depending on weight and option cost. For heavy and low cost
options such as monitors and cabinets, shipping and hub costs dominate. However, for
light and expensive options, such as CPU and memory, inventory carry costs dominate.
22
Based on the previous LFM intern's recommendations, two high-demand heavy options
have been implemented for direct ship with sizeable cost savings. For these two options,
the actual estimated cost savings were compared with estimated figures provided by the
model developed for this thesis. The model overestimated supplier cost savings by about
29% when compared to actual cost savings seen by HP based on four options from price
reductions instituted after direct ship from one supplier. The reason behind this
difference can be attributed to differences in assumptions on expected inventory levels,
inventory carrying cost, shipping costs, and on how much of the savings was kept by the
supplier. Regardless, the simple model developed for this thesis provided a reasonable
potential cost savings estimate.
Although preliminary analysis may show that cost savings are achievable in most cases
by switching to a direct ship model, it is often hard to justify changing to a direct ship
model now given the following issues with Alpha systems:
- There are hundreds of suppliers mostly with low component demand.
- Demand is expected to wane as the Alpha family approaches end-of-life.
- Setting up an electronics data interchange (EDI) link between HP and the supplier
to conduct the direct ship transaction is rather expensive and time-consuming
often taking several months for both parties. Moreover, EDI link setup requests
have been suspended due to corporate IT integration with pre-merger HP.
Upon completion of merger-related IT integration and corporate restructuring, direct ship
opportunities are expected to be reevaluated.
23
3 EOL SUPPLY CHAIN STRATEGIC FRAMEWORK
The New-HP has taken a dual-product rollover strategy for high-performance servers
where the primary strategic goal with selling Alpha servers during the end-of-life (EOL)
phase is to maintain customer satisfaction to help the installed Alpha customer base
transition over to Itanium servers. An end-of-life supply chain framework was developed
as part of this thesis to provide a guideline to understand various supply chain issues to
consider when an entire business line is rolled over to a new business line. Although an
EOL process is available at the platform level (i.e. at the server model level), a strategic
framework was determined to be necessary to assist managers from overlooking higher-
level product, supply chain, and market factors to help better predict the entire Alpha
business demand during the end-of-life phase to minimize holding too much excess
inventory.
Since there is limited information on end-of-life strategies, the framework was based on
discussions with the Alpha server supply chain management team, HP's supply chain
strategy group, and my thesis advisors. The framework essentially consists of five major
items each of which will be discussed in greater detail in the following sections:
1. establish an end-of-life strategic intent
2. determine market risk factors
3. assess part risks and align supplier contracts
4. align production and fulfillment
5. execute and refine strategy
First, a brief overview of pre-merger Compaq's current end-of-life process for platforms
is described as background information. The Alpha server division has a general
guideline to manage the end of life process of their server platforms. The goal of this
process is to minimize inventory write-offs and provide timely communications to all
affected parties. An EOL team is established several months prior to the last shipment
date, and is tasked with these goals; the team is comprised of product management,
24
procurement, services, engineering, supply chain, and finance. During this period, the
team monitors waning demand forecasts, identifies availability and delivery of critical
parts, determines disposition plan for capital equipment and any excess inventory, and
manages product status.
If sourced parts contain unique long lead-time components, or industry-standard
components that might be approaching end-of-life, HP may be responsible for any excess
inventory incurred by the supplier if actual demand is less than the rolling forecast. If
sourced parts contain industry-standard components that are not expected to reach end-
of-life, HP will usually not be responsible for any excess inventory since the supplier
should be able to return the components or sell them to another customer. Therefore,
managing inventory risk for high-priced unique parts during end-of-life is especially
important to reducing potentially costly inventory write-offs.
As described, pre-merger Compaq's end-of-life guideline is associated primarily with
individual platforms. Although many aspects of the guideline are applicable, when
considering ending the life of a business line, higher-level issues may need to be
considered and they are described in the following sections.
3.1 Establishing strategic intent 5
An important initial task for senior management is to determine the strategic intent for
going end of life with a product line. The strategic intent may be to minimize costs,
harvest as much revenue as possible, or maintain customer satisfaction of installed base.
There may be other missions, but selecting the primary one will affect how the strategy
framework and business plan will be developed. For example, if the strategic intent is to
maintain a high-level of customer service, it would make sense to make sufficient last
time purchases of critical parts such as those that were unique to the product line to meet
demand service level during the end-of-life phase. However, if the strategic intent is to
1 Based on discussions with Gianpaolo Callioni, Director of HP Supply Chain Planning and Modeling
team.
25
minimize costs, then fewer parts may be purchased in which case the same level of
customer service level may not be reached.
The other issue to consider is how the product family will end; will it be a "soft" or a
"knife-edge" end-of-life? A "soft" end-of-life is when products are sold without
significant limitations on timeframe as long as there is sufficient demand. A "soft" end-
of-life is used primarily to maintain customer goodwill for those who continue to desire
or need the product. In contrast, a "knife-edge" end-of-life is when products are sold up
to a specified last-sale date and no products are sold after that date regardless of demand.
A "knife-edge" end-of-life does not necessarily cater to high customer service and might
be applicable for consumer products but probably not for high-performance servers that
run critical applications and require continued service and support.
There are different implications depending on the type of end-of-life selected. Most
Alpha customers are major institutions in telecommunications and financial industries or
government and education. These customers often use Alpha servers with mission-
critical applications that are specific to the Alpha platform and may have technical and/or
financial difficulty in transitioning to new platforms; they may need to continue
purchasing Alpha servers as they grow or replace older units.
Although maintaining customer goodwill comes at a price, HP is willing to incur the
costs associated with sustaining continued support, stocking sufficient parts for
production and services, and maintaining manufacturing capability. With significant
competition in the high-performance server market, the New-HP has an incentive to keep
the loyal installed base satisfied. To do this, a "soft" end-of-life strategy to migrate the
Alpha installed base to the Itanium platform was selected to minimize the risk of losing
the hard-earned customers to competitors.
26
3.2 Determine market risk factors
Dr. Corey Billington, an HP supply chain operations executive, along with his colleagues
Prof. Hau Lee of Stanford Business School and Prof. Christopher Tang of UCLA, have
written an article on how best to devise a product roll-over strategy.16 Their article
provides strategic insights on product rollover that are also applicable to end-of-life.
They discuss two major factors - product risk and market risk - to consider during roll-
over and these factors will be described in greater detail as they relate to Alpha servers.
Market risk factors are discussed first to determine their potential effects on Alpha's
future demand certainty. Although a detailed market analysis was performed by HP,
some of the key market risk factors are discussed qualitatively:
- customer base characteristics 7
- market entry (i.e. go-to-market) strategy for Itanium servers
- competitive landscape
- economic conditions
The overwhelming majority of Alpha customers are characterized as being loyal; they
prefer to stay with Alpha servers as long as they are available. However, the Alpha to
Itanium transition is also providing opportunities for a few customers to consolidate their
IT environments on competitive UNIX platforms or Windows thereby negatively
affecting future Alpha demand. The majority of current Alpha customers, who are
locked-in or are loyal, will continue to buy Alpha servers thereby increasing future
demand certainty.
In the current recessed economic environment, shrinking IT budgets creates a balancing
effect such that many existing customers are expected to stay with Alpha servers to
minimize cost risks associated with transitioning to Itanium or competitive offerings.
16 Billington, Corey, et.al.
17 Specific customer base characteristics are not provided due to confidential nature of such data.
27
Many customers are concerned about risking their business relying on an unproven new
chip or increasing spending on competitive servers in a depressed economy. Thus, the
recession further increases future demand certainty.
HP's go-to-market strategy that involves great fanfare for Itanium servers may increase
demand uncertainty for Alpha servers. Sales organizations are expected to push Itanium
servers rather than Alpha servers. This sales strategy may depress future Alpha server
demand.
In summary, most of the installed customer base is loyal to Alpha servers and are
expected to continue to desire Alpha servers until 2006. The main market factors
affecting future Alpha demand are as follows:
- customer loyalty has minimal risk on future demand
- current economic conditions have minimal risk on future demand
- Itanium "go-to-market" strategy has some risk on future demand
Upon evaluating the various market factors, they are not expected to contribute to
significant demand uncertainty as of this writing.
3.3 Assess product risk and align supplier contracts
Product risks as well as market dynamics can contribute to the uncertainty of future
demand. As Alpha servers approach end-of-life, part availability and inventory cost
minimization become increasingly important issues. For example, engineering change
orders as well as overlooked small and inexpensive but important parts of a server can
increase availability risk.18 Stabilizing engineering change orders and ensuring
continuity of supply for even small parts are critical to ensuring server product
18 Discussion with Abbott Weiss, Ph.D., MIT senior lecturer in Engineering Systems Division, October 3,
2002.
28
availability. Minimizing availability risk and inventory costs depend on the type of parts
and how they are sourced during end-of-life.
There are three different sourcing models at pre-merger Compaq: multi, single, and sole.
These sourcing models are similar to other companies such as Sun.19 A brief description
of each of the three sourcing models is provided below.
In a multi-sourced model (majority of parts), there are multiple suppliers who can provide
the same part. In this model, parts being sourced are usually commodity parts such as
memory or hard drive with many suppliers and little differentiation. Multi-sourcing
forces suppliers to compete mainly on price and relationships can be short-lived.
In a single-sourced model (a sizeable percentage of parts), there are multiple suppliers,
however, only one supplier is selected for a part due to any number of reasons: a higher
level of customization, low volumes, quality, or capacity. Relationship is important in
this model. However, there is opportunity for the buyer to switch with some pain to
another supplier.
In a sole-sourced model (a small percentage of parts), there is only one supplier who can
produce a part. This is the case with the Alpha microprocessor chip. In this model, the
buyer is locked into the supplier because of intellectual property, dedicated
manufacturing, or low volumes. The buyer has little room for negotiation with the
supplier in this model. A high trust long-term relationship is essential in this model.
For industry-standard or commodity parts, there is usually minimal availability and
pricing risk since the same parts are supplied to many other companies. However risks
increase if the supplier decides to end the life of a part because it is not generating
sufficient profit or because the part is being replaced with an upgrade. For unique parts
'9 Smith, Nathan, Dynamic Pricing Effects on Strategic Sourcing and Supplier Relations. MIT Leaders for
Manufacturing Thesis, May 2002.
29
primarily associated with single or sole-sourced models, availability and pricing risk
becomes even greater. This is especially true in case of suppliers who do not provide for
other divisions of HP, minimizing Alpha division's negotiating leverage as demand for
Alpha-specific parts wanes. Suppliers may require last-time buys or volume-
commitments from HP if a part reaches end of life. Therefore, various procurement
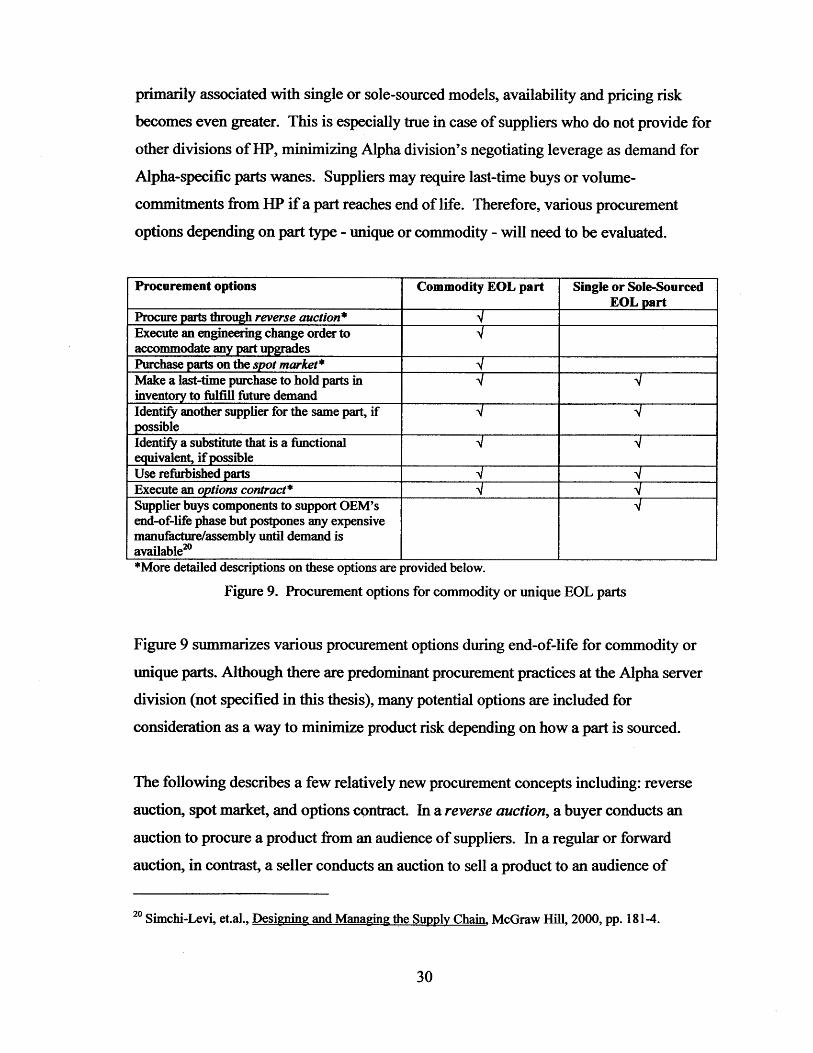
options depending on part type - unique or commodity - will need to be evaluated.
Procurement options Commodity EOL part Single or Sole-SourcedEOL part
Procure parts through reverse auction*Execute an engineering change order toaccommodate any part upgradesPurchase parts on the spot market*Make a last-time purchase to hold parts ininventory to fulfill future demandIdentify another supplier for the same part, ifpossibleIdentify a substitute that is a functionalequivalent, if possibleUse refurbished partsExecute an options contract*Supplier buys components to support OEM'send-of-life phase but postpones any expensivemanufacture/assembly until demand isavailable"_*More detailed descriptions on these options are provided below.
Figure 9. Procurement options for commodity or unique EOL parts
Figure 9 summarizes various procurement options during end-of-life for commodity or
unique parts. Although there are predominant procurement practices at the Alpha server
division (not specified in this thesis), many potential options are included for
consideration as a way to minimize product risk depending on how a part is sourced.
The following describes a few relatively new procurement concepts including: reverse
auction, spot market, and options contract. In a reverse auction, a buyer conducts an
auction to procure a product from an audience of suppliers. In a regular or forward
auction, in contrast, a seller conducts an auction to sell a product to an audience of
2 0 Simchi-Levi, et.al., Designing and Managing the Supply Chain McGraw Hill, 2000, pp. 181-4.
30
buyers. The main benefit of a reverse auction to the buyer is to help identify a supplier's
best prices without time-consuming negotiations.2 ' A reverse auction can be classified
into two categories: (1)public reverse auction where bidding is open to all qualified
suppliers in an open market usually for shorter term contracts and (2) private reverse
auction where bidding is open only to invited suppliers usually for long-term strategic
contracts. Many companies typically conduct private reverse-auctions. For example,
Sun Microsystems conducted over 40 reverse auctions valued at over $1 billion
producing savings of over 20% even after consideration for switching and transactions
costs.22
Spot markets, such as Converge, provide the opportunity for companies to purchase
components and sell components at the current market price immediately without the
need for long-term contracts. Components on the spot market are usually commodity
components such as disk drives and memory. Since availability and quality are not
guaranteed, spot markets are usually used in conjunction with long-term supply contracts
to cover shortages or to sell excess parts.
Option contracts are intended to provide purchasing flexibility to the buyer. In return for
an upfront premium paid to the supplier, the supplier provides flexibility to the buyer to
purchase a certain quantity of parts at a later time at a pre-negotiated price. Similar to a
financial call option, if the options are not exercised during a pre-determined exercise
period, the option expires worthless.
Most recently, pre-merger HP began using portfolio contracts that combine long-term
contracts, options contracts, and the spot market in a portfolio to minimize costs
associated with demand, price and availability uncertainty of commodity components and
2 1 Companies like FreeMarkets, B2E Markets, and GE Exchange Services provide electronic reverse
auction software and services. By mid-2002, Freemarkets has sourced over $40 billion for some of the
world's largest corporations producing more than $Mbillion in savings.
2 Smith, Nathan
31
services. Prof. David Simchi-Levi and Victor Albeniz of MIT have been performing
research in this area as well.
Option contracts when option premium can be estimated and justified might provide a
different means of negotiating and aligning supplier contracts at any time during a
product lifecycle including the end-of-life phase. However, methods could not be found
for determining options premium for component purchases and so the next chapter will
focus on one method using real options to estimate option premium for flexibly acquiring
parts.
3.4 Align production and fulfillment
Upon establishing end-of-life strategic intent and evaluating market & product risks, the
next steps are to consider how and where the servers will be produced, fulfilled, and
serviced. Areas of considerations for end-of-life management include (1) outsourcing
certain portions of manufacturing or logistics to third parties and (2) consolidating plant
operations based on parameters such as tax issues, production costs, manufacturing
capacity, and logistics costs.
Outsourcing can be an attractive alternative especially with electronic contract
manufacturers such as Solectron, Jabil, and Celestica who are now providing many more
aspects of supply chain life-cycle management including end-of-life services, warranty &
repair, fulfillment, and distribution. Since these companies are in the business of
manufacturing circuit boards and electronic components that go into their customer's
products, they have the ability to provide value-added services with their expertise and
knowledge in the industry. Third-party providers might be able to combine the end-of-
life requirements of multiple computer original equipment manufacturers to increase
efficiency, lower costs, and possibly even improve service level. With waning demand
3 Albeniz, Victor and Simchi-Levi, David, "A Portfolio Approach to Procurement Contracts," MIT
working paper, October 3, 2002.
32
and cost-minimization goals, outsourcing might be worth considering for supply chain
life-cycle management.
Plant consolidation in consideration of waning demand can reduce costs by risk-pooling
part demand from multiple locations and by reducing the total required labor and
overhead costs. Also, depending on where products are produced can have a rather large
impact on after-tax profit. For example, since there are no corporate income taxes in
Puerto Rico, a US manufacturing firm can negotiate with the IRS such that profit
generated on a certain portion of revenue (i.e. transfer price) might not be taxed. Many
other countries have lower corporate tax rate compared with the 35% tax rate in the US.
Therefore, estimating after-tax profits (with consideration for variations in shipping,
setup, and labor, and overhead costs) rather than pre-tax income or gross profits when
selecting a consolidated facility is preferable. Detailed tax benefit analyses for several
strategic components were conducted but will not be discussed due to confidentiality.
3.5 Conclusion
In developing an end-of-life supply chain strategy, the strategic intent, part risk, as well
as market risks, are just some of the major factors that help identify effective
procurement, inventory management, and fulfillment tactics. It has been established that
maintaining satisfaction of installed Alpha server customer base is the new-HP's strategic
intent. While driving this strategy, there might be opportunities to minimize excess
inventory, lower part costs and risk by investigating innovative procurement strategies
such as reverse-auctions, spot markets, and options contracts. From a market risk
perspective, it is expected as of this writing that the market conditions will have a
minimal impact on demand forecast.
For the Alpha server supply chain organization, their primary challenge is to minimize
costs during the "soft" end-of-life phase with high customer service level. They might
achieve their goals by leveraging greater buying power of the new-HP, investigating
33

more cost-effective solutions to procurement and outsourcing certain supply chain
operations.
34
4 REAL OPTIONS FOR PART PROCUREMENT
4.1 Introduction
Major issues for the Alpha server division's supply chain operations group are to
minimize excess inventory and price deviations given demand uncertainty during the
end-of-life phase while guaranteeing a desired level of availability. Although there are
many aspects to consider in the end-of-life supply chain strategy as discussed in the
previous chapter, developing cost-effective supplier contracts is a major challenge. Real
options are investigated as an alternative to making long-term volume commitments.
Real options can be best described in relation to financial call options. A financial call
option for a stock is purchased at a fee to provide the option holder the flexibility to
exercise the option to buy a stock at a pre-determined exercise price before an expiration
time. If the stock price is higher than the exercise price at the time of exercise, the option
holder may exercise the option to capture any gains. However, if the stock price drops
below the exercise price, the option holder would not exercise the option and downside
exposure is just the option fee.
Real options have been used to provide flexibility in making decisions about executing
future projects by waiting for more information or as information certainty increases
about product price, demand, or output capacity.24 Real options take into consideration
future uncertainty and flexibility in executing a project for evaluating the project's value.
This is in contrast to using net present value analysis which determines a project's value
with the assumption that a decision has already been made to execute a project.
Similarly, the author argues that real options can be used to obtain the flexibility to
procure parts in light of uncertain demand and/or pricing rather than making upfront
24 slie, Keith J., and Michaels, Max P., "The real power of real options," The McKinsey Quarterly, 1997
Number 3.
35
quantity commitments. If there is server demand in the future, the option can be
exercised to acquire sufficient number of parts needed at a pre-determined price to build
the servers to meet demand. However, if there is no demand in the future, no part
purchases need to be made and downside is limited to the option fee. A specific example
using worldwide demand for Alpha chip during the end-of-life phase will be used to
describe how the real option valuation method might be used to procure parts.
4.2 Real option premium estimation using Black-Scholes formula
The purpose of this section is to provide a methodology to estimate the premium to pay to
a supplier in order to obtain the flexibility for obtaining the option to purchase parts on an
as-needed basis rather than making upfront quantity commitments. At a high level, we
want to compare the real option value with the traditional means of calculating a project's
value using net present value and safety stock.
Real options premium = ROV - NPV
Net present value (NPV) is the difference between the present value of revenue and
present value of costs. Real option value (ROV) is calculated using the Black-Scholes
option-pricing model taking into consideration demand uncertainty.
The difference between ROV and NPV provides the real options premium that a buyer is
willing to pay for the flexibility in acquiring parts arising from demand uncertainty. This
difference is calculated for each period of the forecast. The premise is that if ROV is
greater than NPV, the buyer ought to buy an option from the supplier because the
potential return is higher. However, if NPV is greater than ROV, then the buyer might be
better off making a purchase commitment. The following provides a detailed analysis on
estimating real option premium.
36
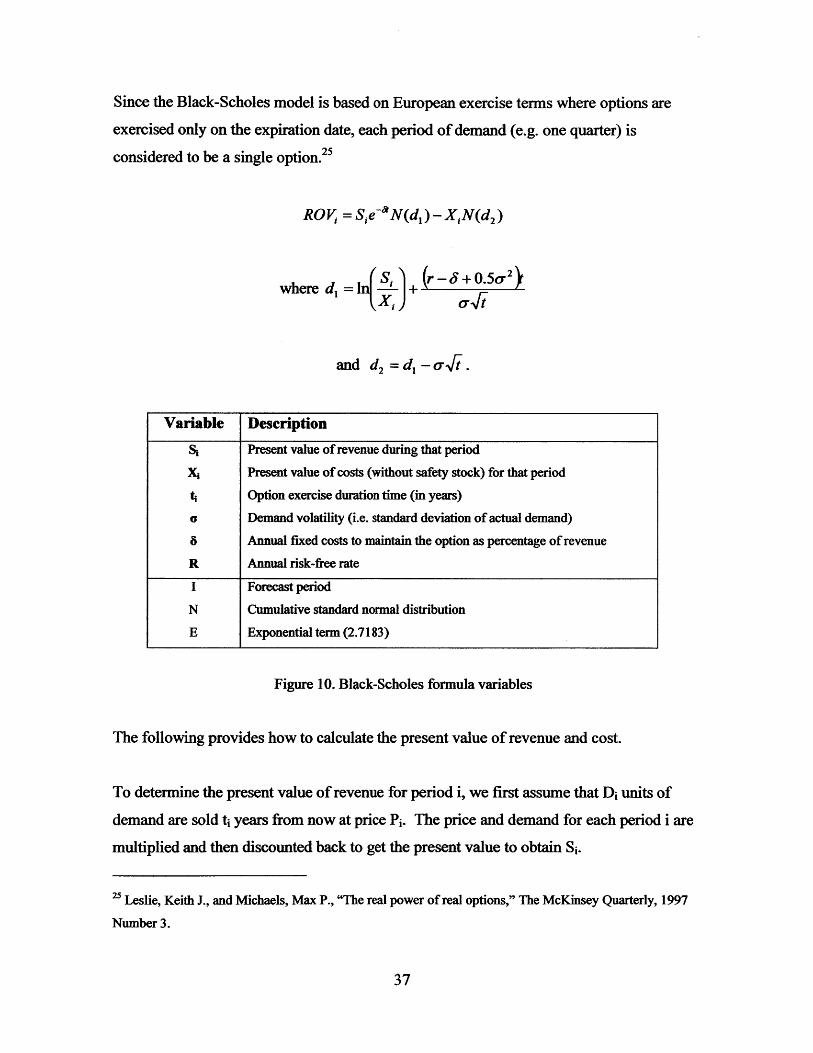
Since the Black-Scholes model is based on European exercise terms where options are
exercised only on the expiration date, each period of demand (e.g. one quarter) is
considered to be a single option.
ROV, = Sie-N(d,) - XN(d 2)
(S. 8 -+0.5a.2where di =n + .5
and d2 = d, -- t-.
Variable Description
S, Present value of revenue during that period
X, Present value of costs (without safety stock) for that period
Option exercise duration time (in years)a Demand volatility (i.e. standard deviation of actual demand)
Annual fixed costs to maintain the option as percentage of revenue
R Annual risk-free rate
I Forecast period
N Cumulative standard normal distribution
E Exponential term (2.7183)
Figure 10. Black-Scholes formula variables
The following provides how to calculate the present value of revenue and cost.
To determine the present value of revenue for period i, we first assume that Di units of
demand are sold t years from now at price Pi. The price and demand for each period i are
multiplied and then discounted back to get the present value to obtain Si.
2 Leslie, Keith J., and Michaels, Max P., "The real power of real options," The McKinsey Quarterly, 1997
Number 3.
37
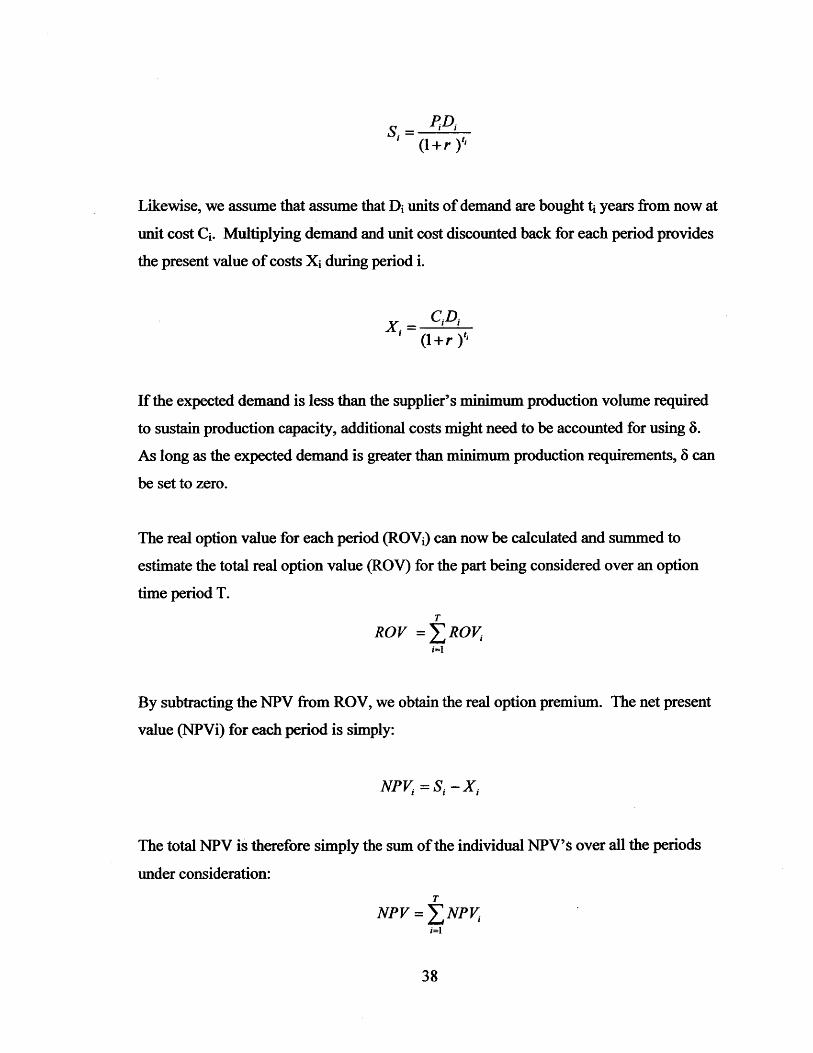
PID.(1+r )t
Likewise, we assume that assume that Di units of demand are bought ti years from now at
unit cost Ci. Multiplying demand and unit cost discounted back for each period provides
the present value of costs Xi during period i.
Xi =- CD,
If the expected demand is less than the supplier's minimum production volume required
to sustain production capacity, additional costs might need to be accounted for using S.
As long as the expected demand is greater than minimum production requirements, 8 can
be set to zero.
The real option value for each period (ROVi) can now be calculated and summed to
estimate the total real option value (ROV) for the part being considered over an option
time period T.
T
ROV =XROVi
By subtracting the NPV from ROV, we obtain the real option premium. The net present
value (NPVi) for each period is simply:
NPV = Si - X,
The total NPV is therefore simply the sum of the individual NPV' over all the periods
under consideration:
T
NPV = NPVi=1
38
4.3 Real options premium estimation example
The following provides a step-by-step methodology for estimating real options premium
for a one-year option for Alpha chips using disguised numbers. HP would pay the
premium for a one-year option from its supplier in return for the flexibility to make
purchases on an as-needed basis during the one-year period rather than committing to
purchase a quantity equal to the one-year expected demand forecast.
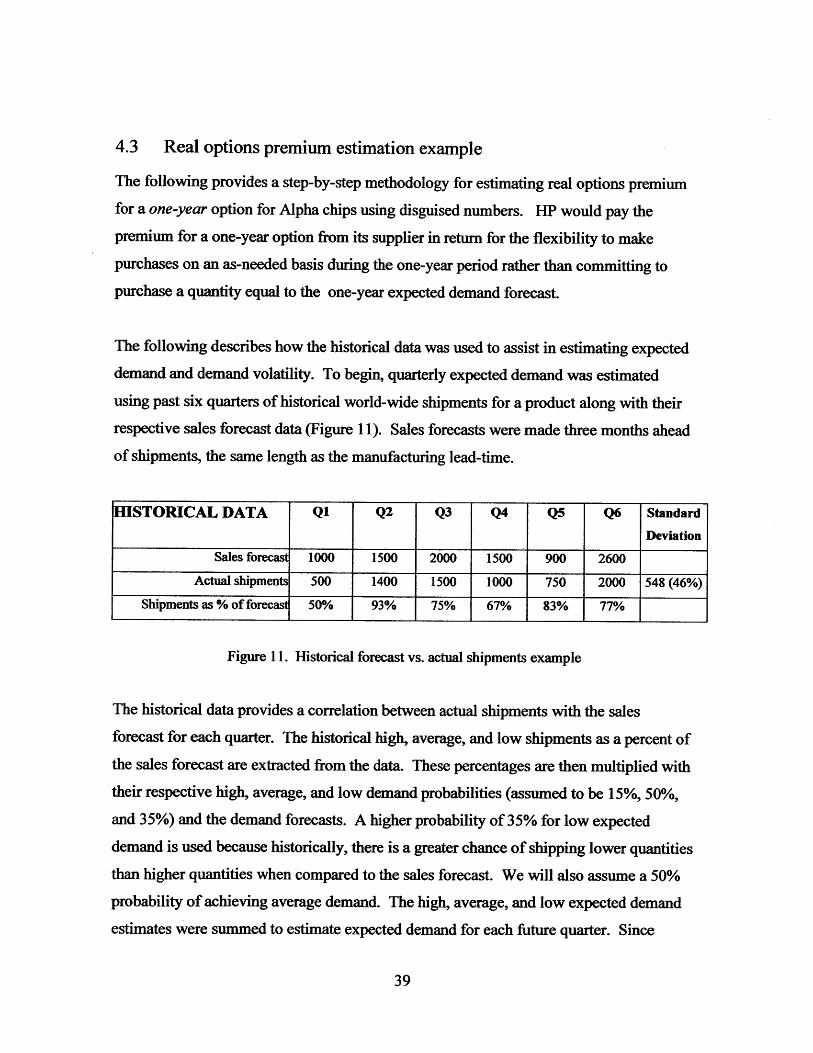
The following describes how the historical data was used to assist in estimating expected
demand and demand volatility. To begin, quarterly expected demand was estimated
using past six quarters of historical world-wide shipments for a product along with their
respective sales forecast data (Figure 11). Sales forecasts were made three months ahead
of shipments, the same length as the manufacturing lead-time.
HISTORICAL DATA Q1 Q2 Q3 Q4 Q5 Q6 Standard
Deviation
Sales forecast 1000 1500 2000 1500 900 2600
Actual shipments 500 1400 1500 1000 750 2000 548 (46%)
Shipments as % of forecasl 50% 93% 75% 67% 83% 77%
Figure 11. Historical forecast vs. actual shipments example
The historical data provides a correlation between actual shipments with the sales
forecast for each quarter. The historical high, average, and low shipments as a percent of
the sales forecast are extracted from the data. These percentages are then multiplied with
their respective high, average, and low demand probabilities (assumed to be 15%, 50%,and 35%) and the demand forecasts. A higher probability of 35% for low expected
demand is used because historically, there is a greater chance of shipping lower quantities
than higher quantities when compared to the sales forecast. We will also assume a 50%
probability of achieving average demand. The high, average, and low expected demand
estimates were summed to estimate expected demand for each future quarter. Since
39
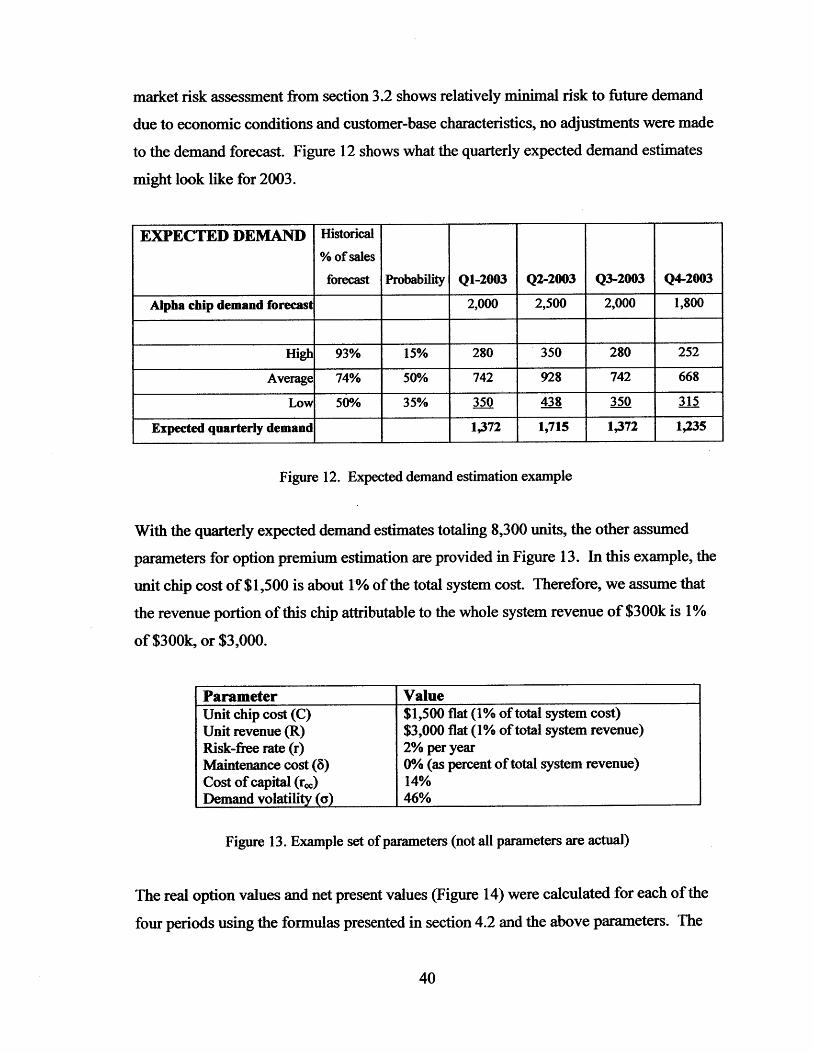
market risk assessment from section 3.2 shows relatively minimal risk to future demand
due to economic conditions and customer-base characteristics, no adjustments were made
to the demand forecast. Figure 12 shows what the quarterly expected demand estimates
might look like for 2003.
EXPECTED DEMAND Historical% of sales
forecast Probability Q1-2003 Q2-2003 Q3-2003 Q4-2003
Alpha chip demand forecast 2,000 2,500 2,000 1,800
High 93% 15% 280 350 280 252
Average 74% 50% 742 928 742 668
Low 50% 35% 350 438 350 315
Expected quarterly demand 1,372 1,715 1,372 1,235
Figure 12. Expected demand estimation example
With the quarterly expected demand estimates totaling 8,300 units, the other assumed
parameters for option premium estimation are provided in Figure 13. In this example, the
unit chip cost of $1,500 is about 1% of the total system cost. Therefore, we assume that
the revenue portion of this chip attributable to the whole system revenue of $300k is 1%
of $300k, or $3,000.
Parameter ValueUnit chip cost (C) $1,500 flat (1% of total system cost)Unit revenue (R) $3,000 flat (1% of total system revenue)Risk-free rate (r) 2% per yearMaintenance cost (8) 0% (as percent of total system revenue)Cost of capital (r,,) 14%Demand volatility (a) 46%
Figure 13. Example set of parameters (not all parameters are actual)
The real option values and net present values (Figure 14) were calculated for each of the
four periods using the formulas presented in section 4.2 and the above parameters. The
40
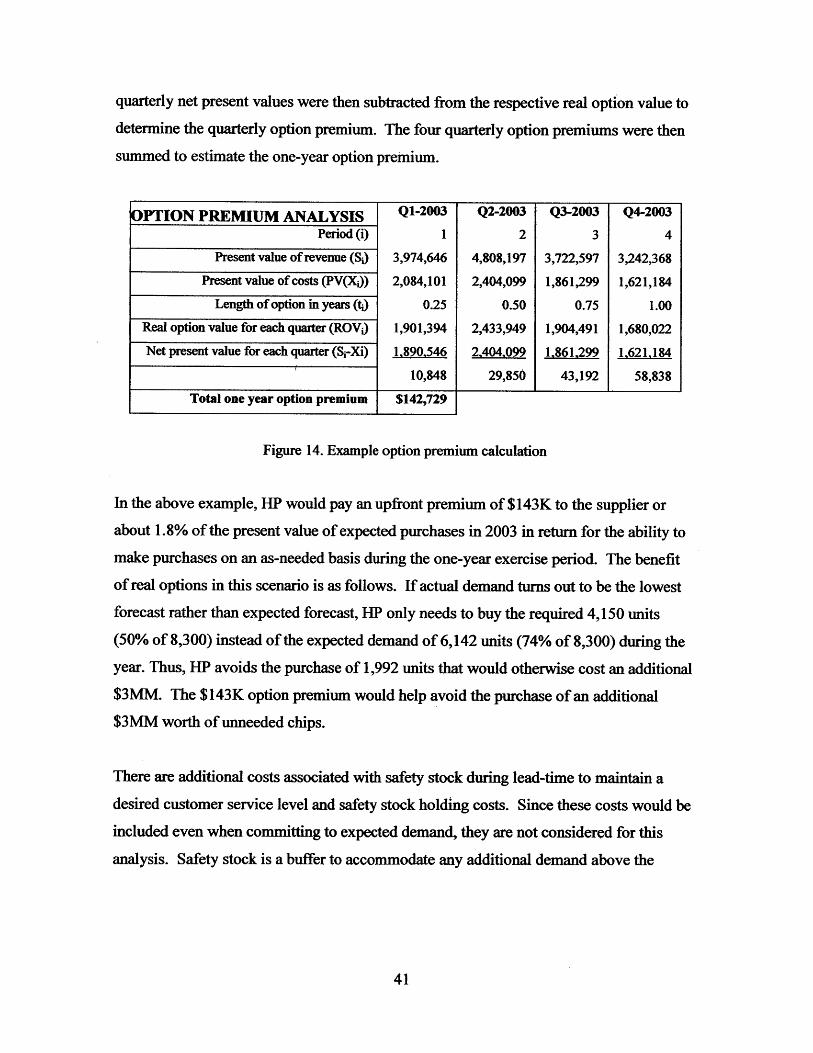
quarterly net present values were then subtracted from the respective real option value to
determine the quarterly option premium. The four quarterly option premiums were then
summed to estimate the one-year option premium.
OPTION PREMiUM ANALYSIS Q-2003 Q2-2003 Q3-2003 Q4-2003Period (i) 1 2 3 4
Present value of revenue (Si) 3,974,646 4,808,197 3,722,597 3,242,368
Present value of costs (PV(X1)) 2,084,101 2,404,099 1,861,299 1,621,184
Length of option in years (ti) 0.25 0.50 0.75 1.00
Real option value for each quarter (ROV ) 1,901,394 2,433,949 1,904,491 1,680,022
Net present value for each quarter (S-Xi) 1,890,546 2,404,099 1,861,299 1,621,184
10,848 29,850 43,192 58,838
Total one year option premium $142,729
Figure 14. Example option premium calculation
In the above example, HP would pay an upfront premium of $143K to the supplier or
about 1.8% of the present value of expected purchases in 2003 in return for the ability to
make purchases on an as-needed basis during the one-year exercise period. The benefit
of real options in this scenario is as follows. If actual demand turns out to be the lowest
forecast rather than expected forecast, HP only needs to buy the required 4,150 units
(50% of 8,300) instead of the expected demand of 6,142 units (74% of 8,300) during the
year. Thus, HP avoids the purchase of 1,992 units that would otherwise cost an additional
$3MM. The $143K option premium would help avoid the purchase of an additional
$3MM worth of unneeded chips.
There are additional costs associated with safety stock during lead-time to maintain a
desired customer service level and safety stock holding costs. Since these costs would be
included even when committing to expected demand, they are not considered for this
analysis. Safety stock is a buffer to accommodate any additional demand above the
41
expected demand at a specified customer service level.26 Safety stock (SSj) for each
period is calculated as follows:
SSi=z a 47
where z is the value associated with cumulative probability for a specified customer
service level (e.g. for 95% customer service level, z = 1.65), a is the standard deviation
of demand which can be estimated from historical shipment data, and L is the lead time
(in quarters).
4.4 Supplier contract points
When negotiating a real options contract with a component supplier, there are several key
points that ought to be considered in a win-win contract and they include: expected
demand forecast, option exercise time period, unit price, quid pro quo penalty, and
maintenance costs. Each of these contract points are discussed below.
Expected demand forecast
A long-term demand forecast provides the supplier with the ability to better manage its
production capacity to ensure availability of parts according to the demand forecast. This
is in contrast to getting short-term rolling forecasts. Since the demand forecast is used to
calculate the real option premium, it would also help the supplier to consider other issues
such as maintenance costs, which is described later.
Exercise time period
The exercise time period provides a timeframe during which parts can be purchased. The
duration of the exercise period will need to be set based on current expectations on future
prices, availability, and demand. A shorter exercise period will be less expensive than a
2 Service level is defined as the probability of not stocking out during lead-time. Simchi-Levi, et.al.,
Designing and Managing the Supply Chain McGraw Hill, 2000.
42
longer exercise period. However, the cost of using a longer exercise period might be
worthwhile if there are any concerns about rising prices and/or availability risk in the
future.
Unit price
The unit price(s) during the exercise period ought to be negotiated based on expected
demand and market price trends. Prices can be constant or can vary depending on when
the components are requested during the exercise period and how many are requested
with respect to the expected demand forecast.
It is conceivable that order quantities higher than what have been forecasted might
require an additional premium possibly because the supplier had already planned for
producing the expected demand and any additional quantities might warrant additional
unexpected resources. Any premium ought to be pre-negotiated to minimize issues when
such an event occurs.
Quid pro quo penalty
It is expected that the supplier provide a certain level of delivery and quality service.
This service level needs to be specified for the supplier to estimate any maintenance costs
associated with maintaining production capacity or safety stock in order to achieve the
desired service level. A supplier penalty for not meeting a service level might be
included in the contract. Also, to prevent the buyer from underestimating expected
demand forecasts, the buyer might be required to pay a pre-negotiated premium or
penalty if actual orders are continuously above expected forecasts. On the other hand, if
there is an expedite request, a premium might be charged to the buyer.
Maintenance costs
The buyer might be expected to be liable for any costs to support demand that might be
less than required to maintain supplier's operation. This liability might come in the form
of a minimum commitment.
43
4.5 Alpha chip real options analysis
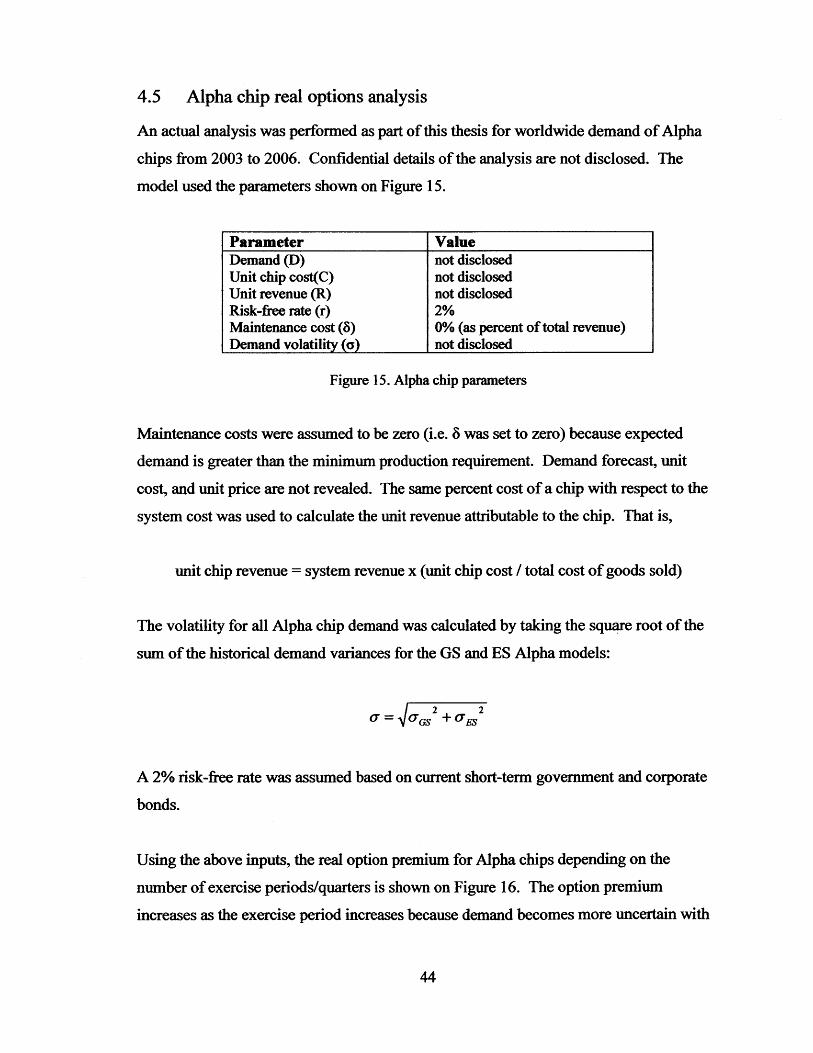
An actual analysis was performed as part of this thesis for worldwide demand of Alpha
chips from 2003 to 2006. Confidential details of the analysis are not disclosed. The
model used the parameters shown on Figure 15.
Figure 15. Alpha chip parameters
Maintenance costs were assumed to be zero (i.e. 8 was set to zero) because expected
demand is greater than the minimum production requirement. Demand forecast, unit
cost, and unit price are not revealed. The same percent cost of a chip with respect to the
system cost was used to calculate the unit revenue attributable to the chip. That is,
unit chip revenue = system revenue x (unit chip cost / total cost of goods sold)
The volatility for all Alpha chip demand was calculated by taking the square root of the
sum of the historical demand variances for the GS and ES Alpha models:
2 2i-= fo-GS +S(2
A 2% risk-free rate was assumed based on current short-term government and corporate
bonds.
Using the above inputs, the real option premium for Alpha chips depending on the
number of exercise periods/quarters is shown on Figure 16. The option premium
increases as the exercise period increases because demand becomes more uncertain with
44
Parameter ValueDemand (D) not disclosedUnit chip cost(C) not disclosedUnit revenue (R) not disclosedRisk-free rate (r) 2%Maintenance cost (6) 0% (as percent of total revenue)Demand volatility (a) not disclosed
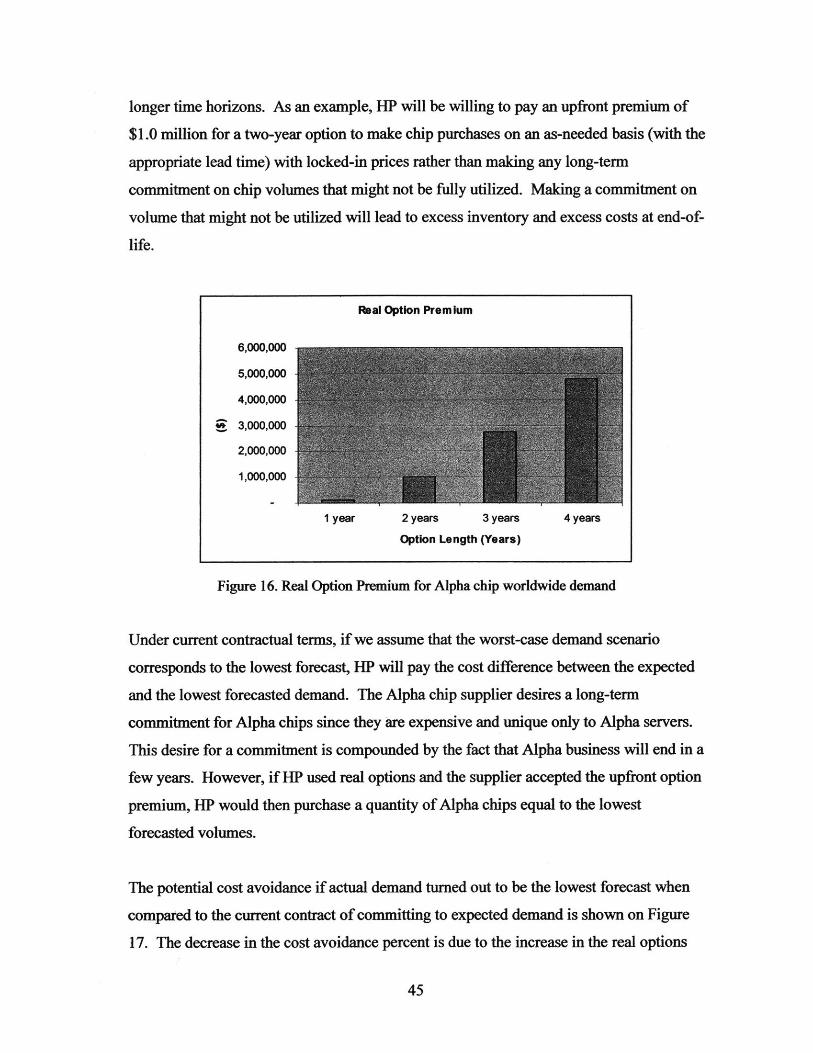
longer time horizons. As an example, HP will be willing to pay an upfront premium of
$1.0 million for a two-year option to make chip purchases on an as-needed basis (with the
appropriate lead time) with locked-in prices rather than making any long-term
commitment on chip volumes that might not be fully utilized. Making a commitment on
volume that might not be utilized will lead to excess inventory and excess costs at end-of-
life.
Real Option Premium
6,000,000
5,000,000
4,000,000
3,000,000
2,000,000
1,000,000
1 year 2 years 3 years 4 years
Option Length (Years)
Figure 16. Real Option Premium for Alpha chip worldwide demand
Under current contractual terms, if we assume that the worst-case demand scenario
corresponds to the lowest forecast, HP will pay the cost difference between the expected
and the lowest forecasted demand. The Alpha chip supplier desires a long-term
commitment for Alpha chips since they are expensive and unique only to Alpha servers.
This desire for a commitment is compounded by the fact that Alpha business will end in a
few years. However, if HP used real options and the supplier accepted the upfront option
premium, HP would then purchase a quantity of Alpha chips equal to the lowest
forecasted volumes.
The potential cost avoidance if actual demand turned out to be the lowest forecast when
compared to the current contract of committing to expected demand is shown on Figure
17. The decrease in the cost avoidance percent is due to the increase in the real options
45
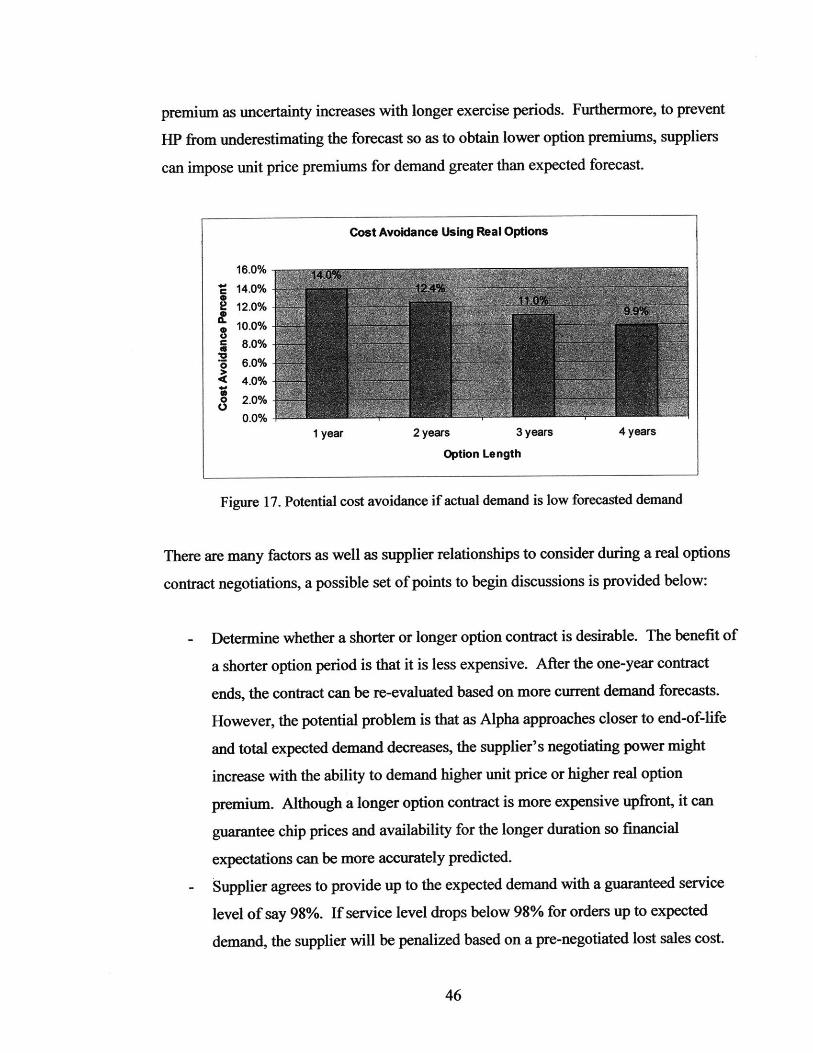
premium as uncertainty increases with longer exercise periods. Furthermore, to prevent
HP from underestimating the forecast so as to obtain lower option premiums, suppliers
can impose unit price premiums for demand greater than expected forecast.
Cost Avoidance Using Real Options
16.0%C 14.0%Ll 12.0%
10.0%C 8.0%
6.0%4.0%
0 2.0%0.0%
I year 2 years 3 years 4 years
Option Length
Figure 17. Potential cost avoidance if actual demand is low forecasted demand
There are many factors as well as supplier relationships to consider during a real options
contract negotiations, a possible set of points to begin discussions is provided below:
- Determine whether a shorter or longer option contract is desirable. The benefit of
a shorter option period is that it is less expensive. After the one-year contract
ends, the contract can be re-evaluated based on more current demand forecasts.
However, the potential problem is that as Alpha approaches closer to end-of-life
and total expected demand decreases, the supplier's negotiating power might
increase with the ability to demand higher unit price or higher real option
premium. Although a longer option contract is more expensive upfront, it can
guarantee chip prices and availability for the longer duration so financial
expectations can be more accurately predicted.
- Supplier agrees to provide up to the expected demand with a guaranteed service
level of say 98%. If service level drops below 98% for orders up to expected
demand, the supplier will be penalized based on a pre-negotiated lost sales cost.
46
- Agree upon chip prices depending on expected volume over a time horizon. HP
will agree to certain minimal commitments such as 50% of the lowest expected
demand. If ordered quantity is above the expected demand, HP might agree to a
unit price premium.
4.6 Future research
The valuation of real options for part procurement presented in this thesis is just a
beginning to what could be more complex analysis taking into consideration many other
factors. Financial models such as Black-Scholes option pricing model is based on
financial matters - a non-real commodity. There might be other issues to consider when
determining option pricing for real aspects in the model for part procurement depending
on the company, products, and supply chain relationships. Some additional issues that
might be worth considering include:
- Inventory policy and carryover arising from variations in demand uncertainty over
time. For example, if there is excess inventory at the end of a period, it will be
carried over to the next period in which case demand for the next period will
decrease. These scenarios may need to be considered.
- Any limitations in production capacity. Limitations to production capacity will
impact availability. The real options analysis in this thesis assumes that there is
unlimited capacity; that is, any demand level can be filled. Clearly this is not the
situation in real life. The model might need to consider how production capacity
limitations will need to be handled.
- Supplier relationship type (single source, sole-source, multi-source). Supplier
relationships can impact negotiating leverage. For example, a sole-source vendor
might demand a higher option premium with less flexibility whereas a multi-
source vendor might agree to a lower option premium with greater flexibility.
Negotiating leverage might be worth considering in the model, somehow.
- Ability for the organization to adopt a real option model. The model presented is
rather complex and it would take someone with sufficient knowledge of finance to
47
understand it. Even with sufficient finance knowledge, the model will need to be
presented in simple terms to enable adoption within a buyer organization.
The above issues are presented so that the reader can make an assessment to see if
additional analyses might be required. However, despite all the analyses, each manager
will need to incorporate experience with the assistance of the model to make the right
decisions.
4.7 Conclusion
Real options could lead to a win-win procurement contract. The buyer's main benefit
especially during a product's end-of-life phase is:
- Minimizing downside exposure to just the option premium and any safety stock
required during lead time thereby reducing any liability arising from excess
inventory due to long-term commitments based on expected demand.
- Guarantee part availability and price.
- Predictability of costs.
Some of the supplier benefits include:
- Gaining better visibility into long-term expected demand to help reduce bullwhip
effect and improve planning.
- Being compensated with a premium for taking on the risk of providing flexibility.
- Clear set of liabilities and expectations.
Given inventory history and as the Alpha business approaches end-of-life, it is
recommended that the Alpha server supply chain group investigate the opportunity to
negotiate with the supplier using real options to help minimize inventory risk. Rather
than making long-term commitments based on expected demand, using procurement
options has the potential to reduce the risk of writing off too much excess inventory in the
27 Simchi-Levi, et.al., Designing and Managing the Supply Chair' McGraw Hill, 2000.
48

future while guaranteeing availability and pricing. Based on discussions with other
managers and executives in the Alpha server divisions, the chip supplier seems open to
new and creative ideas for strategic contracts. Further research is recommended to
develop a more comprehensive option pricing tool, if necessary.
49
BIBLIOGRAPHY
Anthony, Chris, Optimizing Options Fulfillment in a Configure to Order Business. MITM.S. Thesis, June 2002.
Albeniz, Victor and Simchi-Levi, David, "A Portfolio Approach to ProcurementContracts," MIT working paper, October 3, 2002.
Altherr, Mark and Cheon Gene, HP and Compaq Analyst Report, Credit-Suisse FirstBoston, May 10, 2002.
Billington, Corey; Lee, Hau L.; and Tang, Christopher S., "Successful Strategies forProduct Rollovers," MIT Sloan Management Review, Volume 39, Number 3, Spring1998
Cattani, Ph.D., Kyle, "Hewlett-Packard Company: Managing Product End-of-Life",Kenan-Flagler Business School Business Case Study, UNC-Chapel Hill, May 2001.
Fortuna, Steve and Hilhneyer, Michael, "Fireside Chat with Michael Capellas," MerrillLynch company update, May 3, 2002.
Gantz, John and Turner, Vernon, "Standardization: The Secret to IT Leverage," IDCWhitepaper, 2002.
Leslie, Keith J., and Michaels, Max P., "The real power of real options," The McKinseyQuarterly, 1997 Number 3.
O'Brien, Bill, "Alpha preps for grand finale," Tech Update, August 19, 2002.Melenovsky, Mark and Humphreys, John, "Maximizing Flexibility and MinimizingCosts," IDC Whitepaper, 2002.
Sceonaghi, Jr, A.M. and Chiang, H. Eric, "New Unix Servers Unlikely to AlterCompetitive Landscape," Berstein Research weekly notes, September 28,2001.
Simchi-Levi, David; Kaminsky, Philip; and Simchi-Levi, Edith, Designing and Managing
the Supply Chain, McGraw Hill, 2000.
Smith, Nathan, Dnami ects on Strategic Sourcing and Spplier RelationsMIT M.S. Thesis, June 2002.
Yokley, Kara; Kaufmann, Nicholas J.; Goldfarb, Debra S.; Joseph II, Earl; and Willard,Ph.D., Christopher G., "Dell's New Target -HPC", IDC Bulletin #26562, February 2002.
50