Embed Size (px)
Citation preview

Clemson University Clemson University
TigerPrints TigerPrints
All Dissertations Dissertations
December 2020
Encystation and Glycogen Metabolism in Encystation and Glycogen Metabolism in Entamoeba histolytica
Jordan Lynne Wesel Clemson University, [email protected]
Follow this and additional works at: https://tigerprints.clemson.edu/all_dissertations
Recommended Citation Recommended Citation Wesel, Jordan Lynne, "Encystation and Glycogen Metabolism in Entamoeba histolytica" (2020). All Dissertations. 2752. https://tigerprints.clemson.edu/all_dissertations/2752
This Dissertation is brought to you for free and open access by the Dissertations at TigerPrints. It has been accepted for inclusion in All Dissertations by an authorized administrator of TigerPrints. For more information, please contact [email protected].

Encystation and Glycogen Metabolism in Entamoeba histolytica
A Dissertation Presented to
the Graduate School of Clemson University
In Partial Fulfillment of the Requirements for the Degree
Doctor of Philosophy Biochemistry and Molecular Biology
by Jordan Lynne Kirk Wesel
December 2020
Accepted by: Cheryl Ingram-Smith, Committee Chair
James Morris Kerry Smith
Lesly Temesvari
ii
ABSTRACT
Entamoeba histolytica is a parasitic protozoan that causes amebic dysentery,
which affects approximately 90 million people annually, killing between 50-100,000. E.
histolytica is transmitted via the oral-fecal route, through ingestion of contaminated food
and water. The infectious form of the disease is the quiescent cyst, which after ingestion,
undergoes excystation in the small intestine to the proliferative trophozoite. The
trophozoite is the disease-causing form of the parasite, which colonizes the large
intestine. Some trophozoites encyst in the large intestine and are passed out of the host,
propagating the infectious cycle.
Despite the global burden of this disease, study of the infectious cycle has been
impeded by the lack of an E. histolytica model for encystation and excystation. The
reptilian pathogen Entamoeba invadens (E. invadens) has been used as a model; however,
the extensive evolutionary differences between these species, and the different
environments they inhabit, render E. invadens an imperfect model. We present here the
first model for E. histolytica encystation in axenic culture. The generated cysts displayed
all four hallmarks: tetranucleation, a chitinous cell wall, small round shape, and detergent
resistance. High cell density and glucose starvation were shown to be essential signals for
encystation. Additionally, the presence of physiologically relevant concentrations of short
chain fatty acids was shown to accelerate encystation in the parasite.
E. histolytica relies heavily on glycolysis for production of ATP. However, E.
histolytica colonizes the human gut, where glucose is extremely scarce. Glycogen is used
in Entamoeba as a storage molecule, providing glucose as a precursor to either glycolysis
iii
or chitin synthesis during encystation. Therefore, glycogen metabolism in E. histolytica is
thought to be essential for both the growth and proliferation of the parasite. Here, we
examine glycogen metabolism in E. histolytica, and its role in cell growth and
encystation. We examine how trophozoites grow in conditions of nutrient stress and show
that cellular glycogen consumption allows for proper cell growth even absent glucose.
We also show generate two knockdown strains, inhibiting the function of glycogen
synthase and two glycogen phosphorylases, each responsible for half of the glycogen
cycle. These knockdowns are prevented from accumulating cellular glycogen, growing,
and encysting in a comparable fashion to wild type cells. This demonstrates that glycogen
synthesis and degradation are vital to the growth and propagation of the parasite in a low
glucose environment.

iv
DEDICATION
I would like to dedicate this to my Mom and Dad, because I truly could not have
done this without your constant love, support, and encouragement; to my Granny Isabel,
who would have loved to be here to see this; to Cleo and Lilly, who kept me sane through
many late nights of lab work and writing; to Corey, for your love, kindness, patience, and
for your unwavering sense of optimism; finally, to Jimmy, who I am sure will be the first
person outside my committee to read this front to back.

v
ACKNOWLEDGMENTS
I would like to thank my advisor, Dr. Cheryl Ingram-Smith. I am incredibly
grateful for your patience, humor, and cheesecakes. You made me feel very at home. I
am also grateful for all you have taught me, and I will never forget my time in your lab.
I would like to thank my committee as well. Thank you to Dr. Kerry Smith for all
your input and encouragement. Thank you to Dr. James Morris for teaching me why the
sky is blue and why groundhogs have fungal disease. Thank you to Dr. Lesly Temesvari
for all your writing advice, and all your help with the encystation research.
I would like to thank my lab members Matthew Angel, Irem Bastuzel, and Jin
Cho for your help and advice. I am lucky to have had such a good group of coworkers. I
would also like to thank Jennifer Shuman and Julie Dickerson for being fantastic research
partners. Also, I would like to thank Jessica Jones and Christina Wilkinson for all your
love and support, and for being my absolute best friends. Without you two, graduate
school would have been completely impossible
I would also like to thank Rhonda Powell from the Clemson Light Imaging
Facility for her help teaching me microscopy; Dr. Logan Crowe for teaching me how to
use the flow cytometer; Brenda Welter, for helping with encystation research; Corey
Schultz for performing the statistical analysis.
Finally, thank you to the amazing faculty and staff in the Clemson University
Genetics and Biochemistry Department and the Eukaryotic Pathogens Innovation Center.
Thank you for giving me the chance to be a Clemson Tiger.

vi
TABLE OF CONTENTS
Page
TITLE PAGE .................................................................................................................... i ABSTRACT ..................................................................................................................... ii DEDICATION ................................................................................................................ iv ACKNOWLEDGMENTS ............................................................................................... v LIST OF TABLES ........................................................................................................ viii LIST OF FIGURES ........................................................................................................ ix CHAPTER I. Literature Review........................................................................................... 1 Entamoeba histolytica: The Pathogen ........................................................... 1 E. histolytica Metabolism .............................................................................. 4 The Genome and Genetic Tools .................................................................. 12 Stage Conversion in Parasites ...................................................................... 18 Encystation ................................................................................................... 21 Four Hallmarks of Encystation .................................................................... 25 Nutrient Stress and Density Dependence ..................................................... 36 Short Chain Fatty Acids ............................................................................... 39 Excystation ................................................................................................... 43 Research Summary ...................................................................................... 48 References .................................................................................................... 50 II. Encystation of Entamoeba histolytica in Axenic Culture ............................ 63 Abstract ........................................................................................................ 63 Introduction .................................................................................................. 64 Materials and Methods ................................................................................. 67 Results .......................................................................................................... 70 Discussion .................................................................................................... 91 Concluding Remarks .................................................................................... 99 References .................................................................................................. 100

vii
Table of Contents (Continued)
Page
III. Glycogen Metabolism in Entamoeba histolytica ....................................... 107 Abstract ...................................................................................................... 107 Introduction ................................................................................................ 108 Materials and Methods ............................................................................... 111 Results ........................................................................................................ 117 Discussion .................................................................................................. 134 Concluding Remarks .................................................................................. 145 References .................................................................................................. 146 IV. Conclusions and Future Directions ............................................................ 151 Introduction ................................................................................................ 151 The Role of Short Chain Fatty Acids in Gene Regulation......................... 151 Cyst Viability and Excystation in E. histolytica ........................................ 153 The Role of Glycogen Metabolism in Cyst Production and Maturation ........................................................................................... 154 References .................................................................................................. 156 APPENDICES ............................................................................................................. 158 A: License for Use of Figure 1.2 .................................................................... 159 B: License for Use of Figure 1.4 .................................................................... 163 C: License for Use of Figure 1.5 .................................................................... 168 C: License for Use of Figure 1.6 .................................................................... 172

viii
LIST OF TABLES
Table Page 3.A Primers used for gene amplification and RT-PCR analysis....................... 116

ix
LIST OF FIGURES
Figure Page 1.1 The Life Cycle of E. histolytica ..................................................................... 4 1.2 The Glycolytic Pathway and ATP Production in E. histolytica .................................................................................................. 6 1.3 Carbohydrates Serve as Energy Reserves in E. histolytica ................................................................................................ 10 1.4 Canonical RNA interference pathway in Eukaryotic Cells ........................................................................................... 14 1.5 Phylogenetic Analysis of Entamoeba species .............................................. 23 1.6 Chitin Biosynthetic Pathway in E. histolytica ............................................. 28 2.1 In vitro formed E. histolytica cysts are multinucleate ................................. 72 2.2 In vitro formed E. histolytica cysts have a chitin cell wall ........................................................................................................ 74 2.3 In vitro formed E. histolytica cysts are reduced in size versus trophozoites ........................................................................... 76 2.4 In vitro formed E. histolytica cysts are detergent resistant ........................................................................................ 78 2.5 Effect of starting cell density on encystation ............................................... 81 2.6 Effect of cell density on efficiency and rate of encystation ................................................................................................... 83 2.7 Effect of the short chain fatty acid propionate on encystation .............................................................................................. 85 2.8 Effect of propionate on efficiency and rate of encystation ............................................................................................... 88 2.9 Short chain fatty acids speed entry into encystation .................................... 90

x
List of Figures (Continued) Figure Page 3.1 Glycogen content in the WT, LUC+, GYSkd, and PYG1+2kd strains under different growth conditions ........................ 118 3.2 GYS and PYG RNAi silencing ................................................................... 120 3.3 E. histolytica growth in the presence and absence of added glucose ........................................................................................ 123 3.4 Glycogen content in WT cells grown at low and high cell density .................................................................................. 127 3.5 E. histolytica encystation is impaired in the GYSkd and PYG1+2kd strains .................................................................. 130 3.6 Quantification of encystation in the GYSkd and PYG1+2kd strains .................................................................. 132 3.7 Expression of GYS, PYG1, and PYG2 in the WT strain grown in the presence or absence of glucose ............................ 134

1
CHAPTER ONE
LITERATURE REVIEW Entamoeba histolytica: The Pathogen
Infection and Symptoms
Entamoeba histolytica is a parasitic protozoan, a human parasite that is the
causative agent of amoebic dysentery. Approximately 500 million people worldwide are
infected with E. histolytica1 Nearly 100,000 die every year as a result of the most severe
consequence of E. histolytica infection, amoebic liver abscess1,2. Approximately 50
million of those infected contract amoebic dysentery3. The illness associated with this
parasite ranks second in terms of parasite-associated world mortality behind malaria4;
however, most people infected with E. histolytica remain asymptomatic5. Reports suggest
only 5-10% of patients display symptoms5, though some reports go as high as estimating
1 in 5 patients develop disease6. This is concerning, as asymptomatic adults may shed
cysts for more than a year, and asymptomatic infection can still precipitate symptomatic
disease even after a year5.
Although many people infected with E. histolytica are asymptomatic, those who
do develop symptoms typically fall ill within 2 to 4 weeks7. The mildest form of
amebiasis symptoms typically involve both stomach cramping and diarrhea7. However,
amoebic dysentery can develop and includes stomach pain, bloody diarrhea, and a fever7.
The symptoms caused by invasive amebiasis depend upon the type of infection, either
intestinal or extraintestinal8. Amoebic intestinal lesions can form, causing necrosis and
inflammation8. The most common extraintestinal complication of invasive amoebiasis is

2
amoebic liver abscess, wherein similar lesions to what form in the intestines instead form
on the liver8. The invasive form of liver infection appears to predominately impact adult
males9.
This pathogen is particularly common in under-resourced nations where water
treatment and waste disposal infrastructure is lacking10. The World Health Organization
estimates that 2.4 billion people worldwide are living without access to sanitation
facilities, and 1.1 billion people are living without access to improved water11. One study
of preschool aged children in Bangladesh reports that 80% became infected with E.
histolytica at least once during a four-year observation period, and 53% were reinfected.
This rate was attributed to the poor sanitary conditions in the area11. Recently, the
pathogen has been classified as reemerging in warmer climates, such as in East Asia and
Australia5.
Disease Transmission
E. histolytica is transmitted via the oral-fecal route12. Both symptomatic and
asymptomatic individuals act as transmitters of the infectious form of the parasite7. This
transmission occurs when E. histolytica is shed from the host as an infectious cyst (as
seen in Figure 1.1). Upon ingestion, the cysts emerges into its disease-causing
trophozoite form in the small intestine to colonize the large intestine7 (Figure 1.1). E.
histolytica trophozoite colonization presents differently in each individual12. In most
cases, the infection proceeds asymptomatically, with the greatest number of cysts being
shed by asymptomatic carriers13. In symptomatic cases, E. histolytica infection typically
presents as amoebic dysentery, ranging from mild to severe bloody diarrhea2. In

3
particularly severe cases, the trophozoites can invade the intestinal mucosa, traveling
through the bloodstream to the liver, lungs, or brain, causing amoebic abscesses and
killing the host7.
Throughout the course of infection, E. histolytica is transmitted to new hosts as
trophozoites encyst and are shed via bowel movements. To overcome the low efficiency
of transmission via the oral-fecal route, tens of millions of cysts are shed per infected
individual14. One report claims that although the infectious dose is just over 1,000
organisms, a single infected individual can shed up to 45 million cysts per day10. The cyst
form must exist outside of the human body to transfer from host to host, and does so in a
vegetative stage that survives environmental stress due to its chitinous cell wall15.
After ingestion, cysts undergo excystation in the small intestine to produce
disease-causing trophozoites, which are carried along to the large intestine. Due to a
reduced of intestinal flow and the proclivity the trophozoites have for mucin within the
mucus layer of the colon, some trophozoites will stall in the colon12. There, the parasite
may infect the host as described above. In order to both continue transmission and
maintain adequate numbers of parasites within the host to continue infection, a
subpopulation of E. histolytica trophozoites may encyst in the large intestine. The signals
that precipitate this cellular differentiation are unknown. The cysts are then shed in
bountiful numbers from the host. The infection cycle is shown below7.

4
Figure 1.1: The Life Cycle of E. histolytica: E. histolytica infection is transmitted via
the oral-fecal route. Upon ingestion of cysts, excystation occurs in the small intestine and
trophozoites colonize the colon, causing infection. Trophozoites encyst in the colon,
providing protection as they are shed from the host into the environment, continuing the
life cycle. Figure obtained from the CDC official website7.
E. histolytica Metabolism
ATP Generation in E. histolytica
E. histolytica has a limited metabolic program16. It lacks mitochondria, and
instead possesses a related organelle, the mitosome, which lacks the capacity for aerobic
metabolic processes such as oxidative phosphorylation17 or the Krebs cycle16,18.

5
Additionally, E. histolytica lacks purine and pyrimidine biosynthesis pathways, as well as
most amino acid biosynthesis capabilities19.
As such, ATP production in E. histolytica is limited to substrate level
phosphorylation and fermentation as a result of their highly specialized glycolytic
pathway17. Glycolysis is the main pathway through which E. histolytica produces ATP20.
However, its glycolytic pathway is significantly different from the canonical pathway
present in humans18. E. histolytica undergoes pyrophosphate-dependent glycolysis18 via
the pyrophosphate-dependent enzymes phosphofructokinase and pyruvate phosphate
dikinase (PPi-PFK and PPDK, respectively). Although E. histolytica also contains ATP-
dependent PFK, the cellular activity is only ~10% of the activity observed for PPi-PFK20.
PPDK replaces the pyruvate kinase (PK) typical in mammalian glycolysis21.
Additionally, these enzymes are differentially regulated18. In contrast to glycolysis in
other eukaryotic cells21, rather than allosteric inhibition of hexokinase (HK) and PFK1 by
glucose-6-phosphate and ATP + H+, they are competitively inhibited by AMP and
ADP18. Additionally, PPi-PFK and other glycolytic enzymes can catalyze reversible
reactions under physiologic conditions, with hexokinase catalyzing the only irreversible
reaction18,21.
As E. histolytica generates few ATP as a result of relying so singularly on
glycolysis, inorganic pyrophosphate is utilized as a donor18. E. histolytica’s
pyrophosphate-dependent glycolytic pathway produces 5 ATP per glucose22. In addition
to replacement of ATP-dependent PFK, which results in an increase of 1 ATP, PPDK
produces 2 ATP equivalents22, as shown in Figure 1.2, resulting in production of 5 ATP

6
per glucose versus the typical 2 ATP produced in the standard glycolytic pathway. Figure
1.2 below visually outlines the breakdown of glucose to pyruvate in E. histolytica, and
illustrates how it is specialized to produce additional ATP22.
Figure 1.2: The Glycolytic Pathway and ATP Production in E. histolytica. (A)
Glucose is broken down via a specialized pyrophosphate-dependent glycolytic pathway
in E. histolytica. PPi-PFK and PPDK both replace their ATP-dependent counterparts
from mammalian glycolysis. (B) PPDK uses PPi to fuel the production of ATP, resulting
in two equivalents per glucose molecule. (C) The use of PPi during glycolysis allows E.
histolytica to produce 5 ATP molecules. Figure used with permission of Oxford
University Press - Books (US & UK), from PLANT PHYSIOLOGY AND
DEVELOPMENT, Taiz & Zeigler, 6th Edition, 2014; permission conveyed through
Copyright Clearance Center, Inc.
Entamoeba histolytica exists primarily in a microaerophilic environment and can
only tolerate limited amounts of oxygen, though the presence of glucose has been shown
to increase its oxygen uptake16. Glucose is broken down via fermentative glycolysis,

7
which generates ethanol and acetate as its byproducts18. During the breakdown of glucose
to acetyl-CoA, NADH is generated, and in order to produce NAD+, NADH may reduce
acetyl-CoA to form ethanol16. Under aerobic conditions, fully 90% of the acetyl-CoA is
used in this manner to generate ethanol by aldehyde-alcohol dehydrogenase (ADHE), and
the leftover acetyl-CoA is converted to acetate by acetyl-CoA synthetase, producing an
additional ATP21.
Although glycolysis has been studied extensively E. histolytica, the parasite
establishes infection within the human colon where glucose is limited as nearly 100% of
the glucose in the digestive system of the human host is absorbed before it reaches the
colon16. Although there may not be sufficient glucose present for sustained E. histolytica
growth, the parasite is known to consume bacteria by phagocytosis23, and the human
colon has a thriving microbial community. Trophozoites are reported to use phagocytosis
of bacteria and other surrounding cells as a main source of energy, digesting and
reutilizing that which it cannot make24. In fact, phagocytosis has been shown to be vital
to both growth and virulence of E. histolytica, as blocking phagocytosis inhibits both of
these processes23. E. histolytica has been shown to preferentially phagocytose beneficial
species of bacteria within the host, and the reduction of these symbiotes within the host
may result in more favorable conditions for invasion of the colon wall23.
Finally, ATP is also generated through catabolism of amino acids17. While most
parasitic protozoa do not heavily rely on amino acid metabolism, the process is highly
utilized in E. histolytica17. Although E. histolytica lacks the arginine dihydrolase
pathway, enzymes for degradation of aspartate, asparagine, tryptophan threonine, and

8
methionine have been identified19. For example, asparagine is converted to aspartate,
which is then converted to pyruvate by a series of enzymes19. Additionally, tryptophanase
breaks down tryptophan to pyruvate19. Pyruvate is then utilized as described above19.
Both E. histolytica and the reptilian species Entamoeba invadens have been shown to
preferentially consume asparagine, arginine, leucine, serine, and threonine when glucose
levels are low17. Amino acids are thought to be particularly useful to the cell when
glucose has been redirected towards chitin synthesis during encystation17.
The Role of Glycogen in E. histolytica
A vital component of cellular response to nutrient starvation is the utilization of
stored nutrients. Glycogen is a storage polysaccharide that is comprised of D-glucose
residues connected by α-1,4 and α-1,6 linkages, which constitute the linear and branched
linkage points25. When ample glucose is available to the cell, it can be stored for later use
in the form of glycogen. The highly branched glycogen is ideal for energy storage and
forms dense granules in the cell25. Particularly dense clusters of glycogen particles have
been reported in E. histolytica26. Glycogen is reported to be the primary source of
intracellular glucose for E. histolytica27 and accounts for up to 3M of stored glucose28,
except when transitioning into the cystic phase. Trophozoites have been demonstrated to
take up radiolabeled glucose and incorporate it into cytoplasmic glycogen27.
Glycogen synthesis is performed by UDP-glucose pyrophosphorylase and glycogen
synthase28. Glycogen synthase activity has been detected at a low but detectable rate in
axenically grown of E. histolytica trophozoites29. Glucose-6-phosphate (G6P) is the
precursor for glycogen synthesis, and the synthesis of glycogen requires G6P and ATP and

9
produces ADP and PPi, which may provide necessary for PPi-dependent glycolytic
enzymes, although it is also likely PPi hydrolysis is required to drive the synthesis30. This
PPi production would link the process of glycolysis to the anabolic glycogen synthesis
pathway30.
Glycogen granules can be broken down and utilized during times of nutrient
stress31. Pineda et al. demonstrated that intracellular glycogen was able to maintain cells
for ninety minutes in the absence of glucose21. Baumel-Alterzon et al. noted that under
conditions of glucose starvation, transcription increased for three genes encoding amylase,
which is used in glycogen degradation, and for two genes encoding amino-acid degradation
enzymes, suggesting the use of glycogen as an energy store while the cells switch from
glucose to amino acids as a primary energy source32. Both α- and β-amylase catalyze the
breakdown of glycogen, amylose, and amylopectin in E. histolytica33. E. histolytica has
eight putative genes encoding β-amylase, which functions similarly to glycogen
phosphorylase by releasing maltose from the polysaccharide chain by hydrolysis of α-1,4-
glucan linkages6. As a result, β-amylase was proposed to play a role in breaking down free
oligosaccharides to provide a carbon source for the cells in the large intestine6.
Glycogen debranching enzyme (GDE) and glycogen phosphorylase (PYG) have
been reported to operate in concert with one another34,35. Glycogen phosphorylase utilizes
inorganic phosphate to induce the rate limiting step of glycogen degradation, the cleavage
of α-1,4 bonds to release glucose-1-phosphate from the ends of the glycogen branches,
which is then converted to glucose-6-phosphate and processed via glycolysis6,25,36. PYG is
regulated allosterically by phosphorylation36. However, glycogen phosphorylase is

10
sterically blocked at the branch point four residues away and requires GDE to proceed36.
This enzyme cleaves α-1,6 linkages, and transfers one branch to the adjacent chain, leaving
a single glucose at the branch point, which is later hydrolyzed into a single free glucose by
α-1,6-glucosidase as shown in Figure 1.325,36. Figure 1.3 below shows how both sets of
enzymes work together in parallel to provide glucose for the glycolytic production of ATP
for the parasite6.
Figure 1.3: Carbohydrates Serve as Energy Reserves in E. histolytica. These enzymes
both play a vital role in carbohydrate metabolism in E. histolytica. Stored carbohydrates
in the form of glycogen and starch are important to E. histolytica survival during periods
of nutrient stress. These enzymes work in parallel to provide glucose for glycolysis in
place of external glucose. Figure used and modified with permission from PLoS
Pathogens under Creative Commons Attribution License from Thibeaux et al. 20136.
Beyond the vital role glycogen serves as an energy storage molecule within
trophozoites, glycogen is also responsible for a major role in the phase transition of
trophozoite to cyst. Bakker-Grunwald et al. reported that E. histolytica trophozoites
contained a relatively high concentration of cellular glycogen, but that cysts were found to
11
contain substantially less37. Samanta & Ghosh observed during the encystation process that
cellular glycogen levels begin to decrease38.
This same study reported that during encystation in E. invadens, expression of two
glycogen phosphorylase genes was upregulated (EHI_096830 and EHI_138380), while
genes encoding glycolytic enzymes38 and enzymes for glycogen/starch biosynthesis were
downregulated39. The levels of key glycolytic enzymes and their transcript levels drop, as
do glycolytic intermediates such as glucose-6-phosphate and fructose-6-phosphate39, as
cells prepare to enter dormancy40. Cellular energy instead becomes directed towards chitin
cell wall production in E. invadens39.
While the cyst wall of E. histolytica is comprised of multiple carbohydrates,
including Jessie and Jacob lectins, its primary component is chitin38. Chitin is reported as
comprising 25% of the dry weight of the amoeba cyst wall3, however it is not detectable
in the trophozoite form38. Glycogen is thought to serve as the predominant source of
glucose necessary for chitin synthesis, under the strict glucose limitations that induce
encystation38. These changes in cellular metabolism correspond with measurable changes
in gene expression levels. While starch synthase is expressed highly during the
trophozoite stage, and was found to decrease during encystation; PYG expression, while
expressed in trophozoites, increased expression in accordance with the progression of
encystation38.

12
The Genome and Genetic Tools
The Genome of Entamoeba Species
The genome of E. histolytica was sequenced in 2005 and consists of 20,800,650
base pairs of DNA41. However, its assembly has proven challenging, due in large part to
the repetitive nature of the genome, and its high AT content (approximately 75%)41,42.
There are 8,333 annotated genes, encompassing roughly half of the genome 41. Repeat
sequences account for 11.2% of the genome, and the level of nucleotide variation in the
lab strain of the parasite has been described as “modest”43.
E. invadens, the model organism for Entamoeba stage conversion, is considered
distantly related41. Its genome is roughly twice the size of E. histolytica’s, containing
40,888,805 base pairs of DNA and 11,549 genes41. The percentage of coding sequence is
lower than in E. histolytica, at about 38%, and the genome is also only 70% AT-rich41.
Gene Silencing in E. histolytica
Most molecular biology techniques that function in other organisms have not been
amenable to adaptation to Entamoeba studies44. Entamoeba is thought not to be easy to
genetically manipulate due to its unique genome organization. For example, while gene
knockout is one of the most useful genetic tools to study protein function in most
organisms, the option is not available for E. histolytica. The issue is that gene knockout
by homologous recombination is not achievable due to the polyploid nature of
Entamoeba parasites, even though the necessary components for homologous
recombination are present44. Several methods are available for gene silencing in E.
histolytica, via one of two main pathways: posttranscriptional gene silencing, where

13
mRNA is degraded or inactivated; or transcriptional gene silencing, where transcription
never occurs due to DNA methylation, chromatin remodeling, or RNA-interference
(RNAi)44.
The utilization of RNAi for gene knockdown was first described in 1998 in C.
elegans45. Although the introduction of RNA into cells to interfere with gene function
had been done, it was single stranded and antisense to the mRNA target as opposed to
double stranded45. However, double stranded mixtures of RNA were found to be more
potent, requiring only a few molecules to achieve the desired effect45.
The general premise for RNAi is that dsRNA generated to a specific gene is
introduced into the cell, where the dsRNA is broken up into small-interfering RNAs
(siRNAs) by an RNaseIII endonuclease, Dicer46. Most Dicer enzymes have a PAZ
domain that is responsible for binding the 3’ end of the RNA. Additionally, they usually
contain two RNaseIII components that function as a dimer, creating a catalytic pocket
where dsRNA is cleaved47. However, the structure of Dicer varies depending upon the
organism. When Dicer cleaves the dsRNA, it produces two siRNAs of about ~21
nucleotides, each with a 5’ phosphate and 3’ hydroxyl group48. One of these strands
directs silencing and is called the guide strand, and the other strand is the passenger.
Which strand is the guide and which is the passenger is determined by the stability of the
5’ ends of the two strands48.
The siRNAs are identified by the RNA-induced silencing complex (RISC), which
is an Argonaute-small RNA complex and may have other proteins attached47. The
Argonaute (AGO) portion of the RISC is responsible for cleavage47. AGO proteins

14
contain their own PAZ domain, again responsible for binding the incoming RNA, and a
Piwi domain that cleaves the target mRNA. The guide RNA strand is loaded at the 3’ end
into the RISC, the passenger RNA strand is degraded. The siRNA then directs the
complex to the target mRNA. The mRNA is cleaved after the guide siRNA binds to it,
which results in post transcriptional gene silencing47. Often, RNA-dependent RNA
polymerase is recruited to the site of the formation of siRNAs and generates additional
copies to increase the silencing signal capacity47,48. The standard RNAi pathway is shown
below in Figure 1.449.
Figure 1.4: Canonical RNA interference pathway in eukaryotic cells. In a standard
RNAi pathway, the dsRNA to the target gene is processed by Dicer into siRNA, which is
then loaded into the RISC, where the passenger strand is degraded and the leading strand
guides the complex to the target mRNA. The target mRNA is then degraded. Reprinted
by permission from Springer Nature Customer Service Centre GmbH: Springer Nature,
15
BMC Systems Biology, Modeling RNA interference in Mammalian Cells, Guilia Cuccato
et al. 201149.
Entamoeba histolytica has a fully functioning RNAi pathway but it does not
appear to use the same mechanism as other systems. While E. histolytica lacks the gene
encoding Dicer, it does have a gene encoding a protein that contains an RNaseIII
domain47. There are three AGO genes, all of which contain PAZ and Piwi domains, but
only one of which is significantly expressed in trophozoites47. The genome also encodes
for one RNA-dependent RNA polymerase47. Furthermore, it has been demonstrated that
small 27 nucleotide RNAs interact with the expressed form of AGO, a necessary
precursor step, and that these small RNAs that map to specific genes are indeed
associated with silencing of that gene47.
There are a variety of RNAi techniques available in E. histolytica, including short
hairpin RNA-based silencing, dsRNA-based RNAi, and siRNA soaking11,47. Short hairpin
RNA (shRNA) is designed to mimic miRNAs, which have a hairpin type structure, and is
a commonly applied knockdown model47. The shRNA construct contains a RNA
polymerase II promoter for high level expression and the expressed shRNAs are then
shuttled from the nucleus to the cytoplasm, where they are processed into siRNAs and
proceed through the standard silencing process47. However, this mechanism does not
always work in E. histolytica, and even when it does not all shRNAs result in equally
effective mRNA depletion. Furthermore, the level of mRNA degredation does not always
correspond to the level of protein knockdown11,47.
16
Another method used in Entamoeba as well as a variety of other organisms is a
dsRNA based RNAi approach, wherein long dsRNAs are a particularly powerful trigger
of gene silencing11. The dsRNA constructs required to achieve this type of knockdown
are substantial in length, with the first reported success in Entamoeba requiring a 350
base pair segment and successive knockdowns using up to 687 base pairs47. However, it
was reported that the extent of the knockdown in each of these cases was variable,
ranging from roughly 40-80%11. Furthermore, loss of knockdown may occur, with
reversion to wild type levels of expression occurring in one instance at the 6-month mark
even though the plasmid and intact dsRNA portion remained and drug resistance was
maintained11,47.
A third method is siRNA soaking, which can take two forms. Either E. histolytica
may be fed bacteria expressing the desired dsRNA or simply soaked with dsRNA11. An
Escherichia coli (E. coli) strain that does not produce RNaseIII is used to allow the
dsRNA to accumulate within the bacteria and trigger RNAi in Entamoeba upon
ingestion47. One example of the bacterial dsRNA approach resulted in a roughly 60%
knockdown of the target gene47.
One particularly useful method is trigger induced RNAi, caused by antisense
small RNAs. Developed by the Singh lab in 201346, this method provides for the
silencing of multiple genes in a more reliable fashion. In this method, a gene-coding
region to which many endogenous antisense small RNAs (AS sRNAs) map acts as a
“trigger” to silence the gene next to it, independently of the position of the trigger
sequence46. Silencing occurs because this results in the generation of AS sRNAs that

17
have specificity to the fused gene46. This mechanism was discovered because genes that
have a large number of AS sRNAs associated with them have low production of mRNAs,
which would suggest a link between the two, and an existing pathway within the cell for
post transcriptional modification of gene expression46. The expression of sRNAs is stable
in most cases, even after removal of selection to force reproduction of the plasmid46.
Gene Overexpression in E. histolytica
Although the integration of exogenous genes into the E. histolytica genome has
proven thus far to be unsuccessful, episomal expression of exogenous genes has proven
to be a very useful tool for understanding the roles of certain genes44. In initial
experiments, plasmids containing reporter genes under viral promoters to ensure
expression were introduced via electroporation44. However, transient expression was low
due to the low efficiency of transfection via electroporation. New plasmids with an
antibiotic resistance marker, commonly G418, were used to increase expression by using
selective pressure to increase plasmid copy number44,50. The constant selective pressure
will drive constitutive expression51. However, that selection-driven expression is notably
slow50.
An inducible overexpression system was developed for E. histolytica using the
tetracycline (Tet) repressor/operator to provide rapid and precise control of gene
expression50. This is a system was adopted from E. coli, wherein a Tet repressor is bound
to an operator, repressing the expression of the genes that have promoters with that
operator50. The repressor is removed when tetracycline is added to allow expression of

18
the gene to occur50. The Tet repressor binds to tetracycline with high affinity and the
conformational change that results causes the repressor to release52.
Successful overexpression of a specific gene, such as the antioxidant enzymes iron
containing superoxide dismutase Fe-SOD and peroxiredoxin, resulted in decreased
parasite susceptibility to metronidazole53. King et al developed and screened a genome-
wide overexpression library to identify genes involved in phagocytosis54. Over-
expression screens have also served to identify genes relevant to the cell cycle and vesicle
trafficking54.
Stage Conversion in Parasites
Encystation in Other Parasitic Protozoa
Developmental switching between stages is a common tool for disease
transmission in some pathogens55. Many pathogenic protozoa such as E. histolytica,
Giardia lamblia, Balamuthia mandrillaris, and Acanthamoeba castellanii exist in two
distinct stages: the motile trophozoite form and the protective cyst. Giardia encysts in the
jejunum, where bile salts, a pH of 7.8, and a high cell density were identified as strong
stimuli for the induction of encystation12. Chlamydomonas forms walled spores when
starved for nitrogen4. Toxoplasma gondii, which infects cats, additionally forms a thick-
walled oocyst that is shed from the intestine to the environment4.
This mechanism of cellular protection and proliferation is common to many
eukaryotes. In amebic pathogenesis, encystation is responsible not only for disease
transmission, but for differentiation and phase transition39. Encystation of parasitic
protozoa is extremely important for their survival within a human host, as encysted

19
pathogens are resistant to antibiotics and high levels of UV; cysts also resist immune
attack because they do not provoke an immune response, or a limited immune response4.
E. histolytica Life Cycle
E. histolytica exists in a biphasic life cycle; the infectious cyst form, and the
disease-causing trophozoite (as seen in Figure 1.1). Two differentiation processes
separate these two phases: “encystation” and “excystation”56. The motile trophozoite is
the replicative form responsible for disease during infection of a host, whereas the cyst is
the form responsible for transmission39. This cyst is transmitted from one host to another,
and upon ingestion by the host, most commonly via contaminated food or water38, the
cysts traverse the host’s digestive system2 (Figure 1.1). The cysts possess a chitinous cell
wall that allows them to survive the acidic environment of the stomach. They undergo
excystation in the glucose rich environment of the small intestine7. Only in the glucose-
rich small intestine is the cell wall no longer necessary, although the precise stimuli that
trigger excystation are unknown. The parasite is then carried throughout the intestinal
tract, until its affinity for mucin molecules halts their progression at the large intestine12.
Elucidating the molecular processes that control encystation or excystation is
thought to be essential for the development of new therapies and diagnostic tools57.
Treatments targeting encystation or excystation of E. histolytica would be beneficial in
halting transmission of disease, given the inherent hardiness of cysts themselves. Though,
because these processes cannot be readily studied, development of drugs has been limited
by want of a model.

20
Drugs and Treatment
Treatment of the disease has thus far focused solely on the trophozoite stage.
Although, some reports have found E. histolytica infection to be largely self-limiting,
with one study citing a need for drug therapy in only 19% of cases11. Nitroimidazole
drugs such as metronidazole, tinidazole, and ornidazole are the drugs of choice for
treatment of amoebiasis3. Metronidazole is the most popular drug used to target the
symptomatic infection stage caused by trophozoites, and has been used in clinical settings
for more than 40 years40 53. While clinical resistance of E. histolytica to metronidazole
has not yet been reported17, several metronidazole resistant strains of a variety of
protozoa have been reported58. Additionally, trophozoite adaptation to low levels of
metronidazole has been demonstrated in a laboratory setting17. Interestingly, the
mechanism of induced E. histolytica resistance does not mirror that of other parasitic
protozoa, such as Giardia53. To date, no drugs targeting the cyst form are currently
available59. Additionally, nitroimidazole drugs are often reported to cause serious side
effects3.
Metronidazole enters the cell through diffusion. The mechanism of action of
metronidazole causes DNA damage within the trophozoite. A nitro group is reduced to
cytotoxic radicals by reduced ferredoxin53,60. Ferredoxin and flavodoxin act as electron
acceptors of pyruvate:ferredoxin oxidoreductase53, an enzyme that is common to
anaerobic parasites that lack mitochondria60. The reason this drug is able to selectively
target anaerobes is due to the parasites’ unique redox potential in their electron transport,
which is negative enough to reduce the nitro group of metronidazole, whereas under

21
aerobic conditions, the nitro radicals are oxidized by oxygen, mitigating the cytotoxic
effect53.
The current focus on the motile trophozoite is not enough to block transmission in
a way that a focus on drugs for the differentiation process would. In fact, patients treated
for amoebic liver abscess with metronidazole may become asymptomatic cyst shedders5,
and the drug has limited efficacy to treat these cases17. This highlights the importance of
new areas of treatment. Specifically, as the resistant nature of the cyst is due to the chitin
wall, identifying and blocking crucial steps in chitin deposition is an attractive target for
novel therapeutics3.
The chitin cell wall also serves as a point of interest for vaccine development.
Interestingly, inoculation of mice with recombinant Giardia Cyst Wall Protein 2 was
shown to stimulate the immune system comparably to genuine infection, and when the
mice were given live cysts, they managed to shed far fewer61.
Encystation
E. invadens as a model for encystation
Despite the global burden of this disease, laboratory study of infection has been
seriously impeded by the lack of an E. histolytica model for encystation62. E. histolytica
can be readily cultured in a laboratory setting in the trophozoite stage, and genetic tools
exist to manipulate the parasite and study the disease-causing state11. Perhaps due to the
nature of their continuous cultivation, the infectiousness of amoeba has been reduced and
differentiation to cysts can no longer be induced in axenic culture with laboratory
strains62. The lack of an animal model that can support the complete E. histolytica life

22
cycle has additionally hampered study of both encystation and excystation3. The cyst
stage of E. histolytica and the differentiation process continues to elude proper study due
to this crucial limitation.
As a result of these challenges, scientists have turned to E. invadens, a distant
relative to E. histolytica, as a substitute model for study of the human pathogen to study
cellular differentiation63. This pathogen causes similar disease in a reptilian host.
Encystation is reliably achieved with this reptilian pathogen via glucose deprivation
and/or hypo-osmotic shock13,64. It has also been shown that the addition of 5% serum or
mucin to the induction media can promote trophozoite aggregation in a dose-dependent
manner to achieve higher levels of encystation14.
E. invadens has provided scientists with a tool to begin to study the differentiation
pathway of E. histolytica,3,63 but this system has limitations57. Although E. invadens can
represent both stages of the biphasic amoebic life cycle, encysting and excysting in
similar locations, and inducing similar host pathology, the similarities to E. histolytica
end here2. Genetic differences between E. histolytica and E. invadens57 as well as the
different environments they inhabit render the E. invadens model incompatible for
complete study of E. histolytica human pathogenesis. Genome sequencing has established
that E. invadens has a 74% identity in genic regions and 50% in intergenic regions with
E. histolytica58, though a comparison of gene expression during encystation showed they
share similar developmentally regulated genes65. This genetic disparity limits the
comparability of E. invadens to E. histolytica, and scientists have only studied E.
invadens so extensively for want of an E. histolytica differentiation model. Phylogenetic

23
analysis of Entamoeba species (Figure 1.5) demonstrates the genetic divergence of E.
histolytica and E. invadens66. Weedall et al. likewise found large evolutionary distances
between Entamoeba species41.
Figure 1.5: Phylogenetic Analysis of Entamoeba species. E. invadens has been used as
a model organism to study encystation in E. histolytica, however, the model is
insufficient because E. histolytica and E. invadens are only distantly related. As seen
here, E. histolytica and E. invadens are quite evolutionarily divergent from one another.
Figure from Silberman et al., Phylogeny of the genera Entamoeba and Endolimax as
deduced from small-subunit ribosomal RNA sequences, Molecular Biology and
Evolution, 1999, Volume 16, Issue 12, Pages 1740-1751, by permission of Oxford
University Press.
Nevertheless, E. invadens has been used as a substitute for studying phase
transition in E. histolytica due to its ability to encyst and excyst in axenic culture. It has
been reported for nearly 40 years that E. invadens can be induced to encyst by altering

24
the osmolarity of the media as well as the removal of a carbon substrate, although that
was reported to not be the only trigger67. Encystation was even observed in the presence
of high glucose67. Cell density fluctuations were observed in response to their placement
in induction media, with an initial decrease, sharp increase, then gradual decline as
encystation progressed67.
Attempts at Encystation in E. histolytica
Previous attempts have been made to induce E. histolytica encystation in
laboratory culture. In each case, cysts lacked one or more of the four hallmarks of
encystation: spherical shape, detergent-resistance, chitin cell wall, and four nuclei59.
Aguilar-Diaz et al. induced formation of cyst-like structures after treatment with
hydrogen peroxide and metals, but they were not consistently tetranucleate and the
maximum conversion rate from trophozoite to cyst was approximately 30%59. Chatterjee
et al. were able to create “wall-less” cyst structures in E. invadens by treatment with
galactose in the media68 A third attempt by Barron-Gonzalez et al. resulted in 92%
efficiency of induction of cyst-like cells through the use of E. coli and E. faecalis
conditioned media and an alkaline pH69; however, they claim only “multiple” nuclei as
opposed to tetranucleation, and excystation was not achieved. In each case, the methods
used to trigger encystation lacked consistency and biological relevance, and failed to
fulfill each of the four encystation hallmarks.

25
Four Hallmarks of Encystation
Chitin Cell Wall
E. histolytica faces substantial environmental challenges from which to protect
itself. As E. histolytica prepares to leave the one host in order to propagate infection to a
second, it must be resistant to major stressors such as increased oxygen exposure, nutrient
deprivation, and mechanical stressors70. The chitin cell wall serves as a protective shield
against these challenges.
The major components of the E. histolytica cyst wall are chitin, chitosan38, and
chitin-binding lectins, including Jacob, Jessie, and chitinase71. Each component is vital,
and a “Wattle and Daub” model of the Entamoeba cyst wall was proposed to describe its
formation68. Under this model, chitin is formed within secretory vesicles then deposited
on the surface of the cell and Jacob lectins are secreted, binding to the Gal/GalNac lectin
components of the cell membrane2. Jacob serves to crosslink the chitin, as it contains
arrays of Cys-rich chitin binding domains. This forms the skeleton of the wall, which is
filled in with Jessie lectins to create an effectively impenetrable coat around the
parasite68,71,72. Early in encystation, this wall resembles “an irregular net” of fibrous
material surrounding immature cysts73. The Jessie lectins are thought to form a “daub”, or
filling, for the cell wall, given that the addition of these lectins corresponded to a
decrease in permeability of the cysts to stains68. Without this protection, parasite
transmission and survival would not be possible. This exterior remodeling is also
responsible for producing the small, round shape.
It has been reported that chitin is the primary component of this cell wall. The E.

26
histolytica cyst wall is comprised of a single layer, and primarily one polymer2. Chitin is
composed of β 1, 4-linked N-acetylglucosamine (GlcNAc), a glucose derivative38, and
accounts for 25% of the dry weight of the amoeba cyst wall3. Chitin production as a
result of encystation confers both detergent resistance and the characteristic round shape.
Chitin is reported to only be synthesized during encystation and is not present in
the trophozoite, but the full chitin synthesis pathway (Figure 1.6) is not well
characterized38. Expression patterns of the genes required for synthesis of the chitin show
they are transcribed at either low levels or not at all in trophozoites38. Two putative chitin
synthases have been characterized from E. histolytica, and while they are not expressed
in trophozoites, substantial mRNAs were detectable after cyst induction by glucose
deprivation in the E. invadens model63. Both chitin synthase and chitinase mRNA have
been found to be expressed by encysting amoebae71. The level of other, earlier chitin
synthesis pathway genes has also been shown to increase as cells progress towards cysts,
with one report that these genes reached peak expression in E. invadens approximately 9-
12 hours after induction38 and a second report that this spike occurs slightly earlier at 8
hours 40.
The expression of glucose-6-P isomerase, the enzyme responsible for conversion
of glucose-6-P to fructose 6-P, showed decreased expression post induction of encystation,
at approximately the 24 hour mark38. This conversion is a precursor to both glycolysis and
chitin biosynthesis, which may explain the necessity for the enzyme up to 24 hours.
However, there is some debate as to the first step of the chitin synthesis pathway. Jeelani
et al. proposed the first and rate limiting step of chitin synthesis relies on the enzyme

27
glucosamine-fructose-6-phosphate aminotransferase, which is upregulated during
encystation, while glucosamine-6-P-isomerase (Gln6Pi) remains steady in its expression
16,39. However, Samanta and Ghosh cite Gln6Pi as the first committed enzyme of chitin
synthesis, which converts fructose-6-phosphate to glucosamine-6-phosphate38. This
enzyme has been reported to be the rate limiting step during synthesis of the Giardia cell
wall, and ~15-fold increase in expression was observed during encystation, peaking at
around 9 hours38,59,74. Additionally, Gln6Pi was shown to be vital for encystation. RNAi
knockdown of glucosamine-6-P isomerase expression reduced chitin production by ~60%,
and resulting in incomplete cyst wall formation38.
The next step in chitin synthesis is the conversion of glucosamine-6-P to N-
acetylglucosamine phosphate by glucosamine-6-phosphate N-acetyltransferase (GNA),
and GNA shows maximum expression approximately 6-12 hours after the induction of
encystation; the same goes for phosphoglucosamine mutase (PNGM), the enzyme
responsible for the next step of chitin synthesis (wherein a phosphate group is relocated
from C-6 to C-1)38. Finally, chitin synthase, which polymerizes UDP-N-acetylglucosamine
to form chitin, showed maximal expression between 9 and 12 hours post induction38. E.
invadens is reported to have two chitin synthases and both followed this expression
pattern38. For reference, below is the chitin synthesis pathway proposed by Samanta and
Ghosh.

28
Figure 1.6: Chitin Biosynthetic Pathway in E. histolytica. The chitin biosynthetic
pathway in E. histolytica derives glucose from carbohydrate reserves in the form of starch
or glycogen. The first two steps, resulting in the production of fructose-6-phosphate, are
common to both chitin synthesis and glycolysis. Fructose-6-phosphate is then converted
to glucosamine-6-phosphate, which is then converted to N-acetylglucosamine-6-
phosphate. This is then isomerized to N-acetylglucosamine-1-phosphate, which is
transformed to UDP-N-acetylglucosamine. Finally, chitin synthase forms the finished
product, chitin. Reprinted from Molecular and Biochemical Parasitology, Volume 186,
Samanta & Ghosh, The Chitin Biosynthesis Pathway in Entamoeba and the Role of
Glucosamine-6-P Isomerase by RNA interference, Pages 60-68, 2012, with permission
from Elsevier38.

29
Chitinases, which are chitin modifying enzymes, are an additional stage-specific
enzyme expressed only during the encystation induction period58. Chitinase is reported to
degrade and remodel chitin fibrils68,71. E. invadens has four chitinases and the expression
of all four was shown to increase during the early phase of encystation, although EiChit 1
and EiChit 4 increased more than EiChit 2 and EiChit 371. This is thought to be because
only EiChits 1 and 4 encode a Cys-rich region for a chitin binding domain, which would
render them vital for construction of the final wall, as they bind the chitin into its
protective structure71. Chitinase expression has been shown to reach its peak for 48 hours
post induction, and cyst formation was inhibited when chitinase function was inhibited by
allosamidin71.
The Jacob glycoprotein and Jessie lectin are also crucial for formation of the cell
wall. Similar to the chitinases, EiJacob1 is reported to contain several chitin binding
domains (from 3-7) consisting of six Cys-residues, whereas Jessie is reported to contain
one domain consisting of eight Cys-residues, supporting their role as cyst wall
modifiers68,72. Similarly, Jacob and Jessie expression profiles, along with chitinase, were
reported to increase during encystation in E. invadens72. E. histolytica is reported to
contain several genes for these glycoproteins as well72. After 22 hours of induction in
encystation media, expression of Jacob, Jessie, and chitinase were all higher than at 0
hours. Additionally, Jacob lectins, Jessie, and chitinase were found to comprise ~30% ,
~50%, and ~20% of the cyst wall protein, respectively68. Fluorescence microscopy has
confirmed these results, showing that by 24-36 hours, chitin and Jacob lectin accumulate
in the cyst wall causing the cell to take on a more oval shape. Jessie lectins appeared at
30
between 48 and 60 hours in small punctate regions along the wall, and the cyst walls in E.
invadens were largely thought to be completely formed by 72 hours68. Interestingly,
“wall-less” cysts have been found to form in the presence of excess of Gal, which inhibits
binding of Jacob lectins to the incipient cyst wall68.
Tetranucleation
This hallmark is the only defining characteristic of encystation that is not
conferred by the production of chitin. Comparison of the cell cycles of E. invadens and E.
histolytica suggest that the organisms share similar regulatory processes for division and
differentiation75. E. invadens and E. histolytica trophozoites typically contain one nucleus
(although heterogeneity is common75), but develop four nuclei per cyst66.
In terms of this heterogeneity, Ganguly and Lohia report significant variation in
DNA content in E. invadens, ranging from 1n to greater than 8n and corresponding with
the growth phase of the cells75. Early after subculturing, cells were found to be
predominately either 1n or 2n-4n until roughly 48 hours. After 4 days most had a genome
content greater than 4n, then predominately 1n after 6 days of growth75. This would
suggest that when nutrients and space are readily available, cells quickly replicate their
genome, dividing after reaching a genome content between 4n and 8n and then returning
to predominately 1n or 2n levels75. Byers et al. performed similar cytometric analysis and
report cellular DNA content reaching 16n in E. invadens76. Cell division does not appear
to be dependent upon completion of reaching a 2n genome threshold in Entamoeba and
the synthesis of DNA appears to be untethered to checkpoint stoppages, resulting in
31
Entamoeba cells with varying number of nuclei75. Additionally, it is believed
karyokinesis may frequently occur independently of cytokinesis within cell cultures75.
E. histolytica has similarly been reported to have variable ploidy, with DNA
content of individual nuclei sometimes varying by six-fold77. Das et al. reported that
polyploidy may occur independently of nuclear division resulting in one to ten times or
more genome content78, reiterating the lack of checkpoint controls previously identified
in E. invadens. Additionally, even in multinucleated cells, several genome copies may
appear in each nuclei78. This led Das et al. to assert that unknown regulatory mechanisms
control cell division in E. histolytica78.
As E. histolytica differentiates within the colon, their nuclei begin dividing79. It
follows, then, that during the differentiation process, the Entamoeba trophozoites first
increase the amount of DNA they contain76. This is reported to occur in two phases
during both early encystation and cyst maturation75. Encystation is reported to involve
two nuclear divisions to produce the characteristic four nuclei59. During early phases of
E. invadens encystation (8-24hr), expression levels of nuclear proteins tied to nuclear
assembly are high, likely due to the need to tightly package and silence DNA as the cells
prepare for dormancy40. Additionally, Krishnan et al. reported that the chromatid body is
the first feature identified in encysting E. invadens cells, appearing in the cytoplasm by 6
hours post induction and coalescing shortly thereafter3.
After 24 hours of differentiation in nutrient deplete induction media, E. invadens
cells begin shifting their DNA profile, with the population moving from 1n or 2n content
to 4n. This transition is complete by roughly 48 hours, suggesting the complete

32
production of four individual nuclei75. In populations of older, more mature cysts (nine
days), the genome content ranged from 4n-8n, suggesting a second increase in DNA
content after cyst formation was completed (past 96 hours), which would indicate extra
DNA synthesis occurs during cyst maturation75.
How this nuclear division occurs reportedly depends on what stage of mitosis the
Entamoeba trophozoites are in when encystation is induced. Ganguly and Lohia reported
that E. histolytica G1, S, and G2 phases are difficult to identify distinctly75, but other
groups have broken down the cell cycle with more precision. Niculescu reported that
cells residing in G1/G0 respond to cyst induction stimuli and form cysts at a 1:1 ratio, or
one trophozoite produces one cyst80. Cells at this phase respond to stress by switching
from the mitotic cycle into the developmental endopolyploid cycle80, resulting in a
tetraploid cyst. Cells later in progression respond to stress stimuli to produce cysts at a
1:2 ratio; cyst induction signals force cells at G2/M into pre-encysting symmetric
division, and then both daughter cells switch to the endopolyploid cycle80. Ganguly and
Lohia reported that during encystation, trophozoites may have to complete one cell cycle
and return to 1n genome content before they can achieve the 4n DNA content required
for cysts75.
Inducing tetranucleation in axenic culture in concert with the other hallmarks of
encystation has proved challenging, though some groups have been successful. Said-
Fernandez et. al. reported in 1992 that their encystation medium induced one or two
nuclear divisions and the cyst-like structures formed had a rate of bi- or tetra-nucleation
twice that of trophozoites; however, their cyst like structures could not withstand osmotic

33
pressure81. The induction efficiency of these cyst-like structures was around 32.5% after
7 days; however, only a small fraction (1.2%) were tetranucleated80.
Beyond the variation in trophozoites, there is also a reported wide range in the
number of nuclei within cysts75. Cysts have an average of four nuclei with as few as
three and as many as seven nuclei observed75. This genomic plasticity is one of the
components that makes Entamoeba organisms so unique. This tetranucleation, or at least
predominant tetranucleation, has been the difficult hallmark of encystation that many labs
that have induced “cyst-like” structures have not been able to achieve. Although a variety
of encystation stimuli can induce cells to form a chitin cell wall cells may end up
multinucleate, far less than a majority end up tetranucleate. The signals and mechanisms
that regulate Entamoeba cell division cycles in the trophozoite stage or differentiation to
the cyst stage are not well characterized78.
In E. invadens, the introduction of short chain fatty acids (SCFAs) to TYI
medium was found to restrict the ploidy of trophozoites, and also the number of nuclei
per cell in encysting cultures76. Whereas cultures grown in TYI-S-33 media contained
trophozoites with 2n-16n genome content, the major population in SCFA substituted
medium contained only 4n76. This was posited to be a result of the influence SCFAs exert
over the enzymes that regulate nuclear histone acetylation in E. invadens trophozoites, as
this group previously asserted that E. invadens histone H4 lysines can be modified with
acetyl groups to different extents in axenically grown trophozoites13.

34
Small, Round Shape
The easiest phenotype change to identify during encystation is the morphological
change that occurs during the transition from trophozoite to cyst. Eichinger noted that
during encystation, the fluid trophozoite “rounds up” and becomes encapsulated2. The
morphological change that occurs as encystation progresses occurs immediately after
induction, with the shape of the cells changing from an “elongate, directional”
trophozoite form to a rounded form. The rounded cells then converge and adhere to one
another82. Additionally, the cyst structures become smaller, with a size of approximately
10-20 µm, versus trophozoites that are typically 40-60 µm in size, complete with
pseudopods59. The population shift occurs gradually, and cell size and shape also become
much more uniform. Ganguly and Lohia reported that in flow cytometry studies, as
encystation progressed the forward scatter (corresponding to cell size) and side scatter
(corresponding to cell granularity) were both reduced75. This notable change in size and
shape coincides with increased expression of chitin synthase63 and is likely the result of
the production of their chitinous cell wall.
Not only do cysts appear smaller, more spherical, and more uniform than do
trophozoites, they are no longer motile, as the amorphous trophozoites may change their
shape in order to move3. Upon exposure to stress, the trophozoites halt pseudopod
formation as a result of the formation of a chitin cell wall80. Entamoeba lack cytoplasmic
microtubules, so the actin cytoskeleton is solely responsible for Entamoeba cell
morphology3. Cell motility by virtue of the actin cytoskeleton is essential for
differentiation83 because limiting motility additionally limits aggregation, a necessary

35
precursor to encystation. An analysis of four E. invadens profilins was undertaken, where
the proteins were shown to be highly localized to the pseudopods of trophozoites;
expression of each of the four rose sharply during the beginning phases of encystation,
then decreased rapidly in the late phases of cyst induction83.
Additionally, the actin cytoskeleton is reported to play a vital role in the early
phases of encystation, with immunofluorescence staining of E. histolytica trophozoites
revealing significant actin staining, which decreases rapidly as encystation proceeds82.
Furthermore, actin cytoskeleton inhibitors, such as cytochalasin D, a microfilament
inhibitor, have been shown to inhibit E. invadens proliferation and encystation, although
still allowing multinucleation to arise in both trophozoites and cysts. Similar effects were
reported after the introduction of jasplakinolide, an actin-polymerizing drug82,84.
Interestingly, treatment with 2, 3-butanedione monoxime (BDM), an inhibitor of
actomyosin contraction, resulted in the formation of wall-less cysts, or cysts with
irregularly formed cell walls, which demonstrates further that the motility and
aggregation of cells is necessary for chitin deposition, which in turn is necessary for the
signature morphology change.
Detergent Resistance
Detergent resistance is another phenotype conferred by the production of a chitin
cell wall, and as such is secondary, much like the small, round shape hallmark. Chitin
cyst wall production is reported to be vital to providing the resistant capabilities of the
cyst3. The thick polysaccharide walls are also resistant to disruption from strong

36
detergents59. Much like the small, round shape hallmark, it is one of the easier
preliminary tests to determine whether a population of trophozoites contains cysts.
Detergent resistance is often tested after visually identifying the small round
structures71. The detergent treatment is typically done with sarkosyl, ranging from 0.05%-
0.1%, with some as high as 0.15% (w/v) though resistance can also be tested with Triton
X-100 or sodium dodecyl sulfate (SDS) at similar concentrations59,71. The treatments are
typically applied for ~10 minutes to ensure complete dissolution85. It has also proved a
useful tool for differentiating populations for flow cytometry and microscopy
applications, and is used as an indication of relative cyst maturity, as cysts are only
detergent resistant after the cell wall is completely constructed2,86. The progression and
efficiency of encystation is often calculated based on the percentage of cysts that are
resistant to detergent2,86. Highly chitinous cysts often survive treatment at a high
proportion with little visible damage.
Nutrient Stress and Density Dependence
Signals that induce differentiation into either phase of life are necessary to
maintain infection, both through maintenance of parasite numbers within the host and
propagation of infection to other hosts14. E. histolytica is highly responsive to its
environment. During its life cycle, the parasite is exposed to a variety of glucose-poor
and glucose-rich environments, and these fluctuations in nutrient supply induce stress on
the parasite31. Stress conditions, including crowding and the depletion of nutrients, have
been thought to act as signals to induce encystation for quite a while64.

37
Nutrient stress, osmotic shock, and high density are known to trigger encystation
in E. invadens, a distantly related reptilian parasite that serves as the accepted model to
study E. histolytica encystation12,64,67. Glucose deprivation is one very well established
cue for encystation in E. invadens64. How this signal functions to trigger changes in
metabolism for encystation within the cell is not fully characterized. During encystation,
the glycolytic pathway is downregulated in favor of chitin metabolism17. Glycolysis is the
primary pathway for ATP generation in Entamoeba parasites, but when the cell is starved
for glucose, the flux of carbon metabolism is altered to prepare for encystation. Levels of
glucose-6-phosphate and fructose-6-phosphate, used during glycolysis, drop during
encystation in E. invadens39. Pyruvate is converted to acetyl-CoA by pyruvate:ferredoxin
oxidoreductase, which is then converted to ethanol, generating NAD+17,87. Manna et al.
demonstrated that direct binding of NAD+ to the encystation transcription factor
Encystation Regulatory Motif-Binding Protein (ERM-BP) induces encystation by
facilitating ERM-BP binding to promoter regions in cyst-specific genes87. This
phenomenon maps a signaling pathway between nutrient depletion in Entamoeba
parasites and induction of encystation87.
It has additionally been established that E. invadens requires a high cell number
seeded into encystation induction medium3. This high cell density requirement follows
the understanding that large numbers of trophozoites must accumulate in the host colon
to allow for the release of cysts13. Byers et al. reported that upon introduction to low
glucose media, trophozoites aggregated spontaneously once the cell density approached 2
x 105 mL-1, at which point trophozoite multiplication also ceased13. This is key, as
38
encystation usually only takes place within multicellular aggregates3. Cell aggregation is
reported to be a prerequisite for encystation in Entamoeba parasites88, mediated by gal-
terminated ligands, so it is perhaps not surprising that high culture density may stimulate
cell aggregation. Krishnan et al. proposed that cyst wall components within these
aggregates may be secreted into the intercellular space, which would explain the
requirement of cellular aggregation during encystation3. High density cultures of
trophozoites in stationary phase are also more likely to have multiple nuclei per cell
culture76.
These density and nutrient depletion triggers are not highly dissimilar from other
encysting parasites, such as Giardia lamblia12. Encystation in Giardia is sensitive to
increased pH and decreased levels of cholesterol. Pham et al. demonstrated that
encystation is correlated to high-density regions, deemed “foci”, that persist throughout
infection, and reached the conclusion that crowding, nutrient deprivation, and
accumulation of waste and byproducts likely trigger encystation89. However, they also
identified strong matches in encystation transcriptional profiles at the foci regardless of
the day of infection, terming it “developmental synchrony” of the cells within the same
foci89. In contrast, the encystation process for Entamoeba parasites has been described as
a highly asynchronous process3, relying on the fluctuations in population density as well
as nutrient availability to induce portions of the population to encyst.
Stress signals result in changes in gene expression within E. histolytica. ERM-BP
has also been shown to catalyze nicotinamidase activity, which generates nicotinic acid, a
common second messenger that regulates gene expression in bacterial systems87.

39
Ehrenkaufer et al. reported that a number of genetic alterations occur during encystation,
including RNA modification57. As E. histolytica encysts, pre rRNA accumulates by about
5-fold in a process that is highly responsive to specific environmental challenges and cell
differentiation, so that the cells may be ready to synthesize new machinery upon
receiving the signal to excyst90. From this accumulation of evidence, we know that E.
histolytica is highly sensitive to its environment, particularly during these differentiation
processes.
Short Chain Fatty Acids
When Entamoeba take up residence in the host colon, the space is shared by the
individual’s unique microflora. The microflora define the biochemical environment
within the colon13. Short-chain fatty acids (SCFAs) are one of the metabolic byproducts
of fermentation produced by the microbial community in the human large intestine91.
These bacteria ferment starch and non-starch polysaccharides (dietary fibers) to form
SCFAs, of which acetate, butyrate, and propionate are reported to comprise the
majority92. Additionally, the consumption of fiber and vegetables typical of a non-
Western diet is reported to increase the concentration of SCFAs within the colon93. The
SCFA concentration in the colon is substantial, at approximately 80-125mM. The ratios
of acetate, propionate, and butyrate vary depending upon location within the human gut,
but average roughly 57:22:21 (acetate:propionate:butyrate)94.
Although these SCFA byproducts may serve as an energy source for both the host
and other bacteria92,94, they can also serve as signaling molecules. Importantly, these
SCFA metabolites, butyrate in particular, are reported to function as histone deacetylase

40
(HDAC) inhibitors. They can epigenetically control gene expression through chromatin
remodeling93, by causing histone hyperacetylation95. This phenomenon is also relevant to
regulating intestinal cell proliferation given that the hyperacetylation allows transcription
of genes including cyclin-dependent kinase inhibitory proteins, which block cell
replication by arresting the cells in G195. Of all of the SCFAs, butyrate is reported to be
the most effective at arresting cell proliferation and in stimulating or repressing the
expression of genes96.
As E. histolytica encystation within the host occurs in the colon in the presence
of the microbial community and these compounds, it has been hypothesized that SCFAs
may contribute to cell signaling, surface receptor interaction, or nutrient acquisition91.
Byers et al. demonstrated that the addition of SCFAs inhibited the stage conversion
process in E. invadens in a dose-dependent fashion. The combined effects of all three
SCFAs at physiologically relevant concentrations inhibited encystation all together13. In
fact, they showed that SCFAs at a concentration 16-fold below physiological levels was
required to induce even 50% encystation13; however, the growth of E. invadens
trophozoites was not negatively impacted.
The effect of SCFAs on encystation was attributed to the SCFA effects on histone
acetylation, given that histone modifications in E. invadens are linked to stage
conversion. The impact histone acetylation has on stage conversion was confirmed by the
introduction of Trichostatin A (TSA), another HDAC inhibitor that similarly blocked
encystation13. However, blockage by SCFAs contrasted highly with other reports on the
expression profiles of E. histolytica genes when exposed to TSA. Isakov et al. found that
41
the gene encoding Jacob, a protein necessary for cyst formation, was substantially
upregulated by TSA97. Ehrenkaufer et al. found that TSA altered transcription profiles in
ways very similar to encysting parasites65.
SCFAs are thought to impact Entamoeba development, entering the trophozoites
in a pH-dependent manner98. Treating Entamoeba parasites with SCFAs, such as
butyrate, however, did not cause the expected decreased levels of HDAC activity and
hyperacetylation of histones98 as has been seen in other eukaryotic cells95. E. invadens
histones are constitutively acetylated, and E. histolytica strains vary in levels of baseline
acetylation, although the introduction of butyrate led to a decrease in acetylation levels
for both65,98. However, as histone acetylation has a direct influence on DNA replication,
Byers et al. measured DNA content in E. invadens trophozoites exposed to physiological
concentrations of SCFAs and found that they blocked the normal increase in ploidy and
nuclei number trophozoites required to encyst76.
HDAC removes acetate from modified lysine residues located in the N-terminal
tail region of the core histones H2A, H2B, H3, and H4, allowing for histone
acetyltransferase (HAT) activity. Butyrate reportedly inhibits HDAC activity non
competitively96. Trichostatin A functions similarly to inhibit HDAC, however it binds to
the hydrophobic pocket to inhibit the enzyme13,96,97. The E. invadens H4 histone has a
lysine-rich domain (seven lysines, compared to the usual four) in its N-terminus,
theoretically rendering it more sensitive to HDAC/HAT activity98. While methylation of
histones at lysine residues typically silences transcription, lysine acetylation is generally
thought to render the chromatin structure more open and induce transcriptional
42
activation65. This is because acetylation neutralizes the positive charge on histones,
loosening its hold to the chromatin and enhancing access of transcription factors,
polymerases, etc., and are often recruited to a site alongside transcription factors to
enhance the transcriptional activity of the promoter96. Histone deacetylation restores the
positive charge, blocking this access and halting transcription97. However, while the tail
region becomes hyperacetylated in response to Trichostatin A exposure, it does not in
response to butyrate98.
It is proposed that SCFAs impact HAT rather than HDAC activity in Entamoeba,
as cells treated with both TSA and SCFAs contained both hypoacetylated and
hyperacetylated histone populations98. In addition to this lack of alteration in acetylation
profile, it was also reported that very little difference in gene expression was observed
when E. histolytica trophozoites were exposed to SCFAs, whereas TSA induced the
expression of many genes, including those usually expressed during encystation65. These
hypoacetylated H4 histones are not associated with significant alterations in the parasites’
gene expression profile, which is in contrast to data that shows SCFAs regulate gene
expression in other eukaryotic systems91.
Alterations in gene expression in Entamoeba parasites is crucial to stage
conversion, yet only TSA has been shown to induce these changes while both TSA and
SCFAs inhibit encystation65. Again, these changes in transcription levels would seem to
indicate a role for histone acetylation in phase conversion. For example, certain signaling
molecules are upregulated upon treatment of trophozoites with TSA, including protein
kinases and a Rho family GTPase, while others, such as a protein phosphatase, are

43
downregulated65. The regulation of these signaling molecules by TSA further implies the
importance of histone acetylation in controlling signal transduction in responses to
environmental factors in E. histolytica65. One proposed theory for why SCFAs do not
appear to exert strong regulation over the transcriptional response in cultured
trophozoites is that trophozoites grown in culture are selected for their ability to grow in
axenic medium without the normal level of SCFAs65.
Excystation
The cyst stage of E. histolytica is responsible for transmission of the pathogen
between hosts, typically spread through contaminated drinking water70. As such, the cyst
would be exposed to a challenging extra-host environment, and, upon ingestion, to the
harsh stomach acids and digestive enzymes present in the intestinal tract70. However
resistant the cyst must be, it must be sensitive and responsive enough to its external
environment to excyst at a time that would be conducive for the trophozoite70.
Excystation of Entamoeba parasites results in a metacystic amoeba with four
nuclei exiting from chitin-walled cysts by dissolving a portion of the wall71,99. Initially,
the plasma membrane of the encysted trophozoite rests in contact with the cyst wall
surrounding it. However, as quickly as two hours after introduction into high efficiency
induction media, the plasma membrane begins to loosen and detach from the cyst wall in
spots and an increased number of cytoplasmic vesicles can be observed70. That metacysts
have been observed to detach from the cyst wall and then bud off from the cyst through a
tiny hole created in the wall implies a role for chitinases for cell wall remodeling during
excystation100. These vesicles are thought to ferry proteases and chitinase to the edge of

44
the plasma membrane, then secrete them into the newly formed space between the
membrane and wall in order to create a pore101. Eventually, the plasma membrane
separates from the cell wall, except one spot, where they will exit70. The metacystic
amoeba contain four nuclei and will divide into eight amoebulae that develop into
trophozoites99. Electron microscopy studies indicated the presence of trophozoites 24
hours after induction of excystation, although this process is although thought to be
asynchronous70.
The excystation process initiates the infection and as such understanding the
mechanisms involved is highly valuable to controlling the spread of amoebiasis102.
However, if encystation is thought to be poorly understood in E. histolytica, information
on excystation is virtually non-existent. Transferring cysts from induction to growth
media is required to trigger successful excystation, which indicates that a signal from the
media change must be transduced from the cell wall to the nuclei within100,102. This mode
of excystation is notably low efficiency, resulting in 1-10% excystation over a period of
72 hours, and raises concerns about the state of cyst maturity when generated in vitro70.
Entamoeba excystation occurs after exposure to acidic conditions in the stomach
and duodenum to reach the small intestine, specifically the terminal ileum, where the
trophozoites excyst and become proliferative before traveling to the colon7,88. The
trophozoite progression is halted in the colon due to the expression of gal/galNAc lectins
and their affinity for mucins, so excystation selectively occurs upstream of this in the
small intestine70. Similar compounds are released during digestion in both reptiles and
humans, so it is thought that E. invadens is still suitable here as a model70. As such,

45
compounds that mimic the environments cysts are exposed to just prior to excystation
have been investigated to determine any positive effect. The in vitro excystation process
in E. invadens has historically been a low-yield and time consuming process, although
the production of metacystic amoeba has been observed, particularly when introduced to
bile salts and bicarbonate70.
Bicarbonate has been shown to have a strong impact on excystation, with doses in
the 40-80 mM range improving the 1-10% efficiency rate to up to 60% within 24 hours,
whereas as little as 5 mM still boosted efficiency to roughly 50% by 48 hours. Bile salts,
specifically taurocholate and taurodexoycholate, also had a substantial impact on
encystation, with 2.5 mM and 1.25 mM each inducing roughly 50 and 70% encystation,
respectively, by 24 hours.
Makioka et al. generated both artificial gastric fluid (AGF) and artificial intestinal
fluid (AIF) and examined the effect of pretreatment with these compounds on the
efficiency of E. invadens excystation99. Excystation appeared to be partially promoted by
exposure to AGF containing 0.5% pepsin and 0.6% hydrochloric acid at a pH of 1.8 in
distilled water. Exposure to this mixture for a length of 30-60 minutes made slight
improvements, but any longer reduced viability substantially99. AIF, containing 1%
pancreatin, 1% sodium bicarbonate, and 5% ox bile at pH 8.0, appeared to be toxic to
cysts99. Indeed, the only pretreatment that seemed to have any substantial positive impact
on excystation was distilled water at 37°C, which increased viability proportionally to the
exposure time99. Taken together, this data seems to suggest acidic conditions are

46
important for triggering E. invadens excystation, although the exact mechanism is as yet
unclear99.
The importance of cysts’ sensitivity to their surrounding environment has been
established. As protectors of the amoeba, they must ensure they do not excyst in an
environment that would be toxic or otherwise unsuitable to the trophozoite70. What
signals are required however are not well understood. Bile acids are typically
deconjugated from their amino acids in the ileum, reabsorbed by enterocytes, put into
circulation, and then removed from circulation by hepatocytes, where they induce
changes in gene expression after binding to nuclear proteins70. It is posited that they may
trigger similar alterations in gene expression in Entamoeba70.
Additional putative signaling molecules that indicate the appropriate timing for
excystation include calcium, protein kinase C, and phosphatidylinositol 3-kinase70.
Calcium ions are reported to play a key role in metabolic processes in a variety of
eukaryotic cells, including differentiation, mediated by calmodulin (CaM) a calcium
receptor102. Addition of calcium and CaM antagonists to excystation media have been
shown to inhibit excystation and delay metacystic development102.
Components of cells that function during excystation and the following
development of metacystic trophozoites include actin and tubulin70. The reason being the
excystation process as described above involves detaching the amoeba from the chitin
cell wall surrounding it, and then the movement of the metacystic amoeba, until it
eventually escapes100. This involves substantial activity of the actin cytoskeleton100. The
addition of octyl-3,4,5-trimethoxybenzoate (TMB-8) to the media was shown to inhibit

47
excystation as well, likely due to its inhibition of intracellular calcium transport102. This
has been proposed to be due to its prevention of “calcium-dependent gelation” of actin
within the amoeba, which is necessary for vital microtubule involvement in
excystation102. The requirement of extracellular calcium and the incorporation of that
calcium into the cyst have both been reported to be required for encystation, so inhibition
of CaM was also examined for its impact. Similarly to in Giardia, inhibition of CaM by
trifluoperazine (TFP) also inhibited excystation in E. invadens. CaM is known to function
in the assembly and disassembly of microtubules, relevant to nuclear division within
metacysts102.
Phosphatidylinositol 3-kinase (PI3K) and protein kinase C have additionally been
shown to be relevant to the excystation process. Protein kinase C (PKC) is a phospholipid
dependent serine/threonine kinase, and is important to cellular differentiation100.
Signaling via protein kinase C has long been recognized to participate in the
reorganization of the actin cytoskeleton in E. histolytica trophozoites, and it therefore was
a good candidate for investigation for impact on E. invadens excystation100. The
introduction of PKC inhibitors to the excystation media successfully inhibited
excystation. This is interesting in particular because calcium ions act as a cofactor for the
activation of PKC, indicating that the calcium signaling previously investigated by this
same group acts in tandem with PKC100. PI3K is responsible for phosphorylation of
inositol phospholipids to generate lipid byproducts; these byproducts bind proteins in
order to initiate a variety of cellular activities, including actin rearrangement100. A similar
48
reduction of excystation without cyst toxicity was demonstrated when cysts were treated
with wortmannin, an inhibitor of the PI3K family of enzymes100.
Additionally, excystation and metacystic development are both prevented if DNA
replication or cysteine protease activity is blocked101. Cysteine proteases impact growth
and differentiation in a variety of protozoan parasites, and E. histolytica reportedly
contains at least 40 cysteine protease genes103. Additionally, cysteine protease genes have
been shown to be enriched in cysts103. Cysteine protease inhibitors Z-Phe-Ala-DMK and
E-64d have been shown to inhibit excystation of E. invadens in the small intestine in a
concentration dependent manner, as well as metacystic development, without impacting
cyst viability101. As the walls of the cyst contain both chitin and protein, a role for
proteases in creating the pore through which metacystic amoeba bloom would be
expected101. Furthermore, the cyst-specific cysteine protease in Giardia lamblia has a
transmembrane domain that looks very similar to one identified in E. histolytica103.
The environmental triggers for inducing excystation in related pathogens, such as
E. invadens, Cryptosporidium, and Giardia lamblia, have been investigated along similar
lines. For example, excystation in Giardia is triggered in the small intestine by low pH
and exposure to host proteases, and is induced by low pH and high temperature (37°C) in
Cryptosporidium70. Interestingly, exposure of Giardia to bile salts and pepsin did not
alter the level of excystation, similarly to what was reportedly observed in E. invadens99.
Research Summary
This research focuses on glycogen metabolism and encystation in E. histolytica.
We have developed a novel model for encystation of E. histolytica in axenic culture and
49
confirmed each of the four hallmarks: round shape, a chitinous cell wall, tetranucleation,
and detergent resistance3,12,104. We have shown that high cell density and glucose
starvation are both essential triggers for encystation, similarly to what is seen in E.
invadens12,64. However, we observed that short chain fatty acids accelerated E. histolytica
encystation, in contrast to what is seen in E. invadens13. E. histolytica cysts were also
shown to excyst in culture. Additionally, the role of glycogen metabolism in E.
histolytica was investigated. We found glycogen is utilized to sustain growth in E.
histolytica trophozoites during glucose starvation. We also generated two knockdown
mutants for Entamoeba glycogen synthase and both glycogen phosphorylases and
observed growth and encystation defects in both strains.

50
References
1. Baxt, L. A. & Singh, U. New insights into Entamoeba histolytica pathogenesis.
Curr. Opin. Infect. Dis. 21, 489–494 (2008).
2. Eichinger, D. Encystation of Entamoeba parasites. BioEssays 19, 633–639 (1997).
3. Krishnan, D., Nayak, S. & Ghosh, S. K. Novel insights into Entamoeba cyst wall
formation and the importance of actin cytoskeleton. bioRxiv 2020.04.24.059360
(2020) doi:10.1101/2020.04.24.059360.
4. Schaap, P. & Schilde, C. Encystation: The most prevalent and underinvestigated
differentiation pathway of eukaryotes. Microbiology (United Kingdom) vol. 164
(2018).
5. Watanabe, K. & Jr, W. A. P. Molecular biology research to benefit patients with
Entamoeba histolytica infection. Mol. Microbiol. 98, 208–217 (2015).
6. Thibeaux, R. et al. Identification of the virulence landscape essential for
Entamoeba histolytica invasion of the human colon. PLoS Pathog. 9, 1–19 (2013).
7. Centers for Disease Control and Prevention. Amebiasis.
https://www.cdc.gov/parasites/amebiasis/general-info.html (2015).
8. Shibayama, M., de Jesús Serrano-Luna, J., Aguirre-García, J. & Tsutsumi, V.
Pathology, Pathogenesis, and Experimental Amebiasis BT - Amebiasis: Biology
and pathogenesis of Entamoeba. in (eds. Nozaki, T. & Bhattacharya, A.) 411–431
(Springer Japan, 2015). doi:10.1007/978-4-431-55200-0_23.
9. Morf, L. & Singh, U. Entamoeba histolytica: a snapshot of current research and
methods for genetic analysis. Curr. Opin. Microbiol. 15, 469–475 (2012).

51
10. Herman, E. et al. Membrane trafficking modulation during Entamoeba
encystation. Sci. Rep. (2017) doi:10.1038/s41598-017-12875-6.
11. Haque, R. et al. Entamoeba histolytica infection in children and protection from
subsequent amebiasis. Infect. Immun. 74, 904–909 (2006).
12. Eichinger, D. Encystation in parasitic protozoa. Current Opinion in Microbiology
vol. 4 421–426 (2001).
13. Byers, J., Faigle, W. & Eichinger, D. Colonic short-chain fatty acids inhibit
encystation of Entamoeba invadens. Cell. Microbiol. 7, 269–279 (2005).
14. Eichinger, D. A role for a galactose lectin and its ligands during encystment of
Entamoeba. in J. Euk Micro (2001). doi:10.1111/j.1550-7408.2001.tb00411.x.
15. Lohia, A. The cell cycle of Entamoeba histolytica. Mol. Cell. Biochem. 253, 217–
222 (2003).
16. Matt, J. & Duchêne, M. Molecular and biochemical characterization of Entamoeba
histolytica fructokinase. Parasitol. Res. 114, 1939–1947 (2015).
17. Jeelani, G. & Nozaki, T. ScienceDirect Metabolomic analysis of Entamoeba :
applications and implications. Curr. Opin. Microbiol. 20, 118–124 (2014).
18. Saavedra, E. et al. Control and regulation of the pyrophosphate-dependent glucose
metabolism in Entamoeba histolytica. Mol. Biochem. Parasitol. 229, 75–87
(2019).
19. Anderson, I. J. & Loftus, B. J. Entamoeba histolytica: Observations on metabolism
based on the genome sequence. Exp. Parasitol. 110, 173–177 (2005).
20. Saavedra, E., Encalada, R., Pineda, E., Jasso-Chávez, R. & Moreno-Sánchez, R.

52
Glycolysis in Entamoeba histolytica. Biochemical characterization of recombinant
glycolytic enzymes and flux control analysis. FEBS J. 272, 1767–1783 (2005).
21. Pineda, E. et al. In vivo identification of the steps that control energy metabolism
and survival of Entamoeba histolytica. FEBS J. 282, 318–331 (2015).
22. Plaxton, W. C. Metabolic flexibility helps plants to survive stress. in Plant
Physiology 1–15 (Sinauer Associates, 2015).
23. Iyer, L. R., Verma, A. K., Paul, J. & Bhattacharya, A. Phagocytosis of gut bacteria
by Entamoeba histolytica. Front. Cell. Infect. Microbiol. 9, 34 (2019).
24. Somlata & Bhattacharya, A. Phagocytosis in Entamoeba histolytica BT -
Amebiasis: Biology and Pathogenesis of Entamoeba. in (eds. Nozaki, T. &
Bhattacharya, A.) 189–206 (Springer Japan, 2015). doi:10.1007/978-4-431-55200-
0_12.
25. Paredes-Flores, M. A. & Mohiuddin, S. S. Biochemistry, Glycogenolysis. in
StatPearls [Internet] (StatPearls Publishing, 2020).
26. Rosenbaum, R. M. & Wittner, M. Ultrastructure of bacterized and axenic
trophozoites of Entamoeba histolytica with particular reference to helical bodies. J.
Cell Biol. 45, 367–382 (1970).
27. Segura-Luna, J. J. & Calzado-Flores, C. Incorporation of 14C-glucose into
cytoplasmic glycogen from Entamoeba invadens IP-1 strain. Arch. Med. Res. 31,
S194–S195 (2000).
28. Pineda, E. et al. Glucose metabolism and its controlling mechanisms in Entamoeba
histolytica BT - Amebiasis: Biology and Pathogenesis of Entamoeba. in (eds.

53
Nozaki, T. & Bhattacharya, A.) 351–372 (Springer Japan, 2015). doi:10.1007/978-
4-431-55200-0_20.
29. Takeuchi, T., Weinbach, E. C. & Diamond, L. S. Entamoeba histolytica:
Localization and characterization of phosphoglucomutase, uridine diphosphate
glucose pyrophosphorylase, and glycogen synthase. Exp. Parasitol. 43, 115–121
(1977).
30. Saavedra, E. et al. Kinetic modeling can describe in vivo glycolysis in Entamoeba
histolytica. FEBS J. 274, 4922–4940 (2007).
31. Baumel-Alterzon, S. & Ankri, S. Entamoeba histolytica adaptation to glucose
starvation: a matter of life and death. Curr. Opin. Microbiol. 20, 139–145 (2014).
32. Baumel-Alterzon, S., Weber, C., Guillén, N. & Ankri, S. Identification of
dihydropyrimidine dehydrogenase as a virulence factor essential for the survival of
Entamoeba histolytica in glucose-poor environments. Cell. Microbiol. 15, 130–144
(2013).
33. Werries, E. & Muller, F. Studies on the substrate specificity of a- and B-amylase
of Entamoeba histolytica. Mol. Biochem. Parasitol. 18, 211–221 (1986).
34. Werries, E., Franz, A. & Geisemeyer, S. Detection of glycogen-debranching
system in trophozoites of Entamoeba histolytica. J. Protozool. 37, 576–580
(1990).
35. Werries, E. & Thurn, I. Breakdown of glucopolysaccharides in Entamoeba
histolytica by phosphorylase. J. Protozool. 36, 607–612 (1989).
36. Ellingwood, S. S. & Cheng, A. Biochemical and clinical aspects of glycogen
54
storage diseases. J. Endocrinol. 238, R131–R141 (2018).
37. Bakker-Grunwald, T., Martin, J.-B. & Klein, G. Characterization of glycogen and
amino acid pool of Entamoeba histolytica by 13C-NMR Spectroscopy. J.
Eukaryot. Microbiol. 42, 346–349 (1995).
38. Samanta, S. K. & Ghosh, S. K. The chitin biosynthesis pathway in Entamoeba and
the role of glucosamine-6-P isomerase by RNA interference. Mol. Biochem.
Parasitol. 186, 60–68 (2012).
39. Jeelani, G. et al. Metabolic profiling of the protozoan parasite Entamoeba invadens
revealed activation of unpredicted pathway during encystation. PLoS One (2012)
doi:10.1371/journal.pone.0037740.
40. Naiyer, S., Bhattacharya, A. & Bhattacharya, S. Advances in Entamoeba
histolytica biology through transcriptomic analysis. Front. Microbiol. 10, 1921
(2019).
41. Weedall, G. D. & Hall, N. Evolutionary genomics of Entamoeba. Res. Microbiol.
162, 637–645 (2011).
42. Weedall, G. D. The genomics of Entamoebae: Insights and challenges BT -
Amebiasis: Biology and Pathogenesis of Entamoeba. in (eds. Nozaki, T. &
Bhattacharya, A.) 27–47 (Springer Japan, 2015). doi:10.1007/978-4-431-55200-
0_3.
43. Gilchrist, C. A. The E. histolytica genome structure and virulence. Curr. Trop.
Med. reports 3, 158–163 (2016).
44. Mirelman, D. & Bracha, R. Genetic manipulation techniques BT - Amebiasis:

55
Biology and Pathogenesis of Entamoeba. in (eds. Nozaki, T. & Bhattacharya, A.)
75–95 (Springer Japan, 2015). doi:10.1007/978-4-431-55200-0_6.
45. Fire, A. et al. Potent and specific genetic interference by double-stranded RNA in
Caenorhabditis elegans. Nature 391, 806–811 (1998).
46. Morf, L., Pearson, R. J., Wang, A. S. & Singh, U. Robust gene silencing mediated
by antisense small RNAs in the pathogenic protist Entamoeba histolytica. Nucleic
Acids Res. 41, 9424–9437 (2013).
47. Zhang, H., Pompey, J. M. & Singh, U. RNA interference in Entamoeba histolytica:
implications for parasite biology and gene silencing. Future Microbiol. 6, 103–117
(2011).
48. Ghildiyal, M. & Zamore, P. D. Small silencing RNAs: an expanding universe. Nat.
Rev. Genet. 10, 94–108 (2009).
49. Cuccato, G. et al. Modeling RNA interference in mammalian cells. BMC Syst.
Biol. 5, 19 (2011).
50. Hamann, L., Buß, H. & Tannich, E. Tetracycline-controlled gene expression in
Entamoeba histolytica. Mol. Biochem. Parasitol. 84, 83–91 (1997).
51. Katz, U., Bracha, R., Nuchamowitz, Y., Milstein, O. & Mirelman, D. Comparison
between constitutive and inducible plasmid vectors used for gene expression in
Entamoeba histolytica. Mol. Biochem. Parasitol. 128, 229–233 (2003).
52. Ramakrishnan, G., Vines, R. R., Mann, B. J. & Petri, W. A. A tetracycline-
inducible gene expression system in Entamoeba histolytica. Mol. Biochem.
Parasitol. 84, 93–100 (1997).

56
53. Wassmann, C., Hellberg, A., Tannich, E. & Bruchhaus, I. Metronidazole resistance
in the protozoan parasite Entamoeba histolytica is associated with increased
expression of iron-containing superoxide dismutase and peroxiredoxin and
decreased expression of ferredoxin 1 and flavin reductase. J. Biol. Chem. 274,
26051–26056 (1999).
54. King, A. V, Welter, B. H., Koushik, A. B., Gordon, L. N. & Temesvari, L. A. A
genome-wide over-expression screen identifies genes involved in phagocytosis in
the human protozoan parasite, Entamoeba histolytica. PLoS One 7, e43025 (2012).
55. Manna, D., Ehrenkaufer, G. M. & Singh, U. Regulation of gene expression in the
protozoan parasite Entamoeba invadens: Identification of core promoter elements
and promoters with stage-specific expression patterns. Int. J. Parasitol. 44, 837–
845 (2014).
56. Mi-Ichi, F., Miyake, Y., Tam, V. K. & Yoshida, H. A flow cytometry method for
dissecting the cell differentiation process of Entamoeba encystation. Front. Cell.
Infect. Microbiol. (2018) doi:10.3389/fcimb.2018.00250.
57. Ehrenkaufer, G. M. et al. The genome and transcriptome of the enteric parasite
Entamoeba invadens, a model for encystation. Genome Biol. 14, R77 (2013).
58. Dey, T., Basu, R. & Ghosh, S. K. Entamoeba invadens: Cloning and molecular
characterization of chitinases. Exp. Parasitol. (2009)
doi:10.1016/j.exppara.2009.07.008.
59. Aguilar-Díaz, H., Díaz-Gallardo, M., Laclette, J. P. & Carrero, J. C. In vitro
induction of Entamoeba histolytica cyst-like structures from trophozoites. PLoS

57
Negl. Trop. Dis. 4, (2010).
60. Saavedra-Lira, E. & Pérez-Montfort, R. Energy production in Entamoeba
histolytica: new perspectives in rational drug design. Arch. Med. Res. 27, 257–264
(1996).
61. Larocque, R., Nakagaki, K., Lee, P., Abdul-Wahid, A. & Faubert, G. M. Oral
immunization of BALB/c mice with Giardia duodenalis recombinant cyst wall
protein inhibits shedding of cysts. Infect. Immun. 71, 5662–5669 (2003).
62. Segovia-Gamboa, N. C. et al. Differentiation of Entamoeba histolytica: A possible
role for enolase. Exp. Parasitol. (2011) doi:10.1016/j.exppara.2011.05.001.
63. Campos-Góngora, E., Ebert, F., Willhoeft, U., Said-Fernández, S. & Tannich, E.
Characterization of chitin synthases from Entamoeba. Protist (2004)
doi:10.1078/1434461041844204.
64. Vazquezdelara-Cisneros, L. G. & Arroyo-Begovich, A. Induction of encystation of
Entamoeba invadens by removal of glucose from the culture medium. J. Parasitol.
70, 629–633 (1984).
65. Ehrenkaufer, G. M., Eichinger, D. J. & Singh, U. Trichostatin A effects on gene
expression in the protozoan parasite Entamoeba histolytica. BMC Genomics 8, 1–
13 (2007).
66. Silberman, J. D., Clark, C. G., Diamond, L. S. & Sogin, M. L. Phylogeny of the
genera Entamoeba and Endolimax as deduced from small- subunit ribosomal RNA
sequences. Mol. Biol. Evol. 16, 1740–1751 (1999).
67. Avron, B., Stolarsky, T., Chayen, A. & Mirelman, D. Encystation of Entamoeba

58
invadens IP-1 is induced by lowering the osmotic pressure and depletion of
nutrients from the medium. J. Protozool. 33, 522–525 (1986).
68. Chatterjee, A. et al. Evidence for a ‘wattle and daub’ model of the cyst wall of
Entamoeba. PLoS Pathog. (2009) doi:10.1371/journal.ppat.1000498.
69. Barrón-González, M. P., Villarreal-Treviño, L., Reséndez-Pérez, D., Mata-
Cárdenas, B. D. & Morales-Vallarta, M. R. Entamoeba histolytica: Cyst-like
structures in vitro induction. Exp. Parasitol. (2008)
doi:10.1016/j.exppara.2007.11.002.
70. Biswa, M. N., Pradel, G., Frevert, U. & Eichinger, D. Compounds of the upper
gastrointestinal tract induce rapid and efficient excystation of Entamoeba
invadens. Int. J. Parasitol. 6, 247–253 (2009).
71. Makioka, A., Kumagai, M., Hiranuka, K., Kobayashi, S. & Takeuchi, T. Different
structure and mRNA expression of Entamoeba invadens chitinases in the
encystation and excystation. Parasitol. Res. (2011) doi:10.1007/s00436-011-2270-
2.
72. Van Dellen, K. L. et al. Unique posttranslational modifications of chitin-binding
lectins of Entamoeba invadens cyst walls. Eukaryot. Cell 5, 836–848 (2006).
73. Chávez-Munguía, B., Cristóbal-Ramos, A. R., González-Robles, A., Tsutsumi, V.
& Martínez-Palomo, A. Ultrastructural study of Entamoeba invadens encystation
and excystation. J. Submicrosc. Cytol. Pathol. (2003).
74. Timothy Macechko, P., Steimle, P. A., Lindmark, D. G., Erlandsen, S. L. &
Jarroll, E. L. Galactosamine-synthesizing enzymes are induced when Giardia

59
encyst. Mol. Biochem. Parasitol. 56, 301–309 (1992).
75. Ganguly, A. & Lohia, A. The cell cycle of Entamoeba invadens during vegetative
growth and differentiation. Mol. Biochem. Parasitol. (2001) doi:10.1016/S0166-
6851(00)00376-5.
76. Byers, J. & Eichinger, D. Entamoeba invadens: Restriction of ploidy by colonic
short chain fatty acids. Exp. Parasitol. 110, 203–206 (2005).
77. Mukherjee, C., Clark, C. G. & Lohia, A. Entamoeba shows reversible variation in
ploidy under different growth conditions and between life cycle phases. PLoS
Negl. Trop. Dis. (2008) doi:10.1371/journal.pntd.0000281.
78. Das, S. & Lohia, A. Delinking of S phase and cytokinesis in the protozoan parasite
Entamoeba histolytica. Cell. Microbiol. 4, 55–60 (2002).
79. Arredondo, J., González, M., Coria, A. L., Vallarta, M. M. & Leon, N. Entamoeba
histolytica: trophozoite, precyst and cyst studied by atomic force microscopy. in
(2014).
80. Vladimir F. Niculescu. Developmental and non developmental polyploidy in xenic
and axenic cultured stem cell lines of Entamoeba invadens and E. histolytica.
Insights Stem Cells. 2016, 21. 2, (2016).
81. Said-Fernández, S. & Mata-Cárdenas, B. D. Axenic cultivation of Entamoeba
histolytica in suspension. Trans. R. Soc. Trop. Med. Hyg. 86, 173–174 (1992).
82. Makioka, A., Kumagai, M., Ohtomo, H., Kobayashi, S. & Takeuchi, T. Effect of
cytochalasin D on the growth, encystation, and multinucleation of Entamoeba
invadens. Parasitol. Res. 86, 599–602 (2000).

60
83. Makioka, A., Kumagai, M., Hiranuka, K., Kobayashi, S. & Takeuchi, T.
Expression analysis of Entamoeba invadens profilins in encystation and
excystation. Parasitol. Res. (2012) doi:10.1007/s00436-011-2735-3.
84. Makioka, A., Kumagai, M., Ohtomo, H., Kobayashi, S. & Takeuchi, T. Effect of
jasplakinolide on the growth, encystation, and actin cytoskeleton of Entamoeba
histolytica and Entamoeba invadens. J. Parasitol. 87, 399–405 (2001).
85. Campos-Góngora, E. et al. Mg, Mn, and Co ions enhance the formation of
Entamoeba histolytica cyst-like structures resistant to sodium dodecyl sulfate.
Arch. Med. Res. 31, 162–168 (2000).
86. Welter, B. H., Sehorn, M. G. & Temesvari, L. A. Flow cytometric characterization
of encystation in Entamoeba invadens. Mol. Biochem. Parasitol. 218, 23–27
(2017).
87. Manna, D. et al. An NAD + -dependent novel transcription factor controls stage
conversion in Entamoeba. Elife 7, 1–22 (2018).
88. Mi-ichi, F., Yoshida, H. & Hamano, S. Entamoeba encystation: new targets to
prevent the transmission of Amebiasis. PLoS Pathogens (2016)
doi:10.1371/journal.ppat.1005845.
89. Pham, J. K. et al. Transcriptomic profiling of high-density Giardia foci encysting
in the murine proximal intestine. Front. Cell. Infect. Microbiol. 7, 227 (2017).
90. Ojha, S., Ahamad, J., Bhattacharya, A. & Bhattacharya, S. Ribosomal RNA and
protein transcripts persist in the cysts of Entamoeba invadens. Mol. Biochem.
Parasitol. (2014) doi:10.1016/j.molbiopara.2014.05.003.
61
91. Singh, U. & Ehrenkaufer, G. M. Recent insights into Entamoeba development:
Identification of transcriptional networks associated with stage conversion. Int. J.
Parasitol. 39, 41–47 (2009).
92. Topping, D. L. & Clifton, P. M. Short-chain fatty acids and human colonic
function: Roles of resistant starch and nonstarch polysaccharides. Physiol. Rev. 81,
1031–1064 (2001).
93. Licciardi, P. V, Ververis, K. & Karagiannis, T. C. Histone deacetylase inhibition
and dietary short-chain fatty acids. ISRN Allergy 2011, 869647 (2011).
94. Cummings, J. H., Pomare, E. W., Branch, W. J., Naylor, C. P. & Macfarlane, G. T.
Short chain fatty acids in human large intestine, portal, hepatic and venous blood.
Gut 28, 1221–1227 (1987).
95. Blottière, H. M., Buecher, B., Galmiche, J.-P. & Cherbut, C. Molecular analysis of
the effect of short-chain fatty acids on intestinal cell proliferation. Proc. Nutr. Soc.
62, 101–106 (2003).
96. Davie, J. R. Inhibition of histone deacetylase activity by butyrate. J. Nutr. 133,
2485S-2493S (2003).
97. Isakov, E., Siman-Tov, R., Weber, C., Guillen, N. & Ankri, S. Trichostatin A
regulates peroxiredoxin expression and virulence of the parasite Entamoeba
histolytica. Mol. Biochem. Parasitol. 158, 82–94 (2008).
98. Byers, J. & Eichinger, D. Acetylation of the Entamoeba histone H4 N-terminal
domain is influenced by short-chain fatty acids that enter trophozoites in a pH-
dependent manner. Int. J. Parasitol. 38, 57–64 (2008).

62
99. Makioka, A., Kumagai, M., Kobayashi, S. & Takeuchi, T. Effect of artificial
gastrointestinal fluids on the excystation and metacystic development of
Entamoeba invadens. Parasitol. Res. 98, 443–446 (2006).
100. Makioka, A., Kumagai, M., Kobayashi, S. & Takeuchi, T. Involvement of
signaling through protein kinase C and phosphatidylinositol 3-kinase in the
excystation and metacystic development of Entamoeba invadens. Parasitol. Res.
91, 204–208 (2003).
101. Makioka, A., Kumagai, M., Kobayashi, S. & Takeuchi, T. Entamoeba invadens:
Cysteine protease inhibitors block excystation and metacystic development. Exp.
Parasitol. 109, 27–32 (2005).
102. Makioka, A., Kumagai, M., Kobayashi, S. & Takeuchi, T. Possible role of calcium
ions, calcium channels and calmodulin in excystation and metacystic development
of Entamoeba invadens. Parasitol. Res. 88, 837–843 (2002).
103. Ehrenkaufer, G. M., Haque, R., Hackney, J. A., Eichinger, D. J. & Singh, U.
Identification of developmentally regulated genes in Entamoeba histolytica:
Insights into mechanisms of stage conversion in a protozoan parasite. Cell.
Microbiol. 9, 1426–1444 (2007).
104. López-Romero, E. & Villagómez-Castro, J. C. Encystation in Entamoeba
invadens. Parasitol. Today (1993) doi:10.1016/0169-4758(93)90019-C.

63
CHAPTER TWO
ENCYSTATION OF ENTAMOEBA HISTOLYTICA IN AXENIC CULTURE
Jordan Wesel, Jennifer Shuman, Julie Dickerson,
Irem Bastuzel, and Cheryl Ingram-Smith Abstract
Entamoeba histolytica is a parasitic protozoan that causes amoebic dysentery,
which affects approximately 90 million people each year worldwide. E. histolytica is
transmitted by an oral-fecal route through ingestion of food and water contaminated with
the cyst form, which then undergoes excystation to the trophozoite form that colonizes
the large intestine. Despite the global burden of this disease, laboratory study of infection
has been seriously impeded by the lack of an E. histolytica model for encystation and
excystation. The reptilian pathogen Entamoeba invadens has been adapted as a substitute
model for the human pathogen in studying stage conversion between the trophozoite and
cyst form. Although much has been learned about encystation and excystation using the
E. invadens model, the findings do not fully translate to E. histolytica due to the extensive
genetic differences between these species. Here, we present the first model for
E. histolytica encystation in vitro. The cysts were viable, excysting to trophozoite form,
and displayed the four characteristic hallmarks: round shape, a chitinous cell wall,
tetranucleation, and detergent resistance. Using flow cytometry analysis, we showed that
high cell density and glucose limitation are key signals for encystation, as for E.
invadens. Unlike the case for E. invadens, entry into encystation was enhanced by the
presence of the short chain fatty acids acetate and propionate, both of which are prevalent

64
in the large intestine where E. histolytica colonizes. This new model will serve as the
foundation for further study of E. histolytica transmission and treatment.
Introduction
Entamoeba histolytica is a protozoan parasite of humans that is the causative
agent of amoebic dysentery. This pathogen is particularly common in tropical areas in
developing nations with poor sanitation1,2, and approximately 90 million people
worldwide experience symptomatic disease from E. histolytica infection each year2. This
is thought to represent just a fraction of infections though, as an estimated 90% of people
infected with E. histolytica are asymptomatic carriers3,4. Thus, E. histolytica infection
represents a major public health problem affecting up to 1 billion people yearly, resulting
in significant loss of productivity and 50-100,000 deaths from amoebic liver abscess5.
Amoebiasis ranks as a leading cause of death due to parasitic infections6-8.
E. histolytica is transmitted via the oral-fecal route. Transmission occurs when E.
histolytica is shed from the host as an infective, environmentally resistant cyst and
ingested in contaminated food or water. After ingestion, the cyst emerges into its disease-
causing trophozoite form in the small intestine and then colonizes the large intestine.
Although most cases are asymptomatic, carriers shed millions of cysts daily and thus
perpetuate the infection cycle9. Symptomatic infections typically present as amoebic
dysentery but can also result in amoebic liver abscesses that can be deadly if left
untreated4,10,11.
Despite the global burden of this disease, laboratory study of E. histolytica
infection has been seriously impeded by the inability to induce true encystation in the

65
laboratory12-16. E. histolytica can be readily cultured in a laboratory setting in the
trophozoite stage and genetic tools exist to manipulate the parasite and study the disease-
causing state. Development of a reproducible method for inducing encystation of E.
histolytica in culture has remained intractable though. One possible explanation is that
due to the nature of their continuous cultivation, the virulence of laboratory strains has
been reduced and differentiation to cysts can no longer be induced in axenic culture12.
The lack of an animal model that can support the complete E. histolytica life cycle from
ingestion of cysts to colonization to shedding of cysts has also hampered our
understanding of virulence, the infection cycle, and phase transitions between cysts and
trophozoites. Instead, researchers have relied on direct injection or surgical inoculation of
trophozoites to analyze infection in the mouse and gerbil models of infection17-21.
Previous attempts to induce E. histolytica encystation in laboratory culture have
been unsuccessful in producing viable cysts that display the four primary hallmarks:
spherical shape, detergent-resistance, chitin cell wall, and tetranucleation. Said-Fernandez
and Mata-Cárdenas22 reported formation of cyst-like structures after one or two nuclear
divisions. The efficiency of production of these cyst-like structures was ~32.5% after 7
days, similar to the results presented here, but only 1.2% were tetranucleated and could
not withstand osmotic pressure. Barrón-González et al.14 induced formation of cyst-like
cells at very high efficiency through the use of Escherichia coli and Enterococcus
faecalis conditioned media and alkaline pH. These cyst-like cells were multinucleate but
were typically not tetranucleate and were not viable to excyst. Aguilar-Diaz et al.13
induced formation of cyst-like structures after treatment with hydrogen peroxide and
66
metals, but these structures were not consistently tetranucleate and the maximum
conversion rate from trophozoite to cyst was only ~30%.
Instead, researchers have relied on the reptilian species Entamoeba invadens as
the model to study Entamoeba stage conversion23,24. The IP-1 strain of E. invadens
encysts in just 72 hours upon application of glucose deprivation and hypo-osmotic
shock25,26. E. invadens IP-1 can encyst with >95% efficiency unlike other E. invadens
strains that encyst at only 5-20% efficiency27,28. Although this super-encyster has
provided a great deal of information on encystation and excystation, the findings cannot
not fully translate to E. histolytica due to the genetic and host differences. E. invadens has
over 3,000 more predicted genes than E. histolytica and less than half of the predicted
genes in E. invadens have putative orthologs in E. histolytica29. Of 195 cyst-specific
protein identified through proteomic analysis of E. histolytica cysts30, only 74 had
orthologs in E. invadens29.
We have now developed a method for encystation of E. histolytica in axenic
culture. Microscopic examination demonstrated that the cysts were encapsulated in a
chitin cell wall, were spherical and smaller in size than trophozoites, and were
multinucleated with the majority having four or more nuclei. These cysts were also
shown to be detergent resistant, thus fulfilling all four hallmarks for true viable cysts.
Flow cytometry analysis of encysting populations revealed that high cell density was a
determining factor in the rate and efficiency of encystation and that the presence of short
chain fatty acids also influenced entry into encystation. Finally, cysts were shown to be
viable, and could excyst back to the growing trophozoite form. This is the first
67
demonstration of reproducible encystation in axenic culture to produce viable cysts, thus
completing the full life cycle of E. histolytica in laboratory culture. This represents a
major research breakthrough for studying a human pathogen of significant public health
importance.
Materials and Methods
Materials
Adult bovine serum was purchased from Gemini Bio (www.gembio.com) and was
heat-inactivated at 56°C for 25 min. Other media components were purchased from
Fisher Scientific and VWR. Cells were cultured in 25 cm2 non-treated Falcon tissue
culture flasks.
E. histolytica Culture Maintenance
E. histolytica strain HM1:IMSS was used for all experiments. All media
formulations used in this study are based on TYI-S-33 medium56 and are designated as
follows: TYI glucose, standard TYI-S-33 medium (which contains 50 mM added
glucose); TYI basal, TYI-S-33 medium lacking added glucose (but which has ~0.5 mM
glucose remaining from the bovine serum); TYI acetate, TYI basal medium with sodium
acetate added to a final concentration of 62 mM; TYI propionate, TYI basal medium with
sodium propionate added to a final concentration of 24 mM; and TYI butyrate, TYI basal
medium with sodium butyrate added to a final concentration of 23 mM. E. histolytica
strain HM1:IMSS trophozoites were grown axenically at 37°C in 25 cm2 tissue culture
flasks containing 52 mL medium. Cells were passed into fresh medium approximately
every 3 days for standard maintenance.

68
Encystation
To induce encystation, trophozoites were seeded at 50,000 cells/mL into 25 cm2
tissue culture flasks containing 52 mL medium TYI basal or TYI medium containing the
indicated short chain fatty acid (acetate, propionate, or butyrate at the concentrations
indicated above) and incubated at 37°C for up to 168 hours unless noted otherwise. Time
courses for encystation were performed using replicate cultures with one culture from
each replicate harvested at each time point. Flasks were incubated on ice for 10 min and
cells were harvested by centrifugation at 500 x g for 5 min. Mature detergent-resistant
cysts were purified from trophozoites by treatment with phosphate buffered saline (PBS)
containing 0.1% sarkosyl (w/v) on ice for 10 min followed by two washes with tap water.
Three biological replicates were performed for each time course.
Excystation
To determine viability, cyst preparations were sarkosyl-treated as described
above, inoculated into TYI glucose medium, and incubated at 37°C. Excystation and
outgrowth to trophozoite form was monitored microscopically.
Staining and Fluorescence Microscopy
Propidium iodide staining. E. histolytica trophozoites or sarkosyl-treated cysts
were permeabilized with 70% cold ethanol at 4°C for 30 minutes, washed twice with
PBS, resuspended in PBS containing 0.2 mg/mL RNAse A, and stained with propidium
iodide (50 µg/mL). After staining between 15-20 minutes, cells were rinsed once with
PBS.

69
WGA-488 staining. E. histolytica trophozoites or sarkosyl-treated cysts were
stained with WGA-488 (10 mg/mL) for 20 minutes at ambient temperature with constant
rotation. The cells were then rinsed with PBS and fixed with 4% paraformaldehyde for 15
minutes.
Imaging. Stained cells were imaged using a Leica SPE microscope. Cell stained
with Calcofluor white, WGA-488, and propidium iodide were excited at 405 nm, 488 nm,
and 532 nm, respectively. Differential interference contrast (DIC) images were also
taken.
Flow Cytometry Analysis
Flasks were placed on ice for 10-15 minutes to release cells from the surface.
Trophozoites and cysts were harvested at 500 x g for 5 minutes and washed with 1x PBS.
For analysis of chitin production, cells were stained with 10 mg/mL AlexaFluor WGA-
488 for 15 minutes, rinsed with PBS, and fixed in 4% (v:v) paraformaldehyde in PBS for
15 minutes at ambient temperature. For analysis nuclear content, sarkosyl-treated cysts or
untreated trophozoites were ethanol fixed and stained with propidium iodide as described
above.
Fixed cells were rinsed, resuspended in PBS, and analyzed by flow cytometry
using a Cytoflex flow cytometer (Beckman Coulter Life Sciences, Indianapolis, Indiana).
A 488 nm laser was used for excitation of both AlexaFluor WGA-488 and propidium
iodide, and 100,000 events were collected for each sample. Flow cytometry data was
analyzed using FCS Express 6 Flow. A uniform gating strategy was applied to all

70
replicates to determine trophozoite and cyst populations. Three biological replicates were
used for each condition tested.
Results
Growth Conditions for Encystation
Encystation in E. invadens has traditionally been induced by growth at high cell
density under nutrient stress in hypoosmotic conditions. This is done by inoculating
trophozoites at 500,000 cells per mL into 0.47X diluted TYI-S-33 medium lacking added
glucose25,26. We similarly applied high cell density and nutrient stress to determine
whether E. histolytica can encyst in culture. We standardly culture E. histolytica HM1-
IMSS trophozoites in TYI-S-33 medium containing 50 mM added glucose (TYI glucose)
with 5,000 cells per mL inoculum and passage cells into fresh medium every 3-4 days.
For initial encystation trials, trophozoites were inoculated into TYI-S-33 medium lacking
added glucose (TYI basal) at a starting density of 50,000 cells per mL, approximately
ten-fold higher than our standard inoculum. Cultures were examined microscopically
every 24 hours and cell clumping was visible as early as 48 hours and was readily
apparent by 72 hours. Cells became rounder and decreased in size, and by 168 hours no
live trophozoites were visible and only rounded cysts and dead cell debris remained. To
ascertain that trophozoites had indeed undergone stage conversion to true cysts, we
assessed the four hallmarks of encystation: presence of a chitin cell wall, tetranucleation,
decreased cell size and roundedness, and detergent resistance15,27,31,32.

71
Tetranucleation
E. histolytica trophozoites have a single nucleus whereas mature cysts are
tetranucleate33,34. Immature cysts or cyst-like structures typically have one to three nuclei
13,14,33,35. We used propidium iodide staining to identify the number of nuclei in
trophozoites grown in TYI glucose medium versus sarkosyl-treated cysts from week old
encystation cultures grown in TYI basal medium. Propidium iodide staining revealed the
presence of a single nucleus in trophozoites, but cysts stained with propidium iodide had
multiple distinct nuclei. Representative images of a stained cyst and trophozoite are
shown in Figure 2.1A.
The increased nucleation in cysts versus trophozoites was also examined by flow
cytometry. Propidium iodide stained cysts clearly showed higher fluorescence intensity
than trophozoites (Figure 2.1B). This shift to higher fluorescence intensity represents
increased nuclear content in cysts as compared to trophozoites. Although the number of
nuclei present cannot be determined by the shift in fluorescence intensity, our flow
cytometry results taken together with our microscopy results are consistent with
production of tetranucleate cysts.
To assess the percentage of cysts with four or more nuclei, the number of nuclei
present in each of 100 cysts from three biological replicates were counted (Figure 2.1C).
We found that slightly over half of all cysts had four or more nuclei present (52.3 ± 3.3%
with 4-6 nuclei vs 47.7 ± 3.3% with 1-3 nuclei). Overall, 35.7 ± 1.7% of all cysts counted
were tetranucleate and the average number of nuclei present was 3.3 ± 0.1.

72
Figure 2.1: In vitro formed E. histolytica cysts are multinucleate. (A) Representative
image of E. histolytica trophozoites (top) and sarkosyl-treated cysts (bottom) stained with
propidium iodide for microscopic visualization of nuclei. Confocal images (left) and their
corresponding DIC images (right) are shown. (B) Flow cytometry analysis of propidium
iodide stained E. histolytica trophozoites (left) and sarkosyl-treated cysts (right).
Histograms display cell count versus fluorescence intensity and are representative. (C)

73
Number of nuclei per cyst. Cysts from three biological replicates were stained with
propidium iodide and nuclei in 100 cysts from each culture were manually counted.
Chitin Cell Wall
The presence of a chitin cell wall is a well-established hallmark of encystation in
Entamoeba36,37. To determine whether the in vitro cysts have a chitin cell wall, cyst
preparations were treated with AlexaFluor WGA-488, a wheat germ agglutinin that binds
to chitin. Confocal microscopy imaging revealed the absence of a chitin cell wall
surrounding the trophozoite but the presence of a chitin cell wall surrounding the cyst
(Figure 2.2A). Similar results were observed when cysts were stained with Calcofluor
White or Congo Red, both of which bind to chitin. Flow cytometry analysis of unstained
versus WGA-488 stained trophozoite and cyst populations revealed that unstained
trophozoites had a higher auto-fluorescence than cysts. Upon WGA-488 staining though,
the peak fluorescence of the cyst populations increased and that of the trophozoite
populations decreased (Figure 2.2B).

74
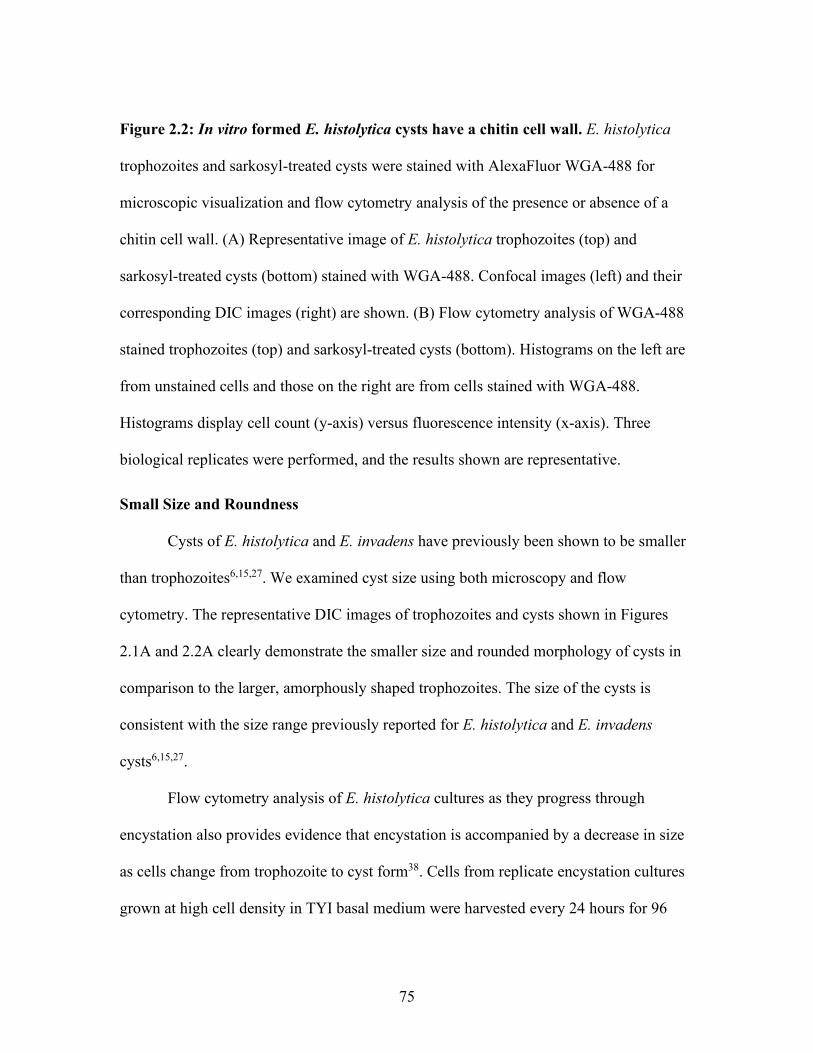
75
Figure 2.2: In vitro formed E. histolytica cysts have a chitin cell wall. E. histolytica
trophozoites and sarkosyl-treated cysts were stained with AlexaFluor WGA-488 for
microscopic visualization and flow cytometry analysis of the presence or absence of a
chitin cell wall. (A) Representative image of E. histolytica trophozoites (top) and
sarkosyl-treated cysts (bottom) stained with WGA-488. Confocal images (left) and their
corresponding DIC images (right) are shown. (B) Flow cytometry analysis of WGA-488
stained trophozoites (top) and sarkosyl-treated cysts (bottom). Histograms on the left are
from unstained cells and those on the right are from cells stained with WGA-488.
Histograms display cell count (y-axis) versus fluorescence intensity (x-axis). Three
biological replicates were performed, and the results shown are representative.
Small Size and Roundness
Cysts of E. histolytica and E. invadens have previously been shown to be smaller
than trophozoites6,15,27. We examined cyst size using both microscopy and flow
cytometry. The representative DIC images of trophozoites and cysts shown in Figures
2.1A and 2.2A clearly demonstrate the smaller size and rounded morphology of cysts in
comparison to the larger, amorphously shaped trophozoites. The size of the cysts is
consistent with the size range previously reported for E. histolytica and E. invadens
cysts6,15,27.
Flow cytometry analysis of E. histolytica cultures as they progress through
encystation also provides evidence that encystation is accompanied by a decrease in size
as cells change from trophozoite to cyst form38. Cells from replicate encystation cultures
grown at high cell density in TYI basal medium were harvested every 24 hours for 96

76
hours, stained with WGA-488, and subjected to flow cytometry analysis. As the cultures
progressed through encystation, a decrease in forward scatter was observed (Figure 2.3),
which is indicative of a decrease in size. Forward scatter decreased slightly by 48 hours
and continued to decrease over time. The cell count in the later time points decreased,
most likely indicating that a population of cells was unable to encyst and died. In
comparison, low-density, non-encysting cultures grown in TYI glucose medium did not
shown any change in cell size (Figure 2.3), as would be expected for non-encysting
trophozoites.
Figure 2.3: In vitro formed E. histolytica cysts are reduced in size versus
trophozoites. Flow cytometry analysis was performed on WGA-488 stained E.
histolytica from high-density encysting cultures (top) and low-density non-encysting
cultures (bottom). Analysis was performed at 24-hour intervals from 24 hours to 96

77
hours. Histograms display cell count (y-axis) versus forward scatter (x axis). Three
biological replicates were performed, and the results shown are representative.
Detergent Resistance
Cysts from E. invadens have been shown to be detergent resistant39,40, which is
considered a defining feature of true cysts. Treatment with 0.1% (w/v) sarkosyl is the
common method used to obtain uniform populations of E. invadens cysts38. We used a
similar treatment to demonstrate that our in vitro E. histolytica cysts are detergent
resistant. Flow cytometry analysis was performed on WGA-488 stained cyst preparations
without and with detergent treatment (Figure 2.4). A small reduction in the peak size and
a shift to slightly higher fluorescence were observed after detergent treatment, both of
which may be due to lysis of immature or defective cysts that had insufficiently
protective cell walls. Detergent treatment of trophozoites resulted in complete lysis of the
population (Figure 2.4). DIC imaging of sarkosyl-treated cysts revealed no signs of
damage (Figures 2.1A and 2.2A) and that the chitin cell wall remained intact (Figure
2.2A).

78
Figure 2.4. In vitro formed E. histolytica cysts are detergent resistant. Flow cytometry
analysis was performed on E. histolytica from high-density encysting cultures (top) and
low-density non-encysting cultures (bottom). Histograms from untreated cultures are
shown on the left and from sarkosyl-treated cultures on the right. Histograms display cell
count versus fluorescence intensity and are representative. Three biological replicates
were performed, and the results shown are representative.
Role of Cell Density in Encystation
We first observed E. histolytica cells with cyst morphology in older cultures (7-10
days) inoculated in TYI basal medium at low cell density (~5,000 trophozoites/mL) but
not in cultures grown in TYI glucose medium. When we inoculated at a higher cell
density of 50,000 trophozoites/mL, cells exhibiting a cyst morphology were apparent by
79
~48 hours and became prevalent by 72 hours. These observations and the fact that
encystation of E. invadens is routinely elicited by culturing trophozoites in diluted TYI
basal medium at a very high initial cell density of 500,000 trophozoites/mL suggest that
cell density and nutrient deprivation play a role in eliciting encystation25,26.
To investigate the impact of cell density on the rate and efficiency of encystation,
we inoculated TYI basal medium at different cell densities and followed entry into
encystation by monitoring chitin cell wall formation by flow cytometry. Replicate
cultures were inoculated at starting cell densities of 10,000, 25,000, 50,000, and 100,000
trophozoites/mL into TYI basal medium (designated hereafter as 10Kbasal, 25Kbasal,
50Kbasal, and 100Kbasal cultures). One culture from each replicate at each starting cell
density was harvested every 24 hours up to 96 hours and then at 168 hours when cultures
were expected to be fully encysted. Three biological replicates were performed for each
starting cell density. Harvested cells were stained with WGA-488 and analyzed by flow
cytometry. The progression toward encystation was monitored by the appearance of a
peak of higher fluorescence intensity, indicative of deposition of the characteristic chitin
cell wall. The lower and higher fluorescence intensity peaks are hereafter referred to as
the trophozoite and cyst peaks.
As seen in the representative histograms shown in Figure 2.5, cultures inoculated
at higher cell densities progressed more quickly toward encystation than cultures
inoculated at lower cell densities. For the 100Kbasal cultures, a shoulder appearing on the
trophozoite peak signals the start of encystation. By 72 hours, the trophozoite peak was
nearly depleted and replaced by the cyst peak. The lower density cultures did not show

80
any shift in the trophozoite peak at 48 hours. By 72 hours, a cyst peak was present for
both the 25Kbasal and 50Kbasal cultures, with the 50Kbasal cultures having a larger
peak. A cyst peak was not observed in the lowest density 10Kbasal cultures until 96
hours post-inoculation. All cultures reached full encystation, as judged by the single high
fluorescence intensity cyst peak and the absence of the lower fluorescence intensity
trophozoite peak. Interestingly, the single peak observed for the 10Kbasal cultures had
slightly lower fluorescence intensity than that for the other cultures at this time point
which may be indicative of immature or defective cysts.

81
Figure 2.5: Effect of starting cell density on encystation. Replicate E. histolytica
cultures inoculated at 10,000, 25,000, 50,000, or 100,000 trophozoites/mL into TYI basal
medium were harvested at 24-hour intervals, stained with WGA-488, and analyzed by
flow cytometry. Histograms display cell count (y-axis) versus fluorescence intensity (x-
axis). Three biological replicates were performed, and the results shown are
representative.
The effect of starting cell density on the efficiency and rate of encystation was
quantitated from the flow cytometry data represented in Figure 2.5. The efficiency of
encystation was calculated as the number of encysting cells (defined as cells with a chitin
cell wall) divided by the starting number of trophozoites. As shown in Figure 2.6A,
efficiency of encystation increased with increasing starting cell density. The 100Kbasal

82
cultures reached nearly 40% efficiency versus just 15% efficiency for the 10Kbasal
cultures. The lower density cultures also showed a lag before encystation was detected,
suggesting that cultures may need to reach a certain cell density before encystation is
triggered.
The rate of encystation, calculated as the number of encysting cells divided by the
total number of cell (trophozoites + cysts), was also influenced by cell density (Figure
2.6B). Although all the cultures reached a high level of encystation in the live cell
population, the rate at which cultures achieved this differed depending on cell density.
Notably, all the cultures reached a high percentage of cysts in the live population
regardless of starting cell density. Overall, comparison of the percentage of cysts from
the starting cell population versus the percentage of cysts in the live cell population
indicates that not all trophozoites were able to encyst when faced with nutrient
deprivation and many died.

83
Figure 2.6: Effect of cell density on efficiency and rate of encystation. The efficiency
and rate of encystation were calculated from flow cytometry analysis of E. histolytica
cultures inoculated at 10,000, 25,000, 50,000, or 100,000 trophozoites/mL. Efficiency of
encystation was calculated as the number of encysting cells (defined as cells with a chitin
cell wall) divided by the starting number of trophozoites. Rate of encystation was
calculated as the number of encysting cells divided by the total number of cells
(trophozoites + cysts). Results shown are the mean and standard deviation from three
biological replicates. Symbols: , 10,000 cells/mL; , 25,000 cells/mL; , 50,000
cells/mL; , 100,000 cells/mL. (A) Efficiency and (B) rate of encystation during growth

84
in TYI basal medium. (C) Efficiency and (D) rate of encystation during growth in TYI
prop medium.
Effect of Short Chain Fatty Acids on Encystation
Short chain fatty acids (SCFAs) are prevalent in the large intestine due to the
metabolic activity of the gut microbiome41,42. The total SCFA concentration in the large
intestine is approximately 100-120 mM with relative ratios of 57:22:21
(acetate:propionate:butyrate) for all regions of the large intestine41. Acetate has been
proposed to be absorbed through the intestinal wall to the portal vein and the colon
epithelium metabolizes butyrate41,43, making propionate perhaps the most readily
available SCFA for utilization by E. histolytica. Furthermore, the addition of propionate
to TYI basal medium supported additional growth versus the addition of acetate or
butyrate. Thus, we first tested the effect of propionate on encystation and found in our
initial trials that propionate appeared to enhance encystation.
We proceeded to quantitate the effect of propionate on encystation using a similar
approach as described above except trophozoites were inoculated into TYI basal medium
containing 24 mM sodium propionate final concentration (designated as TYI propionate).
TYI propionate cultures are hereafter designated as 10Kprop, 25Kprop, 50Kprop, and
100Kprop. Representative flow cytometry histograms are shown in Figure 2.7.

85
Figure 2.7: Effect of the short chain fatty acid propionate on encystation. Replicate
E. histolytica cultures inoculated at different cell densities into TYI prop medium were
harvested at 24-hour intervals, stained with WGA-488, and analyzed by flow cytometry.
Histograms display cell count (y-axis) versus fluorescence intensity (x-axis). Three
biological replicates were performed, and the results shown are representative.

86
For the 100Kprop cultures the cyst peak was visibly larger at 48 hours than the
100Kbasal cultures (Figure 2.5 vs Figure 2.7), suggesting that cells entered encystation
earlier but that this was density dependent. Surprisingly, the histogram did not resolve to
a single cyst peak as quickly in the 100Kprop cultures as in the 100Kbasal cultures
(compare 96 and 168 hours in Figure 2.5 versus Figure 2.7). This was also apparent in the
lower density cultures.
There was a strong reduction in the trophozoite peak in the TYI basal cultures
between the 48-hour and 72-hour time points that was not observed for the TYI
propionate cultures (Figure 2.5 versus Figure 2.7). Although the trophozoite peak was
reduced at the 72-hour versus 48-hour time point for the 100Kprop cultures, this was
accompanied by a greater increase in the cyst peak as compared to the 100Kbasal
cultures. Likewise, the disappearance of the trophozoite peak at 96 hours for the
25Kprop, 50Kprop, and 100Kprop cultures was accompanied by an increase in the cyst
peak. These observations taken together suggest that encysting cultures may experience a
die-off, with only a proportion of trophozoites able to progress into encystation. The
presence of propionate appears to increase the number of trophozoites able to enter
encystation.
Comparison of the flow cytometry histograms from cultures grown in TYI basal
medium versus TYI propionate medium (Figure 2.5 vs Figure 2.7) suggests that the
presence of propionate affected both entry into and progression of encystation at the
population level but that these effects were density dependent. Analysis of the efficiency
of encystation showed that TYI propionate cultures inoculated at higher cell densities had

87
a faster increase in the number of cells that entered encystation (Figure 2.6C) but that the
overall rate of encystation was similar by 168 hours (Figure 2.6D). It is interesting to note
that the 10Kprop cultures experienced a lag in entering encystation but once encystation
began at between 72 and 96 hours it increased linearly through the 168-hour timepoint as
compared to the higher density 25Kprop, 50Kprop, and 100Kprop cultures for which the
rise in encysting cells began to level off after 96 hours. Results from Figure 2.6 showing
the rate and efficiency of encystation in the absence and presence of propionate (TYI
basal versus TYI propionate medium) in cultures with a starting cell density of 5 x 10⁴
cells/mL are replotted in Figure 2.8 for direct comparison. Although the presence of
propionate increased the efficiency of encystation, it had no effect on the rate of
encystation at this high starting cell density.

88
Figure 2.8: Effect of propionate on efficiency and rate of encystation. The efficiency
(A) and rate (B) of encystation were calculated from flow cytometry analysis of E.
histolytica cultures inoculated at 50,000 trophozoites/mL in either TYI basal medium ()
or TYI prop medium (). Efficiency of encystation was calculated as the number of
encysting cells (defined as cells with a chitin cell wall) divided by the starting number of
trophozoites. Rate of encystation was calculated as the number of encysting cells divided
by the total number of cells (trophozoites + cysts). Results shown are the mean and
standard deviation from three biological replicates. These data are taken from Figure 2.6.
89
To compare the effects of the SCFAs acetate, propionate, and butyrate on
encystation, we compared the appearance of the cyst peak at 48 hours and the overall
level of encystation as described above in cultures inoculated at 50,000 trophozoites/mL
in TYI basal medium or TYI basal medium containing 62 mM acetate, 24 mM
propionate, or 23 mM butyrate, representing concentrations similar to those found in the
colon41. Representative histograms from three biological replicates are shown in Figure
2.9 and indicate that the addition of acetate had the strongest effect, with the largest
proportion of the population having entered encystation by 48 hours. All four conditions
produced a strong cyst peak by 168 hours, suggesting that although acetate may have
induced earlier entry into encystation the overall level of encystation was generally
unaffected.

90
Figure 2.9: Short chain fatty acids speed entry into encystation. Replicate E.
histolytica encystation cultures grown in TYI basal medium or TYI basal medium
supplemented with 62 mM acetate, 24 mM propionate, or 23 mM butyrate were
harvested at 48 hours and 168 hours post-inoculation, stained with WGA-488, and
analyzed by flow cytometry. Histograms display cell count versus fluorescence intensity.
Three biological replicates were performed, and the results shown are representative.

91
Cyst Viability
Cysts from one-week encystation cultures were detergent-treated and inoculated
into standard TYI glucose medium to determine if the cyst population was able to excyst
and establish a growing culture. This treatment lysed all trophozoites in the control
culture (not shown). Cysts were inoculated into 4 mL medium per well in a 12-well
culture plate, in triplicate, and the plate was sealed and incubated at 37°C for five days.
Daily microscopic observations were performed and trophozoites were harvested at 5
days post inoculation and counted. Microscopic observation revealed the presence of the
first few trophozoites by 24 hours post inoculation and trophozoites became more
abundant by 48 hours. By day 5 the cultures were nearly confluent, with 8.9 (± 1.7) x 105
trophozoites per mL, representing a minimum of 9 doublings for each cyst that excysted
to trophozoite form. These results demonstrate that our method for inducing encystation
of E. histolytica in laboratory culture produced viable cysts that are capable of stage
conversion back to proliferative trophozoite form.
Discussion
Until now, reproducible encystation of E. histolytica in the laboratory had not
been documented and previous studies on encystation in E. histolytica identified cyst-like
structures that showed some but not all the hallmarks of cysts. Because of this, studies on
encystation have instead relied on the distantly related reptilian species E. invadens.
Stress conditions including crowding and nutrient depletion have long been thought to be
cues for encystation and glucose deprivation has been well-established as a signal for
encystation in E. invadens12,25,26. Here, we have shown that high cell density and nutrient

92
stress were able to induce true and reproducible encystation in E. histolytica.
Trophozoites grown at high cell density in a low glucose medium were fully encysted by
168 hours (1 week) post-inoculation. These cysts displayed the four hallmarks of true
cysts and were viable to undergo excystation back to the growing trophozoite form.
Tetranucleation
This hallmark is the only defining characteristic of encystation that is not
conferred by the production of chitin. As E. histolytica undergoes stage conversion within
the colon, the nuclei begin dividing. Trophozoites that begin encysting during the G1/G0
phase of the cell cycle form cysts at a 1:1 ratio in which one trophozoite produces one
cyst. Cells that begin encysting later in the progression of the cell cycle produce cysts at a
1:2 ratio45. Cells switch from the mitotic cycle into the developmental endopolyploid
replication cycle in which DNA replication occurs without cell division, resulting in a
tetraploid cyst46. Ganguly and Lohia47 examined DNA content during growth and
encystation in E. invadens in which they observed a decrease in 1n and 2n containing
cells and a simultaneous increase in the number of 4n containing cells as encystation
progressed. They found that the DNA content of cysts varied from 4n to 8n or more. E.
histolytica is frequently polyploid, with DNA content of individual nuclei varying
several-fold45.
Chitin Cell Wall
Chitin production has been one of the most extensively examined aspects of cyst
formation and is the most readily measurable component of the encystation process. The
chitin cell wall provides protection against environmental challenges faced by a cyst

93
outside of the human host, including increased oxygen exposure, nutrient deprivation,
and mechanical stressors. The major components of this E. histolytica cyst wall are chitin
and the chitin-binding lectins Jacob, Jessie, and chitinase44. Each component is vital, and
a “Wattle and Daub” model of the Entamoeba cyst wall was proposed wherein the chitin,
crosslinked by Jacob, is filled in with Jessie lectins37, creating an effectively impenetrable
coat around the parasite. Without this protection, parasite transmission and survival
would not be possible.
We demonstrated that the in vitro cysts were uniformly fluorescent when stained
with WGA-488, indicating the presence of a chitin cell wall fully encasing the cyst. As
expected, WGA-488 did not bind to trophozoites due to the absence of a chitin cell wall
when E. histolytica is in its amoebic form and no fluorescent shell was observed. In flow
cytometry analysis of WGA-488 stained trophozoite and cyst populations, cysts
displayed a distinct right-shifted peak of higher fluorescence intensity versus
trophozoites. A time course of encysting cultures demonstrated that encystation was
asynchronous, as the increase in the higher fluorescence intensity cyst peak was
accompanied by a decrease in the lower fluorescence intensity trophozoite peak and that
this shift was gradual over the one-week time period. This is not surprising, as
encystation in the human colon must also be asynchronous since infected persons shed
millions of cysts daily while still maintaining an active infection9,15,27. This can only
occur if only a subpopulation of trophozoites colonizing the colon progresses to
encystation at any given time.

94
Small, Rounded Morphology and Detergent Resistance
As E. histolytica encysts, cell morphology is altered from an amoeboid form to a
smaller, rounded morphology27. This notable change in shape and size coincides with
increased expression of chitin synthase and is the result of the encasement in the
chitinous cell wall36. Our microscopy images and flow cytometry analysis confirmed that
the in vitro cysts were smaller than trophozoites and had a rounded rather than amoeboid
morphology. Flow cytometry results also indicated that the cyst population had a more
uniform size and shape.
Like rounded shape, detergent resistance is also conferred by the chitin cell wall.
The β-(1,4)-linked N-acetylglucosamine (GlcNAc) polymeric structure of the chitin cell
wall provides resistance to harmful environmental stressors and resistance to disruption
from strong detergents39,40. The in vitro cysts were found to be resistant to treatment with
0.1% sarkosyl (w/v), as expected for true cysts, and microscopic imaging revealed little
visible damage.
Cyst Viability
Our demonstration that detergent-treated cysts introduced back into standard TYI
glucose produced actively growing trophozoites confirmed that our in vitro encystation
method produced viable E. histolytica cysts. We did not determine the percentage of
viable cysts as the excystation conditions used have not been optimized and excystation
was not synchronous. Cultures of trophozoites produced by excystation of in vitro cysts
were able to encyst once again (I. Bastuzel, personal communication), demonstrating that
completion of the developmental cycle between trophozoite and cyst and back again is
95
sustainable in cysts produced by the methods described here. Optimization of excystation
conditions and determination of environmental signals for excystation will be
investigated separately and are beyond the scope of the study described herein.
Nutrient Stress and Density Dependence
Having established that viable cysts were formed that exhibited all four of
established hallmarks of true cysts, we were able to begin to evaluate the effect of
different environmental signals such as nutrient stress and cell density. Signals that
induce differentiation into either phase of life are necessary to maintain infection, both
through maintenance of parasite numbers within the host and propagation of infection to
other hosts15. Stress conditions including glucose deprivation, high cell density, and
osmotic stress have been shown to be important signals for encystation in E. invadens in
vitro15,25-27,49. Cell aggregation, medicated by gal-terminated ligands, is reported to be a
prerequisite for encystation in Entamoeba parasites50, so it is perhaps not surprising that
high cell density plays a role.
Although encystation in E. invadens in culture was reported in 196251, the effect
of cell density on encystation was not investigated until 1984 when Vazquezdelara-
Cisneros and Arroyo-Begovich found that starting cell density affected both the time at
which initial signs of encystation were observed as well as final cyst yield26. Increased
starting cell density lowered the time of appearance of cysts to as early as 7 hours post
inoculation at the highest starting cell densities of 5 x 10⁵ to 1 x 10⁶ cells/mL. The highest
cyst yield was observed with 5 x 10⁵ cells/mL but decreased at 1 x 10⁶ cells/mL starting
inoculum.

96
We examined the effect of cell density on encystation in E. histolytica using
starting cell densities ranging from 1 x 10⁴ to 1 x 10⁵ trophozoites/mL. Our findings
demonstrated that starting cell density influenced both the efficiency and rate of
encystation. At 168 hours post inoculation, at which time cysts were found to be
detergent resistant and judged to be fully mature, the highest overall efficiency of ~40%
was observed with cultures inoculated at the highest starting cell density. Although the
final overall rate did not differ substantially between cultures with the three highest
starting cell densities, the cultures with the lowest starting cell density did show a
decreased rate. Overall, the rate of encystation ranged from ~60% to ~90%. The effects
on the rate and efficiency of encystation taken together suggest that only a subset of the
trophozoite population was able to enter encystation upon nutrient deprivation. Those
cells that were able to begin encystation were highly successful in completing stage
conversion to produce mature cysts. The subset that was unable to encyst died, and
perhaps served as a nutrient source to allow encysting cells to complete the process.
Encystation of only a subpopulation of trophozoites at any given time is critical
for maintaining colonization and infection in vivo. Asymptomatic carriers and patients
experiencing symptomatic disease shed millions of cysts daily while maintaining
colonization. Our results show cell density plays a key role in encystation in E. histolytica
as in E. invadens. This could be a means for regulating encystation in vivo by allowing
encystation to occur only once a certain threshold level of cells had been achieved and by
maintaining that threshold level to ensure that colonization continues.

97
Effect of Short Chain Fatty Acids
We also examined the effect of the short chain fatty acids (SCFAs) acetate,
propionate, and butyrate on encystation in E. histolytica. In the colon, the site of E.
histolytica colonization, the total SCFA concentration is ~100-120 mM42 with a relative
ratio of 57:22:21 for acetate, propionate, and butyrate, respectively41. In our initial studies
we focused on the effect of propionate on encystation because we found in trial
experiments that the addition of propionate to TYI basal medium increased growth unlike
acetate or butyrate (T. Dang and C. Ingram-Smith, personal communication). We found
that the final rate of encystation in the presence of propionate was similar for all starting
cell densities, but that propionate had differing effects on efficiency depending on the
initial cell density. Although the cultures at the lowest starting cell density lagged for at
least 72 hours before encystation began, a rapid increase was observed after that period
and continued through 168 hours post inoculation and perhaps would have reached an
even higher efficiency at later time points.
When we compared the effect of propionate on encystation at a single cell
density, we found that the efficiency but not rate of encystation was enhanced by the
presence versus absence of propionate. This may be due to the ability of E. histolytica to
utilize propionate as a growth substrate in the absence of added glucose (T. Dang and C.
Ingram-Smith, personal communication), thus allowing cultures to reach a critical cell
density for more optimal encystation. Propionate may act to first stimulate growth and
then encystation, providing an additive signal for encystation to low glucose-induced
nutrient stress.

98
We compared the effects of acetate, propionate, and butyrate on encystation. We
found that only propionate but not acetate or butyrate can support growth of E. histolytica
when added to TYI basal medium (T. Dang and C. Ingram-Smith, personal
communication). However, in this study, we discovered that the addition of acetate had
the strongest effect on entry into encystation followed by propionate; butyrate had little
effect on entry into encystation. Although the addition of acetate and propionate appeared
to induce earlier entry into encystation, the overall level of encystation was generally
unaffected by the addition of SCFAs. Whether this earlier entry into encystation was
acetate-specific or due to the higher concentration of acetate versus propionate was not
investigated, but the observation that propionate had a more enhanced effect on entry into
encystation than butyrate even though both were added at similar concentrations suggests
that the effect is based on which SCFA was used rather than the concentration.
Our results showing that the SCFAs acetate and propionate influence encystation
in E. histolytica contrast with those for E. invadens. Byers et al.52 found that the addition
of butyrate to 10 mM final concentration in TYI basal medium had no effect on growth of
E. invadens, and the addition of acetate, propionate, and butyrate at a 70:20:10 mM ratio
slightly inhibited growth. The presence of SCFAs inhibited E. invadens encystation in
encystation medium (TYI basal medium diluted to 47% concentration) in a dose-
dependent manner, with propionate and butyrate having a more potent effect than acetate.
The presence of all three SCFAs at a final concentration of ~6 mM total SCFA in a
70:20:10 ratio (acetate:propionate:butyrate) inhibited encystation by 50% and full
inhibition was observed at normal physiological concentrations (~100 mM total final
99
concentration). SCFA concentrations in herbivorous reptiles have been shown to be 71-
77 mM acetate, 12-14 mM propionate, and 8-12 mM butyrate53-55, which are a similar
range to those observed in humans. This suggests that the signals for encystation only
partially overlap for E. histolytica and E. invadens.
Concluding Remarks
We have developed the first reproducible method for encystation of E. histolytica
in laboratory culture that produces viable cysts exhibiting all four hallmarks of true cysts.
Although the reptile pathogen E. invadens has been used as a model for encystation, the
genetic differences between the two species is a major limitation. This was demonstrated
directly by our finding that short chain fatty acids, which were previously shown to
inhibit encystation of E. invadens, enhanced entry into encystation for E. histolytica. The
ability to reproducibly produce E. histolytica cysts in an in vitro system is a critical
research advancement that now allows us to investigate the full life cycle of this human
pathogen in a laboratory setting and to begin to elucidate, among other things, the signals
for stage conversion, which plays a critical role in disease transmission.

100
References
1. Ximenez C, Moran P, Rojas L, Valadez A, Gomez A. Reassessment of the
epidemiology of amoebiasis: State of the art. Infect, Genet Evol. 2009;9:1023-32.
2. Centers for Disease Control and Prevention. Amebiasis.
https://www.cdc.gov/parasites/amebiasis/general-info.html (2015).
3. Entamoeba taxonomy. Bull World Health Organ. 1997;75(3):291-4.
4. Verkerke HP, Petri WA, Marie CS. The dynamic interdependence of amebiasis,
innate immunity, and undernutrition. Semin Immunopathol. 2012;34:771-85.
5. Baxt LA, Singh U. New insights into Entamoeba histolytica pathogenesis. Curr
Opin Infect Dis. 2008;21(5):489-94.
6. Schaap P, Schilde C. Encystation: the most prevalent and underinvestigated
differentiation pathway of eukaryotes. Microbiology. 2018;164(5):727-39.
7. Organization WH. Amoebiasis. Weekly Epidemiological Record. 1997;72:97-
100.
8. WHO, PAHO, & UNESCO. Report: a consultation with experts on amoebiasis.
Epidemiological Bulletin/PAHO. 1997;18:13-4.
9. Beaver PC, Jung RC, Read TR, Robinson TA, Sherman HJ. Experimental
Entamoeba histolytica infections in man. Am J Trop Med Hyg. 1956;5(6):1000-9.
10. Stanley SL, Jr. Amoebiasis. Lancet. 2003;361(9362):1025-34.
11. Haque R, Huston CD, Hughes M, Houpt E, Petri WA, Jr. Amebiasis. N Engl J
Med. 2003;348(16):1565-73.
101
12. Segovia-Gamboa NC, Talamas-Rohana P, Angel-Martinez A, Cazares-Raga FE,
Gonzalez-Robles A, Hernandez-Ramirez VI, et al. Differentiation of Entamoeba
histolytica: a possible role for enolase. Exp Parasitol. 2011;129(1):65-71.
13. Aguilar-Diaz H, Diaz-Gallardo M, Laclette JP, Carrero JC. In vitro induction of
Entamoeba histolytica cyst-like structures from trophozoites. PLoS Negl Trop
Dis. 2010;4(2):e607.
14. Barron-Gonzalez MP, Villarreal-Trevino L, Resendez-Perez D, Mata-Cardenas
BD, Morales-Vallarta MR. Entamoeba histolytica: cyst-like structures in vitro
induction. Exp Parasitol. 2008;118(4):600-3.
15. Eichinger D. Encystation in parasitic protozoa. Current Opinion in Microbiology.
2001;4:421-6.
16. Singh U, Ehrenkaufer GM. Recent insights into Entamoeba development:
identification of transcriptional networks associated with stage conversion. Int J
Parasitol. 2009;39(1):41-7.
17. Burgess SL, Leslie JL, Uddin J, Oakland DN, Gilchrist C, Moreau GB, et al. Gut
microbiome communication with bone marrow regulates susceptibility to
amebiasis. J Clin Invest. 2020.
18. Gilchrist CA, Houpt E, Trapaidze N, Fei Z, Crasta O, Asgharpour A, et al. Impact
of intestinal colonization and invasion on the Entamoeba histolytica
transcriptome. Mol Biochem Parasitol. 2006;147(2):163-76.
19. Burgess SL, Buonomo E, Carey M, Cowardin C, Naylor C, Noor Z, et al. Bone
marrow dendritic cells from mice with an altered microbiota provide interleukin

102
17A-dependent protection against Entamoeba histolytica colitis. mBio.
2014;5(6):e01817.
20. Abhyankar MM, Shrimal S, Gilchrist CA, Bhattacharya A, Petri WA, Jr. The
Entamoeba histolytica serum-inducible transmembrane kinase EhTMKB1-9 is
involved in intestinal amebiasis. Int J Parasitol Drugs Drug Resist. 2012;2:243-8.
21. Huston CD, Petri WA. Amebiasis: Clinical implications of the recognition of
Entamoeba dispar. Curr Infect Dis Rep. 1999;1(5):441-7.
22. Said-Fernandez S, Mata-Cardenas BD, Gonzalez-Garza MT, Navarro-Marmolejo
L, Rodriguez-Perez E. Entamoeba histolytica cysts with a defective wall formed
under axenic conditions. Parasitol Res. 1993;79(3):200-3.
23. Rengpien S, Bailey GB. Differentiation of Entamoeba: a new medium and
optimal conditions for axenic encystation of E. invadens. J Parasitol.
1975;61(1):24-30.
24. Thepsuparungsikul V, Seng L, Bailey GB. Differentiation of Entamoeba:
encystation of E. invadens in monoxenic and axenic cultures. J Parasitol.
1971;57(6):1288-92.
25. Avron B, Stolarsky T, Chayen A, Mirelman D. Encystation of Entamoeba
invadens IP-1 is induced by lowering the osmotic pressure and depletion of
nutrients from the medium. J Protozool. 1986;33(4):522-5.
26. Vazquezdelara-Cisneros LG, Arroyo-Begovich A. Induction of encystation of
Entamoeba invadens by removal of glucose from the culture medium. J Parasitol.
1984;70(5):629-33.

103
27. Eichinger D. Encystation of Entamoeba parasites. Bioessays. 1997;19(7):633-9.
28. Richards CS, Goldman M, Cannon LT. Cultivation of Entamoeba histolytica and
Entamoeba histolytica-like strains at reduced temperature and behavior of the
amebae in diluted media. Am J Trop Med Hyg. 1966;15(4):648-55.
29. Ehrenkaufer GM, Weedall GD, Williams D, Lorenzi HA, Caler E, Hall N, et al.
The genome and transcriptome of the enteric parasite Entamoeba invadens, a
model for encystation. Genome Biol. 2013;14(7):R77.
30. Ali IK, Haque R, Siddique A, Kabir M, Sherman NE, Gray SA, et al. Proteomic
analysis of the cyst stage of Entamoeba histolytica. PLoS Negl Trop Dis.
2012;6(5):e1643.
31. Mirelman D, Avron B. Cyst formation in Entamoeba. In: Ravdin JI, editor.
Amebiasis: Human infection by Entamoeba histolytica. New York: Wiley
Medical Publications; 1988. p. 768-81.
32. Lopez-Romero E, Villagomez-Castro JC. Encystation in Entamoeba invadens.
Parasitol Today. 1993;9(6):225-7.
33. Tanyuksel M, Petri WA. Laboratory diagnosis of amoebiasis. Clinical
Microbiology Reviews. 2003;16:713-29.
34. Clark CG, Espinosa-Cantellano M, Bhattacharya A. Entamoeba histolytica: an
overview of the biology of the organism. In: Radvin JI, editor. Amebiasis. Series
on Tropical Medicine. London: Imperial College Press; 2000. p. 1-45.

104
35. Luna-Nacar M, Navarrete-Perea J, Moguel B, Bobes RJ, Laclette JP, Carrero JC.
Proteomic study of Entamoeba histolytica trophozoites, cysts, and cyst-Like
Structures. PLoS One. 2016;11(5):e0156018.
36. Campos-Gongora E, Ebert F, Willhoeft U, Said-Fernandez S, Tannich E.
Characterization of chitin synthases from Entamoeba. Protist. 2004;155(3):323-
30.
37. Chatterjee A, Ghosh SK, Jang K, Bullitt E, Moore L, Robbins PW, et al. Evidence
for a "wattle and daub" model of the cyst wall of Entamoeba. PLoS Pathog.
2009;5(7):e1000498.
38. Welter BH, Sehorn MG, Temesvari LA. Flow cytometric characterization of
encystation in Entamoeba invadens. Mol Biochem Parasitol. 2017;218:23-7.
39. Arroyo-Begovich A, Carabez-Trejo A. Location on chitin in the cyst wall of
Entamoeba invadens with colloidal gold tracers. J Parasitol. 1982;68(2):253-8.
40. Arroyo-Begovich A, Carabez-Trejo A, Ruiz-Herrera J. Identification of the
structural component in the cyst wall of Entamoeba invadens. J Parasitol.
1980;66(5):735-41.
41. Cummings JH, Pomare EW, Branch WJ, Naylor CP, Macfarlane GT. Short chain
fatty acids in human large intestine, portal, hepatic and venous blood. Gut.
1987;28(10):1221-7.
42. Cummings JH, MacFarlane GT. Role of intestinal bacteria in nutrient metabolism.
Clin Nutr. 1997;16:3-11.

105
43. Roediger WE. Role of anaerobic bacteria in the metabolic welfare of the colonic
mucosa in man. Gut. 1980;21(9):793-8.
44. Makioka A, Kumagai M, Hiranuka K, Kobayashi S, Takeuchi T. Different
structure and mRNA expression of Entamoeba invadens chitinases in the
encystation and excystation. Parasitol Res. 2011;109(2):417-23.
45. Mukherjee C, Clark CG, Lohia A. Entamoeba shows reversible variation in
ploidy under different growth conditions and between life cycle phases. PLoS
Negl Trop Dis. 2008;2(8):e281.
46. Niculescu VF. Developmental and non developmental polyploidy in xenic and
axenic cultured stem cell lines of Entamoeba invadens and Entamoeba histolytica.
Insights Stem Cells. 2016;2:1-10.
47. Ganguly A, Lohia A. The cell cycle of Entamoeba invadens during vegetative
growth and differentiation. Mol Biochem Parasitol. 2001;112(2):277-85.
48. Garcia-Zapien AG, Hernandez-Gutierrez R, Mora-Galindo J. Simultaneous
growth and mass encystation of Entamoeba invadens under axenic conditions.
Arch Med Res. 1995;26(3):257-62.
49. Bailey GB, Rengypian S. Osmotic stress as a factor controlling encystation of
Entamoeba invadens. Arch Invest Med (Mex). 1980;11(1 Suppl):11-6.
50. Mi-Ichi F, Yoshida H, Hamano S. Entamoeba encystation: new targets to prevent
the transmission of amebiasis. PLoS Pathog. 2016;12(10):e1005845.
51. Balamuth W. Effects of some environmental factors upon growth and encystation
of Entamoeba invadens. J Parasitol. 1962;48:101-9.

106
52. Byers J, Faigle W, Eichinger D. Colonic short-chain fatty acids inhibit encystation
of Entamoeba invadens. Cell Microbiol. 2005;7(2):269-79.
53. Barboza PS. Digesta passage and functional anatomy of the digestive tract in the
desert tortoise (Xerobates agassizii). J Comp Physiol. 1995;165:193-202.
54. Bjorndal KA, Bolten AB. Digestive processing in a herbivorous freshwater turtle:
consequences of small intestine fermentation. Physiol Zool. 1990;63:1232-47.
55. Bjorndal KA. Cellulose digestion and volatile fatty acid production in the green
turtle, Chelonia mydas. Comp Biochem Physiol. 1979;63A:127-33.
56. Diamond LS. Techniques of axenic cultivation of Entamoeba histolytica
Schaudinn, 1903 and E. histolytica-like amebae. J Parasitol. 1968;54(5):1047-56.

107
CHAPTER THREE
GLYCOGEN METABOLISM IN ENTAMOEBA HISTOLYTICA
Jordan Wesel and Cheryl Ingram-Smith
Abstract
Entamoeba histolytica is a parasitic protozoan that impacts approximately 90
million people worldwide every year. E. histolytica is transmitted via the oral-fecal route,
spreading through the ingestion of the infectious cyst in contaminated food or water and
then excysting to the proliferative trophozoite form in the small intestine. Trophozoites
colonize the large intestine where glucose is scarce. Glycogen synthesis in the high
glucose environment of the small intestine may be critical for the growth and
proliferation of the parasite. Glycogen is used as both an energy storage molecule and a
precursor to chitin during encystation. Here, we used RNAi gene silencing of glycogen
synthase or glycogen phosphorylase to inhibit glycogen synthesis and glycogen
breakdown, respectively. We showed that these knockdowns prevented cells from
properly accumulating or breaking down glycogen, respectively. Both these impediments
affect growth and encystation. Additionally, we examined trophozoite gene expression
and glycogen content to assess their impact on parasite survival. Here, we show that
glycogen synthesis and degradation are vital to the growth and adaptation of the parasite
to a low glucose environment.

108
Introduction
Entamoeba histolytica is a parasitic protozoan and the causative agent of amoebic
dysentery and amebiasis in humans. This parasite is transmitted via the oral-fecal route,
and as such is common in nations without proper water treatment and waste disposal
infrastructure1. E. histolytica infection is widespread, with nearly 90 million people
across the world contracting symptomatic infection2. This is only a small portion of the
actual number of E. histolytica infections, as an estimated 90% of infections are
asymptomatic3,4. Asymptomatic individuals act as carriers that shed millions of parasites
a day to further spread disease5,6. While most infections remain localized to the intestine,
invasive amebiasis can also occur, and 50-100,000 individuals die from amoebic liver
abscess every year7.
Disease transmission occurs when E. histolytica is shed from the host intestine as
an infective cyst2. It remains dormant and inert until such time as it is ingested and
emerges into a proliferative trophozoite in the small intestine2. The infectious dose is
reported to be approximately 1,000 cysts1. The cysts undergo excystation to produce
infectious trophozoites, which reside primarily in the colon. In order to continue
transmission, some E. histolytica trophozoites encyst in the large intestine, although the
signals that induce these processes are unknown. Carriers shed up to 45 million cysts a
day, propagating transmission1.
Despite the significant global burden of this disease, study of E. histolytica has
been impeded by the lack of an E. histolytica model for encystation8. E. histolytica
trophozoites can be readily cultured axenically in the lab, but no published process exists

109
to induce E. histolytica encystation in axenic culture. Researchers have instead
historically utilized Entamoeba. invadens, a distantly related reptilian parasite, as a model
for encystation and excystation9. Stress signals such as high culture density10 and glucose
depletion9 have been shown to induce encystation in this model11. Preliminary data
suggest that E. histolytica can be induced to encyst upon introduction of these stress
conditions as well (J. Wesel, J. Shuman, J. Dickerson, I. Bastuzel, and C. Ingram-Smith.
Manuscript in preparation.)
E. histolytica possess a uniquely limited metabolic program11. The parasite is
amitochondriate, instead possessing a mitosome, and it lacks the capacity for oxidative
phosphorylation12, the citric acid cycle11,13, relying mainly on glycolysis14. E. histolytica
has a non-canonical glycolytic pathway, relying upon pyrophosphate dependent
enzymes13,15 in order to conserve ATP. E. histolytica glycolysis generates 5 ATP per
glucose molecule16. As such, E. histolytica is extremely sensitive to conditions of glucose
starvation.
However, E. histolytica infections establish in and proliferate from the large
intestine, which is problematic for a parasite that relies heavily on glucose for fuel, as
nearly 100% of the glucose in the digestive system is absorbed prior to reaching the
colon11. While the parasite can partially rely upon phagocytosing the intestinal bacteria 17
and amino acid catabolism12, E. histolytica relies in large part upon stored glucose in the
form of glycogen18.
Glycogen is typically abundant within the cell, accounting for up to 3 M stored
glucose19. Glycogen is formed from the precursor glucose-6-phosphate (G6P), which can

110
either be broken down via glycolysis to form ATP or incorporated into glycogen. This
occurs when G6P is converted to glucose-1-phosphate (G1P), which is then converted to
UDP-glucose, the substrate for glycogen, by UDP-glucose pyrophosphorylase, then
converted to glycogen by glycogen synthase19. Once glucose is scarce, glycogen
phosphorylase and glycogen debranching enzyme operate in concert to free G1P (or
glucose at the branch points), which is converted back to G6P, and then proceeds through
glycolysis19.
In addition to the role glycogen catabolism plays in sustaining E. histolytica
growth, it is also a precursor to the synthesis of chitin19, a major component of the E.
histolytica cyst wall20. While E. histolytica trophozoites contain high concentrations of
cellular glycogen19, cysts contain substantially less21, and this shift is observed during the
encystation process22. Preliminary data show that encystation is induced in part by the
removal of glucose from the culture media in E. histolytica, in combination with other
stresses.
In order to determine the role glycogen plays in the ability of E. histolytica to
adapt to an environment with limited glucose, we have generated two RNAi strains, one
for E. histolytica glycogen synthase, and one for both E. histolytica glycogen
phosphorylases. We have examined how these mutants react in conditions of nutrient
stress, through growth and encystation trials. Additionally, we have tracked expression of
all three genes, and quantified levels of cellular glycogen in wild-type and knockdown
strains under a variety of nutrient deplete conditions. This examination of how the

111
inability to make and use glycogen should reveal how important glycogen is to
environmental adaptation in E. histolytica.
Materials and Methods
Materials
Chemicals were purchased from Sigma-Aldrich, VWR International, Fisher
Scientific, and Life Technologies.
Adult bovine serum was purchased from Gemini Bio (www.gembio.com) and was
heat inactivated at 56°C for 25 min. Penicillin-streptomycin solution and Diamond
vitamins were purchased from Life Technologies (Carlsbad, CA). Other media
components were purchased from Fisher Scientific and VWR.
Wizard Genomic DNA Isolation Kit was purchased from Promega (Madison,
WI). Oligonucleotide primers were purchased from Integrated DNA Technologies
(Coralville, IA). The KOD Hot Start Polymerase Kit was purchased from MilliporeSigma
(Burlington, MA). Restriction enzymes and the NEBuilder HiFi DNA Assembly Kit were
purchased from New England Biolabs (Ipswich, MA). Turbo DNA-free Kit was
purchased from Invitrogen (Carlsbad, CA). qScript XLT 1-Step RT-PCR Kits were
purchased from Quantabio (Beverly, MA). The Glycogen Assay Kit II was purchased
from Abcam (Cambridge, UK). The Bradford reagent and bovine serum albumin for the
protein assays was purchased from Bio-Rad (Hercules, CA). Kits were used according to
the manufacturers’ instructions.

112
E. histolytica Culture Conditions and Maintenance
E. histolytica HM-1:IMSS was grown axenically in standard TYI-S-33 medium
(designated here as TYI glucose), which contains 50 mM added glucose23 . TYI-S-33
medium without added glucose was used in some experiments and is designated as TYI
basal medium. Cells were grown at 37°C in 25cm2 untreated tissue culture flasks
containing 52mL medium or in tightly capped 16 x 125 mm borosilicate glass tubes
containing 13 mL medium. Cells were passed every 3 to 4 days for culture maintenance.
Log phase trophozoites were used for all experiments. Cell counts were obtained using
the Luna Automated cell counter from Logos Biosystems (Annandale, VA).
Vector Construction and Transfection
E. histolytica genomic DNA was isolated from log-phase trophozoites using the
Wizard Genomic DNA Isolation Kit. The coding region of the GYS gene (EHI_085980)
encoding glycogen synthase and ~1,000 bp of the coding region of the PYG1 and PYG2
genes (EHI_138380 and EHI_096830, respectively) encoding the two glycogen
phosphorylases were amplified from E. histolytica genomic DNA using the KOD Hot
Start DNA polymerase kit with the primer pairs shown in Table 3.A. Cycling conditions
used for amplification of all three genes were as follows: activation at 94°C for 2 minutes
followed by 35 cycles of denaturing at 94°C for 30 seconds, annealing at 55°C for 1
minute, and extension at 72°C for one minute. The GYS gene was cloned into the AvrII
and XhoI sties of pKT3M vector 24 kindly provided by Dr. Upi Singh (Stanford
University). The PYG1+2 construct containing the PYG1 and PYG2 fragments, in that
order, was assembled in pKT3M vector using the NEBuilder HiFi DNA Assembly kit.

113
E. histolytica trophozoites were transfected with the RNAi constructs by
electroporation 25. Cells (800uL of cells at a density of 3 x 10⁶ cells per mL) were
electroporated with 100µg of DNA using two pulses at 1.2kV and 25uF. Cells were
immediately added to prewarmed media and incubated at 37°C for 48 hours, then G418
selection was applied at a final concentration of 6µg/mL. The RNAi strains were
maintained under G418 selection thereafter. An RNAi strain with pKTM3 containing the
LUC gene was used as a control.
RNA Isolation and RT-PCR
Reverse transcriptase PCR (RT-PCR) was used to confirm that the gene(s) of
interest showed reduced expression in the RNAi strains and was additionally utilized to
examine the level of gene expression for all three target genes in the WT strain when
grown in TYI glucose as compared to TYI basal.
RNA was isolated from log phase trophozoites using Trizol Reagent based on the
manufacturer’s instructions26. RT-PCR was performed using the qScript XLT 1-Step RT-
PCR Kit with the primer pairs shown in Table 3.A. Reactions contained 200ng of RNA
and cycling conditions were as follows: 48°C for 20 minutes for reverse transcription,
then 94°C for 3 minutes to halt reverse transcription, then 25 cycles of 94°C for 20
seconds to denature, 55°C for 1 minute to anneal, and 72°C for 1 minute to extend. Total
RNA content was assessed using a ribosomal RNA gene (accession number: X61116)
with the primer pair listed in Table 3.A. Semi-quantitative RT-PCR gels were analyzed
using Fiji27.

114
Growth Curves
For determination of growth, cultures were grown in tightly capped 16 x 125 mm
borosilicate glass tubes containing 13 mL medium. Cultures were inoculated at 5 x 10⁴
cells and harvested every 24 hours for a three-day time course. Trypan blue exclusion28
was used to distinguish viable cells from dead cells for counting. Viable cells were
counted using a Luna Automated cell counter. Cultures for growth determinations were
grown at 37°C in standard TYI glucose or in TYI basal medium. All growth curves were
performed with three biological replicates for each time point. Significance testing was
performed using an unpaired Welch two sample t-test with a 95% confidence interval in
R studio, R version 4.0.2 (2020-06-22).
Glycogen Assays
Culture Conditions
Glycogen content of cells was assayed using the Glycogen Assay Kit II
colorimetric assay. Cells for glycogen content analysis were grown to log phase and
transferred into fresh medium and grown 24 hours before seeding into the final growth
medium. Cells were inoculated at a density of 10,000 cells/mL and harvested at 0, 8, and
24 hours. The cells for the 0-hour time points were taken directly from TYI basal media.
Cells were harvested at indicated time points by centrifugation at 500 x g for 10 minutes
and viable cell counts were determined as described above28. Harvested cells were
resuspended in ddH2O, and frozen at -80°C. All time points were performed in triplicate,
with three tubes harvested at each time point.
Glycogen and Protein Isolation

115
For determination of cellular glycogen levels, cells were subjected to repeated
freeze-thaw cycles. The frozen cells were thawed at 37°C, inverted to mix, and then flash
frozen in liquid nitrogen for 3-5 minutes until completely frozen. This process was
repeated five times, ending with a final thaw. The cell suspension was then centrifuged at
10,000 x g for 10 min and the supernatant was stored at -20°C.
Glycogen and Protein Content Assays
In the glycogen assay, glycogen is hydrolyzed to glucose, which reacts with a
probe to generate a colorimetric shift. The samples were hydrolyzed for 30 minutes at
room temperature, and then incubated with probe to develop for an additional 30 minutes
at room temperature. Absorbance was then measured at 450nm using the Synergy Epoch
microplate reader (Biotek, Winooski, VT). and compared to a standard curve generated
using a glycogen standard. Samples were background subtracted for cellular glucose
using mock reactions lacking the hydrolysis enzyme. Three biological replicates were
performed for each strain and each condition tested and three technical replicates were
performed for each assay. Significance testing was performed using an unpaired Welch
two sample t-test with a 95% confidence interval in R studio, R version 4.0.2 (2020-06-
22).
Total protein concentration in the cell lysates was quantitated using the Bradford
Assay with bovine serum albumin as the standard29. Absorbance was read at 595nm.
Encystation
To induce encystation, trophozoites were inoculated at 50,000 cells/mL into tissue
culture flasks containing 52mL TYI basal medium and incubated at 37°C for either 72

116
hours or 168 hours. Flasks were incubated on ice for 10 minutes and cells were harvested
by centrifugation at 500 x g for 5 minutes. Cells were analyzed by flow cytometry as
described below. Encystation experiments were performed with three biological
replicates for each strain at each time point.
Encystation was assessed using flow cytometry. The cells (trophozoites and cysts)
were washed with phosphate buffered saline (PBS), stained with 10mg/mL AlexaFluor
WGA-488 for 15 minutes, rinsed with PBS, and fixed in 4% (v:v) paraformaldehyde in
PBS for 15 minutes. The fixed cells were rinsed and resuspended in PBS and analyzed by
flow cytometry using the Cytoflex flow cytometer (Beckman Coulter Life Sciences,
Indianapolis, Indiana), where 100,000 events were collected per sample. A 488nm laser
was used for excitation. Flow cytometry data was analyzed using FCS Express 7 Flow.
Primer Sequence Cloning Primers
GYS RNAi Forward 5’-CGA CTC CCG GGA TGT CAA TTT CTA TCT CAT TAC CTA TTC TAG-3’
GYS RNAi Reverse 5’-CGA CTG GCC CTC GAG TTA AAG TTC AAA AAC AAA GAC TTT TTT C -3’
PYG1 RNAi Forward 5’-ATT GCA GCA TCA ACG CAA GAT GAC CAC ACA AAT TAG ACG-3’
PYG1 RNAi Reverse 5’- TTC ACT TGA TGA GGA TTT TTG CAT GAC TTT TTC ATC TTC TTA AAT CTT CTC ATT ACA -3’
PYG2 RNAi Forward 5’- TGT AAT GAG AAG ATT TAA GAA GAT GAA AAA GTC ATG CAA AAA TCC TCA TCA AGT-3’
PYG2 RNAi Reverse 5’- ACA TTT TAA GTT TAA AAA AGA AGA GTT CAA CAA TCT TCT AAC TAT ATC TTG-3’
RT-PCR Primers GYS RT-PCR Forward 5’-TGT CAC CAC AAG AAA TGG CTG-3’ GYS RT-PCR Reverse 5’-AAG GGA AGG AAG TTG TGG CA-3’
PYG1 RT-PCR Forward 5’-GAT GAC CAC ACA AAT TAG ACG ATC AGT TTC TAT G-3’ PYG1 RT-PCR Reverse 5’-GCA AGA GAA TCA AGG AAA CAT GCT GC-3’ PYG2 RT-PCR Forward 5’-GCA AAA ATC CTC ATC AAG TGA AGG AGT TTC TC-3’ PYG2 RT-PCR Reverse 5’-CCA AGT CCT CCT GAT CCA AGT GCA G-3’
ssrRNA Forward 5’-AGG CGC GTA AAT TAC CCA CTT TCG-3’ ssrRNA Reverse 5’-CAC CAG ACT TGC CCT CCA ATT GAT-3’
Table 3.A: Primers used for gene amplification and RT-PCR analysis

117
Results
Cellular Glycogen Content was Impacted by the Removal or Addition of Glucose
Cellular glycogen has been reported to be abundant in E. histolytica trophozoites
cultured on glucose 19. Here we determined how cellular glycogen content changes when
cells experience environmental change. WT cells were cultured in either TYI glucose or
TYI basal medium for 24 hours. Cells cultured in TYI basal media (0.5 mM glucose)
were inoculated into TYI glucose media (50 mM glucose) to examine how quickly
glycogen accumulates within the cell. Conversely, cells cultured in TYI glucose medium
were inoculated into TYI basal medium to examine how quickly glycogen is consumed
under conditions of nutrient stress. Additionally, cells cultured in TYI glucose medium
were also inoculated back into TYI glucose medium to examine steady state levels of
glycogen.
Glycogen content was determined by enzymatic hydrolysis of glycogen followed
by colorimetric detection of the release glucose. In determining cellular glycogen content,
the level of free cellular glucose present was measured and subtracted from the glycogen
content determination. This correction led to negative values in some cases, indicating
that the level of cellular glucose exceeded the level of glycogen.
When cells were transferred from TYI basal medium to TYI glucose medium
(BtoG), glycogen content increased over the course of 0 to 24 hours (Figure 3.1A),
becoming significant at the 24-hour time point (p value = 0.4.538 x 10-2). There was no
detectable glycogen at the 0-hour timepoint. Conversely, when cells were transferred
from TYI glucose to TYI basal media (GtoB), cellular glycogen decreased significantly

118
over the course of 0 to 24 hours (p value = 1.169 x 10⁻²), and at the 24-hour time point,
there is no detectable glycogen. Additionally, there was an increase in glycogen content
in cells that were transferred from TYI glucose medium back into fresh TYI glucose
medium (GtoG), though it was only a significant increase for the WT strain (p value =
4.366 x 10⁻²).
Figure 3.1: Glycogen content in the WT, LUC+, GYSkd, and PYG1+2kd strains
under different growth conditions. Cellular glycogen content was determined in E.
histolytica cell extracts by colorimetric assay. Cells were grown for 24 hours, transferred
to fresh medium, and harvested at 0 hr, 8hr, and 24 hr time points. Media transfers were
as follows: TYI basal to TYI glucose (BtoG), TYI glucose to TYI glucose (GtoG), and
TYI glucose to TYI basal (GtoB). (A) WT strain. (B) LUC+ strain. (C) GYSkd strain.
(D) PYG1+2kd strain. Glycogen content is expressed as a ratio of cellular glycogen

119
content to total cell protein content. Assays were performed in triplicate with three
biological replicates, and values are the mean ±SD. Significant difference between
glycogen levels compared to their 0-hour time point were tested using an unpaired Welch
t-test with R. *=p-value <.05.
Generation of GYS and PYG1+2 RNAi Silenced Strains
To further examine the role of glycogen in E. histolytica growth in the absence
and presence of glucose, trigger-mediated RNAi of the glycogen synthase (GYS) gene
(EHI_085980) was used to examine the effect of reduced glycogen synthesis on E.
histolytica growth. GYS transcript levels were examined by reverse transcriptase PCR
(RT-PCR) and were found to be strongly decreased in the GYS RNAi strain (designated
hereafter as GYSkd) versus the WT strain and the control strain (designated hereafter as
LUC+; Figure 3.2A), which carries the pKT3 RNAi plasmid containing a gene encoding
luciferase and was maintained under G418 selection as for the GYS RNAi strain.
Quantitative analysis of the three biological replicates revealed a 60% reduction of the
levels of GYS mRNA (standard deviation of 7%), suggesting strong but incomplete
silencing.
Trigger-mediated RNAi was also used to downregulate transcription of two genes
encoding glycogen phosphorylase (PYG1 and PYG2) together (EHI_138380 and
EHI_096830, respectively). These are the same genes studied by Samanta and Ghosh in
their chitin study22. As these genes share only 66% percent identity at the nucleotide
level, ~1000 bp fragments from the coding region of each gene were tandemly positioned
downstream of the trigger sequence to concurrently down-regulate transcription of both

120
genes (this RNAi strain is designated hereafter as PYG1+2kd). Although this method can
lead to reduced silencing, a substantial reduction in transcript levels were observed for
both genes in PYG1/2kd versus WT and the LUC+ control strain (Figures 3.2B and
3.2C). Quantitative analysis revealed a 43%, and 70% reduction of the levels of PYG1
and PYG2 mRNA, respectively (standard deviations of 7% and 9%, respectively).
Transcript levels of a constitutively expressed control rRNA gene were found to be
similar in all four strains (Figure 3.2D).
Figure 3.2: GYS and PYG RNAi silencing. RT-PCR was used to analyze expression of
(A) GYS, (B) PYG1, (C) PYG2, and (D) the control gene. Gene expression was analyzed
in RNA isolated from the WT strain (lane 1), LUC+ strain (lane 2), GYSkd strain (lane 3)
and PYG1+2kd strain (lane 4). The results shown are representative of three biological
replicates.

121
GYS Knockdown Negatively Impacts Cellular Glycogen Content
Since cellular glycogen was quickly depleted in the WT after transfer to medium
lacking glucose, we examined the impact of the knockdown of GYS would have on
cellular glycogen content. There was no detectable cellular glycogen in the GYSkd strain
grown under any of the media conditions tested at any time point (Figure 3.1C). While
not statistically significant, there did appear to be small increase in the amount of
glycogen from 0 to 24 hours when the cells were introduced to the glucose (BtoG)
condition (p value = 4.878 x 10⁻¹).
Meanwhile, the WT and LUC+ strains showed high cellular glycogen levels
during growth on glucose (GtoG), and glycogen rapidly accumulated in cells that were
switched from TYI basal medium to TYI glucose medium (BtoG). Similarly, for the WT
strain, glycogen was quickly depleted in the WT strain when cells were transferred from
TYI glucose medium to TYI basal medium (Figure 3.1B). The GYSkd strain had reduced
glycogen content even in the presence of glucose, as would be expected. When
comparing glycogen content of the GYSkd strain to both controls, it is readily apparent
the GYSkd strain cannot produce glycogen.
Examination of the GYSkd strain revealed no growth defect in TYI glucose
medium as compared to the WT and LUC+ strains (Figure 3.3A). That the strain did
grow normally in the presence of glucose suggests that an inability to synthesize
glycogen is not deleterious when glucose is readily available, but the lack of glycogen
prevents adaptation to growth on other energy sources.

122
Growth of the GYSkd strain was substantially impacted in TYI basal medium.
The GYSkd strain showed minimal growth in this medium and the difference in growth
compared to the WT and LUC+ strains was statistically different (p values = 4.02 x 10⁻⁷
and 1.198 x 10⁻⁴, respectively).

123
Figure 3.3: E. histolytica growth in the presence and absence of added glucose.
Cultures were inoculated with 5 x 10⁴ cells in (A) TYI glucose or (B) TYI basal medium
and cells were harvested and counted at 24-hour, 48-hour, and 72-hour time points. Three

124
biological replicates were performed for each strain, media, and timepoint. Statistically
significant growth defects compared to wild-type growth were tested using an unpaired
Welch t-test in R. *=p-value<.05.
PYG 1+2 Knockdown Negatively Impacts Cellular Glycogen Content and Growth
Assays for glycogen content in the PYG1+2kd strain grown in the different
growth media revealed a similar pattern to what was observed in the WT and LUC+
strains. Cells switched from TYI basal medium to TYI glucose medium (BtoG) had a
stepwise increase in glycogen content, beginning with no detectable glycogen at 0 hours
(Figure 3.1D). However, during continuous culture on glucose (GtoG), the level of
glycogen synthesis appears to be reduced as compared to WT and especially compared to
LUC+. The glycogen content in WT and LUC+ cells was approximately three times the
level of glycogen observed in the PYG1+2kd strain by 24 hours (Figure 3.1). Glycogen
content in the PYG1+2kd strain only increased slightly over 24 hours when cells were
transferred from TYI glucose medium into fresh TYI glucose medium, and the cellular
concentration of glycogen never displayed a statistically significant increase (Figure 3.1)
(p value = 7.494 x 10⁻²).
When cells were transferred from TYI glucose to TYI basal medium, the small
amount of glycogen present appears to be broken down (Figure 3.1D). However, it is
important to note that the level of glycogen degradation is not statistically significant,
even by 24 hours (p value = 6.826 x 10⁻²). This suggests that the remaining expression of
PYG1 and PYG2 was barely sufficient to metabolize the low amount of glycogen
present.

125
Examination of the growth characteristics of the PYG1+2kd strain demonstrated
that, in contrast to the GYSkd strain, this strain grew at a slower rate than the WT and
LUC+ strains in TYI glucose medium (Figure 3.3A). This difference was statistically
significant by 72 hours (p values = 9.349 x 10⁻⁷ and 4.549 x 10⁻³, respectively). During
growth in TYI basal medium, the PYG1+2kd strain again showed significantly reduced
growth compared to the WT and LUC+ strains (Figure 3.3B) (p values = 3.32 x 10⁻⁷ and
1.068 x 10⁻⁴, respectively). The growth rate closely reflected the rate observed in the
GYSkd strain.
Culture Density Does Not Impact Cellular Glycogen Content
In addition to nutrient stress being a known factor that induces encystation in the
related parasite of E. invadens 9, high cell density is also proposed to be a factor10.
Cellular glycogen levels have been shown to decrease during encystation22 and glycogen
is purported to be the source of glucose for chitin synthesis during this process19. We
have recently demonstrated encystation of E. histolytica in laboratory culture, providing a
model of encystation in the human pathogen (J. Wesel, J. Shuman, J. Dickerson, I.
Bastuzel, and C. Ingram-Smith. Manuscript in preparation.). Therefore, we sought to
determine whether inhibition of glycogen synthesis or utilization had any effect on
encystation in E. histolytica.
We first examined the effect of growth at high cell density on glycogen
accumulation in WT cells. Glycogen content was determined in E. histolytica cells
grown in TYI glucose medium and transferred to TYI basal medium at two different
starting cell densities. Cultures were inoculated at 10,000 cells/mL, our standard starting

126
cell density, or 50,000 cells/mL, the high cell density we use for encystation of E.
histolytica. The assays did not reveal a substantial shift in the patterns described for low
density WT cultures (Figure 3.4). Glycogen was quickly depleted after 8 hours in TYI
basal medium for both the low density and high-density cultures (Figure 3.4 A and 3.4B).
Even at 24 hours, the amount of cellular glycogen is nearly identical, with no statistically
significant difference between the two (p value = 1.552 x 10⁻¹).

127

128
Figure 3.4: Glycogen content in WT cells grown at low and high cell density. The
WT strain was grown in TYI basal medium with a starting inoculum of (A) 1 x 10⁴
cells/mL (low density) and (B) 5 x 10⁴ cells/mL (high density). Cells were harvested and
counted at 24 hour, 48 hour, and 72 hour time points. Glycogen content in cell extracts is
expressed as a ratio of cellular glycogen content to total cell protein content. Assays were
performed in triplicate for three biological replicates for each time point.
GYSkd and PYG1+2kd Show Inhibited Chitin Formation During Encystation
Stored glycogen is widely thought to be a precursor to chitin during encystation in
Entamoeba22, and glycogen levels are decreased in E. invadens cysts versus
trophozoites21,22. Therefore, glycogen synthesis and glycogen breakdown are likely vital
to the process. We thus examined whether encystation was affected in the GYSkd and
PYG1+2kd strains.
Encystation was induced by growing the strains at high starting cell density
(50,000 cells/mL) in TYI basal medium. Cells were harvested at 72 hours and 168 hours
post inoculation, stained with the chitin binding lectin WGA-488, and production of the
chitin cell wall as a measure of the progression of encystation was analyzed by flow
cytometry analysis. The 72-hour time point is when cells typically have begun to develop
the chitin cell wall, and by 168 hours mature cysts have formed.
Encystation progressed differently in the knockdown strains. At 72 hours post-
inoculation, there were two distinct populations as distinguished by the two peaks
observed in the histograms, indicating that cells during encystation have begun to form a
chitin cell wall (Figure 3.5). The left peak centered above 105 represents the population of

129
trophozoites, which contain no chitin, and the right peak between 106 and 107 represents
the population of chitinous cysts. At 72 hours, there was no major distinction between the
four strains. All had a prominent trophozoite peak and the cyst peak has started to form
(Figure 3.5). By 168 hours, both the WT and LUC+ strains appeared to have only a cyst
population with no trophozoite peak remaining (Figure 3.5). Both the GYSkd and
PYG1+2kd strains had a cyst peak with a leftward shoulder, suggesting there was still a
population of trophozoites present, or perhaps cysts that had an incomplete chitin cell
wall (Figure 3.5).

130

131
Figure 3.5: E. histolytica encystation is impaired in the GYSkd and PYG1+2kd
strains. E. histolytica trophozoites were induced to begin encystation by culturing at high
cell density in TYI basal medium. Cells were harvested at 72 hours and 168 hours,
stained with AlexaFluor WGA-488, and analyzed by flow cytometry analysis for the
presence of a chitin cell wall. Three biological replicates were performed for each strain
at each time point, and the histograms shown are representative of each data set.
Histograms display cell count versus fluorescence intensity. The axes are the same for
every histogram. The “cell count” axis extends up to 1000 events, the “fluorescence” axis
extends out to 108.
At 72 hours, all four strains had a similar number and percentage of cysts (Figures
3.6A and 3.6B, respectively). Each strain had between ~5 x 10⁴ and ~6 x 10⁴ trophozoites
and between ~1 x 10⁴ and ~2 x 10⁴ cysts, and 80-90% trophozoites and 10-20% cysts
(Figure 3.6B). The GYSkd strain had both the fewest and lowest percentage of cysts in
the total population (Figures 3.6A and 3.6B). The PYG1+2kd strain had a similar number
and percentage of cysts to WT at 72 hours.
At 168 hours, the WT and LUC+ strains both had the largest number and
percentage of cysts and both strains were nearly fully encysted (Figures 3.6A and 3.6B).
The GYSkd strain had the fewest and lowest percentage of cysts in the total population,
although ~70% of the population had encysted. The PYG1+2kd strain had 1 x 10⁴
trophozoites remaining and ~20% of its total population had not encysted by 168 hours.
Overall, reduced ability to produce or utilize glycogen did result in reduced encystation.

132
133
Figure 3.6: Quantification of encystation in the GYSkd and PYG1+2kd strains. The
results depicted in Figure 3.5 were quantitated by determining the total number of
trophozoites and cysts in each population, as determined by flow cytometry. The results
are displayed as stacked bar graphs for each strain and time point. (A) Total number of
trophozoites and cysts present. (B) Percentage of trophozoites and cysts present. Results
are from three biological replicates for each strain and time point.
Expression of GYS, PYG1, and PYG2 are Downregulated in the Absence of Glucose
As one final line of inquiry, we examined how expression of the GYS, PYG1, and
PYG2 genes varied when cells were starved for glucose. RT-PCR analysis showed that
the GYS transcript level was reduced in the PYG1+2 strain (Figure 3.2A), providing a
potential explanation for why cellular glycogen accumulation was reduced in this strain,
and suggesting that the inability to use glycogen reduces the ability to synthesize
glycogen as well through some feedback mechanism.
We examined this further by analyzing transcript levels in the WT strain during
growth in TYI glucose medium or TYI basal medium (Figure 3.7). When cells were
cultured in TYI glucose, GYS, PYG1, and PYG2 were all expressed, with PYG2
showing the highest of expression (Figure 3.7). However, when cells were cultured in
TYI basal medium for 48 hours, transcript levels were greatly reduced for all three genes.
Quantitative analysis revealed 73% 71% and 78% reductions in mRNA levels for the
GYS, PYG1, and PYG2 genes, respectively, (3%, 12%, and 9% standard deviation,
respectively) between cells grown on TYI glucose and TYI basal media.

134
Figure 3.7: Expression of GYS, PYG1, and PYG2 in the WT strain grown in the
presence or absence of glucose. RT-PCR was used to analyze expression of GYS, PYG1,
PYG2, and the control gene in WT cells grown either in TYI glucose or TYI basal
medium. The results shown are from three biological replicates for each condition.
Discussion
E. histolytica has a unique but limited metabolic program11, lacking the capacity
for oxidative phosphorylation or the citric acid cycle11–13. As a result, glycolysis is
responsible for much of the ATP production within the cell14. Glucose is processed via
fermentative glycolysis, producing 5 ATP per glucose molecule16. However, the parasite
resides in the colon, where there is nearly no available glucose11. As glycolysis is not
sustainable in the colon, E. histolytica is thought to use glycogen as an energy source
while switching to amino acids as a primary energy source30.
Here, we showed that the ability to synthesize and utilize glycogen is critical to
growth adaptation in E. histolytica. We demonstrated that glycogen is utilized rapidly
when cells were starved for glucose and synthesized nearly as rapidly once glucose was
made available. Furthermore, we showed that reduced expression of GYS, PYG1, and
PYG2 led to reduced production and use of glycogen. Glycogen cycling is reported to be
active during culture13, and we now know from this data that glycogen synthesis is
upregulated when glucose is available and glycogen degradation is downregulated when

135
it is not. Knockdown strains were unable to grow normally under nutrient stress and
unable to encyst properly.
Cellular Glycogen Content Was Impacted by the Removal and Addition of Glucose
E. histolytica has previously been shown to store and utilize glycogen19,20,22. Here
we examined how glycogen levels change when media conditions change. We showed
that glycogen was quickly depleted when glucose was removed as an energy source
(GtoB). Both the WT and LUC+ strains exhibited reduced glycogen content. This
reduction occurred quickly within the first 8 hours of nutrient stress and cellular glycogen
was fully depleted by the 24-hour mark. This would indicate that as glucose is no longer
available, cells began to utilize glycogen instead.
This reduction mimics what is predicted to happen during infection. As glucose is
scarce in the colon and glycolysis is not sustainable, glycogen may serve as a temporary
energy source as E. histolytica converts to catabolizing amino acids as a primary energy
source12,30. Amino acids are amply available in both TYI glucose and TYI basal media.
As such, it is likely that glycogen was utilized in the short term while E. histolytica
adjusted its metabolic program to continue growth.
After overnight culture in TYI basal media, neither WT nor LUC+ contained any
measurable cellular glycogen. This observation matches the data obtained from switching
these strains from TYI glucose to TYI basal, where after 24 hours in TYI basal media,
there is no remaining cellular glycogen either.
After introduction to TYI glucose media (BtoG), both strains appear to ramp up
glycogen production. This trend continued over the course of 24 hours, with both strains

136
producing more glycogen the longer they are exposed to glucose. The synthesis of
glycogen in the presence of glucose and the corresponding degradation of glycogen in the
absence of glucose suggests the use of glycogen as a way to store energy within the cell
to guard against times of scarcity18.
Both WT and LUC+ appeared to continue to synthesize glycogen when switched
from one culture of fresh TYI glucose media to a second (GtoG). Both cultures contained
roughly the same amount of glycogen in the 0-hour time point of the TYI glucose to TYI
glucose cultures (0 hour, GtoG) as they did at the 24-hour time point when switched from
TYI basal to TYI glucose (24 hour, BtoG). This indicates that the rate of glycogen
production was consistent between the cultures for each strain.
By the 0-hour time point for the TYI glucose to TYI glucose culture (GtoG), the
cells had already been cultured in the presence of glucose for 24 hours. But, by the 24-
hour time point, both strains had produced even more glycogen. The amount of glycogen
produced by the 24-hour mark for both strains in this media condition was substantial.
This supports the assertion that cells keep a lot of glycogen on hand, as much as up to 3
M19.
The Role of Glycogen Synthase
GYS RNAi Silencing
Quantitative analysis of the RT-PCR gel in Figure 3.2 showed a 41% reduction of
the levels of GYS mRNA. While not fully silenced, this knockdown served as an
indicator of the impact of reduced cellular glycogen levels. While this strain was viable,
both growth outcomes and encystation were inhibited as a result of this knockdown.

137
Interestingly, in the GYSkd strain, PYG1 and PYG2 showed concurrent reductions in
expression, with PYG1 expression reduced by 53% and PYG2 expression reduced by
26% (10% and 11% standard deviation, respectively).
GYS Knockdown Negatively Impacts Cellular Glycogen Content
The GYSkd cell line contained no glycogen, at any time point, in any media
condition. While not particularly interesting, it is informative in this case, confirming the
efficacy of the glycogen synthase knockdown. Although, there did appear to be small
increase in the amount of glycogen in the BtoG condition over the time course. While
neither the cultures from 0 nor 8 hours were even within the statistical range of having
any glycogen, the 24-hour time point is within the margin of error for containing a small
amount of glycogen. Though this is a statistically insignificant difference, it could point
to a small remaining level of activity for glycogen synthase. Considering the RNAi gel
showed a 66% reduction in activity, it is possible that over a longer time period, glycogen
would accumulate within the cell.
GYS Knockdown Does Not Impact Growth on TYI Glucose Media and Negatively
Impacts Growth on TYI Basal Media
Glycogen cycling is a common component of cellular metabolism, vital to glucose
and energy metabolism13. Glycogen cycling has been hypothesized to result in the
production of PPi, which is required for E. histolytica glycolytic enzymes13,19,31–34.
Glycogen synthase acts concurrently with UDP-glucose pyrophosphorylase to produce
PPi, consuming an ATP in the process13,31. When glucose is available in enough excess to
be stored as glycogen, glycolysis is upregulated, via the availability of PPi and need for

138
ATP 31. However, there is no data to support this theory13. Furthermore, it is also reported
that the production of UDP-glucose as a precursor to glycogen requires the hydrolysis of
PPi to move the reaction forward, as do many biosynthetic reactions35.
This popular hypothesis would suggest that an inability to produce glycogen
could result in a negative impact on the rate of glycolysis, and therefore the rate of cell
growth. However, cellular PPi. is manufactured via a separate synthesis pathway, driven
by an H+ gradient across the plasma membrane13. Thus, when glycogen synthesis is
inhibited, G6P likely proceeds through glycolysis as normal. This would explain why
GYSkd growth on glucose is comparable to the WT and LUC+ controls. However,
during infection, E. histolytica are rarely in an environment where excess glucose is
available. Laboratory growth of E. histolytica in TYI glucose medium is inherently not
reflective of the natural environment of the amoeba. The more physiologically relevant
question is how GYSkd would impact growth in the absence of glucose.
While glycogen synthesis consumes G6P and ATP, glycogen degradation
produces G6P. Glycogen degradation becomes particularly important for supplying G6P
to glycolysis when hexokinase activity is low, which happens under conditions of glucose
starvation31. In the case of GYSkd, the expression of glycogen synthase is reduced,
therefore, intracellular glycogen is reduced. In this case, glycogen degradation to G6P
may not proceed due to lack of glycogen.
In examining the RT-PCR of the GYSkd strain grown on glucose, PYG1 appears
to be downregulated alongside GYS (Figure 3.2B), though this coincidence was not
observed for the PYG2 gene. However, the expression profile of PYG1 and PYG2

139
matters less than the glycogen supply they have available to act upon. The GYSkd strain
clearly does not produce enough glycogen to fuel degradation, as seen in Figure 3.1C. As
both GYSkd and PYG1+2kd show nearly identical patterns of inhibited growth in the
absence of glucose, both phenotypes are likely the result of the inhibition of their
respective portions of the glycogen cycle. Therefore, the growth defect of GYSkd on TYI
basal media is likely a result of severely limited G6P supply, inhibiting the procession of
glycolysis.
The Role of Glycogen Phosphorylase
PYG1+2 RNAi Silencing
Quantitative analysis of the RT-PCR gels in Figure 2B and 2C revealed a 43%,
and 70% reduction of the levels of PYG1 and PYG2 mRNA, respectively. While this
strain was viable, its growth lagged compared to the control strains during continuous
culture, indicating that the knockdown was cumbersome for the cells. Levels of GYS
mRNA also fell in the PYG1+2kd strain by 34% (standard deviation of 13%).
PYG1+2 Knockdown Negatively Impacts Cellular Glycogen Content
The PYG1+2kd strain accumulated glycogen when switched from TYI basal to
TYI glucose medium, but glycogen accumulation was limited during steady growth on
glucose, although a pattern of glycogen production was observed. When continuously
cultured in glucose, this strain did not synthesize as much glycogen as quickly as either
WT or LUC+. This fits with data obtained from RT-PCR experiments, as visible in
Figure 3.2B. Reduced expression of PYG1 appears to correspond with reduced
expression of glycogen synthase. Interestingly, this concomitant expression is not

140
observed for PYG2 (Figure 3.2D). The concomitant reduction of glycogen synthase
expression alongside the reduction of glycogen phosphorylase expression severely
impacted the rate of glycogen synthesis even when cells are continuously exposed to high
levels of glucose. This would also explain the observation of reduced growth in the
PYG1+2kd strain.
The PYG1+2kd strain produced glycogen and appeared to able to utilize at least
some of that glycogen when glucose removed from the medium (GtoB). The reduction in
glycogen content in this strain was never statistically significant, which is also a positive
indicator of the efficacy of the simultaneous knockdown of both glycogen
phosphorylases.
The minimal availability of glycogen in the PYG1+2kd strain likely coincides
with its limited degradation capacity. Glycogen cycling is dependent upon both steps of
the cycle, and when the downstream portion is inhibited, the upstream portion is likely to
be sensitive to downstream blockages. As such, the breakdown of glycogen is slowed in
concert with the reduced production of glycogen. The reduced glycogen production for
PYG1+2kd strain in TYI glucose medium, combined with the reduced expression of
glycogen synthase gene again suggests that when glycogen degradation is inhibited,
glycogen synthesis is down regulated. As it is reported that glycogen production requires
ATP13,31, slowing glycogen production when glycogen degradation is inhibited is
beneficial to the cell..
However, the physiological relevance of E. histolytica’s affinity for glycogen
cycling remains to be seen. Trophozoites are theoretically never in the presence of much

141
glucose, as nearly 100% of dietary glucose is taken up prior to reaching the colon11, let
alone the 50mM concentration present in the culture media23. If glycogen production
long term is as important to sustaining growth and virulence as it appears here and in the
literature13,19,31 it appears that appropriate concentrations of cellular glucose must be
derived from phagocytosis.
PYG1+2 Knockdown Negatively Impacts Cell Growth on TYI Glucose Media
In contrast to GYSkd, the PYG1+2kd strain grew less well than the WT and
LUC+ strains even in the presence of glucose. Glycogen cycling is a major component of
E. histolytica metabolism, vital to glycolysis regulation13. In one study, when glycogen
degradation was blocked for two hours, cellular ATP content dropped to ~50%13.
As such, it is not surprising to find that there is a significant growth defect when
glycogen phosphorylase 1 and 2 are knocked down, seen in Figure 3A. PYG1+2kd only
ever accomplished roughly half the growth of the control cell lines, corresponding to the
roughly ~50% predicted cellular ATP content. This would indicate that if glycogen
degradation is unable to proceed, cells would be hard pressed to maintain enough ATP
production to sustain growth. In the case of PYG1+2kd, the expression of glycogen
phosphorylase 1 and 2 is reduced, therefore, the ability of the cell to degrade glycogen to
G6P is reduced.
PYG1+2 Knockdown Negatively Impacts Cell Growth on TYI Basal Media
As glucose is scarce, and glycolysis is not sustainable during colonic infection, E.
histolytica is thought to use glycogen as an energy source while switching to amino acids
as a primary energy source30. When glucose is available to the cell, hexokinase requires

142
ATP to break down glucose into G6P, a glycolytic intermediate. However, when
hexokinase activity is low under conditions of glucose starvation, glycogen degradation
becomes a vital pathway to produce G6P for glycolysis31. Therefore, ATP production is
likely limited in the PYG1+2kd strain, particularly when the strain is starved for glucose.
This is the most likely cause of the growth defect observed in PYG1+2kd on TYI basal
media.
Furthermore, in the absence of glucose, E. histolytica is thought to catabolize
amino acids as a primary source of ATP12,30. Both TYI glucose and TYI basal contain a
variety of amino acids supplied by tryptone and yeast extract. However, phagocytosis of
intestinal bacteria and, upon invasive infection, the intestinal lumen, are also important
sources of nutrients for the scavenging E. histolytica17. While both GYSkd and
PYG1+2kd exhibited a growth defect in the absence of glucose, presumably due to their
limited access to G6P, amino acid catabolism was likely what sustained their slow
growth. However, they were not able to utilize what would be available to them in the
intestine, scavenging other cells. Therefore, the impact of glycogen metabolism on cell
growth is likely overstated in axenic culture, compared to their typical environment.
The Role of Glycogen in Encystation
Culture Density Does Not Impact Cellular Glycogen Levels
Due to the dual role of glycogen as both an energy storage molecule and a
precursor to chitin during encystation19, we next wanted to investigate whether culturing
cells in encystation conditions impacted cellular glycogen content. Nutrient stress and
high cell density are both reported triggers for encystation in E. invadens, and our

143
preliminary data support this for E. histolytica as well9–11. We chose to examine how the
combined stressors of high cell density and nutrient stress would impact cellular glycogen
content in the WT strain.
When grown on glucose, the glycogen levels in the 5 x 10⁴ cells/mL high-density
culture matched that of the 1 x 10⁴ low-density culture at each time point (Figure 4). The
glycogen assay hydrolyzes glycogen to glucose which then is oxidized to an intermediate
which then reduces a colorless probe, so what likely is occurring is there is an increase in
free G6P as a precursor to chitin synthesis and this is what is causing the slight increase
in “glycogen” content.
However, the trend of the quick usage of glycogen remained, although likely for
different purposes. The low-density culture in order to survive switching its primary
energy source, the high-density culture in order to begin encystation.
GYSkd and PYG1+2kd Show an Encystation Defect
Due to the importance of glycogen stores to the production of a chitin cell wall20,
we next chose to examine if a defect in glycogen synthesis or degradation would result in
a defect in production of a cyst wall. The chitin content of a cell during encystation can
be monitored over time via staining with a chitin specific dye, WGA-488, for flow
cytometry.
The induction of encystation did not seem to be significantly impacted in GYSkd
and PYG1+2. Both strains showed a small cyst peak over or slightly right of 106,
corresponding to the control strains (Figure 5). This indicates that the production of chitin
has at least begun for some cells in the population.

144
The “wattle and daub” model of encystation proposes a skeleton of chitin fibrils is
modulated and filled in with lectins over the course of time36 and immature cysts
frequently contain only some punctate regions of chitin between large gaps where no
synthesis occurs. The chitin cell wall is necessary to confer protection for the cyst, and
while no sarkosyl treatment to verify cyst maturity was performed, this would be a
helpful indication of the level of cyst maturity in these cell lines during induction in the
future. Given the importance of stored glycogen as a source for glucose for chitin
formation, it makes sense that inhibition of glycogen formation and degradation
negatively impacts the ability of E. histolytica to form a mature cyst. This observation of
immature, incomplete cysts matches what was observed by Samanta and Ghosh when
they silenced glucosamine-6-P isomerase and were able to reduce chitin synthesis by
~60%22. While chitinous cell walls still formed, they appeared incomplete via
microscopy, and less bright when examined via flow cytometry22.
Glucose Starvation Impacts Glycogen Gene Expression
Upon observing that there was a noticeable trend of glycogen degradation in the
control cells when starved for glucose that corresponded to better growth outcomes when
starved for glucose, we then chose to examine how gene expression might have changed
in the WT line. In order to determine if the expression of the glycogen synthase and
glycogen phosphorylase genes changed, RT-PCR was employed to visually assess how
expression levels had altered upon introduction to TYI basal media.
Glycogen synthase expression is 80% downregulated upon removal of glucose,
which makes sense, as glucose is in incredibly short supply and any available glucose is

145
likely being funneled through glycolysis (Figure 3.7). However, PYG1 and PYG2 are
both also downregulated (Figure 3.7). While this may seem contrary to the assumption
that glycogen degradation is upregulated during glucose starvation, these samples were
collected after 48 hours of culture in TYI basal media. As observed in the glycogen
content assays, cellular glycogen stores are depleted extremely early during glucose
starvation, within 2-8 hours (Figure 3.1)15. Gene expression of both glycogen
phosphorylases likely peaked earlier, then tapered as there was less and less glycogen
available to degrade. A time course of expression from 0 to 12 hours would be a very
interesting experiment to pursue as a follow up to the data outlined here.
Concluding Remarks
The role of glycogen in the metabolic program of E. histolytica has been
examined before, however, our reverse genetics approach to the investigation shed light
on the critical role cellular glycogen plays on growth and adaptation of the parasite to
stress conditions. Here, we have shown that the inability to make or use glycogen causes
defects in growth, rendering both GYSkd and PYG1+2kd growth sluggish in the absence
of glucose. Both knockdowns inhibited encystation, reducing the capacity of E.
histolytica to form a complete cell wall. These lines have an inability to adapt to a low
glucose environment via either growth or encystation, two processes essential for the
infection and proliferation of E. histolytica. These results highlight the vital nature of
glycogen in the metabolism of E. histolytica.

146
References
1. Herman, E. et al. Membrane trafficking modulation during Entamoeba
encystation. Sci. Rep. (2017) doi:10.1038/s41598-017-12875-6.
2. Centers for Disease Control and Prevention. Amebiasis.
https://www.cdc.gov/parasites/amebiasis/general-info.html (2015).
3. Verkerke, H. P., Petri Jr, W. A. & Marie, C. S. The dynamic interdependence of
amebiasis, innate immunity, and undernutrition. Semin. Immunopathol. 34, 771–
785 (2012).
4. Ackers, J., Africa, S., Diego, S., Samuelson, J. & Ximenez, C. Entamoeba
taxonomy. Bull. World Health Organ. 75, 291–294 (1997).
5. Byers, J., Faigle, W. & Eichinger, D. Colonic short-chain fatty acids inhibit
encystation of Entamoeba invadens. Cell. Microbiol. 7, 269–279 (2005).
6. Eichinger, D. A role for a galactose lectin and its ligands during encystment of
Entamoeba. in Journal of Eukaryotic Microbiology (2001). doi:10.1111/j.1550-
7408.2001.tb00411.x.
7. Baxt, L. A. & Singh, U. New insights into Entamoeba histolytica pathogenesis.
Curr. Opin. Infect. Dis. 21, 489–494 (2008).
8. Segovia-Gamboa, N. C. et al. Differentiation of Entamoeba histolytica: A possible
role for enolase. Exp. Parasitol. (2011) doi:10.1016/j.exppara.2011.05.001.
9. Vazquezdelara-Cisneros, L. G. & Arroyo-Begovich, A. Induction of encystation of
Entamoeba invadens by removal of glucose from the culture medium. J. Parasitol.
70, 629–633 (1984).

147
10. Eichinger, D. Encystation in parasitic protozoa. Current Opinion in Microbiology
(2001) doi:10.1016/S1369-5274(00)00229-0.
11. Matt, J. & Duchêne, M. Molecular and biochemical characterization of Entamoeba
histolytica fructokinase. Parasitol. Res. 114, 1939–1947 (2015).
12. Jeelani, G. & Nozaki, T. ScienceDirect Metabolomic analysis of Entamoeba :
applications and implications. Curr. Opin. Microbiol. 20, 118–124 (2014).
13. Saavedra, E. et al. Control and regulation of the pyrophosphate-dependent glucose
metabolism in Entamoeba histolytica. Mol. Biochem. Parasitol. 229, 75–87
(2019).
14. Saavedra, E., Encalada, R., Pineda, E., Jasso-Chávez, R. & Moreno-Sánchez, R.
Glycolysis in Entamoeba histolytica. Biochemical characterization of recombinant
glycolytic enzymes and flux control analysis. FEBS J. 272, 1767–1783 (2005).
15. Pineda, E. et al. In vivo identification of the steps that control energy metabolism
and survival of Entamoeba histolytica. FEBS J. 282, 318–331 (2015).
16. Plaxton, W. C. Metabolic flexibility helps plants to survive stress. in Plant
Physiology 1–15 (Sinauer Associates, 2015).
17. Iyer, L. R., Verma, A. K., Paul, J. & Bhattacharya, A. Phagocytosis of gut bacteria
by Entamoeba histolytica. Front. Cell. Infect. Microbiol. 9, 34 (2019).
18. Segura-Luna, J. J. & Calzado-Flores, C. Incorporation of 14C-glucose into
cytoplasmic glycogen from Entamoeba invadens IP-1 strain. Arch. Med. Res. 31,
S194–S195 (2000).
19. Pineda, E. et al. Glucose metabolism and its controlling mechanisms in Entamoeba

148
histolytica BT - Amebiasis: Biology and Pathogenesis of Entamoeba. in (eds.
Nozaki, T. & Bhattacharya, A.) 351–372 (Springer Japan, 2015). doi:10.1007/978-
4-431-55200-0_20.
20. Chatterjee, A. et al. Evidence for a ‘wattle and daub’ model of the cyst wall of
Entamoeba. PLoS Pathog. (2009) doi:10.1371/journal.ppat.1000498.
21. Bakker-Grunwald, T., MARTIN, J.-B. & KLEIN, G. Characterization of glycogen
and amino acid pool of Entamoeba histolytica by 13C-NMR Spectroscopy. J.
Eukaryot. Microbiol. 42, 346–349 (1995).
22. Samanta, S. K. & Ghosh, S. K. The chitin biosynthesis pathway in Entamoeba and
the role of glucosamine-6-P isomerase by RNA interference. Mol. Biochem.
Parasitol. 186, 60–68 (2012).
23. Diamond, L. S. Techniques of axenic cultivation of Entamoeba histolytica
Schaudinn, 1903 and E. histolytica-like amebae. J. Parasitol. 54, 1047–1056
(1968).
24. Morf, L., Pearson, R. J., Wang, A. S. & Singh, U. Robust gene silencing mediated
by antisense small RNAs in the pathogenic protist Entamoeba histolytica. Nucleic
Acids Res. 41, 9424–9437 (2013).
25. Hamann, L., Nickel, R. & Tannich, E. Transfection and continuous expression of
heterologous genes in the protozoan parasite Entamoeba histolytica. Proc. Natl.
Acad. Sci. U. S. A. 92, 8975–8979 (1995).
26. Chomczynski, P. & Mackey, K. Short technical reports. Modification of the TRI
reagent procedure for isolation of RNA from polysaccharide- and proteoglycan-

149
rich sources. Biotechniques 19, 942–945 (1995).
27. Schindelin, J. et al. Fiji : an open-source platform for biological-image analysis. 9,
(2019).
28. Strober, W. Trypan blue exclusion test of cell viability. Curr. Protoc. Immunol.
111, A3.B.1-A3.B.3 (2015).
29. Bradford, M. M. A Rapid and sensitive method for the quantitation of microgram
quantities of protein utilizing the principle of protein-dye binding. Anal. Biochem.
248–254 (1976).
30. Baumel-Alterzon, S., Weber, C., Guillén, N. & Ankri, S. Identification of
dihydropyrimidine dehydrogenase as a virulence factor essential for the survival of
Entamoeba histolytica in glucose-poor environments. Cell. Microbiol. 15, 130–144
(2013).
31. Saavedra, E. et al. Kinetic modeling can describe in vivo glycolysis in Entamoeba
histolytica. FEBS J. 274, 4922–4940 (2007).
32. Reeves, R. E. Metabolism of Entamoeba histolytica Schaudinn, 1903. in (eds.
Baker, J. R. & Muller, R. B. T.-A. in P.) vol. 23 105–142 (Academic Press, 1985).
33. Taillefer, M. & Sparling, R. Glycolysis as the Central Core of Fermentation BT -
Anaerobes in Biotechnology. in (eds. Hatti-Kaul, R., Mamo, G. & Mattiasson, B.)
55–77 (Springer International Publishing, 2016). doi:10.1007/10_2015_5003.
34. Takahashi, N., Kalfas, S. & Yamada, T. Phosphorylating enzymes involved in
glucose fermentation of Actinomyces naeslundii. J. Bacteriol. 177, 5806–5811
(1995).

150
35. Berg, J., Tymoczko, J. & Stryer, L. Glycogen is Synthesized and Degraded by
Different Pathways. in Biochemistry (W.H. Freeman and Company, 2002).
35. Chatterjee, A. et al. Evidence for a ‘wattle and daub’ model of the cyst wall of
Entamoeba. PLoS Pathog. 5, (2009).

151
CHAPTER FOUR
CONCLUSIONS AND FUTURE DIRECTIONS
Introduction
We have demonstrated the first reproducible model for encystation in E.
histolytica, a discovery vital to studying the complete life cycle of a devastating
pathogen. Additionally, we have shown that conditions that partially imitate the
environment of the human colon, specifically nutrient stress and high cell density, induce
the encystation process. SCFAs have been shown to accelerate encystation efficiency as
well.
We have also shown that glycogen metabolism is key to the ability of E.
histolytica to grow and adapt. We demonstrated that cellular glycogen content is reduced
in response to nutrient starvation. Additionally, when use of cellular glycogen was
inhibited, decreased growth and encystation outcomes were observed.
The Role of Short Chain Fatty Acids in Gene Regulation
We have shown that the SCFAs acetate and propionate promote encystation
efficiency when added at physiological levels. Butyrate, which is also prevalent in the
large intestine, did not substantially increase encystation efficiency when added at
physiological levels compared to glucose starvation alone. Through flow cytometry
analysis, we have shown that the presence of SCFAs accelerates E. histolytica
encystation, initiating chitin production more quickly. However, in E. invadens SCFAs
reportedly inhibit encystation very effectively1, even though the concentrations of SCFAs
in the hindgut are reported to be very similar in reptiles and mammals2.

152
SCFAs have been linked to histone acetylation, regulating gene expression in
other eukaryotes. SCFAs are known to function as histone deacetylase inhibitors,
epigenetically modulating gene expression through chromatin remodeling3. SCFAs
additionally serve as energy sources for colonic bacteria4,5. Our preliminary data also
shows that the addition of propionate to culture media in place of glucose can also sustain
trophozoite growth (J. Wesel, J. Shuman, J. Dickerson, I. Bastuzel, and C. Ingram-Smith.
Manuscript in preparation.).
Due to the acceleratory effect that SCFAs have on the encystation of E. histolytica
compared to the detrimental effect they have on E. invadens1, as well as their role as both
a signaling molecule and energy source in bacteria, investigating what role they are
playing during E. histolytica encystation is highly warranted. Their role in histone
acetylation may not be as pronounced in E. histolytica, as butyrate did not appear to
promote encystation even though it is reported to be the most effective inhibitor of
histone deacetylation3. Therefore, it would be very interesting to further examine the role
SCFAs play on gene expression in E. histolytica as it encysts.
RNA sequencing of encysting E. histolytica cells would be a viable next step. A
transcriptome analysis of encysting E. histolytica would be incredibly valuable to identify
where E. invadens and E. histolytica differ in their encystation triggers and processes.
Similar studies have been undertaken in related parasites; however, there has been no
comprehensive analysis to date of the transcriptome of E. histolytica as encystation
begins. The transcriptomes of both encysting E. invadens and encysted E. histolytica
from clinical isolates have both been examined6,7. However, due to the lack of a model

153
for encystation in E. histolytica, a transcriptome profile has never been performed on
encysting E. histolytica cells. Furthermore, the differences between E. histolytica and E.
invadens encystation cues certainly warrant further study via comparison of the
transcriptome.
Additionally, it would be intriguing to examine the effect of SCFAs on chromatin
remodeling, and therefore possibly tetranucleation in E. histolytica cysts. Byers et al.
report that the introduction of SCFAS results in ploidy restriction in E. invadens8.
However, we have yet to undertake a study on how SCFAs may impact ploidy within E.
histolytica and given their differing responses to SCFAs regarding chitin production,
similar differences may present regarding nuclear content and division.
Cyst Viability and Excystation in E. histolytica
Additionally, while excystation has also been successfully demonstrated in E.
histolytica, the triggers that induce this stage conversion are unclear. Our preliminary
data suggest E. histolytica excysts in response to glucose, though this process has not yet
been optimized. There are likely additional unknown triggers that induce this response
more quickly and efficiently. This is supported by observations in the literature for
excystation of E. invadens, where excystation efficiency is reportedly between 1-10%
upon reintroduction into growth media9. However, our preliminary data do not identify
bile salts or bicarbonate as promoting excystation efficiency, which contrasts the
available data on E. invadens9. Additional studies into what signals induce excystation in
E. histolytica would be valuable to improving our model. This may include alterations in

154
pH, variations in cell density, or reductions in serum content. Furthermore, investigation
of the role of glycogen metabolism in excystation may be viable as well.
The Role of Glycogen Metabolism in Cyst Production and Maturation
Our data here show that when E. histolytica is starved for glucose, glycogen
levels within the cell decline, suggesting it is used as a short-term supply of glucose. If
glycogen utilization is inhibited, it results in negative growth and encystation outcomes.
RT-PCR analysis revealed down-regulation of glycogen phosphorylase transcript levels
in cells grown in the absence of glucose.
A full transcriptomic analysis of encysting E. histolytica cells as described above
would be beneficial to further ascertain the role of key glycogen metabolism genes on
encystation. However, in the short term, a specific analysis of the three specific genes
highlighted here, glycogen synthase and glycogen phosphorylases 1 and 2, would be
interesting. Cellular glycogen may sustain cells starved of glucose for nearly 2 hours10.
However, here we examined glycogen metabolism gene expression at 48 hours, well
beyond where we would expect any glycogen to remain within the cell. The RT-PCR
experiments could maybe be done at an earlier point in time in order to accurately reflect
the use of glycogen within the cell.
Additionally, we did not examine here how the inhibition of glycogen metabolism
genes impacted cyst maturity. A “wattle-and daub” model for encystation in E. histolytica
has been proposed, wherein the skeleton of the chitin wall is formed prior to being filled
to completion11. Electron microscopy or detergent treatment experiments may be
valuable to determine the maturity of the cyst and the strength of the cyst wall.

155
Typically, detergent resistance is used to determine the completion of the chitin
cell wall12. Immature cysts with incomplete wall formation do not survive treatment with
harsh detergents13,14. A cyst maturity assay, wherein the cysts are treated with sarkosyl
and then examined via flow cytometry, would be beneficial in this case14. Furthermore,
electron microscopy of the cell wall in each strain would be valuable to examine the
differences in cell wall construction. Overall, our development of an in vitro encystation
method represents a major technological advancement in E. histolytica research and has
opened many additional avenues of investigation.

156
References
1. Byers, J., Faigle, W. & Eichinger, D. Colonic short-chain fatty acids inhibit
encystation of Entamoeba invadens. Cell. Microbiol. 7, 269–279 (2005).
2. Karasov, W. H. & Douglas, A. E. Comparative digestive physiology. Compr.
Physiol. 3, 741–783 (2013).
3. Licciardi, P. V, Ververis, K. & Karagiannis, T. C. Histone deacetylase inhibition
and dietary short-chain fatty acids. ISRN Allergy 2011, 869647 (2011).
4. Topping, D. L. & Clifton, P. M. Short-chain fatty acids and human colonic
function: Roles of resistant starch and nonstarch polysaccharides. Physiol. Rev. 81,
1031–1064 (2001).
5. Cummings, J. H., Pomare, E. W., Branch, W. J., Naylor, C. P. & Macfarlane, G. T.
Short chain fatty acids in human large intestine, portal, hepatic and venous blood.
Gut 28, 1221–1227 (1987).
6. Ehrenkaufer, G. M. et al. The genome and transcriptome of the enteric parasite
Entamoeba invadens, a model for encystation. Genome Biol. 14, R77 (2013).
7. Ehrenkaufer, G. M., Haque, R., Hackney, J. A., Eichinger, D. J. & Singh, U.
Identification of developmentally regulated genes in Entamoeba histolytica:
Insights into mechanisms of stage conversion in a protozoan parasite. Cell.
Microbiol. 9, 1426–1444 (2007).
8. Byers, J. & Eichinger, D. Entamoeba invadens: Restriction of ploidy by colonic
157
short chain fatty acids. Exp. Parasitol. 110, 203–206 (2005).
9. Biswa, M. N., Pradel, G., Frevert, U. & Eichinger, D. Compounds of the upper
gastrointestinal tract induce rapid and efficient excystation of Entamoeba
invadens. 6, 247–253 (2009).
10. Pineda, E. et al. In vivo identification of the steps that control energy metabolism
and survival of Entamoeba histolytica. FEBS J. 282, 318–331 (2015).
11. Chatterjee, A. et al. Evidence for a ‘wattle and daub’ model of the cyst wall of
Entamoeba. PLoS Pathog. (2009) doi:10.1371/journal.ppat.1000498.
12. Aguilar-Díaz, H., Díaz-Gallardo, M., Laclette, J. P. & Carrero, J. C. In vitro
induction of Entamoeba histolytica cyst-like structures from trophozoites. PLoS
Negl. Trop. Dis. 4, (2010).
13. Krishnan, D., Nayak, S. & Ghosh, S. K. Novel insights into Entamoeba cyst wall
formation and the importance of actin cytoskeleton. bioRxiv 2020.04.24.059360
(2020) doi:10.1101/2020.04.24.059360.
14. Welter, B. H., Sehorn, M. G. & Temesvari, L. A. Flow cytometric characterization
of encystation in Entamoeba invadens. Mol. Biochem. Parasitol. 218, 23–27
(2017).

158
APPENDICES

159
Appendix A
License for Use of Figure 1.2

160

161

162

163
Appendix B
License for Use of Figure 1.4

164

165

166

167

168
Appendix C
License for Use of Figure 1.5

169

170

171

172
Appendix D
License for Use of Figure 1.6

173

174

175


![Entamoeba histolytica - Near East Universitydocs.neu.edu.tr/staff/serdar.susever/20entemoeba [Uyumluluk Modu]_119.pdfEntamoeba histolytica Entamoeba: cell biology, disease, and treatment](https://img.pdfslide.us/doc/110x75/5e2b9a0a3cd62723c411ced3/entamoeba-histolytica-near-east-uyumluluk-modu119pdf-entamoeba-histolytica.jpg)
![Entamoeba histolytica / E. dispar - qu.edu.iqqu.edu.iq/vmjou/wp-content/uploads/2015/01/Vol.-111-8-14.pdf · [Entamoeba histolytica / E. dispar] ... Entamoeba histolytica trophozoite](https://img.pdfslide.us/doc/110x75/5aa7ee767f8b9ab8228ce260/entamoeba-histolytica-e-dispar-queduiqqueduiqvmjouwp-contentuploads201501vol-111-8-14pdfentamoeba.jpg)