Embed Size (px)
Citation preview
Encouraging Participation in Market Based Instruments and Incentive Programs
Research project number CSU29 of the Social and Institutional Research Program of Land & Water Australia. Completed April 2008.
Professor Mark Morrison1, Dr Jeanette Durante2, Ms Jenni Greig1 and Dr John Ward3
1. Charles Sturt University; 2. Queensland Department of Natural Resources and Water; 3. CSIRO
Funding for this research was provided by Land and Water Australia through the Social and Institutional Research Program (SIRP), Central West Catchment Management Authority and Northern Rivers Catchment Management Authority.
April 2008 Published by: Land & Water Australia
Postal address: GPO Box 2182 Canberra ACT 2601
Office Location: L1, The Phoenix Building,
86 Northbourne Avenue Braddon ACT 2612
Telephone: 02 6263 6000
Email: land&[email protected]
Internet: www.lwa.gov.au
© Land & Water Australia 2008
Disclaimer
The information contained in this publication is intended for general use, to assist public knowledge and discussion and to help improve the sustainable management of land, water and vegetation. It includes general statements based on scientific research. Readers are advised and need to be aware that this information may be incomplete or unsuitable for use in specific situations. Before taking any action or decision based on the information in this publication, readers should seek expert professional, scientific and technical advice.
To the extent permitted by law, the Commonwealth of Australia, Land & Water Australia (including its employees and consultants), the authors, and the Social and Institutional Research Program and its partners do not assume liability of any kind whatsoever resulting from any person’s use or reliance upon the content of this publication.
Citation
Morrison, M., Durante, J., Greig, J. & Ward, J. (2008). Encouraging Participation in Market Based Instruments and Incentive Programs. Final Report prepared for Land and Water Australia. Product code: PR081458
Print ISBN: 9781921253959
Designed by: TBC
Printed by: TBC
This project was funded by Land and Water Australia under their Social and Institutional
Research Program. Support for this project was also provided by the North Coast
Catchment Management Authority (NSW), Central West Catchment Management
Authority (NSW), Mt Lofty Ranges Catchment Management Authority (SA), Queensland
Department of Natural Resources and Mines, Charles Sturt University and CSIRO.
The project seeks to provide information about how to design and implement incentives
and market based instruments to increase participation of farmers.
The project team was lead by Professor Mark Morrison (CSU) and Mr Ray Baker
(Queensland Department of Natural Resources and Water). Other members of the project
team include Dr Jeanette Durante (Queensland Department of Natural Resources and
Water), Ms Jenni Greig (Charles Sturt University) and Dr John Ward (CSIRO).
Acknowledgements
Several people while not members of the project team need to be thanked for their
contribution to this final report. In particular, the assistance of Ms Therese Formosa (CSU)
in preparing the sample description and in conducting part of the regression analysis, and
Gillian Paxton (QDNRW) in helping with the analysis of the focus group data, are
gratefully acknowledged. The assistance of David Dowell (CSU) in completing the
reliability and validity analysis of the constructs and Mr Darren King (CSIRO) in preparing
the GIS maps of segments in local government areas is also acknowledged. Our thanks
also go to Lesley Macready, Lesley Pidgeon, Glenda Ware and David Hayward for their
help in conducting the mail survey and in transcribing the tapes from the focus groups.
Correspondence
Correspondence relating to this report should be directed to Professor Mark Morrison,
Phone: 61 2 6338 4253, Email: [email protected]
Table of Contents
EXECUTIVE SUMMARY .............................................................................................................................. 1
1. INTRODUCTION................................................................................................................................... 4
2. LITERATURE REVIEW....................................................................................................................... 7
3. METHODOLOGY................................................................................................................................ 12
3.1 EXPERT INTERVIEWS............................................................................................................................... 12 3.2 FOCUS GROUPS ....................................................................................................................................... 13 3.3 QUESTIONNAIRE ..................................................................................................................................... 15 3.4 SAMPLING ............................................................................................................................................... 19 3.5 QUANTITATIVE DATA ANALYSIS ............................................................................................................ 20
4. FINDINGS FROM THE EXPERT INTERVIEWS........................................................................... 24
4.1 CHARACTERISTICS OF MBI AND INCENTIVE PROGRAMS THAT INCREASE PARTICIPATION...................... 24 4.2 WHO PARTICIPATES IN MBI’S AND INCENTIVES? .................................................................................... 26 4.3 HOW TO COMMUNICATE MBI’S AND INCENTIVES TO INCREASE PARTICIPATION ................................... 28
5. FOCUS GROUP FINDINGS ............................................................................................................... 30
5.1 WHAT ARE THE FEATURES OR CHARACTERISTICS OF MBIS AND INCENTIVE PROGRAMS THAT ENCOURAGE
PARTICIPATION?............................................................................................................................................ 30 5.2 WHO PARTICIPATES IN INCENTIVES PROGRAMS?..................................................................................... 34 5.3 HOW CAN WE COMMUNICATE MBIS AND INCENTIVE PROGRAMS TO INCREASE PARTICIPATION?............ 35 5.4 CONCEPTUAL MODEL SHOWING THE FACTORS INFLUENCING LANDHOLDER PARTICIPATION ................ 37
6. QUANTITATIVE RESULTS .............................................................................................................. 39
6.1 SATISFACTION......................................................................................................................................... 39 6.2 PREFERRED PROGRAM CHARACTERISTICS .............................................................................................. 42 6.3 WHO PARTICIPATES IN MARKET BASED INSTRUMENTS AND INCENTIVE PROGRAMS.............................. 51 6.4 LANDHOLDER SEGMENTS ....................................................................................................................... 56 6.5 EFFECTIVE METHODS OF COMMUNICATION............................................................................................ 72
7. LIMITATIONS ..................................................................................................................................... 76
8. CONCLUSIONS AND RECOMMENDATIONS .............................................................................. 77
APPENDIX 1: INTERVIEWER’S OUTLINE FOR EXPERT INTERVIEWS ....................................... 94
APPENDIX 2: FOCUS GROUP ORGANISATION DETAILS................................................................. 97
APPENDIX 3: SAMPLE DESCRIPTION ................................................................................................... 99
APPENDIX 4: RESULTS FROM THE FACTOR ANALYSIS AND OTHER VALIDITY TESTS.... 109
APPENDIX 5: DIFFERENCES IN THE USE OF INFORMATION CHANNELS ACROSS REGIONS........................................................................................................................................................................ 114
Table of Tables TABLE 1: EXPERTS BY GROUP............................................................................................................................ 13 TABLE 2: SUMMARY OF FOCUS GROUP PARTICIPANTS IN EACH CMA/REGIONAL BODY AREA........................ 14 TABLE 3: RESPONSE RATE DETAILS FOR EACH OF THE FIVE CASE STUDY AREAS ............................................ 20 TABLE 4: OVERALL SATISFACTION WITH LAST PROGRAM PARTICIPATED IN EACH OF THE FIVE REGIONS ....... 40 TABLE 5: SATISFACTION WITH NRM PROGRAMS ACROSS THE FIVE REGIONS .................................................. 41 TABLE 6: PEARSON CORRELATION WITH OVERALL SATISFACTION ................................................................... 42 TABLE 7: PREFERENCES FOR ORGANISATION DELIVERING THE NRM PROGRAM .............................................. 43 TABLE 8: INTEREST IN RECEIVING FUNDING FOR DIFFERENT ACTIVITIES ACROSS REGIONS ............................ 44 TABLE 9: OTHER SUGGESTED ACTIVITIES FOR FUNDING................................................................................... 45 TABLE 10: IMPORTANCE OF ALTERNATIVE FORMS OF TECHNICAL ASSISTANCE ACROSS REGIONS .................. 46 TABLE 11: PREFERENCES FOR PAYMENT OPTIONS ACROSS REGIONS ............................................................... 49 TABLE 12: PREFERENCES FOR CONTRACT LENGTH ACROSS REGIONS ............................................................... 50 TABLE 13: PREFERENCES FOR CONTRACT OPTIONS ACROSS REGIONS.............................................................. 50 TABLE 14: PREFERENCES FOR MONITORING ACROSS REGIONS......................................................................... 51 TABLE 15: BINARY LOGISTIC REGRESSION SHOWING THE INFLUENCE OF CHARACTERISTICS OF RESPONDENTS
ON PARTICIPATION IN AN INCENTIVE PROGRAM IN THE LAST 5 YEARS..................................................... 53 TABLE 16: BINARY LOGIT REGRESSIONS SHOWING THE INFLUENCE OF THE ATTITUDINAL AND BEHAVIOURAL
CONSTRUCTS ON PARTICIPATION............................................................................................................. 58 TABLE 17: ORDERED LOGIT REGRESSIONS SHOWING THE INFLUENCE OF THE ATTITUDINAL AND BEHAVIOURAL
CONSTRUCTS ON INTEREST IN FIXED GRANTS, COST SHARE AND TENDERS............................................ 60 TABLE 18: DISTRIBUTION OF SEGMENTS ACROSS CASE STUDY AREAS ............................................................. 61 TABLE 19: ATTITUDES, BEHAVIOURS AND SITUATIONAL AND SOCIO-DEMOGRAPHIC CHARACTERISTICS OF THE
LANDHOLDER SEGMENTS ........................................................................................................................ 64 TABLE 20: AWARENESS AND KNOWLEDGE OF MBI AND INCENTIVES ACROSS SEGMENTS................................ 66 TABLE 21: PARTICIPATION IN EXISTING MBIS AND INCENTIVES, AND INTEREST IN FIXED GRANTS, COST SHARE
PROGRAMS AND TENDERS ACROSS SEGMENTS ........................................................................................ 68 TABLE 22: USEFULNESS OF FARMING INFORMATION SOURCES......................................................................... 73 TABLE 23: USEFULNESS OF INFORMATION CHANNELS ACROSS LANDHOLDER SEGMENTS ............................... 75 TABLE 24: AGE DISTRIBUTION OF RESPONDENTS ACROSS CATCHMENTS ......................................................... 99 TABLE 25: GENDER OF RESPONDENTS ACROSS CATCHMENTS ........................................................................ 100 TABLE 26: OCCUPATION OF RESPONDENTS ACROSS CATCHMENTS................................................................. 101 TABLE 27: HIGHEST LEVEL OF FORMAL EDUCATION ACROSS CATCHMENTS.................................................. 102 TABLE 28: YEARS LIVED IN DISTRICT ACROSS CATCHMENTS......................................................................... 102 TABLE 29: YEARS LIVED ON PROPERTY ACROSS CATCHMENTS...................................................................... 103 TABLE 30: PROPORTION OF FAMILY INCOME EARNED OFF-FARM ACROSS CATCHMENTS .............................. 104 TABLE 31: SUFFICIENCY OF FAMILY INCOME EARNED ACROSS CATCHMENTS ............................................... 104 TABLE 32: AREA OF PROPERTY ACROSS CATCHMENTS................................................................................... 105
TABLE 33: NUMBER OF FULL TIME WORKERS OTHER THAN RESPONDENT PER FARM ACROSS CATCHMENTS 106 TABLE 34: NUMBER OF PART TIME WORKERS OTHER THAN RESPONDENT PER FARM ACROSS CATCHMENTS 106 TABLE 35: PERCENTAGE OF FARM EQUITY ACROSS CATCHMENTS ................................................................. 107 TABLE 36: MAIN FARMING ACTIVITIES ACROSS CATCHMENTS ...................................................................... 107 TABLE 37: PROPERTY MANAGED AS A LIFESTYLE BLOCK ACROSS CATCHMENTS .......................................... 108 TABLE 38: PATTERN MATRIX FROM THE FACTOR ANALYSIS .......................................................................... 110 TABLE 39: CHRONBACH ALPHAS FOR ALL OF THE ATTITUDINAL SCALES ....................................................... 111 TABLE 40: TESTS OF CONVERGENT VALIDITY................................................................................................. 112 TABLE 41: VARIANCE EXTRACTED AND SQUARED CORRELATION RESULTS FOR THE DISCRIMINANT VALIDITY
TESTS..................................................................................................................................................... 113 TABLE 42: USEFULNESS OF FARMING INFORMATION SOURCES IN THE CENTRAL WEST REGION .................... 114 TABLE 43: USEFULNESS OF FARMING INFORMATION SOURCES IN THE NORTHERN RIVERS REGION ............... 115 TABLE 44: USEFULNESS OF FARMING INFORMATION SOURCES IN THE CONDAMINE ALLIANCE REGION......... 116 TABLE 45: USEFULNESS OF FARMING INFORMATION SOURCES IN THE MACKAY WHITSUNDAY REGION........ 117 TABLE 46: USEFULNESS OF FARMING INFORMATION SOURCES IN THE MT LOFTY REGION............................. 118
Table of Figures FIGURE 1: DESCRIPTION OF FIXED GRANT PROGRAMS, COST SHARE AND TENDERS USED IN THE
QUESTIONNAIRE ...................................................................................................................................... 17 FIGURE 2: CONCEPTUAL MODEL SHOWING THE FACTORS INFLUENCING LANDHOLDER PARTICIPATION .ERROR!
BOOKMARK NOT DEFINED. FIGURE 3: RELATIONSHIP BETWEEN AMOUNT OF GRANT, PROBABILITY OF SUCCESS AND TIME RESPONDENTS
ARE WILLING TO SPEND PREPARING GRANT APPLICATIONS.................................................................... 47 FIGURE 4: TIME SPENT ON INCENTIVE APPLICATION BY HIGHEST PERCENTAGE PER AGE GROUP........................ 48 FIGURE 5: AVERAGE STANDARDISED VALUES FOR BUSINESS ORIENTATION, CONNECTEDNESS, INFORMATION
SEEKING AND TRUST ACROSS THE FIVE LANDHOLDER SEGMENTS............................................................. 62 FIGURE 6: LANDHOLDER SEGMENTS WITHIN LOCAL GOVERNMENT AREAS OF THE MT LOFTY REGION........... 69 FIGURE 7: LANDHOLDER SEGMENTS WITHIN LOCAL GOVERNMENT AREAS OF THE CENTRAL WEST REGION .. 70 FIGURE 8: LANDHOLDER SEGMENTS WITHIN LOCAL GOVERNMENT AREAS OF THE NORTHERN RIVERS REGION
................................................................................................................................................................. 71
Executive Summary
The goal of this research project has been to understand how to improve the design and
delivery of MBIs and incentive programs to increase the participation of landholders. Low
levels of participation can reduce the ability of programs to achieve their desired outcomes,
as well as reduce their efficiency. To understand how to increase landholder participation,
answers to three main research questions have been sought, namely 1) what are the
characteristics of MBIs and incentive programs that encourage participation, 2) who
participates in MBIs and incentive programs and 3) how can MBIs and incentives be better
communicated to increase participation?
A mixed methods research design was used to provide answers to these questions. This
included a literature review (two working papers), 25 expert interviews (one working
paper), eight focus groups (one working paper) in four regions of NSW and Queensland,
and a quantitative survey of about 6000 landholders from two Catchment Management
Authority (CMA) areas in NSW (Central West and Northern Rivers), two regional body
areas in Queensland (Condamine Alliance and Mackay-Whitsundays) and one CMA area in
South Australia (Mt Lofty Ranges).
The results indicated that the features of MBIs and incentives could be modified to increase
participation, and that options were available other than simply paying landholders more
and accepting reduced environmental outcomes. The choice of program administrator can
influence participation as can how the program is delivered. Features such as flexibility in
required environmental outcomes and management practices, amount of paper work
required, availability of technical assistance and clarity about such things as eligibility and
how bids will be assessed all were found to affect landholder participation. Contracting
arrangements were also demonstrated to be important; these include contract length, the
approach used for monitoring, and the chosen payment schedule. Landholders were also
sensitive to the type of program on offer, with landholders having much greater interest in
applying for a fixed grant or a variable cost share program rather than a tender.
In terms of who participates in MBIs and incentives, the influence of socio-demographic,
attitudinal, behavioural and situation variables on participation was investigated. For the
Page | 1
socio-demographics, it was found that age was negatively related and education was
positively related to participation. For attitudes, trust in the organisations delivering natural
resources management programs was found to be a particularly important predictor of
participation. Other attitudes such as environmental responsibility, innovativeness and
profit focus were investigated but were only found to be good predictors of behavioural
intentions, and not actual participation. Behavioural variables were found to be particularly
important for predicting participation, with social connectedness, business orientation and
information seeking found to be amongst the best predictors of all variables investigated.
Lastly, several situational variables were found to influence participation, including farm
size, hours of time worked on farm and length of time on current property.
The four variables that overall had the largest and most consistent influence on participation
– trust, social connectedness, business orientation and information seeking – were used to
define landholder segments. Five segments were identified, including three mainstream
landholder segments and two hobby farmer segments. These segments differed
substantially in their socio-demographic and situational characteristics, as well in their
business orientation, information seeking behaviour, connectedness in their communities
and trust of NRM groups. The groups also differed in terms of their current participation in
MBIs and incentives. Importantly, two of the segments which jointly comprise more than
50% of landholders in some regions – the “profit first” landholders and “smaller,
disconnected, hobby farmers” – have very low awareness of existing programs and very
low participation. GIS maps indicate that these two segments dominate certain local
government areas within the case study areas. Both of these segments generally have a
lower socio-demographic status than the other three segments. Also, their use of the
information channels mostly used by NRM groups to communicate information about
MBIs and incentives is very limited, so these two segments are very challenging to reach
with promotional messages.
Thirdly, insight was provided into the effectiveness of various information channels and
promotional messages. The literature provides some recommendations about how to design
communication programs based on the market context, with factors such as the size of the
market, funds and time available, and the receptivity of landholders influencing the choice
of information channels. However, there was also evidence from the literature and our
qualitative and quantitative research about the effectiveness of specific communication
Page | 2
channels. There was evidence that where landholders hear about a program via direct
contact (eg through extension officers) they are more likely to participate. Similarly,
although probably to a lesser extent, networks, field days, seminars and experimental
economics workshops can be persuasive information channels. However, all of these
channels are limited in their reach which also influences effectiveness, and hence it is
recognised that there is a role for other information channels such as the use of newsletters,
advertising or the internet. In general, advertising was found to have less of an influence on
a landholder’s decision to participate in a program than these other channels; however its
effectiveness can be increased by tailoring messages to the local area and using case studies
that landholders can relate to. Interestingly the internet was hardly mentioned in the
literature and was not thought to be particularly important in our expert interviews,
however it was found in our quantitative survey to be highly valued by landholders as an
information source for farming related issues. This appears to be a channel that could be
more fully exploited in the future. Furthermore, the evidence from the segmentation
analysis suggests that channels such as industry newsletters, the internet, print media and
radio, while generally considered to be less effective overall than some of the other
channels, may be the most effective channels for targeting some of the more difficult to
reach segments. As well as considering what information channels to use, the effectiveness
of alternative messages was evaluated. The evidence from our qualitative research is that
the most effective messages emphasise the benefits to landholders and how the program
will improve the management of their property and their business.
Page | 3
1. Introduction
The purpose of this project was to improve our knowledge regarding how to design and
implement market-based instruments (MBIs) and incentive programs to increase
participation of landholders. Understanding how to increase landholder participation is
important as various programs have in the past suffered from low landholder participation.
Furthermore, participation is related to the dual goals of efficiency and equity. If few
landholders participate in a market-based instrument, the potential for efficiency gains is
likely to be reduced. In terms of equity, if only certain kinds of landholders participate out
of a broader target audience (eg high end, business oriented landholders) then the equity
outcomes from using a particular program may be negative. For these reasons it is
important to understand how MBIs and incentive programs can be designed and delivered
to increase participation.
To better understand how to increase landholder participation, three main research
questions are answered. The first of these is what are the features or characteristics of
MBIs and incentive programs that encourage participation? As might be expected, the
literature indicates that greater compensation and lesser required environmental outcomes
will increase participation. However, are there means that do not involve increased costs
and do not compromise the environmental integrity of natural resource management
programs that can be used to increase participation? The evidence from our literature
review as well as our qualitative and quantitative research suggests that there are a range of
modifications that can be made to the characteristics of programs that can increase
landholder participation. This includes inter alia modifications to such things as who
delivers the program, what activities are funded, how monitoring is done, the length of
contracts, the spacing of funding, and simplicity of administration. Furthermore, we find
that landholder participation is likely to be a function of the type of instrument/incentive
that is used. We find that landholder interest in participating is lowest for tenders, and
highest for simple fixed grants, with interest in variable cost-share programs in the middle.
Page | 4
The second question focuses on understanding who participates in MBIs and incentive
programs. Understanding the characteristics of those who participate is important for better
targeting of promotional efforts as well as for informing instrument design and selection.
The advantage of knowing those who more often participate is that promotional efforts can
be focused on those landholders. For example, if certain landholders (eg from larger
properties) tend to favour one kind of program, while other landholders (eg from smaller
properties who have more off-farm income) prefer other kinds of programs this information
can be used for targeted promotions. Secondly, understanding who is not participating in
programs can provide insight into the sorts of modifications to existing MBIs and
incentives – or perhaps insight into what new instruments need to be offered – that may be
needed to encourage involvement of non-participants.
While it is useful to identify the characteristics of those more likely to participate in an MBI
or incentive program, when implementing an MBI or incentive it is helpful to be able to
identify segments amongst farmers in terms of their characteristics and probable
participation. The ability to group farmers with common characteristics, and common
locations, is useful for selecting which MBIs or incentives are most appropriate for
particular sub-catchments as well as for the application of communication strategies.
However, there is limited literature in this area; little research has been conducted to
identify the most appropriate attitudinal or behavioural constructs for identifying these
segments and no previous studies have focused on identifying segments for the purpose of
encouraging participation in MBIs and incentives. Therefore one of the main goals of this
research is to understand how to segment landholders in such a way that is useful to NRM
groups involved in designing and implementing MBIs and incentives.
The third and final question considered is how to communicate and deliver MBIs and
incentive programs to maximise participation. This is not an area of research that has
received much attention in the academic literature, however communication has a central
role in our conceptual model, and in marketing more generally in explaining participation.
There are several challenges in developing an effective communication strategy. These
include firstly identifying effective communication channels for different segments in the
landholder population. Some literature is available on this topic relating to the
Page | 5
effectiveness of advertising, workshops, through facilitators/extension officers, use of
experimental economics workshops and networks, and when each should be used.
However, there is less understanding of the type and content of messages that will have the
greatest traction with landholders in terms of increasing participation. In advertising theory
it is recognised that advertising messages have different goals (eg awareness, information,
persuasion etc) (Rossiter and Bellman 2005), with the appropriateness of each of these
message types being a function of a person’s existing knowledge and whether they are
currently “in the market” for the good in question. Fully understanding how to develop a
communication strategy is beyond the scope of this project; however some steps are taken
to identify communication channels that are likely to be most effective in reaching the
various landholder segments and the sorts of messages that might be appropriate for these
groups.
A mixed methods research design was used to answer these three research questions. After
completion of a literature review (two working papers), extensive qualitative research was
conducted including 25 expert interviews with NRM practitioners from Catchment
Management Authorities and regional NRM bodies, academics, government officers and
consultants, as well as 8 focus groups of farmers from two states. This was followed by a
quantitative survey of about 6000 landholders (47.3% response rate) across three states
(NSW, Queensland and South Australia) and five CMA/Regional Body areas (Central West
CMA and Northern Rivers CMA in NSW, Condamine Alliance and Mackay-Whitsundays
in Queensland and Mt Lofty Ranges in South Australia).
The structure of this report is based around these three research questions. In the next
section, the literature review, the literature pertaining to each of these research questions is
briefly summarised. Interested readers can find more detail in the two working papers
available on the Institute for Land, Water and Society, Charles Sturt University website.
The methodology used for this project is more fully described next in Section 3. The
findings from the expert interviews and focus groups are then described in Sections 4 and 5
respectively. The results from the quantitative survey are then described in Section 6,
Limitations are described in Section 7 and Conclusions and Recommendations are offered
in Section 8.
Page | 6
2. Literature Review
The literature review for this project is contained in two separate working papers –
(Stanley, Clouston & Baker; Morrison & Greig, 2007). The first considers the issue of
drivers and constraints to involvement in natural resource management through the
adoption of changed practices, technologies and NRM activities. The second considers the
drivers for and constraints to the uptake of MBIs and incentive programs in particular. The
following is a summary of the findings of both papers.
In the first literature review, Stanley, Clouston and Baker acknowledged that it is
“imperative” to identify factors which may influence the uptake of sustainable practices by
landholders before attempting to apply economic and social incentive instruments. The
reason given is two-fold: firstly, without understanding the role of such factors, incentives
may not address constraints, or take advantage of drivers, and therefore will not maximise
the potential for change; and secondly, instruments may be perceived by landholders to be
insensitive to their situations, thus making it more difficult to engage them in future
programs. The literature highlighted a number of factors which explain adoption, these
being related to the three central research questions which formed the basis of this project.
The characteristics of the practice landholders are being asked to adopt may be a barrier to
adoption for landholders. Attributes that landholders will take into consideration include
relative advantage, riskiness, complexity, compatibility, trialability and observability (Cary,
Webb & Barr, 2002; Rogers, 2003). If a practice is seen as being difficult to implement,
incompatible with current farming practices, if the costs to the landholder outweigh the
perceived benefits, or if there is little opportunity to observe potential benefits, it will likely
be unappealing to landholders, and will have low adoption rates (for example, see Vanclay
& Lawrence, 1995; Cary et al, 2002; Vanslembrouck, van Huylenbroeck & Verbeke, 2002;
Curtis & Robertson, 2003).
The methods used to communicate with landholders about a given practice will also play a
role in adoption. Evidence suggests that there is a strong correlation between non-adoption
Page | 7
of changed practices and lack of confidence in the practice. This lack of confidence may be
driven by the practice itself, by individual landholder characteristics (such as adversity to
risk), or by previous negative experience with the agency – the literature emphasises
negative experience with government agencies (Finlay, 2004). In these instances,
communication methods may be used to encourage landholder confidence, or methods of
delivery may include promoting the relationship between an agency and landholders. Poor
access to trusted information about the problem and solutions, which is being addressed by
the recommended changed practice, was also identified as a constraint to adoption rates
(Vanclay, 1992). This also highlights the importance of communication methods which are
tailored to the target audience in order to promote adoption of sustainable practices.
In terms of who is likely or unlikely to adopt changed practices, the literature provided
some unexpected findings. For example, it is often thought that younger landholders, and
those with more formal education, are more likely to adopt than older and less educated
landholders. The literature review found little evidence to support this, suggesting instead
that, at best, the relationship is unclear, particularly as these relationships cannot be
examined in isolation (Guerin & Guerin, 1994; Curtis, Mackay, van Nouhuys, Lockwood,
Byron, Graham, 2000; Cary et al, 2002). The one concession was that adoption does seem
to be positively influenced by participation in ongoing education related to property
activities (eg training courses and field days). Landholder attitudes towards natural
resource management were also considered as a factor, as low rates of adoption are
frequently believed to be caused by landholder attitudes. The literature suggests that
landholders do need to have a positive attitude towards land stewardship, but that this alone
is not sufficient - other constraints must be addressed to encourage adoption (Vanclay &
Lawrence, 1994; Lockie & Rockloff, 2004). The literature regarding succession, social
capital and financial factors of landholders was inconclusive. Both succession and social
capital have been found to have either positive or negative impacts, and neither should be
relied on as a predictor of adoption. Financial constraints emerged as much more complex
than the traditionally held belief that financially constrained landholders are less likely to
adopt changed practices than more affluent landholders. While there is some evidence that
being financially constrained does decrease the likelihood of adoption, it does not follow
that more financial resources will result in greater rates of adoption (Greiner, Stoeckl,
Stokes, Herr, Bachmaier, 2003). Perception of financial situation and other socio-cultural
Page | 8
factors interact with actual financial status (Cary et al, 2002), and the existing literature was
unclear about the exact relationship between these numerous influences.
In the second literature review, Morrison and Greig (2007) investigated the relatively new
body of literature covering the constraints to the uptake of MBIs and incentive programs
both in Australia and overseas. This body of literature again drew attention to the three
central research questions.
The characteristics of MBIs and incentive programs have a role in influencing landholder
participation (for example, see Windle, Rolfe, Whitten, Alam & Street, 2005). Obvious
design features include increasing compensation and decreasing demands placed on
landholders in order to make a program more attractive (Ducos & Dupraz 2006). However,
similar to the previous literature review, the relationship is not as formulaic as this suggests,
and landholders place value on other program features. The literature suggests that
landholders are attracted to programs which have the flexibility to allow negotiation of on-
ground actions and expected outcomes (Wossink & van Wenum 2003; Horne 2006). Other
features which influence participation include the length of contract (eg Brotherton 1991),
the program administrator (Breetz et al 2005; Rolfe et al 2005), use of group contracts
(Rolfe et al 2005; Windle et al 2005) and reduced paperwork (eg Clayton 2005).
The literature also addresses the issue of individual landholder characteristics that might
predict participation in MBIs and other incentive programs through the use of stated
preference surveys and also by examining the characteristics of participants in existing
programs. Socio-demographic characteristics yielded mixed results. In the majority of
studies age was found to be negatively related to participation, though in one study by
Rolfe, Windle, Reeson & Whitten (2006) it was found to be insignificant, and a second by
Ducos and Dupraz (2006) found a non-linear relationship where participation was most
likely for those between 40 and 55 years. The findings for education were more
inconsistent, with some studies finding it to have a positive effect (eg Black and Reeve
1993) and others that it had a negative effect (eg Rolfe et al 2006). Having dependent
children, however, was found to be a consistently positive predictor of participation (Ducos
and Dupraz 2006; Rolfe et al 2006).
Page | 9
Like socio-demographics, there was much variation in the influence of attitudes on
participation. Environmental or conservation attitudes was found to have a positive and
significant effect in some studies (Vanslembrouck et al 2002; Ha et al 2003; Rolfe et al
2006), but negative or insignificant in others (eg Wynn et al 2001; Ducos and Dupraz
2006). However, attitudes towards a program produced more consistent findings – having
a positive attitude was found to have a positive impact on participation (Brotherton 1991,
Ducos and Dupraz 2006). Relatedly, trust in those delivering the program and having a
positive relationship with government administrators was found to increase participation
(Ducos and Dupraz 2006). Furthermore, a series of studies had demonstrated that
familiarity with, or participation in previous programs significantly affected the likelihood
of participation (Vanslembrouck et al 2002; Wossink and van Wenum 2003; Clayton 2005,
Ducos and Dupraz 2006). Lastly, several studies noted that non-participation was related to
the perception of government interference (Wossink and van Wenum 2003; Ducos and
Dupraz, 2006)
Previous studies have demonstrated that property characteristics can influence the
likelihood of participation. Property size is the most studied predictor, and has been found
to have either a positive or negative influence on participation, depending on the nature of
the program (Brotherton, 1991; Black and Reeve, 1993; Curtis et al 2006). While the
influence of property size on participation in less clear a priori, a number of studies have
found that the likelihood of participation increases when the program requirements fit well
with the property (eg Rolfe et al 2006), whereas higher costs (eg financial, time, or reduced
productivity) associated with participation lowers the likelihood of participation (Wynn et
al 2001; Clayton 2005).
Finally, the literature review indicated that there are different landholder segments, and that
these segments have different constraints and drivers in their decision to participate in
MBIs and incentives. Three studies were considered, and these had considerable variation
in both methodology and findings (Darbyshire, 1999; Watson & Pryor, 2002; Thomson,
2001). Two key lessons emerge from the literature – the first is that, in what few studies
are publicly available, there are significant limitations, such as a lack of justification for
constructs used to form segments. The second key lesson is that there appears to be a gap
in the current knowledge of how to encourage uptake, specifically of MBIs, amongst
different segments.
Page | 10
Some research has been undertaken on the types of information channels that encourage
participation in MBIs and incentive programs. The most persuasive form of
communication appears to be word-of-mouth, which operates through extension officers as
well as existing networks and community opinion leaders (Lynch & Lovell, 2003; Rogers,
2003). Direct contact through extension officers has the advantage of building trust as well
as providing the opportunity to deal with misinformation and provide appropriate technical
advice on potential management actions. The use of networks has the advantage of being a
cost-effective form of communication, however, the reach is often limited (Breetz, Fisher-
Vanden, Jacobs & Schary, 2005). Seminars and workshops can also increase participation,
and the empirical evidence suggests that those who heard about a program through
attending a seminar or workshop are more likely to participate than those informed solely
through advertising (Lynch and Lovell 2003, Frondel, Lehmann and Watzold 2006). While
advertising has been shown to be less persuasive than other these other forms of
communication it still has a role in reaching landholders who are not otherwise easy to
reach. The literature also highlights that the effectiveness and hence appropriateness of
using alternative information channels will depend on the market context. Factors such as
the size of the market, time and funding constraints, initial farmer attitudes towards the
program will all influence which of these channels are likely to be most suitable (Breetz et
al 2005).
In conclusion, the literature demonstrates that the design features of MBIs and incentive
programs do influence participation. Second, landholder and property characteristics can
be used to predict the likelihood that different landholders will participate. However, only
certain variables (eg age, trust, attitude towards and participation in previous programs,
potential to gain) are robust predictors. Relatively little is known about landholder
segments and how to define them, particularly in the case of MBIs and incentives. Third,
information channels differ in their effectiveness at persuading landholder to participate in
a program, however the relative effectiveness of the various channels does depend on the
market context.
Page | 11
3. Methodology
A mixed methods research design was used for this project. This included a literature
review (see Working Papers 1 and 2), qualitative research which included expert interviews
(see Working Paper 3) and focus groups, and lastly a quantitative survey. Each of these
aspects of the research design provided information relevant for answering each of the
research questions. Further detail on the qualitative and quantitative components of the
research design is provided in the following subsections.
3.1 Expert Interviews
The goal of the expert interviews was to provide initial qualitative insight from NRM
practitioners, government officers, consultants and academics into each of the research
questions. In the interviews, 15 questions were asked of the experts to provide insight into
how MBIs and incentives could be designed to increase participation, to identify the sorts
of people more likely to participate in MBIs and incentives and whether they differed
across different types of instruments, and any ideas that experts had for improving
communication of MBIs and incentives. The interviewer’s outline is presented in
Appendix 1.
A list of experts was initially constructed through the review of literature and through key
stakeholders in this research. This list targeted individuals working as academics, regional
practitioners, consultants and working in government. Further, experts being interviewed
were invited to recommend other experts who were likely to have valuable insights into the
areas covered in the survey (ie snowballing). Experts were invited to take part in an
individual interview, although two of the participants were interviewed together. Two
experts declined and two others were unable to be contacted. The interviews continued until
theoretical saturation occurred.
A total of 22 interviews were conducted involving experts from Tasmania, Queensland,
NSW and Victoria, as shown in Table 1. A number of these experts had experience in
multiple fields. For example, many of the academics indicated they had previously worked
Page | 12
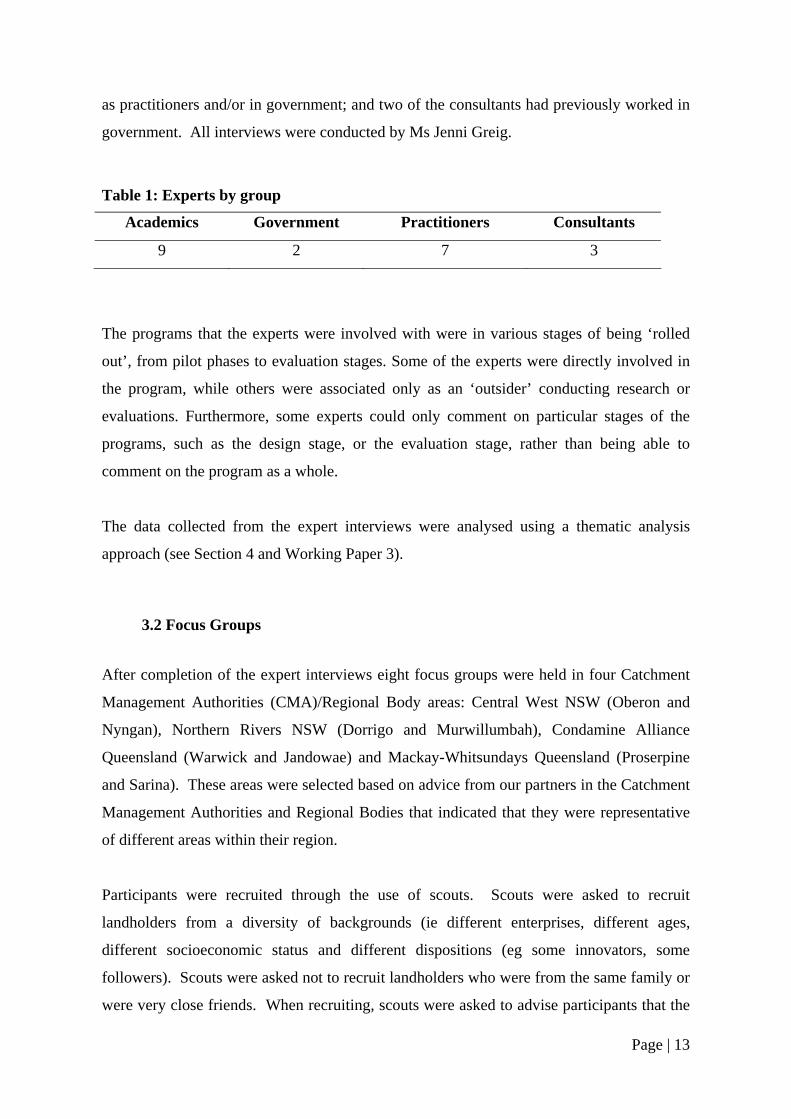
as practitioners and/or in government; and two of the consultants had previously worked in
government. All interviews were conducted by Ms Jenni Greig.
Table 1: Experts by group
Academics Government Practitioners Consultants
9 2 7 3
The programs that the experts were involved with were in various stages of being ‘rolled
out’, from pilot phases to evaluation stages. Some of the experts were directly involved in
the program, while others were associated only as an ‘outsider’ conducting research or
evaluations. Furthermore, some experts could only comment on particular stages of the
programs, such as the design stage, or the evaluation stage, rather than being able to
comment on the program as a whole.
The data collected from the expert interviews were analysed using a thematic analysis
approach (see Section 4 and Working Paper 3).
3.2 Focus Groups
After completion of the expert interviews eight focus groups were held in four Catchment
Management Authorities (CMA)/Regional Body areas: Central West NSW (Oberon and
Nyngan), Northern Rivers NSW (Dorrigo and Murwillumbah), Condamine Alliance
Queensland (Warwick and Jandowae) and Mackay-Whitsundays Queensland (Proserpine
and Sarina). These areas were selected based on advice from our partners in the Catchment
Management Authorities and Regional Bodies that indicated that they were representative
of different areas within their region.
Participants were recruited through the use of scouts. Scouts were asked to recruit
landholders from a diversity of backgrounds (ie different enterprises, different ages,
different socioeconomic status and different dispositions (eg some innovators, some
followers). Scouts were asked not to recruit landholders who were from the same family or
were very close friends. When recruiting, scouts were asked to advise participants that the
Page | 13
purpose of the discussion group was to discuss “farm management incentives”.
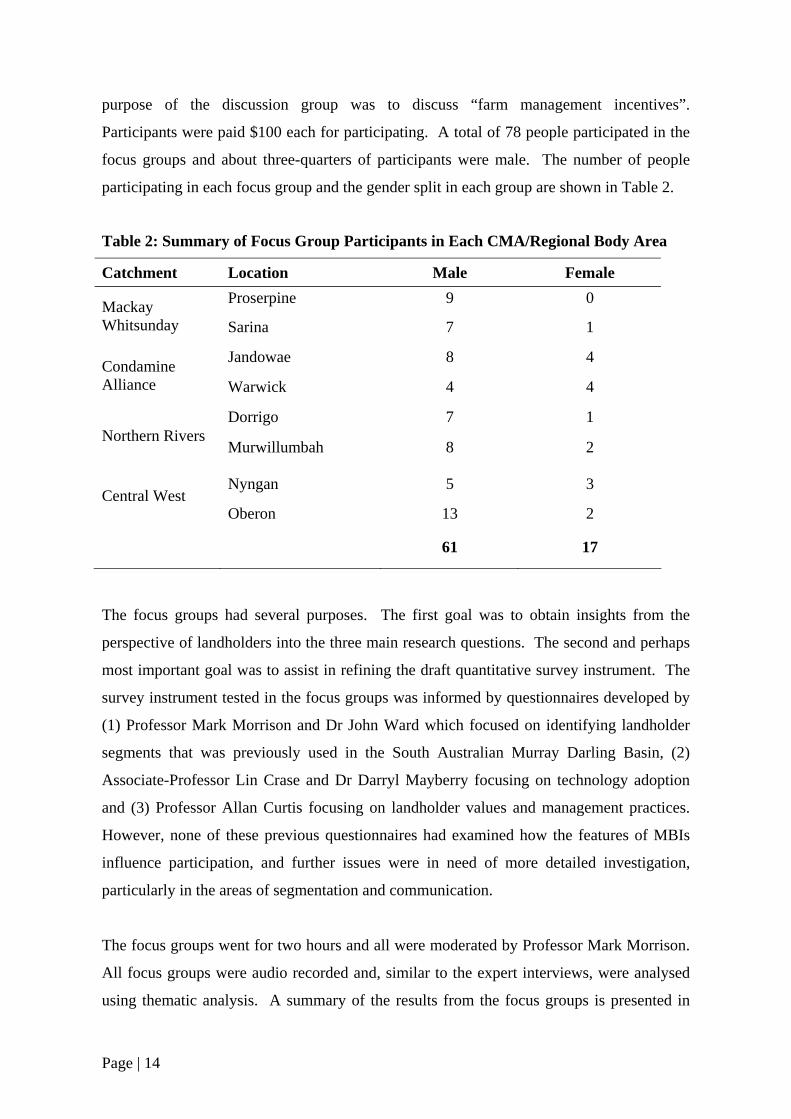
Participants were paid $100 each for participating. A total of 78 people participated in the
focus groups and about three-quarters of participants were male. The number of people
participating in each focus group and the gender split in each group are shown in Table 2.
Table 2: Summary of Focus Group Participants in Each CMA/Regional Body Area
Catchment Location Male Female Proserpine 9 0 Mackay
Whitsunday Sarina 7 1
Jandowae 8 4 Condamine Alliance Warwick 4 4
Dorrigo 7 1 Northern Rivers
Murwillumbah 8 2
Nyngan 5 3 Central West
Oberon 13 2
61 17
The focus groups had several purposes. The first goal was to obtain insights from the
perspective of landholders into the three main research questions. The second and perhaps
most important goal was to assist in refining the draft quantitative survey instrument. The
survey instrument tested in the focus groups was informed by questionnaires developed by
(1) Professor Mark Morrison and Dr John Ward which focused on identifying landholder
segments that was previously used in the South Australian Murray Darling Basin, (2)
Associate-Professor Lin Crase and Dr Darryl Mayberry focusing on technology adoption
and (3) Professor Allan Curtis focusing on landholder values and management practices.
However, none of these previous questionnaires had examined how the features of MBIs
influence participation, and further issues were in need of more detailed investigation,
particularly in the areas of segmentation and communication.
The focus groups went for two hours and all were moderated by Professor Mark Morrison.
All focus groups were audio recorded and, similar to the expert interviews, were analysed
using thematic analysis. A summary of the results from the focus groups is presented in
Page | 14
Section 5 of this report, and a more detailed explanation of the findings will be available
shortly in Working Paper 4.
3.3 Questionnaire
The questionnaire used in the quantitative survey was titled “Improving Incentive Programs
for Farm Management: A Survey of Landholder Attitudes”. The survey was 17 pages in
length and presented in an A4 booklet with a full colour cover. The questionnaires were
largely the same for each CMA/Regional Body area, apart from a few questions that
referred to specific programs in each of these areas. The questionnaire had seven parts, as
follows:
• Part 1 collected background information on occupation, time worked on a farm
per week, length of time in the district and on current property, area of property
and employees.
• Part 2 sought to collect information on various attitudes. More specifically the
questions were asked to enable measurement of constructs relating to
environmental attitude, profit focus, tradition, perceived time constraints,
perceived capital constraints, innovation, and information seeking behaviour.
• In Part 3, information was collected on incentive programs in each of the case
study areas. This included information on awareness, programs that respondents
had applied to participate in or had participated in, their satisfaction with various
aspects of the last program that they had participated in and overall satisfaction.
Furthermore, questions were also included to ascertain respondents’ interest in
two incentive programs and one MBI: a simple fixed grants program, a variable
cost-share program where the amount paid to respondents depended on the
extent of the environmental benefit achieved, and tenders. The actual
description of the programs used in the questionnaire is provided below in
Figure 1.
• In Part 4 respondents were asked a series of questions relating to their
preferences for specific design aspects of MBIs and incentives, including who
Page | 15
they would like to deliver the program, what they would like to see funded, what
they would like technical assistance for, how much time they are willing to
spend preparing applications, their preferred contract length for ongoing
programs, and how they would like monitoring to be conducted.
• In Part 5 questions were asked about landholders’ business practices. The two
main goals of this section were to get behavioural measures of landholders’
degree of business orientation, their information seeking behaviour and their
environmental orientation.
• The focus of Part 6 was community attitudes. Two main constructs were
measured here: connectedness and trust in natural resource management
agencies, which are both related to social capital.
• Lastly Part 7 asked a series of demographic questions relating to age, gender,
income, profitability, education and farm equity.
Page | 16
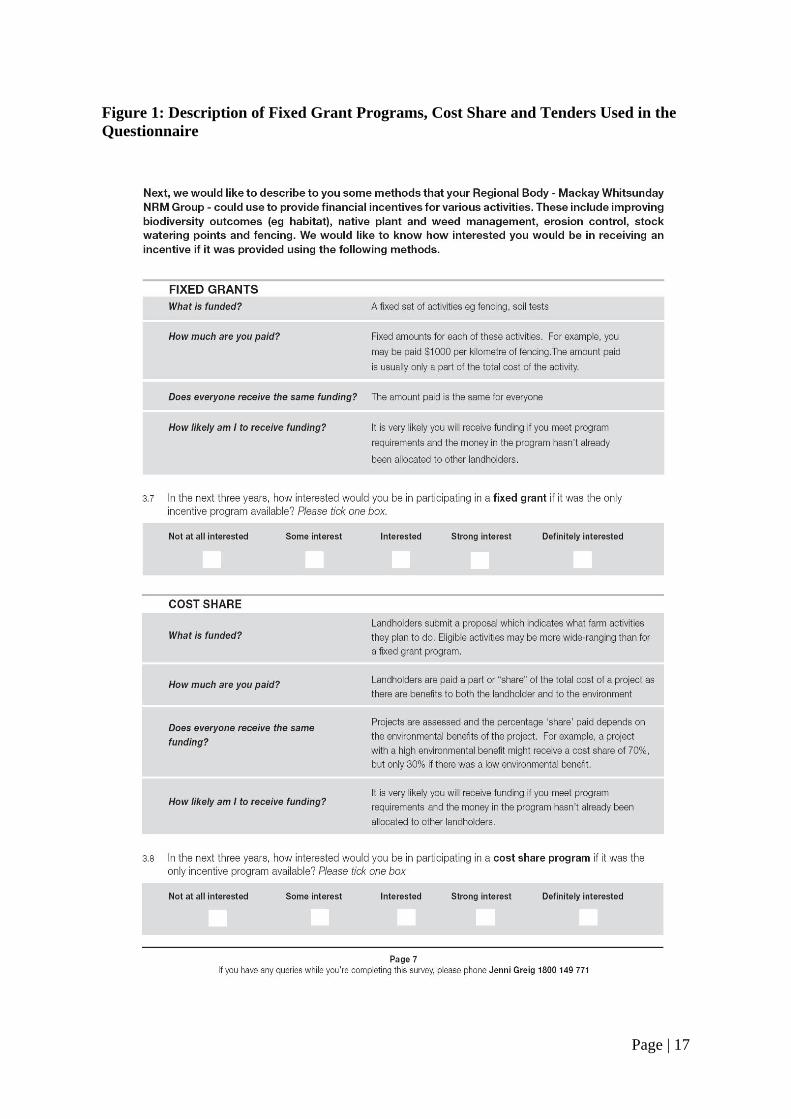
Figure 1: Description of Fixed Grant Programs, Cost Share and Tenders Used in the Questionnaire
Page | 17
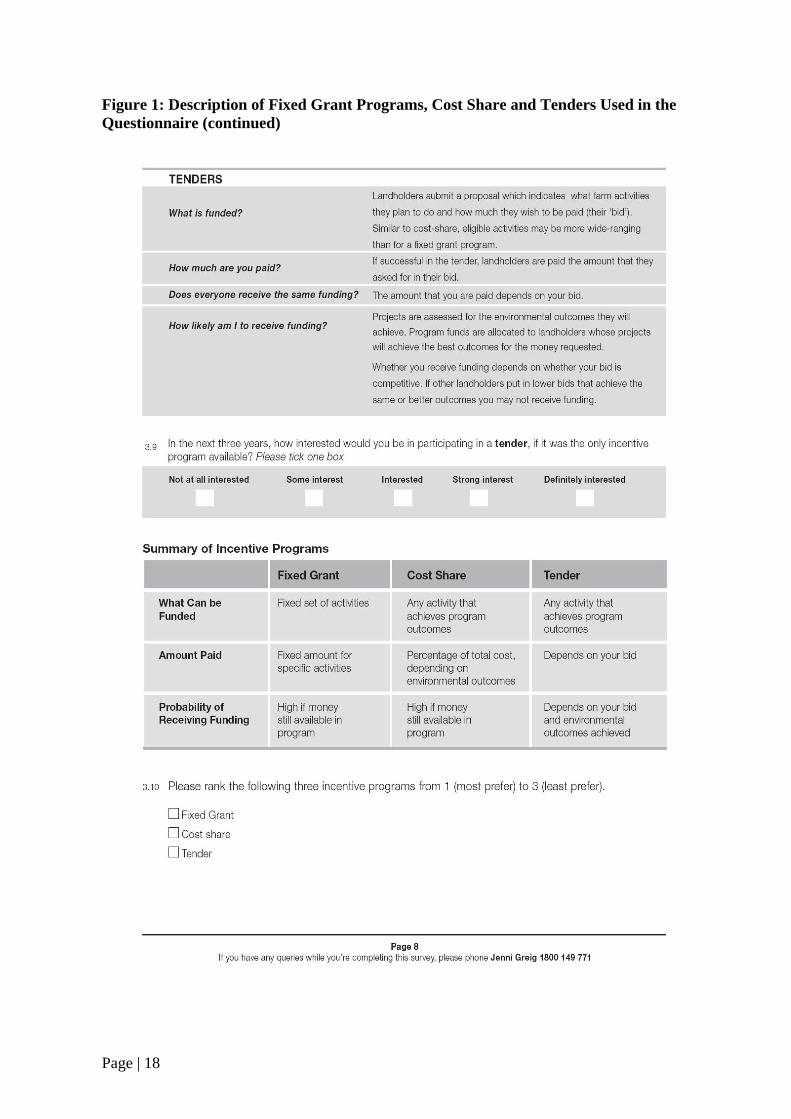
Figure 1: Description of Fixed Grant Programs, Cost Share and Tenders Used in the Questionnaire (continued)
Page | 18
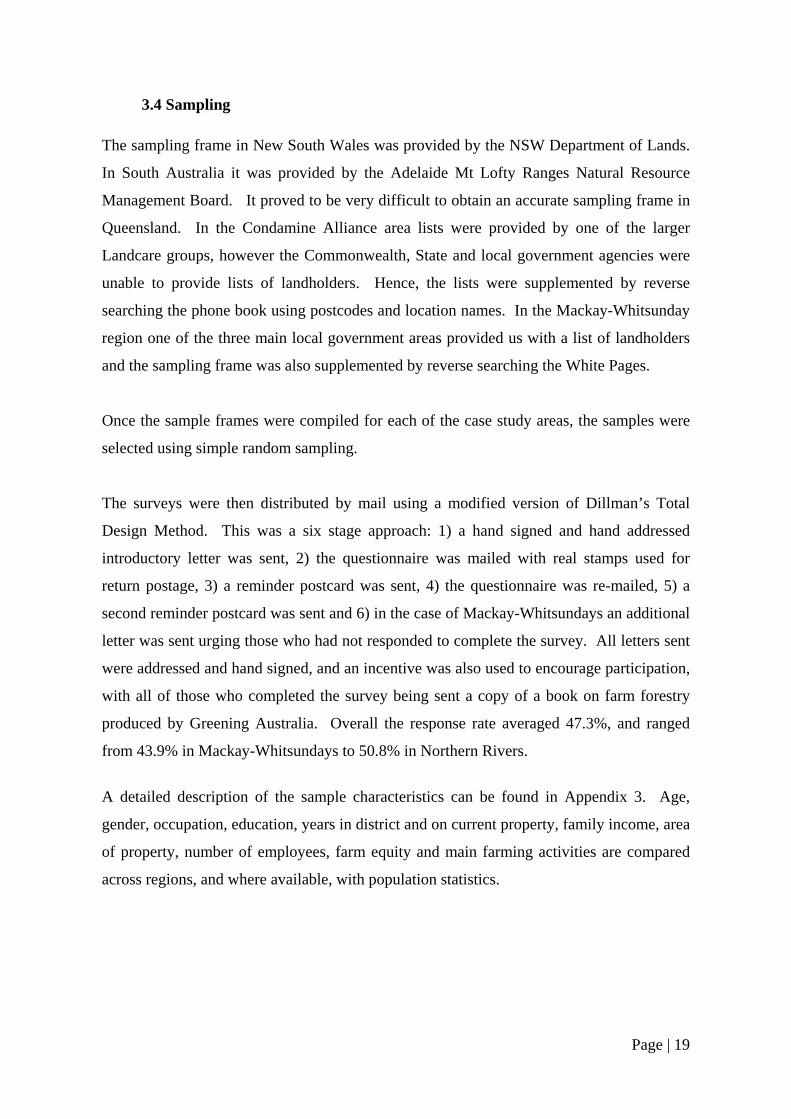
3.4 Sampling The sampling frame in New South Wales was provided by the NSW Department of Lands.
In South Australia it was provided by the Adelaide Mt Lofty Ranges Natural Resource
Management Board. It proved to be very difficult to obtain an accurate sampling frame in
Queensland. In the Condamine Alliance area lists were provided by one of the larger
Landcare groups, however the Commonwealth, State and local government agencies were
unable to provide lists of landholders. Hence, the lists were supplemented by reverse
searching the phone book using postcodes and location names. In the Mackay-Whitsunday
region one of the three main local government areas provided us with a list of landholders
and the sampling frame was also supplemented by reverse searching the White Pages.
Once the sample frames were compiled for each of the case study areas, the samples were
selected using simple random sampling.
The surveys were then distributed by mail using a modified version of Dillman’s Total
Design Method. This was a six stage approach: 1) a hand signed and hand addressed
introductory letter was sent, 2) the questionnaire was mailed with real stamps used for
return postage, 3) a reminder postcard was sent, 4) the questionnaire was re-mailed, 5) a
second reminder postcard was sent and 6) in the case of Mackay-Whitsundays an additional
letter was sent urging those who had not responded to complete the survey. All letters sent
were addressed and hand signed, and an incentive was also used to encourage participation,
with all of those who completed the survey being sent a copy of a book on farm forestry
produced by Greening Australia. Overall the response rate averaged 47.3%, and ranged
from 43.9% in Mackay-Whitsundays to 50.8% in Northern Rivers.
A detailed description of the sample characteristics can be found in Appendix 3. Age,
gender, occupation, education, years in district and on current property, family income, area
of property, number of employees, farm equity and main farming activities are compared
across regions, and where available, with population statistics.
Page | 19
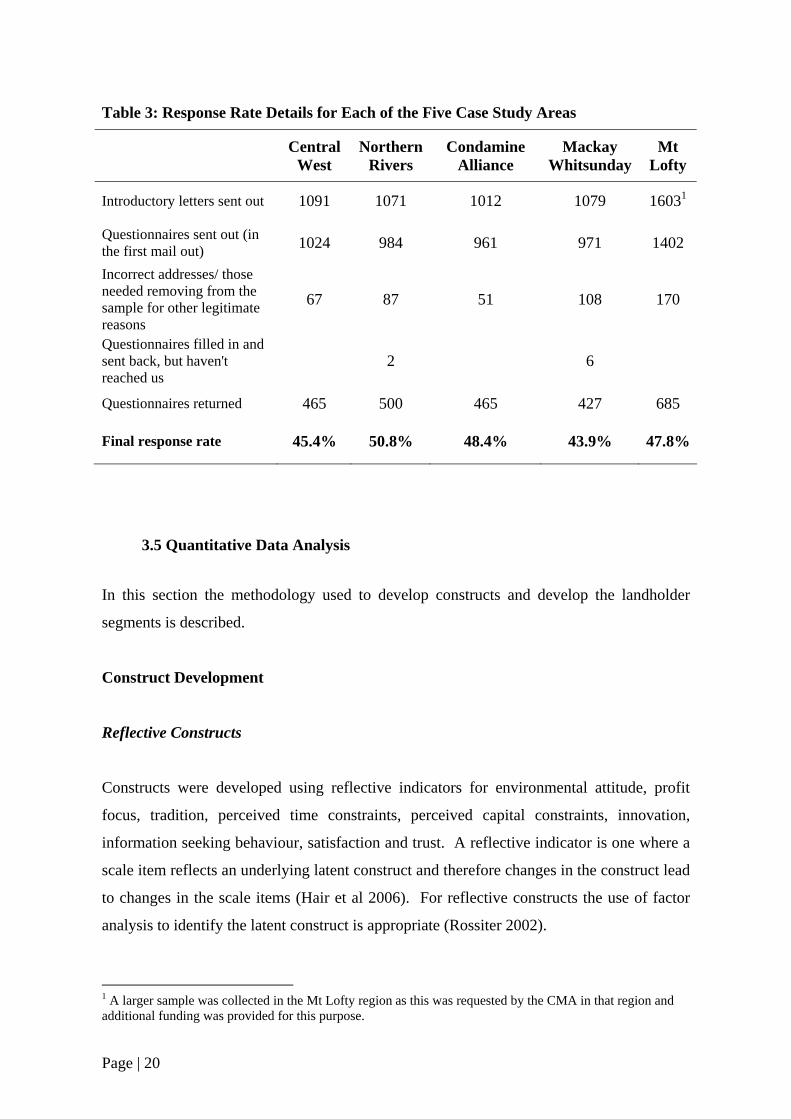
Table 3: Response Rate Details for Each of the Five Case Study Areas
Central West
Northern Rivers
Condamine Alliance
Mackay Whitsunday
Mt Lofty
Introductory letters sent out 1091 1071 1012 1079 16031
Questionnaires sent out (in the first mail out) 1024 984 961 971 1402
Incorrect addresses/ those needed removing from the sample for other legitimate reasons
67 87 51 108 170
Questionnaires filled in and sent back, but haven't reached us
2 6
Questionnaires returned 465 500 465 427 685
Final response rate 45.4% 50.8% 48.4% 43.9% 47.8%
3.5 Quantitative Data Analysis
In this section the methodology used to develop constructs and develop the landholder
segments is described.
Construct Development
Reflective Constructs
Constructs were developed using reflective indicators for environmental attitude, profit
focus, tradition, perceived time constraints, perceived capital constraints, innovation,
information seeking behaviour, satisfaction and trust. A reflective indicator is one where a
scale item reflects an underlying latent construct and therefore changes in the construct lead
to changes in the scale items (Hair et al 2006). For reflective constructs the use of factor
analysis to identify the latent construct is appropriate (Rossiter 2002).
1 A larger sample was collected in the Mt Lofty region as this was requested by the CMA in that region and additional funding was provided for this purpose.
Page | 20
The items included in these scales were drawn from several sources. These include:
• An earlier questionnaire developed by Professor Mark Morrison and Dr John Ward
that was used in the South Australian Murray Darling Basin which focused on
identifying landholder segments. Only items that were found to load highly on
relevant constructs from this study were included.
• Scales published in studies by Cook and Gronke (2002) and Cook and Gronke
(2005).
• Focus groups were used to develop the scale on satisfaction and to refine the scale
on trust.
Principal components factor analysis was conducted to develop each of these constructs.
Factor analysis is a data reduction technique that is commonly used to convert multiple
scale items into a single construct. A non-orthogonal rotation (oblimin) was used to
improve the interpretability of the data. A non-orthogonal rotation was used as it does not
require as strong structural assumptions as an orthogonal rotation. Results from the factor
analysis are presented in Appendix 4.
Evidence of reliability of each of the constructs was produced using Chronbach alphas.
Confirmatory factor analysis was used to test convergent validity of each of the scales (high
and significant loadings) while discriminant validity was tested using the approach
recommended by Hair et al (2006).
Formative Constructs
As well as the reflective indicators, several formative behavioural constructs were
developed. A formative construct is the sum of its component parts. Behavioural
constructs were developed for business orientation, environmental behaviour, use of
information channels and connectedness. Apart from the construct relating to information
channels which modified a scale developed by Associate Professor Lin Crase and Dr Darryl
Mayberry, all of these behavioural scales were developed specifically for this project.
Focus groups were used to identify the various aspects of property related business
orientation, pro environmental behaviours and connectedness. Based on these responses,
Page | 21
questions were then asked in the draft questionnaire to provide insight into each specific
aspect of these three constructs. The questions that were developed were tested in focus
groups and only questions that produced reasonable variation were retained in the final
questionnaire. Cross-tabulations and chi-square tests were then conducted to identify
which of the individual questions relating to each of the behavioural constructs significantly
explained participation. These were the questions that were included when developing the
behavioural constructs. A summative procedure was used to develop the constructs in
order to maximise the variation within the construct.
Regression Analysis
After the constructs were developed, binary and ordinal logit regression analysis was
conducted to identify those constructs that have the most influence on awareness of the
most common MBIs and incentives, participation in these programs, and interest in
participating in fixed grants, variable cost share or tenders. In the literature it is
recommended that only those constructs that have the greatest influence on the outcomes of
interest be used for clustering; thus regression analysis was used for this purpose. All of
the reflective and formative constructs described above, apart from tradition and
stewardship, were included in the regression analysis. Tradition and stewardship were
excluded as there was limited evidence of reliability and validity for these two constructs.
In addition, further regression analyses were conducted that only included socio-
demographic and farm level characteristics. These regressions were conducted to identify
additional variables useful for identifying those most likely to participate in MBIs and
incentive programs.
Cluster Analysis
From the regression analysis, four constructs were found to consistently have a large and
significant effect on the outcomes of interest. Moreover, no other variables came close to
having as large and consistent effect on participation and the other outcomes of concern.
These variables were trust, connectedness, property related business orientation and use of
information channels for gathering information about farming. The first of these constructs
(trust) was a reflective construct while the remaining three were formative.
Page | 22
Ward’s method was used to identify the landholder segments. This is a commonly used
hierarchical method of cluster analysis which groups together respondents with similar
preferences. A five cluster solution was selected based on statistical and practical
considerations (eg size of clusters). External validity was tested using chi-square tests for
nominal data and ANOVAs for ratio data.
Page | 23
4. Findings from the Expert Interviews
The expert interviews consisted of 22, semi-structured, phone interviews with experts from
academia, government, NRM groups and NRM consulting firms. An “expert” was
considered to be someone who has had field experience in researching, designing,
implementing or evaluating MBIs or incentive programs. The expert interviews sought
further information on the same three research questions considered in the literature review,
namely (1) what are the characteristics or design features of MBIs and incentives that lead
to increased participation; (2) what are the characteristics (individual and farm level) of
those who participate in MBIs and incentives programs; and (3) how can communication
strategies be designed to increase participation.
In this section we briefly describe the findings from the expert interviews. These findings
are described in much greater detail in Working Paper 3 from this project.
4.1 Characteristics of MBI and Incentive Programs that Increase Participation
According to the expert respondents, a number of key features should be considered when
designing and delivering an MBI program to increase participation of the target audience.
A carefully designed and delivered program with a greater relative advantage will garner
greater interest, and is more likely to achieve higher participation over the longer term.
These views are strongly supported by the literature (Clayton, 2005; Rolfe et al, 2005).
Design Features
The experts identified four key design features of a program that are critical to establishing
whether it is worth a land manager’s investment of time and resources in the application
process. These are: providing adequate incentive to participate; being flexible in the
application process and program requirements; keeping monitoring to an achievable level
of activity; and designing contracts that are acceptable to land managers.
The experts all agreed that providing adequate reward to account for high transaction costs
and opportunity costs is critical to the success of an MBI or incentive program. A program
Page | 24
with high expectations and little financial benefit is unlikely to be adopted. Important too is
getting the cost share right, with many land managers unwilling to engage in programs if
their own commitment outweighs that of the funding body. The experts also identified the
importance of non-monetary incentives in the form of labour and advice, and in the
provision of awards that acknowledge innovation.
Being too restrictive in the selection criteria for successful applicants, and being rigid in
expectations, are both likely to deter participation. In concert with the literature, the experts
agreed that providing participants with the opportunity to negotiate outcomes and
deliverables will encourage increased participation. To garner the highest participation, the
targeted practices will be consistent with current management practices.
While monitoring and evaluation is a critical component of any MBI or incentive program,
the experts largely agreed that if the expectations placed on the participants are too onerous
then participation will likely be affected. By designing simple, up-front monitoring
programs, where information gathered is fed back to the community, participation can be
increased and evaluation opportunities improved.
And finally, the details of any contract negotiated between a land manager and an incentive
provider can greatly influence participation. Experts made particular note of the
importance of balancing the need for long-term outcomes, with the unpalatable nature of
long-term contracts, particularly covenants.
Program Delivery
In addition to getting the design of an MBI or incentive program right, is the importance of
program delivery. The experts noted several aspects of delivery, including the importance
of choice of the program administrator; the need for clarity, transparency and simplicity;
and the importance of timing and coordination.
Carefully choosing the program administrator is essential according to both the expert
respondents and the published literature (eg Horne 2006). All experts emphasised the need
for credible, trustworthy and skilled administrators, and acknowledged the impact of
previous policies and programs on how various agencies are perceived. Specifically,
Page | 25
government agencies are viewed with distrust while ‘independent’ organisations such as
Greening Australia and Landcare are often seen as more benign. Hence an independent,
non-government administrator may mitigate suspicion, but who that is, is dependent on the
regionally specific context.
Providing clarity and transparency about specific design features of MBIs and incentives,
and keeping the application process simple, are important to engendering trust and
encouraging participation. Specifically, experts suggested the importance of clarifying:
program objectives, targets, the application process, how applications or bids will be
assessed, eligibility, monitoring expectations and the availability of technical advice on an
ongoing basis.
There are several aspects to getting the timing and coordination right on an MBI or
incentive program, beginning with providing land managers and administrators with
enough time to familiarise themselves with the program. Another key timing issue is
ensuring that the application process and the key deliverables are coordinated to avoid
clashing with key farming and family commitments. Experts also noted that coordination
and timing were a challenge given the range of organisations and individuals who might be
involved at different stages.
4.2 Who Participates in MBIs and Incentives?
There was much consistency between the literature and the expert respondents regarding
those personal characteristics that indicate an increased likelihood of participation in MBIs
or other incentive programs, although some differences in perspective did emerge.
Two socio-demographic variables were raised by respondents to explain participation – age
and education – and the respondents’ conclusions were largely in concert with the
literature. The expert respondents suggested that younger farmers are more likely to
participate, while the literature suggests a little more complexity and implies that stage of
life may be a more important characteristic (Byron, Curtis & Mackay, 2005; Ducos &
Dupraz, 2006; Rolfe et al, 2006). The expert respondents also indicated that the more
educated a farmer, the more likely they were to participate, while the literature suggests that
Page | 26
education is not a particularly useful indicator of participation as various studies have
revealed highly divergent relationships.
Three behavioural characteristics were discussed by expert respondents as being of some
importance. The quality of the relationship that a landholder has with the proponents of the
incentive scheme is perceived to be an important influencing factor, with the better the
relationship the more likelihood of future participation. This was strongly linked to issues
of trust and was entirely consistent with the literature (Breetz et al, 2005; Rolfe et al, 2005;
Ducos & Dupraz, 2006). Strongly interlinked and also raised by expert respondents was
previous involvement in other incentive schemes. This was seen to be highly influential in
a landholder’s decision to participate. It was also noted, however, that the features of some
programs (particularly auctions) attracted people who may not have been involved in other
forms of MBIs or incentives, such as grant programs. Again, this was consistent with the
literature. The ‘connectedness’ of a landholder, as demonstrated by participation in various
networks, was also raised by several expert respondents as being an important characteristic
for influencing participation.
There was significant variance among the expert respondents regarding the influence of
attitudes. Some concluded that the more ‘conservation conscious’ a farmer the more
likelihood of participation, while others suggested that it was the profit-driven farmers who
were more likely to participate. The literature is ambiguous on this point, some suggesting
that conservation attitude has little significance and may even be negatively related to
participation (eg Vanslembrouck et al, 2002), while others found environmental attitude to
have a positive effect (eg Ha et al, 2003; Rolfe et al, 2006). The expert respondents also
suggested that innovative, progressive, and confident farmers are more likely to participate
in an MBI or incentive program.
Several farm characteristics were raised by the expert respondents as having a relationship
to participation in MBIs and incentive programs. The length of time in farming and the
length of time on their properties were both considered to be important predictors of
participation. Interestingly, it is considered that farmers are more likely to participate if
they have not been farming long, or have not owned the property for a long period.
Business orientation was also perceived as a characteristic likely to influence participation,
with the more business driven and profit driven a farmer, the more likely is participation.
Page | 27
This however, was also linked to design features of an MBI, with several respondents
commenting that some design features (such as contracts and in-perpetuity conditions)
would discourage business oriented farmers.
Opportunity cost emerged from the expert respondents as an important characteristic
influencing participation. They suggested that if the costs associated with participation are
high, and/or the payments are low, participation is less likely. This was consistent with the
literature (for example, see Brotherton, 1991 and Ducos & Dupraz, 2006). Finally, the
possibility of “crowding out” was also raised in the expert interviews. It was suggested that
many of the people who choose to participate in MBI or incentive programs are probably
intent on proceeding with the activity anyway and are looking for some assistance and
support to do so, raising some doubts on the cost-effectiveness of incentive and MBI
programs.
The existence of landholder segments was also discussed in the expert interviews. The
experts made some important observations about the importance of segmenting farmers for
MBI or incentive program delivery. They suggested that the differences and similarities
between individual farmers often influence participation in MBI schemes, and that
recognising these characteristics and being able to group them provides a means for
designing MBIs to achieve increased participation. The expert respondents also highlighted
the need for a mix of instruments to more effectively engage the diversity of farmers that
are being targeted for change.
Also noted by a small number of respondents is the importance of diffusion for increasing
participation in schemes; as programs are ‘tried and tested’ by social leaders or trusted
innovators, and observed by others, participation is likely to increase.
4.3 How to Communicate MBIs and Incentives to Increase Participation
From the expert interviews, a number of insights were provided into how to better
communicate an MBI or incentive scheme. These insights related to how a program is
advertised, how initial contact is made with the pool of potential participants, the
importance of direct contact and extension, the role of existing networks, the importance of
Page | 28
sending the right message and avoiding technical language, and being prepared for potential
problems or questions in advance.
The experts raised a range of methods that they had used to advertise MBI programs with
an emphasis on the importance of using a range of approaches. Newspapers, radio, fliers
and brochures were the most commonly used with local radio and local newspapers
considered the most effective, particularly if used to promote past stories of success. This
contrasts with some of the literature reviewed which suggested that radio particularly was
linked to a decreased level of participation (Ha et al, 2003). Several experts suggested that
advertising was an avenue of limited effectiveness for communicating incentive programs,
if used in the absence of other communication strategies.
The experts saw personal contact and established relationships as being highly instrumental
in encouraging participation. The experts and the literature both emphasised the
importance of formal and informal networks to promote MBI or incentive programs (Lynch
& Lovell, 2003; Breetz et al, 2005). The benefits of using existing networks are that it taps
into people already interested in environmental based incentive programs, and utilises pre-
existing trust. However, the downside is that it is likely to attract the same people over
again, raising questions about cost effectiveness and equity.
Providing extension services to potential participants was a common theme to emerge with
the expert respondents, with the view that it was one of the most important facets of an
MBI or incentive program. Extension staff can assist in clarifying application processes,
dealing with misinformation, and facilitating best practice, so investing time and resources
into building trust is considered invaluable. However, the experts also stressed the
importance of having skilled, experienced and locally based extension staff to engender
trust and respect.
Lastly, the experts also emphasised the importance of using the right language in any
communication, particularly avoiding jargon and inconsistencies in terminology.
Page | 29
5. Focus Group Findings
Eight focus groups were conducted with landholders in the four NSW and Queensland case
study areas. The objectives in running the focus groups were: 1) to obtain qualitative
information from landholders about the three main research questions which had been
considered through earlier phases of the project, 2) to test the survey instrument and 3) to
develop behavioural constructs for business and environmental orientation and community
connectedness. The development of these constructs will be addressed in detail in a
forthcoming working paper. In this section, we report findings from the focus groups,
related to the three main research questions. That is, what program features are likely to
encourage participation; who is most likely to participate in MBIs and incentives; and how
to best communicate information, both in terms of media and the messages to use.
5.1 What are the Features or Characteristics of MBIs and Incentive Programs that Encourage Participation?
During each focus group, participants were asked about features of incentive programs that
they would want to know about, or issues they would need to clarify before agreeing to
participate. Responses echo many of the ideas identified in both the literature review and
expert interviews.
Design Features
Focus groups participants consistently identified a number of design features of programs
which would be important to them before committing to an MBI or incentive program.
These included: the costs and benefits of participation, application and other paperwork
requirements, flexibility, obligations and conditions, eligibility and monitoring.
In every focus group participants stated that the costs, and relative benefits were an
important consideration. Participants expressed concern regarding financial outlay, tax
implications, and effect on income for the family and farm business. Other costs were also
mentioned, such as time, labour and other resource costs. Overall benefits were of interest,
such as the amount of funding, how long the program would last, and what long terms gains
might be made in production and profitability. Most focus groups participants also
Page | 30
expressed a desire to know that the program was going to achieve environmental goals.
These findings are consistent with those from the expert interviews.
Concern about the amount of administrative work required for the application and during
the life of the project was also voiced in every focus group, with the most common
complaint being that paperwork for such programs is too long and complicated:
“Yeah the paperwork … make it as short as you can make it, and straight to the point”
Focus group participants indicated that the time commitment required for paperwork, as
compared to the potential benefit (likelihood of receiving funding and amount of funding
on offer), was a major determinant of the likelihood of applying to participate. In some
focus groups, the possibility of assistance in writing applications was suggested as
increasing the attractiveness of a program. This is consistent with the literature (eg
Clayton, 2005; Ducos and Dupraz, 2006).
Another finding consistent with the literature is that flexibility is positively associated with
participation (Wossink & van Wenum, 2003; Horne, 2006). All focus groups mentioned
that they wanted to know that the program would be “flexible” – usually in terms of being
able to negotiate the required management practices, and also that the project manager be
responsive to uncontrollable factors, such as weather. Relatedly, focus group participants
were concerned about obligations and restrictions that might be built into the program, and
they desired flexibility with these. Participants indicated that obligations needed to be very
clear, and wanted to know if they might change during the life of the program. They also
wanted to know about any consequences for breaching conditions, whether intentional or
otherwise.
Findings from the expert interviews suggested that eligibility could deter participation if it
was too restrictive. Eligibility was raised as an issue in half of the focus groups. While
most participants agreed that they simply wanted clear information on what the exact
criteria were, others raised related issues that would affect the attractiveness of programs,
such as how flexible the criteria are, and if a landholder could negotiate eligibility if they
were interested in a slightly different project.
Page | 31
“every farm has its own scenario, it is very hard for everyone to fit in the right bits, to fit with the criteria”
Finally, monitoring requirements were another design feature noted in the focus groups as
influencing participation, which has also been found to be of importance in previous
literature (eg Rolfe et al, 2005 and Windle et al, 2005). Participants suggested that
requirements need to be reasonable, and not overly taxing. However, an interesting point
that did emerge from the focus groups was that monitoring was seen as a means of
improving outcomes of participation, by creating the opportunity to address incorrect
actions or improve actions along the way. Participants also were concerned that some
monitoring needed to occur to ensure the integrity of programs and were positive about on
farm visits during, and at the end of the program.
Program Delivery
The focus groups raised a number of issues related to program delivery, although these
differed somewhat to what had been identified in the expert interviews. Themes from the
focus groups included time, advice and assistance and program administration.
Time was a prevailing theme throughout all the focus groups. Similar to the literature,
(Breetz et al, 2005; Clayton, 2006) the issue of timing and timeframes were a crucial
element to the attractiveness of a program. A number of participants referred to
experiences applying for funding only to receive it months after they wanted to carry out
the work. The timeframe of a program was also important for focus group participants –
programs that are either too long, or too short were unappealing. Timeframes also need to
be flexible due to the factors over which landholders have little or no control, but which can
affect a landholder’s ability to carry out management actions (for example, tree planting
being dependant on rain). Finally, the time commitment involved influences how attractive
a program might be. The majority of focus group participants indicated that they are time
poor, so a program that will take up their time has to be worthwhile. These findings differ
from the findings from the expert interviews; the experts identified different ‘timing’ issues
to the focus group participants (eg such as being careful about when applications are due),
suggesting that there is a range of timing issues that bring to bear on program delivery.
Page | 32
Focus group participants also identified that they wanted to know what sort of advice and
assistance would be available. This included guidance in the development of projects as
well as whether they would have someone to advise them throughout the project. In order
for this advice or assistance to increase the likelihood of participation, this advice needs to
be personalised, come from experts and be clear (ie not overly academic). Furthermore,
anyone giving advice needed to have local knowledge, and not try to advise from “an office
somewhere”. This reflects the adoption literature which suggests that access to quality
information is related to increased adoption of changed practices (Vanclay 1992).
The final issue of program delivery raised in the focus groups was that of program
administration. Participants indicated that the agency responsible for administering the
program affected attractiveness, and wanted assurance that a program would be well
administered before committing themselves. These findings closely resembled those from
the expert interviews.
Tenders Focus groups participants were asked specifically about the use of tenders as a means of
delivering MBIs and incentive programs. In some cases, the tender process needed to be
explained as not all focus group participants were familiar with the term. Across all focus
groups, negative perceptions of tenders were expressed, including the following:
• The benefit is uncertain, especially given the level of time and work involved
• Many landholders do not understand the process of a tender
• Tenders favour those who can fill out paperwork the “right way”, rather than those
who are going to produce the best on-ground outcomes.
• Tenders are unfair and cause rivalry within a district
• Tenders are a money-saving exercise:
“Governments are trying to push that because you know why. We will all individually tender,
it’ll be cheaper, see.”
Although there were several participants who indicated they might participate in a tender,
the majority indicated that they would not for these reasons.
Page | 33
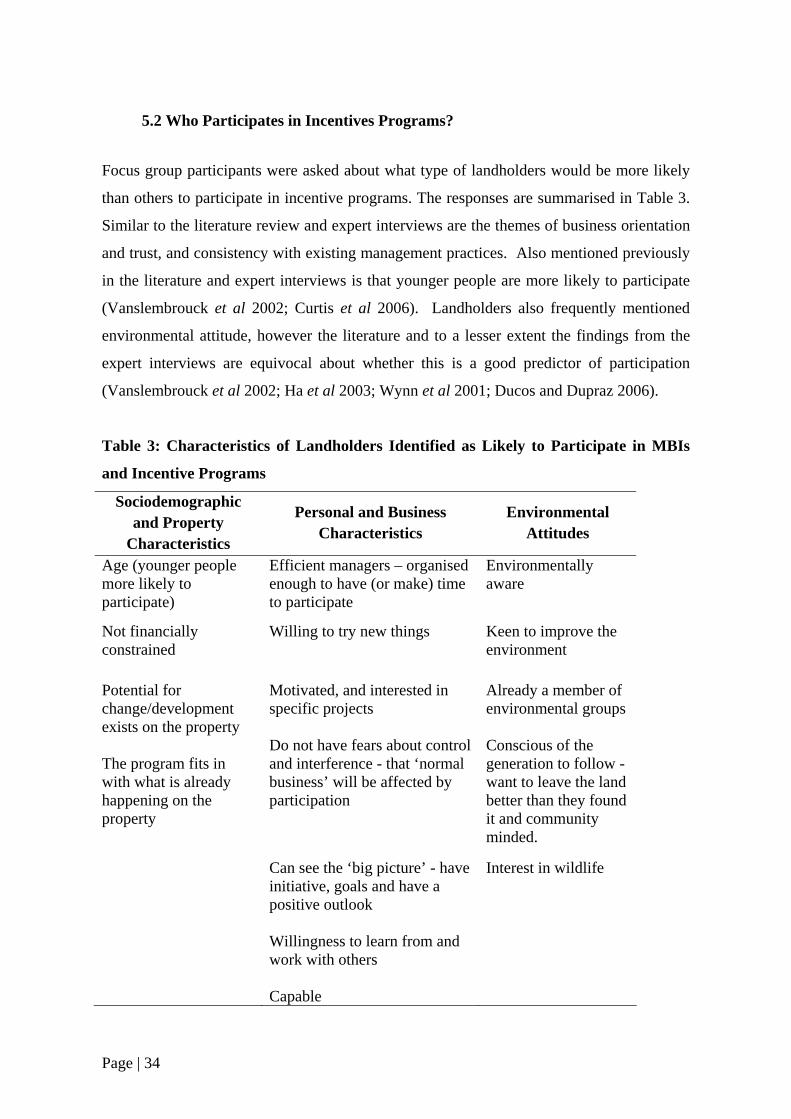
5.2 Who Participates in Incentives Programs?
Focus group participants were asked about what type of landholders would be more likely
than others to participate in incentive programs. The responses are summarised in Table 3.
Similar to the literature review and expert interviews are the themes of business orientation
and trust, and consistency with existing management practices. Also mentioned previously
in the literature and expert interviews is that younger people are more likely to participate
(Vanslembrouck et al 2002; Curtis et al 2006). Landholders also frequently mentioned
environmental attitude, however the literature and to a lesser extent the findings from the
expert interviews are equivocal about whether this is a good predictor of participation
(Vanslembrouck et al 2002; Ha et al 2003; Wynn et al 2001; Ducos and Dupraz 2006).
Table 3: Characteristics of Landholders Identified as Likely to Participate in MBIs
and Incentive Programs
Sociodemographic and Property
Characteristics
Personal and Business Characteristics
Environmental Attitudes
Age (younger people more likely to participate)
Efficient managers – organised enough to have (or make) time to participate
Environmentally aware
Not financially constrained
Willing to try new things Keen to improve the environment
Potential for change/development exists on the property
Motivated, and interested in specific projects
Already a member of environmental groups
The program fits in with what is already happening on the property
Do not have fears about control and interference - that ‘normal business’ will be affected by participation
Conscious of the generation to follow - want to leave the land better than they found it and community minded.
Can see the ‘big picture’ - have initiative, goals and have a positive outlook
Interest in wildlife
Willingness to learn from and work with others
Capable
Page | 34
5.3 How can we Communicate MBIs and Incentive Programs to Increase Participation?
Focus groups were asked about how best to communicate and deliver programs, with a
particular focus on what channels to use to reach landholders, and the most effective
messages to use.
Media
Methods of advertising were suggested by participants as a useful means of reaching large
groups of landholders. Popular methods were very similar to those mentioned in expert
interviews, and included:
• Local radio – This was frequently mentioned, but it was emphasised that local and
rural radio would reach a more targeted audience.
• Fliers in mailbox – it was pointed out that this method has a broad reach, but was
still limited, especially as fliers are often disregarded.
• Local newspaper –having the program as part of an editorial or news article is more
effective than advertisements or classified notices.
• Shop notice boards.
• Television advertising – it was mentioned that this media could be useful, though
only in conjunction with other, more localised media, such as the methods
mentioned above.
Comments made by participants suggest that advertising needs to use straightforward
language, and not contain an overload of information in order to communicate clearly with
landholders.
Participants indicated that personal and direct contact was the best way to interest
individual landholders in participating in programs. Comments suggest that such contact
should be on-going and regular, and preferably involves contact with a local person.
Furthermore, participants indicated that successful channels for passing on information
regarding an MBI or incentive program include well known and respected community
members, professionals who are familiar with landholders in the area (bankers, industry
consultants etc), existing landholder networks, and taking advantage of ‘word of mouth’:
Page | 35
“word of mouth, it is like it goes out and it comes back to you. You sort of get the key people interested … It’s very hard to get that going, but once you do get that going, it is by far the best advertising you’ll ever have … Bush Telegraph. It works pretty well, it does”
These suggestions are consistent with findings from previous phases of the project (eg
Lynch & Lovell, 2003; Rogers, 2003).
Focus group participants indicated that as well as general advertising, community meetings
should be held to provide further information, and allow an opportunity for specific
questions to be asked. Small, localised meetings, with good explanations of the program
were agreed to be ideal. It was further suggested that information could be provided
through other events – for example, field days.
Messages
Focus group participants indicated that messages needed to be about the benefits to the
landholder. Messages should ideally be personalised – helping the landholder to see how
the program is relevant to them. It was also suggested that messages need to be exciting
(“sexy”), and emphasise that it is something to benefit the landholder, their family and
property or business (eg “we can help you”).
“a lot of them don’t know what the benefit of it is, so the message of it would be maybe good explanation of what the benefit would be for the farmers.”
Along similar lines, a popular idea was to use previous success stories and personalised
case studies in order to make a program more appealing.
“I think the beauty is in the success stories. There has got to be some interest in success stories. People will see how it happened to that guy.”
This is consistent with literature that suggests observability increases the likelihood of
participation (Cary, Webb & Barr, 2002; Rogers, 2003)
Another suggestion was to emphasise the community benefits. This was regarded as a
positive way to encourage whole communities to support a program, which in turn would
affect the ease of implementation if everyone were working towards the same things.
Page | 36
Finally, an important message arising from the focus groups was to emphasise that
landholders need not fear government interference or being overburdened by program
commitments. This is consistent with literature that suggests the government agencies
delivering the program can be a barrier to uptake (Finlayson, 2004; Rolfe, McCosker &
Windle, 2005) and that a communication can be used to build trust strategy.
“take away the suspicion that the Government is coming to take away the farm, or they are going to be incumbent to do this for forever and a day. That it is a benefit to the environment and the business” (Oberon)
5.4 Conceptual Model Showing the Factors Influencing Landholder Participation
Based on the findings from the literature review, expert interviews and focus groups a
conceptual model was developed which demonstrates the factors that influence landholder
participation in MBIs and incentive programs.
Landholders have an interest in participation which is a function of their potential gain and
dispositional variables such as environmental attitude, innovativeness and profit focus. As
shown by the two boxes on the left of the diagram, this interest in participation is
influenced by both the communication strategy and the type of interest used and its
features. Landholder interest in participation is also increased or constrained by the context
and their individual capacity. The context is a function of social capital, and includes trust
in those delivering the program and the amount of connectedness in the community.
Capacity is a function of business orientation and experience in working with those
delivering NRM programs. The empirical modelling conducted in the next chapter is based
on this conceptual model.
Page | 37
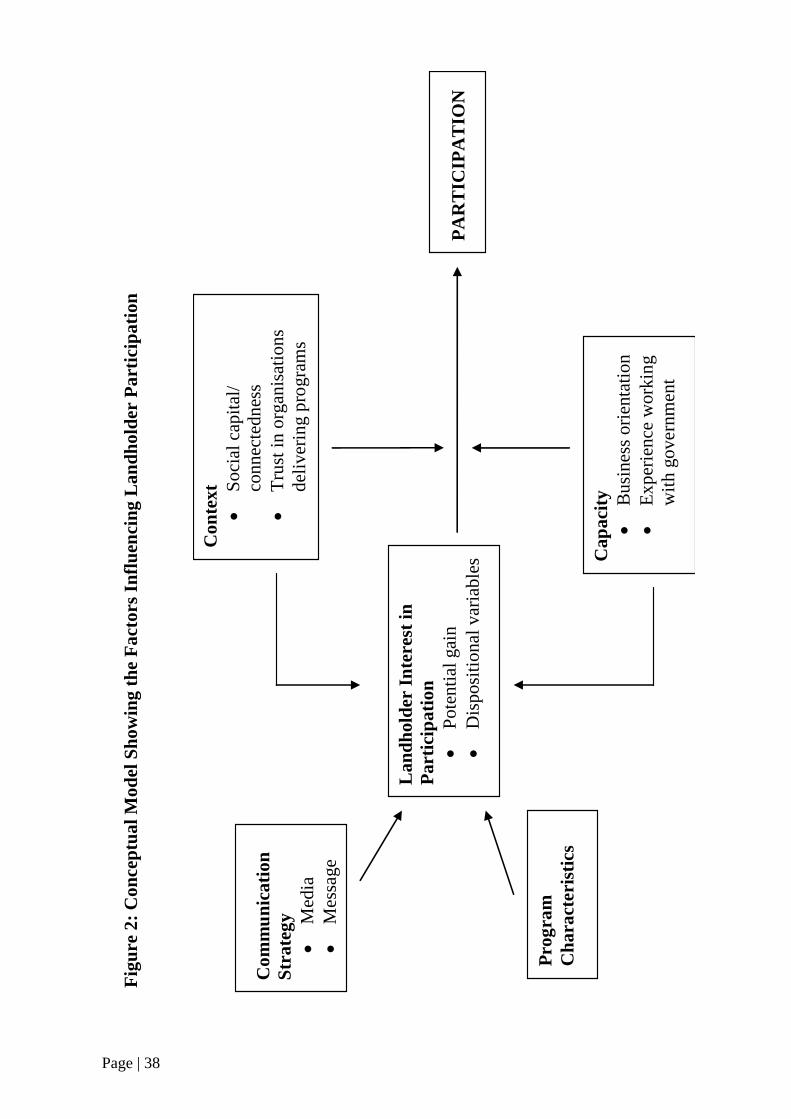
Figu
re 2
: Con
cept
ual M
odel
Sho
win
g th
e Fa
ctor
s Inf
luen
cing
Lan
dhol
der
Part
icip
atio
n
Com
mun
icat
ion
Stra
tegy
•
Med
ia
• M
essa
ge
Prog
ram
C
hara
cter
istic
s
Lan
dhol
der
Inte
rest
in
Part
icip
atio
n •
Pote
ntia
l gai
n •
Dis
posi
tiona
l var
iabl
es
Con
text
•
Soci
al c
apita
l/ co
nnec
tedn
ess
• Tr
ust i
n or
gani
satio
ns
deliv
erin
g pr
ogra
ms
Cap
acity
•
Bus
ines
s orie
ntat
ion
• Ex
perie
nce
wor
king
w
ith g
over
nmen
t
PAR
TIC
IPA
TIO
N
Page | 38
6. Quantitative Results
In presenting the quantitative results we begin with a discussion of respondent satisfaction
with existing NRM programs and the factors that influence this satisfaction in Section 6.1.
The focus then turns to answering the three main research questions which are addressed in
Sections 6.2 to 6.4.
6.1 Satisfaction While not one of the original research questions, information about satisfaction with the last
program respondents participated in was collected as the literature indicated that the quality
of relationships with administrators can influence the probability of participation (Ducos &
Dupraz 2006). Moreover, as the goal was to develop a construct to measure satisfaction,
various aspects relating to satisfaction with a program were measured together with overall
satisfaction. This allows the identification of what specific aspects of program delivery
have the greatest influence on overall satisfaction.
In the questionnaire participants were first asked to indicate whether the last program they
participated in: (1) was beneficial, (2) achieved its objectives, (3) had straightforward
application procedures, (4) had rules and requirements that were easy to understand, (5)
whether finding the contact person was easy and (6) whether it was well administered.
After answering these questions they were asked about their overall satisfaction with the
program.
Overall Satisfaction with Existing Programs
The overall rating tended towards being satisfied (possible answers ranged from 1 – not at
all satisfied to 5 – very satisfied, with M= 3.69). Central West had a higher proportion of
participants satisfied or very satisfied with the last program than other catchments, and
Central West and Mackay-Whitsundays had slightly smaller proportions of participants
slightly or not at all satisfied than other catchments, although overall these differences are
not statistically significant (χ2 = 18.495, p=0.296). (See Table 5).
Page | 39
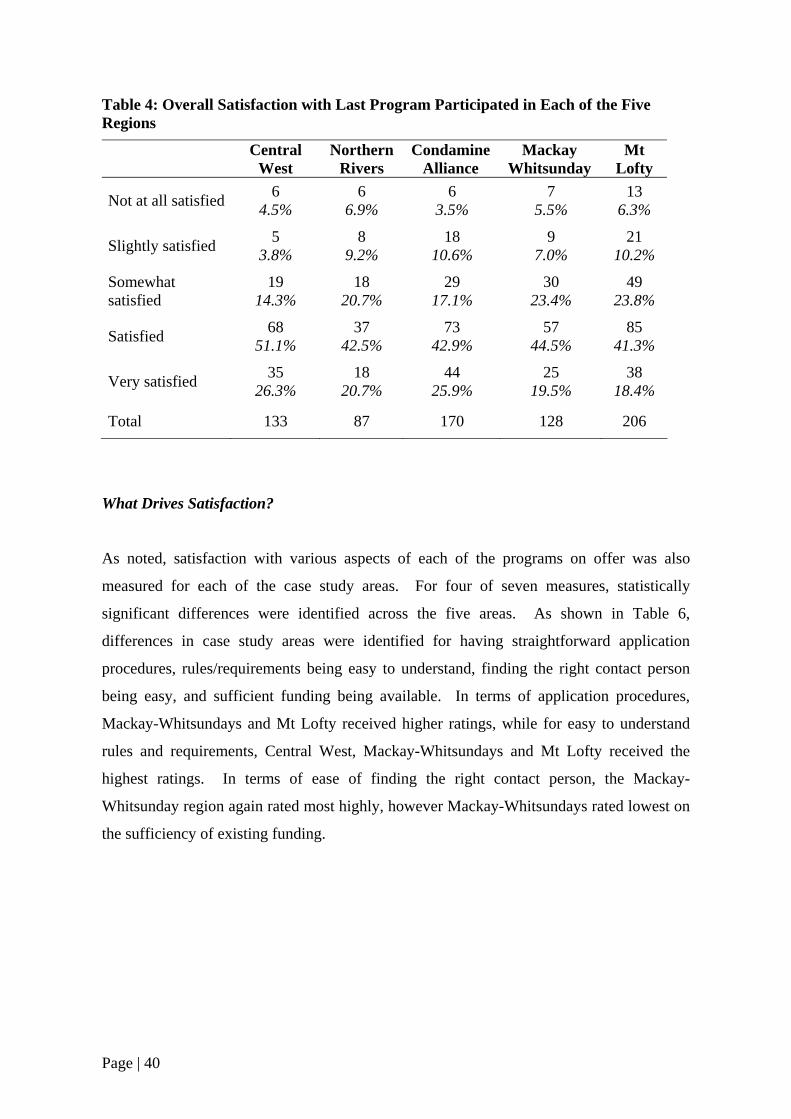
Table 4: Overall Satisfaction with Last Program Participated in Each of the Five Regions
Central West
Northern Rivers
Condamine Alliance
Mackay Whitsunday
Mt Lofty
Not at all satisfied 6 4.5%
6 6.9%
6 3.5%
7 5.5%
13 6.3%
Slightly satisfied 5 3.8%
8 9.2%
18 10.6%
9 7.0%
21 10.2%
Somewhat satisfied
19 14.3%
18 20.7%
29 17.1%
30 23.4%
49 23.8%
Satisfied 68 51.1%
37 42.5%
73 42.9%
57 44.5%
85 41.3%
Very satisfied 35 26.3%
18 20.7%
44 25.9%
25 19.5%
38 18.4%
Total 133 87 170 128 206
What Drives Satisfaction?
As noted, satisfaction with various aspects of each of the programs on offer was also
measured for each of the case study areas. For four of seven measures, statistically
significant differences were identified across the five areas. As shown in Table 6,
differences in case study areas were identified for having straightforward application
procedures, rules/requirements being easy to understand, finding the right contact person
being easy, and sufficient funding being available. In terms of application procedures,
Mackay-Whitsundays and Mt Lofty received higher ratings, while for easy to understand
rules and requirements, Central West, Mackay-Whitsundays and Mt Lofty received the
highest ratings. In terms of ease of finding the right contact person, the Mackay-
Whitsunday region again rated most highly, however Mackay-Whitsundays rated lowest on
the sufficiency of existing funding.
Page | 40
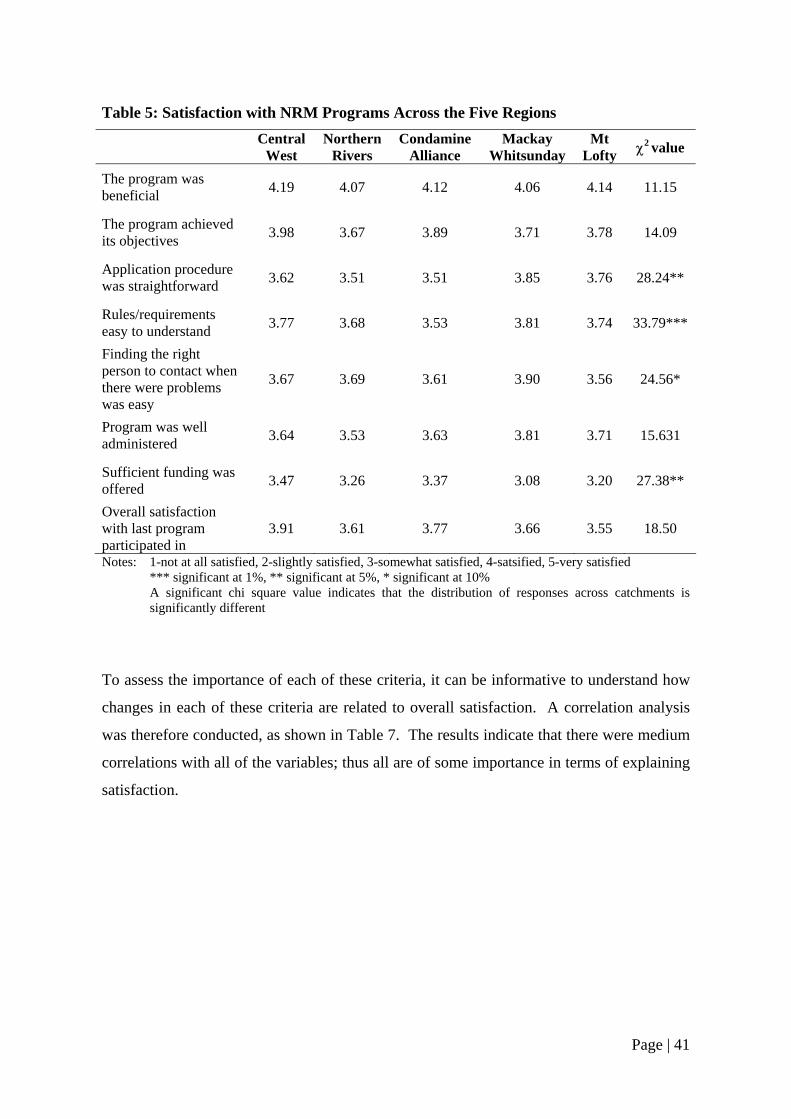
Table 5: Satisfaction with NRM Programs Across the Five Regions
Central
West Northern
Rivers Condamine
Alliance Mackay
Whitsunday Mt
Lofty χ2 value
The program was beneficial 4.19 4.07 4.12 4.06 4.14 11.15
The program achieved its objectives 3.98 3.67 3.89 3.71 3.78 14.09
Application procedure was straightforward 3.62 3.51 3.51 3.85 3.76 28.24**
Rules/requirements easy to understand 3.77 3.68 3.53 3.81 3.74 33.79***
Finding the right person to contact when there were problems was easy
3.67 3.69 3.61 3.90 3.56 24.56*
Program was well administered 3.64 3.53 3.63 3.81 3.71 15.631
Sufficient funding was offered 3.47 3.26 3.37 3.08 3.20 27.38**
Overall satisfaction with last program participated in
3.91 3.61 3.77 3.66 3.55 18.50
Notes: 1-not at all satisfied, 2-slightly satisfied, 3-somewhat satisfied, 4-satsified, 5-very satisfied *** significant at 1%, ** significant at 5%, * significant at 10%
A significant chi square value indicates that the distribution of responses across catchments is significantly different
To assess the importance of each of these criteria, it can be informative to understand how
changes in each of these criteria are related to overall satisfaction. A correlation analysis
was therefore conducted, as shown in Table 7. The results indicate that there were medium
correlations with all of the variables; thus all are of some importance in terms of explaining
satisfaction.
Page | 41
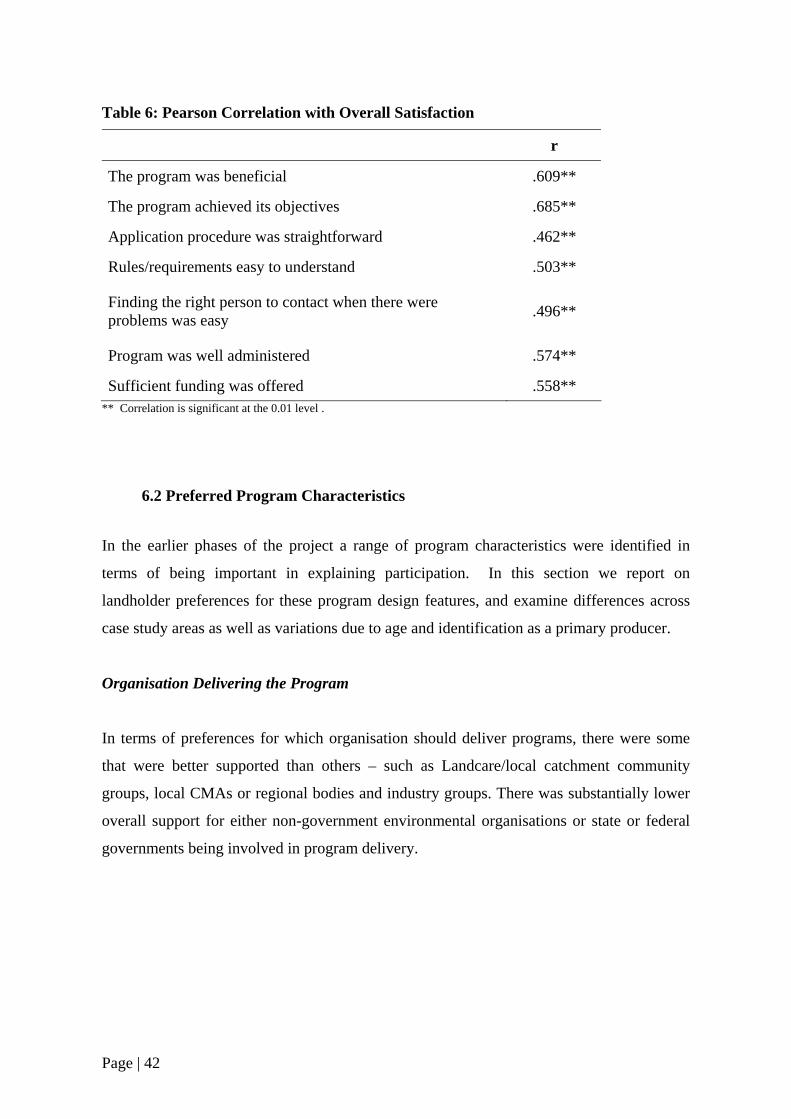
Table 6: Pearson Correlation with Overall Satisfaction
r
The program was beneficial .609**
The program achieved its objectives .685**
Application procedure was straightforward .462**
Rules/requirements easy to understand .503**
Finding the right person to contact when there were problems was easy .496**
Program was well administered .574**
Sufficient funding was offered .558** ** Correlation is significant at the 0.01 level .
6.2 Preferred Program Characteristics
In the earlier phases of the project a range of program characteristics were identified in
terms of being important in explaining participation. In this section we report on
landholder preferences for these program design features, and examine differences across
case study areas as well as variations due to age and identification as a primary producer.
Organisation Delivering the Program
In terms of preferences for which organisation should deliver programs, there were some
that were better supported than others – such as Landcare/local catchment community
groups, local CMAs or regional bodies and industry groups. There was substantially lower
overall support for either non-government environmental organisations or state or federal
governments being involved in program delivery.
Page | 42
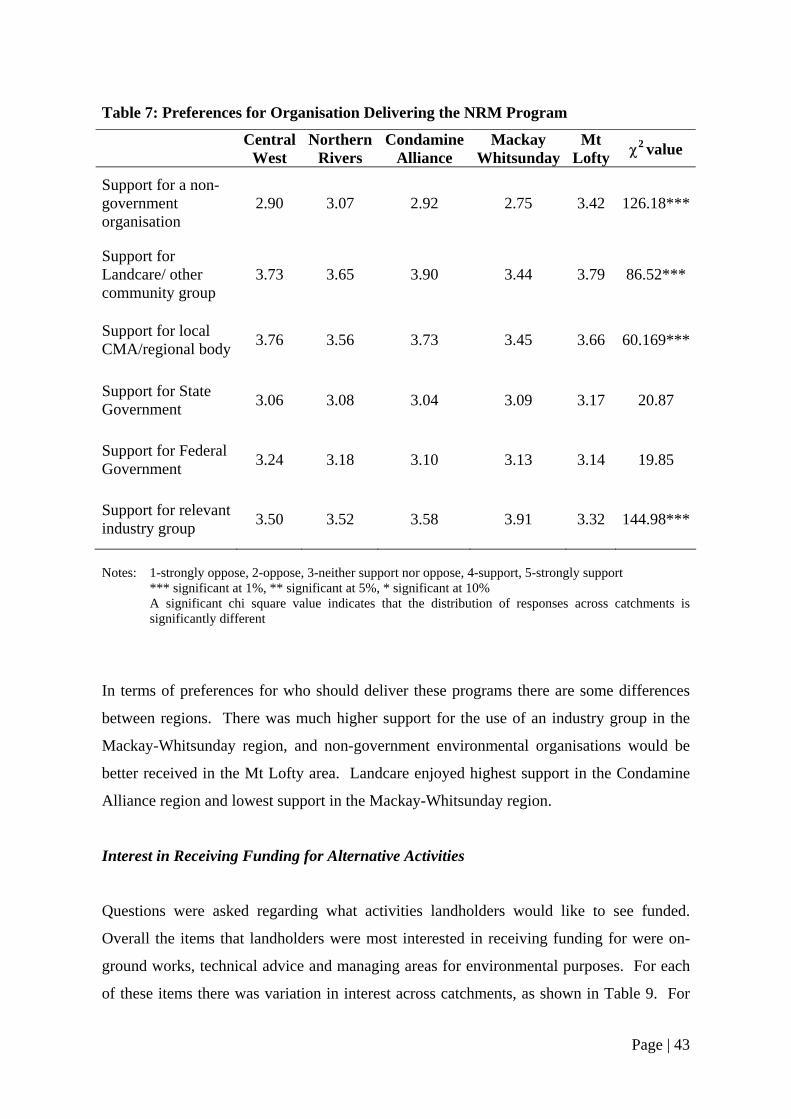
Table 7: Preferences for Organisation Delivering the NRM Program
Central
West Northern
Rivers Condamine
Alliance Mackay
Whitsunday Mt
Lofty χ2 value
Support for a non-government organisation
2.90 3.07 2.92 2.75 3.42 126.18***
Support for Landcare/ other community group
3.73 3.65 3.90 3.44 3.79 86.52***
Support for local CMA/regional body 3.76 3.56 3.73 3.45 3.66 60.169***
Support for State Government 3.06 3.08 3.04 3.09 3.17 20.87
Support for Federal Government 3.24 3.18 3.10 3.13 3.14 19.85
Support for relevant industry group 3.50 3.52 3.58 3.91 3.32 144.98***
Notes: 1-strongly oppose, 2-oppose, 3-neither support nor oppose, 4-support, 5-strongly support *** significant at 1%, ** significant at 5%, * significant at 10% A significant chi square value indicates that the distribution of responses across catchments is
significantly different
In terms of preferences for who should deliver these programs there are some differences
between regions. There was much higher support for the use of an industry group in the
Mackay-Whitsunday region, and non-government environmental organisations would be
better received in the Mt Lofty area. Landcare enjoyed highest support in the Condamine
Alliance region and lowest support in the Mackay-Whitsunday region.
Interest in Receiving Funding for Alternative Activities
Questions were asked regarding what activities landholders would like to see funded.
Overall the items that landholders were most interested in receiving funding for were on-
ground works, technical advice and managing areas for environmental purposes. For each
of these items there was variation in interest across catchments, as shown in Table 9. For
Page | 43
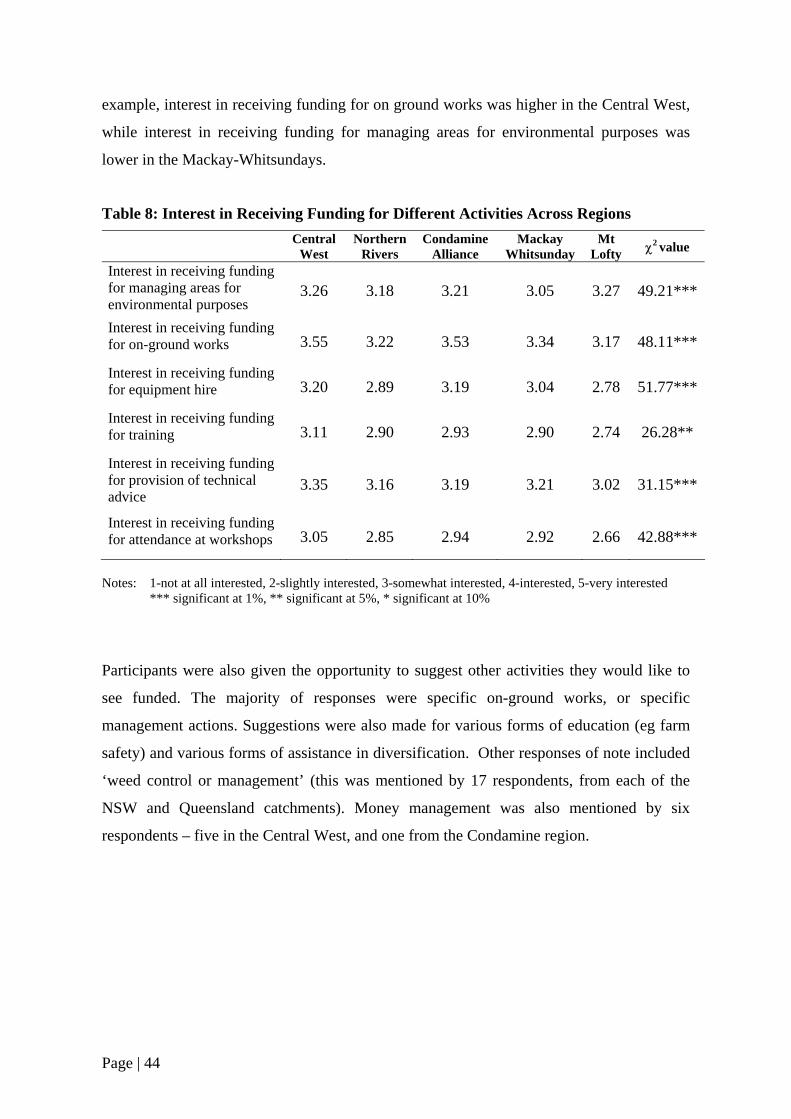
example, interest in receiving funding for on ground works was higher in the Central West,
while interest in receiving funding for managing areas for environmental purposes was
lower in the Mackay-Whitsundays.
Table 8: Interest in Receiving Funding for Different Activities Across Regions
Central
West Northern
Rivers Condamine
Alliance Mackay
Whitsunday Mt
Lofty χ2 value
Interest in receiving funding for managing areas for environmental purposes
3.26 3.18 3.21 3.05 3.27 49.21***
Interest in receiving funding for on-ground works 3.55 3.22 3.53 3.34 3.17 48.11***
Interest in receiving funding for equipment hire 3.20 2.89 3.19 3.04 2.78 51.77***
Interest in receiving funding for training 3.11 2.90 2.93 2.90 2.74 26.28**
Interest in receiving funding for provision of technical advice
3.35 3.16 3.19 3.21 3.02 31.15***
Interest in receiving funding for attendance at workshops 3.05 2.85 2.94 2.92 2.66 42.88***
Notes: 1-not at all interested, 2-slightly interested, 3-somewhat interested, 4-interested, 5-very interested *** significant at 1%, ** significant at 5%, * significant at 10%
Participants were also given the opportunity to suggest other activities they would like to
see funded. The majority of responses were specific on-ground works, or specific
management actions. Suggestions were also made for various forms of education (eg farm
safety) and various forms of assistance in diversification. Other responses of note included
‘weed control or management’ (this was mentioned by 17 respondents, from each of the
NSW and Queensland catchments). Money management was also mentioned by six
respondents – five in the Central West, and one from the Condamine region.
Page | 44
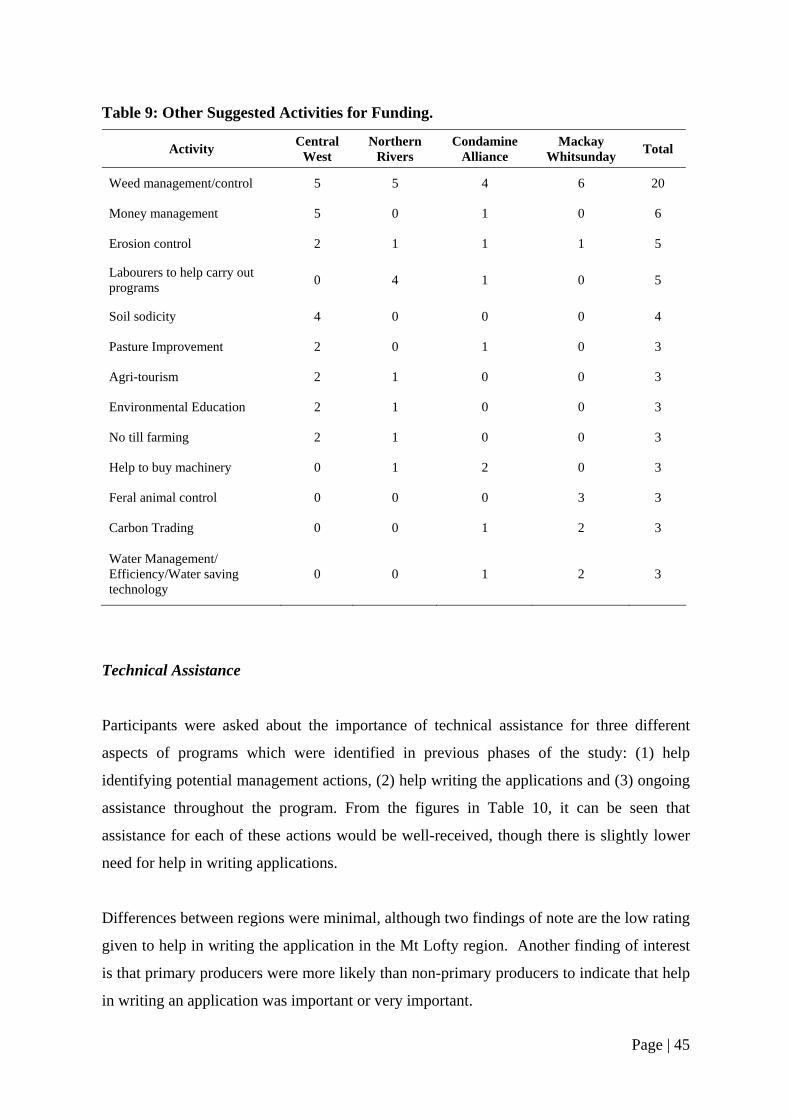
Table 9: Other Suggested Activities for Funding.
Activity Central West
Northern Rivers
Condamine Alliance
Mackay Whitsunday Total
Weed management/control 5 5 4 6 20
Money management 5 0 1 0 6
Erosion control 2 1 1 1 5
Labourers to help carry out programs 0 4 1 0 5
Soil sodicity 4 0 0 0 4
Pasture Improvement 2 0 1 0 3
Agri-tourism 2 1 0 0 3
Environmental Education 2 1 0 0 3
No till farming 2 1 0 0 3
Help to buy machinery 0 1 2 0 3
Feral animal control 0 0 0 3 3
Carbon Trading 0 0 1 2 3
Water Management/ Efficiency/Water saving technology
0 0 1 2 3
Technical Assistance
Participants were asked about the importance of technical assistance for three different
aspects of programs which were identified in previous phases of the study: (1) help
identifying potential management actions, (2) help writing the applications and (3) ongoing
assistance throughout the program. From the figures in Table 10, it can be seen that
assistance for each of these actions would be well-received, though there is slightly lower
need for help in writing applications.
Differences between regions were minimal, although two findings of note are the low rating
given to help in writing the application in the Mt Lofty region. Another finding of interest
is that primary producers were more likely than non-primary producers to indicate that help
in writing an application was important or very important.
Page | 45
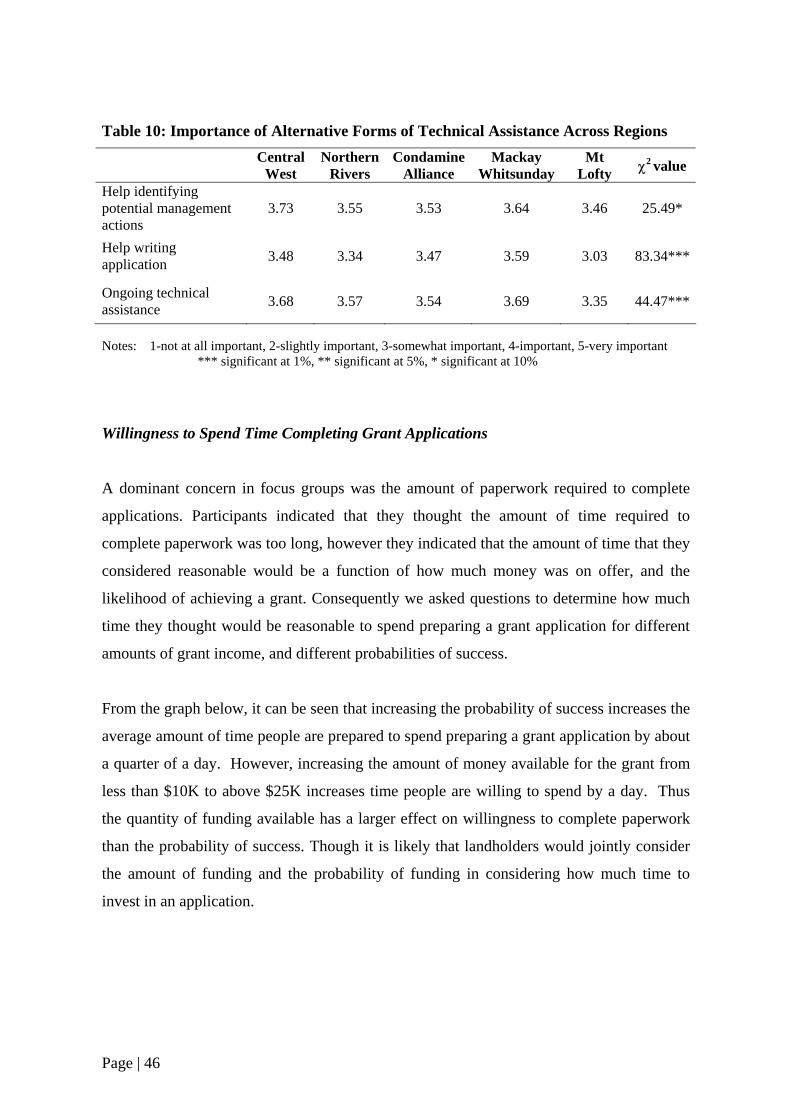
Table 10: Importance of Alternative Forms of Technical Assistance Across Regions
Central
West Northern
Rivers Condamine
Alliance Mackay
WhitsundayMt
Lofty χ2 value
Help identifying potential management actions
3.73 3.55 3.53 3.64 3.46 25.49*
Help writing application 3.48 3.34 3.47 3.59 3.03 83.34***
Ongoing technical assistance 3.68 3.57 3.54 3.69 3.35 44.47***
Notes: 1-not at all important, 2-slightly important, 3-somewhat important, 4-important, 5-very important *** significant at 1%, ** significant at 5%, * significant at 10%
Willingness to Spend Time Completing Grant Applications
A dominant concern in focus groups was the amount of paperwork required to complete
applications. Participants indicated that they thought the amount of time required to
complete paperwork was too long, however they indicated that the amount of time that they
considered reasonable would be a function of how much money was on offer, and the
likelihood of achieving a grant. Consequently we asked questions to determine how much
time they thought would be reasonable to spend preparing a grant application for different
amounts of grant income, and different probabilities of success.
From the graph below, it can be seen that increasing the probability of success increases the
average amount of time people are prepared to spend preparing a grant application by about
a quarter of a day. However, increasing the amount of money available for the grant from
less than $10K to above $25K increases time people are willing to spend by a day. Thus
the quantity of funding available has a larger effect on willingness to complete paperwork
than the probability of success. Though it is likely that landholders would jointly consider
the amount of funding and the probability of funding in considering how much time to
invest in an application.
Page | 46
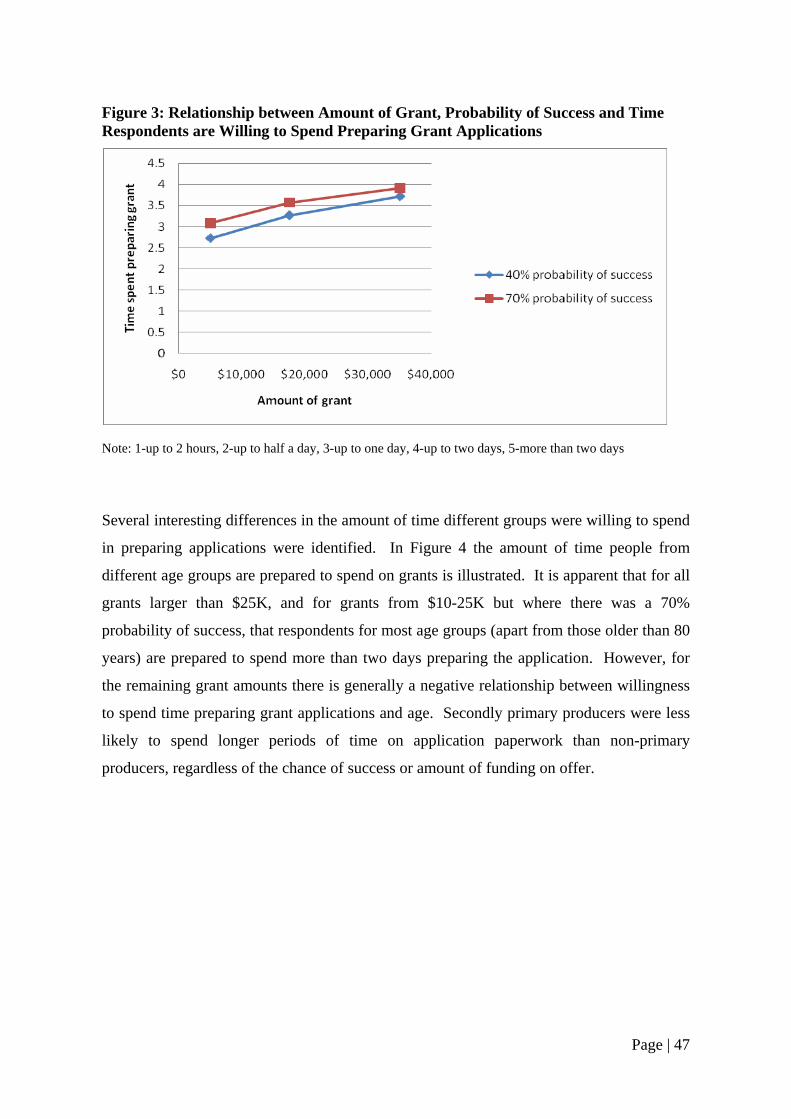
Figure 3: Relationship between Amount of Grant, Probability of Success and Time Respondents are Willing to Spend Preparing Grant Applications
Note: 1-up to 2 hours, 2-up to half a day, 3-up to one day, 4-up to two days, 5-more than two days
Several interesting differences in the amount of time different groups were willing to spend
in preparing applications were identified. In Figure 4 the amount of time people from
different age groups are prepared to spend on grants is illustrated. It is apparent that for all
grants larger than $25K, and for grants from $10-25K but where there was a 70%
probability of success, that respondents for most age groups (apart from those older than 80
years) are prepared to spend more than two days preparing the application. However, for
the remaining grant amounts there is generally a negative relationship between willingness
to spend time preparing grant applications and age. Secondly primary producers were less
likely to spend longer periods of time on application paperwork than non-primary
producers, regardless of the chance of success or amount of funding on offer.
Page | 47
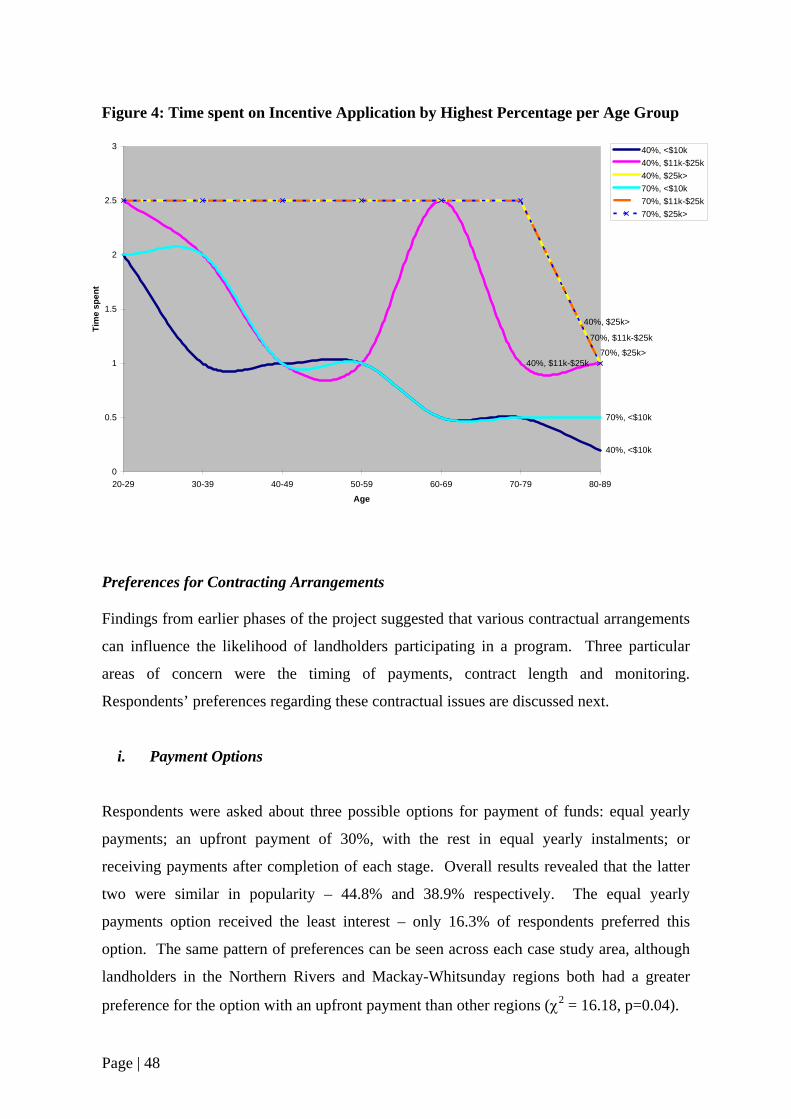
Figure 4: Time spent on Incentive Application by Highest Percentage per Age Group
40%, $11k-$25k
70%, <$10k
>
11k-$25k
70%, $25k>
5
1
3
Tim
e sp
ent
2.5
40%, $25k
70%, $
1.5
2
0.
40%, <$10k
020-29 30-39 40-49 50-59 60-69 70-79 80-89
Age
40%, <$10k40%, $11k-$25k40%, $25k>70%, <$10k70%, $11k-$25k70%, $25k>
t length and monitoring.
Respondents’ preferen i n s ar d nex
ent Optio
ask th ble or pay funds: early
pfront payment of 30%, with the rest in equal yearly instalments; or
after completion of each stage. Overall results revealed that the latter
in ty an
option received the least interest – only 16.3% of respondents preferred this
ption. The same pattern of preferences can be seen across each case study area, although
ndholders in the Northern Rivers and Mackay-Whitsunday regions both had a greater
reference for the option with an upfront payment than other regions (χ2 = 16.18, p=0.04).
Preferences for Contracting Arrangements Findings from earlier phases of the project suggested that various contractual arrangements
can influence the likelihood of landholders participating in a program. Three particular
areas of concern were the timing of payments, contrac
ces regard ng these co tractual issue e discusse t.
i. Paym ns
Respondents were
payments; an u
ed about ree possi options f ment of equal y
receiving payments
two were similar
payments
populari – 44.8% d 38.9% respectively. The equal yearly
o
la
p
Page | 48
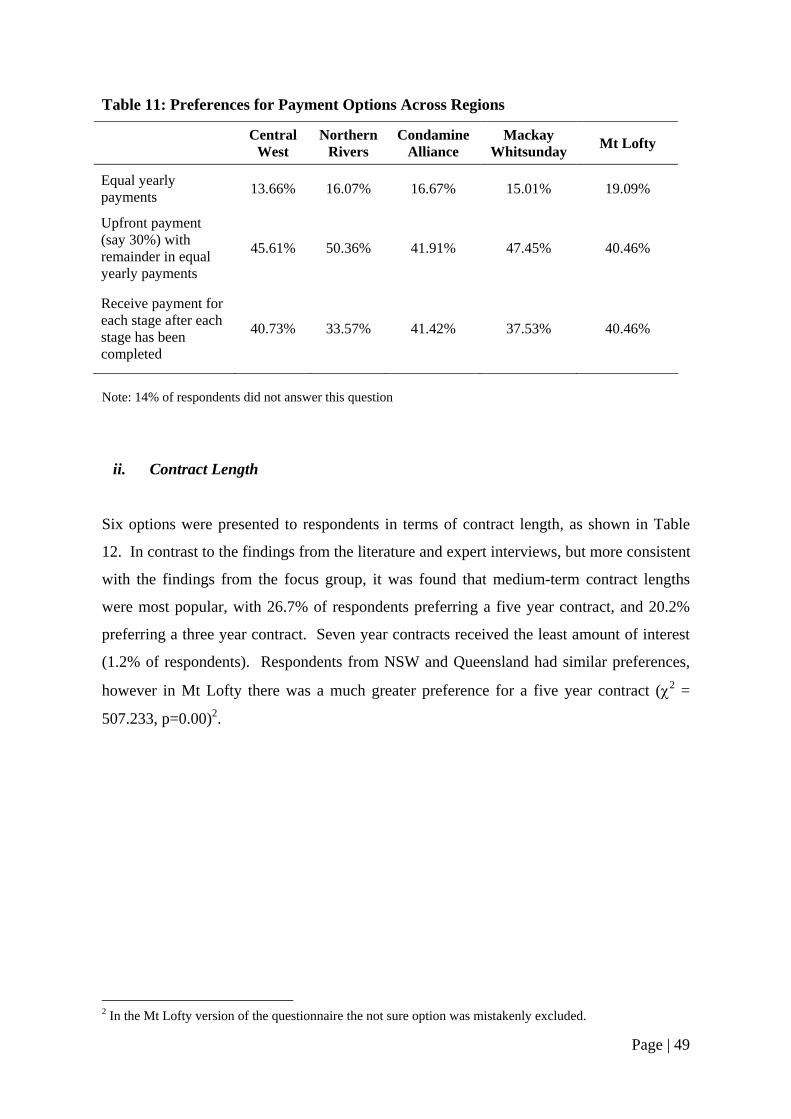
Table 11: Preferences for Payment Options Across Regions
Central Northern Condamine Mackay Mt Lofty West Rivers Alliance Whitsunday
Equal yearly payments 13.66% 16.07% 16.67% 15.01% 19.09%
Upfront payment (say 30%) with remainder in equal yearly payments
45.61% 50.36% 41.91% 47.45% 40.46%
Receive payment for each stage after each stage has been completed
40.73% 33.57% 41.42% 37.53% 40.46%
Note: 14% of respondents did not answer this question
ii. Contract Length
Six options were presented to respondents in terms of contract length, as shown in Table
12. In contrast to the findings from the literature and expert interviews, but more consistent
with the findings from the focus group, it was found that medium-term contract lengths
were most popular, with 26.7% of respondents preferring a five year contract, and 20.2%
preferring a three year contract. Seven year contracts received the least amount of interest
(1.2% of respondents). Respondents from NSW and Queensland had similar preferences,
however in Mt Lofty there was a much greater preference for a five year contract (χ2 =
507.233, p=0.00)2.
2 In the Mt Lofty version of the questionnaire the not sure option was mistakenly excluded.
Page | 49
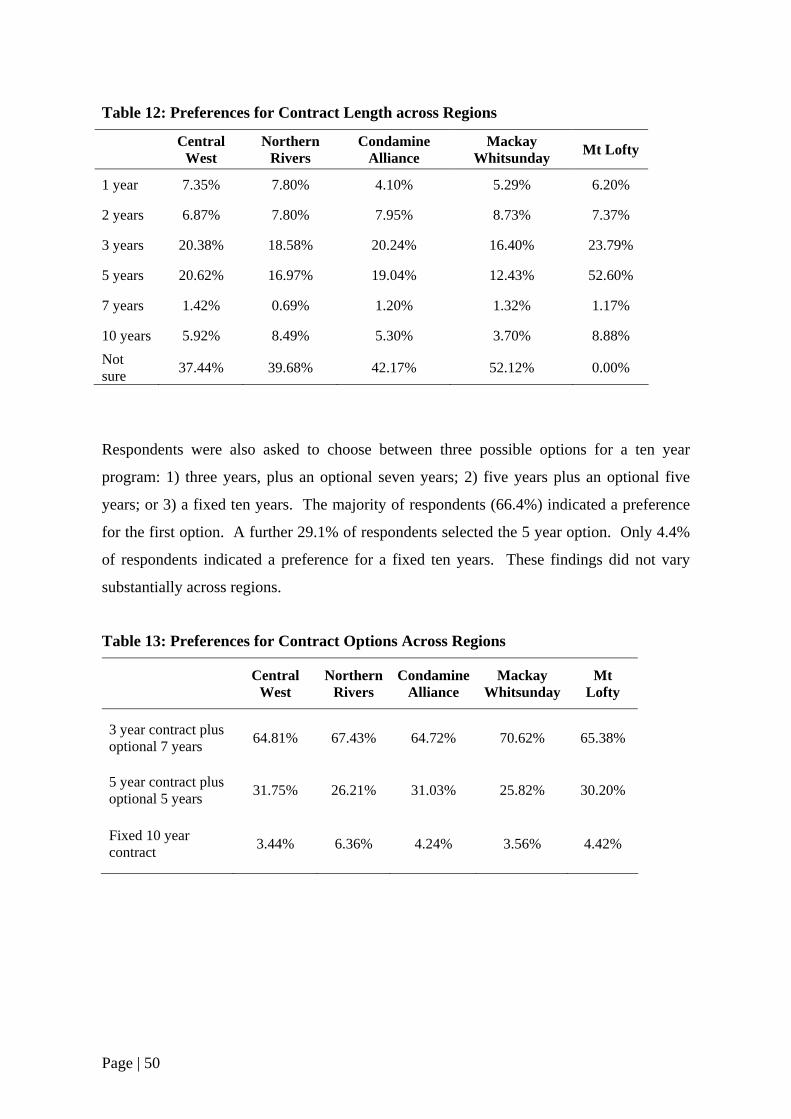
Table 12: Preferences for Contract Length across Regions
Central West
Northern Rivers
Condamine Alliance
Mackay Whitsunday Mt Lofty
1 year 7.35% 7.80% 4.10% 5.29% 6.20%
2 years 6.87% 7.80% 7.95% 8.73% 7.37%
3 years 20.38% 18.58% 20.24% 16.40% 23.79%
5 years 20.62% 16.97% 19.04% 12.43% 52.60%
7 years 1.42% 0.69% 1.20% 1.32% 1.17%
10 years 5.92% 8.49% 5.30% 3.70% 8.88% Not sure 37.44% 39.68% 42.17% 52.12% 0.00%
Respondents were also asked to choose between three possible options for a ten year
program: 1) three years, plus an optional seven years; 2) five years plus an optional five
years; or 3) a fixed ten years. The majority of respondents (66.4%) indicated a preference
for the first option. A further 29.1% of respondents selected the 5 year option. Only 4.4%
of respondents indicated a preference for a fixed ten years. These findings did not vary
substantially across regions.
Table 13: Preferences for Contract Options Across Regions
Central West
Northern Rivers
Condamine Alliance
Mackay Whitsunday
Mt Lofty
3 year contract plus optional 7 years 64.81% 67.43% 64.72% 70.62% 65.38%
5 year contract plus optional 5 years 31.75% 26.21% 31.03% 25.82% 30.20%
Fixed 10 year contract 3.44% 6.36% 4.24% 3.56% 4.42%
Page | 50

iii. Preferred Monitoring
Respondents were also asked to choose between three possible options for monitoring: 1)
have a site visit halfway and at the end of a contract; 2) having a site visit at the end of the
contract only; or 3) sending in photos at key stages and a site visit at the end of a contract.
The first option was preferred by 63.2% of respondents, the third by 29.5%. Interestingly,
the option with the least amount of monitoring – having a site visit at the end only – was
preferred by only 7.3% of respondents. This finding was again unexpected based on the
findings from the expert interviews where a minimum amount of monitoring was
recommended, but was consistent with the findings from the focus groups where farmers
preferred more ongoing monitoring so that they could identify any problems early on and to
guarantee the integrity of the program.
Table 14: Preferences for Monitoring Across Regions
Central West
Northern Rivers
Condamine Alliance
Mackay Whitsunday
Site visit halfway and at end of contract 64.62% 63.88% 62.95% 61.17%
Site visit at end of contract 7.18% 6.14% 9.59% 6.42%
Send in photos at key stages and site visit at end of contract 28.21% 29.98% 27.46% 32.40%
6.3 Who Participates in Market Based Instruments and Incentive Programs
Binary logistic regression analyses were conducted with socio-demographic and farm level
characteristics included as independent variables. These regressions were conducted to
identify variables useful for identifying those most likely to participate in MBIs and
incentive programs.
Page | 51
Regression Analysis
Binary logistic regressions were estimated to predict participation3 in several of the main
MBI and incentive programs4 as a function of 13 socio-demographic and property level
characteristics. Participation in two Australia wide programs was investigated: Landcare
and Envirofund. Secondly, participation in four catchment specific programs was
investigated: Central West CMA Incentives, Condamine Alliance Regional Investment
Strategy Program, Rural Water Use Efficiency Program (Mackay-Whitsundays) and the
Sustainable Landscape Program (Mackay-Whitsundays). Thirdly, participation was
modelled for participation in any program in any catchment. The results for these
regressions are presented in Table 16.
The summary statistics suggest that the predictive power of the equations varies, as shown
by the percentage correct predictions and the rho-square values. Rho square values of 0.2
are equivalent to R2 values of about 60-70% in standard regression analysis (Louviere,
Hensher and Swait 2000).
The results in Table 16 suggest that total area of property, education, and hours worked on
property are the most frequently significant variables in explaining participation. Variables
significant in at least two equations include years lived in district, years lived on property,
total area of property leased, age and gender.
The variable indicating whether a respondent identified themselves as a primary producer
was only significant for the Rural Water Efficiency equation. ‘Primary producer’ was
found to be a positive indicator of participation suggesting that primary producers are more
inclined to take part in this program. This finding is contradictory to Curtis et al (2006)
who found that identifying as a farmer was a negative predictor of participation, although
the Curtis et al study focused on participation in a biodiversity tender rather than a water
efficiency program.
3 Additional regressions were run where the dependent variable was whether respondents had applied to participate in the programs listed in this paragraph. The results were substantively equivalent to what is reported here therefore have not been presented. 4 Programs were only investigated if they were chosen by a reasonable proportion of the sample (>5%).
Page | 52
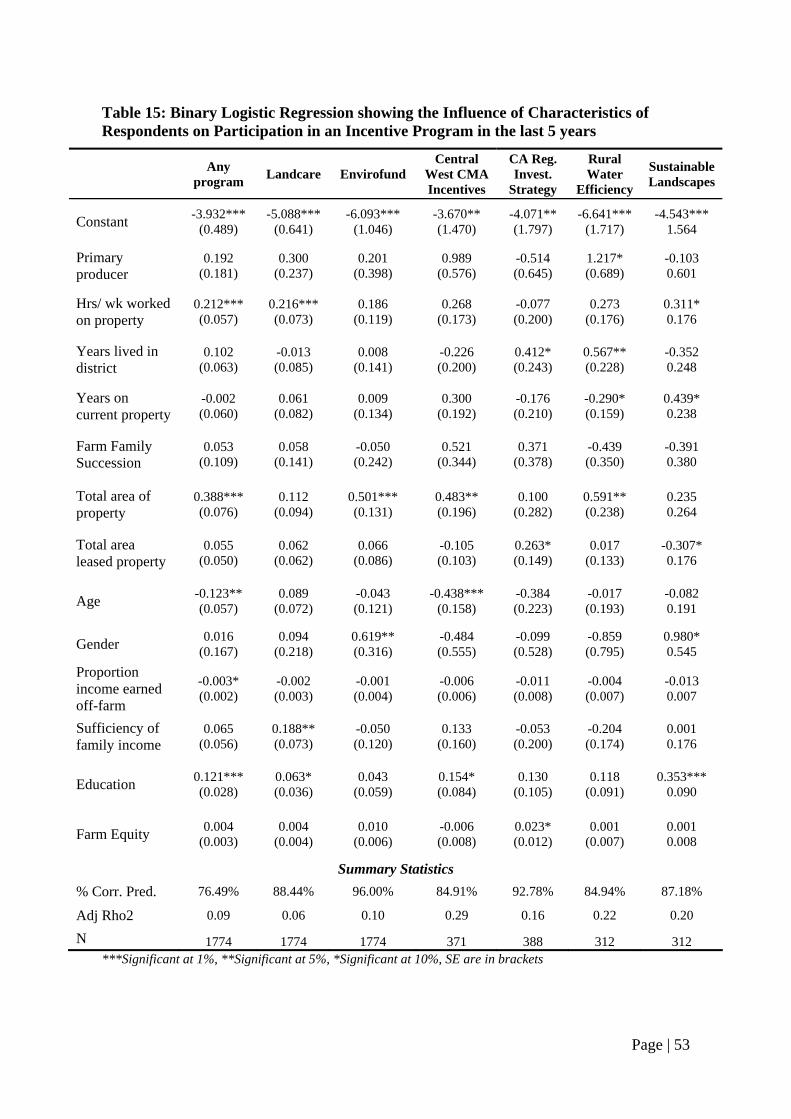
Table 15: Binary Logistic Regression showing the Influence of Characteristics of Respondents on Participation in an Incentive Program in the last 5 years
Any
program Landcare Envirofund Central
West CMA Incentives
CA Reg. Invest.
Strategy
Rural Water
Efficiency
Sustainable Landscapes
Constant -3.932*** (0.489)
-5.088*** (0.641)
-6.093*** (1.046)
-3.670** (1.470)
-4.071** (1.797)
-6.641*** (1.717)
-4.543*** 1.564
Primary producer
0.192 (0.181)
0.300 (0.237)
0.201 (0.398)
0.989 (0.576)
-0.514 (0.645)
1.217* (0.689)
-0.103 0.601
Hrs/ wk worked on property
0.212*** (0.057)
0.216*** (0.073)
0.186 (0.119)
0.268 (0.173)
-0.077 (0.200)
0.273 (0.176)
0.311* 0.176
Years lived in district
0.102 (0.063)
-0.013 (0.085)
0.008 (0.141)
-0.226 (0.200)
0.412* (0.243)
0.567** (0.228)
-0.352 0.248
Years on current property
-0.002 (0.060)
0.061 (0.082)
0.009 (0.134)
0.300 (0.192)
-0.176 (0.210)
-0.290* (0.159)
0.439* 0.238
Farm Family Succession
0.053 (0.109)
0.058 (0.141)
-0.050 (0.242)
0.521 (0.344)
0.371 (0.378)
-0.439 (0.350)
-0.391 0.380
Total area of property
0.388*** (0.076)
0.112 (0.094)
0.501*** (0.131)
0.483** (0.196)
0.100 (0.282)
0.591** (0.238)
0.235 0.264
Total area leased property
0.055 (0.050)
0.062 (0.062)
0.066 (0.086)
-0.105 (0.103)
0.263* (0.149)
0.017 (0.133)
-0.307* 0.176
Age -0.123** (0.057)
0.089 (0.072)
-0.043 (0.121)
-0.438*** (0.158)
-0.384 (0.223)
-0.017 (0.193)
-0.082 0.191
Gender 0.016 (0.167)
0.094 (0.218)
0.619** (0.316)
-0.484 (0.555)
-0.099 (0.528)
-0.859 (0.795)
0.980* 0.545
Proportion income earned off-farm
-0.003* (0.002)
-0.002 (0.003)
-0.001 (0.004)
-0.006 (0.006)
-0.011 (0.008)
-0.004 (0.007)
-0.013 0.007
Sufficiency of family income
0.065 (0.056)
0.188** (0.073)
-0.050 (0.120)
0.133 (0.160)
-0.053 (0.200)
-0.204 (0.174)
0.001 0.176
Education 0.121*** (0.028)
0.063* (0.036)
0.043 (0.059)
0.154* (0.084)
0.130 (0.105)
0.118 (0.091)
0.353*** 0.090
Farm Equity 0.004 (0.003)
0.004 (0.004)
0.010 (0.006)
-0.006 (0.008)
0.023* (0.012)
0.001 (0.007)
0.001 0.008
Summary Statistics % Corr. Pred. 76.49% 88.44% 96.00% 84.91% 92.78% 84.94% 87.18%
Adj Rho2 0.09 0.06 0.10 0.29 0.16 0.22 0.20
N 1774 1774 1774 371 388 312 312 ***Significant at 1%, **Significant at 5%, *Significant at 10%, SE are in brackets
Page | 53
The amount of hours worked on the property was positively significant in three of the
equations. Again this finding is opposite to that of Curtis et al (2006) who found that the
number of hours worked on a property was negatively related to participation.
Participation was revealed to be positively influenced by the number of years a respondent
had lived in their local district. Previous studies have not investigated the effect of this
variable on likelihood to participate in an MBI or incentive program.
Mixed results were identified in regards to the effect the length of time respondents had
lived on their current property had on their likelihood to participate in an incentive
program. ‘Years on current property’ was significant and negative for the Rural Water
Efficiency equation suggesting that more recent purchasers of property would be more
likely to participate in incentive programs. This is consistent with Curtis et al’s (2006)
finding for the Victorian River Tender Project and the expert interviews conducted during
the course of the study. Conversely, ‘years on current property’ was positively related to
participation for the Sustainable Landscapes Program, indicating that longer term residents
were more likely to participate in this project. Given that the Sustainable Landscapes
Program focuses largely on biodiversity and involves an MBI, the explanation for the
variability in these findings does not appear to be differences in the focus of the programs.
Total area of property was positively significant in four of the seven equations. This was
similar to Black and Reeve (1993), who found that farm size was positively related to
participation in Landcare. Conversely, Clayton (2005), Curtis et al (2006), and Brotherton
(1991) all found that farm size was negative related to participation. Thus there is much
uncertainty in the literature regarding the influence of this variable on participation.
Mixed relationships were also evident between participation and the total area of property
leased to respondents. The amount of property leased to the respondent is positively
related to participation in the Condamine Alliance Regional Investment Strategy Program.
Alternatively, this relationship is negative for the Sustainable Landscape Program
(Mackay-Whitsundays). The mixed results may be attributed to the long term results of
the Sustainable Landscape Program which would not benefit those who leased their current
property. A negative relationship is supported by Ducos and Dupraz (2006) who indicated
that the amount of land in short term tenant farming was negatively related to participation.
Page | 54
Consistent with the findings of Wynn et al (2001) and Curtis et al (2006), age was found to
be negatively related to participation. This relationship was significant and constant across
two of the equations including participation in any program included in the questionnaire.
This finding was also supported by the expert interviews and focus groups conducted in
this study where respondents indicated that younger farmers are more likely to participate.
Gender was also significant in two of the equations. A positive relation was observed
between gender (being female) and participation. This relationship had not been previously
tested.
Interestingly, proportion of income earned off farm was negatively related to participation
though it was only significant at the 10% level in one of the equations. This contradicts the
finding of Curtis et al (2006) who observed a positive relationship between off farm
income and participation.
Also relating to income and participation was the variable sufficiency of family income.
This variable proved to be significant and positively related to participation in the equation
for Landcare, indicating those who are more financially sound are more likely to
participate in Landcare.
Education was positively significant in four of the equations. This finding is supported by
Black and Reeve (1993) who identified a positive relationship between education and
participation. Also the experts interviewed in the course of this study suggested that those
with a higher level of education were more likely to participate. However, a more recent
international study by Ducos and Dupraz (2006) found that education had a negative effect
on the likelihood of participation.
Black and Reeves’ (1993) finding of a positive relation between farm equity and
participation was also found in one of the regressions reported, though the significance
level was only marginal.
Therefore, the characteristics of those more likely to participate in an MBI or incentive
program include being younger, more educated and male. They tend to work a larger
Page | 55
amount of time on their property, own larger properties, and have lived in their local
district for a longer period of time.
6.4 Landholder Segments As discussed in the methodology, the process of identifying landholder segments involves
the use of factor, regression and cluster analysis. Factor analysis was used to identify the
attitudinal constructs, and the results from this analysis are reported in Appendix 4, as are
the tests of the validity and reliability of the attitudinal constructs. In this section we focus
on firstly reporting the results from the regression analysis used to identify the attitudinal
and behavioural constructs which best predict potential and actual participation in various
MBIs and incentive programs. Four constructs are identified in this analysis as consistently
having the greatest influence on participation: trust, connectedness, business orientation and
use of information channels for gathering information about farming. These constructs
were then used for the cluster analysis which is used to define the landholder segments.
This is described after the cluster analysis.
Regression Analysis
Binary logit regressions were estimated to predict participation5 in several of the main MBI
and incentive programs6 as a function of seven7 of the eight attitudinal constructs and the
four behavioural constructs. Participation in two Australia wide programs were
investigated: Landcare and Envirofund. Secondly, participation in four catchment specific
programs were investigated: Central West CMA Incentives, Condamine Alliance Regional
Investment Strategy Program, Rural Water Use Efficiency Program (Mackay-Whitsundays)
and the Sustainable Landscape Program (Mackay-Whitsundays). Thirdly, participation was
modelled for participation in any program in any catchment. The results for these
regressions are presented in Table 17. Standardised coefficients are reported in Table 17 so
that the magnitude of the coefficients can be compared.
5 Additional regressions were run where the dependent variable was whether respondents had applied to participate in the programs listed in this paragraph. The results were substantively equivalent to what is reported here therefore have not been presented. 6 Programs were only investigated if they were chosen by a reasonable proportion of the sample (>5%). 7 One of the eight attitudinal constructs (stewardship) was excluded as its reliability and validity was poor (see Appendix 4).
Page | 56
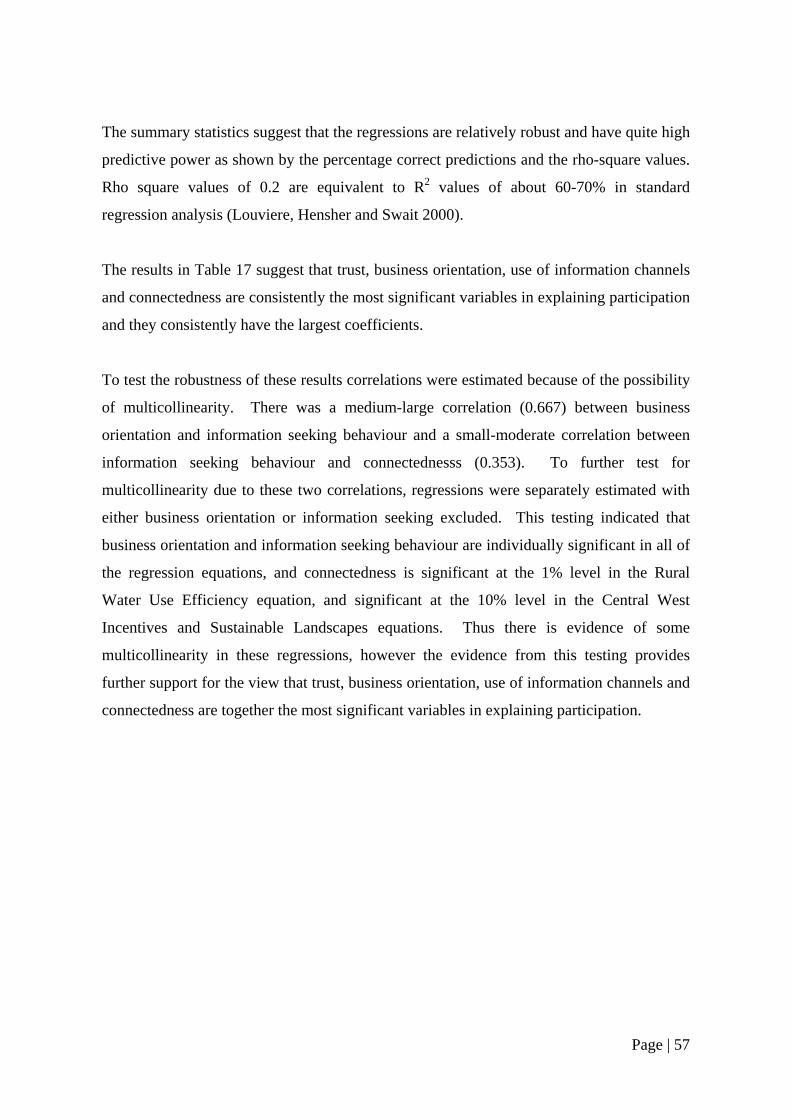
The summary statistics suggest that the regressions are relatively robust and have quite high
predictive power as shown by the percentage correct predictions and the rho-square values.
Rho square values of 0.2 are equivalent to R2 values of about 60-70% in standard
regression analysis (Louviere, Hensher and Swait 2000).
The results in Table 17 suggest that trust, business orientation, use of information channels
and connectedness are consistently the most significant variables in explaining participation
and they consistently have the largest coefficients.
To test the robustness of these results correlations were estimated because of the possibility
of multicollinearity. There was a medium-large correlation (0.667) between business
orientation and information seeking behaviour and a small-moderate correlation between
information seeking behaviour and connectednesss (0.353). To further test for
multicollinearity due to these two correlations, regressions were separately estimated with
either business orientation or information seeking excluded. This testing indicated that
business orientation and information seeking behaviour are individually significant in all of
the regression equations, and connectedness is significant at the 1% level in the Rural
Water Use Efficiency equation, and significant at the 10% level in the Central West
Incentives and Sustainable Landscapes equations. Thus there is evidence of some
multicollinearity in these regressions, however the evidence from this testing provides
further support for the view that trust, business orientation, use of information channels and
connectedness are together the most significant variables in explaining participation.
Page | 57
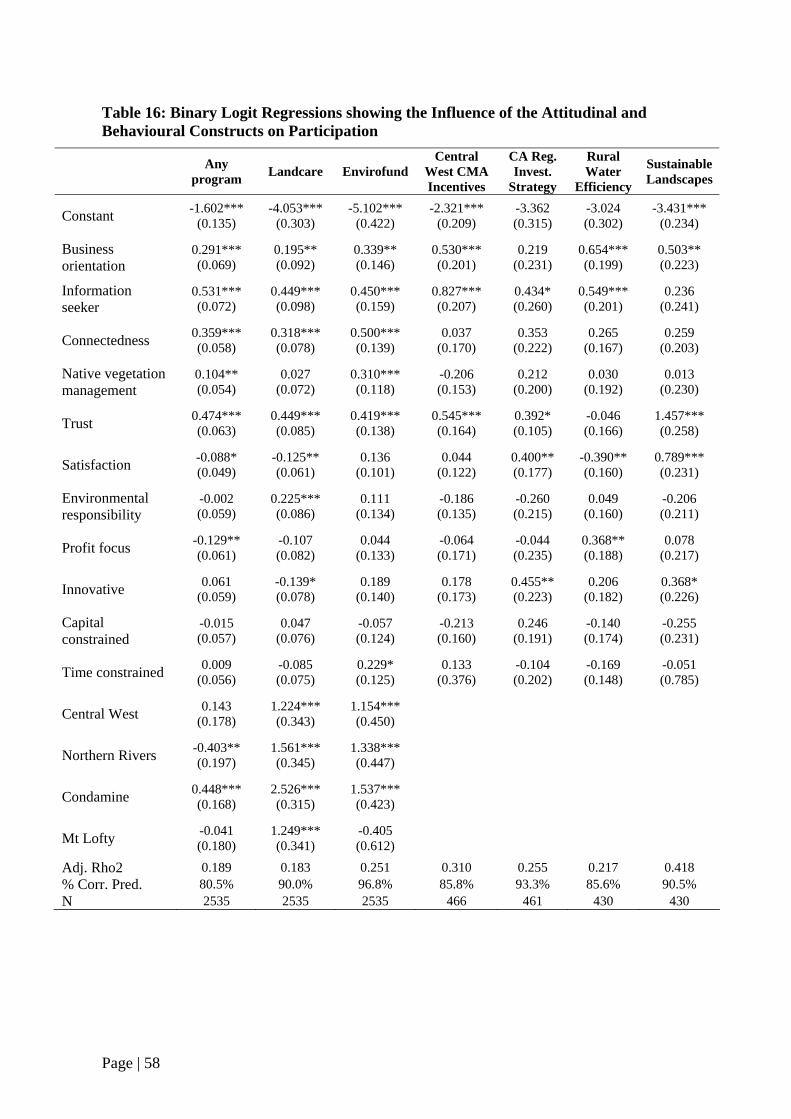
Table 16: Binary Logit Regressions showing the Influence of the Attitudinal and Behavioural Constructs on Participation
Any program Landcare Envirofund
Central West CMA Incentives
CA Reg. Invest.
Strategy
Rural Water
Efficiency
Sustainable Landscapes
Constant -1.602*** (0.135)
-4.053*** (0.303)
-5.102*** (0.422)
-2.321*** (0.209)
-3.362 (0.315)
-3.024 (0.302)
-3.431*** (0.234)
Business orientation
0.291*** (0.069)
0.195** (0.092)
0.339** (0.146)
0.530*** (0.201)
0.219 (0.231)
0.654*** (0.199)
0.503** (0.223)
Information seeker
0.531*** (0.072)
0.449*** (0.098)
0.450*** (0.159)
0.827*** (0.207)
0.434* (0.260)
0.549*** (0.201)
0.236 (0.241)
Connectedness 0.359*** (0.058)
0.318*** (0.078)
0.500*** (0.139)
0.037 (0.170)
0.353 (0.222)
0.265 (0.167)
0.259 (0.203)
Native vegetation management
0.104** (0.054)
0.027 (0.072)
0.310*** (0.118)
-0.206 (0.153)
0.212 (0.200)
0.030 (0.192)
0.013 (0.230)
Trust 0.474*** (0.063)
0.449*** (0.085)
0.419*** (0.138)
0.545*** (0.164)
0.392* (0.105)
-0.046 (0.166)
1.457*** (0.258)
Satisfaction -0.088* (0.049)
-0.125** (0.061)
0.136 (0.101)
0.044 (0.122)
0.400** (0.177)
-0.390** (0.160)
0.789*** (0.231)
Environmental responsibility
-0.002 (0.059)
0.225*** (0.086)
0.111 (0.134)
-0.186 (0.135)
-0.260 (0.215)
0.049 (0.160)
-0.206 (0.211)
Profit focus -0.129** (0.061)
-0.107 (0.082)
0.044 (0.133)
-0.064 (0.171)
-0.044 (0.235)
0.368** (0.188)
0.078 (0.217)
Innovative 0.061 (0.059)
-0.139* (0.078)
0.189 (0.140)
0.178 (0.173)
0.455** (0.223)
0.206 (0.182)
0.368* (0.226)
Capital constrained
-0.015 (0.057)
0.047 (0.076)
-0.057 (0.124)
-0.213 (0.160)
0.246 (0.191)
-0.140 (0.174)
-0.255 (0.231)
Time constrained 0.009 (0.056)
-0.085 (0.075)
0.229* (0.125)
0.133 (0.376)
-0.104 (0.202)
-0.169 (0.148)
-0.051 (0.785)
Central West 0.143 (0.178)
1.224*** (0.343)
1.154*** (0.450)
Northern Rivers -0.403** (0.197)
1.561*** (0.345)
1.338*** (0.447)
Condamine 0.448*** (0.168)
2.526*** (0.315)
1.537*** (0.423)
Mt Lofty -0.041 (0.180)
1.249*** (0.341)
-0.405 (0.612)
Adj. Rho2 0.189 0.183 0.251 0.310 0.255 0.217 0.418 % Corr. Pred. 80.5% 90.0% 96.8% 85.8% 93.3% 85.6% 90.5% N 2535 2535 2535 466 461 430 430
Page | 58
In addition, ordered logit regressions were estimated showing the effect of the attitudinal
and behavioural constructs on interest in fixed grants, cost-share and tenders. Similar to the
previously reported regressions, trust, connectedness, business orientation and use of
information channels are consistently significant in all three regressions.
However, three other variables, innovative, profit focus and environmental responsibility
are also significant in all three equations. Moreover, the magnitude of the coefficients for
‘innovative’ in all equations is particularly large, and the coefficients for profit focus and
environmental responsibility exceeded those for connectedness.
One of the primary objectives in conducting the regression analysis is to identify suitable
variables for clustering. The dependent variables in these three equations are essentially
subjective – they focus on respondents’ perceived interest in participating in MBIs and
incentive programs during the next three years. This contrasts with the earlier regressions
which focused on objective outcomes. Given that the regressions using objective outcomes
are likely to be more reliable, and thus should be given greater weight, and that innovative
and profit focus were less consistently significant and correctly signed in the earlier
regressions, they are not used as constructs in the cluster analysis8.
8 As a further test of the appropriateness of using these variables for the cluster analysis, experimental cluster analyses were estimated including these additional variables however they did not produce as robust outcomes.
Page | 59
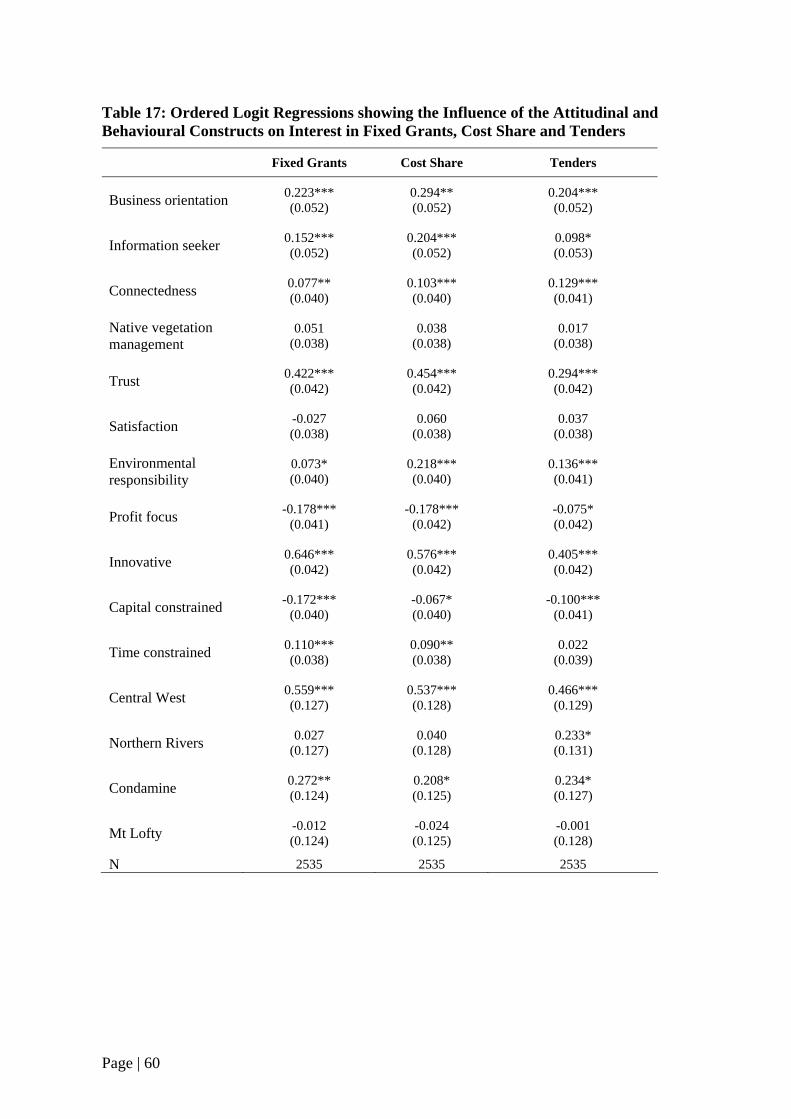
Table 17: Ordered Logit Regressions showing the Influence of the Attitudinal and Behavioural Constructs on Interest in Fixed Grants, Cost Share and Tenders Fixed Grants Cost Share Tenders
Business orientation 0.223*** (0.052)
0.294** (0.052)
0.204*** (0.052)
Information seeker 0.152*** (0.052)
0.204*** (0.052)
0.098* (0.053)
Connectedness 0.077** (0.040)
0.103*** (0.040)
0.129*** (0.041)
Native vegetation management
0.051 (0.038)
0.038 (0.038)
0.017 (0.038)
Trust 0.422*** (0.042)
0.454*** (0.042)
0.294*** (0.042)
Satisfaction -0.027 (0.038)
0.060 (0.038)
0.037 (0.038)
Environmental responsibility
0.073* (0.040)
0.218*** (0.040)
0.136*** (0.041)
Profit focus -0.178*** (0.041)
-0.178*** (0.042)
-0.075* (0.042)
Innovative 0.646*** (0.042)
0.576*** (0.042)
0.405*** (0.042)
Capital constrained -0.172*** (0.040)
-0.067* (0.040)
-0.100*** (0.041)
Time constrained 0.110*** (0.038)
0.090** (0.038)
0.022 (0.039)
Central West 0.559*** (0.127)
0.537*** (0.128)
0.466*** (0.129)
Northern Rivers 0.027 (0.127)
0.040 (0.128)
0.233* (0.131)
Condamine 0.272** (0.124)
0.208* (0.125)
0.234* (0.127)
Mt Lofty -0.012 (0.124)
-0.024 (0.125)
-0.001 (0.128)
N 2535 2535 2535
Page | 60
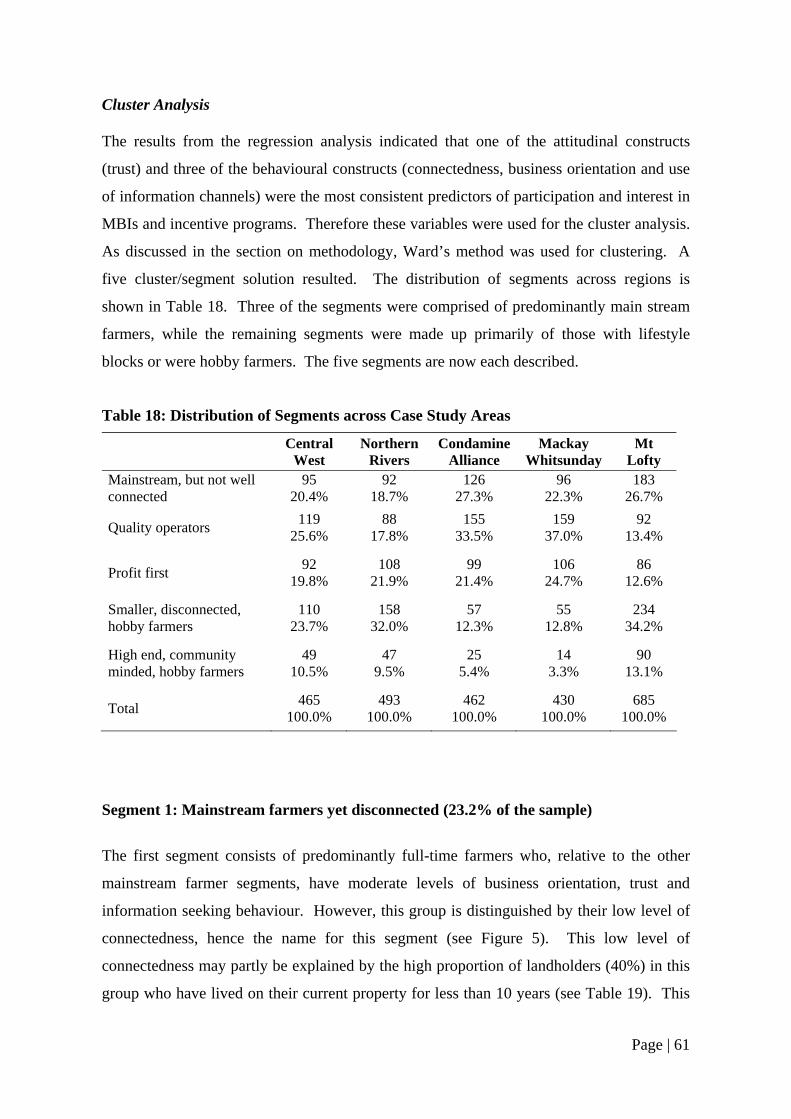
Cluster Analysis The results from the regression analysis indicated that one of the attitudinal constructs
(trust) and three of the behavioural constructs (connectedness, business orientation and use
of information channels) were the most consistent predictors of participation and interest in
MBIs and incentive programs. Therefore these variables were used for the cluster analysis.
As discussed in the section on methodology, Ward’s method was used for clustering. A
five cluster/segment solution resulted. The distribution of segments across regions is
shown in Table 18. Three of the segments were comprised of predominantly main stream
farmers, while the remaining segments were made up primarily of those with lifestyle
blocks or were hobby farmers. The five segments are now each described.
Table 18: Distribution of Segments across Case Study Areas
Central
West Northern
Rivers Condamine
Alliance Mackay
Whitsunday Mt
Lofty Mainstream, but not well connected
95 20.4%
92 18.7%
126 27.3%
96 22.3%
183 26.7%
Quality operators 119 25.6%
88 17.8%
155 33.5%
159 37.0%
92 13.4%
Profit first 92 19.8%
108 21.9%
99 21.4%
106 24.7%
86 12.6%
Smaller, disconnected, hobby farmers
110 23.7%
158 32.0%
57 12.3%
55 12.8%
234 34.2%
High end, community minded, hobby farmers
49 10.5%
47 9.5%
25 5.4%
14 3.3%
90 13.1%
Total 465 100.0%
493 100.0%
462 100.0%
430 100.0%
685 100.0%
Segment 1: Mainstream farmers yet disconnected (23.2% of the sample)
The first segment consists of predominantly full-time farmers who, relative to the other
mainstream farmer segments, have moderate levels of business orientation, trust and
information seeking behaviour. However, this group is distinguished by their low level of
connectedness, hence the name for this segment (see Figure 5). This low level of
connectedness may partly be explained by the high proportion of landholders (40%) in this
group who have lived on their current property for less than 10 years (see Table 19). This
Page | 61
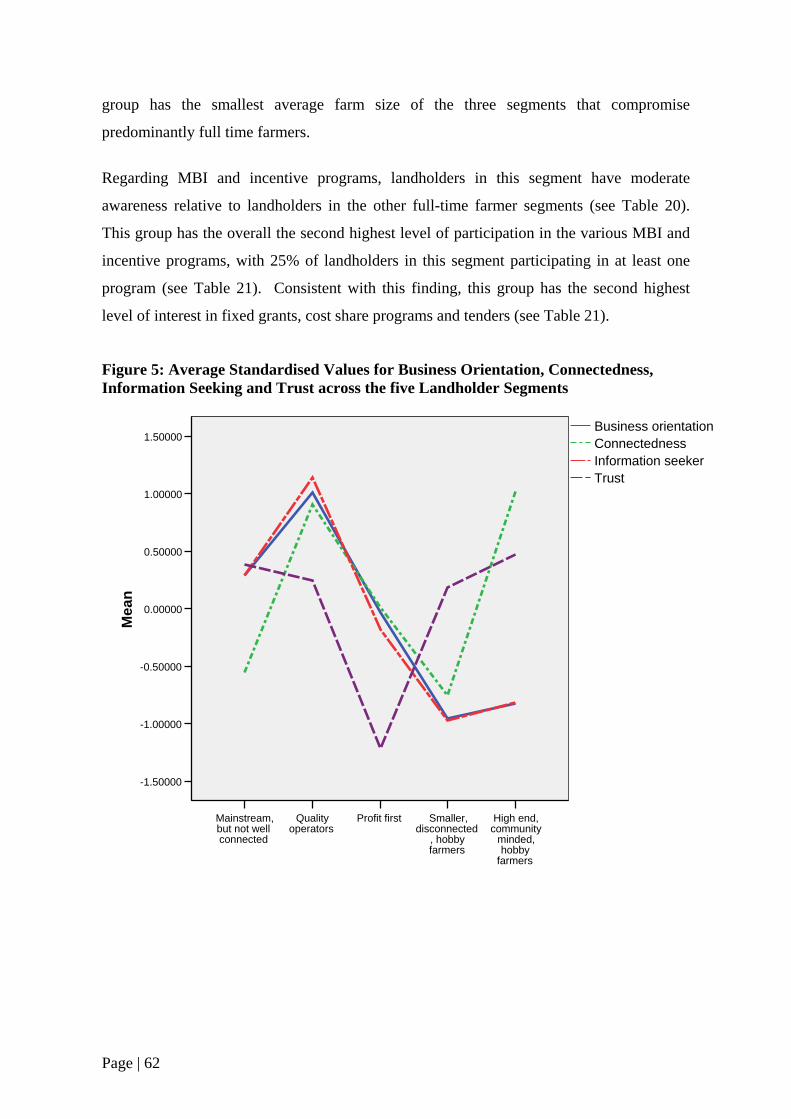
group has the smallest average farm size of the three segments that compromise
predominantly full time farmers.
Regarding MBI and incentive programs, landholders in this segment have moderate
awareness relative to landholders in the other full-time farmer segments (see Table 20).
This group has the overall the second highest level of participation in the various MBI and
incentive programs, with 25% of landholders in this segment participating in at least one
program (see Table 21). Consistent with this finding, this group has the second highest
level of interest in fixed grants, cost share programs and tenders (see Table 21).
Figure 5: Average Standardised Values for Business Orientation, Connectedness, Information Seeking and Trust across the five Landholder Segments
High end, community
minded, hobby
farmers
Smaller, disconnected
, hobby farmers
Profit firstQuality operators
Mainstream, but not well connected
1.50000
1.00000
0.50000
0.00000
-0.50000
-1.00000
-1.50000
Mea
n
TrustInformation seekerConnectednessBusiness orientation
Page | 62
Segment 2: Quality operators (24.2% of the sample)
This landholder segment have been called quality operators because they have particularly
high average scores for business orientation, information seeking behaviour and
connectedness as well as a moderately high score for trust. This group consists primarily of
larger, wealthier and more innovative and profit focused farmers, who employ more full
time and part time workers then any other segment. They are neither capital nor time
constrained. They have the highest percentage of landholders of any segment that consider
themselves full-time farmers. They have a moderately high level of education. They are
relatively neutral in terms of environmental responsibility. They have the smallest
percentage of native vegetation on their property and do not anticipate that this percentage
will change greatly in the future.
In terms of MBI and incentive programs, this segment has the highest levels of awareness
of all of the segments and these are the landholders most likely to participate in a program.
Currently 46% or almost a half of these landholders have participated in a program over the
past five years. This group dominates participation in each of the programs listed in Table
22, and it is apparent that their interest in all available programs, whether it be fixed grants,
cost share or tenders, is higher than for any other segment.
Segment 3: Profit first (24.2% of the sample)
The third landholder segment is characterised by having a strong profit focus, despite
having the lowest scores for business orientation and information seeking of the three full-
time farmer segments. It has a high value for time constrained, and a low value for
innovation. This segment has very low trust in those involved in delivering NRM programs
and, not surprisingly, satisfaction in the last program they participated in is low. This group
has a very low score for environmental responsibility and does not plan to substantially
increase the area of their farm covered in native vegetation over the next 30 years.
In terms of situational and socio-demographic variables, the group has the lowest average
education level of any segment, on average they has lived in the district for the longest of
any of the segments, and they has the second largest farm size.
Page | 63
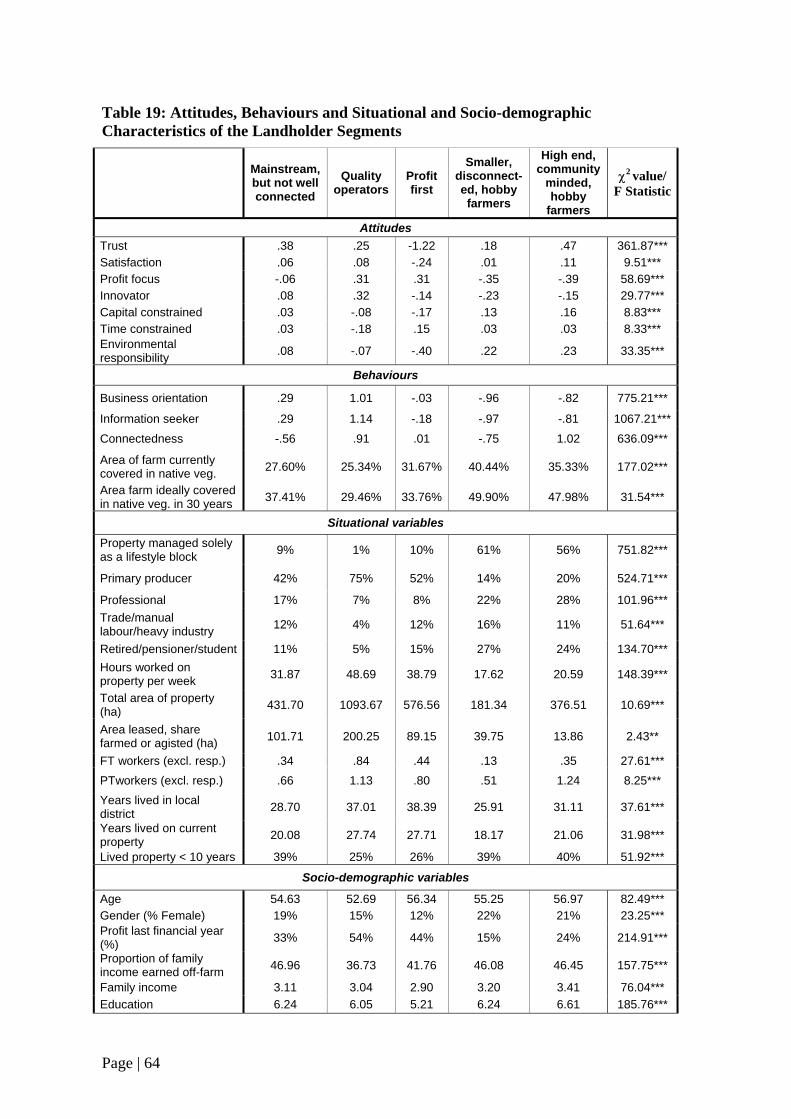
Table 19: Attitudes, Behaviours and Situational and Socio-demographic Characteristics of the Landholder Segments
Mainstream, but not well connected
Quality operators
Profit first
Smaller, disconnect-ed, hobby farmers
High end, community
minded, hobby
farmers
χ2 value/ F Statistic
Attitudes Trust .38 .25 -1.22 .18 .47 361.87*** Satisfaction .06 .08 -.24 .01 .11 9.51*** Profit focus -.06 .31 .31 -.35 -.39 58.69*** Innovator .08 .32 -.14 -.23 -.15 29.77*** Capital constrained .03 -.08 -.17 .13 .16 8.83*** Time constrained .03 -.18 .15 .03 .03 8.33*** Environmental responsibility .08 -.07 -.40 .22 .23 33.35***
Behaviours
Business orientation .29 1.01 -.03 -.96 -.82 775.21***
Information seeker .29 1.14 -.18 -.97 -.81 1067.21***Connectedness -.56 .91 .01 -.75 1.02 636.09***
Area of farm currently covered in native veg. 27.60% 25.34% 31.67% 40.44% 35.33% 177.02***
Area farm ideally covered in native veg. in 30 years 37.41% 29.46% 33.76% 49.90% 47.98% 31.54***
Situational variables Property managed solely as a lifestyle block 9% 1% 10% 61% 56% 751.82***
Primary producer 42% 75% 52% 14% 20% 524.71***
Professional 17% 7% 8% 22% 28% 101.96*** Trade/manual labour/heavy industry 12% 4% 12% 16% 11% 51.64***
Retired/pensioner/student 11% 5% 15% 27% 24% 134.70*** Hours worked on property per week 31.87 48.69 38.79 17.62 20.59 148.39***
Total area of property (ha) 431.70 1093.67 576.56 181.34 376.51 10.69***
Area leased, share farmed or agisted (ha) 101.71 200.25 89.15 39.75 13.86 2.43**
FT workers (excl. resp.) .34 .84 .44 .13 .35 27.61*** PTworkers (excl. resp.) .66 1.13 .80 .51 1.24 8.25*** Years lived in local district 28.70 37.01 38.39 25.91 31.11 37.61***
Years lived on current property 20.08 27.74 27.71 18.17 21.06 31.98***
Lived property < 10 years 39% 25% 26% 39% 40% 51.92***
Socio-demographic variables
Age 54.63 52.69 56.34 55.25 56.97 82.49*** Gender (% Female) 19% 15% 12% 22% 21% 23.25*** Profit last financial year (%) 33% 54% 44% 15% 24% 214.91***
Proportion of family income earned off-farm 46.96 36.73 41.76 46.08 46.45 157.75***
Family income 3.11 3.04 2.90 3.20 3.41 76.04*** Education 6.24 6.05 5.21 6.24 6.61 185.76***
Page | 64
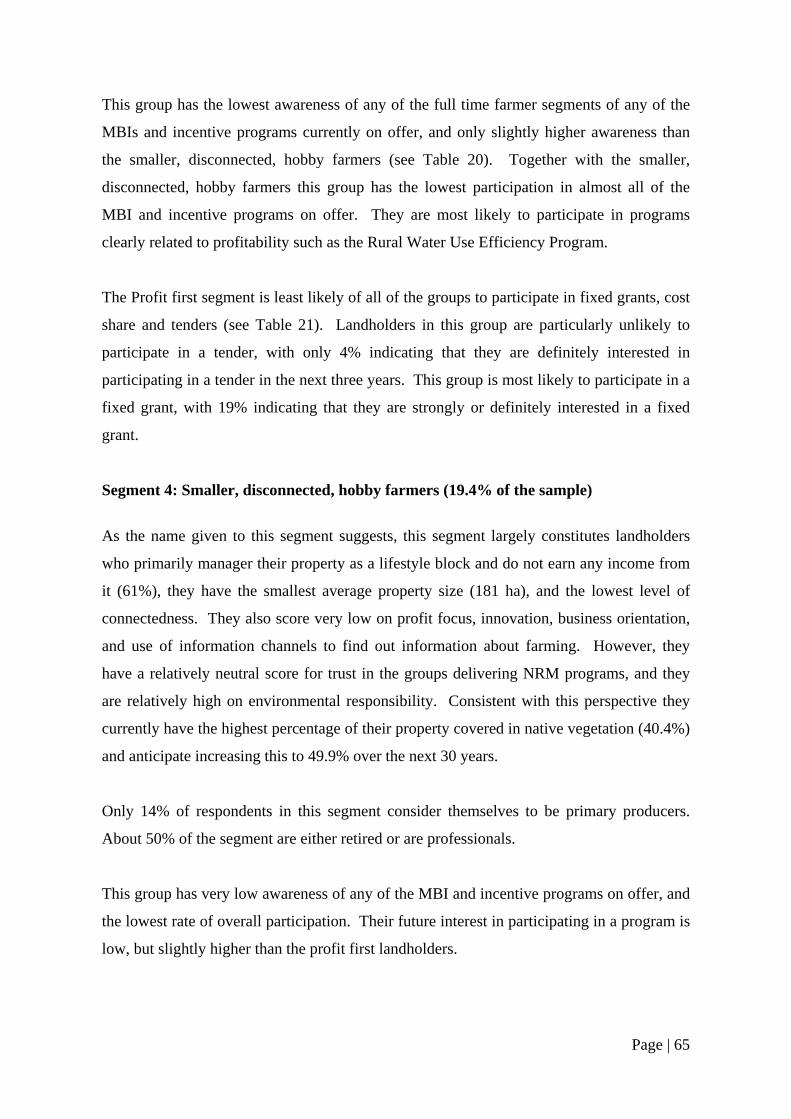
This group has the lowest awareness of any of the full time farmer segments of any of the
MBIs and incentive programs currently on offer, and only slightly higher awareness than
the smaller, disconnected, hobby farmers (see Table 20). Together with the smaller,
disconnected, hobby farmers this group has the lowest participation in almost all of the
MBI and incentive programs on offer. They are most likely to participate in programs
clearly related to profitability such as the Rural Water Use Efficiency Program.
The Profit first segment is least likely of all of the groups to participate in fixed grants, cost
share and tenders (see Table 21). Landholders in this group are particularly unlikely to
participate in a tender, with only 4% indicating that they are definitely interested in
participating in a tender in the next three years. This group is most likely to participate in a
fixed grant, with 19% indicating that they are strongly or definitely interested in a fixed
grant.
Segment 4: Smaller, disconnected, hobby farmers (19.4% of the sample)
As the name given to this segment suggests, this segment largely constitutes landholders
who primarily manager their property as a lifestyle block and do not earn any income from
it (61%), they have the smallest average property size (181 ha), and the lowest level of
connectedness. They also score very low on profit focus, innovation, business orientation,
and use of information channels to find out information about farming. However, they
have a relatively neutral score for trust in the groups delivering NRM programs, and they
are relatively high on environmental responsibility. Consistent with this perspective they
currently have the highest percentage of their property covered in native vegetation (40.4%)
and anticipate increasing this to 49.9% over the next 30 years.
Only 14% of respondents in this segment consider themselves to be primary producers.
About 50% of the segment are either retired or are professionals.
This group has very low awareness of any of the MBI and incentive programs on offer, and
the lowest rate of overall participation. Their future interest in participating in a program is
low, but slightly higher than the profit first landholders.
Page | 65
Table 20: Awareness and Knowledge of MBI and Incentives across Segments
Mainstream, but not well connected
Quality operators
Profit first
Smaller, disconnected,
hobby farmers
High end, community
minded, hobby
farmers
Landcare 1.68 1.44 1.84 1.94 1.73
Envirofund 2.96 2.52 3.15 3.27 3.00
Central West CMA Incentives 2.23 1.50 2.52 3.08 2.52
Watersmart Australia Program 2.94 2.90 3.00 3.18 2.93
Community Water Grants 2.94 2.53 3.06 3.12 2.85
Water Use Efficiency Program 2.93 2.60 2.98 3.06 2.89
Environmental Trust Program 3.03 2.78 3.31 3.14 3.09
Bush Recovery Program 2.92 2.76 3.07 3.03 2.83
Community Water Grants 2.60 2.27 2.97 2.89 2.92
Condamine Alliance Regional Investment Strategy programs
2.44 2.12 2.92 2.88 2.75
Rural Water Use Efficiency Program 2.09 1.51 2.07 2.75 2.36
Land for Wildlife 2.12 2.06 2.33 2.25 1.86 Sustainable Landscape Program 2.30 1.99 2.54 2.69 2.43
Segment 5: High end, community minded hobby farmers (8.9% of the sample)
The final segment is the smallest of the five segments, being only 8.9% of the sample,
however its size differs across the case study areas. In the Mackay-Whitsunday region it is
3.3% of the sample, in Condamine Alliance it is 5.4% and in Mt Lofty it represents 13.1%
of the sample.
Like segment 4, this group largely comprises hobby farmers with 56% of landholders
managing their property solely as a lifestyle block. And also like segment 4, the business
orientation and information seeking behaviour of this group is relatively low. However,
this group consists of wealthier and more community minded landholders. Respondents in
this group have much larger properties (376.5 ha on average) than the other hobby farmer
segment (181.3 ha), and the highest level of family income and education of any segment.
Page | 66
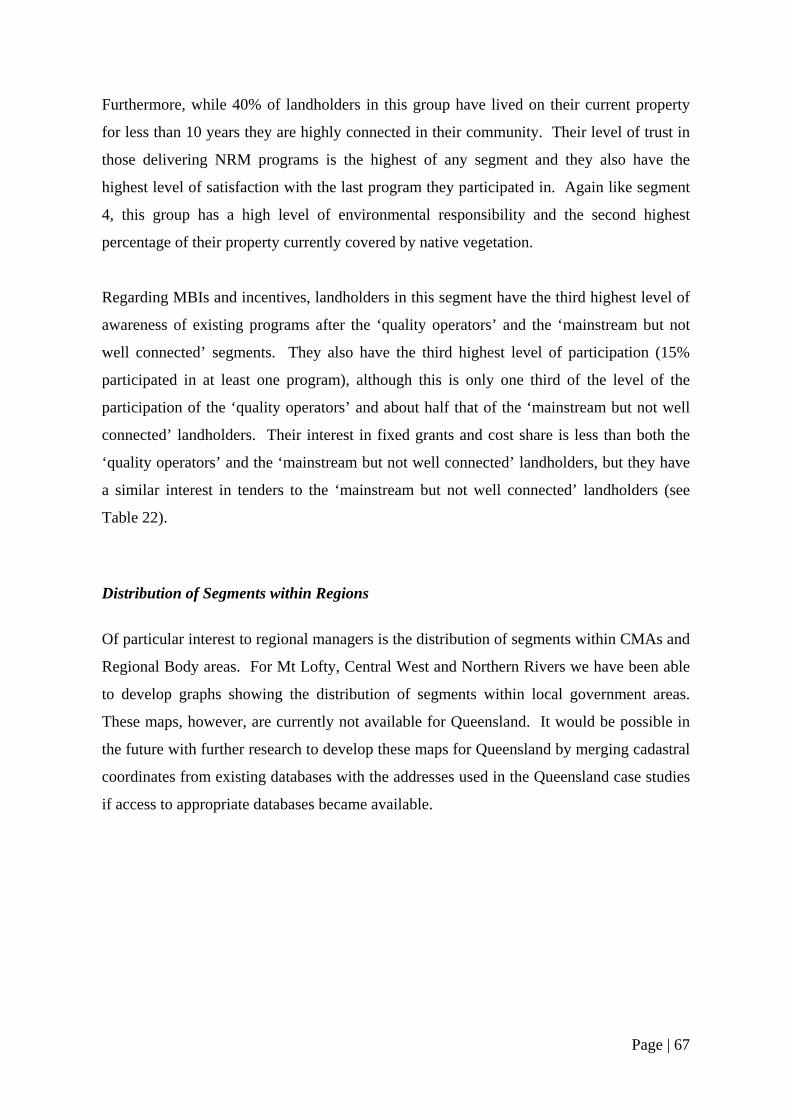
Furthermore, while 40% of landholders in this group have lived on their current property
for less than 10 years they are highly connected in their community. Their level of trust in
those delivering NRM programs is the highest of any segment and they also have the
highest level of satisfaction with the last program they participated in. Again like segment
4, this group has a high level of environmental responsibility and the second highest
percentage of their property currently covered by native vegetation.
Regarding MBIs and incentives, landholders in this segment have the third highest level of
awareness of existing programs after the ‘quality operators’ and the ‘mainstream but not
well connected’ segments. They also have the third highest level of participation (15%
participated in at least one program), although this is only one third of the level of the
participation of the ‘quality operators’ and about half that of the ‘mainstream but not well
connected’ landholders. Their interest in fixed grants and cost share is less than both the
‘quality operators’ and the ‘mainstream but not well connected’ landholders, but they have
a similar interest in tenders to the ‘mainstream but not well connected’ landholders (see
Table 22).
Distribution of Segments within Regions
Of particular interest to regional managers is the distribution of segments within CMAs and
Regional Body areas. For Mt Lofty, Central West and Northern Rivers we have been able
to develop graphs showing the distribution of segments within local government areas.
These maps, however, are currently not available for Queensland. It would be possible in
the future with further research to develop these maps for Queensland by merging cadastral
coordinates from existing databases with the addresses used in the Queensland case studies
if access to appropriate databases became available.
Page | 67
Table 21: Participation in Existing MBIs and Incentives, and Interest in Fixed Grants, Cost Share Programs and Tenders across Segments
Mainstream, but not well connected
Quality operators Profit first
Smaller, disconnected, hobby farmers
High end, community
minded, hobby farmers
Participation in Existing Programs Any program 25% 46% 11% 8% 15%
Landcare 12% 19% 5% 4% 8%
Envirofund 2% 9% 1% 0% 3%
Central West CMA Incentives 20% 43% 6% 3% 4%
Watersmart Australia Program 1% 2% 0% 0% 0%
Community Water Grants 1% 6% 1% 0% 0% Water Use Efficiency Program 1% 7% 0% 0% 0%
Bush Recovery Program 5% 7% 1% 1% 2% Community Water Grants 3% 3% 1% 2% 0% Condamine Alliance Regional Investment Strategy programs
8% 15% 2% 0% 4%
Rural Water Use Efficiency Program 7% 28% 8% 2% 7%
Land for Wildlife 2% 4% 0% 4% 7% Sustainable Landscape Program 17% 23% 1% 5% 0%
Interest in Fixed Grants, Cost Share and Tenders Strongly or definitely interested
Fixed grants 37% 46% 19% 24% 30% Cost share 31% 40% 14% 18% 24% Tenders 16% 20% 8% 10% 16% Definitely interested Fixed grants 23% 25% 11% 14% 16% Cost share 17% 21% 7% 11% 13% Tenders 10% 11% 4% 7% 9%
Page | 68
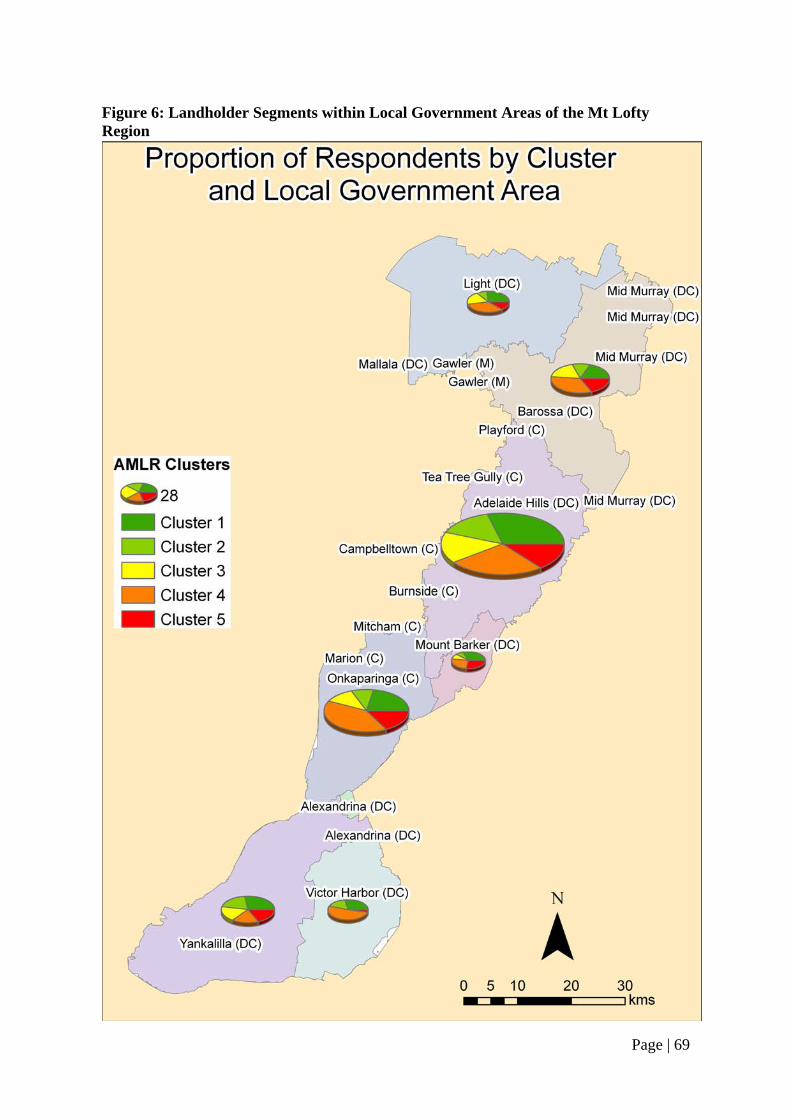
Figure 6: Landholder Segments within Local Government Areas of the Mt Lofty Region
Page | 69
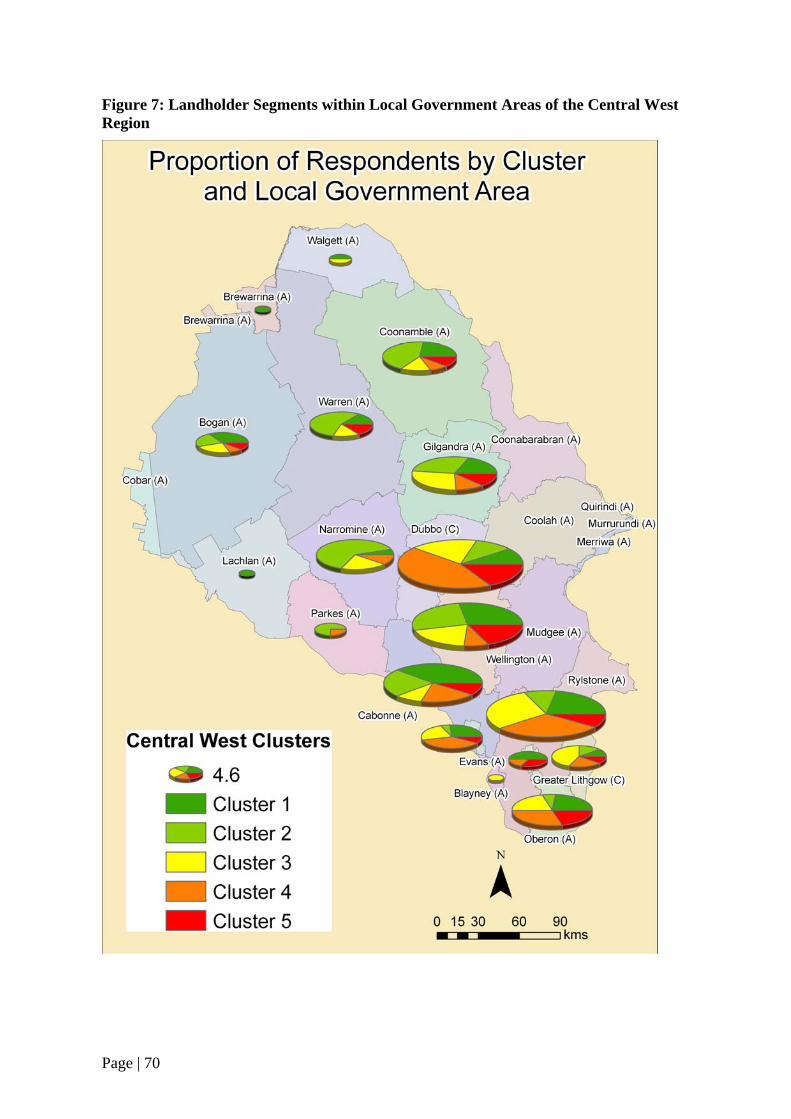
Figure 7: Landholder Segments within Local Government Areas of the Central West Region
Page | 70
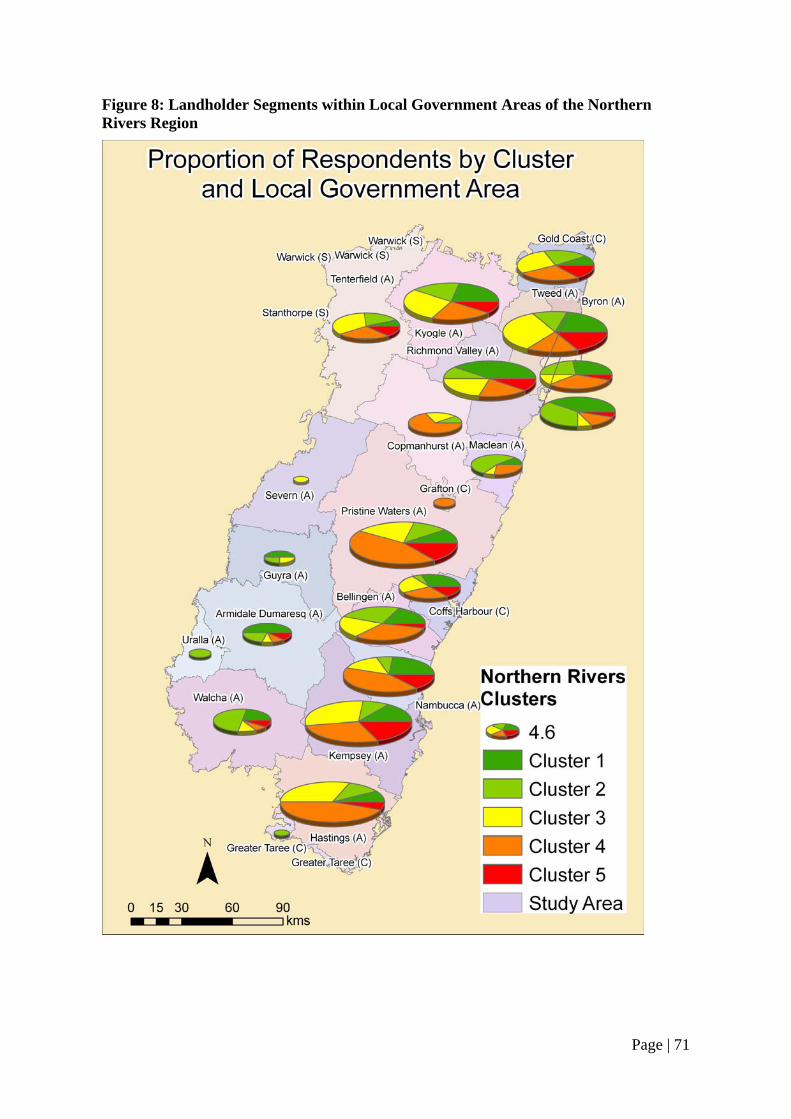
Figure 8: Landholder Segments within Local Government Areas of the Northern Rivers Region
Page | 71
6.5 Effective Methods of Communication
The focus of the third research question is on how to communicate and deliver MBIs and
incentive programs to maximise participation. Therefore in the questionnaire information
was sought regarding which information channels landholders have previously used to
obtain information about farming, and the usefulness of each of these sources. In this
section we report on these findings, and also identify how the usage of these channels
varies across regions and landholder segments.
As shown in Table 22, respondents were presented with a list of 16 information channels
and asked to rate their usefulness. In terms of print media, across the entire sample the
most useful channels were rural press, DPI/DNR brochures and industry newsletters, while
in terms of people ‘other farmers’ particularly and field days stand out as the sources most
used, and most useful. Regarding electronic media, the radio and internet are perceived to
be more useful than television. Lastly, those information channels with the greatest
proportion of participants identifying that they have never used them were Landcare
groups, specialist training programs and extension officers/advisory staff from any source,
and private agronomists or consultants.
Variations in the Usefulness of Information Channels across Regions, Professions and
Age Groups
Several region-specific differences in the methods of communication were identified. In
the Mt Lofty region there was a higher proportion of participants indicating they had never
used a number of information channels than in the other catchment areas, most likely
reflecting the higher proportion of hobby farmers in this catchment. Secondly, a larger
proportion of landholders from the Mackay-Whitsunday region rated industry-based
sources (newsletters, extension officers) as useful or very useful. Further details about
differences in the use of information channels across regions are presented in Appendix 5.
Several other differences in the use of information channels were identified. Chi square
tests indicate that primary producers are more likely to use and find each of the information
channels useful than others. Several aged based differences were also identified. For
instance, older and middle-aged farmers (ie 40-69) tended to find industry newsletters more
Page | 72
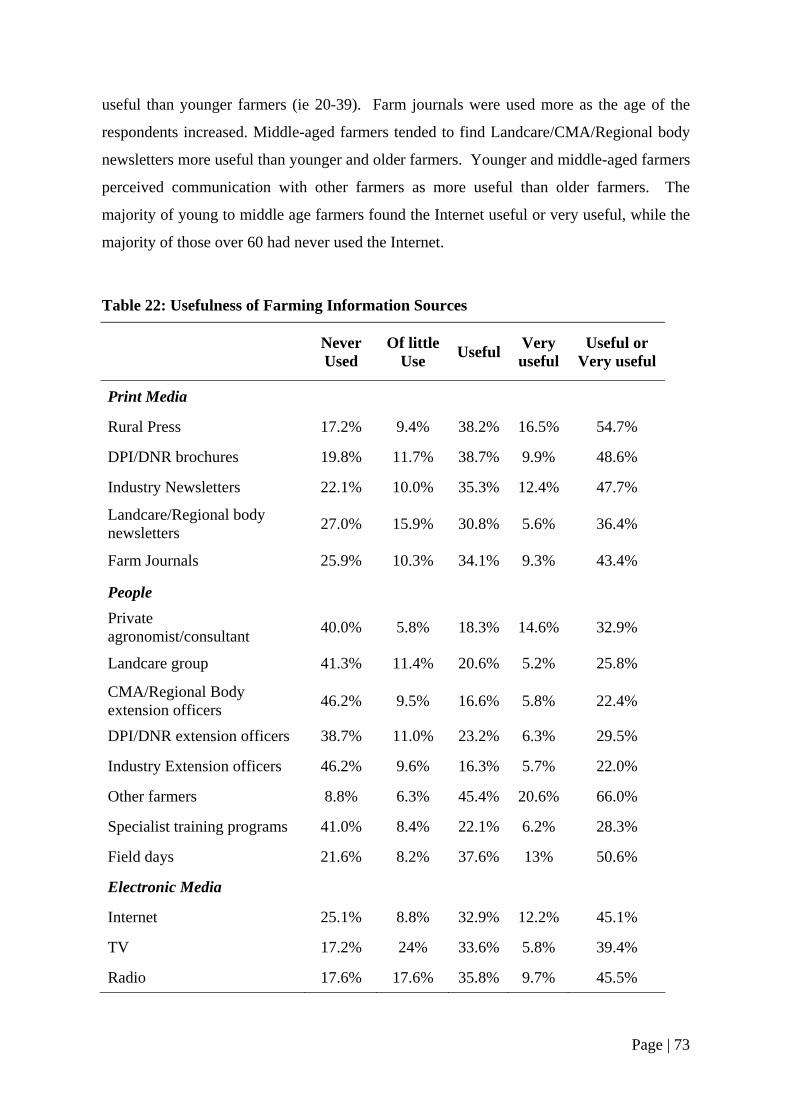
useful than younger farmers (ie 20-39). Farm journals were used more as the age of the
respondents increased. Middle-aged farmers tended to find Landcare/CMA/Regional body
newsletters more useful than younger and older farmers. Younger and middle-aged farmers
perceived communication with other farmers as more useful than older farmers. The
majority of young to middle age farmers found the Internet useful or very useful, while the
majority of those over 60 had never used the Internet.
Table 22: Usefulness of Farming Information Sources
Never Used
Of little Use Useful Very
useful Useful or
Very useful
Print Media
Rural Press 17.2% 9.4% 38.2% 16.5% 54.7%
DPI/DNR brochures 19.8% 11.7% 38.7% 9.9% 48.6%
Industry Newsletters 22.1% 10.0% 35.3% 12.4% 47.7%
Landcare/Regional body newsletters 27.0% 15.9% 30.8% 5.6% 36.4%
Farm Journals 25.9% 10.3% 34.1% 9.3% 43.4%
People Private agronomist/consultant 40.0% 5.8% 18.3% 14.6% 32.9%
Landcare group 41.3% 11.4% 20.6% 5.2% 25.8%
CMA/Regional Body extension officers 46.2% 9.5% 16.6% 5.8% 22.4%
DPI/DNR extension officers 38.7% 11.0% 23.2% 6.3% 29.5%
Industry Extension officers 46.2% 9.6% 16.3% 5.7% 22.0%
Other farmers 8.8% 6.3% 45.4% 20.6% 66.0%
Specialist training programs 41.0% 8.4% 22.1% 6.2% 28.3%
Field days 21.6% 8.2% 37.6% 13% 50.6%
Electronic Media
Internet 25.1% 8.8% 32.9% 12.2% 45.1%
TV 17.2% 24% 33.6% 5.8% 39.4%
Radio 17.6% 17.6% 35.8% 9.7% 45.5%
Page | 73
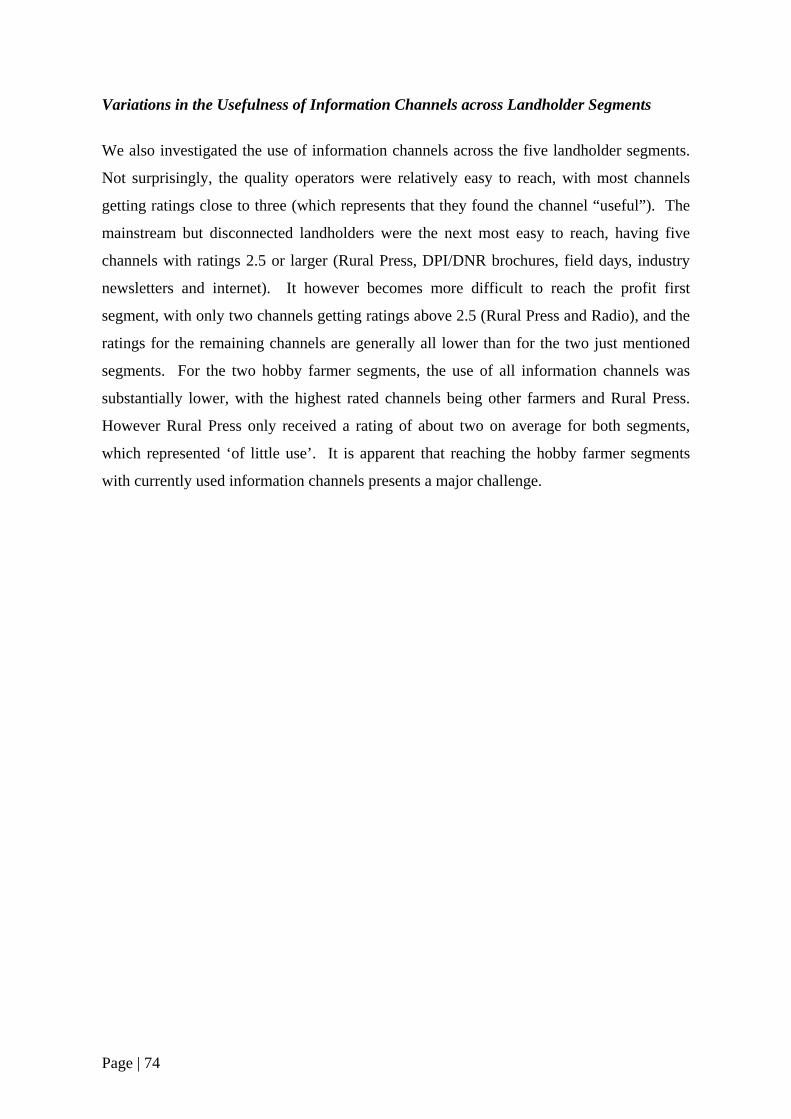
Variations in the Usefulness of Information Channels across Landholder Segments
We also investigated the use of information channels across the five landholder segments.
Not surprisingly, the quality operators were relatively easy to reach, with most channels
getting ratings close to three (which represents that they found the channel “useful”). The
mainstream but disconnected landholders were the next most easy to reach, having five
channels with ratings 2.5 or larger (Rural Press, DPI/DNR brochures, field days, industry
newsletters and internet). It however becomes more difficult to reach the profit first
segment, with only two channels getting ratings above 2.5 (Rural Press and Radio), and the
ratings for the remaining channels are generally all lower than for the two just mentioned
segments. For the two hobby farmer segments, the use of all information channels was
substantially lower, with the highest rated channels being other farmers and Rural Press.
However Rural Press only received a rating of about two on average for both segments,
which represented ‘of little use’. It is apparent that reaching the hobby farmer segments
with currently used information channels presents a major challenge.
Page | 74
Table 23: Usefulness of Information Channels Across Landholder Segments
Mainstream, but not well connected
Quality operators
Profit first
Smaller, disconnected,
hobby farmers
High end, community
minded, hobby
farmers Print Media
Rural press 2.78 2.99 2.68 2.03 2.18
DPI/DNR brochures 2.66 2.94 2.30 1.78 1.90
Industry newsletters 2.54 3.14 2.44 1.48 1.60
CMA/Regional body newsletters 2.32 2.67 1.74 1.71 2.00
Farm journals 2.39 2.93 2.28 1.49 1.55
People
Private agronomist/consultant 2.04 2.96 1.85 1.21 1.26
Landcare group 1.96 2.39 1.47 1.30 1.67
CMA/Regional Body extension officers/advisory staff
1.77 2.42 1.42 1.16 1.29
DPI/DNR officers/advisory staff 1.98 2.60 1.72 1.24 1.42
Industry extension officers/advisory staff 1.64 2.54 1.50 1.11 1.11
Other farmers 2.99 3.27 3.01 2.37 2.65
Specialist training programs 1.87 2.71 1.64 1.14 1.18
Field days 2.64 3.15 2.38 1.56 1.80
Electronic Media
Internet 2.50 2.85 2.23 1.87 1.89
TV 2.36 2.55 2.38 2.01 2.10
Radio 2.45 2.84 2.53 1.87 2.08
Note: 1-never used, 2-of little use, 3-useful, 4-very useful
Page | 75
7. Limitations
In any research project there are limitations associated with methodology. It is important
when interpreting the results to be aware of these limitations.
Of particular concern, and particularly when the goal is segmentation, is the possibility of
sampling error. For this study a response rate of 47.3% was achieved. While this compares
favourably with other social research surveys conducted with landholders, it does not
preclude the possibility of sampling error. It is possible, even likely, that the non-
respondents are not randomly distributed. Previous research of non-respondents suggests
that they tended to have a lower socio-demographic status than respondents. Of the five
landholder segments identified in this research, the profit first group had the lowest socio-
demographic status in terms of education and income. Therefore it would follow if there is
sampling error that non-respondents are more likely to be from this segment than other
segments. Further research could test the veracity of this deduction.
A second limitation relating to sampling is the lack of access to sample frames in the
Queensland case studies. As noted in the methodology section, we had to rely on use of the
phone book and lists supplied by Landcare and local government where available.
Page | 76
8. Conclusions and Recommendations
The overriding goal of this research project has been to understand how to improve the
design and delivery of MBIs and incentive programs to increase the participation of
landholders. Low levels of participation can reduce the ability of programs to achieve their
desired outcomes, as well as reduce their efficiency. To understand how to increase
participation in these programs, answers to three main research questions have been sought,
namely: 1) what are the characteristics of MBIs and incentive programs that encourage
participation, 2) who participates in MBIs and incentive programs and 3) how can MBIs
and incentives be better communicated to increase participation? We now briefly review
the findings for each of these questions from each of the stages of our research before
presenting some recommendations for the delivery of MBIs and incentive programs.
Research Question 1: What are the Characteristics of MBIs and Incentive Programs
that Encourage Landholder Participation?
Not surprisingly, the evidence from both the literature and from our qualitative research
suggests that increasing the net benefits through increasing the amount paid to landholders
and decreasing expected outcomes will lead to increased participation. However this is
arguably not the most desirable way to increase landholder participation, and our findings
indicate that there are number of modifications to program design that can be made that will
achieve the same effect.
Program Delivery
From the literature review and our qualitative research there were common themes about
how this might be done. A number of these themes relate to program delivery. Being
flexible and allowing negotiations relating to environmental outcomes and required
management practices was demonstrated to increase participation. Simplifying the
application process is also important. There is a limit to what landholders are both willing
and able to complete, although landholders are willing to do more paperwork for grants that
involve larger funding and have higher probability of success. Thirdly, landholders value
technical assistance: in identifying potential management actions, writing applications, and
for dealing with others issues through the life of the project. Fourth, clarity and
Page | 77
transparency about key design features such as eligibility, how bids will be assessed,
monitoring, and the availability of ongoing technical advice encourages participation.
Landholders also wanted clarity about how program requirements such as deliverables and
timelines could be changed in adverse circumstances such as poor weather or illness. Fifth,
as noted in the expert interviews, program administrators need to be aware of timing issues,
and ensure that the timing of applications or key deliverables do not clash with key farming
or family commitments.
Program Administrator
As well as how programs are delivered, who delivers the program can have a sizeable
influence on participation. The potential influence of the choice of administrator was first
noted in the literature review. Horne (2006) found that using environmental organisations
as an administrator would lead to lower participation than either a conservation trust or an
industry body. In Australia, the evidence from the expert interviews suggested that many
landholders do not trust government agencies, and that participation is likely to be higher if
the programs are offered by Landcare or through an environment group such as Greening
Australia. These claims were tested in the quantitative survey, and the evidence from
landholders indicated that the greatest support was for delivery via Landcare,
CMAs/Regional Bodies and industry groups. The support for delivery through government
agencies was low, as was support for delivery through environmental groups. Only in
catchments where there are large proportions of hobby farmers does the latter appear to be a
viable alternative. However, from the perspective of suppliers of funds or those who are
accountable for the outcomes of potential programs, the capacity of the organisations to
deliver a program in a desired way will also be an important factor in selecting the program
administrator.
Contracting Arrangements
A variety of contracting arrangements were noted in the literature and our qualitative
research as potentially influencing participation. This included length of contracts,
payment schedules and monitoring requirements. From the literature and expert interviews
it was expected that landholders would prefer shorter contracts and a minimal amount of
monitoring. However, the results from both the focus groups and the quantitative survey
suggested otherwise. These results indicated that respondents prefer mid-length contracts
(3-5 years) with an option to extend the contract, and that they prefer monitoring that
Page | 78
involves site visits to ensure the integrity of the programs and to resolve any problems
before the end of the contract.
Choice of Instrument
Evidence emerged from the expert interviews that different types of farmers are more likely
to prefer different types of instruments, with more business oriented and innovative farmers
more likely to prefer the use of the more sophisticated instruments such as tenders. A
couple of the experts interviewed noted that the adoption of tenders may follow a diffusion
type process, with some farmers becoming more interested after they have observed the
innovators and early adopters. In the focus groups farmers were questioned about the use
of tenders, and many concerns were noted such as the uncertainty involved in applying for
a tender, the difficulty of understanding the process, concern that those successful were
those who knew how to fill out an application well rather than deliver well in terms of
outcomes, and that they create rivalry between landholders. In the quantitative survey
landholders were questioned about their interest in applying to participate in three
programs: fixed grants, variable cost-share and tenders. Landholders had the highest
interest in applying for fixed grants, followed by variable cost-share, with interest in
tenders substantially lower than the other two instruments.
Research Question 2: Who Participates in MBIs and Incentives? Understanding who participates in MBIs and incentives programs is important for
designing communication programs, as well as for designing the best mix of MBIs and
incentives. To answer this question through each of the stages of our research project we
investigated the socio-demographic, attitudinal, behavioural and situational factors
influencing participation, and found the following.
Socio-demographic Variables
In the literature the socio-demographic variables that have received greatest attention in
terms of their effect on participation are age and education. In the literature, age has been
shown in a number of studies to have a negative effect on participation, a finding confirmed
by our qualitative and quantitative research. For education, the literature suggests that
education can have a positive or negative effect, although ongoing education in areas
related to farm management can have a positive effect on participation. The findings from
Page | 79
both the expert interviews and focus groups however suggested that education is positively
related to participation, a finding confirmed in the quantitative analysis.
Attitudinal Variables
The influence of several attitudes on participation has been examined in the literature and
as part of this research project. The evidence from the literature and the expert interviews
was that environmental attitude has an ambiguous effect on participation. We tested this
variable and found that it was not an effective predictor of actual behaviour, but was a good
predictor of behavioural intentions in terms of interest in participating in fixed grants, cost
share and tenders. While there is uncertainty about the usefulness of environmental
responsibility in explaining participation, a positive attitude to the program and trust in
those administering the program were found in the literature and mentioned in the expert
interviews as being very influential in explaining participation. In the quantitative analysis
trust was consistently found to be a primary determinant of participation.
The possibility of several other variables in explaining participation were also noted in the
literature, expert interviews and focus groups, such as being innovative, profit focused, and
satisfaction with past programs. These variables were investigated in the quantitative
analysis however their effect on past participation proved to be either minimal or
ambiguous. However, both being innovative and profit focused were found to be good
predictors of intention to participate in future fixed grants, cost share programs or tenders.
Behavioural Variables
In the literature the main behavioural variable noted to influence participation was
involvement in other or previous programs. The importance of this variable was confirmed
in the expert interviews, however two other behavioural variables – business orientation
and connectedness – were also noted to increase participation. Several experts noted that
those who were more business oriented had more capacity to participate in MBI and
incentive programs, and were more likely to participate in the more sophisticated
instruments. Those who were more connected, such as through their involvement in
various networks, were also more likely to participate, a point supported more recently in
the literature (eg Molinas 1998). In our quantitative analysis we examined the effect of
business orientation, information seeking behaviour and connectedness on participation and
found each of these variables to be closely related to participation.
Page | 80

Situational Variables
Lastly, the influence of various situational variables on participation was investigated. In
general our findings are opposite to what we expected based on the literature and our
qualitative research. In the literature farm size was shown to have an ambiguous effect on
participation, however in our quantitative analysis we found that it is positively related to
participation. One study by Curtis et al (2006) found that hours worked on farm is
negatively related to participation, however we find the opposite. The findings from the
expert interviews indicated that length of time on current property has a negative effect on
participation, however we found for one program it has a negative effect and for another a
positive effect, and for most programs no effect on participation.
Identifying Landholder Segments
One of our objectives in identifying the variables that allow us to identify who is most
likely to participate in MBIs and incentive programs was to determine variables suitable for
creating landholder segments. For this purpose four constructs were identified as
appropriate: trust, business orientation, information seeking behaviour and connectedness.
These are four of the main variables found to distinguish those most likely to participate in
an MBI or incentive program discussed above. Using these variables, five landholder
segments were identified, three of which were mainstream farmer segments and two were
comprised mostly of hobby farmers.
These five segments differed substantially in their socio-demographic and situational
characteristics, as well in their business orientation, information seeking behaviour,
connectedness in their communities and trust of NRM groups. Importantly, the groups also
differed in terms of their awareness and knowledge of existing MBIs and incentives,
current participation in MBIs and incentives, and likely future participation. One of the
five segments stands out in terms of actual and likely future participation. This is the
“quality operator” segment, which is made up of strongly business oriented, information
seeking and well connected landholders who have a relatively high socio-demographic
status. Two other segments also have reasonable levels of participation, though to a lesser
extent than the “quality operators”. These are the “mainstream farmers, but not well
connected” segment, and the “high end, community minded, hobby farmers”. However,
there are two segments, the “profit first” and “smaller, disconnected, hobby farmers”, that
have very low awareness or knowledge of existing programs, have very low participation
Page | 81
and are much less likely to participate in future programs. Both of these segments
generally have a lower socio-demographic status than the other three segments. Also, their
use of the information channels mostly used by NRM groups to communicate information
about MBIs and incentives is very limited, so these two segments are very challenging to
reach with promotional messages. And these two segments cannot be ignored - they are
sizeable segments, together making up from 33.7% to 53.9% of landholders, depending on
the region under investigation. Moreover, the GIS maps indicate that these two segments
dominate certain local government areas within the case study areas.
These findings raise some several important issues relating to both efficiency and equity.
First, the results indicate that those most likely to participate in MBI and incentive
programs are those with the highest socio-demographic status. This raises the possibility of
“crowding out” of private investment in NRM works. In other words, would the funded
activities have occurred even if funding had not been received? There is evidence in the
literature that this occurs to some degree (Crabtree, Chalmers and Eiser 2001), potentially
eroding the efficiency of MBIs in particular. Secondly this raises concern about equity.
Röling (1988, p.66) noted that “extension workers and progressive farmers attract each
other like magnets” and that this created the potential for reinforcing privilege, as
progressive farmers received the benefits of such contact. While there has been much
emphasis in recent years on improving the efficiency with which NRM funds are expended,
less attention has been given to the equity implications of the programs. The results
indicate that instruments such as tenders are likely to have low uptake amongst these more
difficult to reach segments. Reaching these segments will require the use of instruments
such as fixed grants and variable cost-share for which they have greater interest, and
carefully selected information channels with appropriately designed messages. Other
instruments that have not previously been used in Australia such as cross-compliance
requirements may also be effective for reaching these groups.
Research Question 3: How to Communicate MBIs and Incentives to Increase
Participation?
Communicating MBI and incentive programs was recognised both in the literature and the
expert interviews as being important for encouraging participation, and for dealing with
problems such as a lack of trust. However, the amount of careful research on the question
Page | 82
of how to improve the design of communication programs was surprisingly small,
particularly when compared to the amount of effort that has gone into improving the design
features of MBIs and incentives. Much of the research that has gone into communication
programs has been anecdotal and incidental, for example, inclusion of a couple of dummy
variables in a regression to see how hearing about a program influences participation. In
these studies what is being measured is the persuasiveness of individual channels rather
than effectiveness, as overall effectiveness also depends on the reach of particular channels.
There has been limited systematic work regarding the effectiveness of alternative
information channels, the effectiveness of these channels for reaching alternative
landholder segments, and the sorts of messages that are likely to be most effective for
reaching each of these segments. The one exception to this is the study by Breetz et al
(2004) who developed a theoretical model demonstrating how communication strategies
should be developed based on the market context (eg number of landholders, receptivity,
budget, time available etc).
Nonetheless, some insights were gained from our research about the effectiveness of
alternative information channels. From the literature review and qualitative research, direct
contact (word of mouth) was believed to be the most persuasive information channel. The
use of personal contact by extension staff was emphasised as it could be used to clarify the
application process, deal with misinformation, facilitate best practice and build trust.
However, it was recognised that it is challenging to find and keep staff that are sufficiently
skilled and experienced for this purpose. Interestingly, while the findings from the
literature review and qualitative research were in accord about the importance of direct
contact, the evidence from the quantitative survey indicated that only a relatively small
proportion of landholders found visits by extension officers to be useful or very useful.
The effectiveness of networks was also recognised in both the literature and qualitative
research. This can include the use of opinion leaders for promoting programs. The use of
formal and informal networks has the advantage of building on pre-existing trust but is also
potentially limited in terms of reach. The results from the quantitative survey indicated that
industry newsletters were considered valuable by almost half of the landholders surveyed,
and they were relatively effective at reaching the profit first farmers who are generally
difficult to reach.
Page | 83
Other channels considered to be reasonably effective were field days, seminars and
experimental economics workshops. Seminars and workshops have been found to be more
effective empirically than advertising (Lynch and Lovell 2003; Frondel, Lehmann and
Wätzold 2006). Experimental economics workshops have also been recommended as they
can provide for farmers a simulation or trial of what participating in a program involves,
although there is little empirical evidence yet available about the effect of these workshops
on participation. In the focus groups landholders recommended the use of localised
community meetings to provide further information about the program and to answer
specific questions. In the quantitative survey, questions were included about the usefulness
of field days and specialist training programs. The former was rated as useful or very
useful by about half of the respondents, however only 28% of respondents indicated that
they found specialist training programs useful suggesting that the use of seminars and
workshops may also be limited in terms of potential reach.
Perhaps the area of most contention in terms of promotion is the use of advertising.
Empirically, advertising has been demonstrated to be less persuasive than other methods in
increasing participation, however it was recognised that a range of communication tools
(including advertising) are needed to reach a broad range of landholders, particularly if the
extent of networks are limited. In the expert interviews, while some experts thought that
advertising was likely to be of limited effectiveness, particularly if it is the only channel
used, they suggested that fliers and brochures as well as local radio and newspapers could
be effective, particularly if they promoted stories of past successes. The experts generally
frowned upon the use of television for promotion. In a similar vein, focus group
participants recommended fliers, local radio and local newspapers, particularly where the
program is described in an editorial or news article. In preparing such articles they
emphasised the need to connect with the target audience by using understandable and
straightforward language, with an article of appropriate length. Focus group participants
also recommended the use of shop noticeboards. In terms of quantitative evidence, radio
and newspapers were rated quite highly in terms of usefulness as information sources about
farming, and higher than television. Nonetheless overall the evidence appears to suggest
that advertising is most effective when tailored to the local area, involves case studies that
landholders can relate to, and uses language that landholders can understand.
Page | 84
A further information channel that rated highly with landholders in the quantitative survey
was the internet. This appears to have good potential as an information source, though in
the expert interviews it was considered to be more of a “back-up” information source. One
important insight from the focus groups was that landholders often find it difficult to source
information on the various funding programs that are available. Participants emphasised
the need for a centralised website where landholders can source information on available
programs. In some regions such sources of information already exist, but may be better
promoted in order to engage landholders.
Lastly, the qualitative research provided some insight into how to deliver promotional
messages rather than which channels to use. In both the expert interviews and the focus
groups the point was made that the “right message” needs to be sent to landholders, one
that will capture their interest. The benefits available to the landholder, their property and
their business need to be stated. It needs to be clear to landholders how the program will
improve their farm management. In doing so expectations also need to be managed – both
experts and focus group participants indicated that the probability of success in receiving a
grant should be stated and not oversold. Both experts and focus group participants also
noted the importance of using the right language and avoiding jargon when developing
promotional messages.
Recommendations
Following is a list of recommendations arising from this research. In providing these
recommendations it is acknowledged that the objectives of particular MBI and incentive
programs differ, and that these objectives need to be considered when interpreting these
recommendations.
1. Mixing of instruments
Given that certain segments are relatively unlikely to adopt specific instruments (eg
tenders) consider having a mix of instruments available. This may include fixed grants for
relatively low cost projects and tenders for higher cost projects. In choosing the appropriate
mix of instruments, factors that influence the suitability of specific instruments for use in an
Page | 85
area, such as the availability of necessary scientific information and sufficient variation in
the costs and impacts of abatement options, would also need to be considered.
2. Design programs for specific segments
Establish programs aimed at specific segments to improve equity in the distribution of
funds or to engage known target groups. For example, this may include programs for
properties of specific size eg focused on hobby farms or mid-sized properties.
3. Develop new instruments that may be effective at reaching segments with low
participation
In the USA cross-compliance instruments (eg Sodbusters) have been effective at reaching
groups that have otherwise been unwilling to participate in NRM programs. These
programs may be effective in Australia as a means of promoting behavioural change among
particular segments, for example in encouraging the profit first farmers to participate in
NRM programs.
4. Evaluate the efficiency of variable cost-share
Much academic research has sought to evaluate the efficiency of tenders. The empirical
evidence indicates that strategising and crowding out reduces the efficiency of tenders over
time. However, variable cost-share programs have received less attention, though they
have efficiency properties that are likely to lead to better outcomes than fixed grants and the
the evidence from this study is that they are preferred to tenders.
5. Preferred program characteristics
Insight was provided into the landholders’ preferred options for a number of design features
of MBIs and incentives, which can be adopted to increase participation. These preferred
features are as follows:
Page | 86
• Use Landcare, local CMAs/regional bodies or industry groups to deliver the
programs
• Provide technical assistance particularly for identifying potential management
actions and ongoing technical assistance. Provide help writing applications if
possible.
• Indicate the probability of success with past grants
• For payments, landholders prefer to receive a larger upfront payment with the
residual paid in equal yearly payments or payment after each stage has been
completed rather than equal yearly payments
• For ongoing projects, contracts of 3-5 years with an optional extension are preferred
to projects of fewer years in length
• For monitoring, include site visits half way and at the end of the project rather than
just at the end of the project, or sending in photos at key stages.
6. Communication strategy – what channels to use
There are a number of channels that can be used for promotional purposes. This includes
the use of direct contact, networks, workshops and seminars, newsletters, and advertising.
The choice of which mix of instruments is most appropriate to use depends on the context,
including the budget and time available, the number of landholders in the area of concern,
and their receptivity to the program. In general, direct contact is recognised to be
particularly persuasive method for encouraging participation in MBIs and incentive
programs, and should be continued. However, it is also a costly alternative and can have
limited reach, so it may not always be the most cost-effective approach. Using networks
and opinion leaders is likely to be effective where there are problems with trust. Networks
can also be a lower cost method of promotion. Experimental economics workshops,
seminars and other community meetings are likely to be useful where the program is
relatively complicated and landholders will require the program to be carefully explained.
Advertising is also likely to be useful, particularly for increasing the reach of the
communication program, however it needs to be localised and the message carefully
developed so it includes a message that is both understandable and of interest to
landholders eg through the use of case studies. Further research however is needed to
Page | 87
understand the cost-effectiveness of the alternative channels, taking into account both the
persuasiveness and reach of each of the channels.
7. Communication strategy – be aware of what channels the difficult to reach
segments use
The quality operators and to a lesser extent the mainstream but disconnected landholders
make use of most information channels and are therefore relatively easy to reach. If the
goal is to reach the other segments, such as profit first and the two hobby farmer segments,
then channels may need to be carefully chosen. This could include the use of Rural Press,
Radio, industry newsletters, DPI/DNR brochures, TV and radio as well as direct contact.
8. Communication strategy – what message to use
In developing promotional materials, these should be developed with the values and
interests of landholders in mind. Thus they should emphasise wherever possible the
benefits to landholders from participation in terms of improved farm management.
This, however, is an area in need of further research, in particular to identify the messages
likely to be most effective in reaching each of the five segments.
9. The importance of social capital
Trust and connectedness were two of the most important predictors of participation. This
suggests that further work needs to be undertaken to understand how both trust and
connectedness can be developed between landholders and between landholders and those
delivering NRM programs.
Page | 88
References
Black, A. and Reeve, I. 1993: Participation in Landcare Groups: The relative importance of
attitudinal and situational factors, Journal of Environmental Management, 39, 51-71.
Breetz, H.L., Fisher-Vanden, K., Jacobs, H. and Schary, C. 2005: Trust and
communication: Mechanisms for increasing farmers’ participation in Water Quality
Trading, Land Economics, 81 (2), 170-190.
Brotherton, I. 1991: What limits participation in ESAs? Journal of Environmental
Management, 32, 241-49.
Byron, I. Curtis, A. and Mackay, J. 2005: Draft: Providing social and economic data to
support regional natural resource management in the Burnett Mary, Bureau of Rural
Sciences, Canberra.
Cary, J., Webb, T. and Barr, N. 2002: Understanding Landholders’ Capacity to Change to
Sustainable Practices. Insights about Practice Adoption and Social Capacity for Change,
Canberra: Bureau of Rural Sciences.
Clayton, H. 2005: Market incentives for biodiversity conservation in a saline-affected
landscape: farmer response and feedback. Contributed paper at the Salinity pre-conference
workshop, 8th February, of the 49th Annual Conference of the Australian Agricultural and
Resources Economics Society, Coffs Harbour, 9th-11th February 2005.
Cook, T., and Gronke, P. 2002: Trust, distrust, confidence, lack of confidence: New
evidence of public opinion towards government and institutions from 2002. Paper
delivered at the annual meeting of the Southern Political Science Association, Savannah,
Georgia, November 2002.
Cook, T., and Gronke, P. 2005: The sceptical American: Revisiting the meanings of trust in
government and confidence in institutions. The Journal of Politics, 67(3), 784-803.
Page | 89
Crabtree, B., Chalmers, N. and Eiser, D. 2001: Voluntary incentive schemes for farm
forestry: Uptake, policy effectiveness and employment impacts, Forestry, 74 (5), 455-65
Curtis, A., Allan, C., Howard, J., McDonald, S. and Roberton, S. 2006: Evaluation of North
East Catchment Management Authority’s River Tender Pilot, Report number two prepared
by the Institute of Land, Water and Society, Charles Sturt University.
Curtis, A., MacKay, J., van Nouhuys, M., Lockwood, M., Byron, I. and Graham, M. 2000:
Exploring land manager willingness and capacity to manage dryland salinity: the
Goulburn Broken Catchment, Charles Sturt University, Albury.
Curtis, A. and Robertson, A. 2003: Understanding landholder management of river
frontages: the Goulburn Broken, Ecological Management and Restoration, 4(1), 45-54.
Darbyshire, C. 1999: A market profile of land managers in the Corangamite Catchment,
Report prepared by Interact Market Research for the Department of Natural Resources and
environment, Geelong.
Ducos, G. and Dupraz, P. 2006: Private provision of environmental services and transaction
costs: Agro-environmental contracts in France, Proceedings of the Environmental and
Resource Economists 3rd World Congress, 3rd-7th July, 2006, Kyoto, Japan.
Finlay, R. A. 2004: Understanding Land Managers Attitudes Using Focus Groups,
Proceedings of Refereed Papers, AFBM Network Conference 2004.
Frondel, M., Lehmann, P. and Wätzold, F. 2006: Landowners’ participation in voluntary
conservation programs: the impact of information, Proceedings of the Environmental and
Resource Economists 3rd World Congress, 3rd-7th July, 2006, Kyoto, Japan.
Greiner, R., Stoeckl, N., Stokes, C., Herr, A. and Bachmaier, J. 2003: Natural resource
management in the Burdekin Dry Tropics: social and economic issues, a report for the
Burdekin Dry Tropics NRM Board, CSIRO, Townsville.
Page | 90
Guerin, L. and Guerin, T. 1994: Constraints to the adoption of innovations in agricultural
research and environmental management, Australian Journal of Experimental Agriculture,
34, 549-571.
Ha, A., O’Neill, T., Strappzzan L. and Stoneham, G. 2003: Bush Tender Participation in
First Bidding Round: What are the characteristics of rural land managers who
participated? Paper presented at the 47th Annual Conference of the Australian Agricultural
and Resources Economics Society, Freemantle, 12th-14th February 2003.
Hair, J., Black, B., Babin, B., Anderson, R. and Tatham, R. 2006: Multivariate Data Analysis (6th
edition). Upper Saddle River, NJ: Prentice-Hall.
Horne, P. 2006: Use of choice experiments in the design of biodiversity conservation
policy, Proceedings of the Environmental and Resource Economists 3rd World Congress,
3rd-7th July, 2006, Kyoto, Japan.
Lockie, S and Rockloff, S. 2004: Landowner Attitudes to Wetlands and Wetland
Conservation Programs and Incentives, Cooperative Research Centre for Costal Zone,
Estuary and Waterway Management.
Louviere, J, Hensher, D & Swait, J 2000: Stated Choice Methods: Analysis and
Applications. Cambridge University Press, Cambridge, UK.
Lynch L. and Lovell, S.J. 2003: Combining spatial and survey data to explain participation
in Agricultural Land Preservation Programs, Land Economics, 79 (2), 259-276.
Molinas. J: 1998 The impact of inequality, gender, external assistance and social capital on
local-level cooperation. World Development 26(3), 413-431
Rogers, Everett M. 2003: Diffusion of Innovations, 5th ed, Free Press, New York.
Rolfe, J., McCosker, J. and Windle, J. 2005: Establishing East-West Landscape Linkage in
the Southern Desert Uplands - Research Reports, Final Report for MBI Project 18,
Research Report No. 6.
Page | 91
Rolfe, J., Windle, J., Reeson, A. and Whitten, S. 2006: Assessing the Incentives Needed to
Improve Riparian Management in Grazing Systems: Comparing Experimental Auctions
and Choice Modelling Approaches, Paper Presented at the 50th Annual Conference of the
Australian Agricultural and Resource Economics, Sydney 7th-10th of February, 2006.
Röling, N. 1988. Extension Science: Information Systems in Agricultural Development.
Cambridge University Press, Cambridge.
Rossiter, J.R., and Bellman, S. 2005: Marketing Communications: Theory and
Applications. Pearson Prentice Hall, Frenchs Forest.
Thomson, D. 2001: Different Pebbles, Same Pond: Farming Styles in Loddon Catchment of
Victoria, Proceedings Australasian Pacific Extension Network International Conference,
Toowoomba, 3rd-5th October 2001.
Vanclay, F. 1992: The social context of farmers’ adoption of environmentally sound
farming practices, in Lawrence, G., Vanclay, F. and Furze, B. (eds) Agriculture,
environment and society: contemporary issues for Australia, Macmillan, Melbourne.
Vanclay, F. and Lawrence, G. 1994: Farmer rationality and the adoption of environmentally
sound practices; a critique of the assumptions of traditional agricultural extension. Journal
of Agricultural Education and Extension, 1 (1), 59-90.
Vanslembrouck, I., Van Huylenbroeck, G., and Verbeke, W. 2002: Determinants of the
willingness of Belgian farmers to participate in agri-environmental measures. Journal of
Agricultural Economics, 53 (3), 489-511.
Watson, P. and Pryor, R. 2002: Grazing for biodiversity and profit: farmer segmentation
study and evaluation of research and extension worker attitudes. Report for Grazing for
Biodiversity and Profit project, Ecologically Sustainable Agriculture Initiative (ESAI
05115). Department of Natural Resources and Environment: East Melbourne.
Page | 92
Windle, J., Rolfe, J., Whitten, S., Alam, K. and Street, D. 2005: Using Choice Modelling to
Establish the Supply of Riparian Services and the Potential for Water Quality Trading
Scheme in Central Queensland. Paper presented at the 49th Annual Conference of the
Australian Agricultural and Resources Economics Society, Coffs Harbour, 9th-11th February
2005.
Wossink, G.A.A. & van Wenum, J.H. 2003: Biodiversity conservation by farmers: Analysis
of actual and contingent participation. European Review of Agricultural Economics, 30(4),
461-485.
Wynn, G., Crabtree, B. and Potts, J. 2001: Modelling farmer entry into the Environmentally
Sensitive Areas Schemes in Scotland. Journal of Agricultural Economics, 52(1), 65-82.
Page | 93
Appendix 1: Interviewer’s Outline for Expert Interviews Introduction
We’re contacting you because we’ve been told that you’re interested in MBI and that you
have had experience in them.
We are conducting a survey of experts as part of a project funded by Land and Water
Australia titled “Understanding landholder constraints to the uptake of market-based
instruments”. As somebody who is experienced with market based instruments (MBIs), we
would like to ask you a few questions about your experience with how to encourage
increased participation in MBIs.
Participation is voluntary, and the survey will take about 20 minutes to complete. The
project has approval from CSU’s ethics in human research committee.
Would you be willing to participate in this survey? Is now suitable for the interview, or
could I call you back at a more suitable time?
Types of MBIs
1. What MBIs or incentives have you previously been involved with either
implementing or testing through experiments or surveys. (By MBIs we mean
incentive programs such as tenders, stewardship payments or devolved grants, or
subsidy schemes such as Landcare.)
Characteristics of MBIs
2. What do you consider to be the most important design features of a MBI or
incentive program (note: if needed give examples - duration of contract,
constraints, who runs the MBI, type of incentive, application process etc)?
3. What do you consider to be the main features of a MBI that influence participation?
Page | 94
4. Are you aware of any literature that has investigated how the design of an MBI
influences participation?
Who participates in MBIs
5. In the MBIs that you have implemented or investigated, did you examine or notice
whether certain types of farmers were more likely to participate? If yes, could you
please describe their characteristics?
6. Do you think that different types of farmers are more likely to participate in
different MBIs? Why?
7. Are you aware of any literature that has investigated the types of farmers that
participate in MBIs?
Implementing and promoting MBIs
8. Could you please describe the implementation and promotion process for the MBIs
that you were involved in implementing? By implementation process we mean the
method you used to let farmers know about the MBI, and encourage involvement in
the MBI)
(If have not previously implemented as indicated from Q1, go to Q12)
9. What parts of this process do you consider to have been most effective in
encouraging farmer participation?
10. What would you do differently next time to encourage farmer participation?
11. From your knowledge of MBIs, what implementation and promotion strategies
would you follow to encourage maximum participation in an MBI?
12. Are you aware of any literature that has examined how to implement and promote
MBIs in order to encourage maximum participation?
Page | 95
Monitoring and evaluating MBI/incentive programs
13. In the MBIs that you have implemented or investigated, was there a monitoring and
evaluation component that assessed such aspects as the effectiveness of the
program, the transaction costs, participation rates, reasons for becoming or not
becoming involved, whether the on-ground actions or biophysical outcomes were
achieved etc?
14. If so, could you provide details including what aspects were monitored and what
were the key findings? Are these summarised in an available report?
15. Are you aware of any attempts to collect information on the effectiveness of an MBI
program?
Page | 96
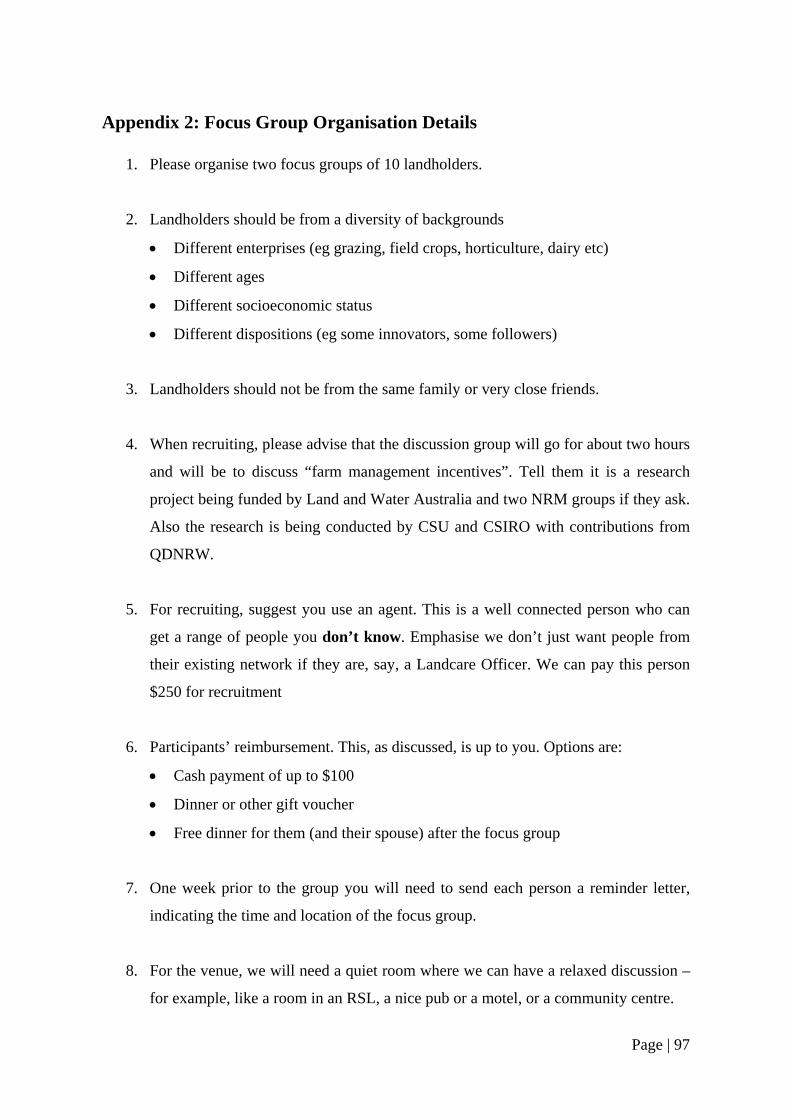
Appendix 2: Focus Group Organisation Details
1. Please organise two focus groups of 10 landholders.
2. Landholders should be from a diversity of backgrounds
• Different enterprises (eg grazing, field crops, horticulture, dairy etc)
• Different ages
• Different socioeconomic status
• Different dispositions (eg some innovators, some followers)
3. Landholders should not be from the same family or very close friends.
4. When recruiting, please advise that the discussion group will go for about two hours
and will be to discuss “farm management incentives”. Tell them it is a research
project being funded by Land and Water Australia and two NRM groups if they ask.
Also the research is being conducted by CSU and CSIRO with contributions from
QDNRW.
5. For recruiting, suggest you use an agent. This is a well connected person who can
get a range of people you don’t know. Emphasise we don’t just want people from
their existing network if they are, say, a Landcare Officer. We can pay this person
$250 for recruitment
6. Participants’ reimbursement. This, as discussed, is up to you. Options are:
• Cash payment of up to $100
• Dinner or other gift voucher
• Free dinner for them (and their spouse) after the focus group
7. One week prior to the group you will need to send each person a reminder letter,
indicating the time and location of the focus group.
8. For the venue, we will need a quiet room where we can have a relaxed discussion –
for example, like a room in an RSL, a nice pub or a motel, or a community centre.
Page | 97

We need a table and 11 chairs around it, plus a couple of extra in the corner for
observers.
We will need drinks – water, soft drinks, tea, coffee.
Also, we will need some food – eg, finger food, lollies, biscuits, cakes (ample, but
not over the top).
Each person will need a pen and pad, as well as a name tag – the labels that can be
stuck on a shirt are fine.
On the day, we will need a typed list of those attending if we are paying money, so
they can sign off that they have received the money.
Page | 98
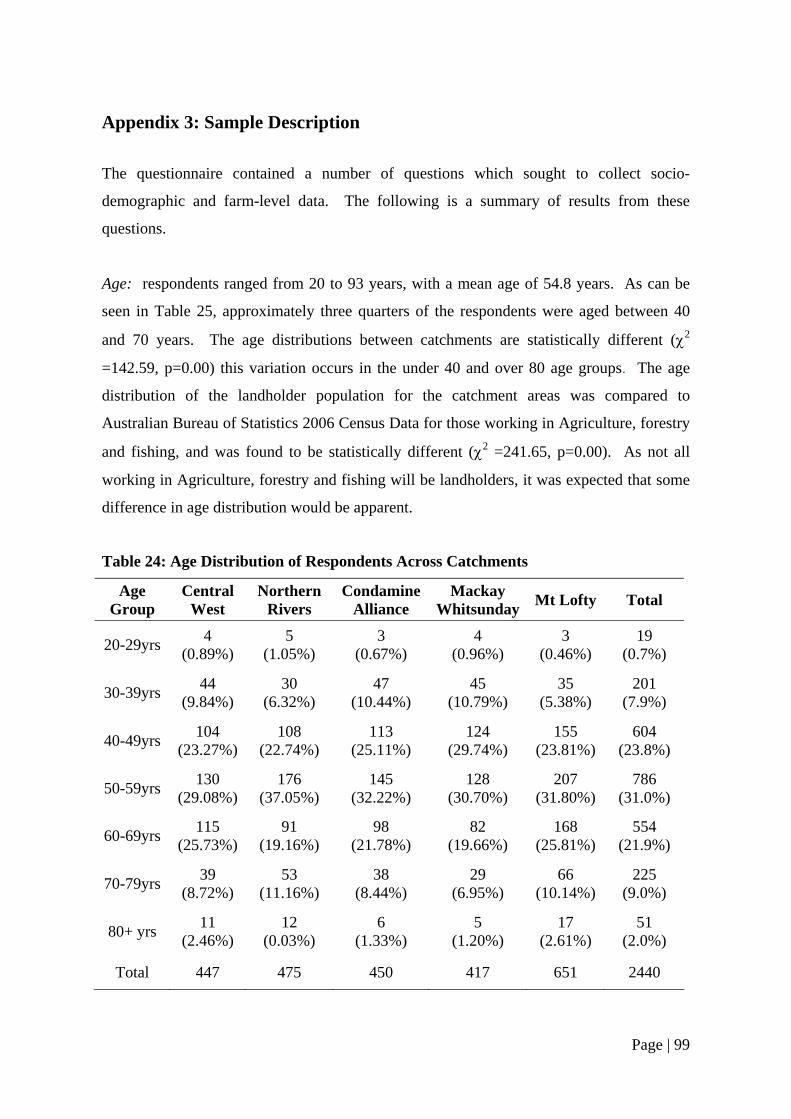
Appendix 3: Sample Description
The questionnaire contained a number of questions which sought to collect socio-
demographic and farm-level data. The following is a summary of results from these
questions.
Age: respondents ranged from 20 to 93 years, with a mean age of 54.8 years. As can be
seen in Table 25, approximately three quarters of the respondents were aged between 40
and 70 years. The age distributions between catchments are statistically different (χ2
=142.59, p=0.00) this variation occurs in the under 40 and over 80 age groups. The age
distribution of the landholder population for the catchment areas was compared to
Australian Bureau of Statistics 2006 Census Data for those working in Agriculture, forestry
and fishing, and was found to be statistically different (χ2 =241.65, p=0.00). As not all
working in Agriculture, forestry and fishing will be landholders, it was expected that some
difference in age distribution would be apparent.
Table 24: Age Distribution of Respondents Across Catchments
Age Group
Central West
Northern Rivers
Condamine Alliance
Mackay Whitsunday Mt Lofty Total
20-29yrs 4 (0.89%)
5 (1.05%)
3 (0.67%)
4 (0.96%)
3 (0.46%)
19 (0.7%)
30-39yrs 44 (9.84%)
30 (6.32%)
47 (10.44%)
45 (10.79%)
35 (5.38%)
201 (7.9%)
40-49yrs 104 (23.27%)
108 (22.74%)
113 (25.11%)
124 (29.74%)
155 (23.81%)
604 (23.8%)
50-59yrs 130 (29.08%)
176 (37.05%)
145 (32.22%)
128 (30.70%)
207 (31.80%)
786 (31.0%)
60-69yrs 115 (25.73%)
91 (19.16%)
98 (21.78%)
82 (19.66%)
168 (25.81%)
554 (21.9%)
70-79yrs 39 (8.72%)
53 (11.16%)
38 (8.44%)
29 (6.95%)
66 (10.14%)
225 (9.0%)
80+ yrs 11 (2.46%)
12 (0.03%)
6 (1.33%)
5 (1.20%)
17 (2.61%)
51 (2.0%)
Total 447 475 450 417 651 2440
Page | 99
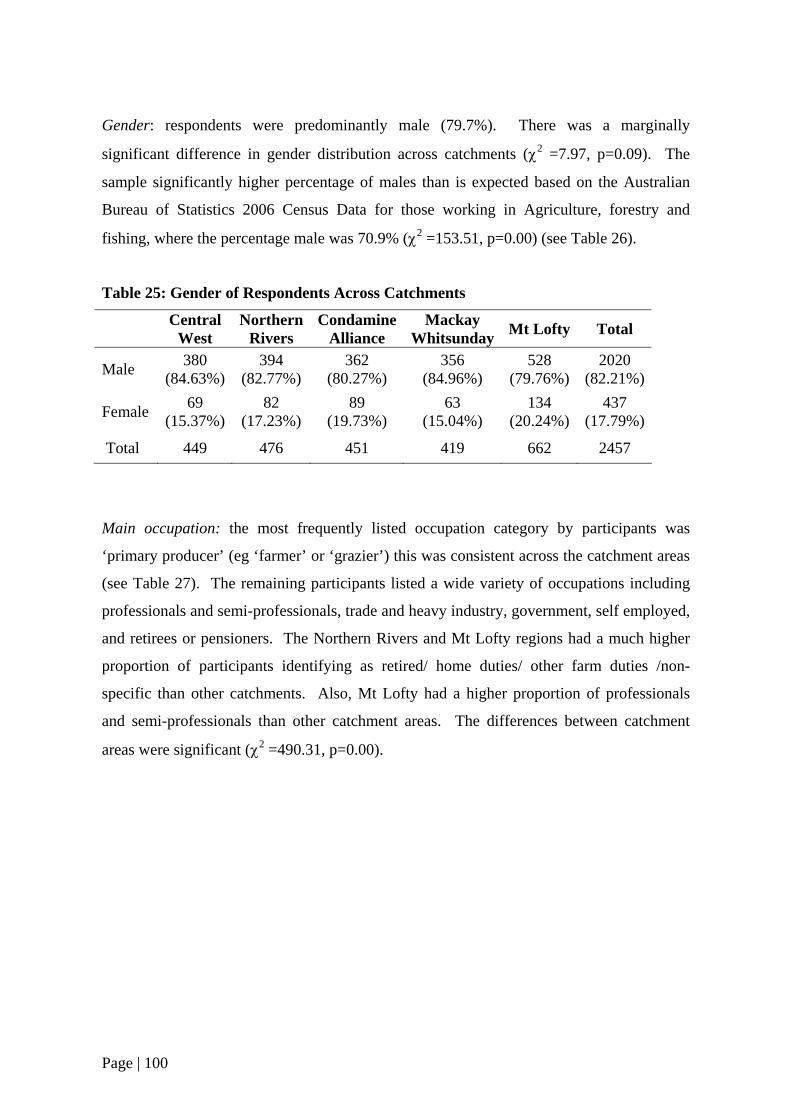
Gender: respondents were predominantly male (79.7%). There was a marginally
significant difference in gender distribution across catchments (χ2 =7.97, p=0.09). The
sample significantly higher percentage of males than is expected based on the Australian
Bureau of Statistics 2006 Census Data for those working in Agriculture, forestry and
fishing, where the percentage male was 70.9% (χ2 =153.51, p=0.00) (see Table 26).
Table 25: Gender of Respondents Across Catchments
Central
West Northern
Rivers Condamine
Alliance Mackay
Whitsunday Mt Lofty Total
Male 380 (84.63%)
394 (82.77%)
362 (80.27%)
356 (84.96%)
528 (79.76%)
2020 (82.21%)
Female 69 (15.37%)
82 (17.23%)
89 (19.73%)
63 (15.04%)
134 (20.24%)
437 (17.79%)
Total 449 476 451 419 662 2457
Main occupation: the most frequently listed occupation category by participants was
‘primary producer’ (eg ‘farmer’ or ‘grazier’) this was consistent across the catchment areas
(see Table 27). The remaining participants listed a wide variety of occupations including
professionals and semi-professionals, trade and heavy industry, government, self employed,
and retirees or pensioners. The Northern Rivers and Mt Lofty regions had a much higher
proportion of participants identifying as retired/ home duties/ other farm duties /non-
specific than other catchments. Also, Mt Lofty had a higher proportion of professionals
and semi-professionals than other catchment areas. The differences between catchment
areas were significant (χ2 =490.31, p=0.00).
Page | 100
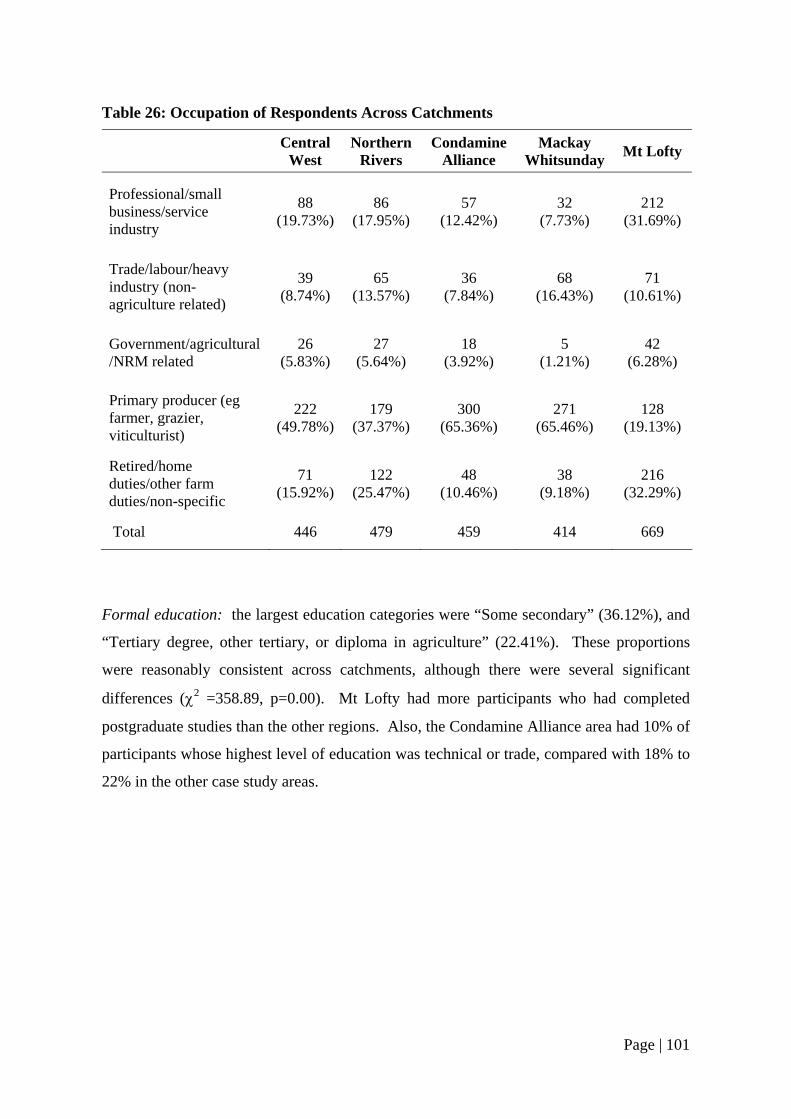
Table 26: Occupation of Respondents Across Catchments
Central West
Northern Rivers
Condamine Alliance
Mackay Whitsunday Mt Lofty
Professional/small business/service industry
88 (19.73%)
86 (17.95%)
57 (12.42%)
32 (7.73%)
212 (31.69%)
Trade/labour/heavy industry (non-agriculture related)
39 (8.74%)
65 (13.57%)
36 (7.84%)
68 (16.43%)
71 (10.61%)
Government/agricultural/NRM related
26 (5.83%)
27 (5.64%)
18 (3.92%)
5 (1.21%)
42 (6.28%)
Primary producer (eg farmer, grazier, viticulturist)
222 (49.78%)
179 (37.37%)
300 (65.36%)
271 (65.46%)
128 (19.13%)
Retired/home duties/other farm duties/non-specific
71 (15.92%)
122 (25.47%)
48 (10.46%)
38 (9.18%)
216 (32.29%)
Total 446 479 459 414 669
Formal education: the largest education categories were “Some secondary” (36.12%), and
“Tertiary degree, other tertiary, or diploma in agriculture” (22.41%). These proportions
were reasonably consistent across catchments, although there were several significant
differences (χ2 =358.89, p=0.00). Mt Lofty had more participants who had completed
postgraduate studies than the other regions. Also, the Condamine Alliance area had 10% of
participants whose highest level of education was technical or trade, compared with 18% to
22% in the other case study areas.
Page | 101
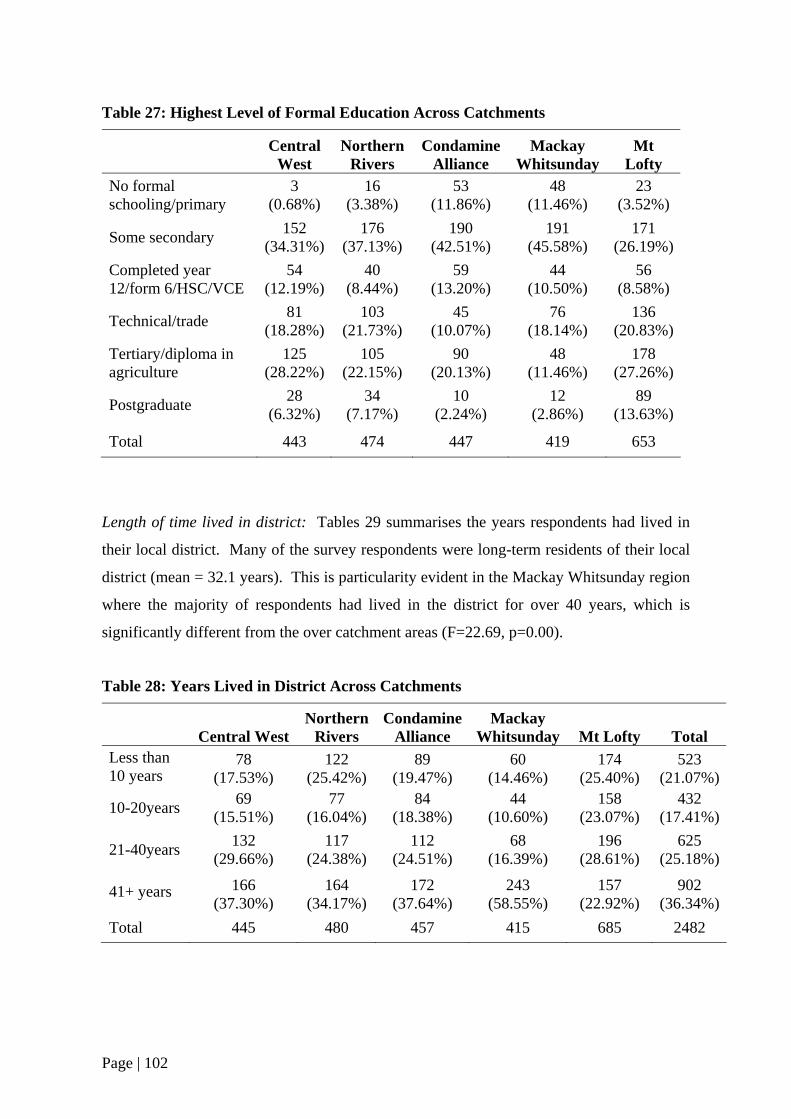
Table 27: Highest Level of Formal Education Across Catchments
Central West
Northern Rivers
Condamine Alliance
Mackay Whitsunday
Mt Lofty
No formal schooling/primary
3 (0.68%)
16 (3.38%)
53 (11.86%)
48 (11.46%)
23 (3.52%)
Some secondary 152 (34.31%)
176 (37.13%)
190 (42.51%)
191 (45.58%)
171 (26.19%)
Completed year 12/form 6/HSC/VCE
54 (12.19%)
40 (8.44%)
59 (13.20%)
44 (10.50%)
56 (8.58%)
Technical/trade 81 (18.28%)
103 (21.73%)
45 (10.07%)
76 (18.14%)
136 (20.83%)
Tertiary/diploma in agriculture
125 (28.22%)
105 (22.15%)
90 (20.13%)
48 (11.46%)
178 (27.26%)
Postgraduate 28 (6.32%)
34 (7.17%)
10 (2.24%)
12 (2.86%)
89 (13.63%)
Total 443 474 447 419 653
Length of time lived in district: Tables 29 summarises the years respondents had lived in
their local district. Many of the survey respondents were long-term residents of their local
district (mean = 32.1 years). This is particularity evident in the Mackay Whitsunday region
where the majority of respondents had lived in the district for over 40 years, which is
significantly different from the over catchment areas (F=22.69, p=0.00).
Table 28: Years Lived in District Across Catchments
Central West Northern
Rivers Condamine
Alliance Mackay
Whitsunday Mt Lofty Total Less than 10 years
78 (17.53%)
122 (25.42%)
89 (19.47%)
60 (14.46%)
174 (25.40%)
523 (21.07%)
10-20years 69 (15.51%)
77 (16.04%)
84 (18.38%)
44 (10.60%)
158 (23.07%)
432 (17.41%)
21-40years 132 (29.66%)
117 (24.38%)
112 (24.51%)
68 (16.39%)
196 (28.61%)
625 (25.18%)
41+ years 166 (37.30%)
164 (34.17%)
172 (37.64%)
243 (58.55%)
157 (22.92%)
902 (36.34%)
Total 445 480 457 415 685 2482
Page | 102
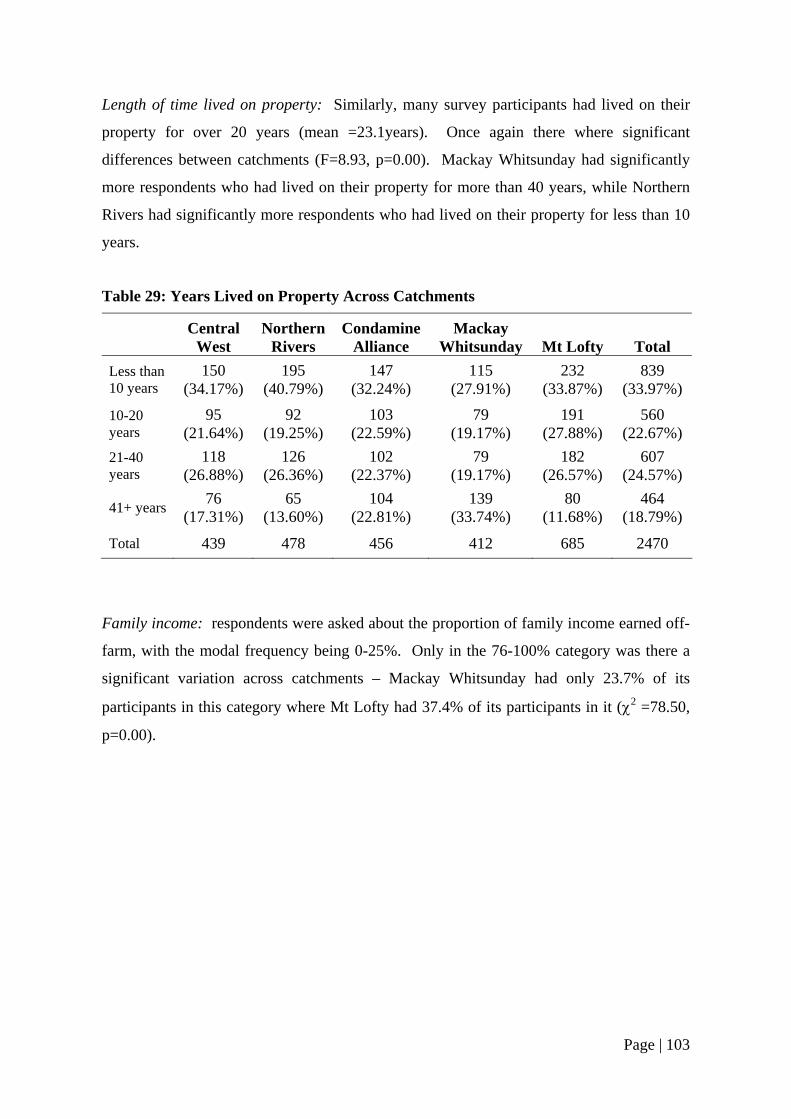
Length of time lived on property: Similarly, many survey participants had lived on their
property for over 20 years (mean =23.1years). Once again there where significant
differences between catchments (F=8.93, p=0.00). Mackay Whitsunday had significantly
more respondents who had lived on their property for more than 40 years, while Northern
Rivers had significantly more respondents who had lived on their property for less than 10
years.
Table 29: Years Lived on Property Across Catchments
Central
West Northern
Rivers Condamine
Alliance Mackay
Whitsunday Mt Lofty Total Less than 10 years
150 (34.17%)
195 (40.79%)
147 (32.24%)
115 (27.91%)
232 (33.87%)
839 (33.97%)
10-20 years
95 (21.64%)
92 (19.25%)
103 (22.59%)
79 (19.17%)
191 (27.88%)
560 (22.67%)
21-40 years
118 (26.88%)
126 (26.36%)
102 (22.37%)
79 (19.17%)
182 (26.57%)
607 (24.57%)
41+ years 76 (17.31%)
65 (13.60%)
104 (22.81%)
139 (33.74%)
80 (11.68%)
464 (18.79%)
Total 439 478 456 412 685 2470
Family income: respondents were asked about the proportion of family income earned off-
farm, with the modal frequency being 0-25%. Only in the 76-100% category was there a
significant variation across catchments – Mackay Whitsunday had only 23.7% of its
participants in this category where Mt Lofty had 37.4% of its participants in it (χ2 =78.50,
p=0.00).
Page | 103
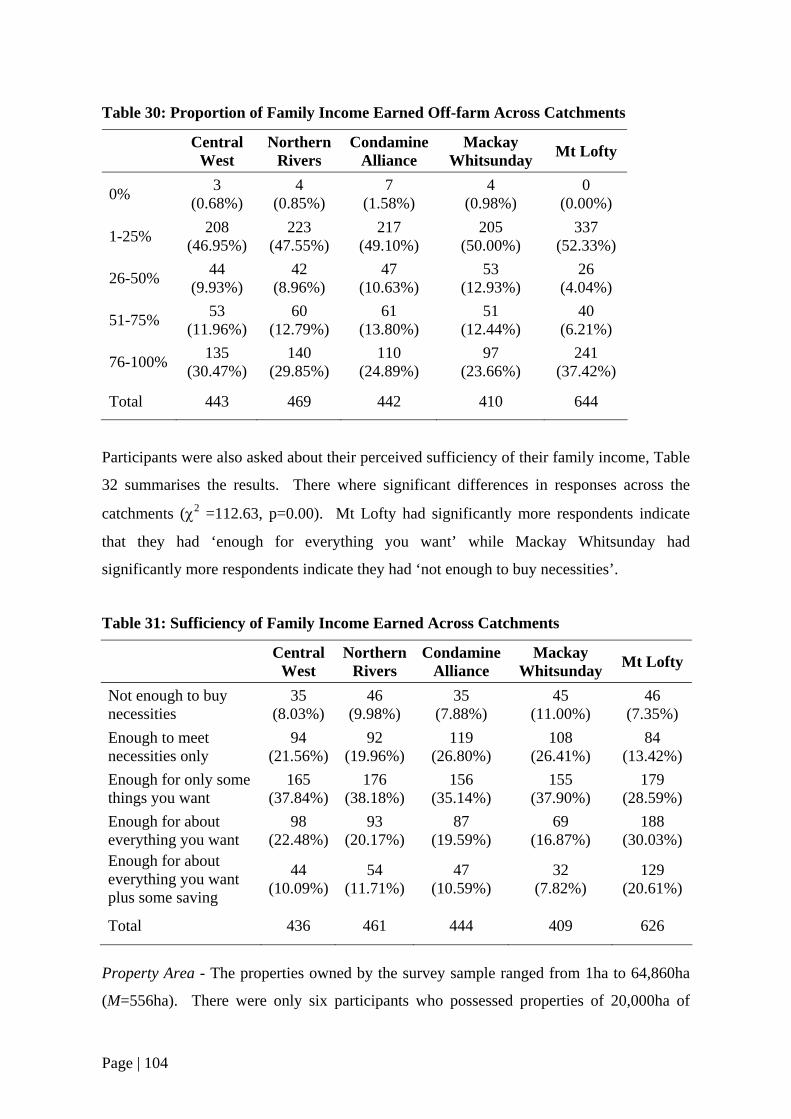
Table 30: Proportion of Family Income Earned Off-farm Across Catchments
Central
West Northern
Rivers Condamine
Alliance Mackay
Whitsunday Mt Lofty
0% 3 (0.68%)
4 (0.85%)
7 (1.58%)
4 (0.98%)
0 (0.00%)
1-25% 208 (46.95%)
223 (47.55%)
217 (49.10%)
205 (50.00%)
337 (52.33%)
26-50% 44 (9.93%)
42 (8.96%)
47 (10.63%)
53 (12.93%)
26 (4.04%)
51-75% 53 (11.96%)
60 (12.79%)
61 (13.80%)
51 (12.44%)
40 (6.21%)
76-100% 135 (30.47%)
140 (29.85%)
110 (24.89%)
97 (23.66%)
241 (37.42%)
Total 443 469 442 410 644
Participants were also asked about their perceived sufficiency of their family income, Table
32 summarises the results. There where significant differences in responses across the
catchments (χ2 =112.63, p=0.00). Mt Lofty had significantly more respondents indicate
that they had ‘enough for everything you want’ while Mackay Whitsunday had
significantly more respondents indicate they had ‘not enough to buy necessities’.
Table 31: Sufficiency of Family Income Earned Across Catchments
Central
West Northern
Rivers Condamine
Alliance Mackay
Whitsunday Mt Lofty
Not enough to buy necessities
35 (8.03%)
46 (9.98%)
35 (7.88%)
45 (11.00%)
46 (7.35%)
Enough to meet necessities only
94 (21.56%)
92 (19.96%)
119 (26.80%)
108 (26.41%)
84 (13.42%)
Enough for only some things you want
165 (37.84%)
176 (38.18%)
156 (35.14%)
155 (37.90%)
179 (28.59%)
Enough for about everything you want
98 (22.48%)
93 (20.17%)
87 (19.59%)
69 (16.87%)
188 (30.03%)
Enough for about everything you want plus some saving
44 (10.09%)
54 (11.71%)
47 (10.59%)
32 (7.82%)
129 (20.61%)
Total 436 461 444 409 626
Property Area - The properties owned by the survey sample ranged from 1ha to 64,860ha
(M=556ha). There were only six participants who possessed properties of 20,000ha of
Page | 104
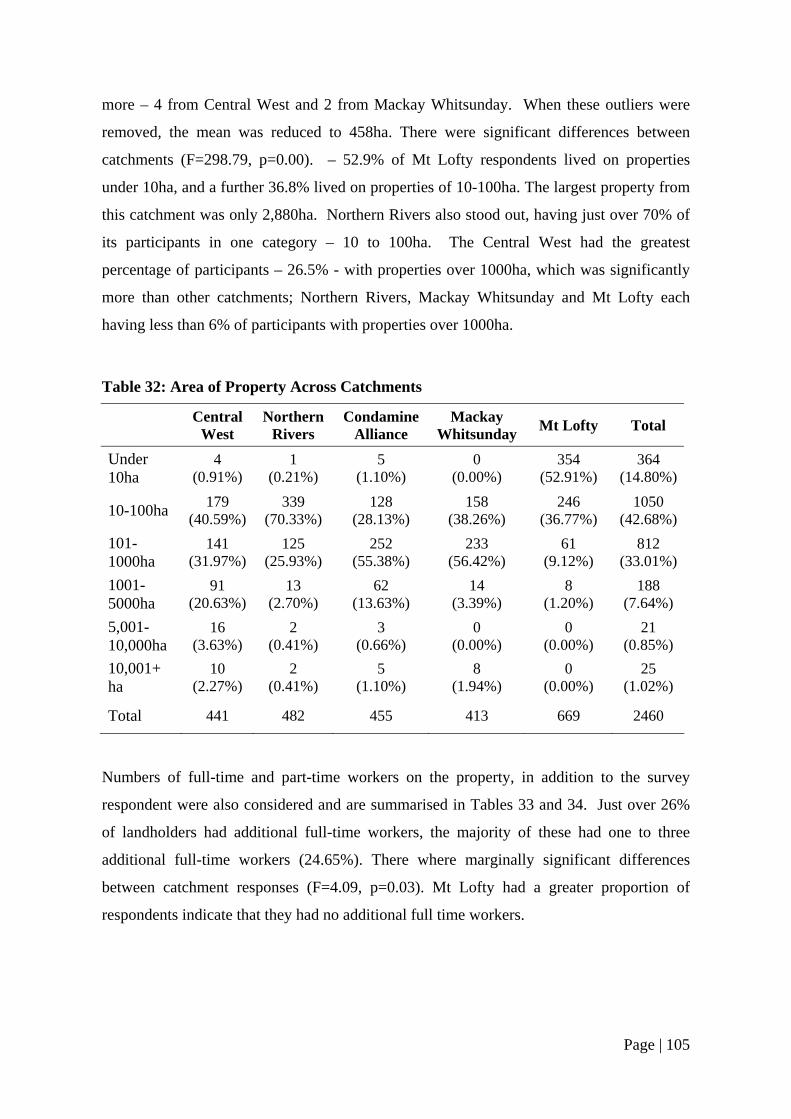
more – 4 from Central West and 2 from Mackay Whitsunday. When these outliers were
removed, the mean was reduced to 458ha. There were significant differences between
catchments (F=298.79, p=0.00). – 52.9% of Mt Lofty respondents lived on properties
under 10ha, and a further 36.8% lived on properties of 10-100ha. The largest property from
this catchment was only 2,880ha. Northern Rivers also stood out, having just over 70% of
its participants in one category – 10 to 100ha. The Central West had the greatest
percentage of participants – 26.5% - with properties over 1000ha, which was significantly
more than other catchments; Northern Rivers, Mackay Whitsunday and Mt Lofty each
having less than 6% of participants with properties over 1000ha.
Table 32: Area of Property Across Catchments
Central
West Northern
Rivers Condamine
Alliance Mackay
Whitsunday Mt Lofty Total
Under 10ha
4 (0.91%)
1 (0.21%)
5 (1.10%)
0 (0.00%)
354 (52.91%)
364 (14.80%)
10-100ha 179 (40.59%)
339 (70.33%)
128 (28.13%)
158 (38.26%)
246 (36.77%)
1050 (42.68%)
101-1000ha
141 (31.97%)
125 (25.93%)
252 (55.38%)
233 (56.42%)
61 (9.12%)
812 (33.01%)
1001-5000ha
91 (20.63%)
13 (2.70%)
62 (13.63%)
14 (3.39%)
8 (1.20%)
188 (7.64%)
5,001-10,000ha
16 (3.63%)
2 (0.41%)
3 (0.66%)
0 (0.00%)
0 (0.00%)
21 (0.85%)
10,001+ ha
10 (2.27%)
2 (0.41%)
5 (1.10%)
8 (1.94%)
0 (0.00%)
25 (1.02%)
Total 441 482 455 413 669 2460
Numbers of full-time and part-time workers on the property, in addition to the survey
respondent were also considered and are summarised in Tables 33 and 34. Just over 26%
of landholders had additional full-time workers, the majority of these had one to three
additional full-time workers (24.65%). There where marginally significant differences
between catchment responses (F=4.09, p=0.03). Mt Lofty had a greater proportion of
respondents indicate that they had no additional full time workers.
Page | 105
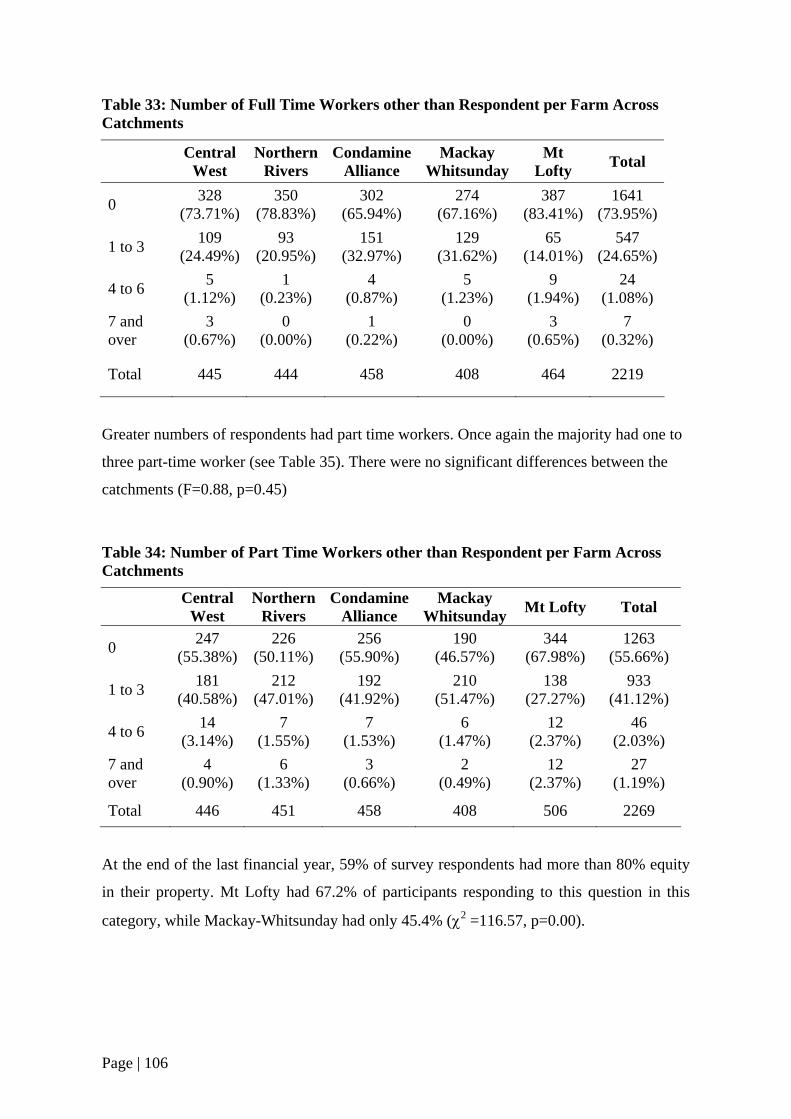
Table 33: Number of Full Time Workers other than Respondent per Farm Across Catchments
Central West
Northern Rivers
Condamine Alliance
Mackay Whitsunday
Mt Lofty Total
0 328 (73.71%)
350 (78.83%)
302 (65.94%)
274 (67.16%)
387 (83.41%)
1641 (73.95%)
1 to 3 109 (24.49%)
93 (20.95%)
151 (32.97%)
129 (31.62%)
65 (14.01%)
547 (24.65%)
4 to 6 5 (1.12%)
1 (0.23%)
4 (0.87%)
5 (1.23%)
9 (1.94%)
24 (1.08%)
7 and over
3 (0.67%)
0 (0.00%)
1 (0.22%)
0 (0.00%)
3 (0.65%)
7 (0.32%)
Total 445 444 458 408 464 2219
Greater numbers of respondents had part time workers. Once again the majority had one to
three part-time worker (see Table 35). There were no significant differences between the
catchments (F=0.88, p=0.45)
Table 34: Number of Part Time Workers other than Respondent per Farm Across Catchments
Central West
Northern Rivers
Condamine Alliance
Mackay Whitsunday Mt Lofty Total
0 247 (55.38%)
226 (50.11%)
256 (55.90%)
190 (46.57%)
344 (67.98%)
1263 (55.66%)
1 to 3 181 (40.58%)
212 (47.01%)
192 (41.92%)
210 (51.47%)
138 (27.27%)
933 (41.12%)
4 to 6 14 (3.14%)
7 (1.55%)
7 (1.53%)
6 (1.47%)
12 (2.37%)
46 (2.03%)
7 and over
4 (0.90%)
6 (1.33%)
3 (0.66%)
2 (0.49%)
12 (2.37%)
27 (1.19%)
Total 446 451 458 408 506 2269
At the end of the last financial year, 59% of survey respondents had more than 80% equity
in their property. Mt Lofty had 67.2% of participants responding to this question in this
category, while Mackay-Whitsunday had only 45.4% (χ2 =116.57, p=0.00).
Page | 106
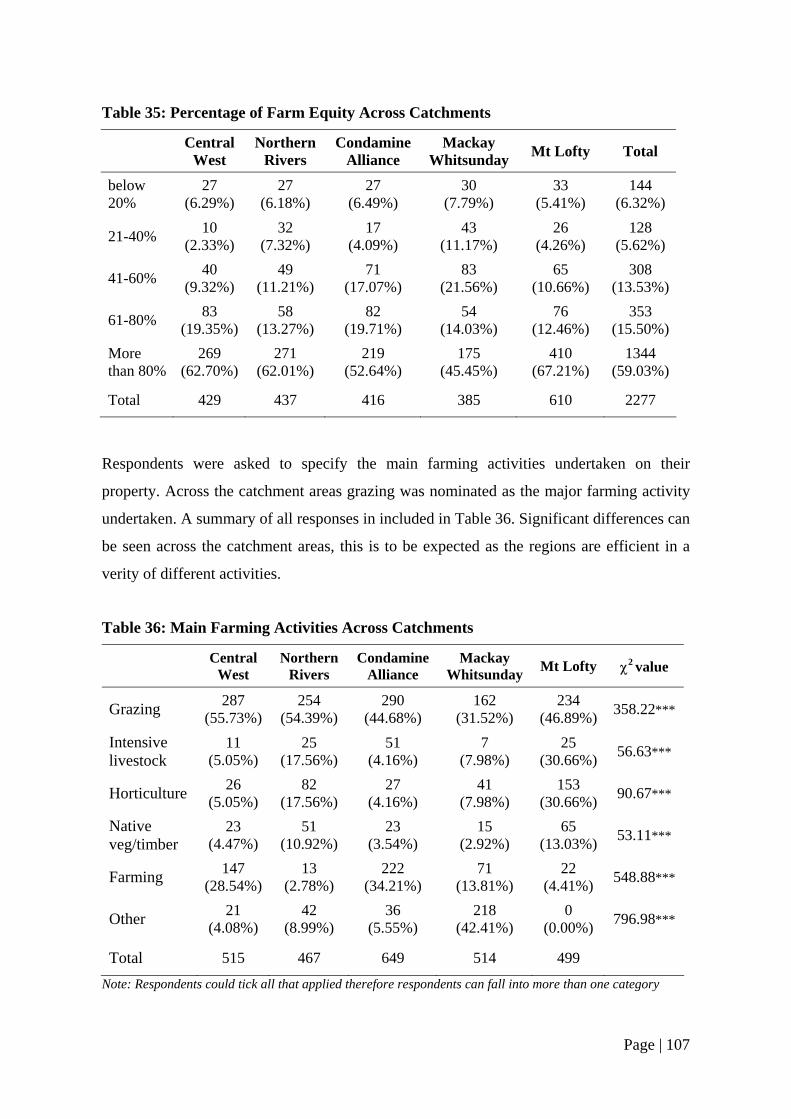
Table 35: Percentage of Farm Equity Across Catchments
Central
West Northern
Rivers Condamine
Alliance Mackay
Whitsunday Mt Lofty Total
below 20%
27 (6.29%)
27 (6.18%)
27 (6.49%)
30 (7.79%)
33 (5.41%)
144 (6.32%)
21-40% 10 (2.33%)
32 (7.32%)
17 (4.09%)
43 (11.17%)
26 (4.26%)
128 (5.62%)
41-60% 40 (9.32%)
49 (11.21%)
71 (17.07%)
83 (21.56%)
65 (10.66%)
308 (13.53%)
61-80% 83 (19.35%)
58 (13.27%)
82 (19.71%)
54 (14.03%)
76 (12.46%)
353 (15.50%)
More than 80%
269 (62.70%)
271 (62.01%)
219 (52.64%)
175 (45.45%)
410 (67.21%)
1344 (59.03%)
Total 429 437 416 385 610 2277
Respondents were asked to specify the main farming activities undertaken on their
property. Across the catchment areas grazing was nominated as the major farming activity
undertaken. A summary of all responses in included in Table 36. Significant differences can
be seen across the catchment areas, this is to be expected as the regions are efficient in a
verity of different activities.
Table 36: Main Farming Activities Across Catchments
Central West
Northern Rivers
Condamine Alliance
Mackay Whitsunday Mt Lofty χ2 value
Grazing 287 (55.73%)
254 (54.39%)
290 (44.68%)
162 (31.52%)
234 (46.89%) 358.22***
Intensive livestock
11 (5.05%)
25 (17.56%)
51 (4.16%)
7 (7.98%)
25 (30.66%) 56.63***
Horticulture 26 (5.05%)
82 (17.56%)
27 (4.16%)
41 (7.98%)
153 (30.66%) 90.67***
Native veg/timber
23 (4.47%)
51 (10.92%)
23 (3.54%)
15 (2.92%)
65 (13.03%) 53.11***
Farming 147 (28.54%)
13 (2.78%)
222 (34.21%)
71 (13.81%)
22 (4.41%) 548.88***
Other 21 (4.08%)
42 (8.99%)
36 (5.55%)
218 (42.41%)
0 (0.00%) 796.98***
Total 515 467 649 514 499
Note: Respondents could tick all that applied therefore respondents can fall into more than one category
Page | 107
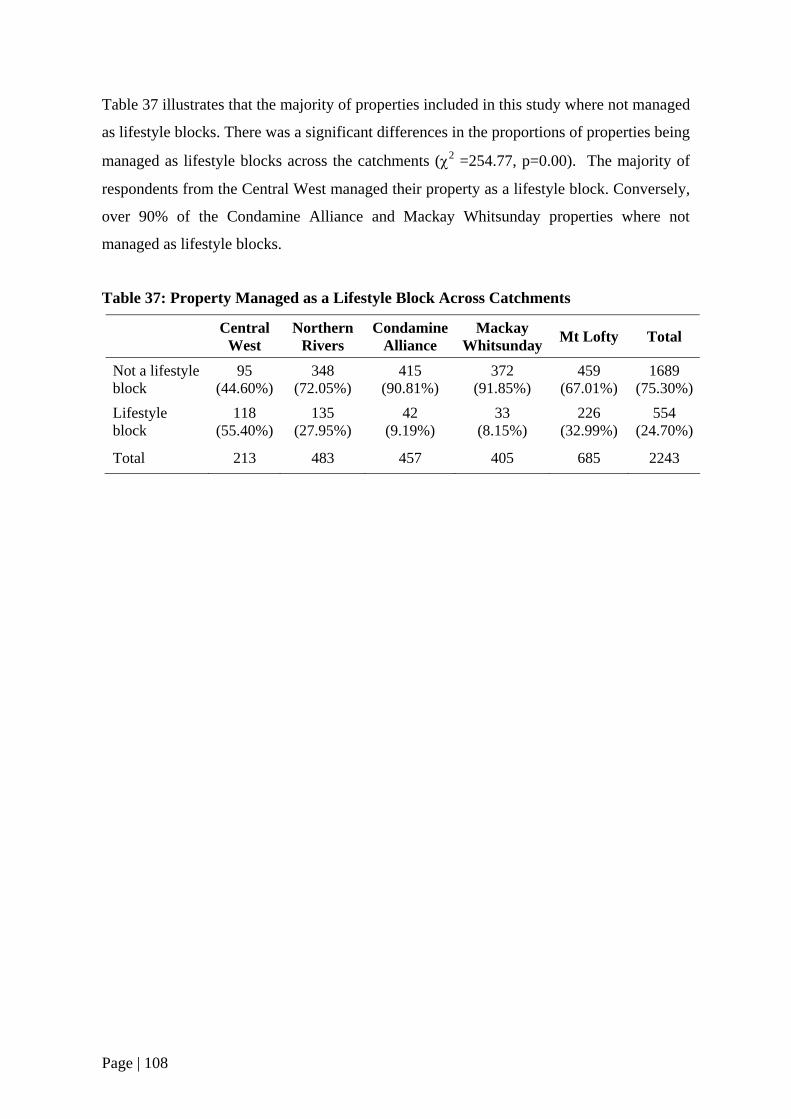
Table 37 illustrates that the majority of properties included in this study where not managed
as lifestyle blocks. There was a significant differences in the proportions of properties being
managed as lifestyle blocks across the catchments (χ2 =254.77, p=0.00). The majority of
respondents from the Central West managed their property as a lifestyle block. Conversely,
over 90% of the Condamine Alliance and Mackay Whitsunday properties where not
managed as lifestyle blocks.
Table 37: Property Managed as a Lifestyle Block Across Catchments
Central West
Northern Rivers
Condamine Alliance
Mackay Whitsunday Mt Lofty Total
Not a lifestyle block
95 (44.60%)
348 (72.05%)
415 (90.81%)
372 (91.85%)
459 (67.01%)
1689 (75.30%)
Lifestyle block
118 (55.40%)
135 (27.95%)
42 (9.19%)
33 (8.15%)
226 (32.99%)
554 (24.70%)
Total 213 483 457 405 685 2243
Page | 108
Appendix 4: Results from the Factor Analysis and Other Validity Tests Factor Analysis
A principal components factor analysis with a non-orthogonal rotation was used to derive
attitudinal constructs for use in both the regression and factor analysis. The KMO indicator
of 0.828 demonstrated that the use of factor analysis was appropriate. Items with loadings
less than 0.5 and communalities of less than 0.48 were excluded. An eight factor solution
was justified based on total variance explained of 61.3% and a visual inspection of the scree
plot. An eight factor solution resulted, and the very small percentage of residuals with
absolute value larger than 0.05 (14%) suggest that this is a robust solution.
The pattern matrix was used to identify the various constructs, as shown in Table 39. The
constructs are identified by examining which variables load most highly on the each
construct. It is apparent that there are few cross-loadings and that most variables have high
loadings with their respective constructs which is indicative of both discriminant and
convergent validity. However, more formal tests of both of these forms of validity are
reported below.
The eight constructs identified in the pattern matrix are:
1. Trust
2. Profit focused
3. Dissatisfaction
4. Cash constrained
5. Innovator
6. Environmental responsibility
7. Time available
8. Stewardship
Page | 109
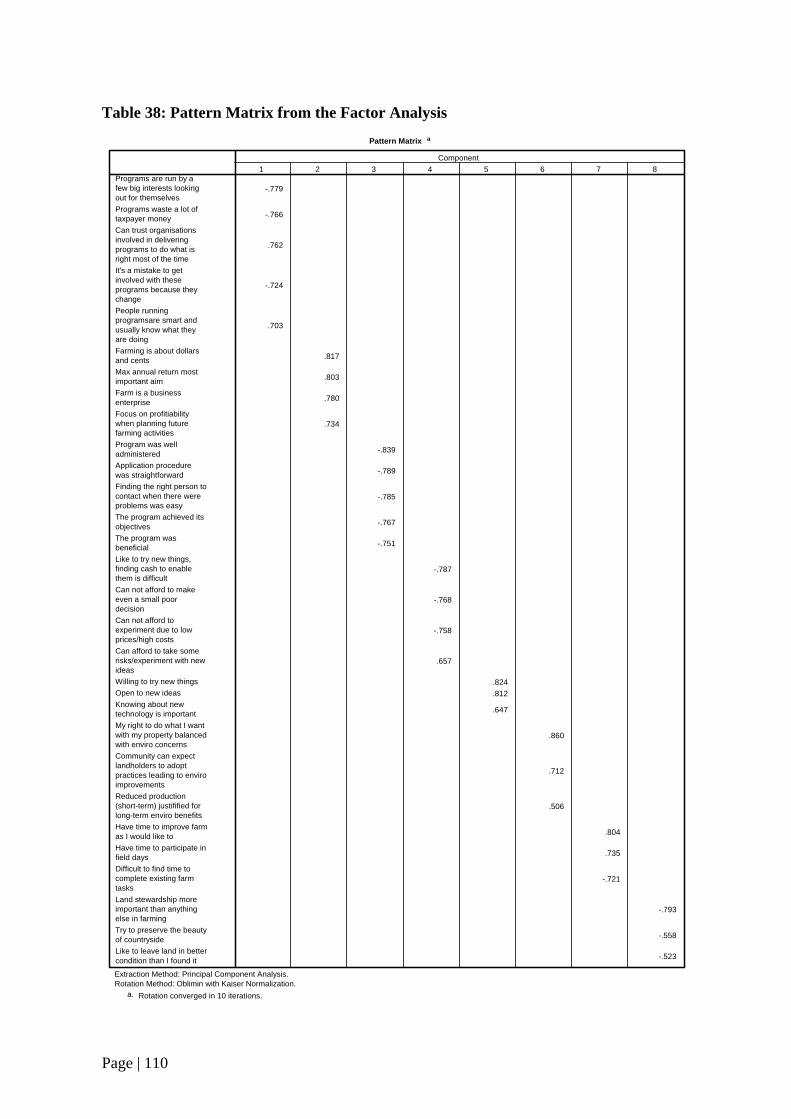
Table 38: Pattern Matrix from the Factor Analysis Pattern Matrix a
-.779
-.766
.762
-.724
.703
.817
.803
.780
.734
-.839
-.789
-.785
-.767
-.751
-.787
-.768
-.758
.657
.824 .812
.647
.860
.712
.506
.804
.735
-.721
-.793
-.558
-.523
Programs are run by afew big interests lookingout for themselvesPrograms waste a lot oftaxpayer moneyCan trust organisationsinvolved in deliveringprograms to do what isright most of the timeIt's a mistake to getinvolved with theseprograms because theychangePeople runningprogramsare smart andusually know what theyare doingFarming is about dollarsand centsMax annual return mostimportant aimFarm is a businessenterpriseFocus on profitiabilitywhen planning futurefarming activitiesProgram was welladministeredApplication procedurewas straightforwardFinding the right person tocontact when there wereproblems was easyThe program achieved itsobjectivesThe program wasbeneficialLike to try new things,finding cash to enablethem is difficultCan not afford to makeeven a small poordecisionCan not afford toexperiment due to lowprices/high costsCan afford to take somerisks/experiment with newideasWilling to try new thingsOpen to new ideasKnowing about newtechnology is importantMy right to do what I wantwith my property balancedwith enviro concernsCommunity can expectlandholders to adoptpractices leading to enviroimprovementsReduced production(short-term) justifified forlong-term enviro benefitsHave time to improve farmas I would like toHave time to participate infield daysDifficult to find time tocomplete existing farmtasksLand stewardship moreimportant than anythingelse in farmingTry to preserve the beautyof countrysideLike to leave land in bettercondition than I found it
1 2 3 4 5 6 7 8Component
Extraction Method: Principal Component Analysis. Rotation Method: Oblimin with Kaiser Normalization.
Rotation converged in 10 iterations.a.
Page | 110
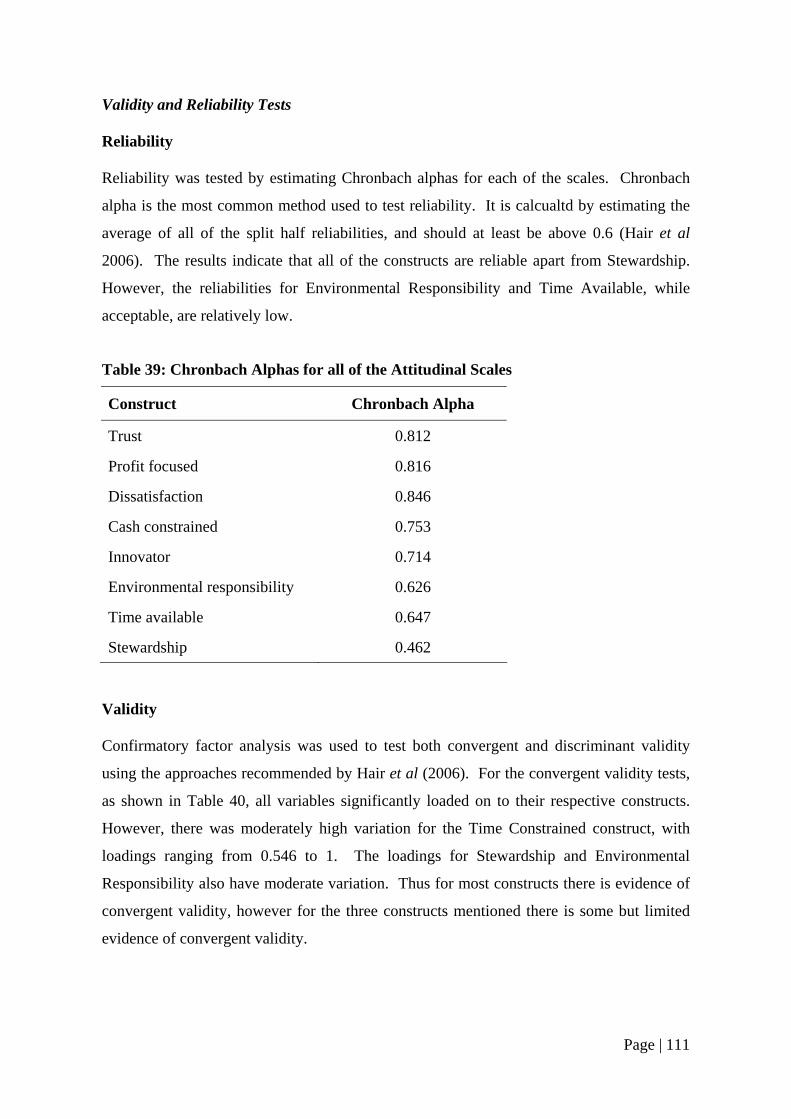
Validity and Reliability Tests Reliability Reliability was tested by estimating Chronbach alphas for each of the scales. Chronbach
alpha is the most common method used to test reliability. It is calcualtd by estimating the
average of all of the split half reliabilities, and should at least be above 0.6 (Hair et al
2006). The results indicate that all of the constructs are reliable apart from Stewardship.
However, the reliabilities for Environmental Responsibility and Time Available, while
acceptable, are relatively low.
Table 39: Chronbach Alphas for all of the Attitudinal Scales
Construct Chronbach Alpha
Trust 0.812
Profit focused 0.816
Dissatisfaction 0.846
Cash constrained 0.753
Innovator 0.714
Environmental responsibility 0.626
Time available 0.647
Stewardship 0.462 Validity Confirmatory factor analysis was used to test both convergent and discriminant validity
using the approaches recommended by Hair et al (2006). For the convergent validity tests,
as shown in Table 40, all variables significantly loaded on to their respective constructs.
However, there was moderately high variation for the Time Constrained construct, with
loadings ranging from 0.546 to 1. The loadings for Stewardship and Environmental
Responsibility also have moderate variation. Thus for most constructs there is evidence of
convergent validity, however for the three constructs mentioned there is some but limited
evidence of convergent validity.
Page | 111
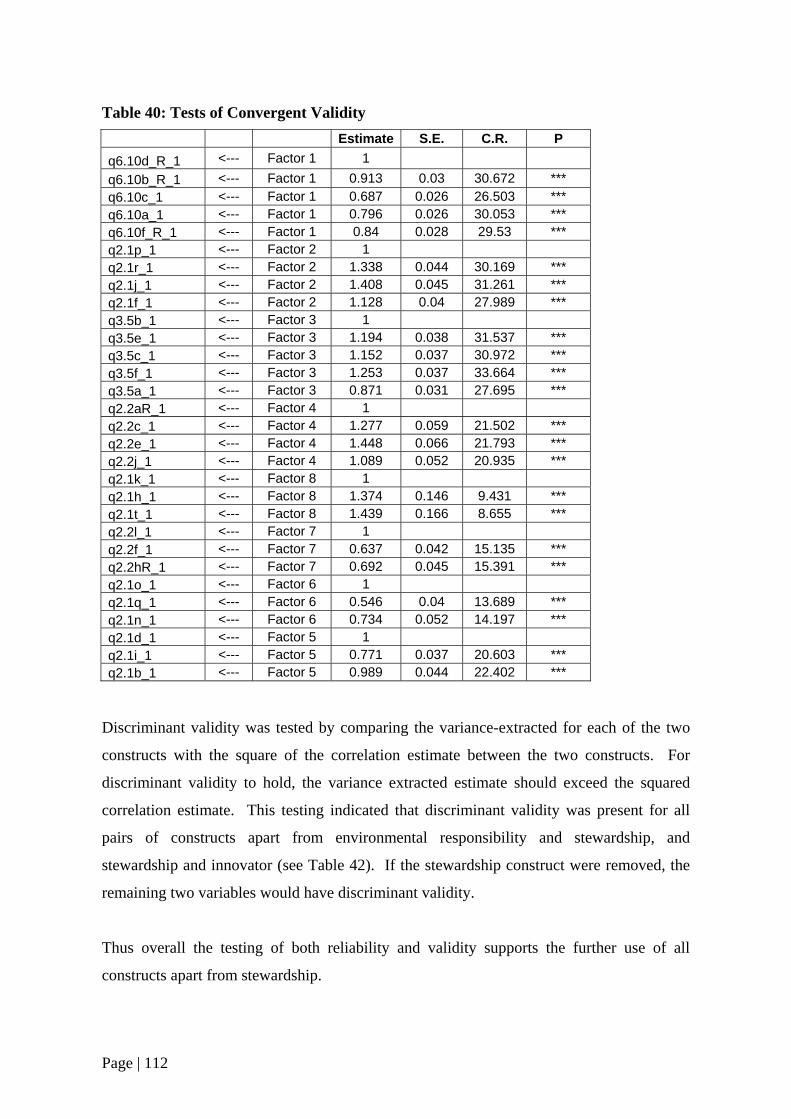
Table 40: Tests of Convergent Validity Estimate S.E. C.R. P
q6.10d_R_1 <--- Factor 1 1 q6.10b_R_1 <--- Factor 1 0.913 0.03 30.672 *** q6.10c_1 <--- Factor 1 0.687 0.026 26.503 *** q6.10a_1 <--- Factor 1 0.796 0.026 30.053 *** q6.10f_R_1 <--- Factor 1 0.84 0.028 29.53 *** q2.1p_1 <--- Factor 2 1 q2.1r_1 <--- Factor 2 1.338 0.044 30.169 *** q2.1j_1 <--- Factor 2 1.408 0.045 31.261 *** q2.1f_1 <--- Factor 2 1.128 0.04 27.989 *** q3.5b_1 <--- Factor 3 1 q3.5e_1 <--- Factor 3 1.194 0.038 31.537 *** q3.5c_1 <--- Factor 3 1.152 0.037 30.972 *** q3.5f_1 <--- Factor 3 1.253 0.037 33.664 *** q3.5a_1 <--- Factor 3 0.871 0.031 27.695 *** q2.2aR_1 <--- Factor 4 1 q2.2c_1 <--- Factor 4 1.277 0.059 21.502 *** q2.2e_1 <--- Factor 4 1.448 0.066 21.793 *** q2.2j_1 <--- Factor 4 1.089 0.052 20.935 *** q2.1k_1 <--- Factor 8 1 q2.1h_1 <--- Factor 8 1.374 0.146 9.431 *** q2.1t_1 <--- Factor 8 1.439 0.166 8.655 *** q2.2l_1 <--- Factor 7 1 q2.2f_1 <--- Factor 7 0.637 0.042 15.135 *** q2.2hR_1 <--- Factor 7 0.692 0.045 15.391 *** q2.1o_1 <--- Factor 6 1 q2.1q_1 <--- Factor 6 0.546 0.04 13.689 *** q2.1n_1 <--- Factor 6 0.734 0.052 14.197 *** q2.1d_1 <--- Factor 5 1 q2.1i_1 <--- Factor 5 0.771 0.037 20.603 *** q2.1b_1 <--- Factor 5 0.989 0.044 22.402 ***
Discriminant validity was tested by comparing the variance-extracted for each of the two
constructs with the square of the correlation estimate between the two constructs. For
discriminant validity to hold, the variance extracted estimate should exceed the squared
correlation estimate. This testing indicated that discriminant validity was present for all
pairs of constructs apart from environmental responsibility and stewardship, and
stewardship and innovator (see Table 42). If the stewardship construct were removed, the
remaining two variables would have discriminant validity.
Thus overall the testing of both reliability and validity supports the further use of all
constructs apart from stewardship.
Page | 112
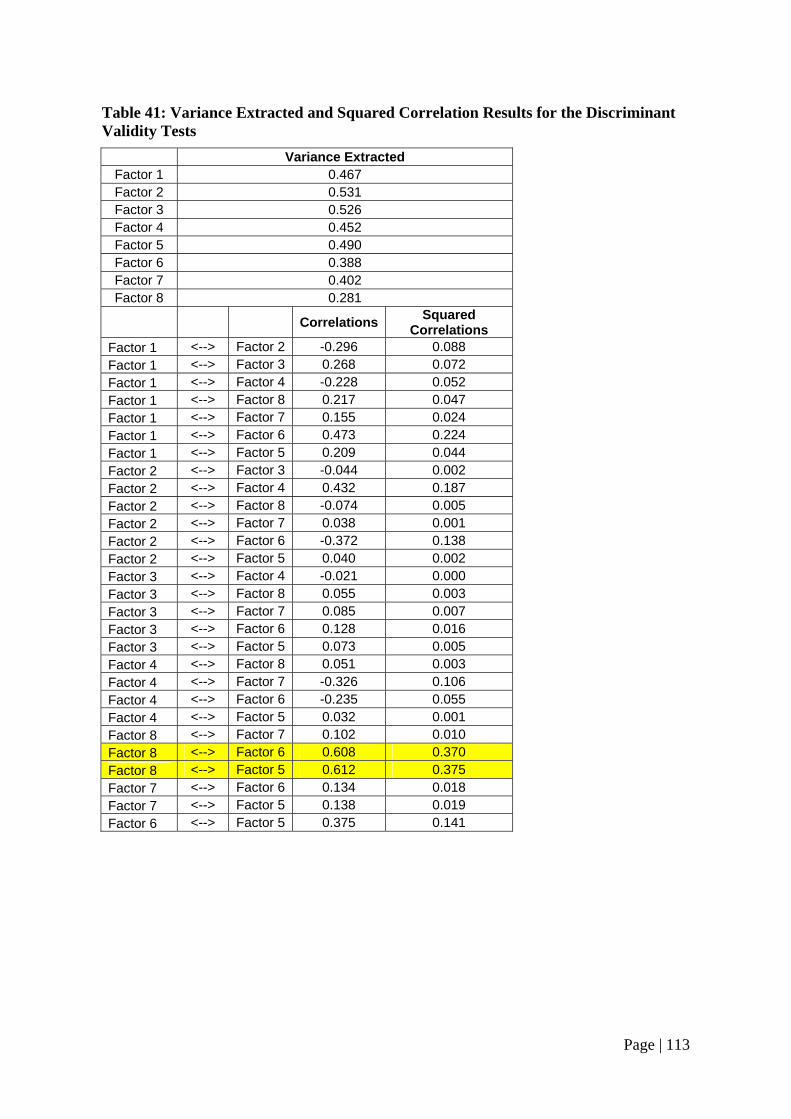
Table 41: Variance Extracted and Squared Correlation Results for the Discriminant Validity Tests
Variance Extracted Factor 1 0.467 Factor 2 0.531 Factor 3 0.526 Factor 4 0.452 Factor 5 0.490 Factor 6 0.388 Factor 7 0.402 Factor 8 0.281
Correlations Squared Correlations
Factor 1 <--> Factor 2 -0.296 0.088 Factor 1 <--> Factor 3 0.268 0.072 Factor 1 <--> Factor 4 -0.228 0.052 Factor 1 <--> Factor 8 0.217 0.047 Factor 1 <--> Factor 7 0.155 0.024 Factor 1 <--> Factor 6 0.473 0.224 Factor 1 <--> Factor 5 0.209 0.044 Factor 2 <--> Factor 3 -0.044 0.002 Factor 2 <--> Factor 4 0.432 0.187 Factor 2 <--> Factor 8 -0.074 0.005 Factor 2 <--> Factor 7 0.038 0.001 Factor 2 <--> Factor 6 -0.372 0.138 Factor 2 <--> Factor 5 0.040 0.002 Factor 3 <--> Factor 4 -0.021 0.000 Factor 3 <--> Factor 8 0.055 0.003 Factor 3 <--> Factor 7 0.085 0.007 Factor 3 <--> Factor 6 0.128 0.016 Factor 3 <--> Factor 5 0.073 0.005 Factor 4 <--> Factor 8 0.051 0.003 Factor 4 <--> Factor 7 -0.326 0.106 Factor 4 <--> Factor 6 -0.235 0.055 Factor 4 <--> Factor 5 0.032 0.001 Factor 8 <--> Factor 7 0.102 0.010 Factor 8 <--> Factor 6 0.608 0.370 Factor 8 <--> Factor 5 0.612 0.375 Factor 7 <--> Factor 6 0.134 0.018 Factor 7 <--> Factor 5 0.138 0.019 Factor 6 <--> Factor 5 0.375 0.141
Page | 113
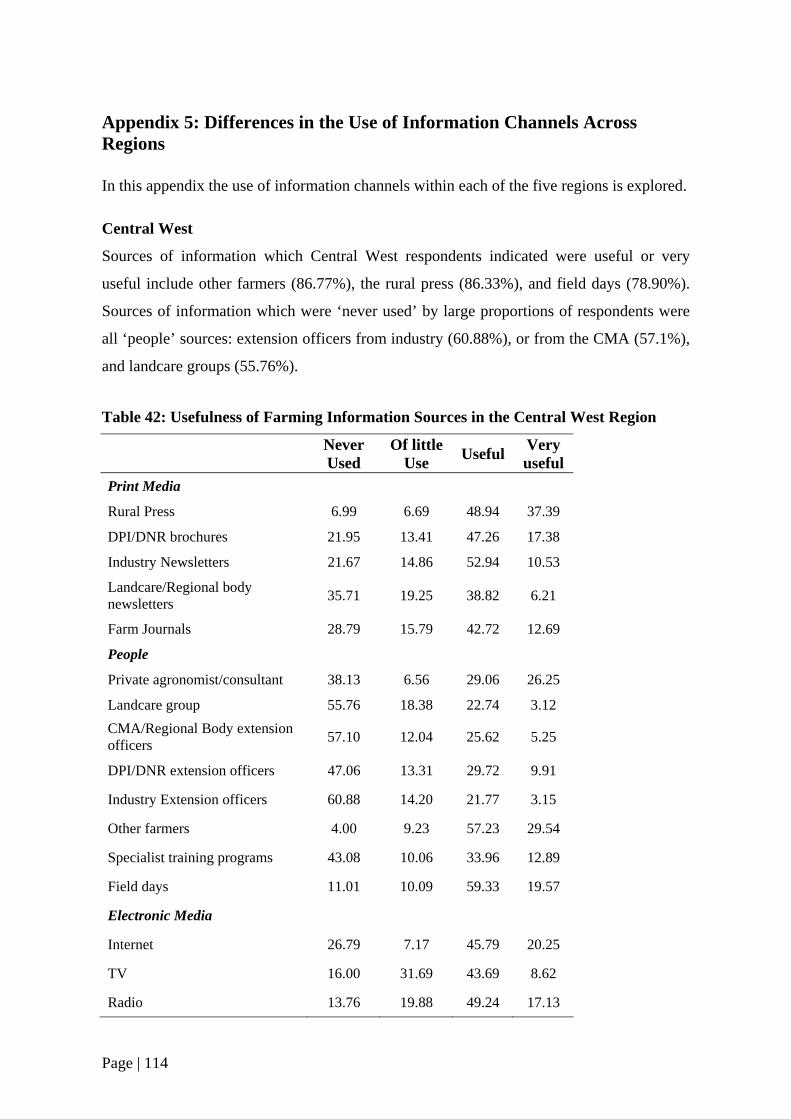
Appendix 5: Differences in the Use of Information Channels Across Regions
In this appendix the use of information channels within each of the five regions is explored. Central West
Sources of information which Central West respondents indicated were useful or very
useful include other farmers (86.77%), the rural press (86.33%), and field days (78.90%).
Sources of information which were ‘never used’ by large proportions of respondents were
all ‘people’ sources: extension officers from industry (60.88%), or from the CMA (57.1%),
and landcare groups (55.76%).
Table 42: Usefulness of Farming Information Sources in the Central West Region
Never Used
Of little Use Useful Very
useful Print Media Rural Press 6.99 6.69 48.94 37.39
DPI/DNR brochures 21.95 13.41 47.26 17.38
Industry Newsletters 21.67 14.86 52.94 10.53
Landcare/Regional body newsletters 35.71 19.25 38.82 6.21
Farm Journals 28.79 15.79 42.72 12.69
People
Private agronomist/consultant 38.13 6.56 29.06 26.25
Landcare group 55.76 18.38 22.74 3.12 CMA/Regional Body extension officers 57.10 12.04 25.62 5.25
DPI/DNR extension officers 47.06 13.31 29.72 9.91
Industry Extension officers 60.88 14.20 21.77 3.15
Other farmers 4.00 9.23 57.23 29.54
Specialist training programs 43.08 10.06 33.96 12.89
Field days 11.01 10.09 59.33 19.57
Electronic Media
Internet 26.79 7.17 45.79 20.25
TV 16.00 31.69 43.69 8.62
Radio 13.76 19.88 49.24 17.13
Page | 114
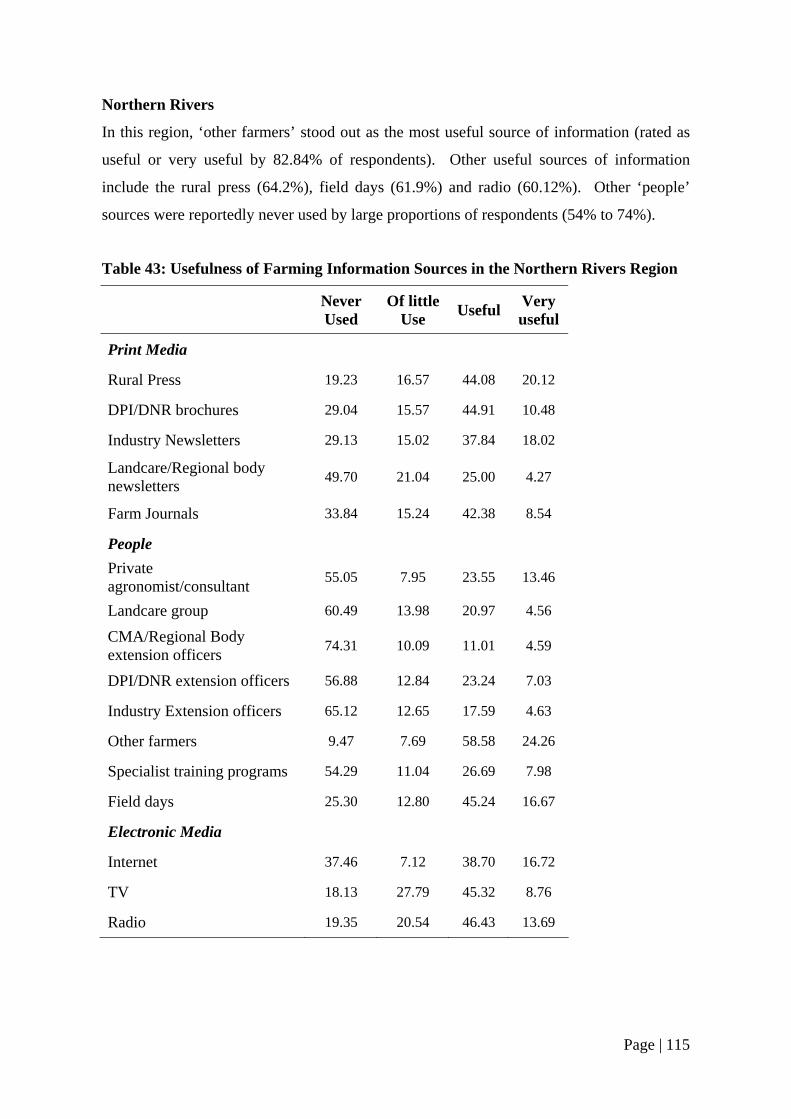
Northern Rivers
In this region, ‘other farmers’ stood out as the most useful source of information (rated as
useful or very useful by 82.84% of respondents). Other useful sources of information
include the rural press (64.2%), field days (61.9%) and radio (60.12%). Other ‘people’
sources were reportedly never used by large proportions of respondents (54% to 74%).
Table 43: Usefulness of Farming Information Sources in the Northern Rivers Region
Never Used
Of little Use Useful Very
useful
Print Media
Rural Press 19.23 16.57 44.08 20.12
DPI/DNR brochures 29.04 15.57 44.91 10.48
Industry Newsletters 29.13 15.02 37.84 18.02
Landcare/Regional body newsletters 49.70 21.04 25.00 4.27
Farm Journals 33.84 15.24 42.38 8.54
People
Private agronomist/consultant 55.05 7.95 23.55 13.46
Landcare group 60.49 13.98 20.97 4.56
CMA/Regional Body extension officers 74.31 10.09 11.01 4.59
DPI/DNR extension officers 56.88 12.84 23.24 7.03
Industry Extension officers 65.12 12.65 17.59 4.63
Other farmers 9.47 7.69 58.58 24.26
Specialist training programs 54.29 11.04 26.69 7.98
Field days 25.30 12.80 45.24 16.67
Electronic Media
Internet 37.46 7.12 38.70 16.72
TV 18.13 27.79 45.32 8.76
Radio 19.35 20.54 46.43 13.69
Page | 115
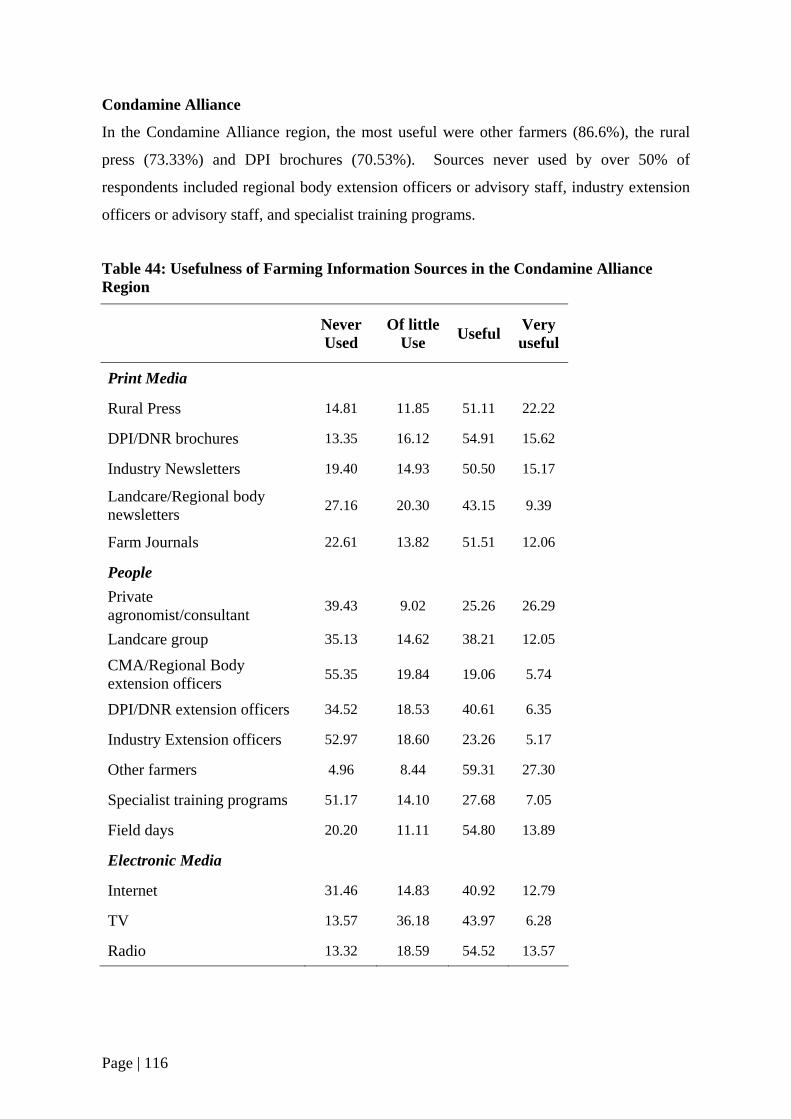
Condamine Alliance
In the Condamine Alliance region, the most useful were other farmers (86.6%), the rural
press (73.33%) and DPI brochures (70.53%). Sources never used by over 50% of
respondents included regional body extension officers or advisory staff, industry extension
officers or advisory staff, and specialist training programs.
Table 44: Usefulness of Farming Information Sources in the Condamine Alliance Region
Never Used
Of little Use Useful Very
useful
Print Media
Rural Press 14.81 11.85 51.11 22.22
DPI/DNR brochures 13.35 16.12 54.91 15.62
Industry Newsletters 19.40 14.93 50.50 15.17
Landcare/Regional body newsletters 27.16 20.30 43.15 9.39
Farm Journals 22.61 13.82 51.51 12.06
People
Private agronomist/consultant 39.43 9.02 25.26 26.29
Landcare group 35.13 14.62 38.21 12.05
CMA/Regional Body extension officers 55.35 19.84 19.06 5.74
DPI/DNR extension officers 34.52 18.53 40.61 6.35
Industry Extension officers 52.97 18.60 23.26 5.17
Other farmers 4.96 8.44 59.31 27.30
Specialist training programs 51.17 14.10 27.68 7.05
Field days 20.20 11.11 54.80 13.89
Electronic Media
Internet 31.46 14.83 40.92 12.79
TV 13.57 36.18 43.97 6.28
Radio 13.32 18.59 54.52 13.57
Page | 116
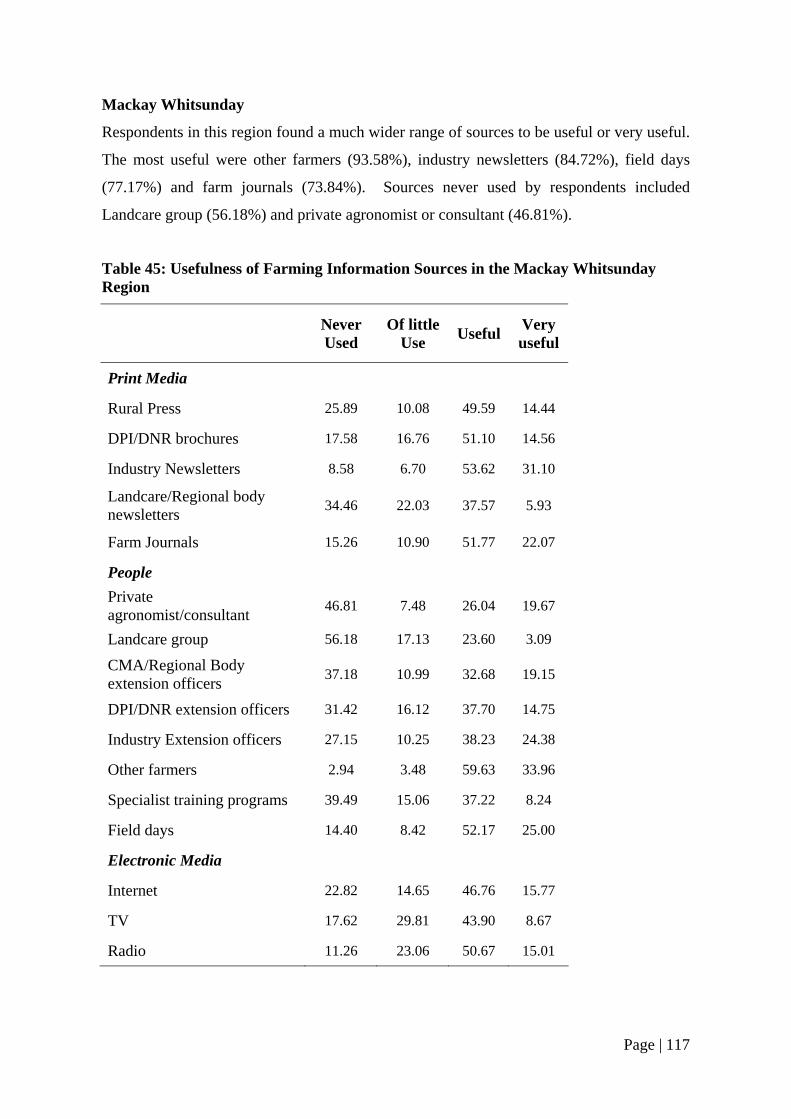
Mackay Whitsunday
Respondents in this region found a much wider range of sources to be useful or very useful.
The most useful were other farmers (93.58%), industry newsletters (84.72%), field days
(77.17%) and farm journals (73.84%). Sources never used by respondents included
Landcare group (56.18%) and private agronomist or consultant (46.81%).
Table 45: Usefulness of Farming Information Sources in the Mackay Whitsunday Region
Never Used
Of little Use Useful Very
useful
Print Media
Rural Press 25.89 10.08 49.59 14.44
DPI/DNR brochures 17.58 16.76 51.10 14.56
Industry Newsletters 8.58 6.70 53.62 31.10
Landcare/Regional body newsletters 34.46 22.03 37.57 5.93
Farm Journals 15.26 10.90 51.77 22.07
People
Private agronomist/consultant 46.81 7.48 26.04 19.67
Landcare group 56.18 17.13 23.60 3.09
CMA/Regional Body extension officers 37.18 10.99 32.68 19.15
DPI/DNR extension officers 31.42 16.12 37.70 14.75
Industry Extension officers 27.15 10.25 38.23 24.38
Other farmers 2.94 3.48 59.63 33.96
Specialist training programs 39.49 15.06 37.22 8.24
Field days 14.40 8.42 52.17 25.00
Electronic Media
Internet 22.82 14.65 46.76 15.77
TV 17.62 29.81 43.90 8.67
Radio 11.26 23.06 50.67 15.01
Page | 117
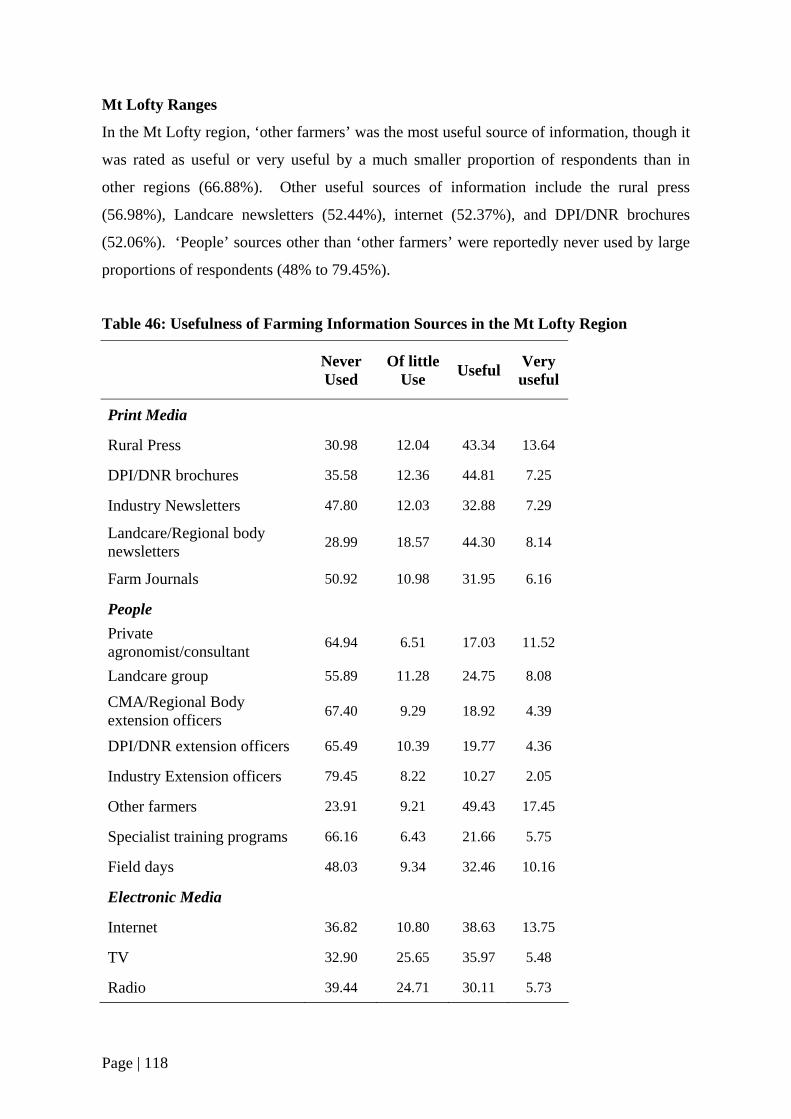
Mt Lofty Ranges
In the Mt Lofty region, ‘other farmers’ was the most useful source of information, though it
was rated as useful or very useful by a much smaller proportion of respondents than in
other regions (66.88%). Other useful sources of information include the rural press
(56.98%), Landcare newsletters (52.44%), internet (52.37%), and DPI/DNR brochures
(52.06%). ‘People’ sources other than ‘other farmers’ were reportedly never used by large
proportions of respondents (48% to 79.45%).
Table 46: Usefulness of Farming Information Sources in the Mt Lofty Region
Never Used
Of little Use Useful Very
useful
Print Media
Rural Press 30.98 12.04 43.34 13.64
DPI/DNR brochures 35.58 12.36 44.81 7.25
Industry Newsletters 47.80 12.03 32.88 7.29
Landcare/Regional body newsletters 28.99 18.57 44.30 8.14
Farm Journals 50.92 10.98 31.95 6.16
People
Private agronomist/consultant 64.94 6.51 17.03 11.52
Landcare group 55.89 11.28 24.75 8.08
CMA/Regional Body extension officers 67.40 9.29 18.92 4.39
DPI/DNR extension officers 65.49 10.39 19.77 4.36
Industry Extension officers 79.45 8.22 10.27 2.05
Other farmers 23.91 9.21 49.43 17.45
Specialist training programs 66.16 6.43 21.66 5.75
Field days 48.03 9.34 32.46 10.16
Electronic Media
Internet 36.82 10.80 38.63 13.75
TV 32.90 25.65 35.97 5.48
Radio 39.44 24.71 30.11 5.73
Page | 118