Embed Size (px)
Citation preview
Enable Midstream Partners, LP
Second Quarter 2015 Conference Call
August 5, 2015
Forward-looking Statements
This presentation and the oral statements made in connection herewith may contain “forward-looking statements” within the
meaning of the securities laws. All statements, other than statements of historical fact, regarding Enable Midstream Partners’
(“Enable”) strategy, future operations, financial position, estimated revenues, projected costs, prospects, plans and objectives of
management are forward-looking statements. These statements often include the words “could,” “believe,” “anticipate,” “intend,”
“estimate,” “expect,” “project,” “forecast” and similar expressions and are intended to identify forward-looking statements, although
not all forward-looking statements contain such identifying words. These forward-looking statements are based on Enable’s current
expectations and assumptions about future events and are based on currently available information as to the outcome and timing of
future events. Enable assumes no obligation to and does not intend to update any forward-looking statements included
herein. When considering forward-looking statements, you should keep in mind the risk factors and other cautionary statements
described under the heading “Risk Factors” included in our SEC filings. Enable cautions you that these forward-looking statements
are subject to all of the risks and uncertainties, most of which are difficult to predict and many of which are beyond its control,
incident to the ownership, operation and development of natural gas and crude oil infrastructure assets. These risks include, but
are not limited to, contract renewal risk, commodity price risk, environmental risks, operating risks, regulatory changes and the other
risks described under “Risk Factors” in our SEC filings. Should one or more of these risks or uncertainties occur, or should
underlying assumptions prove incorrect, Enable’s actual results and plans could differ materially from those expressed in any
forward-looking statements.
2
Non-GAAP Financial Measures
The Partnership has included the non-GAAP financial measures gross margin, Adjusted EBITDA and distributable cash flow
in this presentation based on information in its condensed combined and consolidated financial statements.
Gross margin, Adjusted EBITDA and distributable cash flow are supplemental financial measures that management and
external users of the Partnership’s financial statements, such as industry analysts, investors, lenders and rating agencies may use,
to assess:
• The Partnership’s operating performance as compared to those of other publicly traded partnerships in the midstream energy
industry, without regard to capital structure or historical cost basis;
• The ability of the Partnership’s assets to generate sufficient cash flow to make distributions to its partners;
• The Partnership’s ability to incur and service debt and fund capital expenditures; and
• The viability of acquisitions and other capital expenditure projects and the returns on investment of various investment
opportunities.
The appendix to this presentation includes a reconciliation of gross margin to revenues, Adjusted EBITDA and distributable cash
flow to net income attributable to controlling interest, and Adjusted EBITDA to net cash provided by operating activities, the most
directly comparable GAAP financial measures, on a historical basis, as applicable, for each of the periods indicated. The
Partnership believes that the presentation of gross margin, Adjusted EBITDA and distributable cash flow provides information useful
to investors in assessing its financial condition and results of operations. Gross margin, Adjusted EBITDA and distributable cash
flow should not be considered as alternatives to net income, operating income, revenue, cash from operations or any other measure
of financial performance or liquidity presented in accordance with GAAP. Gross margin, Adjusted EBITDA and distributable cash
flow have important limitations as analytical tools because they exclude some but not all items that affect the most directly
comparable GAAP measures. Additionally, because gross margin, Adjusted EBITDA and distributable cash flow may be defined
differently by other companies in the Partnership’s industry, its definitions of gross margin, Adjusted EBITDA and distributable cash
flow may not be comparable to similarly titled measures of other companies, thereby diminishing their utility.
3

Enable Midstream Highlights
► Announced a second quarter 2015 distribution of
$0.316/unit
► 1.1% increase over the first quarter 2015 distribution
► 10% increase over the partnership’s minimum quarter
distribution
► Reaffirming 2015 distribution growth guidance and
announcing guidance for continued distribution
growth through 2017
► Strong demand from producers, end users and
marketers continues to drive new midstream
infrastructure investments
► Announcing the Wildhorse plant, a new 200 MMcf/d
natural gas processing facility to be located in
Garvin County, Oklahoma
► Announcing an Enable Gas Transmission (EGT)
system expansion involving new shipper
commitments from the EGT open season in excess
of 175,000 dekatherms per day (Dth/d)
4
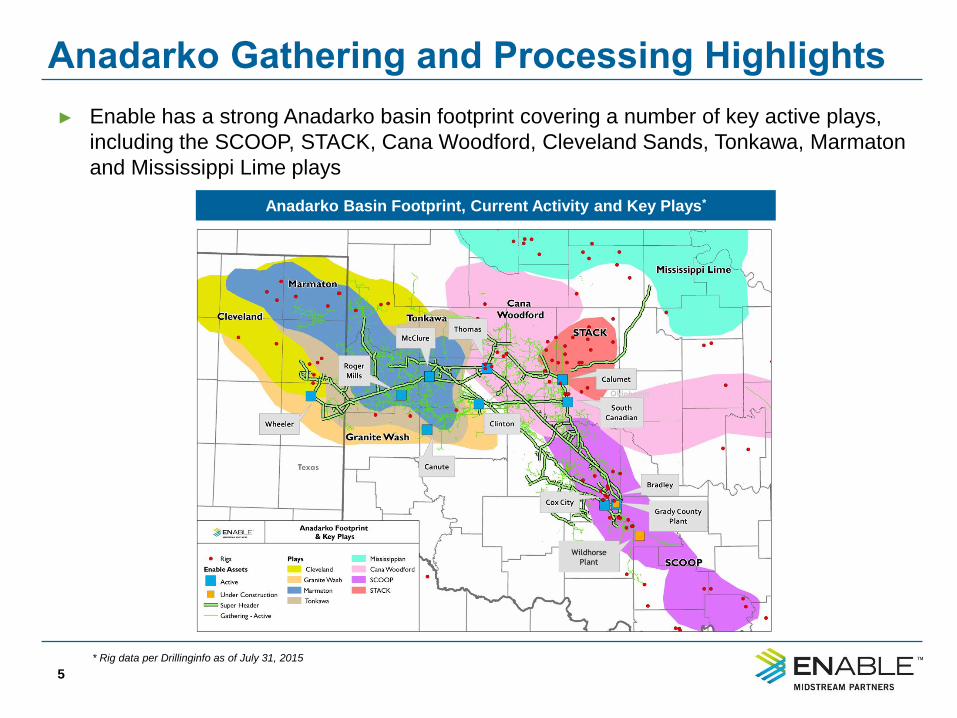
► Enable has a strong Anadarko basin footprint covering a number of key active plays,
including the SCOOP, STACK, Cana Woodford, Cleveland Sands, Tonkawa, Marmaton
and Mississippi Lime plays
5
Anadarko Basin Footprint, Current Activity and Key Plays*
Anadarko Gathering and Processing Highlights
* Rig data per Drillinginfo as of July 31, 2015
Wildhorse
Plant
Anadarko Gathering and Processing Highlights
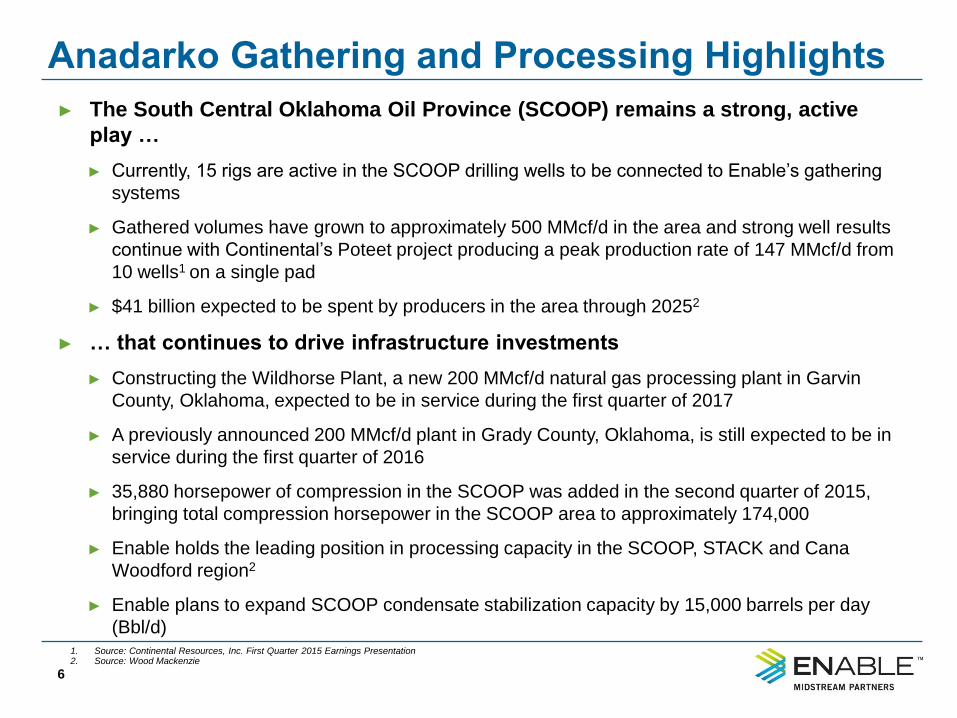
► The South Central Oklahoma Oil Province (SCOOP) remains a strong, active
play …
► Currently, 15 rigs are active in the SCOOP drilling wells to be connected to Enable’s gathering
systems
► Gathered volumes have grown to approximately 500 MMcf/d in the area and strong well results
continue with Continental’s Poteet project producing a peak production rate of 147 MMcf/d from
10 wells1 on a single pad
► $41 billion expected to be spent by producers in the area through 20252
► … that continues to drive infrastructure investments
► Constructing the Wildhorse Plant, a new 200 MMcf/d natural gas processing plant in Garvin
County, Oklahoma, expected to be in service during the first quarter of 2017
► A previously announced 200 MMcf/d plant in Grady County, Oklahoma, is still expected to be in
service during the first quarter of 2016
► 35,880 horsepower of compression in the SCOOP was added in the second quarter of 2015,
bringing total compression horsepower in the SCOOP area to approximately 174,000
► Enable holds the leading position in processing capacity in the SCOOP, STACK and Cana
Woodford region2
► Enable plans to expand SCOOP condensate stabilization capacity by 15,000 barrels per day
(Bbl/d)
6
1. Source: Continental Resources, Inc. First Quarter 2015 Earnings Presentation 2. Source: Wood Mackenzie
Anadarko Gathering and Processing Highlights
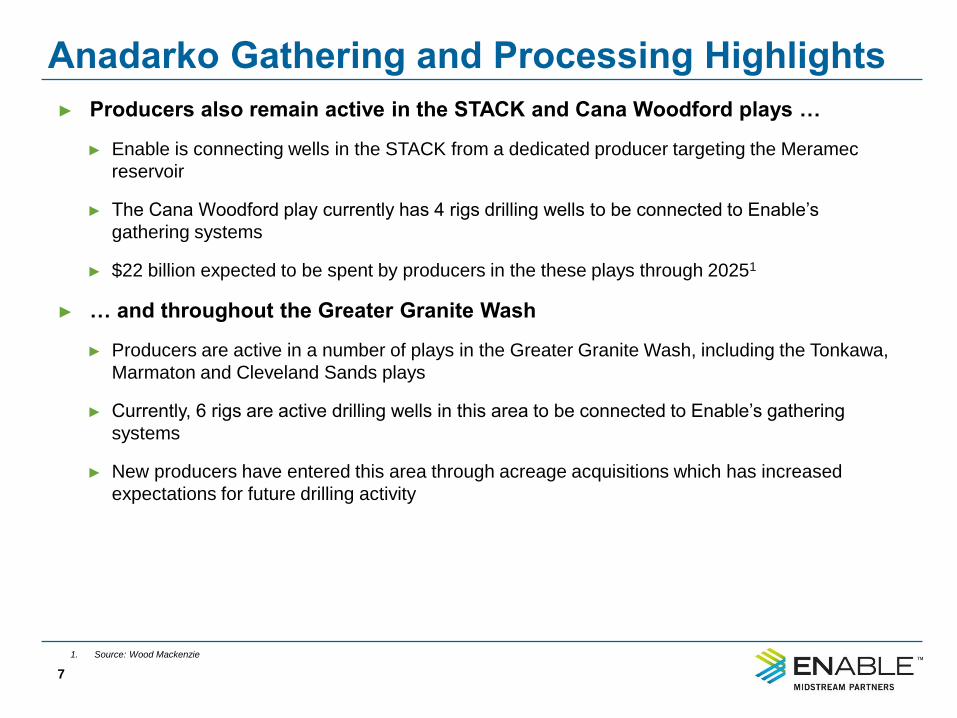
► Producers also remain active in the STACK and Cana Woodford plays …
► Enable is connecting wells in the STACK from a dedicated producer targeting the Meramec
reservoir
► The Cana Woodford play currently has 4 rigs drilling wells to be connected to Enable’s
gathering systems
► $22 billion expected to be spent by producers in the these plays through 20251
► … and throughout the Greater Granite Wash
► Producers are active in a number of plays in the Greater Granite Wash, including the Tonkawa,
Marmaton and Cleveland Sands plays
► Currently, 6 rigs are active drilling wells in this area to be connected to Enable’s gathering
systems
► New producers have entered this area through acreage acquisitions which has increased
expectations for future drilling activity
7
1. Source: Wood Mackenzie
Ark-La-Tex and Arkoma G&P Highlights
8
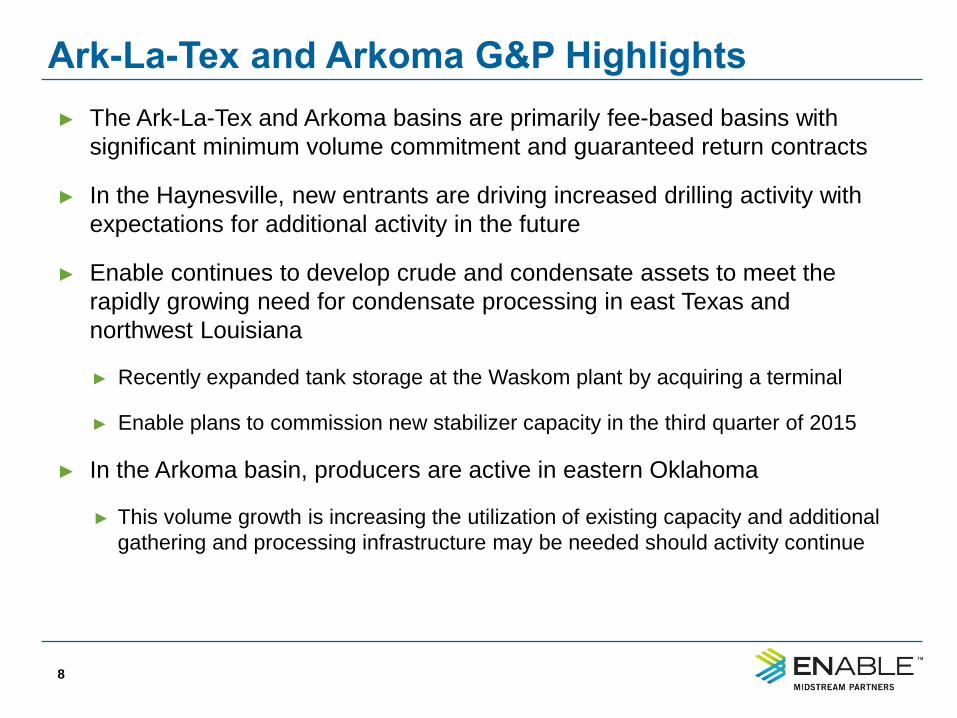
► The Ark-La-Tex and Arkoma basins are primarily fee-based basins with
significant minimum volume commitment and guaranteed return contracts
► In the Haynesville, new entrants are driving increased drilling activity with
expectations for additional activity in the future
► Enable continues to develop crude and condensate assets to meet the
rapidly growing need for condensate processing in east Texas and
northwest Louisiana
► Recently expanded tank storage at the Waskom plant by acquiring a terminal
► Enable plans to commission new stabilizer capacity in the third quarter of 2015
► In the Arkoma basin, producers are active in eastern Oklahoma
► This volume growth is increasing the utilization of existing capacity and additional
gathering and processing infrastructure may be needed should activity continue
Bakken Crude Gathering Highlights
9
1. Source: North Dakota’s Department of Mineral Resources website as of April 28, 2015
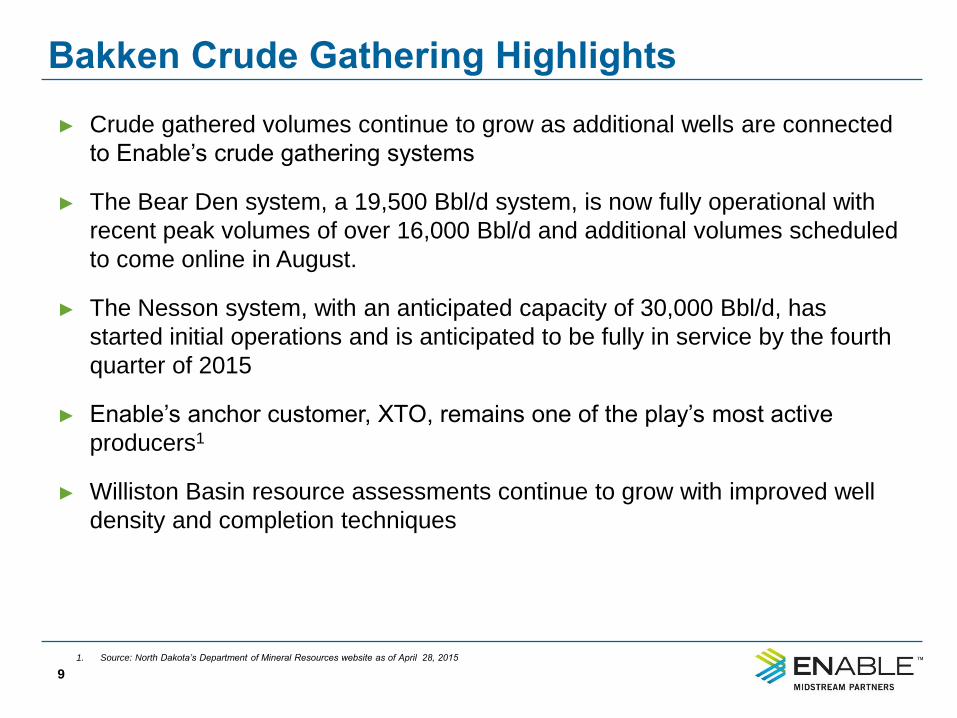
► Crude gathered volumes continue to grow as additional wells are connected
to Enable’s crude gathering systems
► The Bear Den system, a 19,500 Bbl/d system, is now fully operational with
recent peak volumes of over 16,000 Bbl/d and additional volumes scheduled
to come online in August.
► The Nesson system, with an anticipated capacity of 30,000 Bbl/d, has
started initial operations and is anticipated to be fully in service by the fourth
quarter of 2015
► Enable’s anchor customer, XTO, remains one of the play’s most active
producers1
► Williston Basin resource assessments continue to grow with improved well
density and completion techniques
Transportation and Storage Highlights
10
Supply Solutions
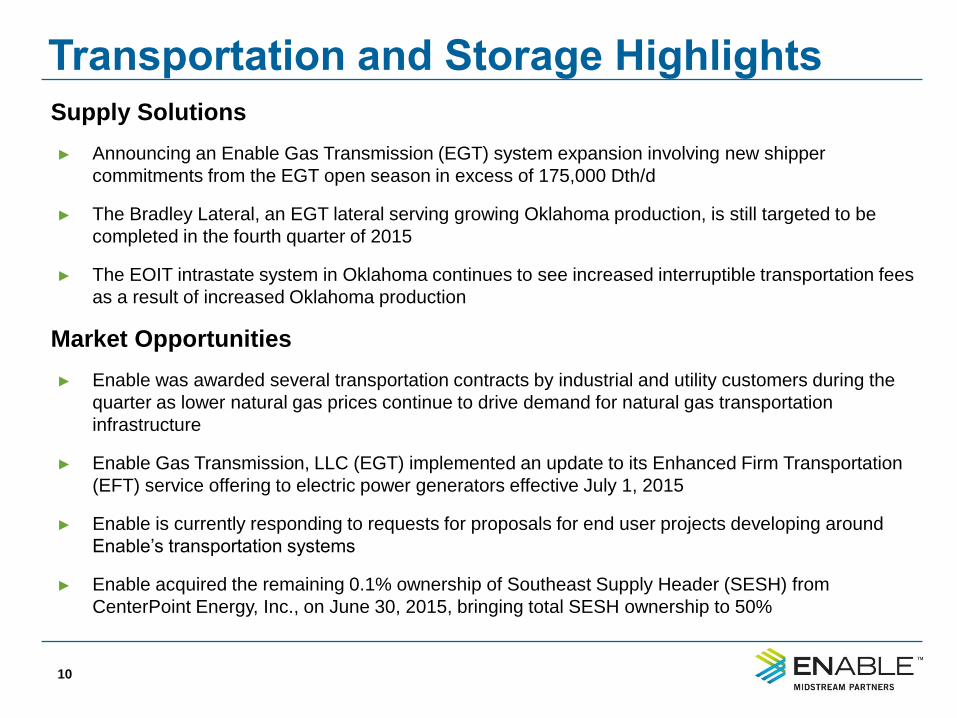
► Announcing an Enable Gas Transmission (EGT) system expansion involving new shipper
commitments from the EGT open season in excess of 175,000 Dth/d
► The Bradley Lateral, an EGT lateral serving growing Oklahoma production, is still targeted to be
completed in the fourth quarter of 2015
► The EOIT intrastate system in Oklahoma continues to see increased interruptible transportation fees
as a result of increased Oklahoma production
Market Opportunities
► Enable was awarded several transportation contracts by industrial and utility customers during the
quarter as lower natural gas prices continue to drive demand for natural gas transportation
infrastructure
► Enable Gas Transmission, LLC (EGT) implemented an update to its Enhanced Firm Transportation
(EFT) service offering to electric power generators effective July 1, 2015
► Enable is currently responding to requests for proposals for end user projects developing around
Enable’s transportation systems
► Enable acquired the remaining 0.1% ownership of Southeast Supply Header (SESH) from
CenterPoint Energy, Inc., on June 30, 2015, bringing total SESH ownership to 50%
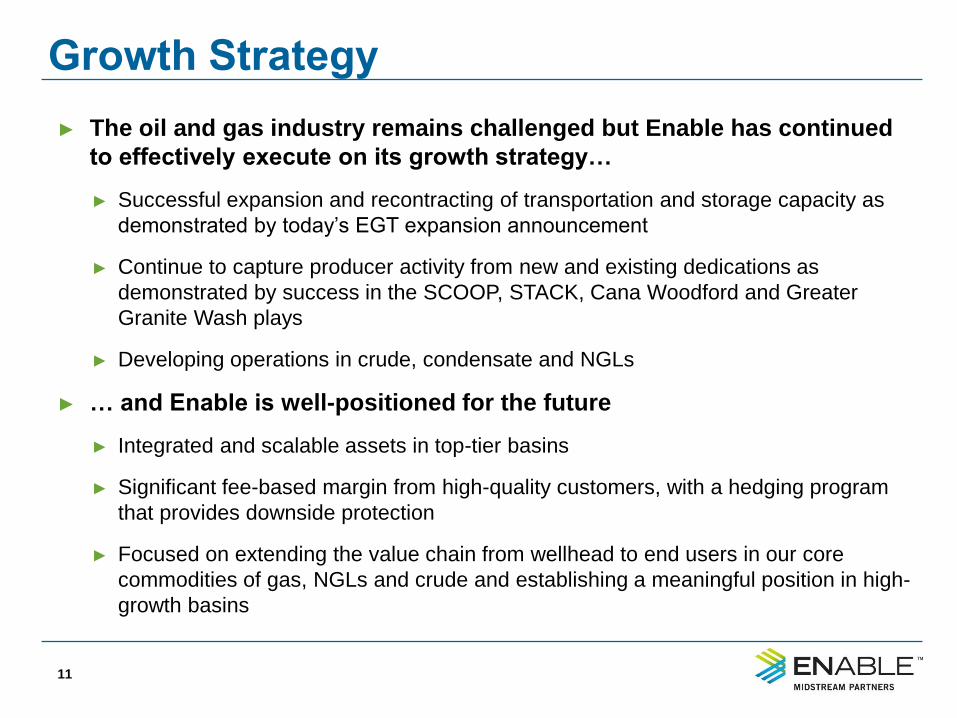
Growth Strategy
11
► The oil and gas industry remains challenged but Enable has continued
to effectively execute on its growth strategy…
► Successful expansion and recontracting of transportation and storage capacity as
demonstrated by today’s EGT expansion announcement
► Continue to capture producer activity from new and existing dedications as
demonstrated by success in the SCOOP, STACK, Cana Woodford and Greater
Granite Wash plays
► Developing operations in crude, condensate and NGLs
► … and Enable is well-positioned for the future
► Integrated and scalable assets in top-tier basins
► Significant fee-based margin from high-quality customers, with a hedging program
that provides downside protection
► Focused on extending the value chain from wellhead to end users in our core
commodities of gas, NGLs and crude and establishing a meaningful position in high-
growth basins
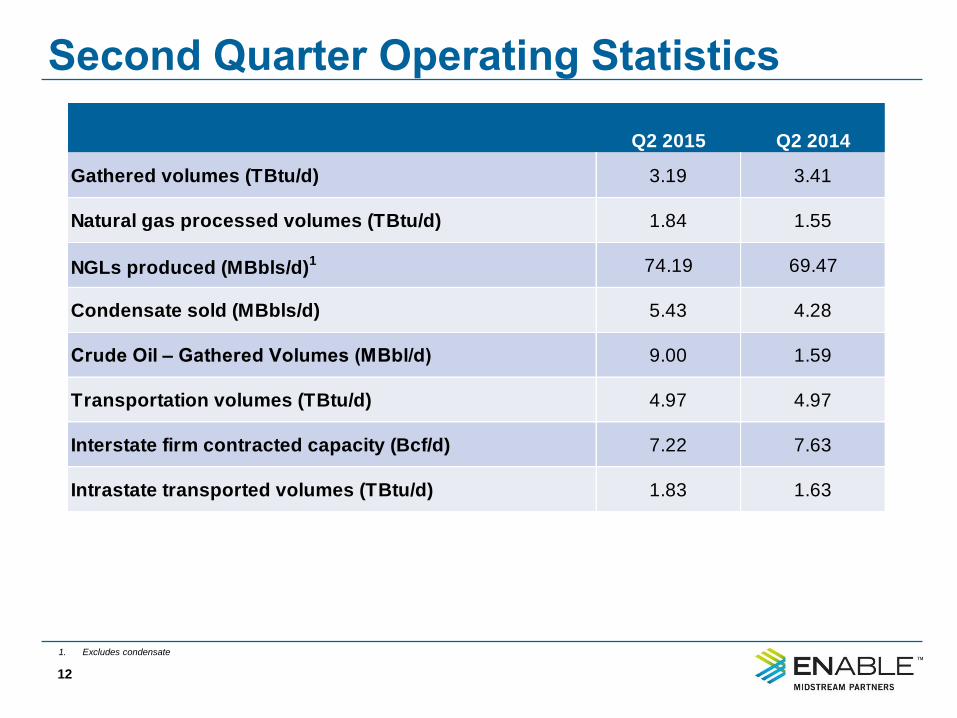
Second Quarter Operating Statistics
1. Excludes condensate
Q2 2015 Q2 2014
Gathered volumes (TBtu/d) 3.19 3.41
Natural gas processed volumes (TBtu/d) 1.84 1.55
NGLs produced (MBbls/d)1 74.19 69.47
Condensate sold (MBbls/d) 5.43 4.28
Crude Oil – Gathered Volumes (MBbl/d) 9.00 1.59
Transportation volumes (TBtu/d) 4.97 4.97
Interstate firm contracted capacity (Bcf/d) 7.22 7.63
Intrastate transported volumes (TBtu/d) 1.83 1.63
12
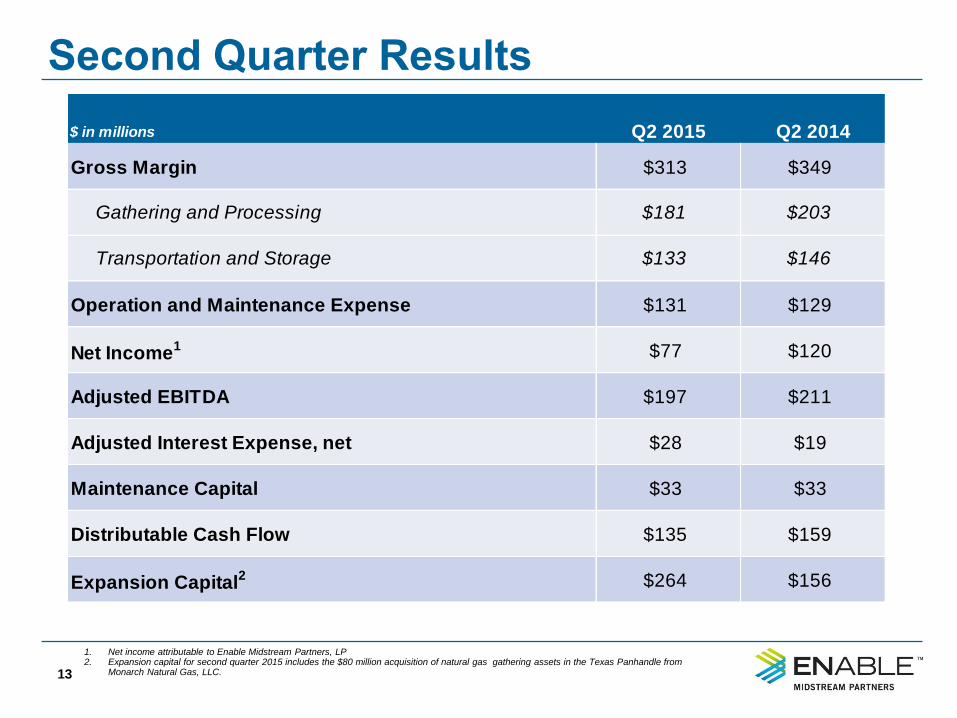
Second Quarter Results
1. Net income attributable to Enable Midstream Partners, LP 2. Expansion capital for second quarter 2015 includes the $80 million acquisition of natural gas gathering assets in the Texas Panhandle from
Monarch Natural Gas, LLC.
$ in millions Q2 2015 Q2 2014
Gross Margin $313 $349
Gathering and Processing $181 $203
Transportation and Storage $133 $146
Operation and Maintenance Expense $131 $129
Net Income1 $77 $120
Adjusted EBITDA $197 $211
Adjusted Interest Expense, net $28 $19
Maintenance Capital $33 $33
Distributable Cash Flow $135 $159
Expansion Capital2 $264 $156
13
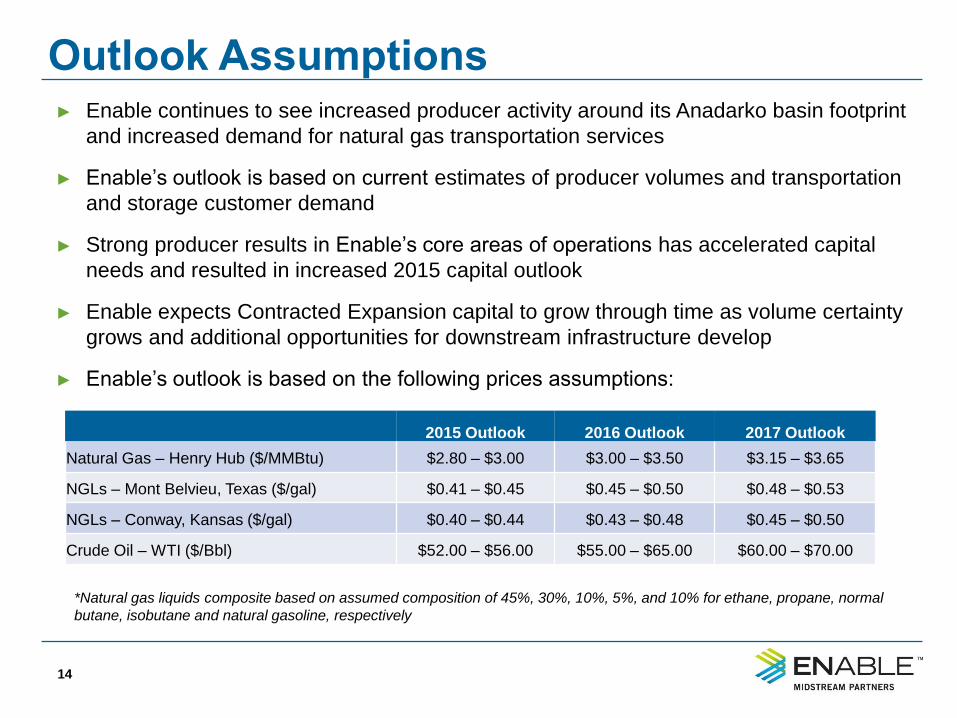
Outlook Assumptions
14
► Enable continues to see increased producer activity around its Anadarko basin footprint
and increased demand for natural gas transportation services
► Enable’s outlook is based on current estimates of producer volumes and transportation
and storage customer demand
► Strong producer results in Enable’s core areas of operations has accelerated capital
needs and resulted in increased 2015 capital outlook
► Enable expects Contracted Expansion capital to grow through time as volume certainty
grows and additional opportunities for downstream infrastructure develop
► Enable’s outlook is based on the following prices assumptions:
*Natural gas liquids composite based on assumed composition of 45%, 30%, 10%, 5%, and 10% for ethane, propane, normal
butane, isobutane and natural gasoline, respectively
2015 Outlook 2016 Outlook 2017 Outlook
Natural Gas – Henry Hub ($/MMBtu) $2.80 – $3.00 $3.00 – $3.50 $3.15 – $3.65
NGLs – Mont Belvieu, Texas ($/gal) $0.41 – $0.45 $0.45 – $0.50 $0.48 – $0.53
NGLs – Conway, Kansas ($/gal) $0.40 – $0.44 $0.43 – $0.48 $0.45 – $0.50
Crude Oil – WTI ($/Bbl) $52.00 – $56.00 $55.00 – $65.00 $60.00 – $70.00
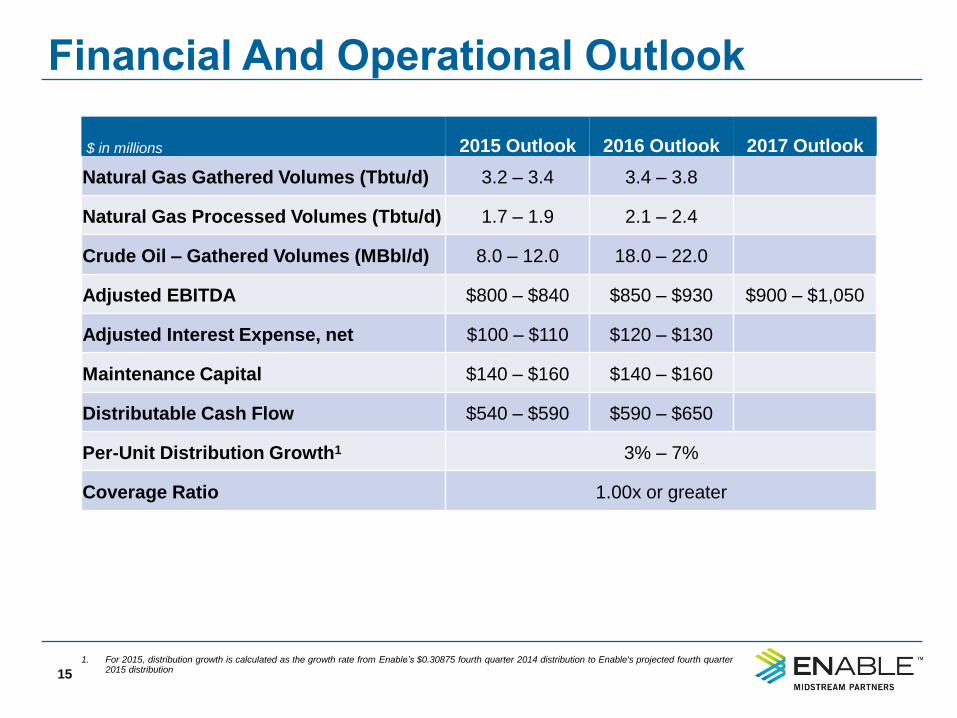
Financial And Operational Outlook
15
1. For 2015, distribution growth is calculated as the growth rate from Enable’s $0.30875 fourth quarter 2014 distribution to Enable's projected fourth quarter 2015 distribution
$ in millions 2015 Outlook 2016 Outlook 2017 Outlook
Natural Gas Gathered Volumes (Tbtu/d) 3.2 – 3.4 3.4 – 3.8
Natural Gas Processed Volumes (Tbtu/d) 1.7 – 1.9 2.1 – 2.4
Crude Oil – Gathered Volumes (MBbl/d) 8.0 – 12.0 18.0 – 22.0
Adjusted EBITDA $800 – $840 $850 – $930 $900 – $1,050
Adjusted Interest Expense, net $100 – $110 $120 – $130
Maintenance Capital $140 – $160 $140 – $160
Distributable Cash Flow $540 – $590 $590 – $650
Per-Unit Distribution Growth1 3% – 7%
Coverage Ratio 1.00x or greater

Expansion Capital Outlook
16
► Contracted Expansion includes:
► Gathering, compression and processing infrastructure to support projected volume growth from
current contracts and acreage dedications, including infrastructure in the SCOOP, STACK,
Northwest Cana, Bakken and Greater Granite Wash plays
► Identified Opportunities include transportation and G&P projects in late-stage negotiation,
such as:
► Additional Bakken crude gathering expansions
► Anadarko gas gathering and processing expansions
► New end-user transportation service and market access pipeline opportunities
► NGL transportation infrastructure
$ in millions 2015 Outlook 2016 Outlook 2017 Outlook
Contracted Expansion $700 – $900 $700 – $900 $200 – $500
Acquisitions $80 N/A N/A
Identified Opportunities $0 – $100 $300 – $500 $400 – $600
Total $780 – $1,080 $1,000 – $1,400 $600 – $1,100
53%
28%
10%
9%
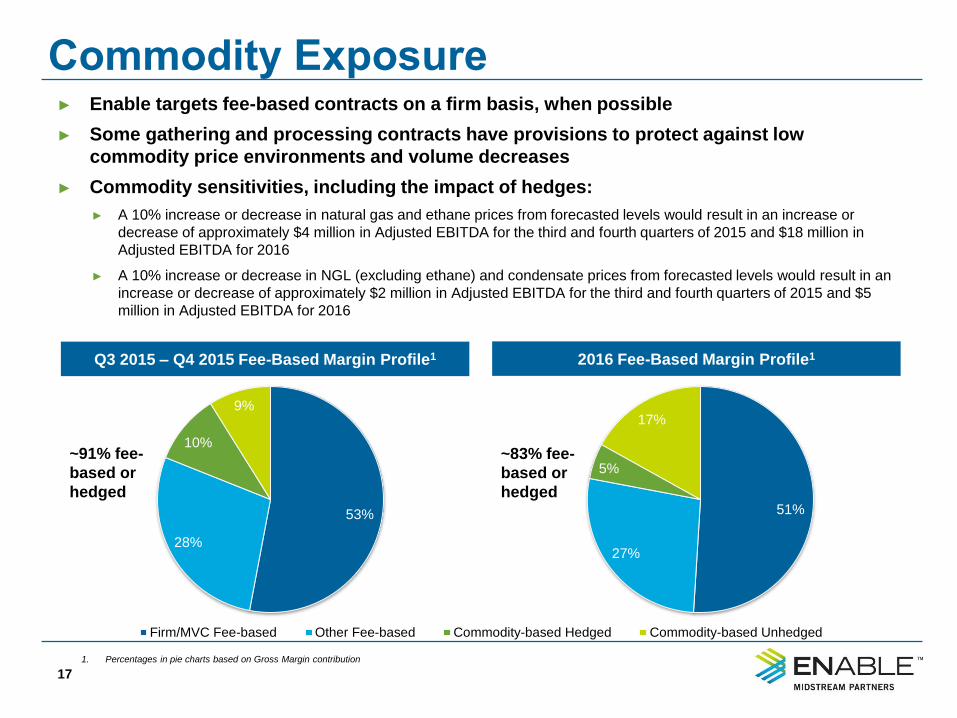
Commodity Exposure ► Enable targets fee-based contracts on a firm basis, when possible
► Some gathering and processing contracts have provisions to protect against low
commodity price environments and volume decreases
► Commodity sensitivities, including the impact of hedges:
► A 10% increase or decrease in natural gas and ethane prices from forecasted levels would result in an increase or
decrease of approximately $4 million in Adjusted EBITDA for the third and fourth quarters of 2015 and $18 million in
Adjusted EBITDA for 2016
► A 10% increase or decrease in NGL (excluding ethane) and condensate prices from forecasted levels would result in an
increase or decrease of approximately $2 million in Adjusted EBITDA for the third and fourth quarters of 2015 and $5
million in Adjusted EBITDA for 2016
1. Percentages in pie charts based on Gross Margin contribution
Q3 2015 – Q4 2015 Fee-Based Margin Profile1
17
~91% fee-
based or
hedged
2016 Fee-Based Margin Profile1
51%
27%
5%
17%
53% 30% 11% 6% Firm/MVC Fee-based Other Fee-based Commodity-based Hedged Commodity-based Unhedged
~83% fee-
based or
hedged
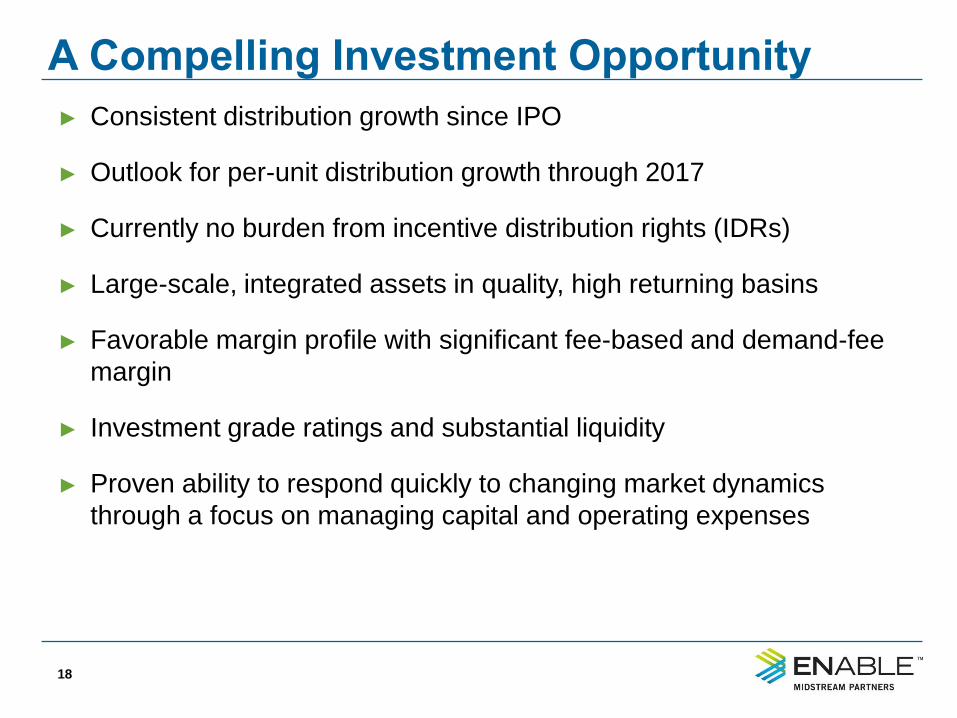
A Compelling Investment Opportunity
18
► Consistent distribution growth since IPO
► Outlook for per-unit distribution growth through 2017
► Currently no burden from incentive distribution rights (IDRs)
► Large-scale, integrated assets in quality, high returning basins
► Favorable margin profile with significant fee-based and demand-fee
margin
► Investment grade ratings and substantial liquidity
► Proven ability to respond quickly to changing market dynamics
through a focus on managing capital and operating expenses
Question and Answer Question & Answer
19
Appendix Appendix
20
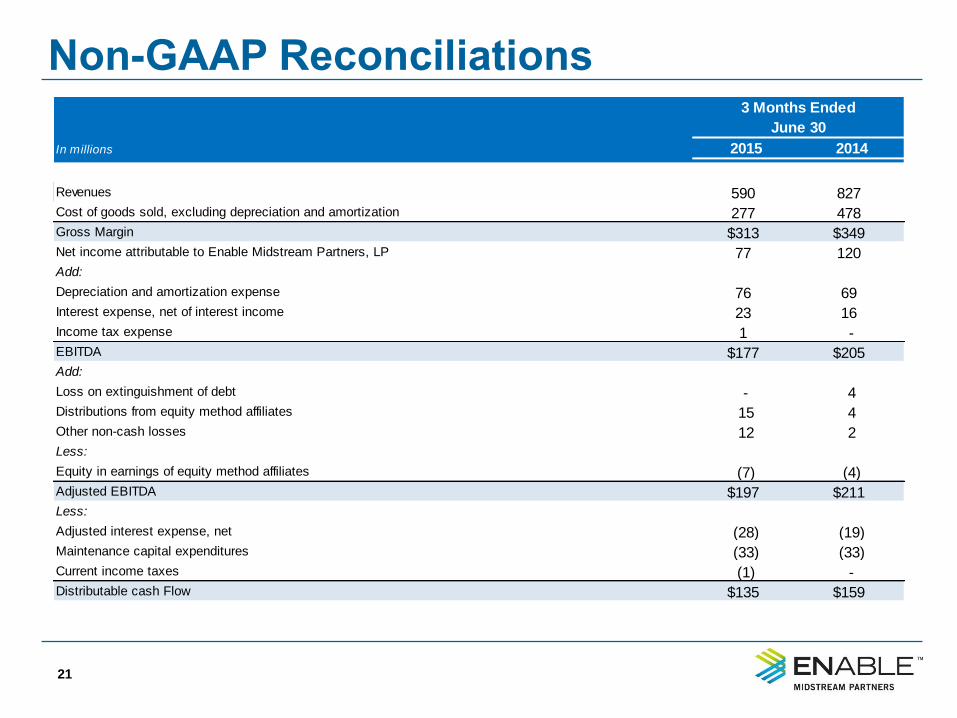
Non-GAAP Reconciliations
21
In millions 2015 2014
Revenues 590 827
Cost of goods sold, excluding depreciation and amortization 277 478
Gross Margin $313 $349
Net income attributable to Enable Midstream Partners, LP 77 120
Add:
Depreciation and amortization expense 76 69
Interest expense, net of interest income 23 16
Income tax expense 1 -
EBITDA $177 $205
Add:
Loss on extinguishment of debt - 4
Distributions from equity method affiliates 15 4
Other non-cash losses 12 2
Less:
Equity in earnings of equity method affiliates (7) (4)
Adjusted EBITDA $197 $211
Less:
Adjusted interest expense, net (28) (19)
Maintenance capital expenditures (33) (33)
Current income taxes (1) -
Distributable cash Flow $135 $159
June 30
3 Months Ended
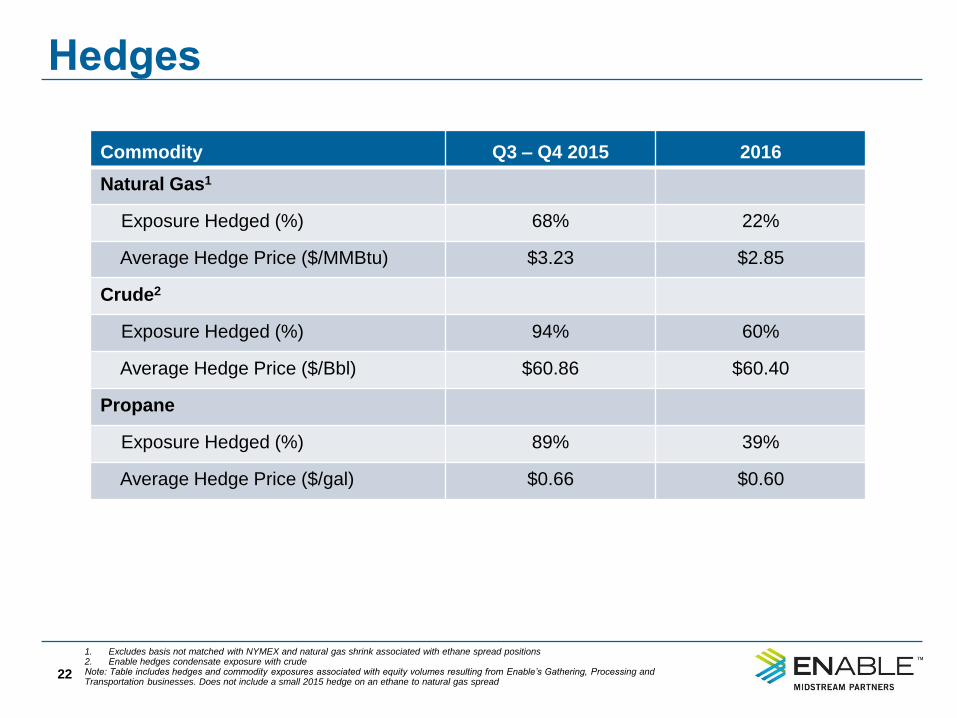
Hedges
22
Commodity Q3 – Q4 2015 2016
Natural Gas1
Exposure Hedged (%) 68% 22%
Average Hedge Price ($/MMBtu) $3.23 $2.85
Crude2
Exposure Hedged (%) 94% 60%
Average Hedge Price ($/Bbl) $60.86 $60.40
Propane
Exposure Hedged (%) 89% 39%
Average Hedge Price ($/gal) $0.66 $0.60
1. Excludes basis not matched with NYMEX and natural gas shrink associated with ethane spread positions 2. Enable hedges condensate exposure with crude Note: Table includes hedges and commodity exposures associated with equity volumes resulting from Enable’s Gathering, Processing and Transportation businesses. Does not include a small 2015 hedge on an ethane to natural gas spread