Embed Size (px)
Citation preview

Prepared for
SKM Pty Ltd
October 2007
EMU SWAMP DAM PROJECT
SOIL AND LAND SUITABILITY
PROPOSED EMU SWAMP DAM AREA SOIL AND LAND SUITABILITY
DOCUMENT CONTROL Document: Emu Swamp Soil Survey.doc
Title: Soils And Land Suitability Survey Of the proposed Emu Swamp Dam area and pipeline route
Project Manager:
Graham Tuck
Author: Graham Tuck Client: SKM Pty Ltd Client Contact: Niall Carey Client Reference:
Emu Swamp Project - Soils
Synopsis: Document describes the soils and existing land suitability
Revision Number
Date Checked by
1 4/9/07 Draft for Client Review 3 23/9/07 After NC comments Final 27 Nov 2007 G Tuck
1
GTES PTY LTD
1 EXECUTIVE SUMMARY 3
2 BACKGROUND 6 2.1 LOCATION OF SURVEY AREA 6 2.2 EXISTING LAND USE 6 2.3 SCOPE OF WORK 7 2.4 SURVEY STANDARDS 7 2.5 LAND SUITABILITY ASSESSMENT 8 2.6 LAND RESOURCE INFORMATION REVIEW 8 2.7 SURVEY METHODOLOGY 11 2.8 SOIL ANALYSIS 11
3 EMU SWAMP DAM AREA SOILS 12 3.1 OVERVIEW 12 3.2 SOIL TYPES 14
A Uniform loamy sands associated with alluvial channels. 14 B Uniform coarse loamy sands with moderate slope and granite outcropping. 18 C Uniform coarse loamy sands on low slopes 20
3.3 TOPSOIL MANAGEMENT 23 4 SOILS OF THE PROPOSED PIPELINE ROUTE 24
4.1 BACKGROUND 24 4.2 ASSESSMENT METHODOLOGY 24 4.3 LAND TYPES ALONG PIPELINE ROUTE 25
Soil Mapping units 25 Erosion risk 27
5 AGRICULTURAL LAND SUITABILITY 29 5.1 BACKGROUND 29 5.2 LAND SUITABILITY FOR CROPPING 30 5.3 SUITABILITY FOR GRAZING 31 5.4 LAND SUITABILITY SUMMARY 32 5.5 GOOD QUALITY AGRICULTURAL LAND 35 5.6 GQAL CONCLUSION 37
6 CONSTRUCTION MANAGEMENT 38 6.1 MAJOR ENVIRONMENTAL RISKS FROM SOIL DISTURBANCE 38
Dam Inundation Area 38 Proposed Pipeline Routes 38
6.2 ENVIRONMENTAL CONTROLS DURING CONSTRUCTION (ALL AREAS) 38 7 REFERENCES 41
ANALYTE 8
2
GTES PTY LTD
LIST OF FIGURES
Figure 1 Location Map - Emu Swamp Project Figure 2 Regional Soil Associations of Powell (1975) Figure 3 Soils of the Inundation Area Figure 4 Soils along Pipeline Routes Figure 5 Cropping Suitability Map – Inundation Area Figure 6 Grazing Suitability Map – Inundation Area LIST OF ATTACHMENTS Attachment 1 Survey Sites - Location and field descriptions Attachment 2 Analytical Data and Laboratory Details
3
GTES PTY LTD
1 EXECUTIVE SUMMARY
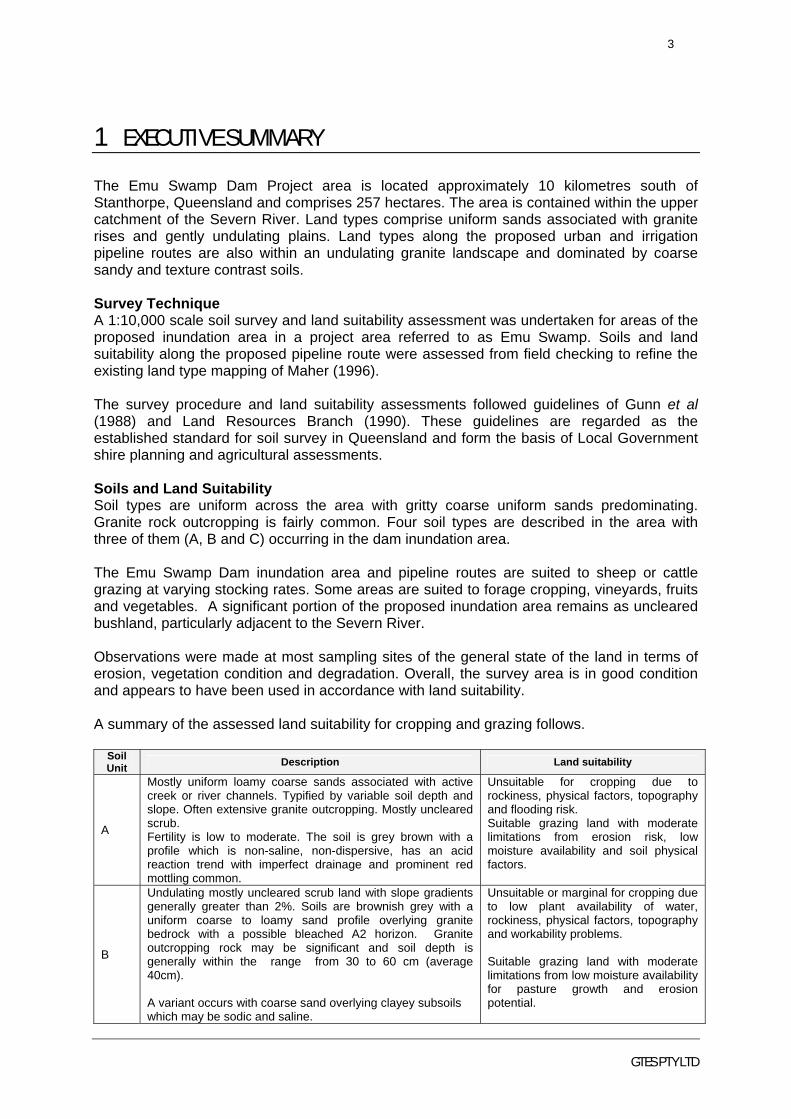
The Emu Swamp Dam Project area is located approximately 10 kilometres south of Stanthorpe, Queensland and comprises 257 hectares. The area is contained within the upper catchment of the Severn River. Land types comprise uniform sands associated with granite rises and gently undulating plains. Land types along the proposed urban and irrigation pipeline routes are also within an undulating granite landscape and dominated by coarse sandy and texture contrast soils. Survey Technique A 1:10,000 scale soil survey and land suitability assessment was undertaken for areas of the proposed inundation area in a project area referred to as Emu Swamp. Soils and land suitability along the proposed pipeline route were assessed from field checking to refine the existing land type mapping of Maher (1996). The survey procedure and land suitability assessments followed guidelines of Gunn et al (1988) and Land Resources Branch (1990). These guidelines are regarded as the established standard for soil survey in Queensland and form the basis of Local Government shire planning and agricultural assessments. Soils and Land Suitability Soil types are uniform across the area with gritty coarse uniform sands predominating. Granite rock outcropping is fairly common. Four soil types are described in the area with three of them (A, B and C) occurring in the dam inundation area. The Emu Swamp Dam inundation area and pipeline routes are suited to sheep or cattle grazing at varying stocking rates. Some areas are suited to forage cropping, vineyards, fruits and vegetables. A significant portion of the proposed inundation area remains as uncleared bushland, particularly adjacent to the Severn River. Observations were made at most sampling sites of the general state of the land in terms of erosion, vegetation condition and degradation. Overall, the survey area is in good condition and appears to have been used in accordance with land suitability. A summary of the assessed land suitability for cropping and grazing follows.
Soil Unit Description Land suitability
A
Mostly uniform loamy coarse sands associated with active creek or river channels. Typified by variable soil depth and slope. Often extensive granite outcropping. Mostly uncleared scrub. Fertility is low to moderate. The soil is grey brown with a profile which is non-saline, non-dispersive, has an acid reaction trend with imperfect drainage and prominent red mottling common.
Unsuitable for cropping due to rockiness, physical factors, topography and flooding risk. Suitable grazing land with moderate limitations from erosion risk, low moisture availability and soil physical factors.
B
Undulating mostly uncleared scrub land with slope gradients generally greater than 2%. Soils are brownish grey with a uniform coarse to loamy sand profile overlying granite bedrock with a possible bleached A2 horizon. Granite outcropping rock may be significant and soil depth is generally within the range from 30 to 60 cm (average 40cm). A variant occurs with coarse sand overlying clayey subsoils which may be sodic and saline.
Unsuitable or marginal for cropping due to low plant availability of water, rockiness, physical factors, topography and workability problems. Suitable grazing land with moderate limitations from low moisture availability for pasture growth and erosion potential.
4
GTES PTY LTD
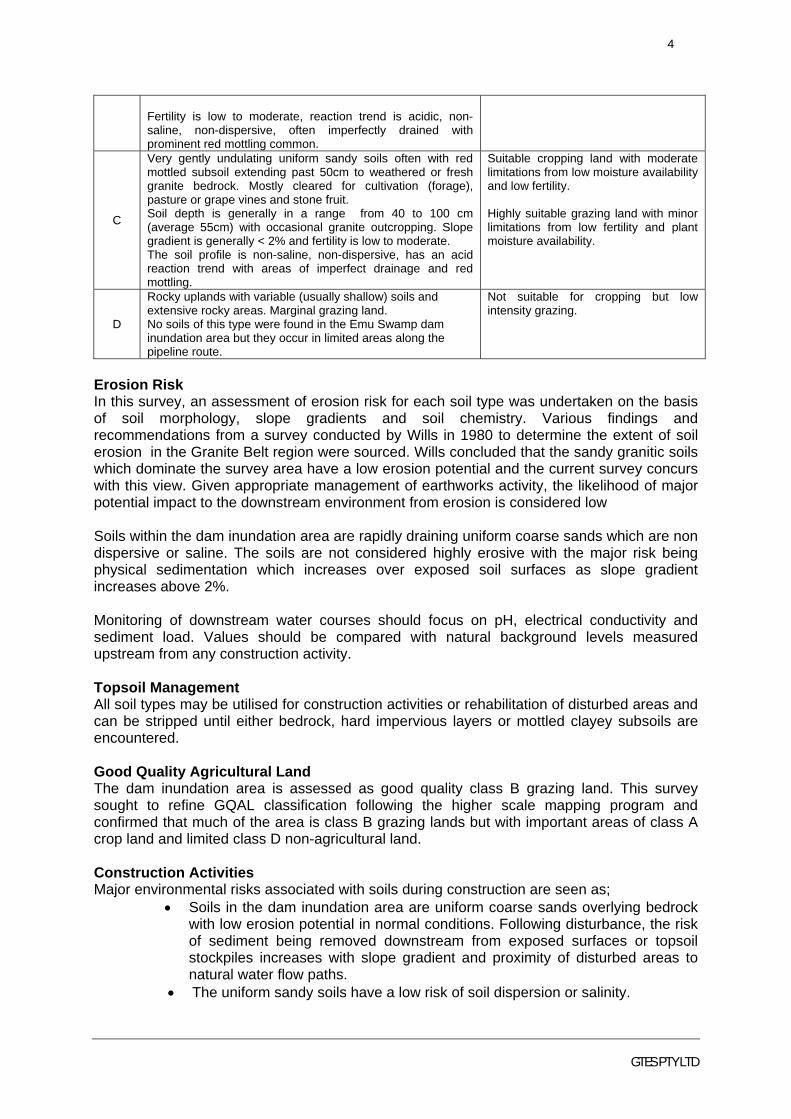
Fertility is low to moderate, reaction trend is acidic, non-saline, non-dispersive, often imperfectly drained with prominent red mottling common.
C
Very gently undulating uniform sandy soils often with red mottled subsoil extending past 50cm to weathered or fresh granite bedrock. Mostly cleared for cultivation (forage), pasture or grape vines and stone fruit. Soil depth is generally in a range from 40 to 100 cm (average 55cm) with occasional granite outcropping. Slope gradient is generally < 2% and fertility is low to moderate. The soil profile is non-saline, non-dispersive, has an acid reaction trend with areas of imperfect drainage and red mottling.
Suitable cropping land with moderate limitations from low moisture availability and low fertility. Highly suitable grazing land with minor limitations from low fertility and plant moisture availability.
D
Rocky uplands with variable (usually shallow) soils and extensive rocky areas. Marginal grazing land. No soils of this type were found in the Emu Swamp dam inundation area but they occur in limited areas along the pipeline route.
Not suitable for cropping but low intensity grazing.
Erosion Risk In this survey, an assessment of erosion risk for each soil type was undertaken on the basis of soil morphology, slope gradients and soil chemistry. Various findings and recommendations from a survey conducted by Wills in 1980 to determine the extent of soil erosion in the Granite Belt region were sourced. Wills concluded that the sandy granitic soils which dominate the survey area have a low erosion potential and the current survey concurs with this view. Given appropriate management of earthworks activity, the likelihood of major potential impact to the downstream environment from erosion is considered low Soils within the dam inundation area are rapidly draining uniform coarse sands which are non dispersive or saline. The soils are not considered highly erosive with the major risk being physical sedimentation which increases over exposed soil surfaces as slope gradient increases above 2%. Monitoring of downstream water courses should focus on pH, electrical conductivity and sediment load. Values should be compared with natural background levels measured upstream from any construction activity. Topsoil Management All soil types may be utilised for construction activities or rehabilitation of disturbed areas and can be stripped until either bedrock, hard impervious layers or mottled clayey subsoils are encountered. Good Quality Agricultural Land The dam inundation area is assessed as good quality class B grazing land. This survey sought to refine GQAL classification following the higher scale mapping program and confirmed that much of the area is class B grazing lands but with important areas of class A crop land and limited class D non-agricultural land. Construction Activities Major environmental risks associated with soils during construction are seen as;
• Soils in the dam inundation area are uniform coarse sands overlying bedrock with low erosion potential in normal conditions. Following disturbance, the risk of sediment being removed downstream from exposed surfaces or topsoil stockpiles increases with slope gradient and proximity of disturbed areas to natural water flow paths.
• The uniform sandy soils have a low risk of soil dispersion or salinity.

5
GTES PTY LTD
• While the uniform sands are common along proposed pipeline routes, an increased environmental risk is noted from the likely presence of texture contrast soils with possible increased salinity in the clay subsoil. Chemical data indicate that some of these soils may be approaching levels considered dispersive and saline. Contaminated runoff may cause downstream impacts from sedimentation and salinity.
Suggested management controls for construction activities are included in Section 6.
6
GTES PTY LTD
2 BACKGROUND
2.1 LOCATION OF SURVEY AREA
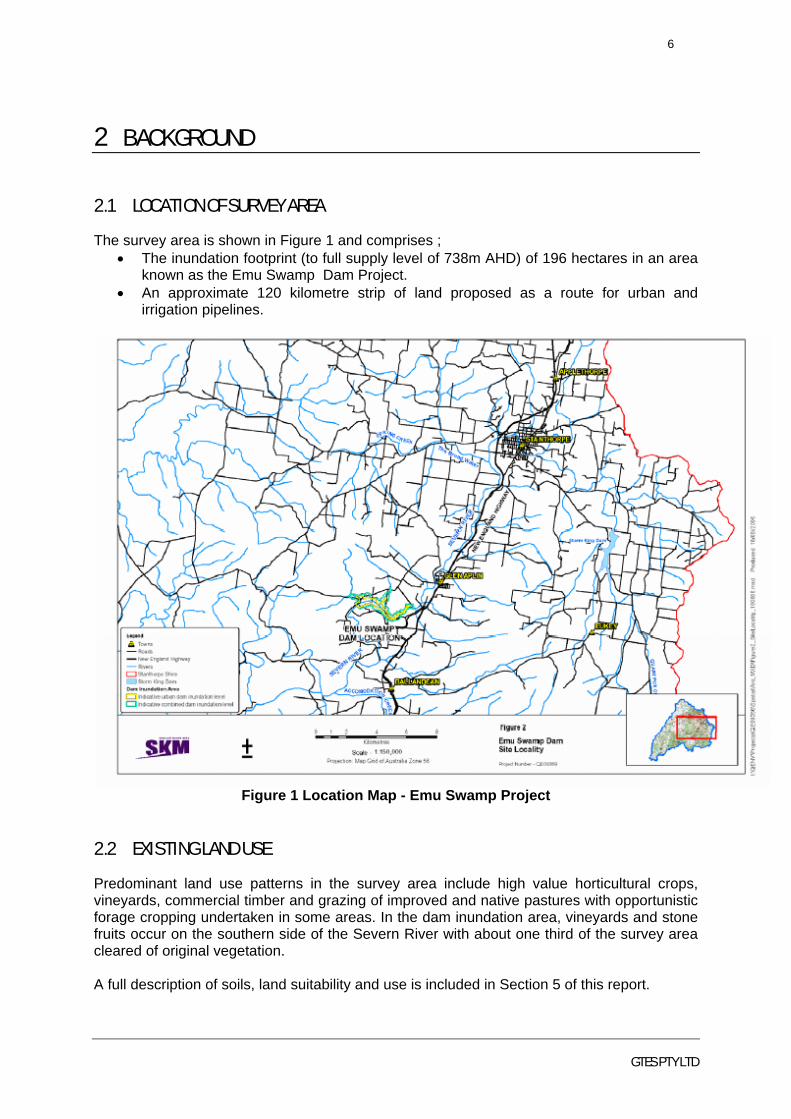
The survey area is shown in Figure 1 and comprises ; • The inundation footprint (to full supply level of 738m AHD) of 196 hectares in an area
known as the Emu Swamp Dam Project. • An approximate 120 kilometre strip of land proposed as a route for urban and
irrigation pipelines.
Figure 1 Location Map - Emu Swamp Project
2.2 EXISTING LAND USE
Predominant land use patterns in the survey area include high value horticultural crops, vineyards, commercial timber and grazing of improved and native pastures with opportunistic forage cropping undertaken in some areas. In the dam inundation area, vineyards and stone fruits occur on the southern side of the Severn River with about one third of the survey area cleared of original vegetation. A full description of soils, land suitability and use is included in Section 5 of this report.
7
GTES PTY LTD
2.3 SCOPE OF WORK
SKM has been commissioned to undertake an EIS to review the Emu Creek urban supply / irrigation dam proposal. The EIS support work proposed by the consultant primarily involves;
• Collation and review of available background soils and land suitability data, • description of regional geology, • preparation of a soils and land inventory / map and assessments of land suitability, • assessment of quality/ quantities of useable topsoil / subsoil, • identification of problems from physical characteristics, sodicity, salinity and erosion
potential, • describe possible impacts, in particular erosion rates and effects, • outline mitigation measures to control possible soil related impacts from salinity,
acidity, sodium and sedimentation. • A detailed assessment of soils in the dam area to confirm agricultural land suitability
given that it is all assessed as Area B GQAL – potentially good agricultural land and, • Describe landforms and soil types together with relevant information of land suitability
and risks to the environment along proposed pipeline routes. The land inventory study project was managed by GTES Pty Ltd and conducted by environmental scientist Mr Graham Tuck. This project does not include soils suitability information for engineering requirements such as construction of facilities.
2.4 SURVEY STANDARDS
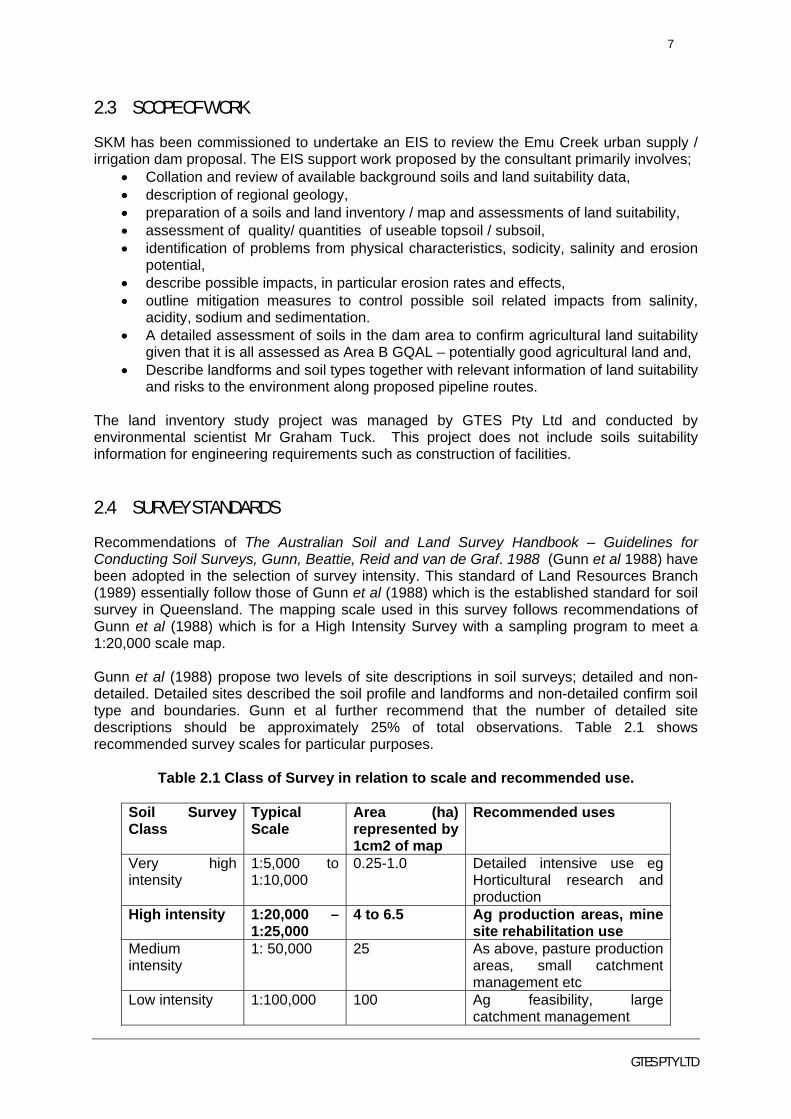
Recommendations of The Australian Soil and Land Survey Handbook – Guidelines for Conducting Soil Surveys, Gunn, Beattie, Reid and van de Graf. 1988 (Gunn et al 1988) have been adopted in the selection of survey intensity. This standard of Land Resources Branch (1989) essentially follow those of Gunn et al (1988) which is the established standard for soil survey in Queensland. The mapping scale used in this survey follows recommendations of Gunn et al (1988) which is for a High Intensity Survey with a sampling program to meet a 1:20,000 scale map. Gunn et al (1988) propose two levels of site descriptions in soil surveys; detailed and non-detailed. Detailed sites described the soil profile and landforms and non-detailed confirm soil type and boundaries. Gunn et al further recommend that the number of detailed site descriptions should be approximately 25% of total observations. Table 2.1 shows recommended survey scales for particular purposes.
Table 2.1 Class of Survey in relation to scale and recommended use.
Soil Survey Class
Typical Scale
Area (ha) represented by 1cm2 of map
Recommended uses
Very high intensity
1:5,000 to 1:10,000
0.25-1.0 Detailed intensive use eg Horticultural research and production
High intensity 1:20,000 – 1:25,000
4 to 6.5 Ag production areas, mine site rehabilitation use
Medium intensity
1: 50,000 25 As above, pasture production areas, small catchment management etc
Low intensity 1:100,000 100 Ag feasibility, large catchment management
8
GTES PTY LTD
Reconnaissance 1:250,000 to 1:500,000
625 to 2,500 Ag development potential, pasture production areas etc
Synthesis 1:2,500,000 40,000 National resource inventory The guidelines suggest that 10 sites per 100 hectares is suitable for a 1:20,000 scale survey depending on pre existing resource information as well as the local knowledge and experience of the surveyor. Further, the guideline also recommends that between 1 and 5% of all sites are sampled and subject to laboratory analysis.
2.5 LAND SUITABILITY ASSESSMENT
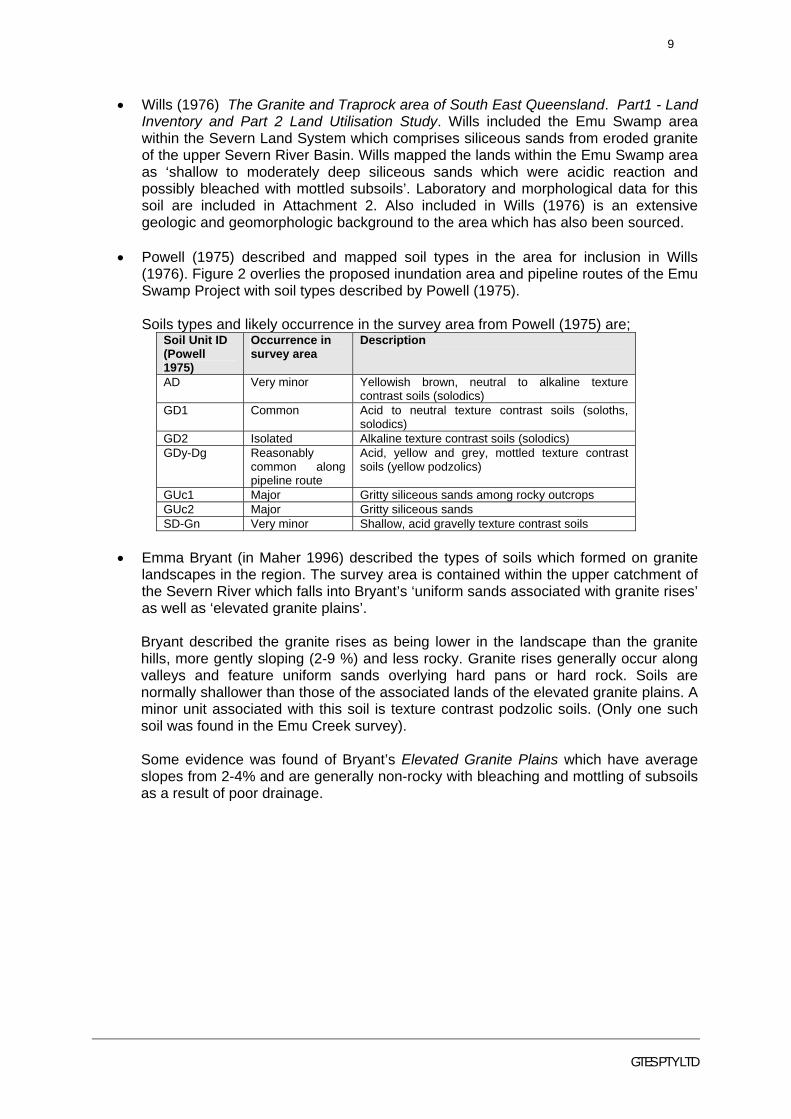
Assessments were made for land suitability. Land suitability deals with the existing specific or potential uses for grazing and or cropping. The five-class system proposed by Land Resources Branch (1989) and used by Shields and Williams (QDPI, 1990) in the Kilcummin Soil Survey is considered appropriate for this survey. This system is based on physical and chemical limiting factors applied directly to specific uses. The system comprises:
Class 1 high quality land with few or very minor limitations, Class 2 land with minor limitations, Class 3 moderate limitations to sustaining the use, Class 4 marginal land requiring major inputs to sustain the use Class 5 unsuitable due to extreme limitations.
2.6 LAND RESOURCE INFORMATION REVIEW
A variety of background information relevant to the area was sourced in this survey. This information includes;
• Maher (1996). Understanding and Managing Soils in the Stanthorpe Rosenthal Region. DNR. This report collated available data from past surveys (below) and, combined with local knowledge and experience, developed a manual to assist in sound agricultural land management practices in the region. Mapping units are called ‘Land Types’ which may include different soil types. Mapping is at a scale of 1:250000 which is far too broad for direct application to the Emu Swamp survey but provides useful background data. The land type mapping from Maher (1996) was the basis for the soils assessment along the proposed pipeline route.
• Wills (1980). Granite Belt Soil Erosion Survey. QDPI. This report is based on a survey of landholders in the region and concluded that erosion problems on granitic soils are more a function of agricultural management practices than slope gradient. The major problem is soil degradation from physical siltation rather than dispersion related problems.
• Powell (1977). Soils of the Granite Belt Vineyards. South-east Queensland. QDPI.
Powell characterized soil types from vineyards which existed in the mid 1970’s in the area. As no vineyards existed in the proposed Emu Swamp dam area, no soils were described there. Nevertheless Powell described ‘a shallow siliceous sand on weathered granite’ which appears to predominate in the survey area. Data were reviewed for this soil and compared to data generated in the current survey.
9
GTES PTY LTD
• Wills (1976) The Granite and Traprock area of South East Queensland. Part1 - Land Inventory and Part 2 Land Utilisation Study. Wills included the Emu Swamp area within the Severn Land System which comprises siliceous sands from eroded granite of the upper Severn River Basin. Wills mapped the lands within the Emu Swamp area as ‘shallow to moderately deep siliceous sands which were acidic reaction and possibly bleached with mottled subsoils’. Laboratory and morphological data for this soil are included in Attachment 2. Also included in Wills (1976) is an extensive geologic and geomorphologic background to the area which has also been sourced.
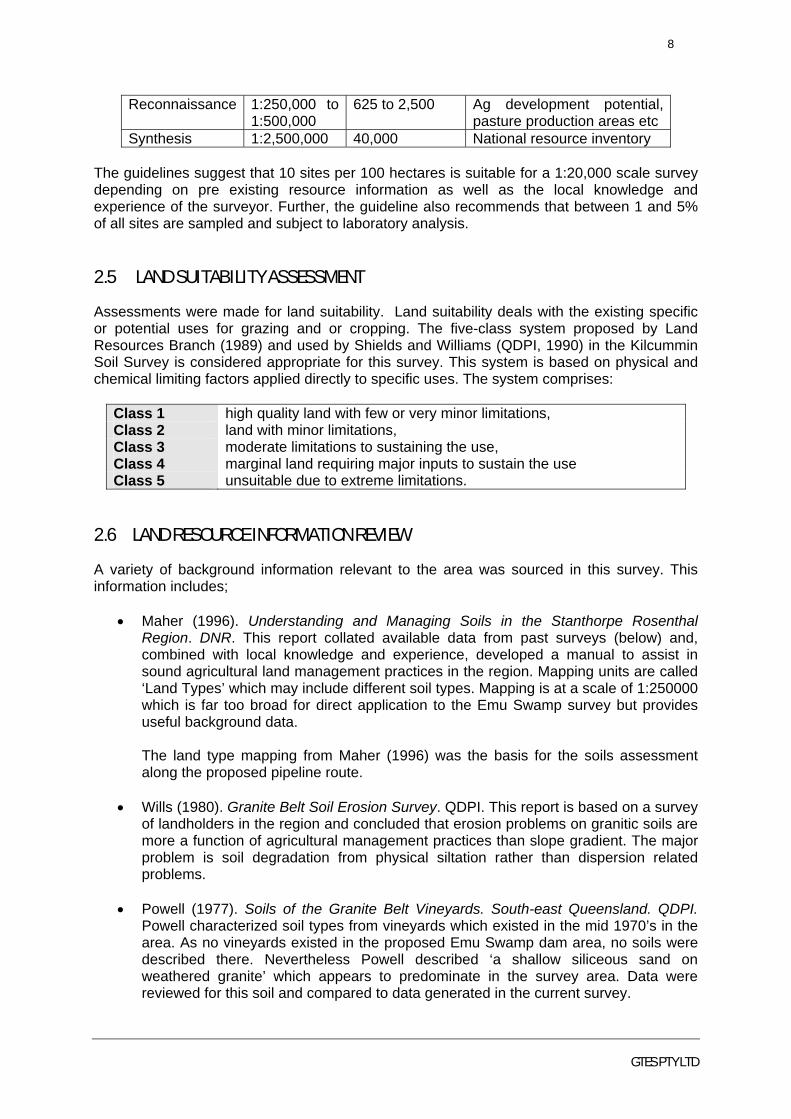
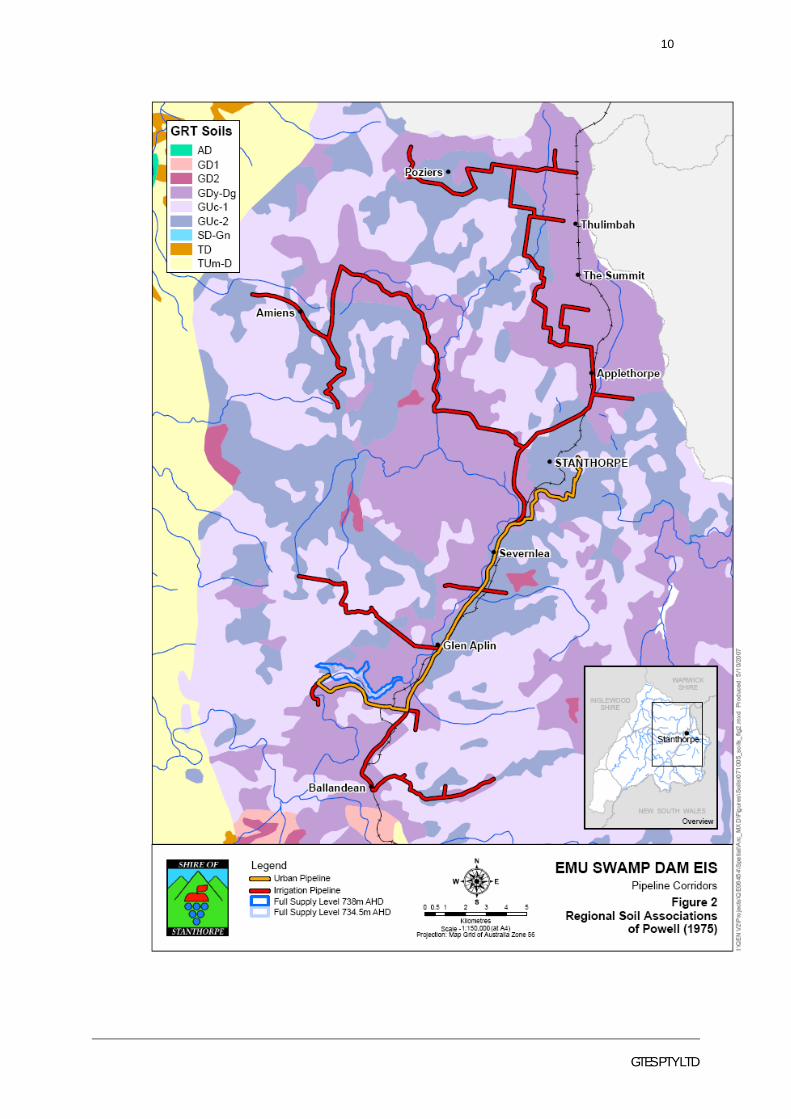
• Powell (1975) described and mapped soil types in the area for inclusion in Wills
(1976). Figure 2 overlies the proposed inundation area and pipeline routes of the Emu Swamp Project with soil types described by Powell (1975).
Soils types and likely occurrence in the survey area from Powell (1975) are;
Soil Unit ID (Powell 1975)
Occurrence in survey area
Description
AD Very minor Yellowish brown, neutral to alkaline texture contrast soils (solodics)
GD1 Common Acid to neutral texture contrast soils (soloths, solodics)
GD2 Isolated Alkaline texture contrast soils (solodics) GDy-Dg Reasonably
common along pipeline route
Acid, yellow and grey, mottled texture contrast soils (yellow podzolics)
GUc1 Major Gritty siliceous sands among rocky outcrops GUc2 Major Gritty siliceous sands SD-Gn Very minor Shallow, acid gravelly texture contrast soils
• Emma Bryant (in Maher 1996) described the types of soils which formed on granite
landscapes in the region. The survey area is contained within the upper catchment of the Severn River which falls into Bryant’s ‘uniform sands associated with granite rises’ as well as ‘elevated granite plains’.
Bryant described the granite rises as being lower in the landscape than the granite hills, more gently sloping (2-9 %) and less rocky. Granite rises generally occur along valleys and feature uniform sands overlying hard pans or hard rock. Soils are normally shallower than those of the associated lands of the elevated granite plains. A minor unit associated with this soil is texture contrast podzolic soils. (Only one such soil was found in the Emu Creek survey).
Some evidence was found of Bryant’s Elevated Granite Plains which have average slopes from 2-4% and are generally non-rocky with bleaching and mottling of subsoils as a result of poor drainage.
10
GTES PTY LTD
11
GTES PTY LTD
2.7 SURVEY METHODOLOGY
The soils were mapped at an approximate scale of 1:10,000 in line with recommendations of Gunn et al (1988). Following initial field checks, this scale was selected as most appropriate for the detailed evaluation of this particular area. Initially, available background information (refer above) was examined and air photo mosaics of the area were mapped to delineate proposed soil units on the basis of similar topographic and vegetative patterns. As soils basically comprised uniform coarse sands with major variability being depth to weathered bedrock, mapping units were determined primarily on the basis of;
• similarity in morphological attributes, particularly soil depth, • extent of granite surface outcropping and, • slope gradient.
A brief reference-mapping phase was conducted to develop a draft soil type map legend and document the expected soil variation in the area. This was followed by detailed site sampling to verify soil types and define boundaries. Field sampling was quite straightforward as access was very good to all parts of the survey area. Free survey techniques (Gunn et al 1988) were used to verify soil types and boundaries and involved 31 detailed site observations supported by other non-detailed sites to confirm soil type and map boundaries. Detailed sites involved the exposure of the soil profile with 75mm hand augers to depths up to 120 cm or to hard or otherwise impenetrable layers. Where possible, soil pits or cuttings were used to better describe subsoil structure. Background geological data confirm granite substrate as the only unit which is likely to influence soil attributes. Non-detailed sites involved either a quick check of soil type and stripping depth with a hand auger or confirmation of changes in vegetation or topography. The soil scheme of Isbell (1998) is used to classify soil type. Almost all soils are silicious sands. Soil types have been confirmed following interpretation of laboratory data.
2.8 SOIL ANALYSIS
The selection of soils for chemical analysis was undertaken on the basis of that site being a good representation of the soil type as a whole. Analytical results were used to determine chemical limiting factors and utilised to assist in agricultural suitability assessments for cropping and grazing. In addition, these data helped determine soil potential in future construction activity. Representative sites were sampled for detailed analysis of major horizons at the Phosyn Analytical Laboratory, a NATA approved facility. Details of laboratory analyses undertaken, results and methods are included in Attachment 2. The following analyses were performed:
SAMPLES ANALYSIS All samples pH, cations, CEC, Ca:Mg, % base saturation, electrical conductivity (1:5 soil water
extract) Detailed chemical characterisation of representative surface soils
pH (H2O), pH (CaCl2), Organic Matter (%), CEC (meq/100g), EC (dS/m), Nitrate – N (ppm), P (ppm), K (meq), Ca (meq), Mg (meq), S (ppm), B (ppm), Cu (ppm), Fe (ppm), Mn (ppm), Zn (ppm), Al (meq), Na (meq), Cl (ppm), Ca base saturation (%), K base saturation (%), Mg base saturation (%), Na base saturation (%), Ca:Mg, Nitrogen (%), particle size distribution and R1 dispersion.
12
GTES PTY LTD
3 EMU SWAMP DAM AREA SOILS
3.1 OVERVIEW
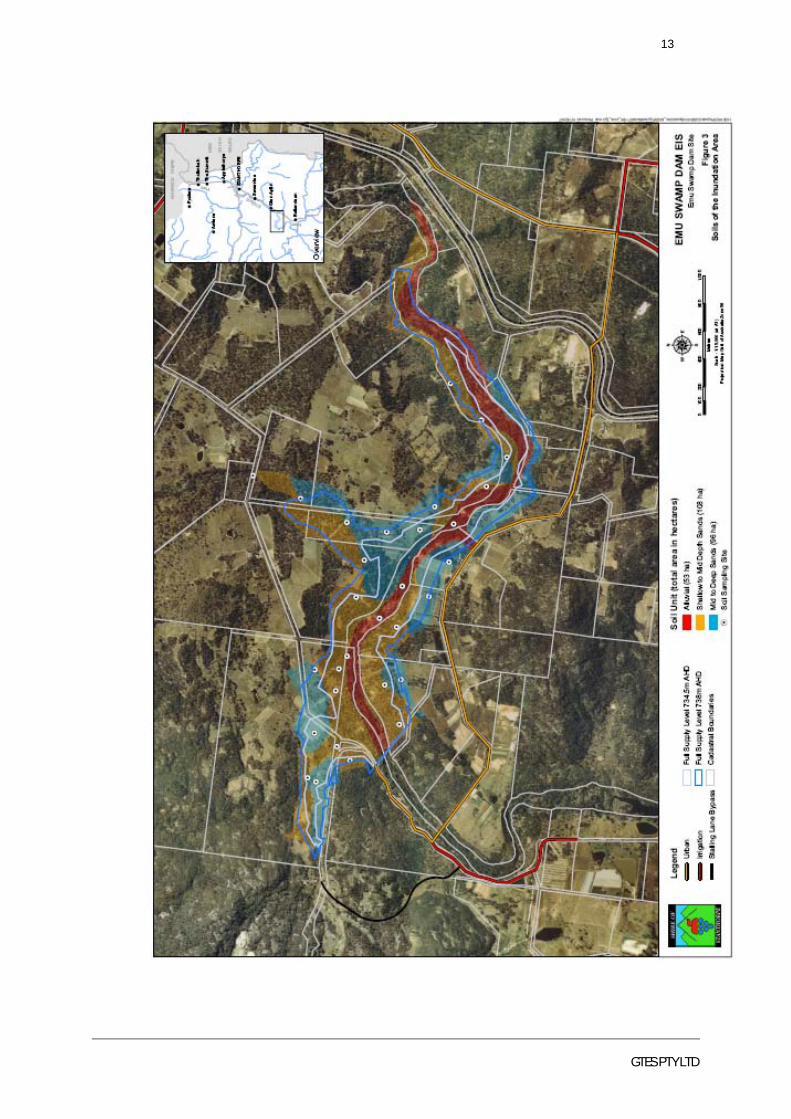
The survey area is contained in the upper catchment of the Severn River where underlying geology is exclusively granite from which all soils in the survey are derived. Soil mapping units have been developed primarily on the basis of similarity in morphology, laboratory data, soil depth, percentage of granite outcropping and topographic position. Table 3.1 shows the three soil types delineated in this survey and identifies comparable soils described in previous surveys. The soils distribution in the inundation area are shown on Figure 3. The principal soil type is uniform coarse gritty sands of variable depth to weathered bedrock. Variations include mottled or bleached A2 horizons and very occasional clayey subsoil.
TABLE 3-1 RELATIONSHIP WITH GTES (2007) SOILS AND PREVIOUS SURVEYS Comparable soils from other surveys GTES
Map Unit
Description Powell (1977)
Powell (1975)
Land Type (Maher 1996)
A
Loamy coarse sands associated with active creek or river channels. Typified by variable soil depth and slope. Often extensive (>50%) granite outcropping. Mostly uncleared scrub.
Ucc GUc1 Banca
B
Undulating with uniform coarse to loamy sands, possible bleach often with moderate granite outcropping. Soil depth is generally from 30 to 60 cm (average 40cm). Slopes generally 2- 4%. Mostly uncleared scrub.
Uca GUc2 Pozieres and Banca
C
Very gently undulating uniform sandy soils often with red mottled subsoil extending past 50cm to weathered or fresh granite bedrock. Soil depth generally from 40 to 100 cm (average 55cm). Mostly cleared for cultivation (forage), pasture or grape vines and stone fruit. Granite outcropping < 20%. Slopes generally < 2%
Ucb
GUc2 and minor GD1 and G Dy-
Dg
Pozieres
13
GTES PTY LTD
14
GTES PTY LTD
3.2 SOIL TYPES
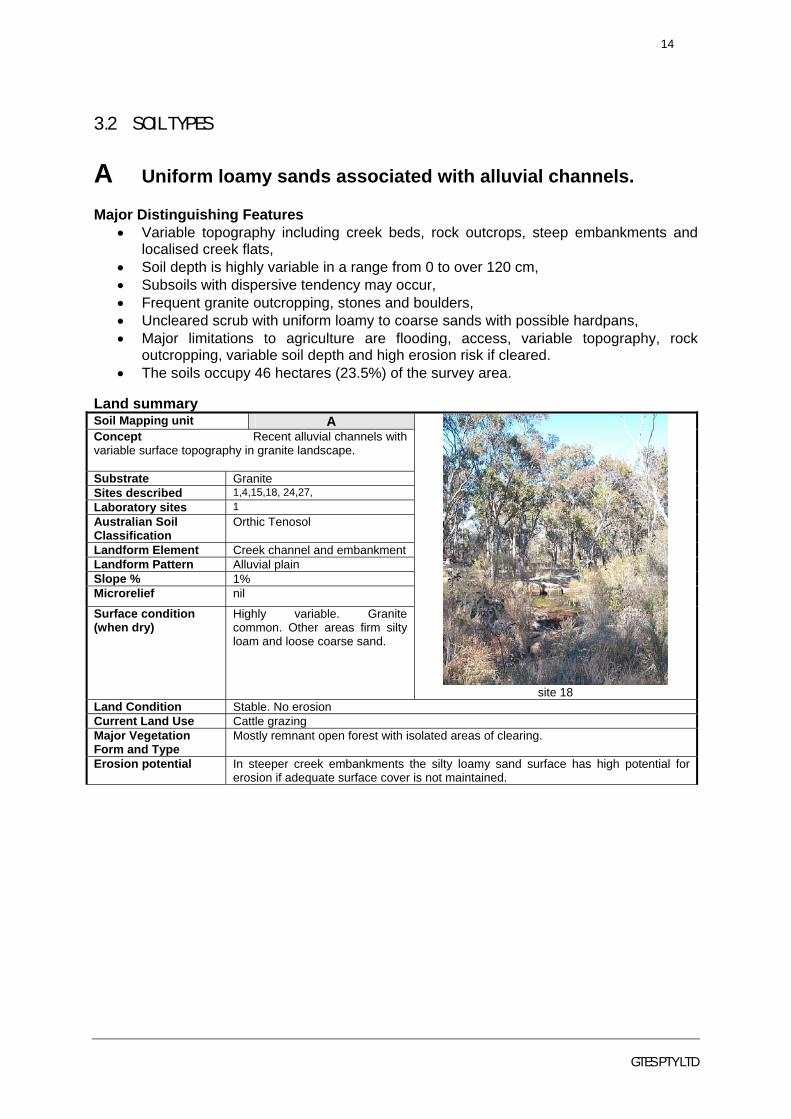
A Uniform loamy sands associated with alluvial channels. Major Distinguishing Features
• Variable topography including creek beds, rock outcrops, steep embankments and localised creek flats,
• Soil depth is highly variable in a range from 0 to over 120 cm, • Subsoils with dispersive tendency may occur, • Frequent granite outcropping, stones and boulders, • Uncleared scrub with uniform loamy to coarse sands with possible hardpans, • Major limitations to agriculture are flooding, access, variable topography, rock
outcropping, variable soil depth and high erosion risk if cleared. • The soils occupy 46 hectares (23.5%) of the survey area.
Land summary Soil Mapping unit A Concept Recent alluvial channels with variable surface topography in granite landscape. Substrate Granite Sites described 1,4,15,18, 24,27, Laboratory sites 1 Australian Soil Classification
Orthic Tenosol
Landform Element Creek channel and embankment Landform Pattern Alluvial plain Slope % 1% Microrelief nil
Surface condition (when dry)
Highly variable. Granite common. Other areas firm silty loam and loose coarse sand.
site 18
Land Condition Stable. No erosion Current Land Use Cattle grazing Major Vegetation Form and Type
Mostly remnant open forest with isolated areas of clearing.
Erosion potential
In steeper creek embankments the silty loamy sand surface has high potential for erosion if adequate surface cover is not maintained.
15
GTES PTY LTD
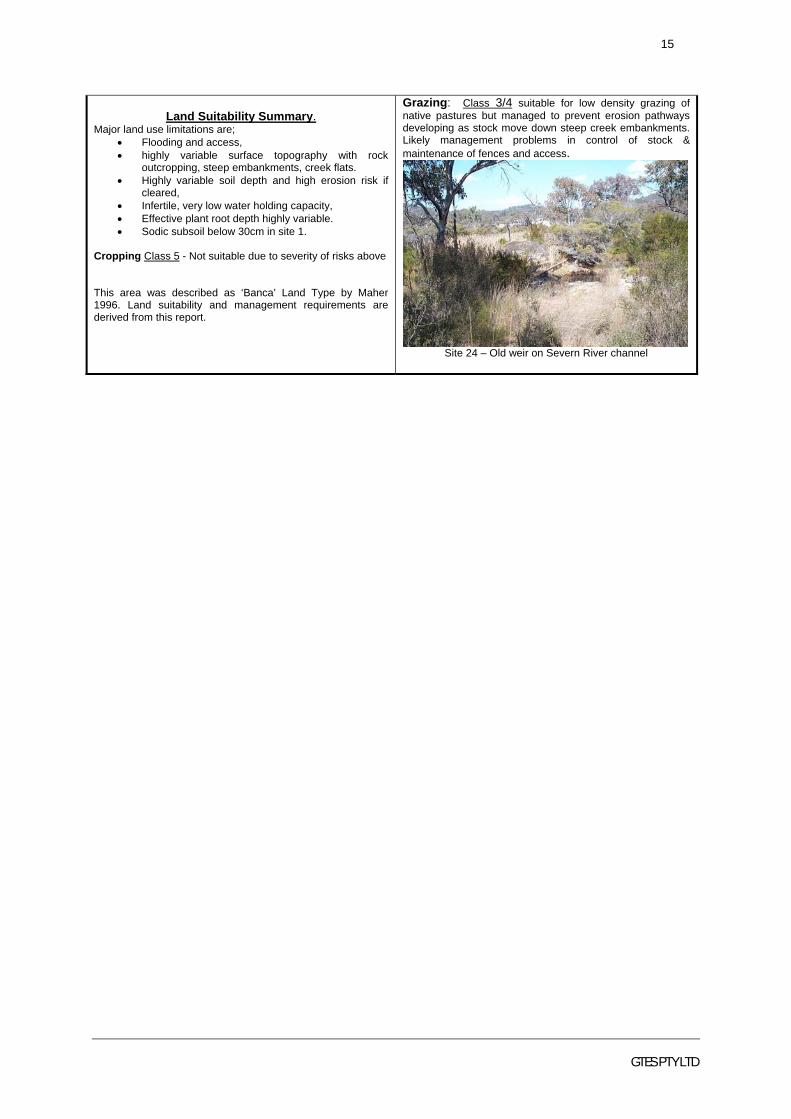
Land Suitability Summary.
Major land use limitations are; • Flooding and access, • highly variable surface topography with rock
outcropping, steep embankments, creek flats. • Highly variable soil depth and high erosion risk if
cleared, • Infertile, very low water holding capacity, • Effective plant root depth highly variable. • Sodic subsoil below 30cm in site 1.
Cropping Class 5 - Not suitable due to severity of risks above This area was described as ‘Banca’ Land Type by Maher 1996. Land suitability and management requirements are derived from this report.
Grazing: Class 3/4 suitable for low density grazing of native pastures but managed to prevent erosion pathways developing as stock move down steep creek embankments. Likely management problems in control of stock & maintenance of fences and access.
Site 24 – Old weir on Severn River channel

16
GTES PTY LTD
TYPICAL SOIL PROFILE – Deep sand
MINOR VARIANT – Deep loamy
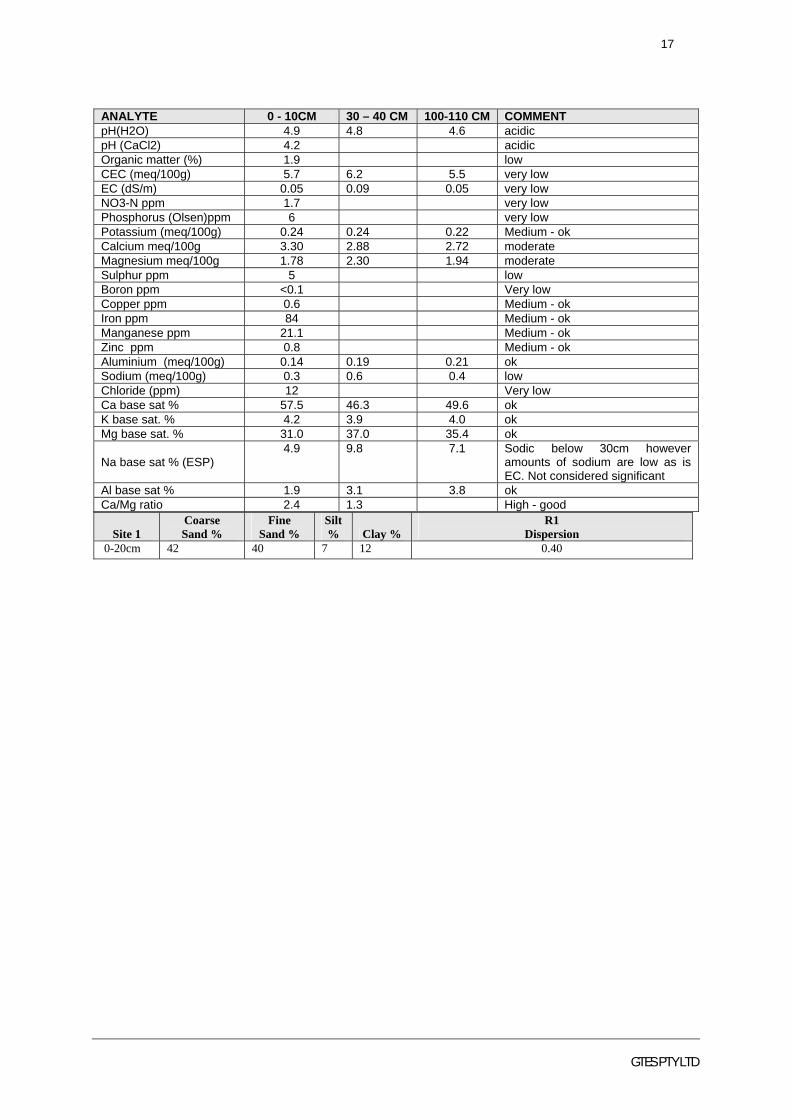
MAJOR ASPECTS OF CHEMICAL ANALYSES: SITE 1 Laboratory analyses indicate that fertility is very low. Specifically, nitrogen, phosphorus, sulphur and boron are very low while most trace elements are adequate. Cation exchange capacity is very low and pH trend is acid which continues to the bedrock. No tendency for dispersion is indicated above 30 cm depth. The subsoil below the bleached layer at 30cm is not saline. The soil bleach indicates a tendency to waterlog as rapidly infiltrating water is held up by the hard, impervious subsoil layer. The surface is 80% sand with equal proportions of fine and coarse sand. This is the result of alluvial deposition of finer grained particles which suggests that the surface may tend to seal and set hard. The R1 is very low indicating little potential for dispersion.
Horizon Depth cm Field Description A11 0 -60 Pale brown 10YR5/3, silty sandy loam,
firm, field pH 5.5 clear change to; A12 60 – 120+ dark brown 10YR 3/1, loamy coarse
sand, massive, field pH 5,
0.0m 0.2m 0.6m 0.9m
site 18
Note that soil depth is often quite variable with exposed rock common.
Runoff: Quite good infiltration but rapid over exposed rock. Permeability : High Drainage: may be impeded by bedrock or hardpans.
Horizon Depth cm Field Description A11 0 -10 Dark brown 10YR3/3, silty coarse
sand, massive, field pH 5.0 clear change to;
A12 10 – 30 Pale brown 10YR 5/3, coarse sandy loam, massive, clear to;
A21 30-40cm yellowish brown 10YR5/6(w), 10YR7/2(d), loamy coarse sand, conspicuous bleach, massive, no segregations, field pH 4.5, clear to;
A22 40-120+cm Brown 7.5YR4/2, gritty coarse sand, massive but sets hard, field pH 4.5.
0.0m 0.2m 0.6m 0.9m 1.2m
site 1
Runoff: Very rapid over exposed rock. Silty loam topsoil areas may be moderate but coarse loose sandy areas slow. Permeability : High Drainage: Impeded by bedrock or hardpans.
17
GTES PTY LTD
ANALYTE 0 - 10CM 30 – 40 CM 100-110 CM COMMENT pH(H2O) 4.9 4.8 4.6 acidic pH (CaCl2) 4.2 acidic Organic matter (%) 1.9 low CEC (meq/100g) 5.7 6.2 5.5 very low EC (dS/m) 0.05 0.09 0.05 very low NO3-N ppm 1.7 very low Phosphorus (Olsen)ppm 6 very low Potassium (meq/100g) 0.24 0.24 0.22 Medium - ok Calcium meq/100g 3.30 2.88 2.72 moderate Magnesium meq/100g 1.78 2.30 1.94 moderate Sulphur ppm 5 low Boron ppm <0.1 Very low Copper ppm 0.6 Medium - ok Iron ppm 84 Medium - ok Manganese ppm 21.1 Medium - ok Zinc ppm 0.8 Medium - ok Aluminium (meq/100g) 0.14 0.19 0.21 ok Sodium (meq/100g) 0.3 0.6 0.4 low Chloride (ppm) 12 Very low Ca base sat % 57.5 46.3 49.6 ok K base sat. % 4.2 3.9 4.0 ok Mg base sat. % 31.0 37.0 35.4 ok
Na base sat % (ESP) 4.9 9.8 7.1 Sodic below 30cm however
amounts of sodium are low as is EC. Not considered significant
Al base sat % 1.9 3.1 3.8 ok Ca/Mg ratio 2.4 1.3 High - good
Site 1 Coarse Sand %
Fine Sand %
Silt % Clay %
R1 Dispersion
0-20cm 42 40 7 12 0.40
18
GTES PTY LTD
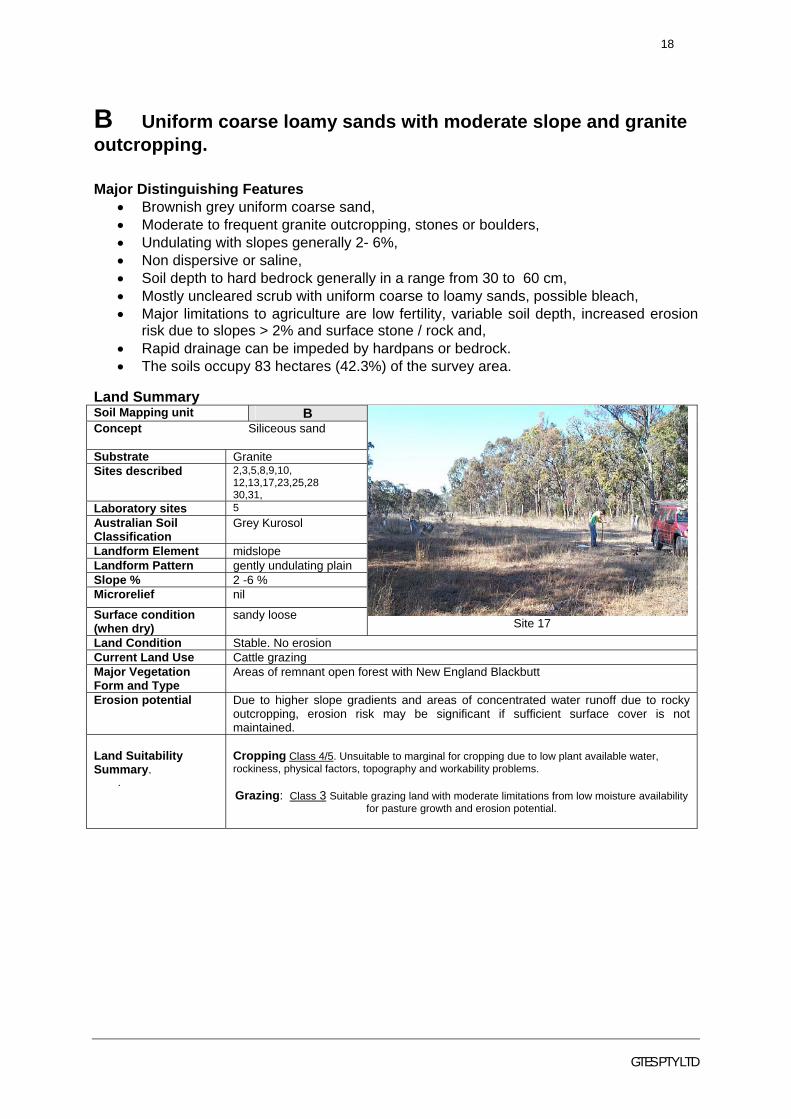
B Uniform coarse loamy sands with moderate slope and granite outcropping. Major Distinguishing Features
• Brownish grey uniform coarse sand, • Moderate to frequent granite outcropping, stones or boulders, • Undulating with slopes generally 2- 6%, • Non dispersive or saline, • Soil depth to hard bedrock generally in a range from 30 to 60 cm, • Mostly uncleared scrub with uniform coarse to loamy sands, possible bleach, • Major limitations to agriculture are low fertility, variable soil depth, increased erosion
risk due to slopes > 2% and surface stone / rock and, • Rapid drainage can be impeded by hardpans or bedrock. • The soils occupy 83 hectares (42.3%) of the survey area.
Land Summary Soil Mapping unit B Concept Siliceous sand Substrate Granite Sites described 2,3,5,8,9,10,
12,13,17,23,25,28 30,31,
Laboratory sites 5 Australian Soil Classification
Grey Kurosol
Landform Element midslope Landform Pattern gently undulating plain Slope % 2 -6 % Microrelief nil
Surface condition (when dry)
sandy loose Site 17
Land Condition Stable. No erosion Current Land Use Cattle grazing Major Vegetation Form and Type
Areas of remnant open forest with New England Blackbutt
Erosion potential
Due to higher slope gradients and areas of concentrated water runoff due to rocky outcropping, erosion risk may be significant if sufficient surface cover is not maintained.
Land Suitability Summary.
.
Cropping Class 4/5. Unsuitable to marginal for cropping due to low plant available water, rockiness, physical factors, topography and workability problems.
Grazing: Class 3 Suitable grazing land with moderate limitations from low moisture availability
for pasture growth and erosion potential.

19
GTES PTY LTD
TYPICAL SOIL PROFILE
MAJOR ASPECTS OF CHEMICAL ANALYSES: SITE 5 Laboratory analyses indicate that fertility is very low – less than the alluvial site 1 for soil A. Specifically, nitrogen, phosphorus, copper, potassium, sulphur and boron are very low while most other trace elements are adequate. Cation exchange capacity is very low and pH trend is strongly acid which continues to the bedrock. Organic matter is high in the surface as is the calcium to magnesium ratio. Electrical conductivity is very low throughout as is cation exchange. The subsoil below the A horizon is non-sodic or saline. The site was freely drained with no sign of impeded drainage. Particle size distribution is dominated by sand with moderate fractions of fine sand included. Dispersive tendency is very low.
ANALYTE 0 - 10CM 30 - 40 CM COMMENT pH(H2O) 5.3 4.7 acidic pH (CaCl2) 4.8 acidic Organic matter (%) 3.3 high CEC (meq/100g) 10.9 5.1 low EC (dS/m) 0.05 0.02 very low NO3-N ppm 3.5 Very low Phosphorus (Olsen)ppm 8 Very low Potassium (meq/100g) 0.24 0.10 low Calcium meq/100g 8.76 3.05 adequate Magnesium meq/100g 1.49 1.48 low Sulphur ppm 8 low Boron ppm 0.3 Very low Copper ppm 0.2 Low / medium Iron ppm 45 medium Manganese ppm 52.2 high Zinc ppm 0.6 medium Aluminium (meq/100g) 0.12 0.18 ok Sodium (meq/100g) 0.3 0.3 Very low Chloride (ppm) 7 Very low Ca base sat % 80.4 60.2 ok K base sat. % 2.2 2.0 ok Mg base sat. % 13.7 29.2 ok Na base sat % (ESP) 2.6 5.1 Non sodic Ca/Mg ratio 5.9 2.1 High - good Al base sat % 1.1 3.6 ok
Site Coarse sand Fine sand Silt Clay
R1 Dispersion
% % % % 5 40 34 14 12 0.63
Horizon Depth cm Field Description A11 0 -20 Brown 10YR3/2, coarse sand, massive
, field pH 5.5 clear change to; A12 20 - 55 greyish brown 7.5YR 5/2, coarse
sand, no segregations massive, field pH 4.5, red mottling below 30 cm depth increasing
C
55+ parent material
0.0m 0.3m 0.5m
Site 5
0.6m 0.8m
Runoff: Rapid over rock exposure areas otherwise slow Permeability : High Drainage: restricted by bedrock or hard pans
20
GTES PTY LTD
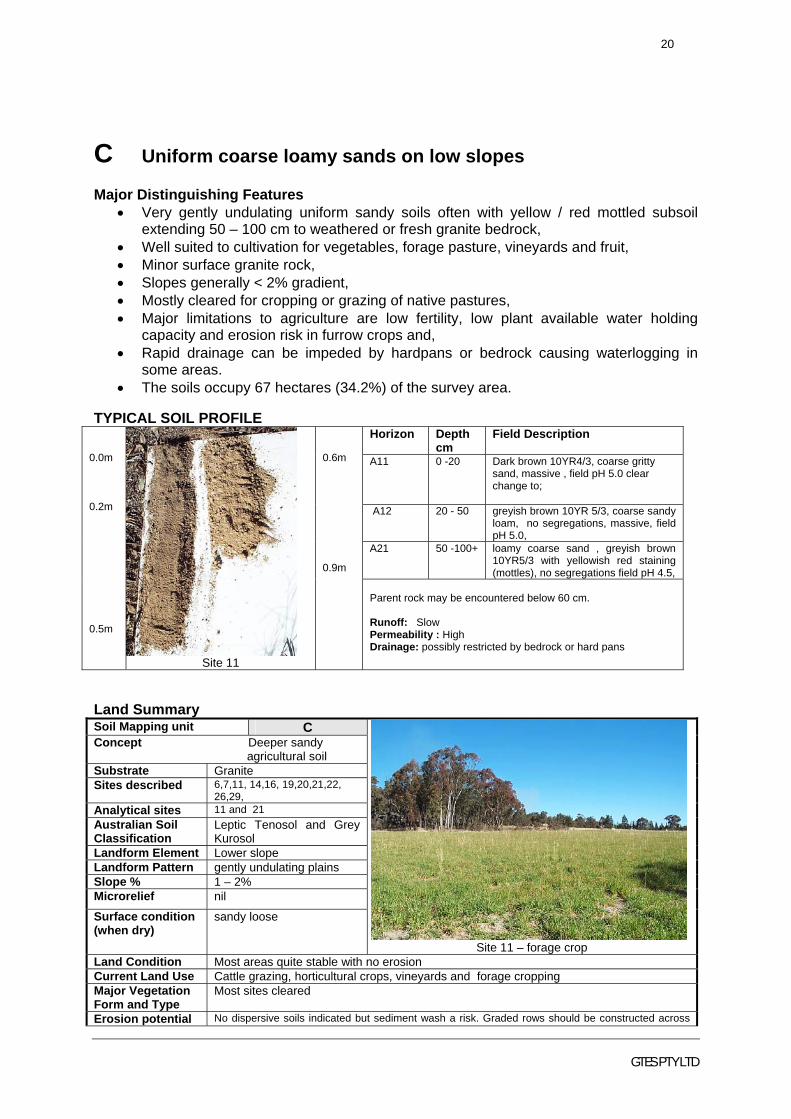
C Uniform coarse loamy sands on low slopes Major Distinguishing Features
• Very gently undulating uniform sandy soils often with yellow / red mottled subsoil extending 50 – 100 cm to weathered or fresh granite bedrock,
• Well suited to cultivation for vegetables, forage pasture, vineyards and fruit, • Minor surface granite rock, • Slopes generally < 2% gradient, • Mostly cleared for cropping or grazing of native pastures, • Major limitations to agriculture are low fertility, low plant available water holding
capacity and erosion risk in furrow crops and, • Rapid drainage can be impeded by hardpans or bedrock causing waterlogging in
some areas. • The soils occupy 67 hectares (34.2%) of the survey area.
TYPICAL SOIL PROFILE
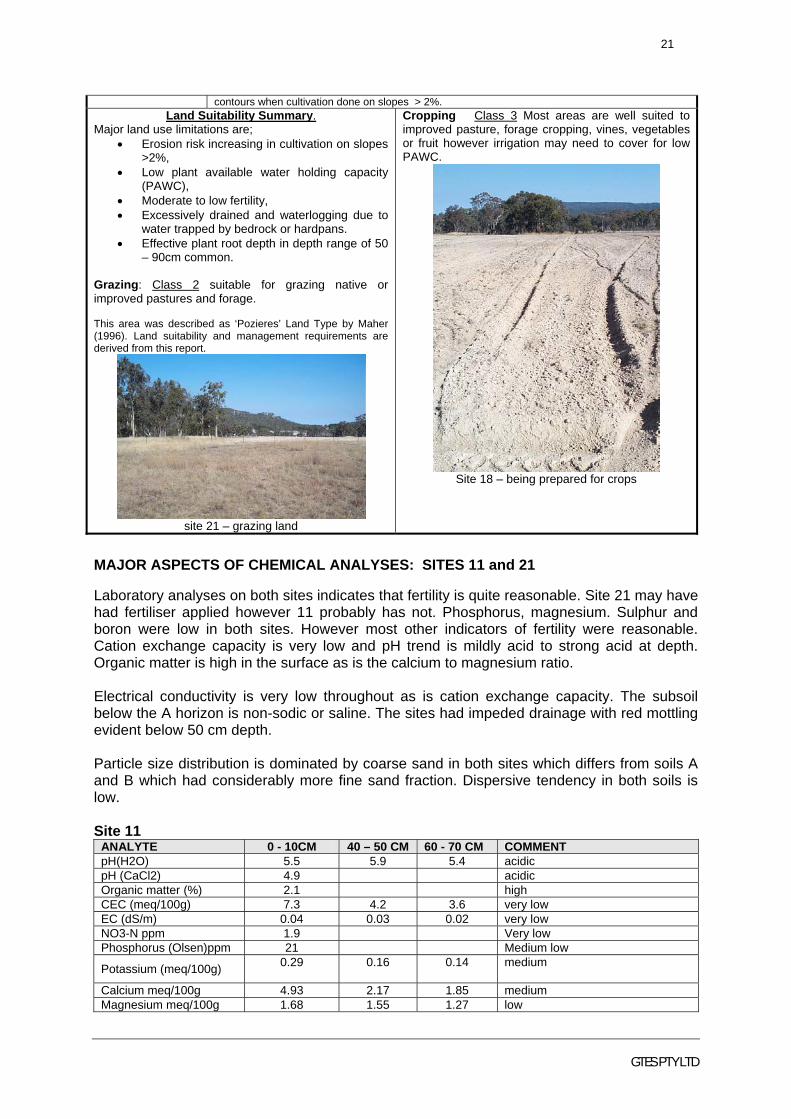
Land Summary Soil Mapping unit C Concept Deeper sandy agricultural soil Substrate Granite Sites described 6,7,11, 14,16, 19,20,21,22,
26,29, Analytical sites 11 and 21 Australian Soil Classification
Leptic Tenosol and Grey Kurosol
Landform Element Lower slope Landform Pattern gently undulating plains Slope % 1 – 2% Microrelief nil
Surface condition (when dry)
sandy loose
Site 11 – forage crop Land Condition Most areas quite stable with no erosion Current Land Use Cattle grazing, horticultural crops, vineyards and forage cropping Major Vegetation Form and Type
Most sites cleared
Erosion potential No dispersive soils indicated but sediment wash a risk. Graded rows should be constructed across
Horizon Depth cm
Field Description
A11 0 -20 Dark brown 10YR4/3, coarse gritty sand, massive , field pH 5.0 clear change to;
A12 20 - 50 greyish brown 10YR 5/3, coarse sandy loam, no segregations, massive, field pH 5.0,
A21 50 -100+ loamy coarse sand , greyish brown 10YR5/3 with yellowish red staining (mottles), no segregations field pH 4.5,
0.0m 0.2m 0.5m
Site 11
0.6m 0.9m
Parent rock may be encountered below 60 cm. Runoff: Slow Permeability : High Drainage: possibly restricted by bedrock or hard pans
21
GTES PTY LTD
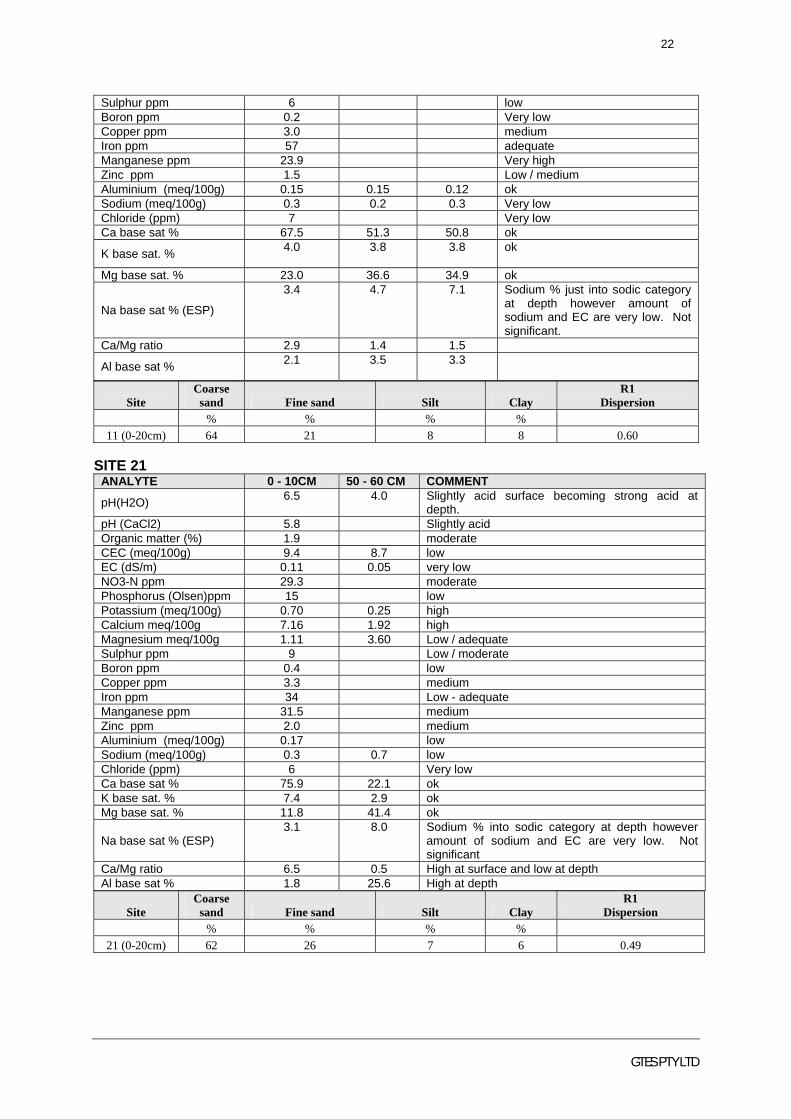
contours when cultivation done on slopes > 2%. Land Suitability Summary.
Major land use limitations are; • Erosion risk increasing in cultivation on slopes
>2%, • Low plant available water holding capacity
(PAWC), • Moderate to low fertility, • Excessively drained and waterlogging due to
water trapped by bedrock or hardpans. • Effective plant root depth in depth range of 50
– 90cm common. Grazing: Class 2 suitable for grazing native or improved pastures and forage. This area was described as ‘Pozieres’ Land Type by Maher (1996). Land suitability and management requirements are derived from this report.
site 21 – grazing land
Cropping Class 3 Most areas are well suited to improved pasture, forage cropping, vines, vegetables or fruit however irrigation may need to cover for low PAWC.
Site 18 – being prepared for crops
MAJOR ASPECTS OF CHEMICAL ANALYSES: SITES 11 and 21 Laboratory analyses on both sites indicates that fertility is quite reasonable. Site 21 may have had fertiliser applied however 11 probably has not. Phosphorus, magnesium. Sulphur and boron were low in both sites. However most other indicators of fertility were reasonable. Cation exchange capacity is very low and pH trend is mildly acid to strong acid at depth. Organic matter is high in the surface as is the calcium to magnesium ratio. Electrical conductivity is very low throughout as is cation exchange capacity. The subsoil below the A horizon is non-sodic or saline. The sites had impeded drainage with red mottling evident below 50 cm depth. Particle size distribution is dominated by coarse sand in both sites which differs from soils A and B which had considerably more fine sand fraction. Dispersive tendency in both soils is low. Site 11
ANALYTE 0 - 10CM 40 – 50 CM 60 - 70 CM COMMENT pH(H2O) 5.5 5.9 5.4 acidic pH (CaCl2) 4.9 acidic Organic matter (%) 2.1 high CEC (meq/100g) 7.3 4.2 3.6 very low EC (dS/m) 0.04 0.03 0.02 very low NO3-N ppm 1.9 Very low Phosphorus (Olsen)ppm 21 Medium low
Potassium (meq/100g) 0.29 0.16 0.14
medium
Calcium meq/100g 4.93 2.17 1.85 medium Magnesium meq/100g 1.68 1.55 1.27 low
22
GTES PTY LTD
Sulphur ppm 6 low Boron ppm 0.2 Very low Copper ppm 3.0 medium Iron ppm 57 adequate Manganese ppm 23.9 Very high Zinc ppm 1.5 Low / medium Aluminium (meq/100g) 0.15 0.15 0.12 ok Sodium (meq/100g) 0.3 0.2 0.3 Very low Chloride (ppm) 7 Very low Ca base sat % 67.5 51.3 50.8 ok
K base sat. % 4.0 3.8
3.8 ok
Mg base sat. % 23.0 36.6 34.9 ok
Na base sat % (ESP)
3.4 4.7 7.1 Sodium % just into sodic category at depth however amount of sodium and EC are very low. Not significant.
Ca/Mg ratio 2.9 1.4 1.5
Al base sat % 2.1 3.5
3.3
Site Coarse sand Fine sand Silt Clay
R1 Dispersion
% % % % 11 (0-20cm) 64 21 8 8 0.60
SITE 21
ANALYTE 0 - 10CM 50 - 60 CM COMMENT
pH(H2O) 6.5 4.0 Slightly acid surface becoming strong acid at depth.
pH (CaCl2) 5.8 Slightly acid Organic matter (%) 1.9 moderate CEC (meq/100g) 9.4 8.7 low EC (dS/m) 0.11 0.05 very low NO3-N ppm 29.3 moderate Phosphorus (Olsen)ppm 15 low Potassium (meq/100g) 0.70 0.25 high Calcium meq/100g 7.16 1.92 high Magnesium meq/100g 1.11 3.60 Low / adequate Sulphur ppm 9 Low / moderate Boron ppm 0.4 low Copper ppm 3.3 medium Iron ppm 34 Low - adequate Manganese ppm 31.5 medium Zinc ppm 2.0 medium Aluminium (meq/100g) 0.17 low Sodium (meq/100g) 0.3 0.7 low Chloride (ppm) 6 Very low Ca base sat % 75.9 22.1 ok K base sat. % 7.4 2.9 ok Mg base sat. % 11.8 41.4 ok
Na base sat % (ESP) 3.1 8.0 Sodium % into sodic category at depth however
amount of sodium and EC are very low. Not significant
Ca/Mg ratio 6.5 0.5 High at surface and low at depth Al base sat % 1.8 25.6 High at depth
Site Coarse sand Fine sand Silt Clay
R1 Dispersion
% % % % 21 (0-20cm) 62 26 7 6 0.49
23
GTES PTY LTD
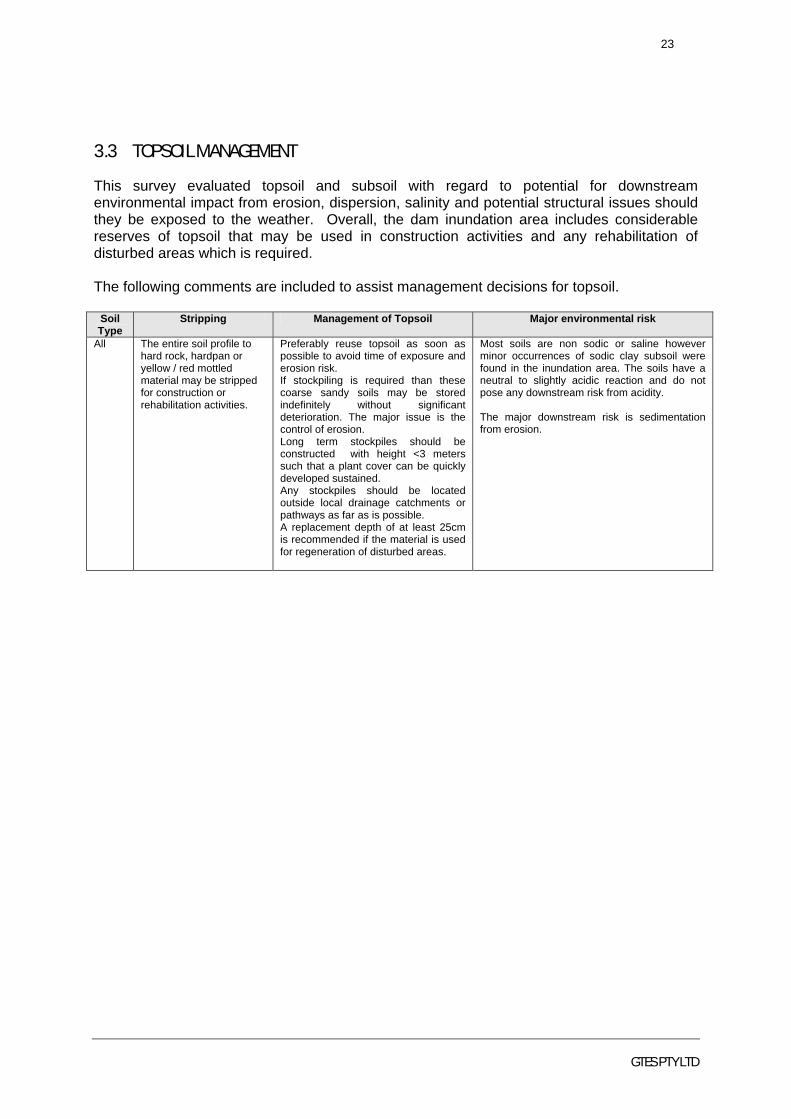
3.3 TOPSOIL MANAGEMENT
This survey evaluated topsoil and subsoil with regard to potential for downstream environmental impact from erosion, dispersion, salinity and potential structural issues should they be exposed to the weather. Overall, the dam inundation area includes considerable reserves of topsoil that may be used in construction activities and any rehabilitation of disturbed areas which is required. The following comments are included to assist management decisions for topsoil.
Soil Type
Stripping Management of Topsoil Major environmental risk
All The entire soil profile to hard rock, hardpan or yellow / red mottled material may be stripped for construction or rehabilitation activities.
Preferably reuse topsoil as soon as possible to avoid time of exposure and erosion risk. If stockpiling is required than these coarse sandy soils may be stored indefinitely without significant deterioration. The major issue is the control of erosion. Long term stockpiles should be constructed with height <3 meters such that a plant cover can be quickly developed sustained. Any stockpiles should be located outside local drainage catchments or pathways as far as is possible. A replacement depth of at least 25cm is recommended if the material is used for regeneration of disturbed areas.
Most soils are non sodic or saline however minor occurrences of sodic clay subsoil were found in the inundation area. The soils have a neutral to slightly acidic reaction and do not pose any downstream risk from acidity. The major downstream risk is sedimentation from erosion.

24
GTES PTY LTD
4 SOILS OF THE PROPOSED PIPELINE ROUTE
4.1 BACKGROUND
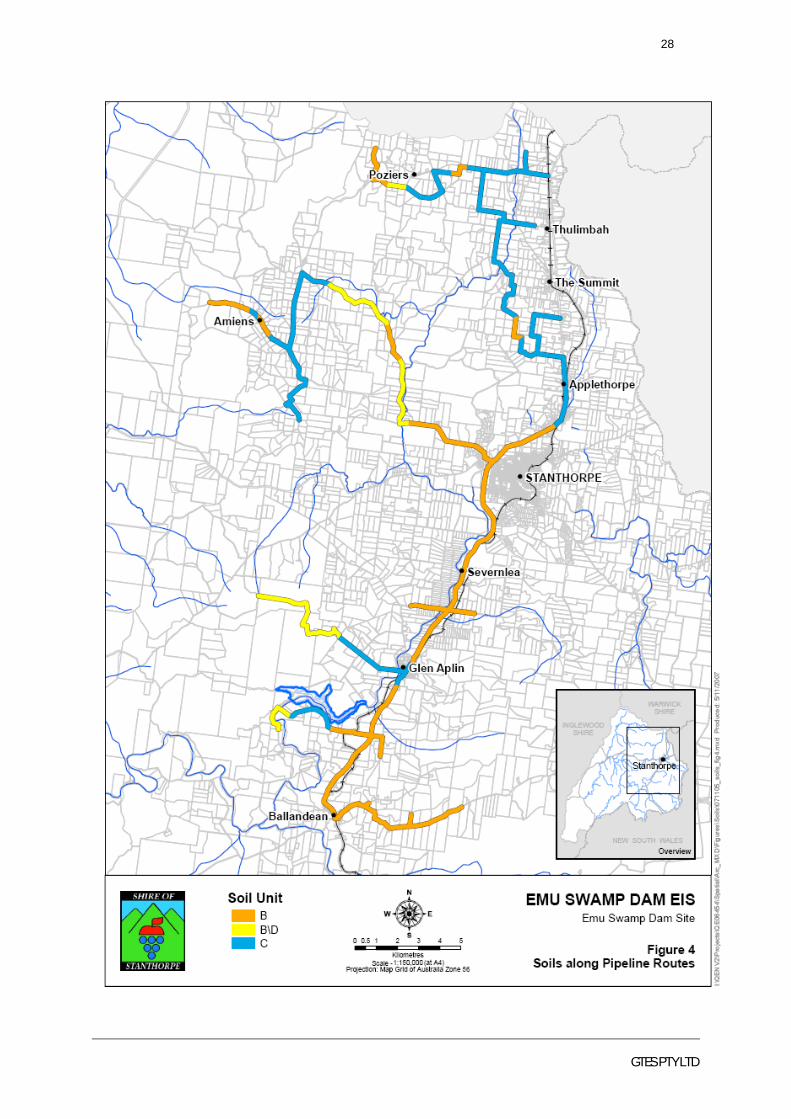
Land and soil types which occur along proposed routes for a pipeline to distribute water from the Emu Creek Dam have been assessed and are shown on Figure 4. As with the actual dam area, the entire pipeline distribution system is contained within the granite landscape. For the most part, the pipeline route will follow established road corridors. This section of the report seeks to identify soil types and relevant aspects for consideration in the construction of the pipeline.
4.2 ASSESSMENT METHODOLOGY
This assessment was basically a two part process involving; • A review of available data and, • field checking and refinement of the available data along the pipeline route.
Comprehensive data of the geology, geomorphology, land types, land use and soil types were sourced from the following reports;
• Maher (1996) Resource Information, in Understanding and Managing Soils in the Stanthorpe – Rosenthal Region, DNR. All areas along the pipeline route were included in a 1:250000 scale map of ‘Land Types’. For each land type, major soil types have been described.
• Wills (1976) The Granite and Traprock Area of South-East Qld. QDPI., described land use, soils and geomorphology across the region, also at a 1:250000 scale. Soil data originated from Powell (1975),
• Powell (1977) Soils of Granite Belt Vineyards. Powell also mapped the soil types which were included in Wills (1976)
• Powell (1975) Soils of Granite Belt Region. • Wills (1980) A Granite Belt Soil Erosion Survey identified issues and aspects in areas of
existing and proposed cultivation. The process of assessing land and soil types along the pipeline route was essentially an exercise in checking and refining soil boundaries described in Powell (1975). The aim was to refine map boundaries to a more useable 1:10,000 (approx) scale accuracy than the existing broad scale map. In addition, a selection of soil observations were made to confirm that soil types described for the area were accurate. Following the completion of field traverses along the route, data was reviewed and compared to map boundaries and soil types described by Powell. It was decided that soil types described by Powell were appropriate for the area however boundaries of land types required refinement in some areas. For this reason, information of natural resources and management requirements included in Maher (1996) and Powell (1975) is considered directly applicable to the map of the pipeline route. Attachment 1 shows site observations recorded along the pipeline route.
25
GTES PTY LTD
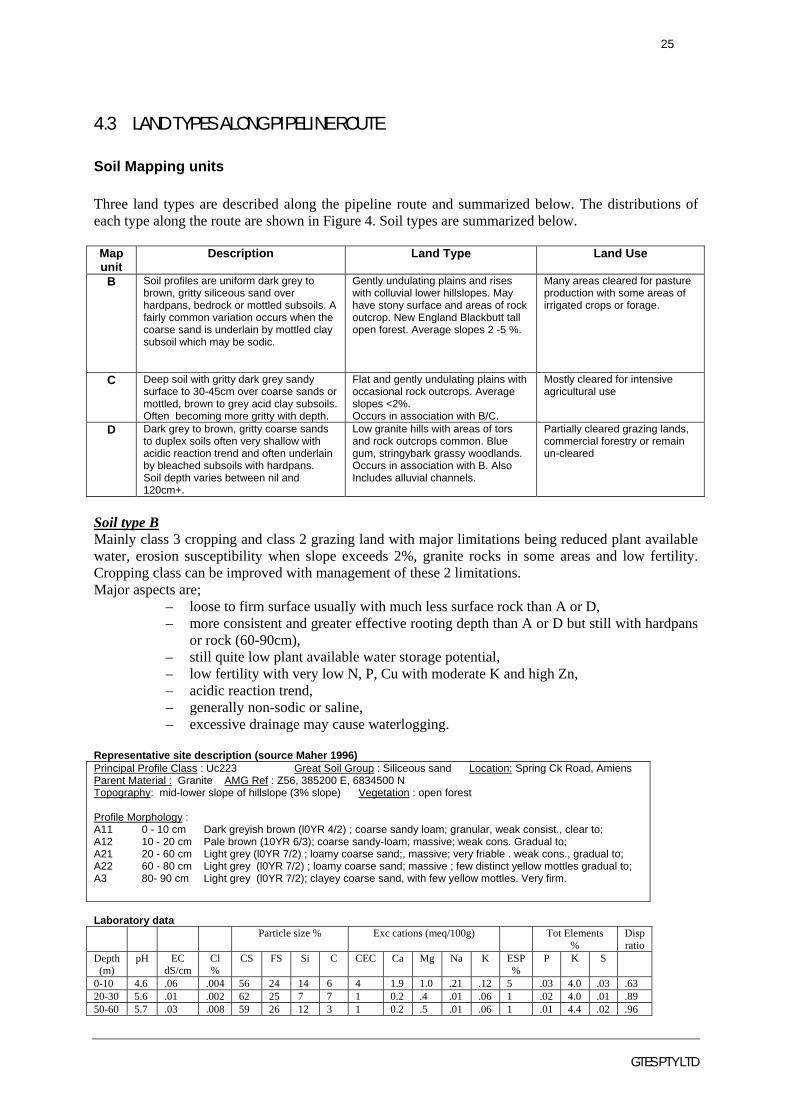
4.3 LAND TYPES ALONG PIPELINE ROUTE
Soil Mapping units Three land types are described along the pipeline route and summarized below. The distributions of each type along the route are shown in Figure 4. Soil types are summarized below. Map unit
Description Land Type Land Use
B Soil profiles are uniform dark grey to brown, gritty siliceous sand over hardpans, bedrock or mottled subsoils. A fairly common variation occurs when the coarse sand is underlain by mottled clay subsoil which may be sodic.
Gently undulating plains and rises with colluvial lower hillslopes. May have stony surface and areas of rock outcrop. New England Blackbutt tall open forest. Average slopes 2 -5 %.
Many areas cleared for pasture production with some areas of irrigated crops or forage.
C Deep soil with gritty dark grey sandy surface to 30-45cm over coarse sands or mottled, brown to grey acid clay subsoils. Often becoming more gritty with depth.
Flat and gently undulating plains with occasional rock outcrops. Average slopes <2%. Occurs in association with B/C.
Mostly cleared for intensive agricultural use
D Dark grey to brown, gritty coarse sands to duplex soils often very shallow with acidic reaction trend and often underlain by bleached subsoils with hardpans. Soil depth varies between nil and 120cm+.
Low granite hills with areas of tors and rock outcrops common. Blue gum, stringybark grassy woodlands. Occurs in association with B. Also Includes alluvial channels.
Partially cleared grazing lands, commercial forestry or remain un-cleared
Soil type B Mainly class 3 cropping and class 2 grazing land with major limitations being reduced plant available water, erosion susceptibility when slope exceeds 2%, granite rocks in some areas and low fertility. Cropping class can be improved with management of these 2 limitations. Major aspects are;
– loose to firm surface usually with much less surface rock than A or D, – more consistent and greater effective rooting depth than A or D but still with hardpans
or rock (60-90cm), – still quite low plant available water storage potential, – low fertility with very low N, P, Cu with moderate K and high Zn, – acidic reaction trend, – generally non-sodic or saline, – excessive drainage may cause waterlogging.
Representative site description (source Maher 1996) Principal Profile Class : Uc223 Great Soil Group : Siliceous sand Location: Spring Ck Road, Amiens Parent Material : Granite AMG Ref : Z56, 385200 E, 6834500 N Topography: mid-lower slope of hillslope (3% slope) Vegetation : open forest Profile Morphology : A11 0 - 10 cm Dark greyish brown (l0YR 4/2) ; coarse sandy loam; granular, weak consist., clear to; A12 10 - 20 cm Pale brown (10YR 6/3); coarse sandy-loam; massive; weak cons. Gradual to; A21 20 - 60 cm Light grey (l0YR 7/2) ; loamy coarse sand;, massive; very friable . weak cons., gradual to; A22 60 - 80 cm Light grey (l0YR 7/2) ; loamy coarse sand; massive ; few distinct yellow mottles gradual to; A3 80- 90 cm Light grey (l0YR 7/2); clayey coarse sand, with few yellow mottles. Very firm. Laboratory data
Particle size % Exc cations (meq/100g) Tot Elements %
Disp ratio
Depth (m)
pH EC dS/cm
Cl %
CS FS Si C CEC Ca Mg Na K ESP %
P K S
0-10 4.6 .06 .004 56 24 14 6 4 1.9 1.0 .21 .12 5 .03 4.0 .03 .63 20-30 5.6 .01 .002 62 25 7 7 1 0.2 .4 .01 .06 1 .02 4.0 .01 .89 50-60 5.7 .03 .008 59 26 12 3 1 0.2 .5 .01 .06 1 .01 4.4 .02 .96
26
GTES PTY LTD
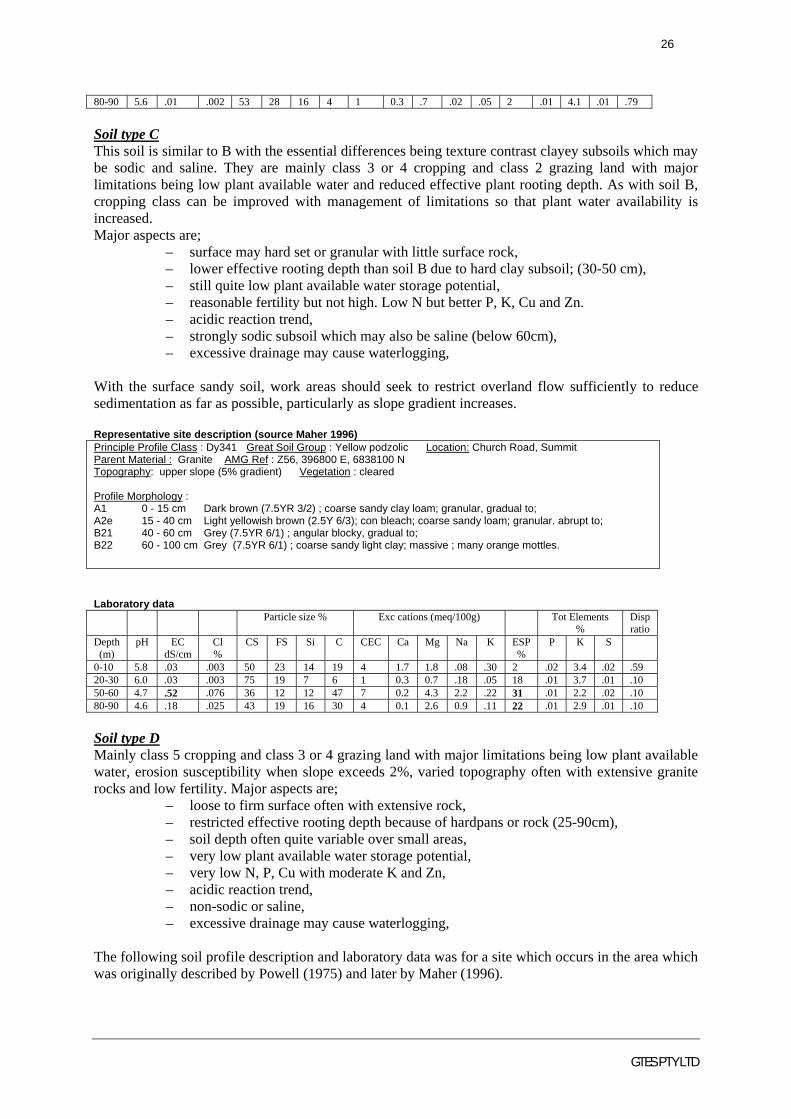
80-90 5.6 .01 .002 53 28 16 4 1 0.3 .7 .02 .05 2 .01 4.1 .01 .79 Soil type C This soil is similar to B with the essential differences being texture contrast clayey subsoils which may be sodic and saline. They are mainly class 3 or 4 cropping and class 2 grazing land with major limitations being low plant available water and reduced effective plant rooting depth. As with soil B, cropping class can be improved with management of limitations so that plant water availability is increased. Major aspects are;
– surface may hard set or granular with little surface rock, – lower effective rooting depth than soil B due to hard clay subsoil; (30-50 cm), – still quite low plant available water storage potential, – reasonable fertility but not high. Low N but better P, K, Cu and Zn. – acidic reaction trend, – strongly sodic subsoil which may also be saline (below 60cm), – excessive drainage may cause waterlogging,
With the surface sandy soil, work areas should seek to restrict overland flow sufficiently to reduce sedimentation as far as possible, particularly as slope gradient increases. Representative site description (source Maher 1996) Principle Profile Class : Dy341 Great Soil Group : Yellow podzolic Location: Church Road, Summit Parent Material : Granite AMG Ref : Z56, 396800 E, 6838100 N Topography: upper slope (5% gradient) Vegetation : cleared Profile Morphology : A1 0 - 15 cm Dark brown (7.5YR 3/2) ; coarse sandy clay loam; granular, gradual to; A2e 15 - 40 cm Light yellowish brown (2.5Y 6/3); con bleach; coarse sandy loam; granular. abrupt to; B21 40 - 60 cm Grey (7.5YR 6/1) ; angular blocky, gradual to; B22 60 - 100 cm Grey (7.5YR 6/1) ; coarse sandy light clay; massive ; many orange mottles. Laboratory data
Particle size % Exc cations (meq/100g) Tot Elements %
Disp ratio
Depth (m)
pH EC dS/cm
Cl %
CS FS Si C CEC Ca Mg Na K ESP %
P K S
0-10 5.8 .03 .003 50 23 14 19 4 1.7 1.8 .08 .30 2 .02 3.4 .02 .59 20-30 6.0 .03 .003 75 19 7 6 1 0.3 0.7 .18 .05 18 .01 3.7 .01 .10 50-60 4.7 .52 .076 36 12 12 47 7 0.2 4.3 2.2 .22 31 .01 2.2 .02 .10 80-90 4.6 .18 .025 43 19 16 30 4 0.1 2.6 0.9 .11 22 .01 2.9 .01 .10 Soil type D Mainly class 5 cropping and class 3 or 4 grazing land with major limitations being low plant available water, erosion susceptibility when slope exceeds 2%, varied topography often with extensive granite rocks and low fertility. Major aspects are;
– loose to firm surface often with extensive rock, – restricted effective rooting depth because of hardpans or rock (25-90cm), – soil depth often quite variable over small areas, – very low plant available water storage potential, – very low N, P, Cu with moderate K and Zn, – acidic reaction trend, – non-sodic or saline, – excessive drainage may cause waterlogging,
The following soil profile description and laboratory data was for a site which occurs in the area which was originally described by Powell (1975) and later by Maher (1996).
27
GTES PTY LTD
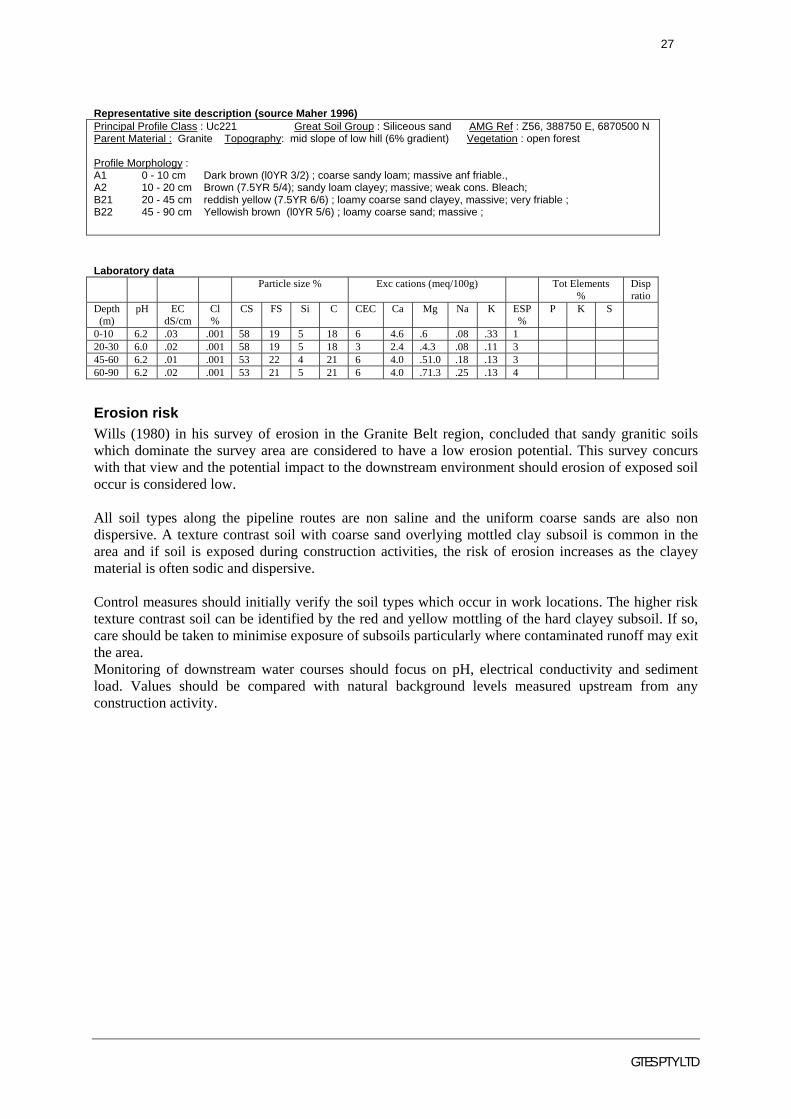
Representative site description (source Maher 1996) Principal Profile Class : Uc221 Great Soil Group : Siliceous sand AMG Ref : Z56, 388750 E, 6870500 N Parent Material : Granite Topography: mid slope of low hill (6% gradient) Vegetation : open forest Profile Morphology : A1 0 - 10 cm Dark brown (l0YR 3/2) ; coarse sandy loam; massive anf friable., A2 10 - 20 cm Brown (7.5YR 5/4); sandy loam clayey; massive; weak cons. Bleach; B21 20 - 45 cm reddish yellow (7.5YR 6/6) ; loamy coarse sand clayey, massive; very friable ; B22 45 - 90 cm Yellowish brown (l0YR 5/6) ; loamy coarse sand; massive ; Laboratory data
Particle size % Exc cations (meq/100g) Tot Elements %
Disp ratio
Depth (m)
pH EC dS/cm
Cl %
CS FS Si C CEC Ca Mg Na K ESP %
P K S
0-10 6.2 .03 .001 58 19 5 18 6 4.6 .6 .08 .33 1 20-30 6.0 .02 .001 58 19 5 18 3 2.4 .4.3 .08 .11 3 45-60 6.2 .01 .001 53 22 4 21 6 4.0 .51.0 .18 .13 3 60-90 6.2 .02 .001 53 21 5 21 6 4.0 .71.3 .25 .13 4
Erosion risk Wills (1980) in his survey of erosion in the Granite Belt region, concluded that sandy granitic soils which dominate the survey area are considered to have a low erosion potential. This survey concurs with that view and the potential impact to the downstream environment should erosion of exposed soil occur is considered low. All soil types along the pipeline routes are non saline and the uniform coarse sands are also non dispersive. A texture contrast soil with coarse sand overlying mottled clay subsoil is common in the area and if soil is exposed during construction activities, the risk of erosion increases as the clayey material is often sodic and dispersive. Control measures should initially verify the soil types which occur in work locations. The higher risk texture contrast soil can be identified by the red and yellow mottling of the hard clayey subsoil. If so, care should be taken to minimise exposure of subsoils particularly where contaminated runoff may exit the area. Monitoring of downstream water courses should focus on pH, electrical conductivity and sediment load. Values should be compared with natural background levels measured upstream from any construction activity.
28
GTES PTY LTD
29
GTES PTY LTD
5 AGRICULTURAL LAND SUITABILITY
5.1 BACKGROUND
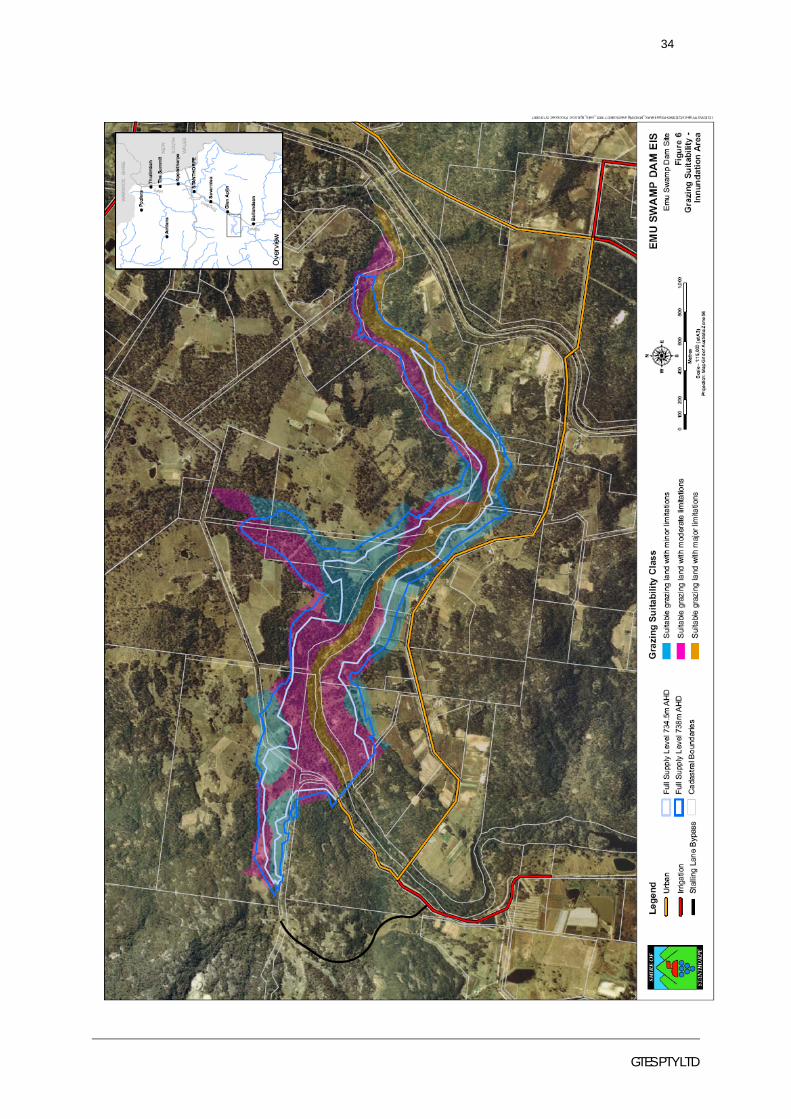
Figures 5 and 6 show the current agricultural suitability class for cropping and grazing land uses in the inundation area. In the dam inundation area, the grazing of native and improved pastures by sheep and beef cattle has remained the dominant land use on the northern side of the Severn River while southern fringes have maintained forage cropping, fruit, vegetables and vines. The methodology used to identify agricultural suitability was described in Section 2.5. Limiting factors The following limitations are considered relevant to the suitability for rainfed cropping and grazing in the area. These were (using the DPI nomenclature in brackets);
plant available water capacity (m); nutrient deficiency (n); soil physical factors (p); soil workability (k); salinity (s); rockiness (r); microrelief (g-gilgai); wetness (w); water erosion (e); flooding (f); and topography (t).
Land suitability class is determined by the highest ranking limiting factor or a combination of a number of factors. Normally, only the most severe two or three limiting factors would determine suitability and the remainder become irrelevant. For this reason, only the major limiting factors determining suitability are presented. In this survey, the main limiting factors which determined crop and grazing suitability class were plant available moisture (m), nutrient deficiency (n), soil physical factors (p), erosion (e) workability (k) and susceptibility to flooding (f). Land suitability classification is based on specific land uses assessed using the following classes:
Class 1 Suitable land with negligible limitations and is highly productive requiring only simple management practices;
Class 2 Suitable land with minor limitations which either reduce production or require more than simple management practices to sustain the use;
Class 3 Suitable land with moderate limitations – Land which is moderately suited to a proposed use but which requires significant inputs to ensure sustainable use;
Class 4 Marginal land with severe limitations which make it doubtful whether the inputs required to achieve and maintain production outweigh the benefits in the long term; and
Class 5 Unsuitable land with extreme limitations that precludes its use.
30
GTES PTY LTD
5.2 LAND SUITABILITY FOR CROPPING
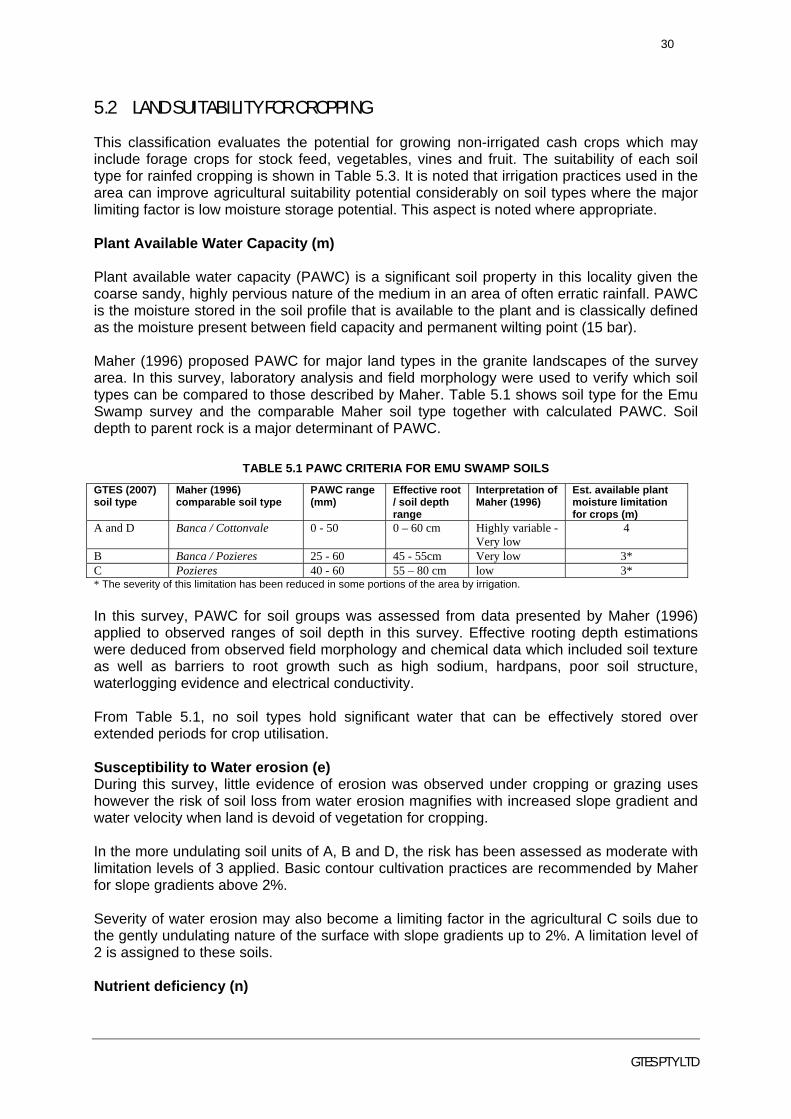
This classification evaluates the potential for growing non-irrigated cash crops which may include forage crops for stock feed, vegetables, vines and fruit. The suitability of each soil type for rainfed cropping is shown in Table 5.3. It is noted that irrigation practices used in the area can improve agricultural suitability potential considerably on soil types where the major limiting factor is low moisture storage potential. This aspect is noted where appropriate. Plant Available Water Capacity (m) Plant available water capacity (PAWC) is a significant soil property in this locality given the coarse sandy, highly pervious nature of the medium in an area of often erratic rainfall. PAWC is the moisture stored in the soil profile that is available to the plant and is classically defined as the moisture present between field capacity and permanent wilting point (15 bar). Maher (1996) proposed PAWC for major land types in the granite landscapes of the survey area. In this survey, laboratory analysis and field morphology were used to verify which soil types can be compared to those described by Maher. Table 5.1 shows soil type for the Emu Swamp survey and the comparable Maher soil type together with calculated PAWC. Soil depth to parent rock is a major determinant of PAWC.
TABLE 5.1 PAWC CRITERIA FOR EMU SWAMP SOILS
GTES (2007) soil type
Maher (1996) comparable soil type
PAWC range (mm)
Effective root / soil depth range
Interpretation of Maher (1996)
Est. available plant moisture limitation for crops (m)
A and D Banca / Cottonvale 0 - 50 0 – 60 cm Highly variable -Very low
4
B Banca / Pozieres 25 - 60 45 - 55cm Very low 3* C Pozieres 40 - 60 55 – 80 cm low 3* * The severity of this limitation has been reduced in some portions of the area by irrigation. In this survey, PAWC for soil groups was assessed from data presented by Maher (1996) applied to observed ranges of soil depth in this survey. Effective rooting depth estimations were deduced from observed field morphology and chemical data which included soil texture as well as barriers to root growth such as high sodium, hardpans, poor soil structure, waterlogging evidence and electrical conductivity. From Table 5.1, no soil types hold significant water that can be effectively stored over extended periods for crop utilisation. Susceptibility to Water erosion (e) During this survey, little evidence of erosion was observed under cropping or grazing uses however the risk of soil loss from water erosion magnifies with increased slope gradient and water velocity when land is devoid of vegetation for cropping. In the more undulating soil units of A, B and D, the risk has been assessed as moderate with limitation levels of 3 applied. Basic contour cultivation practices are recommended by Maher for slope gradients above 2%. Severity of water erosion may also become a limiting factor in the agricultural C soils due to the gently undulating nature of the surface with slope gradients up to 2%. A limitation level of 2 is assigned to these soils. Nutrient deficiency (n)
31
GTES PTY LTD
All sites indicated quite low fertility which is consistent with conclusions of Maher (1996) on similar soils in the area. Accordingly all soil types have a limitation level of 3 which would normally require fertiliser inputs for cropping. Soil Physical Factors (p) This limitation deals with conditions which determine sufficient seed contact with moist soil to prevent desiccation prior to germination and establishment. This condition applies to Emu Creek coarse sandy soils which may become waterlogged and have a narrow moisture storage potential for plant exploitation. Accordingly a limitation level of 3 applies to soil C (greater soil depth to reduce effects of waterlogging) and 4 to A, B and D. Rockiness (r) Rockiness refers to the amount of rock out crop and coarse fragments greater than 6 cm in diameter. Soil types A,B and D feature areas of granite outcropping which is considered a significant limitation for cultivation. Accordingly, limitation levels of 4 and 5 are assigned for this reason. Most soil type C is not significantly affected by surface rock and is assigned a level 2 limitation level. Flooding (f) Flooding may limit cropping opportunities due to the high risk of erosion of cultivated soil as well as loss of access in critical times. The alluvial channels of soil type A would flood regularly for short periods which attracts a limitation level 4. Topography (t) Topography is assessed in terms of slope. Slope may limit the effective and safe use of machinery and contribute to erosion hazard. Soils A, B and D are limitation level 4 and C is 2. Salinity (s) This refers to the reduction in dry matter yield as a result of soluble salt in the soil profile. No saline soils were evidenced from laboratory data or documented by Maher for these soil types. Accordingly a salinity limitation of 1 applies. Soil B may have increasing salt at depth but insufficient to affect the severity of this limitation.
5.3 SUITABILITY FOR GRAZING
The assessment process for grazing of native pastures adopted in his report follows that used by Shields and Williams (1991) and utilises the same limitations used to assess cropping. Basically, apart from the alluvial channels, all soils do not have significant limitations to a grazing use with the incorporation of sound management practices and have potential for pasture improvement. Class 1 to 3 lands are considered suitable for significant pasture improvement, class 4 offers marginal potential for pasture improvement, and class 5 is not suitable for improvement and restricted to grazing of native pastures with low productivity. Major limiting factors are assigned a severity rating (1-5) with the most severe being the overall suitability class for that soil type. The alluvial A soils present more stringent management requirements and are assigned as class 4. The other soils are considered classes 2 and 3 as a result of limitations from restricted soil water availability, erosion susceptibility and fertility.
32
GTES PTY LTD
Plant Available Water Capacity (m) Using the logic described above for assessment of cropping lands, the assigned limitation levels for PAWC are described in Table 5.2 below;
TABLE 5.2 PAWC CRITERIA FOR EMU SWAMP SOILS - GRAZING Soil type Est. available plant
moisture limitation for grazing (m)
A, B and D 3 C 2
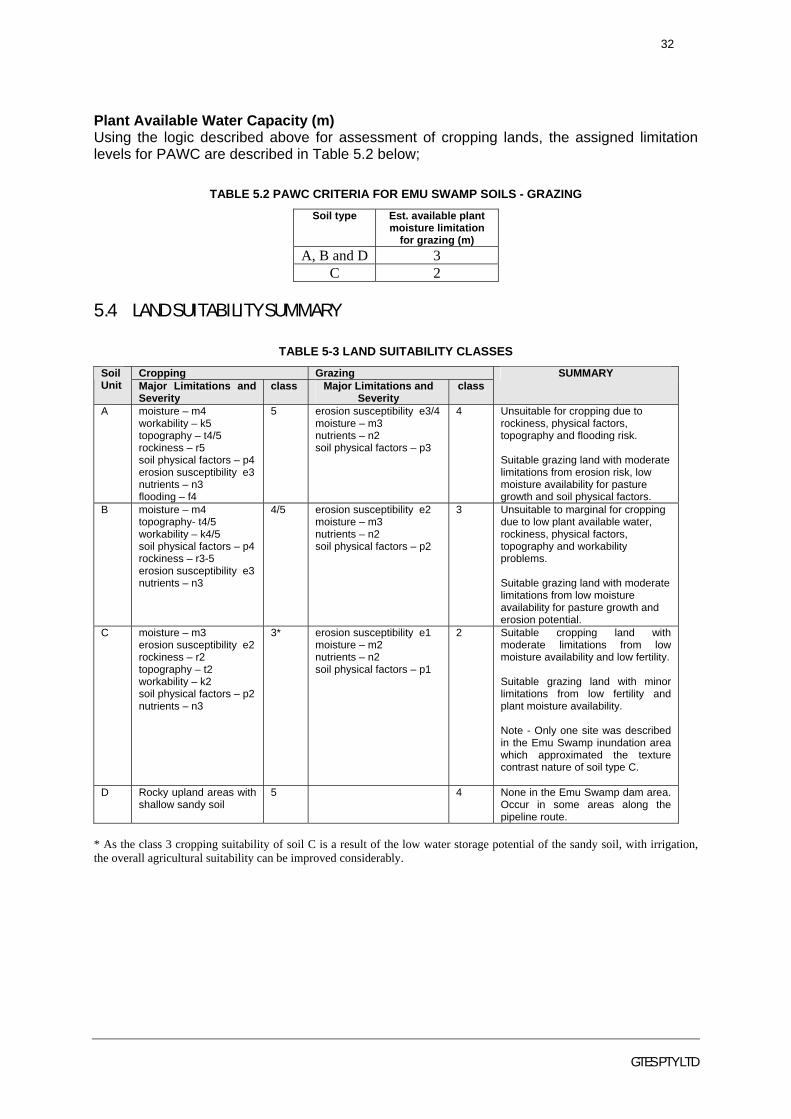
5.4 LAND SUITABILITY SUMMARY
TABLE 5-3 LAND SUITABILITY CLASSES
Cropping Grazing Soil Unit Major Limitations and
Severity class Major Limitations and
Severity class
SUMMARY
A moisture – m4 workability – k5 topography – t4/5 rockiness – r5 soil physical factors – p4 erosion susceptibility e3 nutrients – n3 flooding – f4
5 erosion susceptibility e3/4 moisture – m3 nutrients – n2 soil physical factors – p3
4 Unsuitable for cropping due to rockiness, physical factors, topography and flooding risk. Suitable grazing land with moderate limitations from erosion risk, low moisture availability for pasture growth and soil physical factors.
B moisture – m4 topography- t4/5 workability – k4/5 soil physical factors – p4 rockiness – r3-5 erosion susceptibility e3 nutrients – n3
4/5 erosion susceptibility e2 moisture – m3 nutrients – n2 soil physical factors – p2
3 Unsuitable to marginal for cropping due to low plant available water, rockiness, physical factors, topography and workability problems. Suitable grazing land with moderate limitations from low moisture availability for pasture growth and erosion potential.
C
moisture – m3 erosion susceptibility e2 rockiness – r2 topography – t2 workability – k2 soil physical factors – p2 nutrients – n3
3* erosion susceptibility e1 moisture – m2 nutrients – n2 soil physical factors – p1
2 Suitable cropping land with moderate limitations from low moisture availability and low fertility. Suitable grazing land with minor limitations from low fertility and plant moisture availability. Note - Only one site was described in the Emu Swamp inundation area which approximated the texture contrast nature of soil type C.
D Rocky upland areas with shallow sandy soil
5 4 None in the Emu Swamp dam area. Occur in some areas along the pipeline route.
* As the class 3 cropping suitability of soil C is a result of the low water storage potential of the sandy soil, with irrigation, the overall agricultural suitability can be improved considerably.

33
GTES PTY LTD
34
GTES PTY LTD
35
GTES PTY LTD
Current land condition Observations were made at most sampling sites of the general state of the land in terms of erosion, vegetation condition and degradation. Overall, the survey area is in good condition and appeared to have been used in accordance with land suitability. Comments follow for specific aspects. Erosion and structural decline Apart from very minor sedimentation which was evident in some areas of old cultivation to the south of the Severn River, the survey area was not degraded as a result of erosion. Active erosive gullies were not in evidence in any area. Maher (1996) mapped the Cottonvale soil (described as a possible variant of soil type B in GTES 2007) as a possible soil type in the vicinity of the project area. These soils may have sodic dispersive subsoils with possible hard setting surface and present an increased risk from erosion. However in the survey area itself, no sites which match these erosive Cottonvale attributes were found. Apart from one site which had light clayey sand subsoil, all were uniform coarse sands with little indication of clayey, dispersive subsoils. So erosion risk from dispersive soils is not considered a risk in the area with major concern being sedimentation from excessive overland flow on slope gradients over 2%. No evidence of compaction as a result of overgrazing or cultivation practices was obvious. Stocking rates No specific data were obtained of historical rates however the condition of pastures (particularly in view of the dry season) did not indicate overgrazing was occurring. Vegetation Vigor Estimated pasture cover in grazing lands varies from 0% (rock outcrops) up to > 80% with most sites in the 60-70% range. This cover is quite good in view of seasonal experiences. On the flatter lands where most of the original vegetation has been removed, regrowth is not an issue. Native woodland communities appear to be in a healthy condition in most areas where they remain. There is no noticeable weed problem and no noxious species have been observed. Fertility Fertility levels for each soil type have been described previously. Overall, fertility levels recorded are quite low which is consistent with all background data inspected for the area. It is considered that low fertility is a natural aspect of these soils and not a result of land degradation from agricultural practices. Property Management Much of the area has been sub-divided with only 2 significant agricultural farms still operating. Farm infrastructure was well maintained and the properties appear to be very well managed.
5.5 GOOD QUALITY AGRICULTURAL LAND
The Planning Guidelines The Identification of Good Quality Agricultural Land (DLGP and DPI, 1993) have established four Classes of agricultural land for Queensland. Class A Land is considered to be good quality agricultural land. In some areas Class B land (where agricultural land is scarce) and better quality Class C land (where pastoral industries
36
GTES PTY LTD
predominate) may also be considered to be good quality agricultural land. The description of the classes is as follows: CLASS DESCRIPTION Class A Crop land – Land suitable for current and potential crops with limitations to production which range from non to moderate levels. Class B Limited Crop Land – Land that is marginal for current and potential crops due to severe limitations; and suitable for pastures. Engineering and/or agronomic improvements may be required before the land is considered suitable for cropping. Class C Pasture Land – Land suitable only for improved or native pastures due to limitations, which preclude continuous cultivation for crop production; but some areas, may tolerate a short period of ground disturbance for pasture establishment. Class D Non-agricultural Land – Land not suitable for agricultural uses due to extreme limitations. This may be undisturbed land with significant habitat, conservation and/or catchment values or land that may be unsuitable because of very steep slopes, shallow soils, rock outcrop or poor drainage.
In the Stanthorpe Shire, QDPI have identified crop land (Class A), marginal crop land (Class B) and land suitable for improved pastures (Class C). All of the project area has been categorised as Class B - Land that is marginal for current and potential crops due to severe limitations; and suitable for pastures. This survey has followed the Guideline for the identification of good agricultural land and with the intensive sampling undertaken in this survey has refined the areas of good quality land. A summary of areas considered to be present within the dam inundation area are shown in Table 5.4.
Table 5.4 GQAL Land in the Inundation Area Land suitability Soil
map unit
Important Limitations Fruit, vine, vegetable
forage crops Grazing native pastures
GQAL Land type
Area (ha)
A Flooding and access, Highly variable surface topography with rock outcrop, steep embankments and creek flats, Highly variable soil depth, High erosion risk if cleared, Infertile, very low water holding capacity, Effective plant root depth Low & highly variable.
Not suitable class 5 Limitation ratings moisture – m4 workability – k5 topography – t4/5 rockiness – r5 soil physical factors – p4 erosion susceptibility e3 nutrients – n3 flooding – f4
Suitable class 3 Limitation ratings erosion susceptibility e3 moisture – m3 nutrients – n2 soil physical factors – p3
Class D - Non-agricultural Land
46
B Erosion risk increasing on slopes >2%, Stone and rock, Very infertile, very low water holding capacity, excessively drained and waterlogging due to water trapped by bedrock or hardpans. Effective plant root depth can be quite variable.
Not suitable class 5 Limitation ratings moisture – m4 topography- t5 workability – k4 soil physical factors – p4 rockiness – r4 erosion susceptibility e3 nutrients – n3
Suitable class 3 Limitation ratings erosion susceptibility e2 moisture – m3 nutrients – n2 soil physical factors – p2
Class B – limited crop land suitable to pastures
83
C Erosion risk increasing in cultivation on slopes >1%, Low plant available water holding capacity, Low fertility, excessively drained and possible waterlogging due to water trapped by hardpans. Effective plant root depth in depth range of 40 – 90cm (mainly 50-60cm).
Suitable class 3 Limitation ratings moisture – m3 erosion susceptibility e2 rockiness – r2 topography – t2 workability – k2 soil physical factors – p2 nutrients – n3
Suitable class 2 Limitation ratings erosion susceptibility e2 moisture – m2 nutrients – n2 soil physical factors – p1
Class A – crop land
67

37
GTES PTY LTD
5.6 GQAL CONCLUSION
From evidence available from previous surveys and that generated in this survey, (which has a refined mapping scale following 1:10000 sampling intensity), the area covers a range of good quality agricultural land categories which is made up of 67 hectares of class A crop land, 83 hectares of class B pasture grazing land and 46 ha of unsuitable class D land.
38
GTES PTY LTD
6 CONSTRUCTION MANAGEMENT
6.1 MAJOR ENVIRONMENTAL RISKS FROM SOIL DISTURBANCE
Dam Inundation Area The major soil type in the area is uniform coarse sands overlying bedrock or gritty gravels. Major ground disturbance works will be required in this area which will include the removal of vegetation as well as the stripping and transport of topsoil for construction works. Consequently, the area will be exposed and vulnerable to erosive processes. Major environmental risks from the effects of construction activities on soils are seen as;
• All soils have moderate risk of sediment being removed (siltation) downstream from exposed surfaces or topsoil stockpiles which increases with slope gradient and proximity of disturbed areas to natural water flow paths.
• A low risk of soil dispersion or salinity exists on the uniform sands and sandy A horizons of texture contrast soils which may be encountered.
Proposed Pipeline Routes Assessments of major environmental risk have been carried out based on the data of Powell (1975), Wills (1976,1980) and Maher (1996) with risks developed essentially from field checking and refinement of soil boundaries of Maher.
Some variation in mapping boundaries of Maher (1996) and Powell (1975) were noted although the range of soils in the area as a whole were consistent. Accordingly, the soil types described in this report along the pipeline route may differ from Maher (1996) and Powell (1975) in some areas.
The major soil types along the proposed route are the uniform coarse sands referred to as soil types B, C and D. Major environmental risks to soils are seen as;
• A moderate environmental risk is noted from the existence of texture contrast
soil variant which may occur in soil type B. It is only after excavation that the clayey subsoil becomes evident. Construction activity should therefore expect such soil variation. These soils have clayey subsoils below 50cm depth which may be approaching levels described by Baker and Eldershaw (1993) as dispersive and saline. Excavated or exposed subsoils which are clayey have increased risk of saline or sodium affected sediment in runoff to local streams.
• All soils have moderate risk of sediment being removed downstream from exposed surfaces or topsoil stockpiles which increases with slope gradient and proximity of disturbed areas to natural water flow paths.
• A low risk of soil dispersion or salinity exists on the uniform sands and sandy A horizons of texture contrast soils.
6.2 ENVIRONMENTAL CONTROLS DURING CONSTRUCTION (ALL AREAS)
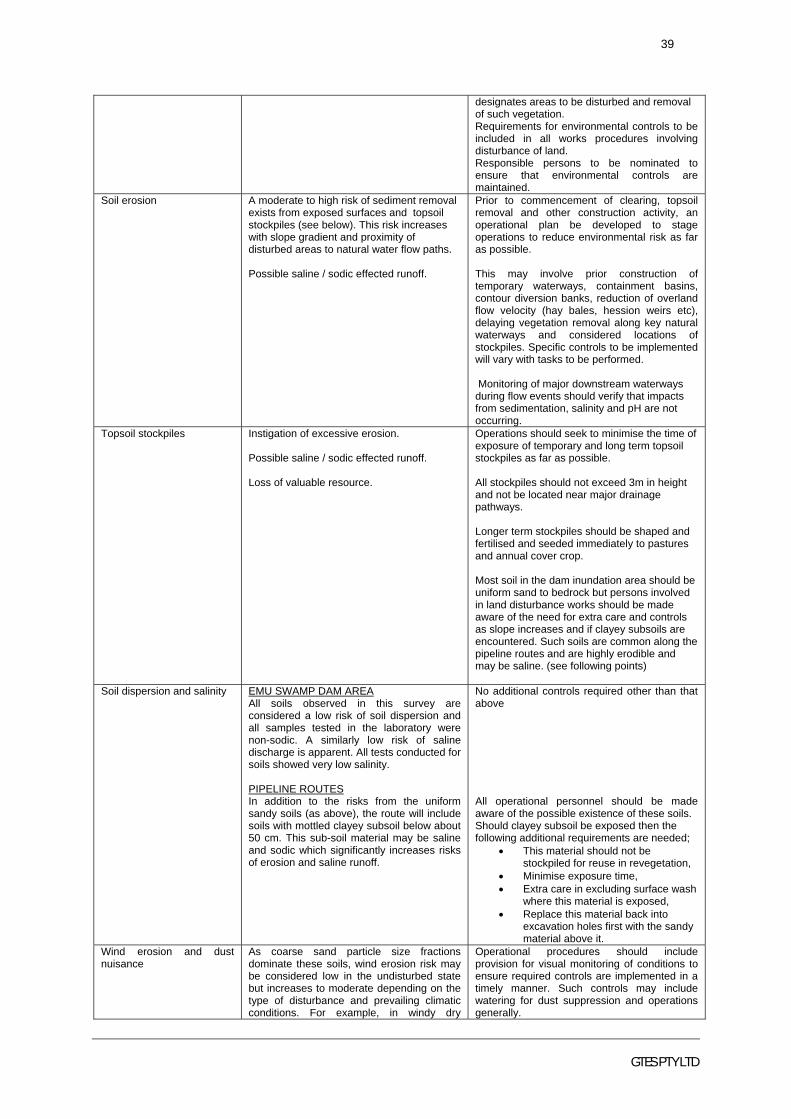
Environmental Aspect Major Risk Controls Clearing of vegetation
Soil erosion risk increases as surface laid bare.
Consider options to maximise vegetation preservation. Develop a clearing plan which clearly
39
GTES PTY LTD
designates areas to be disturbed and removal of such vegetation. Requirements for environmental controls to be included in all works procedures involving disturbance of land. Responsible persons to be nominated to ensure that environmental controls are maintained.
Soil erosion A moderate to high risk of sediment removal exists from exposed surfaces and topsoil stockpiles (see below). This risk increases with slope gradient and proximity of disturbed areas to natural water flow paths. Possible saline / sodic effected runoff.
Prior to commencement of clearing, topsoil removal and other construction activity, an operational plan be developed to stage operations to reduce environmental risk as far as possible. This may involve prior construction of temporary waterways, containment basins, contour diversion banks, reduction of overland flow velocity (hay bales, hession weirs etc), delaying vegetation removal along key natural waterways and considered locations of stockpiles. Specific controls to be implemented will vary with tasks to be performed. Monitoring of major downstream waterways during flow events should verify that impacts from sedimentation, salinity and pH are not occurring.
Topsoil stockpiles Instigation of excessive erosion.
Possible saline / sodic effected runoff. Loss of valuable resource.
Operations should seek to minimise the time of exposure of temporary and long term topsoil stockpiles as far as possible. All stockpiles should not exceed 3m in height and not be located near major drainage pathways. Longer term stockpiles should be shaped and fertilised and seeded immediately to pastures and annual cover crop. Most soil in the dam inundation area should be uniform sand to bedrock but persons involved in land disturbance works should be made aware of the need for extra care and controls as slope increases and if clayey subsoils are encountered. Such soils are common along the pipeline routes and are highly erodible and may be saline. (see following points)
Soil dispersion and salinity EMU SWAMP DAM AREA All soils observed in this survey are considered a low risk of soil dispersion and all samples tested in the laboratory were non-sodic. A similarly low risk of saline discharge is apparent. All tests conducted for soils showed very low salinity. PIPELINE ROUTES In addition to the risks from the uniform sandy soils (as above), the route will include soils with mottled clayey subsoil below about 50 cm. This sub-soil material may be saline and sodic which significantly increases risks of erosion and saline runoff.
No additional controls required other than that above All operational personnel should be made aware of the possible existence of these soils. Should clayey subsoil be exposed then the following additional requirements are needed;
• This material should not be stockpiled for reuse in revegetation,
• Minimise exposure time, • Extra care in excluding surface wash
where this material is exposed, • Replace this material back into
excavation holes first with the sandy material above it.
Wind erosion and dust nuisance
As coarse sand particle size fractions dominate these soils, wind erosion risk may be considered low in the undisturbed state but increases to moderate depending on the type of disturbance and prevailing climatic conditions. For example, in windy dry
Operational procedures should include provision for visual monitoring of conditions to ensure required controls are implemented in a timely manner. Such controls may include watering for dust suppression and operations generally.

40
GTES PTY LTD
conditions, topsoil removal using scrapers may initiate excessive wind erosion and nuisance.
41
GTES PTY LTD
7 REFERENCES
Baker, D.E. and Eldershaw, V.J. (1993) Interpreting Soil Analysis for agricultural use in Queensland. QDPI QO93014 Bruce, R.C. and Rayment, G.F. (1982). Analytical Methods and interpretations used by the Agricultural chemical Branch, QDPI, for soil and land use surveys. QDPI Bulletin QB82004. Bruce, R.C. and Rayment, G.F. (1984). Soil Testing and Some Test Interpretations used by the QDPI. QDPI Bulletin QI84029 DHLGP and DPI, (1993) Identification of Good Quality Agricultural Land and the State Planning Policy 1/92. Gunn, R.H, Beattie, J.A., Reid, R.E. and van de Graff, R. (1988). Australian Soil and Land Survey Handbook. Inkata Press Melbourne. Isbell, R.F (1998) The Australian Soil Classification. CSIRO Publishing Land Resources Branch (1989) Guidelines for Land Suitability Evaluation in Queensland. QDPI. Maher,J.M. (ed) 1996 Understanding and Managing Soils in the Stanthorpe-Rosenthal Region. Department of Natural Resources. DNRQ96001, Brisbane. McDonald, R.C. and Isbell, R.F. (1984). Australian soil and land survey field handbook, Inkata Press. Powell. B 1975. Soils of the Granite Belt Region. South-east Queensland. ( soil map) QDPI. Powell. B 1977. Soils of the Granite Belt Vineyards. South-east Queensland. QDPI. Shields, P.G. and Williams, B.M. (1991) Land resource survey and evaluation of the Kilcummin area, Queensland. QDPI bulletin QV 91001. Wills, A.K. 1980. Granite Belt Soil Erosion Survey. QDPI Wills, A.K. 1976 The Granite and Traprock area of South East Queensland. Part1 Land Inventory and Part 2 Land Utilization Study

GTES PTY LTD
ATTACHMENTS
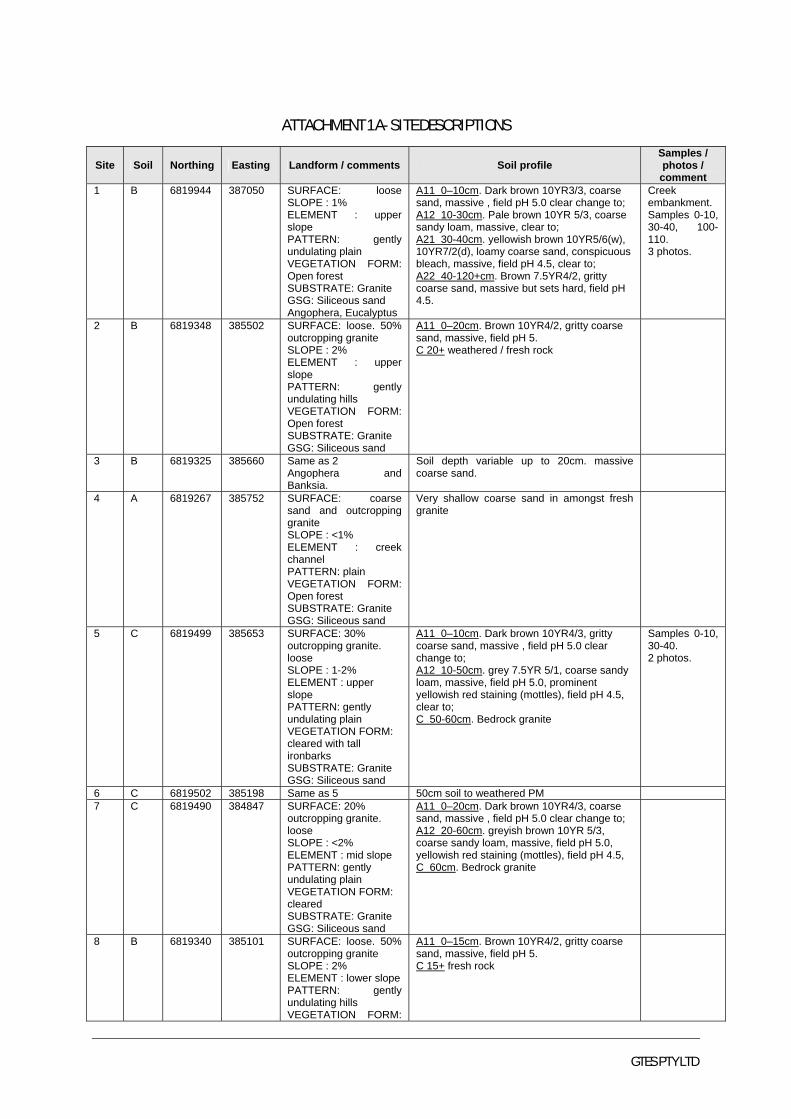
GTES PTY LTD
ATTACHMENT 1 A- SITE DESCRIPTIONS
Site Soil Northing Easting Landform / comments Soil profile Samples / photos /
comment 1 B 6819944 387050 SURFACE: loose
SLOPE : 1% ELEMENT : upper slope PATTERN: gently undulating plain VEGETATION FORM: Open forest SUBSTRATE: Granite GSG: Siliceous sand Angophera, Eucalyptus
A11 0–10cm. Dark brown 10YR3/3, coarse sand, massive , field pH 5.0 clear change to; A12 10-30cm. Pale brown 10YR 5/3, coarse sandy loam, massive, clear to; A21 30-40cm. yellowish brown 10YR5/6(w), 10YR7/2(d), loamy coarse sand, conspicuous bleach, massive, field pH 4.5, clear to; A22 40-120+cm. Brown 7.5YR4/2, gritty coarse sand, massive but sets hard, field pH 4.5.
Creek embankment. Samples 0-10, 30-40, 100-110. 3 photos.
2 B 6819348 385502 SURFACE: loose. 50% outcropping granite SLOPE : 2% ELEMENT : upper slope PATTERN: gently undulating hills VEGETATION FORM: Open forest SUBSTRATE: Granite GSG: Siliceous sand
A11 0–20cm. Brown 10YR4/2, gritty coarse sand, massive, field pH 5. C 20+ weathered / fresh rock
3 B 6819325 385660 Same as 2 Angophera and Banksia.
Soil depth variable up to 20cm. massive coarse sand.
4 A 6819267 385752 SURFACE: coarse sand and outcropping granite SLOPE : <1% ELEMENT : creek channel PATTERN: plain VEGETATION FORM: Open forest SUBSTRATE: Granite GSG: Siliceous sand
Very shallow coarse sand in amongst fresh granite
5 C 6819499 385653 SURFACE: 30% outcropping granite. loose SLOPE : 1-2% ELEMENT : upper slope PATTERN: gently undulating plain VEGETATION FORM: cleared with tall ironbarks SUBSTRATE: Granite GSG: Siliceous sand
A11 0–10cm. Dark brown 10YR4/3, gritty coarse sand, massive , field pH 5.0 clear change to; A12 10-50cm. grey 7.5YR 5/1, coarse sandy loam, massive, field pH 5.0, prominent yellowish red staining (mottles), field pH 4.5, clear to; C 50-60cm. Bedrock granite
Samples 0-10, 30-40. 2 photos.
6 C 6819502 385198 Same as 5 50cm soil to weathered PM 7 C 6819490 384847 SURFACE: 20%
outcropping granite. loose SLOPE : <2% ELEMENT : mid slope PATTERN: gently undulating plain VEGETATION FORM: cleared SUBSTRATE: Granite GSG: Siliceous sand
A11 0–20cm. Dark brown 10YR4/3, coarse sand, massive , field pH 5.0 clear change to; A12 20-60cm. greyish brown 10YR 5/3, coarse sandy loam, massive, field pH 5.0, yellowish red staining (mottles), field pH 4.5, C 60cm. Bedrock granite
8 B 6819340 385101 SURFACE: loose. 50% outcropping granite SLOPE : 2% ELEMENT : lower slope PATTERN: gently undulating hills VEGETATION FORM:
A11 0–15cm. Brown 10YR4/2, gritty coarse sand, massive, field pH 5. C 15+ fresh rock

GTES PTY LTD
Open forest SUBSTRATE: Granite GSG: Siliceous sand
9 A 6819245 385001 Creek line through much outcropping granite
Minor coarse sand between granite
10 C 6819550 384876 SURFACE: loose. Below massive outcropping granite SLOPE : 4% ELEMENT : mid slope PATTERN: gently undulating hills VEGETATION FORM: Open forest SUBSTRATE: Granite GSG: Siliceous sand
A11 0–25cm. Brown 10YR4/2, gritty coarse sand, massive, field pH 5. C 25+ weathered / fresh rock
11 C 6818880 385582 SURFACE: cultivation with forage crop, loose. Gritty sand SLOPE : 1-2% ELEMENT : mid slope PATTERN: gently undulating plain VEGETATION FORM: cleared SUBSTRATE: Granite GSG: Siliceous sand
AP 0–20cm. Dark brown 10YR4/3, coarse gritty sand, massive , field pH 5.0 clear change to; A12 20-50cm. greyish brown 10YR 5/3, coarse sandy loam, massive, field pH 5.0, A21 50-100cm+ loamy coarse sand , greyish brown 10YR5/3 with yellowish red staining (mottles), field pH 4.5,
Cultivation wet from 20 to 70cm. Samples 0-10, 40-50, 60-70. 2 photos.
12 B 6818995 385544 SURFACE: loose sand with outcropping granite SLOPE : 3-4% ELEMENT : mid slope PATTERN: gently undulating hills VEGETATION FORM: Open forest SUBSTRATE: Granite GSG: Siliceous sand
A11 0–25cm. pale brown 10YR5/2, silty loam, massive, field pH 5. C 25+ weathered / fresh rock
13 B 6818891 385260 SURFACE: 20% outcropping granite. loose SLOPE : 3% ELEMENT : mid slope PATTERN: undulating plain VEGETATION FORM: tall Angophera mixed scrub SUBSTRATE: Granite GSG: Siliceous sand
AP 0–20cm. Brown 10YR4/2, gritty coarse sand, massive , field pH 5.0 clear change to; A12 20-70cm. greyish brown 7.5YR 5/3, coarse sandy loam, massive, field pH 5.0, field pH 5, clear to; C 70cm. Bedrock granite
Samples 0-20, 60-70. 4 photos.
14 C 6818678 386181 SURFACE: cultivated grapes - loose SLOPE : <1% ELEMENT : flat plain PATTERN: gently undulating plain VEGETATION FORM: grape vines SUBSTRATE: Granite GSG: Siliceous sand
A11 0–20cm. Brown 10YR4/2, gritty coarse sand, massive , field pH 5.0 clear change to; A12 20-50cm. greyish brown 7.5YR 5/3, coarse sandy loam, massive, field pH 5.0, field pH 5, clear to; A21 50-80cm+ loamy coarse sand , greyish brown 10YR5/3 with yellowish red staining (mottles), field pH 4.5,
15 A 6818870 386255 SURFACE: coarse sand and outcropping granite SLOPE : <1% ELEMENT : creek channel PATTERN: plain VEGETATION FORM: Open forest SUBSTRATE: Granite GSG: Siliceous sand
Very shallow coarse sand in amongst fresh granite
16 C 6818533 386428 Irrigated fruit trees and grape vines
A12 0–20cm. Brown 10YR4/2, gritty coarse sand, massive , field pH 5.0 clear change to; A12 20-65cm. greyish brown 7.5YR 5/3, coarse sandy loam, massive, field pH 5.0,
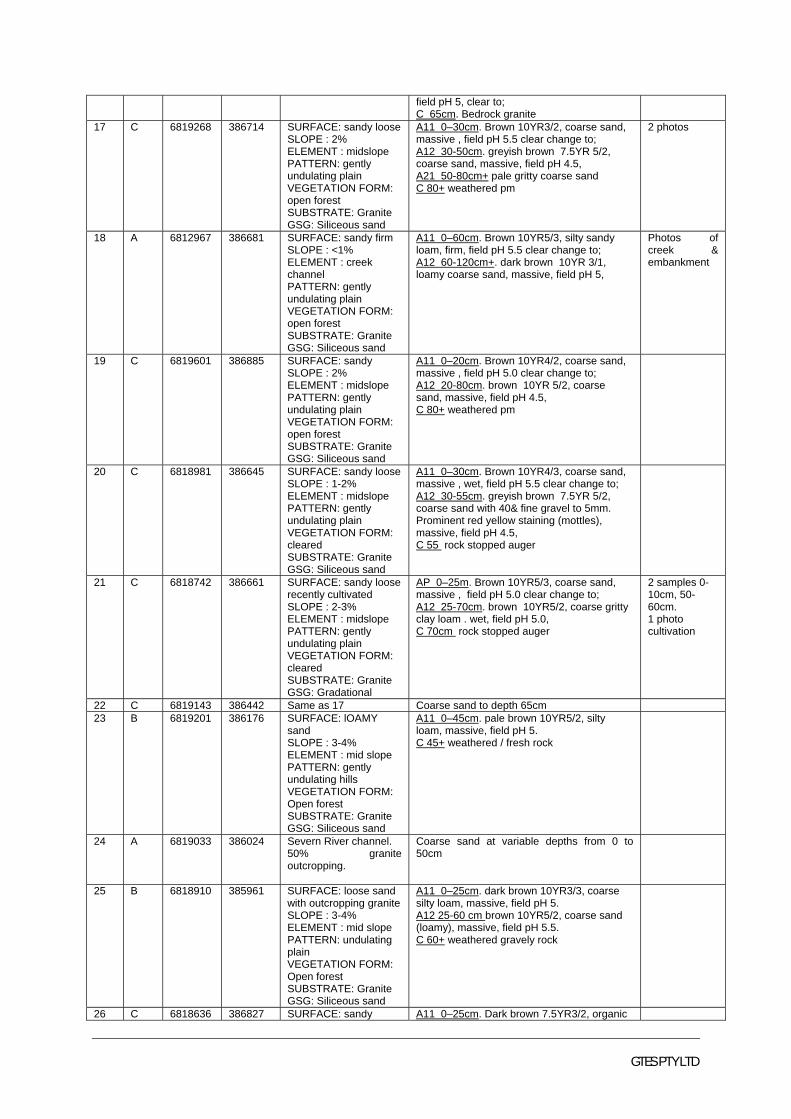
GTES PTY LTD
field pH 5, clear to; C 65cm. Bedrock granite
17 C 6819268 386714 SURFACE: sandy loose SLOPE : 2% ELEMENT : midslope PATTERN: gently undulating plain VEGETATION FORM: open forest SUBSTRATE: Granite GSG: Siliceous sand
A11 0–30cm. Brown 10YR3/2, coarse sand, massive , field pH 5.5 clear change to; A12 30-50cm. greyish brown 7.5YR 5/2, coarse sand, massive, field pH 4.5, A21 50-80cm+ pale gritty coarse sand C 80+ weathered pm
2 photos
18 A 6812967 386681 SURFACE: sandy firm SLOPE : <1% ELEMENT : creek channel PATTERN: gently undulating plain VEGETATION FORM: open forest SUBSTRATE: Granite GSG: Siliceous sand
A11 0–60cm. Brown 10YR5/3, silty sandy loam, firm, field pH 5.5 clear change to; A12 60-120cm+. dark brown 10YR 3/1, loamy coarse sand, massive, field pH 5,
Photos of creek & embankment
19 C 6819601 386885 SURFACE: sandy SLOPE : 2% ELEMENT : midslope PATTERN: gently undulating plain VEGETATION FORM: open forest SUBSTRATE: Granite GSG: Siliceous sand
A11 0–20cm. Brown 10YR4/2, coarse sand, massive , field pH 5.0 clear change to; A12 20-80cm. brown 10YR 5/2, coarse sand, massive, field pH 4.5, C 80+ weathered pm
20 C 6818981 386645 SURFACE: sandy loose SLOPE : 1-2% ELEMENT : midslope PATTERN: gently undulating plain VEGETATION FORM: cleared SUBSTRATE: Granite GSG: Siliceous sand
A11 0–30cm. Brown 10YR4/3, coarse sand, massive , wet, field pH 5.5 clear change to; A12 30-55cm. greyish brown 7.5YR 5/2, coarse sand with 40& fine gravel to 5mm. Prominent red yellow staining (mottles), massive, field pH 4.5, C 55 rock stopped auger
21 C 6818742 386661 SURFACE: sandy loose recently cultivated SLOPE : 2-3% ELEMENT : midslope PATTERN: gently undulating plain VEGETATION FORM: cleared SUBSTRATE: Granite GSG: Gradational
AP 0–25m. Brown 10YR5/3, coarse sand, massive , field pH 5.0 clear change to; A12 25-70cm. brown 10YR5/2, coarse gritty clay loam . wet, field pH 5.0, C 70cm rock stopped auger
2 samples 0-10cm, 50-60cm. 1 photo cultivation
22 C 6819143 386442 Same as 17 Coarse sand to depth 65cm 23 B 6819201 386176 SURFACE: lOAMY
sand SLOPE : 3-4% ELEMENT : mid slope PATTERN: gently undulating hills VEGETATION FORM: Open forest SUBSTRATE: Granite GSG: Siliceous sand
A11 0–45cm. pale brown 10YR5/2, silty loam, massive, field pH 5. C 45+ weathered / fresh rock
24 A 6819033 386024 Severn River channel. 50% granite outcropping.
Coarse sand at variable depths from 0 to 50cm
25 B 6818910 385961 SURFACE: loose sand with outcropping granite SLOPE : 3-4% ELEMENT : mid slope PATTERN: undulating plain VEGETATION FORM: Open forest SUBSTRATE: Granite GSG: Siliceous sand
A11 0–25cm. dark brown 10YR3/3, coarse silty loam, massive, field pH 5. A12 25-60 cm brown 10YR5/2, coarse sand (loamy), massive, field pH 5.5. C 60+ weathered gravely rock
26 C 6818636 386827 SURFACE: sandy A11 0–25cm. Dark brown 7.5YR3/2, organic
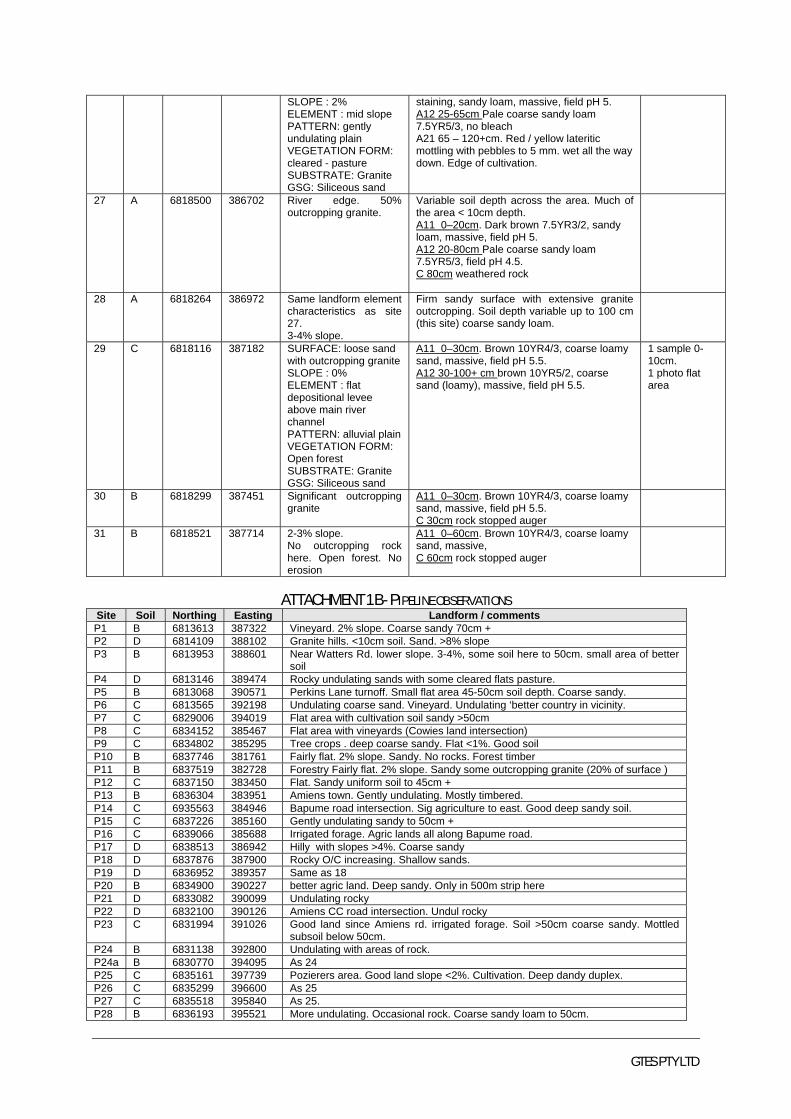
GTES PTY LTD
SLOPE : 2% ELEMENT : mid slope PATTERN: gently undulating plain VEGETATION FORM: cleared - pasture SUBSTRATE: Granite GSG: Siliceous sand
staining, sandy loam, massive, field pH 5. A12 25-65cm Pale coarse sandy loam 7.5YR5/3, no bleach A21 65 – 120+cm. Red / yellow lateritic mottling with pebbles to 5 mm. wet all the way down. Edge of cultivation.
27 A 6818500 386702 River edge. 50% outcropping granite.
Variable soil depth across the area. Much of the area < 10cm depth. A11 0–20cm. Dark brown 7.5YR3/2, sandy loam, massive, field pH 5. A12 20-80cm Pale coarse sandy loam 7.5YR5/3, field pH 4.5. C 80cm weathered rock
28 A 6818264 386972 Same landform element characteristics as site 27. 3-4% slope.
Firm sandy surface with extensive granite outcropping. Soil depth variable up to 100 cm (this site) coarse sandy loam.
29 C 6818116 387182 SURFACE: loose sand with outcropping granite SLOPE : 0% ELEMENT : flat depositional levee above main river channel PATTERN: alluvial plain VEGETATION FORM: Open forest SUBSTRATE: Granite GSG: Siliceous sand
A11 0–30cm. Brown 10YR4/3, coarse loamy sand, massive, field pH 5.5. A12 30-100+ cm brown 10YR5/2, coarse sand (loamy), massive, field pH 5.5.
1 sample 0-10cm. 1 photo flat area
30 B 6818299 387451 Significant outcropping granite
A11 0–30cm. Brown 10YR4/3, coarse loamy sand, massive, field pH 5.5. C 30cm rock stopped auger
31 B 6818521 387714 2-3% slope. No outcropping rock here. Open forest. No erosion
A11 0–60cm. Brown 10YR4/3, coarse loamy sand, massive, C 60cm rock stopped auger
ATTACHMENT 1 B- PIPELINE OBSERVATIONS Site Soil Northing Easting Landform / comments P1 B 6813613 387322 Vineyard. 2% slope. Coarse sandy 70cm + P2 D 6814109 388102 Granite hills. <10cm soil. Sand. >8% slope P3 B 6813953 388601 Near Watters Rd. lower slope. 3-4%, some soil here to 50cm. small area of better
soil P4 D 6813146 389474 Rocky undulating sands with some cleared flats pasture. P5 B 6813068 390571 Perkins Lane turnoff. Small flat area 45-50cm soil depth. Coarse sandy. P6 C 6813565 392198 Undulating coarse sand. Vineyard. Undulating ‘better country in vicinity. P7 C 6829006 394019 Flat area with cultivation soil sandy >50cm P8 C 6834152 385467 Flat area with vineyards (Cowies land intersection) P9 C 6834802 385295 Tree crops . deep coarse sandy. Flat <1%. Good soil P10 B 6837746 381761 Fairly flat. 2% slope. Sandy. No rocks. Forest timber P11 B 6837519 382728 Forestry Fairly flat. 2% slope. Sandy some outcropping granite (20% of surface ) P12 C 6837150 383450 Flat. Sandy uniform soil to 45cm + P13 B 6836304 383951 Amiens town. Gently undulating. Mostly timbered. P14 C 6935563 384946 Bapume road intersection. Sig agriculture to east. Good deep sandy soil. P15 C 6837226 385160 Gently undulating sandy to 50cm + P16 C 6839066 385688 Irrigated forage. Agric lands all along Bapume road. P17 D 6838513 386942 Hilly with slopes >4%. Coarse sandy P18 D 6837876 387900 Rocky O/C increasing. Shallow sands. P19 D 6836952 389357 Same as 18 P20 B 6834900 390227 better agric land. Deep sandy. Only in 500m strip here P21 D 6833082 390099 Undulating rocky P22 D 6832100 390126 Amiens CC road intersection. Undul rocky P23 C 6831994 391026 Good land since Amiens rd. irrigated forage. Soil >50cm coarse sandy. Mottled
subsoil below 50cm. P24 B 6831138 392800 Undulating with areas of rock. P24a B 6830770 394095 As 24 P25 C 6835161 397739 Pozierers area. Good land slope <2%. Cultivation. Deep dandy duplex. P26 C 6835299 396600 As 25 P27 C 6835518 395840 As 25. P28 B 6836193 395521 More undulating. Occasional rock. Coarse sandy loam to 50cm.
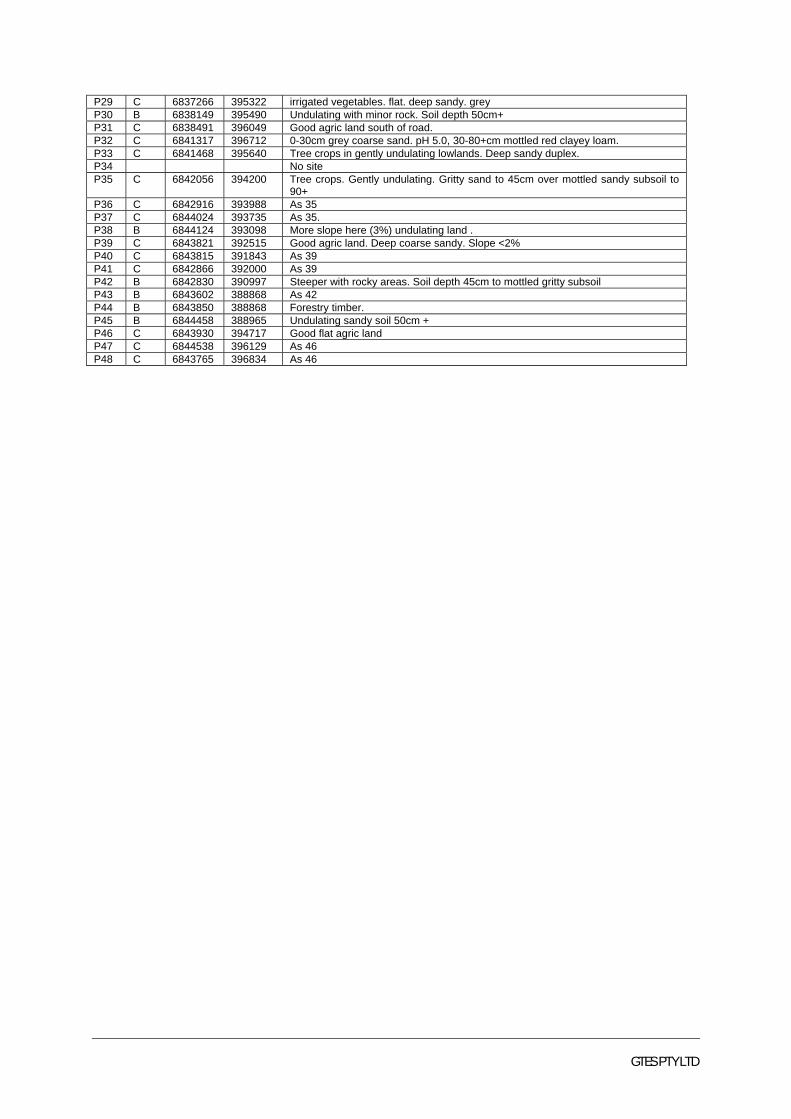
GTES PTY LTD
P29 C 6837266 395322 irrigated vegetables. flat. deep sandy. grey P30 B 6838149 395490 Undulating with minor rock. Soil depth 50cm+ P31 C 6838491 396049 Good agric land south of road. P32 C 6841317 396712 0-30cm grey coarse sand. pH 5.0, 30-80+cm mottled red clayey loam. P33 C 6841468 395640 Tree crops in gently undulating lowlands. Deep sandy duplex. P34 No site P35 C 6842056 394200 Tree crops. Gently undulating. Gritty sand to 45cm over mottled sandy subsoil to
90+ P36 C 6842916 393988 As 35 P37 C 6844024 393735 As 35. P38 B 6844124 393098 More slope here (3%) undulating land . P39 C 6843821 392515 Good agric land. Deep coarse sandy. Slope <2% P40 C 6843815 391843 As 39 P41 C 6842866 392000 As 39 P42 B 6842830 390997 Steeper with rocky areas. Soil depth 45cm to mottled gritty subsoil P43 B 6843602 388868 As 42 P44 B 6843850 388868 Forestry timber. P45 B 6844458 388965 Undulating sandy soil 50cm + P46 C 6843930 394717 Good flat agric land P47 C 6844538 396129 As 46 P48 C 6843765 396834 As 46
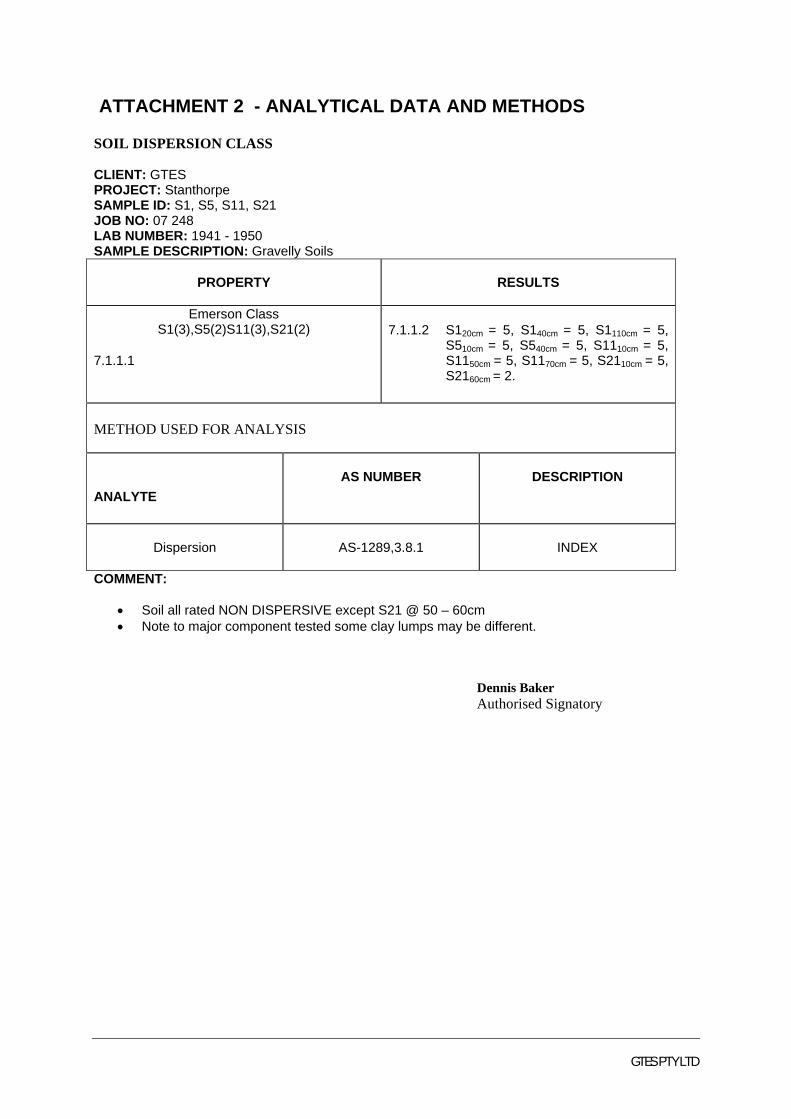
GTES PTY LTD
ATTACHMENT 2 - ANALYTICAL DATA AND METHODS
SOIL DISPERSION CLASS
CLIENT: GTES PROJECT: Stanthorpe SAMPLE ID: S1, S5, S11, S21 JOB NO: 07 248 LAB NUMBER: 1941 - 1950 SAMPLE DESCRIPTION: Gravelly Soils
PROPERTY
RESULTS
Emerson Class
S1(3),S5(2)S11(3),S21(2)
7.1.1.1
7.1.1.2 S120cm = 5, S140cm = 5, S1110cm = 5, S510cm = 5, S540cm = 5, S1110cm = 5, S1150cm = 5, S1170cm = 5, S2110cm = 5, S2160cm = 2.
METHOD USED FOR ANALYSIS
ANALYTE
AS NUMBER
DESCRIPTION
Dispersion
AS-1289,3.8.1
INDEX
COMMENT:
• Soil all rated NON DISPERSIVE except S21 @ 50 – 60cm • Note to major component tested some clay lumps may be different.
Dennis Baker Authorised Signatory
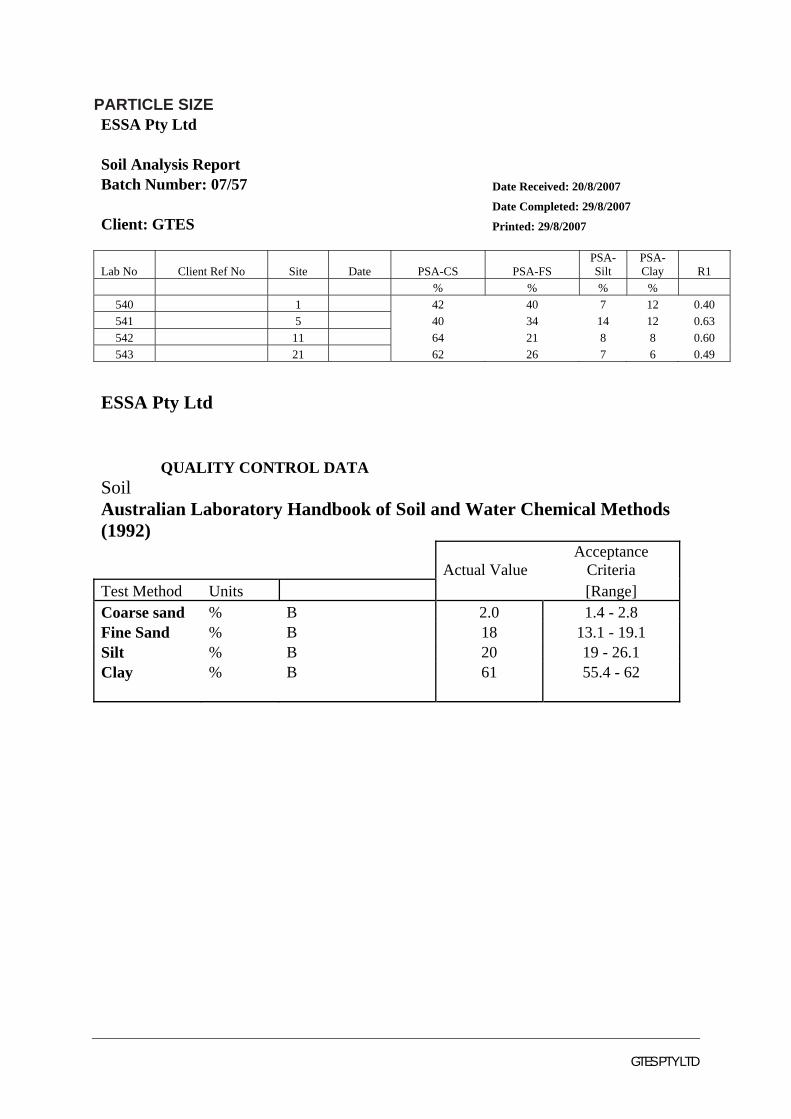
GTES PTY LTD
PARTICLE SIZE ESSA Pty Ltd
Soil Analysis Report Batch Number: 07/57 Date Received: 20/8/2007
Date Completed: 29/8/2007 Client: GTES Printed: 29/8/2007
Lab No Client Ref No Site Date PSA-CS PSA-FS PSA-Silt
PSA-Clay R1
% % % % 540 1 42 40 7 12 0.40 541 5 40 34 14 12 0.63 542 11 64 21 8 8 0.60 543 21 62 26 7 6 0.49
ESSA Pty Ltd
QUALITY CONTROL DATA Soil Australian Laboratory Handbook of Soil and Water Chemical Methods (1992)
Actual Value Acceptance
Criteria Test Method Units [Range] Coarse sand % B 2.0 1.4 - 2.8 Fine Sand % B 18 13.1 - 19.1 Silt % B 20 19 - 26.1 Clay % B 61 55.4 - 62
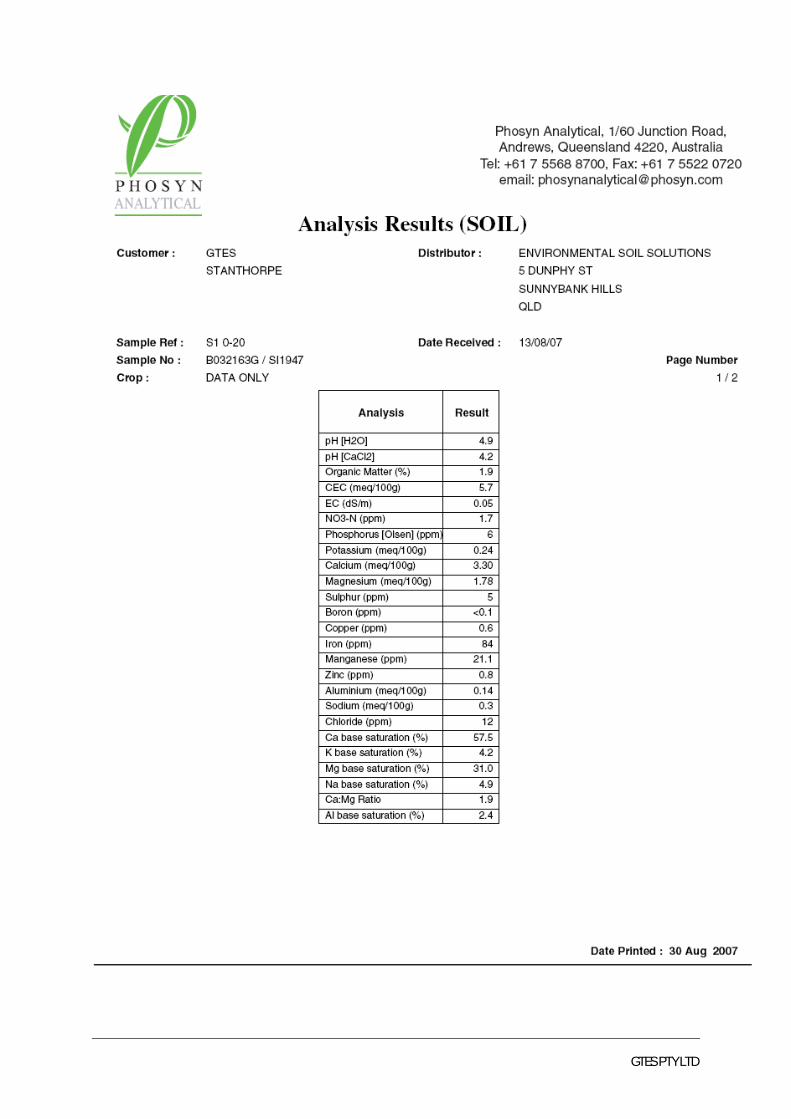
GTES PTY LTD
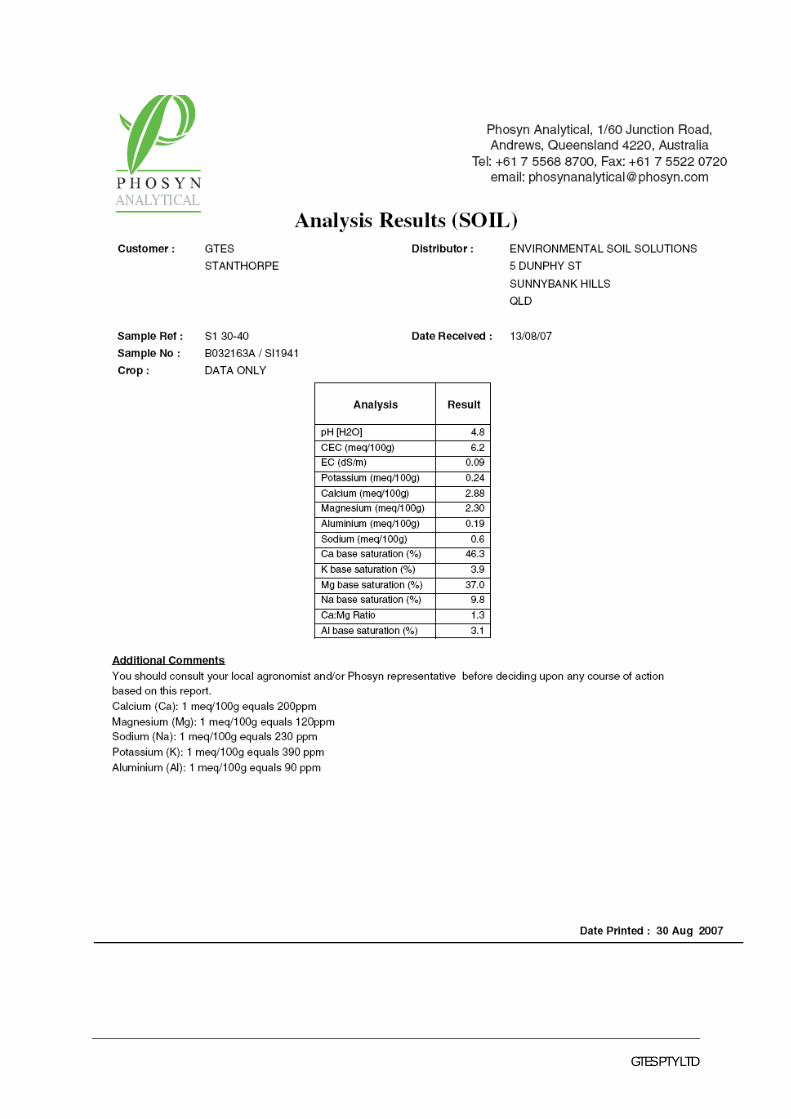
GTES PTY LTD

GTES PTY LTD
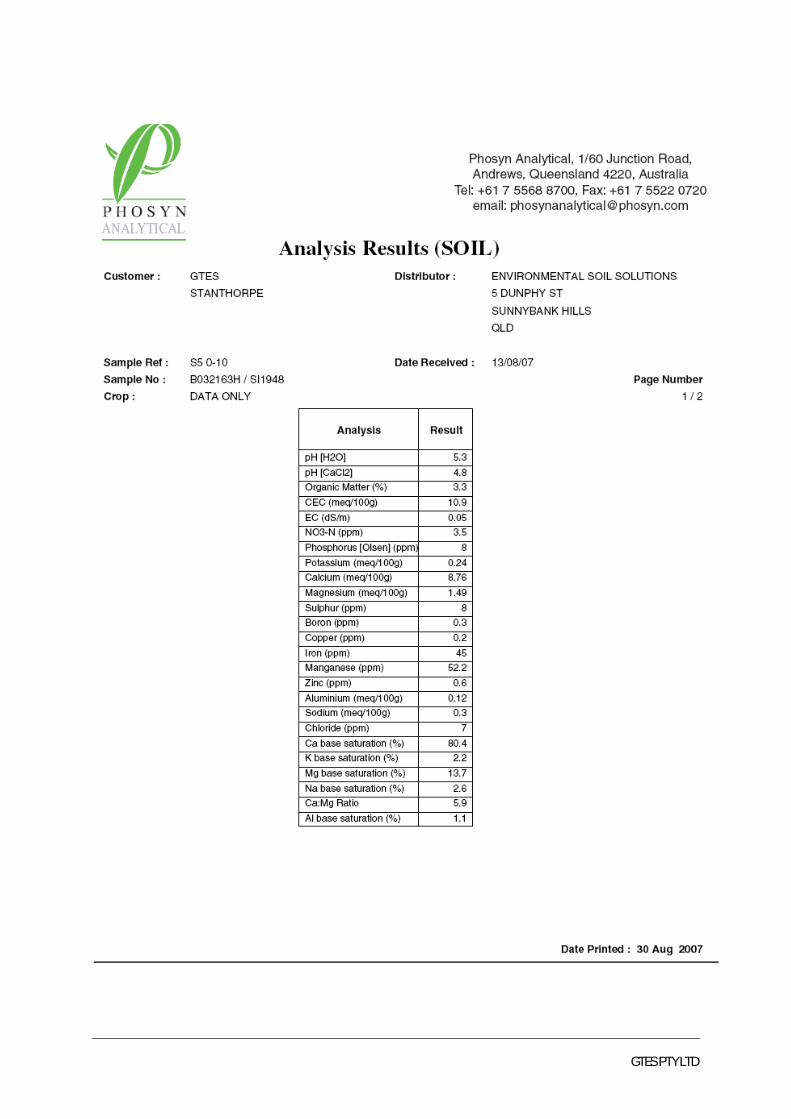
GTES PTY LTD
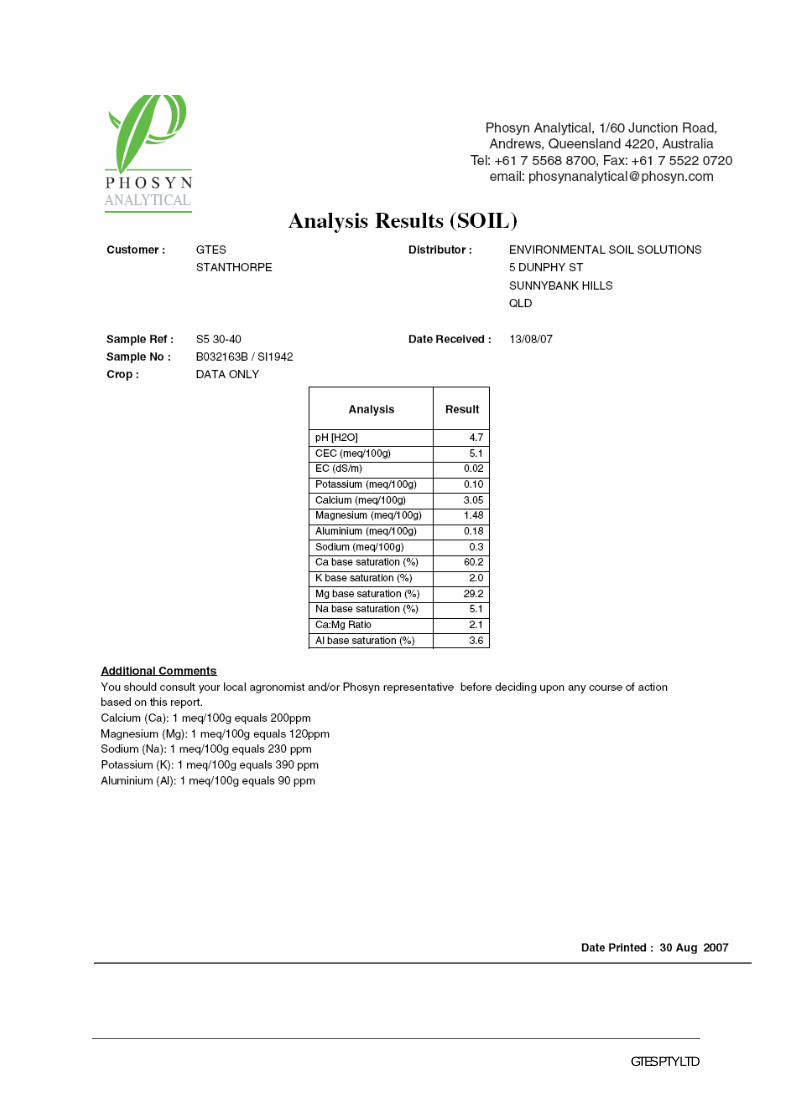
GTES PTY LTD
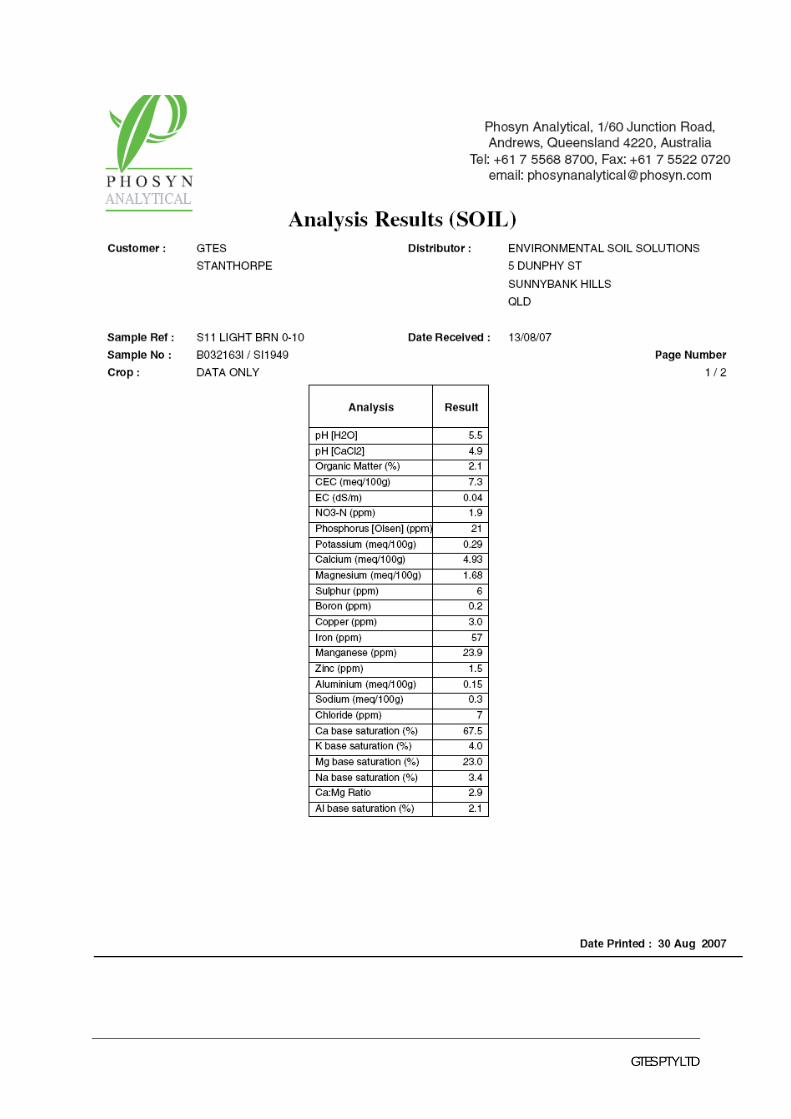
GTES PTY LTD
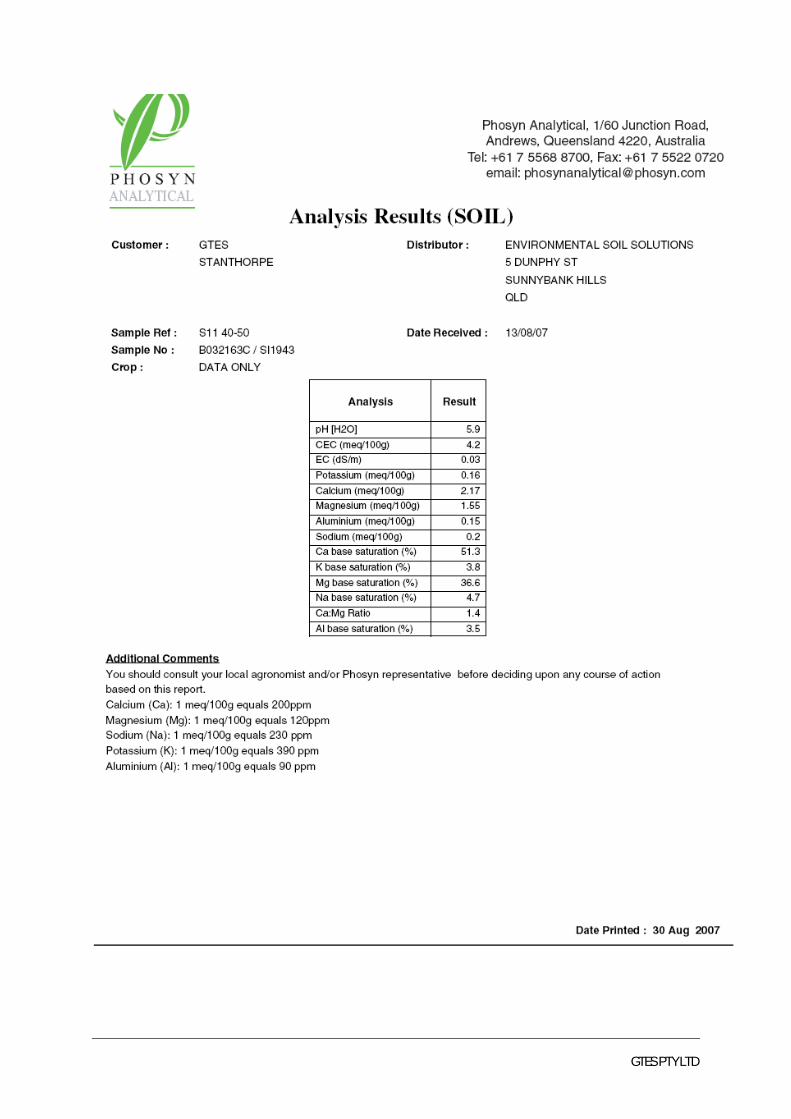
GTES PTY LTD

GTES PTY LTD

GTES PTY LTD
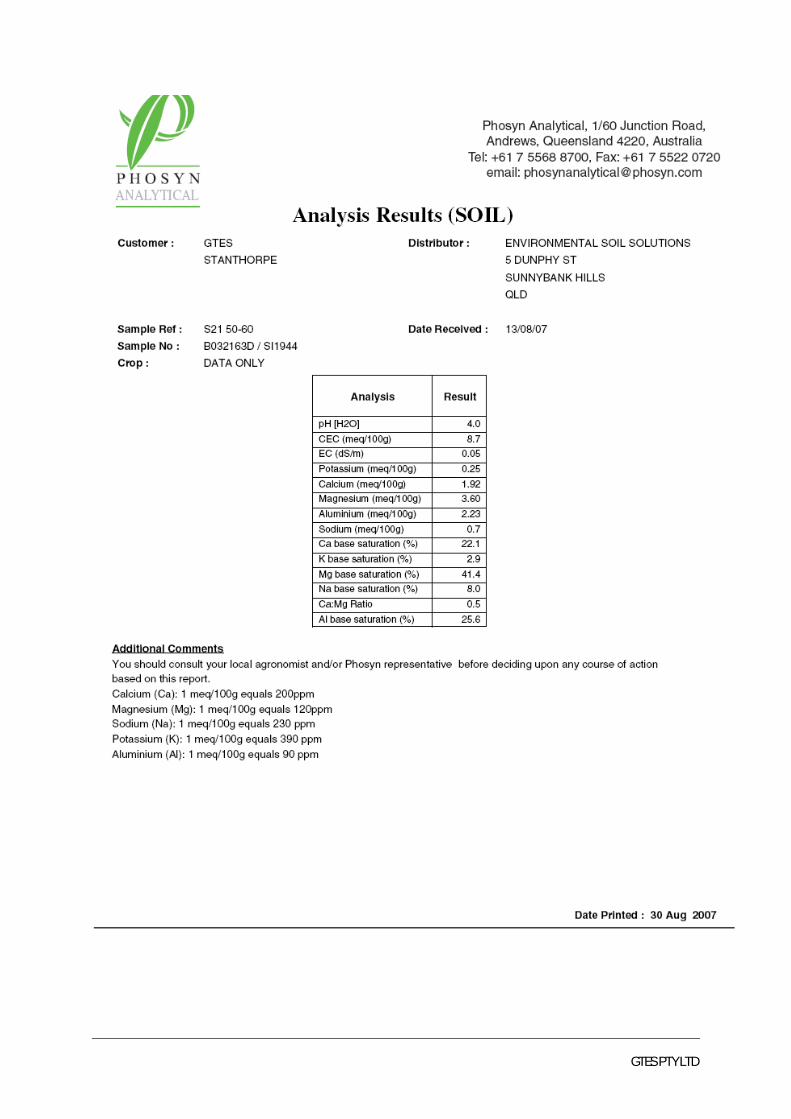
GTES PTY LTD
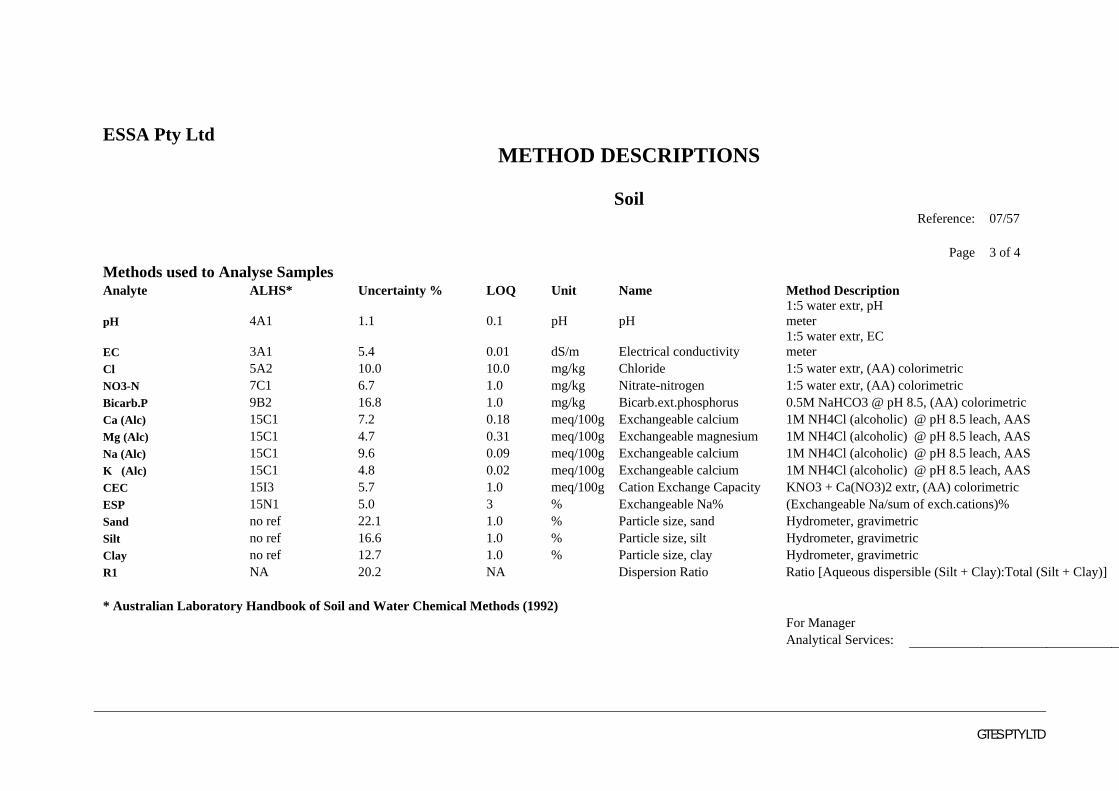
GTES PTY LTD
METHOD DESCRIPTIONS
ESSA Pty Ltd
Soil Reference: 07/57 Page 3 of 4 Methods used to Analyse Samples Analyte ALHS* Uncertainty % LOQ Unit Name Method Description
pH 4A1 1.1 0.1 pH pH 1:5 water extr, pH meter
EC 3A1 5.4 0.01 dS/m Electrical conductivity 1:5 water extr, EC meter
Cl 5A2 10.0 10.0 mg/kg Chloride 1:5 water extr, (AA) colorimetric NO3-N 7C1 6.7 1.0 mg/kg Nitrate-nitrogen 1:5 water extr, (AA) colorimetric Bicarb.P 9B2 16.8 1.0 mg/kg Bicarb.ext.phosphorus 0.5M NaHCO3 @ pH 8.5, (AA) colorimetric Ca (Alc) 15C1 7.2 0.18 meq/100g Exchangeable calcium 1M NH4Cl (alcoholic) @ pH 8.5 leach, AAS Mg (Alc) 15C1 4.7 0.31 meq/100g Exchangeable magnesium 1M NH4Cl (alcoholic) @ pH 8.5 leach, AAS Na (Alc) 15C1 9.6 0.09 meq/100g Exchangeable calcium 1M NH4Cl (alcoholic) @ pH 8.5 leach, AAS K (Alc) 15C1 4.8 0.02 meq/100g Exchangeable calcium 1M NH4Cl (alcoholic) @ pH 8.5 leach, AAS CEC 15I3 5.7 1.0 meq/100g Cation Exchange Capacity KNO3 + Ca(NO3)2 extr, (AA) colorimetric ESP 15N1 5.0 3 % Exchangeable Na% (Exchangeable Na/sum of exch.cations)% Sand no ref 22.1 1.0 % Particle size, sand Hydrometer, gravimetric Silt no ref 16.6 1.0 % Particle size, silt Hydrometer, gravimetric Clay no ref 12.7 1.0 % Particle size, clay Hydrometer, gravimetric R1 NA 20.2 NA Dispersion Ratio Ratio [Aqueous dispersible (Silt + Clay):Total (Silt + Clay)] * Australian Laboratory Handbook of Soil and Water Chemical Methods (1992) For Manager Analytical Services:
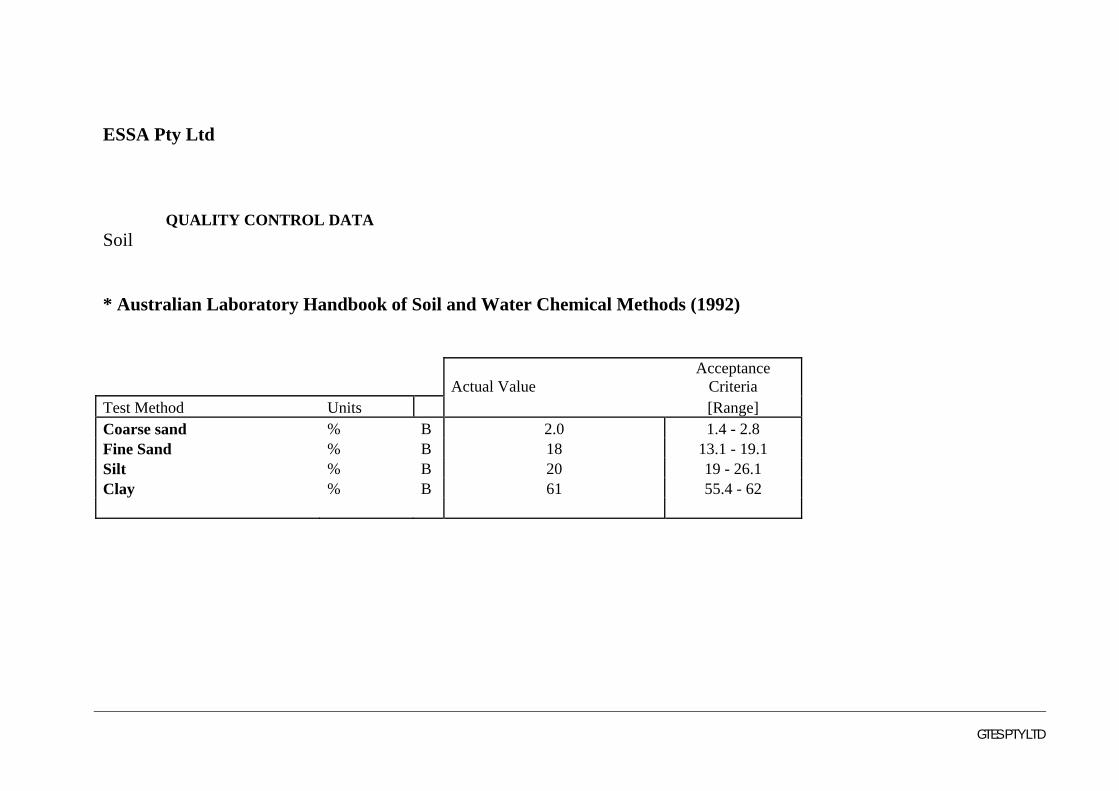
GTES PTY LTD
ESSA Pty Ltd
QUALITY CONTROL DATA Soil * Australian Laboratory Handbook of Soil and Water Chemical Methods (1992)
Actual Value Acceptance
Criteria Test Method Units [Range] Coarse sand % B 2.0 1.4 - 2.8 Fine Sand % B 18 13.1 - 19.1 Silt % B 20 19 - 26.1 Clay % B 61 55.4 - 62