Embed Size (px)
Citation preview

Bay-Lake Regional Planning Commission
Economy Overview
Brown County
Economic Modeling Specialists International | www.economicmodeling.com Page 1/15

Population (2013) 255,924
Jobs (2013) 160,916
Average Earnings (2013) $52,016
Unemployed (11/2013) 7,296
Completions (2012) 5,054
GRP (2012) $13,664,513,025
Exports (2012) $17,220,890,229
Imports (2012) $15,907,491,482
Report Info
Brown County
Dataset Version 2014.1 Class of Worker
Class of Worker Categories QCEW Employees + Non-QCEW Employees + Self-Employed
Timeframe 2010 - 2014
Dataset Category EMSI Complete
Region Name Brown County
Counties
Brown, WI (55009)
Economic Modeling Specialists International | www.economicmodeling.com Page 2/15

Age Group 2013Population
% ofPopulation
Under 5 years 17,510 6.8%
5 to 9 years 17,494 6.8%
10 to 14 years 17,500 6.8%
15 to 19 years 17,621 6.9%
20 to 24 years 17,532 6.9%
25 to 29 years 17,909 7.0%
30 to 34 years 17,746 6.9%
35 to 39 years 15,400 6.0%
40 to 44 years 16,034 6.3%
45 to 49 years 18,371 7.2%
50 to 54 years 19,021 7.4%
55 to 59 years 17,172 6.7%
60 to 64 years 14,622 5.7%
65 to 69 years 10,229 4.0%
70 to 74 years 7,323 2.9%
75 to 79 years 5,555 2.2%
80 to 84 years 4,324 1.7%
85 years and over 4,562 1.8%
Brown County | Population
255,9242013 Population
4.4% of State
4.9%Population Growth for the Last 5 Years
State Growth 2.3%
Economic Modeling Specialists International | www.economicmodeling.com Page 3/15

NAICS Industry 2013Jobs
11 Agriculture, Forestry, Fishing and Hunting 1,768
21 Mining, Quarrying, and Oil and Gas Extraction 80
22 Utilities 328
23 Construction 6,828
31 Manufacturing 25,883
42 Wholesale Trade 7,379
44 Retail Trade 15,187
48 Transportation and Warehousing 6,616
51 Information 1,868
52 Finance and Insurance 10,659
53 Real Estate and Rental and Leasing 1,458
54 Professional, Scientific, and Technical Services 6,729
55 Management of Companies and Enterprises 5,378
56 Administrative and Support and Waste Management and Remediation Services 8,045
61 Educational Services (Private) 2,256
62 Health Care and Social Assistance 19,709
71 Arts, Entertainment, and Recreation 3,034
72 Accommodation and Food Services 13,310
81 Other Services (except Public Administration) 6,297
90 Government 18,103
99 Unclassified Industry 1
Brown County | Jobs by Industry
160,916Total Jobs (2013)
50.3%Male
(National: 51.1%)
49.7%Female
(National: 48.9%)
Economic Modeling Specialists International | www.economicmodeling.com Page 4/15

NAICS IndustryAvg.
Earnings(2013)
11 Agriculture, Forestry, Fishing and Hunting $27,841
21 Mining, Quarrying, and Oil and Gas Extraction $71,705
22 Utilities $149,574
23 Construction $57,930
31 Manufacturing $61,340
42 Wholesale Trade $65,236
44 Retail Trade $28,027
48 Transportation and Warehousing $49,556
51 Information $60,405
52 Finance and Insurance $65,622
53 Real Estate and Rental and Leasing $36,182
54 Professional, Scientific, and Technical Services $71,087
55 Management of Companies and Enterprises $92,396
56Administrative and Support and Waste Management and RemediationServices
$32,121
61 Educational Services (Private) $26,112
62 Health Care and Social Assistance $60,110
71 Arts, Entertainment, and Recreation $101,268
72 Accommodation and Food Services $15,651
81 Other Services (except Public Administration) $21,904
90 Government $58,122
99 Unclassified Industry $23,824
Brown County | Average Earnings by Industry
$52,016Avg. Earnings (2013)
90% of Nation Avg.
$64,047Male Avg. Earnings (2013)
92% of Nation Avg.
$39,817Female Avg. Earnings (2013)
88% of Nation Avg.
Economic Modeling Specialists International | www.economicmodeling.com Page 5/15

NAICS Industry Unemployed(11/2013)
% ofUnemployed
11 Agriculture, Forestry, Fishing and Hunting 24 0%
21 Mining, Quarrying, and Oil and Gas Extraction 6 0%
22 Utilities 11 0%
23 Construction 664 9%
31 Manufacturing 1,172 16%
42 Wholesale Trade 185 3%
44 Retail Trade 724 10%
48 Transportation and Warehousing 242 3%
51 Information 48 1%
52 Finance and Insurance 298 4%
53 Real Estate and Rental and Leasing 53 1%
54 Professional, Scientific, and Technical Services 243 3%
55 Management of Companies and Enterprises 47 1%
56Administrative and Support and Waste Management andRemediation Services
608 8%
61 Educational Services (Private) 67 1%
62 Health Care and Social Assistance 635 9%
71 Arts, Entertainment, and Recreation 244 3%
72 Accommodation and Food Services 673 9%
81 Other Services (except Public Administration) 176 2%
90 Government 396 5%
99 No Previous Work Experience/Unspecified 778 11%
Brown County | Unemployment by Industry
7,296Total Unemployment (11/2013)
Economic Modeling Specialists International | www.economicmodeling.com Page 6/15

Brown County | Top Program Completions
CIP Program Completions (2012)
51 Health professions and related programs 1,518
52Business, management, marketing, and relatedsupport services
755
43Homeland security, law enforcement, firefightingand related protective services
244
30 Multi/interdisciplinary studies 221
15Engineering technologies and engineering-related fields
219
13 Education 206
11Computer and information sciences and supportservices
196
24Liberal arts and sciences, general studies andhumanities
170
48 Precision production 166
42 Psychology 144
Economic Modeling Specialists International | www.economicmodeling.com Page 7/15
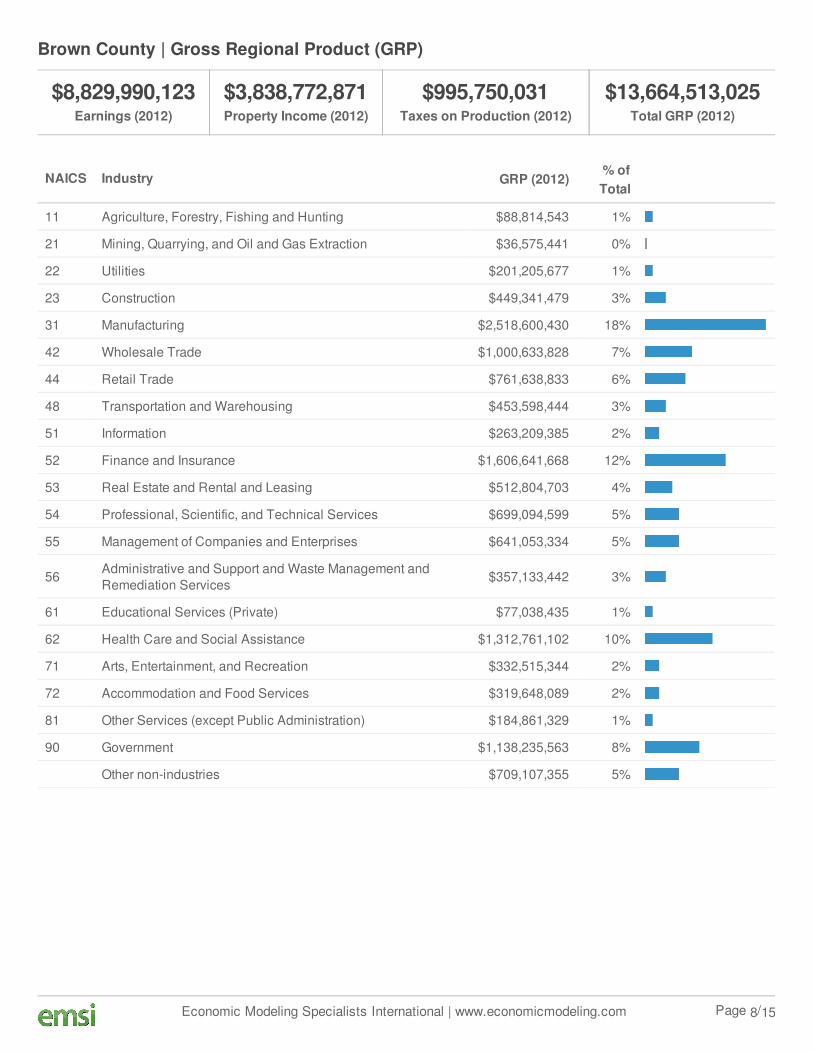
NAICS Industry GRP (2012)% ofTotal
11 Agriculture, Forestry, Fishing and Hunting $88,814,543 1%
21 Mining, Quarrying, and Oil and Gas Extraction $36,575,441 0%
22 Utilities $201,205,677 1%
23 Construction $449,341,479 3%
31 Manufacturing $2,518,600,430 18%
42 Wholesale Trade $1,000,633,828 7%
44 Retail Trade $761,638,833 6%
48 Transportation and Warehousing $453,598,444 3%
51 Information $263,209,385 2%
52 Finance and Insurance $1,606,641,668 12%
53 Real Estate and Rental and Leasing $512,804,703 4%
54 Professional, Scientific, and Technical Services $699,094,599 5%
55 Management of Companies and Enterprises $641,053,334 5%
56Administrative and Support and Waste Management andRemediation Services
$357,133,442 3%
61 Educational Services (Private) $77,038,435 1%
62 Health Care and Social Assistance $1,312,761,102 10%
71 Arts, Entertainment, and Recreation $332,515,344 2%
72 Accommodation and Food Services $319,648,089 2%
81 Other Services (except Public Administration) $184,861,329 1%
90 Government $1,138,235,563 8%
Other non-industries $709,107,355 5%
Brown County | Gross Regional Product (GRP)
$8,829,990,123Earnings (2012)
$3,838,772,871Property Income (2012)
$995,750,031Taxes on Production (2012)
$13,664,513,025Total GRP (2012)
Economic Modeling Specialists International | www.economicmodeling.com Page 8/15
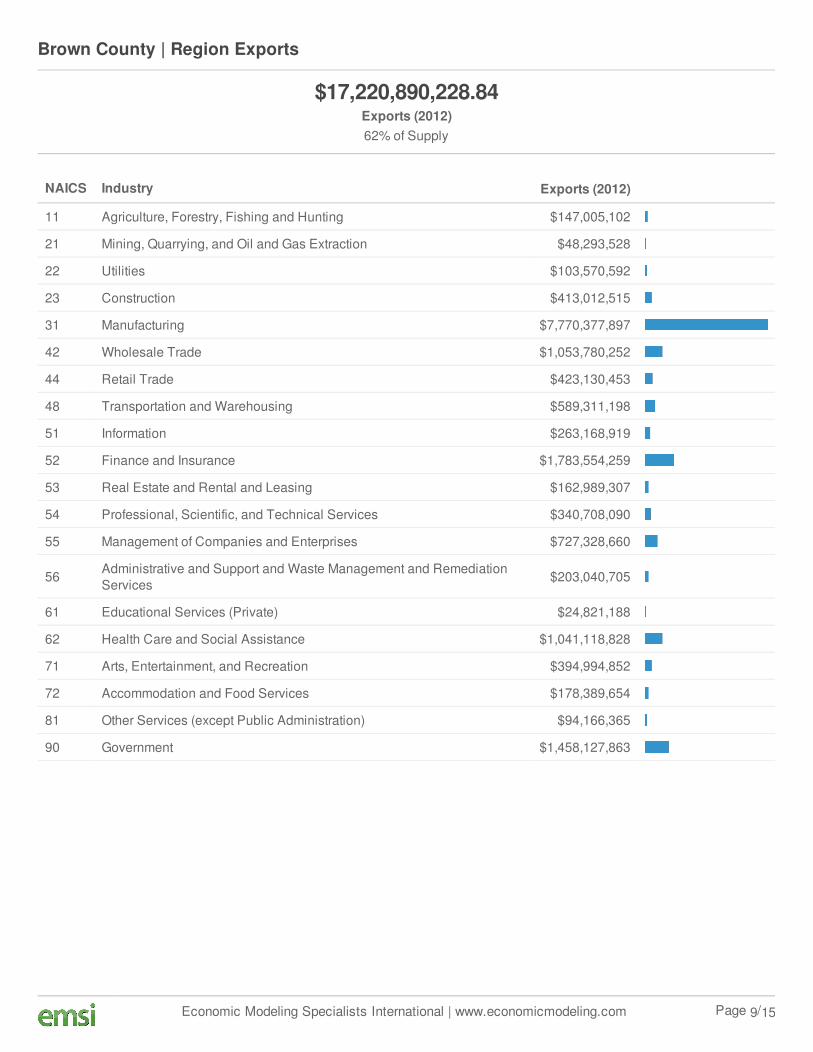
NAICS Industry Exports (2012)
11 Agriculture, Forestry, Fishing and Hunting $147,005,102
21 Mining, Quarrying, and Oil and Gas Extraction $48,293,528
22 Utilities $103,570,592
23 Construction $413,012,515
31 Manufacturing $7,770,377,897
42 Wholesale Trade $1,053,780,252
44 Retail Trade $423,130,453
48 Transportation and Warehousing $589,311,198
51 Information $263,168,919
52 Finance and Insurance $1,783,554,259
53 Real Estate and Rental and Leasing $162,989,307
54 Professional, Scientific, and Technical Services $340,708,090
55 Management of Companies and Enterprises $727,328,660
56Administrative and Support and Waste Management and RemediationServices
$203,040,705
61 Educational Services (Private) $24,821,188
62 Health Care and Social Assistance $1,041,118,828
71 Arts, Entertainment, and Recreation $394,994,852
72 Accommodation and Food Services $178,389,654
81 Other Services (except Public Administration) $94,166,365
90 Government $1,458,127,863
Brown County | Region Exports
$17,220,890,228.84Exports (2012)62% of Supply
Economic Modeling Specialists International | www.economicmodeling.com Page 9/15

NAICS Industry Imports (2012)
11 Agriculture, Forestry, Fishing and Hunting $1,344,051,469
21 Mining, Quarrying, and Oil and Gas Extraction $237,835,472
22 Utilities $237,832,307
23 Construction $283,542,381
31 Manufacturing $4,002,798,348
42 Wholesale Trade $761,989,448
44 Retail Trade $381,474,231
48 Transportation and Warehousing $460,071,371
51 Information $660,306,740
52 Finance and Insurance $1,147,002,945
53 Real Estate and Rental and Leasing $664,252,470
54 Professional, Scientific, and Technical Services $687,183,159
55 Management of Companies and Enterprises $209,196,212
56Administrative and Support and Waste Management and RemediationServices
$294,041,587
61 Educational Services (Private) $131,992,618
62 Health Care and Social Assistance $311,579,011
71 Arts, Entertainment, and Recreation $102,223,359
72 Accommodation and Food Services $238,840,584
81 Other Services (except Public Administration) $218,797,998
90 Government $3,532,479,771
Brown County | Region Imports
$15,907,491,482Imports (2012)61% of Demand
$10,332,554,118Locally Produced & Consumed (2012)
39% of Demand
Economic Modeling Specialists International | www.economicmodeling.com Page 10/15

Regional Trends
Region 2010 Jobs 2014 Jobs % Change
A Brown County 154,963 162,317 4.7%
2013 Educational Attainment
Largest Openings/Completions Gaps
OccupationRelated
Completions(2012)
AnnualOpenings
(2013)
Medical and Health Services Managers (11-9111) 0 16
Librarians (25-4021) 0 15
Physicians and Surgeons, All Other (29-1069) 0 15
Human Resources Specialists (13-1071) 6 20
Securities, Commodities, and Financial Services Sales Agents (41-3031) 1 15
Economic Modeling Specialists International | www.economicmodeling.com Page 11/15

2013 Age Demographics
Growing/Declining Occupations
OccupationChange in
Jobs (2010-2014)
Combined Food Preparation and Serving Workers, Including Fast Food (35-3021) 522
Registered Nurses (29-1141) 303
Janitors and Cleaners, Except Maids and Housekeeping Cleaners (37-2011) 294
Carpenters (47-2031) -90
Telemarketers (41-9041) -141
Childcare Workers (39-9011) -175
2013 Race Demographics
Economic Modeling Specialists International | www.economicmodeling.com Page 12/15

Growing/Declining Industries
IndustryChange in
Jobs (2010-2014)
General Medical and Surgical Hospitals (Private) (622110) 751
Warehouse Clubs and Supercenters (452910) 689
Limited-Service Restaurants (722211) 660
Animal (except Poultry) Slaughtering (311611) -268
Telemarketing Bureaus and Other Contact Centers (561422) -463
Discount Department Stores (452112) -816
Top Regional Businesses
Business Name LocalEmployees
Brown County Court Reporter 1,900
American Foods Group, Llc 1,200
Shopko Stores Operating Co, Llc 1,140
Humana Insurance Company 1,000
Carver Boat (plant No 9) 1,000
Source: Equifax Business-Level DataDISCLAIMER: Business Data by Equifax is third-party data provided by EMSI to its customers as a convenience, and EMSIdoes not endorse or warrant its accuracy or consistency with other published EMSI data.
Economic Modeling Specialists International | www.economicmodeling.com Page 13/15

Data Sources and Calculations
Input-Output Data
The input-output model in this report is EMSI's gravitational flows multi-regional social account matrix model (MR-SAM). It isbased on data from the Census Bureau's Current Population Survey and American Community Survey; as well as the Bureau ofEconomic Analysis' National Income and Product Accounts, Input-Output Make and Use Tables, and Gross State Product data.In addition, several EMSI in-house data sets are used, as well as data from Oak Ridge National Labs on the cost oftransportation between counties.
Institution Data
The institution data in this report is taken directly from the national IPEDS database published by the U.S. Department ofEducation's National Center for Education Statistics.
Completers Data
The completers data in this report is taken directly from the national IPEDS database published by the U.S. Department ofEducation's National Center for Education Statistics.
Demographic Data
The demographic data in this report is compiled from several sources using a specialized process. Sources include annualpopulation estimates and population projections from the US Census Bureau, birth and mortality rates from the US HealthDepartment, and projected regional job growth.
Industry Data
EMSI industry data have various sources depending on the class of worker. (1) For QCEW Employees, EMSI primarily uses theQCEW (Quarterly Census of Employment and Wages), with supplemental estimates from County Business Patterns andCurrent Employment Statistics. (2) Non-QCEW employees data are based on a number of sources including QCEW, CurrentEmployment Statistics, County Business Patterns, BEA State and Local Personal Income reports, the National Industry-Occupation Employment Matrix (NIOEM), the American Community Survey, and Railroad Retirement Board statistics. (3) Self-Employed and Extended Proprietor classes of worker data are primarily based on the American Community Survey,Nonemployer Statistics, and BEA State and Local Personal Income Reports. Projections for QCEW and Non-QCEWEmployees are informed by NIOEM and long-term industry projections published by individual states.
Unemployment Data
The unemployment data in this report comes from the Bureau of Labor Statistics' Local Area Unemployment Statistics and isupdated every two months.
State Data Sources
This report uses state data from the following agencies: Wisconsin Department of Workforce Development, Bureau of WorkforceInformation
Economic Modeling Specialists International | www.economicmodeling.com Page 14/15

Educational Attainment Data
EMSI's educational attainment numbers are based on EMSI's demographic data and the American Community Survey. Bycombining these sources, EMSI interpolates for missing years and projects data at the county level. Educational attainment datacover only the population aged 25 years or more and indicate the highest level achieved.
Occupation Data
EMSI occupation employment data are based on final EMSI industry data and final EMSI staffing patterns. Wage estimates arebased on Occupational Employment Statistics (QCEW and Non-QCEW Employees classes of worker) and the AmericanCommunity Survey (Self-Employed and Extended Proprietors). Occupational wage estimates also affected by county-levelEMSI earnings by industry.
Equifax Business-Level Data
Data for individual businesses is provided by Equifax (http://www.equifax.com/commercial/), which maintains a database ofmore than 20 million U.S. business entities. Note that in aggregate it will not be consistent with EMSI labor market data due todifferences in definitions, methodology, coverage, and industry/geographic classification.
Economic Modeling Specialists International | www.economicmodeling.com Page 15/15