Embed Size (px)
Citation preview
ANNUAL REPORT 2016
Empowering Compassionate Global Citizens

ST COLUMBA COLLEGE | 2016 ANNUAL REPORT
CONTEXTUAL STATEMENT ...............................................................................2
FROM THE PRINCIPAL ..........................................................................................3
2016 ENROLMENTS................................................................................................5
FAITH AND IDENTITY ............................................................................................6
CULTURE AND IDENTITY ....................................................................................8
TEACHER STANDARDS AND QUALIFICATIONS ................................9
WORKFORCE COMPOSITION ....................................................................... 10
STUDENT ATTENDANCE .................................................................................. 11
STUDENT OUTCOMES IN STANDARDISED NATIONAL LITERACY AND NUMERACY TESTING (NAPLAN) ................................................... 12
YEAR 3 RESULTS .................................................................................................. 13
YEAR 5 RESULTS .................................................................................................. 15
YEAR 7 RESULTS .................................................................................................. 17
YEAR 9 RESULTS .................................................................................................. 18
SENIOR SECONDARY OUTCOMES ........................................................... 20
SACE ......................................................................................................................... 20
VET ............................................................................................................................ 20
POST SCHOOL DESTINATIONS...................................................................... 21
PARENT, STUDENT & TEACHER SATISFACTION WITH THE SCHOOL ........................................................ 22
OVERALL FINANCIAL POSITION ................................................................ 23
CONTENTS
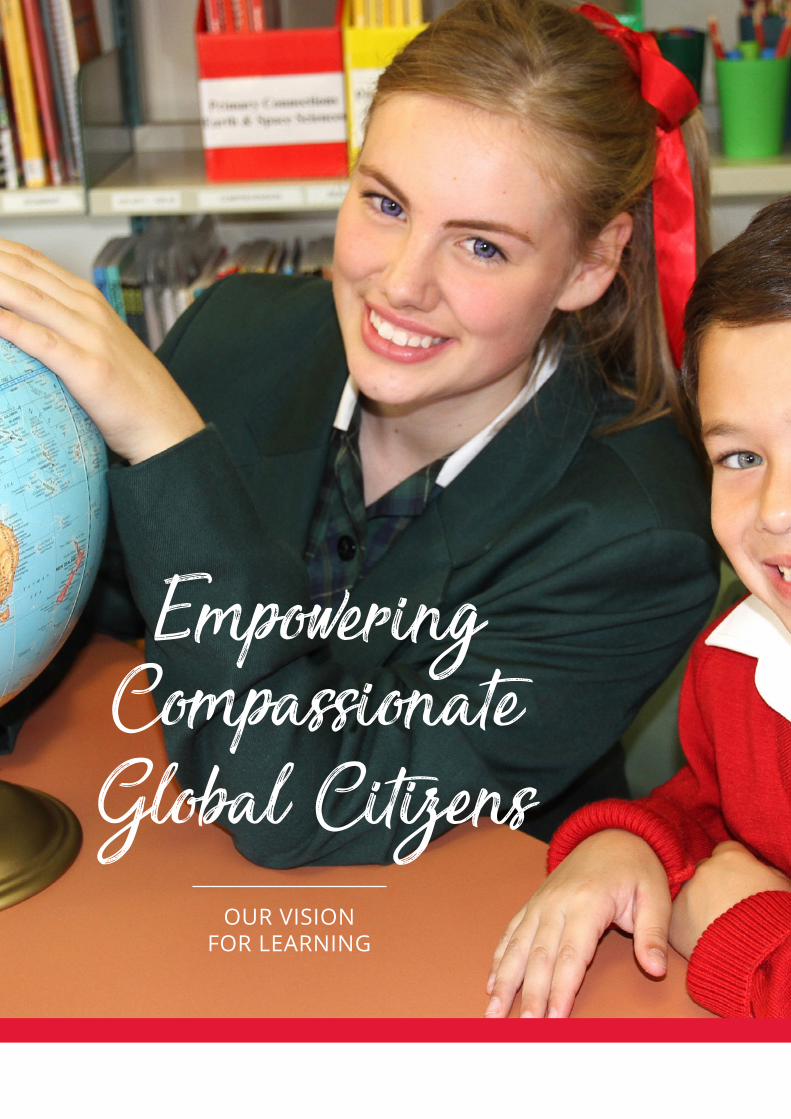
Empowering Compassionate Global Citizens
OUR VISION FOR LEARNING
St Columba College is an R-12 co-educational College established as a joint initiative of the Anglican and Catholic churches of the Adelaide Dioceses. Established in 1997 and located at Andrews Farm in the northern suburbs of Adelaide, the College is open to families who are seeking a Christian education founded by the beliefs, values and practices of both traditions of our unique ecumenical partnership. The College consists of three schools located on three sites within walking distance of each other; a Junior School for students from Reception to Year 5, a Middle School for students in Years 6 to 9 and a Senior School for students in Years 10 to 12.
OUR MISSIONProvide students with outstanding learning and academic outcomes, supporting students to experience God’s love, as embodied within our Anglican and Catholic traditions.
OUR VISIONSt Columba College seeks to nurture in our students and the wider community a close relationship with God, a passion for living and a life-long love of learning.
OUR VISION FOR LEARNINGEmpowering Compassionate Global Citizens.
2
CONTEXTUAL STATEMENT
ST COLUMBA COLLEGE | 2016 ANNUAL REPORT
I am delighted to report to you the performance of the College in 2016. This past year was a year in which we reflected on the past and established the strategic directions for the future of the College. As an Anglican and Catholic school, our mission is to bring about a world that God wants for each individual and family; a world where each person is deeply respected, valued and cared for. This mission is central to who we are as a school community and underpins our teaching, programs, relationships, structures and decisions.
Throughout the year, community forums were held for staff, Middle and Senior School students and parents. A key question that was asked was to reflect on what practices, values and beliefs about student learning have shaped our College and what practices, values and beliefs about student learning should not maintained as the school looks forward to developing a vision and plan for the future? These two questions allowed us to examine what we currently do and what are the possibilities into the future.
What was evident from the community feedback was that there was a strong connection to the College as a family centred and faith community, the school provides quality education to our students in the north of Adelaide, has an emphasis on the pastoral care of each student and their family, has high standards for learning and behaviour and a strong belief that all students can learn and be successful. The feedback showed we needed to:
• strengthen our approach to curriculum development and learning across R-12;
• give students more opportunities to have a say in the decision making of the school;
• further develop the House Pastoral Care system;
• promote and celebrate our cultural diversity and achievements;
• engage our parents/caregivers in learning.
FROM THE PRINCIPAL
Coupled with community consultation, the Continuous Improvement Framework for Catholic Schools was also used by staff to evaluate the school’s progress across nine domains. This evaluation shaped the Annual Plan and priorities for 2016 and the College Council’s Strategic Plan for 2017-2018.
During 2016 we identified our direction for learning across R-12. Empowering Compassionate Global Citizens became our Vision for Learning and we committed to developing students to have the attitudes, mindset and skills to actively participate and make a difference in a changing global world now and into the future. To achieve this, the School-wide Pedagogical Framework was developed and this framework will guide teaching and learning programs into the future across R-12. Mindset, Engagement, Hands-on, Differentiation and Collaboration were identified as key principles for every classroom.
The College began a new partnership with Curtin University (WA) to use feedback from students about their experiences at school. 35 teachers used the Classroom Climate Questionnaire to gauge student’s perceptions about learning and their participation in the classroom. As a result teachers trialled new strategies to improve student learning. Years 1-12 students had the opportunity to provide feedback about school culture through the What’s Happening in this School Survey. While positive in many areas, it has been informative about students’ understanding about school rules, teacher/student relationships and affirming and celebrating our diverse community.
Along with analysing NAPLAN and SACE results we implemented the use of PAT Reading and PAT Mathematics online tests from Years 1-10. This whole school data collection gives excellent information about student learning and highlights areas for improvement. Reading comprehension is one key improvement focus into the future.
Delivering an inclusive curriculum continues to be major emphasis for staff and we are committed to meeting the needs of all students. In any classroom there is a wide range of abilities and staff have been supported to learn more about the different strategies that increase student participation and accommodate the different learning needs.
3
4
Student participation across the College continued though a wide range of experiences and opportunities. Masses and liturgies were held as a whole school to celebrate the Easter Story, Saint Columba Day, academic achievement and regularly for year levels and sub schools throughout the year allowing students to sing, read and lead. Our Year 4 students participated in the Religious Education and Literacy Assessment Tool (ReLAT) for the first time. This provided an overview of their understanding of religious concepts. The R-12 RE curriculum also was reviewed by teachers. Rev Jo Smith joined the College as our Chaplain to support students, staff and families.
Our Junior and Middle School students participated in sport carnivals and knock out competitions throughout the year and for the first time the College joined the SASSSA Northern Zone providing more opportunities for our Middle and Senior students to participate in weekday competitions. Opportunities for our students to participate in Music continued at Assemblies, Open Day and Prayer and Presentation Nights. Our Drama students excelled through the productions of ‘Romeo and Juliet’ and ‘Servant of Two Masters’ and our Junior School held the first End of Year Concert at school in November. Authors and guest speakers engaged students about literature and poetry throughout the year. Excursions allowed students to experience museums, art galleries, aboriginal trails, Parliament House, wetlands and the coast, synagogues, universities and career days. Our Year 5s and Year 9s once again travelled to Ballarat and Canberra. Participating in the Tournament of Minds at Flinders University was another highlight for our Junior and Middle School students and we celebrated ‘RU OK? Day’ in Term 3 as a whole school. The Visual Art and Design and Technology Exhibition showcased our senior students’ work in November. Food and Technology students had the opportunity to practice their food and hospitality skills at the staff and parent luncheons they organised.
In 2016 we began to explore ways to engage parents in learning with the Parents and Friends Association and feedback at the Parent Forum held during the year. Opportunities to build authentic partnerships with parents will be a future focus.
The new Strategic Plan will guide the directions for the College over the next three years. It aims to continue to develop a strong positive profile in the wider community and be known as a school that is inclusive, welcoming and strives to achieve excellent outcomes for all students.
I take this opportunity to thank the whole staff for their dedication and commitment to all our students in 2016. As I move around the College on any given day, I hear and see staff encouraging, listening, caring, praising, challenging and showing patience towards each child. These are profound human qualities and we are blessed to have such a quality staff at St Columba College. I acknowledge and thank the following key staff for their wonderful support and leadership throughout 2016; Wayne Gladigau, Kimberley Shean, Steven Brombal, Louis de Jager, Christopher Spry, Julie Hancock, Matthew McGinty, Robert O’Toole, Sarah Morris, Deirdre Walters, Shane Dowling and to our two Directors of Spirituality, Jane Bailey and Eugenia Stopyra, and our R-12 Director of Inclusive Education Mary Woznitza.
New to the role as Principal in 2016 I have greatly appreciated the support of the whole school parent community and especially thank the Parents and Friends Committee for their tireless work. I extend our heartfelt thanks to Colleen Boaden who concludes her time as President and sincerely thank her for work in the community during the past 10 years.
I take this opportunity to thank the College Council for their support during the past 12 months and the Chairperson Bruno Vieceli for his support and guidance. I look forward with great enthusiasm to 2017.
Lastly, I thank our 1400 students for all they give and do to make St Columba College a great school.
MS LEANNE CARR Principal
ST COLUMBA COLLEGE | 2016 ANNUAL REPORT
2016ENROLMENTS
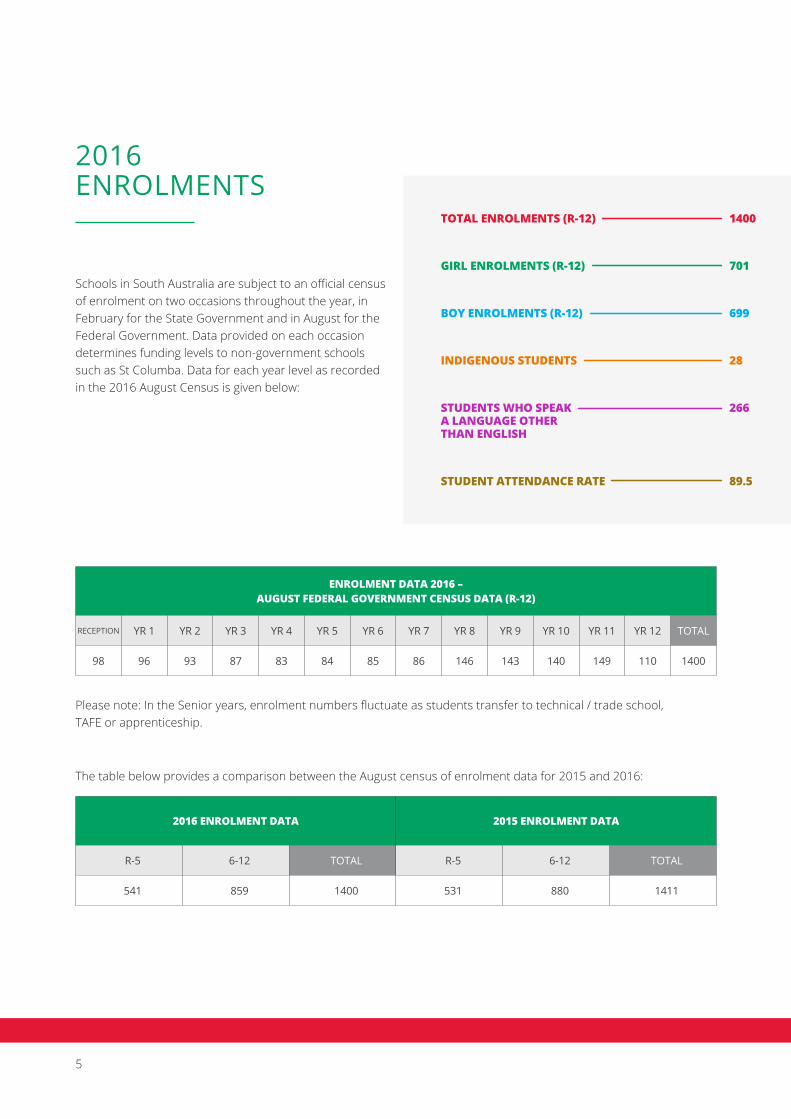
Schools in South Australia are subject to an official census of enrolment on two occasions throughout the year, in February for the State Government and in August for the Federal Government. Data provided on each occasion determines funding levels to non-government schools such as St Columba. Data for each year level as recorded in the 2016 August Census is given below:
ENROLMENT DATA 2016 – AUGUST FEDERAL GOVERNMENT CENSUS DATA (R-12)
RECEPTION YR 1 YR 2 YR 3 YR 4 YR 5 YR 6 YR 7 YR 8 YR 9 YR 10 YR 11 YR 12 TOTAL
98 96 93 87 83 84 85 86 146 143 140 149 110 1400
2016 ENROLMENT DATA 2015 ENROLMENT DATA
R-5 6-12 TOTAL R-5 6-12 TOTAL
541 859 1400 531 880 1411
The table below provides a comparison between the August census of enrolment data for 2015 and 2016:
TOTAL ENROLMENTS (R-12)
GIRL ENROLMENTS (R-12)
BOY ENROLMENTS (R-12)
INDIGENOUS STUDENTS
STUDENTS WHO SPEAK A LANGUAGE OTHER THAN ENGLISH
STUDENT ATTENDANCE RATE
1400
701
699
28
266
89.5
Please note: In the Senior years, enrolment numbers fluctuate as students transfer to technical / trade school, TAFE or apprenticeship.
5

6
As an Anglican and Catholic College, St Columba has always taken seriously the spiritual welfare of its staff and students, and has sought to assist them to both understand academically the facts of the Christian faith and to experience emotionally the effects of the Christian faith. Students are engaged through the Mentor program, Liturgies, Eucharist’s, Religious Education lessons and Retreats.
The religious affiliation of the St Columba community in 2016 is identified below:
FAITH AND IDENTITY
ANGLICAN: 124
CATHOLIC: 306
BUDDHIST: 11
LUTHERAN: 24
MUSLIM: 42
ORTHODOX: 10
UNITING CHURCH: 30
OTHER CHRISTIAN: 190
NO RELIGIOUS AFFILIATION: 663
ST COLUMBA COLLEGE | 2016 ANNUAL REPORT

7

CULTURE AND IDENTITY
8
AFRIKAANS
ARABIC
DARI (AFGHANISTAN)
DINKA (SUDAN)
ENGLISH
FARSI (AFGHANISTAN)
FILIPINO
GREEK
HAZARAGI (AFGHANISTAN)
HINDI
INDONESIAN
KHMER
KIRUNDI (TANZANIA/UGANDA)
LAO
MALAYALAM (INDIA)
MADI (UGANDA)
PERSIAN
PUNJABI
SHONA (ZIMBABWE)
SWAHILI (KISWAHILI)
TAGALOG (PHILIPPINES)
THAI
UYGHUR (TURKESTAN)
VIETNAMESE
ZULU
2
5
36
138
1090
2
5
4
2
3
1
17
25
1
3
7
1
7
3
18
6
1
2
23
2
INDIGENOUS 24
TORRES STRAIT ISLANDER 2
ST COLUMBA COLLEGE | 2016 ANNUAL REPORT

TEACHER STANDARDS & QUALIFICATIONS
Formal academic qualifications of teaching staff: In addition to the formal qualifications held by teaching staff, all staff are required to complete training in Responding to Abuse and Neglect and First Aid. They are also required to hold the necessary qualifications for Teacher Registration in South Australia which includes a National Police Check and a record of at least 60 hours of Professional Learning in each three year period.
St Columba has provided substantial support by means of funding and time to staff in order to assist them with accessing Professional Learning to meet their individual needs for growth and development and build capacity within the community to ensure that our students have access to high quality teaching and learning.
Additionally, there have been a number of opportunities for teaching staff to work internally with other staff within their faculties and/or year level teams in reviewing and developing curriculum and assessment.
The most significant areas of professional learning accessed throughout 2016 have been:
1. Subject specific professional learning which have included a range of conferences and workshops from a variety of learning areas;
2. SACE Professional Learning, in particular attendance at clarifying forums and SACE Australian Curriculum implementation workshops;
3. Faith Formation and Development.
Staff have also accessed Professional Learning in the areas of assessment, classroom pedagogies, differentiation, dyslexia and integration of information and communication technologies in the classroom.
MASTER DEGREE
BACHELOR DEGREE WITH HONOURS
BACHELOR DEGREE
GRADUATE DIPLOMA
GRADUATE CERTIFICATE
24
3
109
42
20
9
10
WORKFORCE COMPOSITION
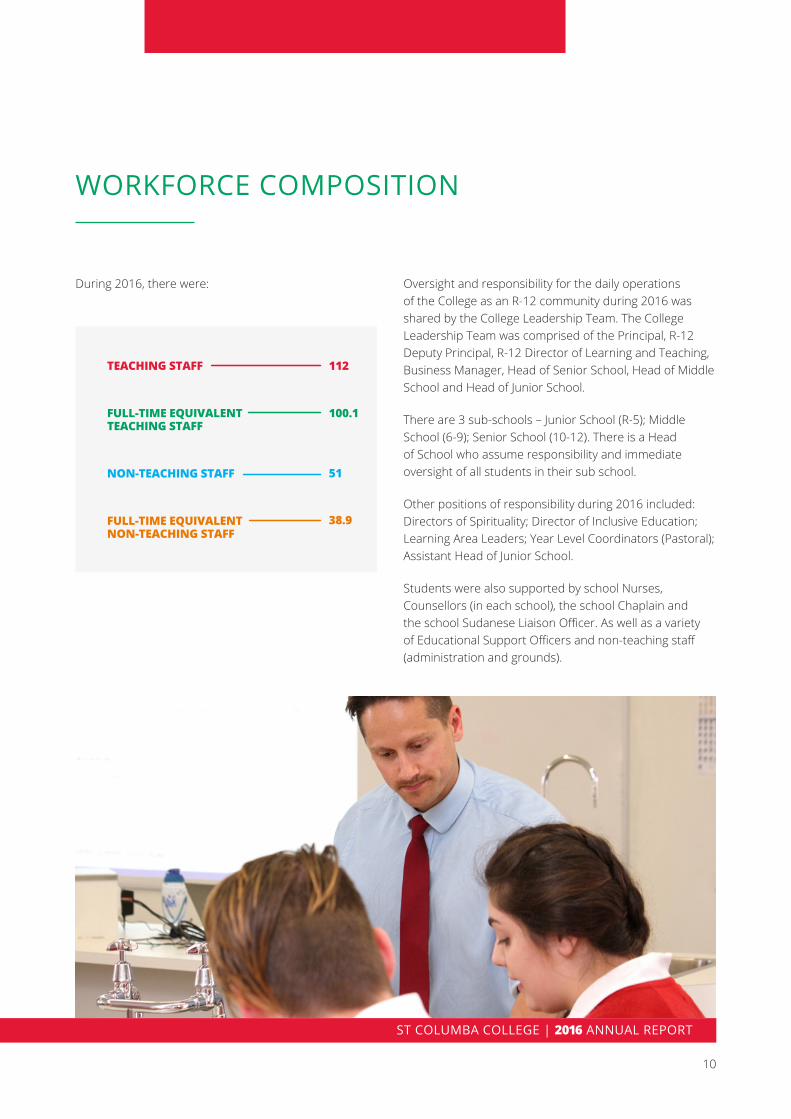
During 2016, there were:
TEACHING STAFF
FULL-TIME EQUIVALENT TEACHING STAFF
NON-TEACHING STAFF
FULL-TIME EQUIVALENT NON-TEACHING STAFF
112
100.1
51
38.9
Oversight and responsibility for the daily operations of the College as an R-12 community during 2016 was shared by the College Leadership Team. The College Leadership Team was comprised of the Principal, R-12 Deputy Principal, R-12 Director of Learning and Teaching, Business Manager, Head of Senior School, Head of Middle School and Head of Junior School.
There are 3 sub-schools – Junior School (R-5); Middle School (6-9); Senior School (10-12). There is a Head of School who assume responsibility and immediate oversight of all students in their sub school.
Other positions of responsibility during 2016 included: Directors of Spirituality; Director of Inclusive Education; Learning Area Leaders; Year Level Coordinators (Pastoral); Assistant Head of Junior School.
Students were also supported by school Nurses, Counsellors (in each school), the school Chaplain and the school Sudanese Liaison Officer. As well as a variety of Educational Support Officers and non-teaching staff (administration and grounds).
ST COLUMBA COLLEGE | 2016 ANNUAL REPORT

St Columba provides a number of channels in which student absence can be notified. Parents/caregivers are encouraged to contact the College in the even that their son/daughter will not be at school. Any student who is late to school/class or is leaving early is expected to ‘sign in or out’ at Student Services.
When the student is absent without explanation, an SMS text message is sent to the parent/caregiver seeking clarification for the absence. All explained absences are categorised and the specific details are recorded for each student on the College’s attendance database.
Repeated absenteeism without explanation is followed up by mentor teachers/year level coordinators.
2016 ATTENDANCE RECORDS (%) BY YEAR LEVEL
YEAR LEVEL TERM 1 TERM 2 TERM 3 TERM 4
Reception 93.5 90.1 89.3 89.5
Year 1 92.0 88.8 87.8 89.1
Year 2 92.6 90.1 88.5 90.3
Year 3 92.2 88.5 88.8 90.2
Year 4 93.2 91.3 90.4 91.1
Year 5 93.7 90.4 89.6 91.2
Year 6 93.4 91.6 90.2 89.6
Year 7 93.1 90.9 87.7 87.1
Year 8 92.1 88.0 87.5 87.3
Year 9 91.1 88.1 87.5 89.2
Year 10 90.6 88.9 86.7 90.3
Year 11 89.8 88.0 85.5 86.1
Year 12 90.6 84.3 82.6 85.8
AVERAGE STUDENT ATTENDANCE BY SCHOOL AND COLLEGE (%)
SCHOOL TERM 1 TERM 2 TERM 3 TERM 4 AVERAGE
R-5 92.9 89.9 89.0 90.2 90.5
6-9 92.4 89.7 88.2 88.3 89.7
10-12 90.3 87.1 84.9 87.4 87.4
R-12 92.1 89.1 87.8 89.0 89.5
STUDENT ATTENDANCE
Long term absences are managed by the Head of School who communicates with families in order to support student attendance into the future.
The College assists families by providing counselling support to students who are experiencing difficulties attending school. Formal, written contact with parent/caregivers for students with long term absences is also provided by the school. In the event of long term student absence, contact with various agencies including Families SA, the Department of Education and Children’s Services and the Catholic Education Office for support with resolving long term absenteeism.
The percentage figure for average student attendance shows the proportion of days that each student, on average, attended school over each term. The larger the percentage, the smaller the number of days that students are absent from school.
In 2016 the average student attendance rate was 89.5%.
12
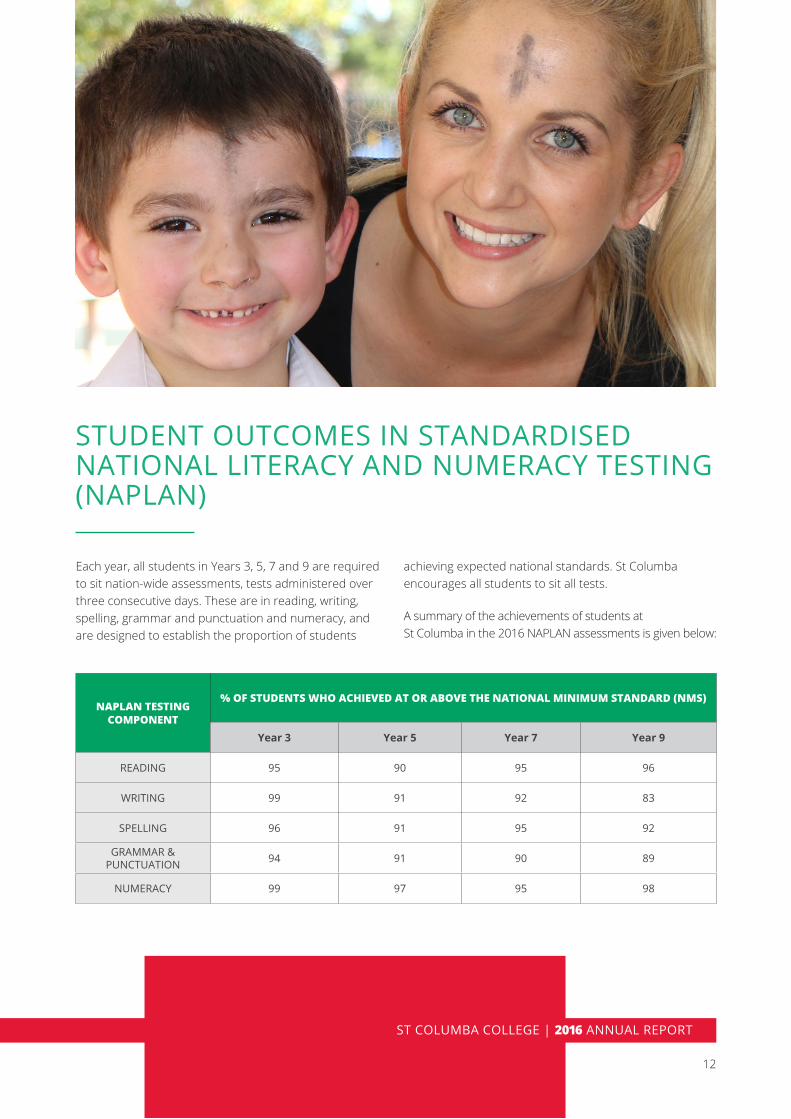
STUDENT OUTCOMES IN STANDARDISED NATIONAL LITERACY AND NUMERACY TESTING (NAPLAN)
Each year, all students in Years 3, 5, 7 and 9 are required to sit nation-wide assessments, tests administered over three consecutive days. These are in reading, writing, spelling, grammar and punctuation and numeracy, and are designed to establish the proportion of students
achieving expected national standards. St Columba encourages all students to sit all tests.
A summary of the achievements of students at St Columba in the 2016 NAPLAN assessments is given below:
NAPLAN TESTING COMPONENT
% OF STUDENTS WHO ACHIEVED AT OR ABOVE THE NATIONAL MINIMUM STANDARD (NMS)
Year 3 Year 5 Year 7 Year 9
READING 95 90 95 96
WRITING 99 91 92 83
SPELLING 96 91 95 92
GRAMMAR & PUNCTUATION 94 91 90 89
NUMERACY 99 97 95 98
ST COLUMBA COLLEGE | 2016 ANNUAL REPORT

Greater than 94% of Students at St Columba in Year 3 achieved at or above the National Minimum Standard (NMS) in each component of NAPLAN in 2016. This is consistent with 2015 data and is a slight increase on 2014.
In relation to the National Minimum Standard, there has been an improvement in Numeracy results for Year 3 in 2016. Numeracy has continued to improve over the course of the last 3 years with an increase from 92% of students who achieved at or above the NMS in 2014 to 96% in 2015 and a continued increase to 99% in 2016.
Reading has remained steady at 95% over the past two years, with a slight improvement between 2014 and 2015.
Whilst Grammar and Punctuation have remained consistent at 94% in 2015 and 2016 this is a decrease from 2014 data where the percentage of students who achieved at or above the NMS was 99%.
In all areas of testing, the school mean scores are situated in Proficiency Band 4.
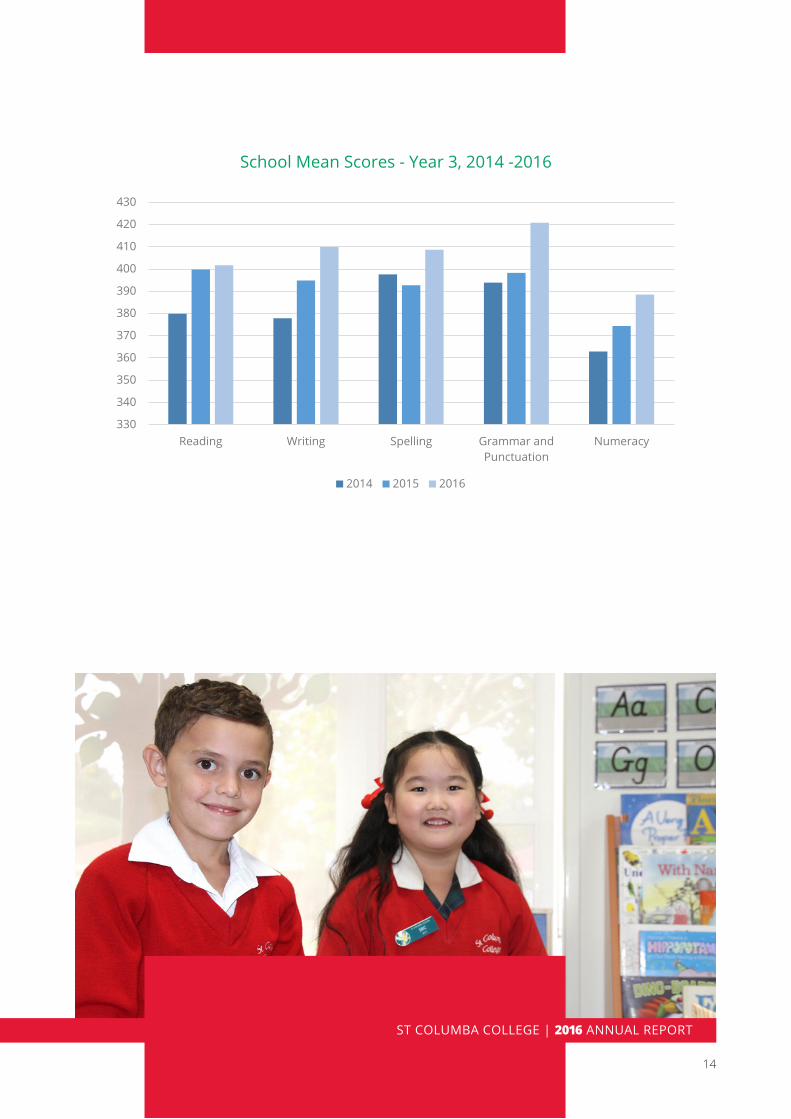
In all areas of testing, the School Mean Scores have increased in comparison to that of 2015 and 2014. The most notable gains in the past two years have been in Writing, Grammar & Punctuation and Numeracy.
YEAR 3 RESULTS SUMMARY
SCHOOL MEAN SCORES - PROFICIENCY BAND AND % OF STUDENTS WHO ACHIEVED AT OR ABOVE NATIONAL MINIMUM STANDARDS (NMS)
NAPLAN TESTING COMPONENT
MEAN SCORE MEAN SCORES AS PROFICIENCY BAND
% OF STUDENTS WHO ACHIEVED THE NMS
2014 2015 2016 2014 2015 2016 2014 2015 2016
READING 379.9 399.8 401.7 4 4 4 93 95 95
WRITING 377.9 394.8 409.9 4 4 4 97 100 99
SPELLING 397.6 392.7 408.7 4 4 4 96 97 96
GRAMMAR & PUNCTUATION 393.9 398.3 420.8 4 4 4 99 94 94
NUMERACY 362.9 374.4 388.5 3 4 4 92 96 99
13
14
School Mean Scores - Year 3, 2014 -2016
ST COLUMBA COLLEGE | 2016 ANNUAL REPORT

YEAR 5 RESULTS SUMMARY
Greater than 90% of Students at St Columba in Year 5 achieved at or above the National Minimum Standard (NMS) in each component of NAPLAN in 2016. On average there has been a decrease in the School Mean Scores for most areas in comparison to both 2014 and 2015 data.
There have been gains in Grammar and Punctuation and Numeracy, but overall, data between years varies. There are no clear trends in the data.
In relation to the National Minimum Standard, there has been an improvement in Numeracy results for Year 5 in 2016.
Reading has declined to 90% in 2016, this is concerning, given that there was a slight improvement of 3% between 2014 and 2015. Spelling has also declined to 91% in 2016, this is concerning, given that there was a slight improvement of 6% between 2014 and 2015.
There have been marginal fluctuations in Writing over the past 3 years.
Grammar and Punctuation have improved in 2016 to 91% after a significant decline in results in 2015 to 82% from 93% in 2014.
In all areas of testing, the school mean scores are situated in Proficiency Band 5.
SCHOOL MEAN SCORES - PROFICIENCY BAND AND % OF STUDENTS WHO ACHIEVED AT OR ABOVE NATIONAL MINIMUM STANDARDS (NMS)
NAPLAN TESTING COMPONENT
MEAN SCORE MEAN SCORES AS PROFICIENCY BAND
% OF STUDENTS WHO ACHIEVED THE NMS
2014 2015 2016 2014 2015 2016 2014 2015 2016
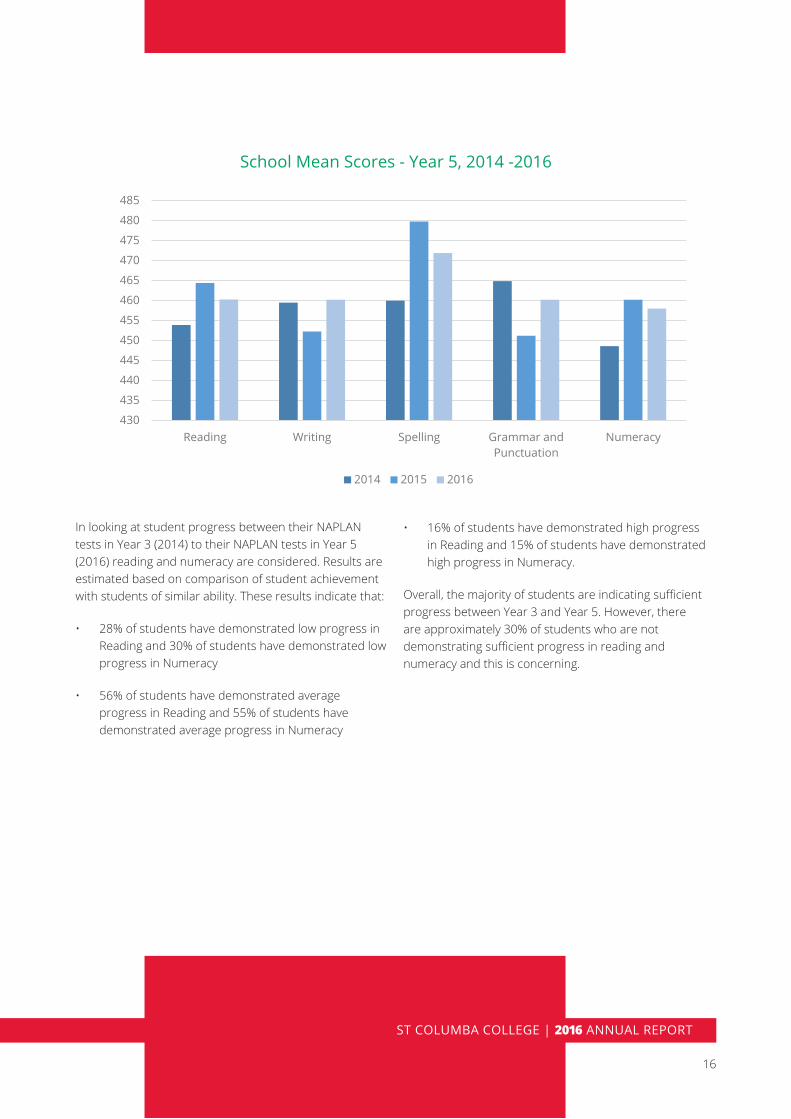
READING 453.9 464.4 460.3 5 5 5 91 94 90
WRITING 459.5 452.3 460.2 5 5 5 94 90 91
SPELLING 460 479.8 471.9 5 6 5 89 95 91
GRAMMAR & PUNCTUATION 464.9 451.2 460.2 5 5 5 93 82 91
NUMERACY 448.6 460.2 458 5 5 5 93 91 97
15
16
School Mean Scores - Year 5, 2014 -2016
In looking at student progress between their NAPLAN tests in Year 3 (2014) to their NAPLAN tests in Year 5 (2016) reading and numeracy are considered. Results are estimated based on comparison of student achievement with students of similar ability. These results indicate that:
• 28% of students have demonstrated low progress in Reading and 30% of students have demonstrated low progress in Numeracy
• 56% of students have demonstrated average progress in Reading and 55% of students have demonstrated average progress in Numeracy
• 16% of students have demonstrated high progress in Reading and 15% of students have demonstrated high progress in Numeracy.
Overall, the majority of students are indicating sufficient progress between Year 3 and Year 5. However, there are approximately 30% of students who are not demonstrating sufficient progress in reading and numeracy and this is concerning.
ST COLUMBA COLLEGE | 2016 ANNUAL REPORT

YEAR 7 RESULTS SUMMARY
Greater than 90% of Students at St Columba in Year 7 achieved at or above the National Minimum Standard (NMS) in each component of NAPLAN in 2016. On average there has been a decrease in the School Mean Scores for most areas in comparison to both 2014 and 2015 data.
There have been gains in Writing and Spelling in comparison to 2015 but data indicates improvements can be made.
In all areas of testing, the school mean scores are situated in Proficiency Band 6.
School Mean Scores - Year 7, 2014 -2016
SCHOOL MEAN SCORES - PROFICIENCY BAND AND % OF STUDENTS WHO ACHIEVED AT OR ABOVE NATIONAL MINIMUM STANDARDS (NMS)
NAPLAN TESTING COMPONENT
MEAN SCORE MEAN SCORES AS PROFICIENCY BAND
% OF STUDENTS WHO ACHIEVED THE NMS
2014 2015 2016 2014 2015 2016 2014 2015 2016
READING 531 519 506.7 7 6 6 96 97 95
WRITING 513 461.4 486.9 6 5 6 93 84 92
SPELLING 529 530.9 517.6 6 7 6 96 92 95
GRAMMAR & PUNCTUATION 523.9 520.4 498.4 6 6 6 95 92 90
NUMERACY 518.8 515.3 511.7 6 6 6 96 100 95
17
18
In looking at student progress between their NAPLAN tests in Year 5 (2014) to their NAPLAN tests in Year 7 (2016) reading and numeracy are considered. Results are estimated based on comparison of student achievement with students of similar ability. These results indicate that:
• 27% of students have demonstrated low progress in Reading and 31% of students have demonstrated low progress in Numeracy
• 49% of students have demonstrated average progress in Reading and 56% of students have demonstrated average progress in Numeracy
• 23% of students have demonstrated high progress in Reading and 13% of students have demonstrated high progress in Numeracy.
Overall, the majority of students are indicating sufficient progress between Year 5 and Year 7. However, there are approximately 30% of students who are not demonstrating sufficient progress in reading and numeracy and this is concerning.
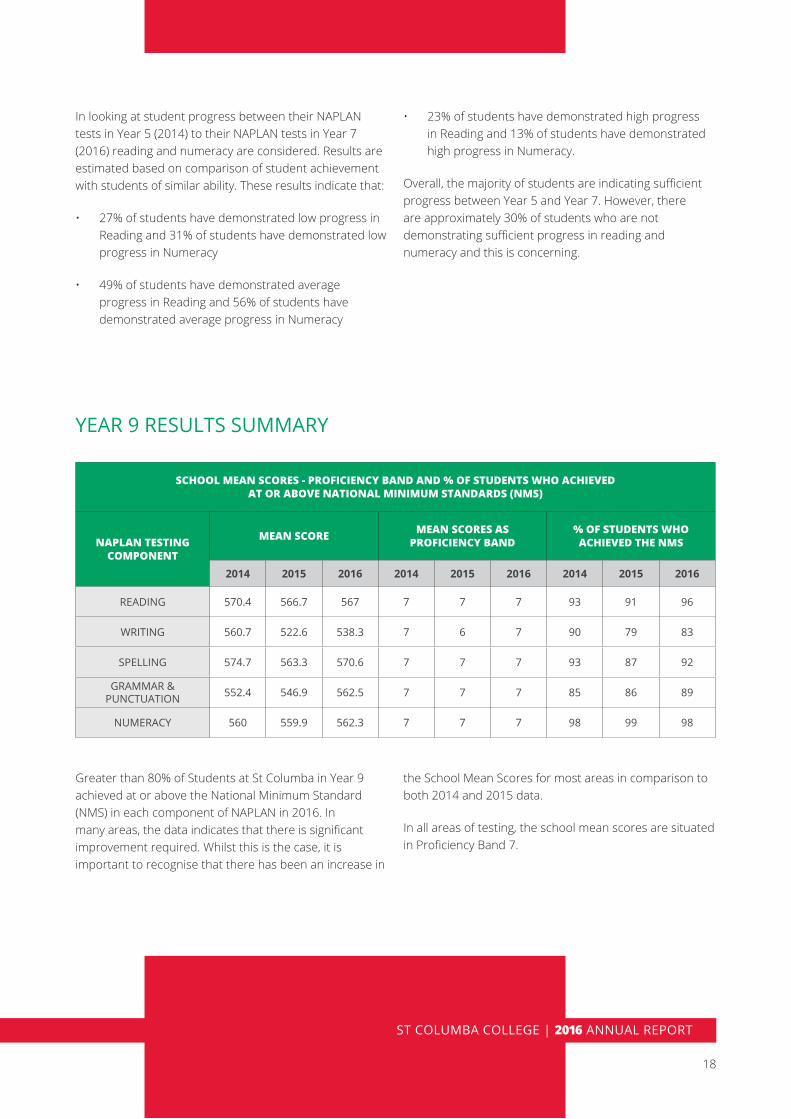
YEAR 9 RESULTS SUMMARY
Greater than 80% of Students at St Columba in Year 9 achieved at or above the National Minimum Standard (NMS) in each component of NAPLAN in 2016. In many areas, the data indicates that there is significant improvement required. Whilst this is the case, it is important to recognise that there has been an increase in
the School Mean Scores for most areas in comparison to both 2014 and 2015 data.
In all areas of testing, the school mean scores are situated in Proficiency Band 7.
SCHOOL MEAN SCORES - PROFICIENCY BAND AND % OF STUDENTS WHO ACHIEVED AT OR ABOVE NATIONAL MINIMUM STANDARDS (NMS)
NAPLAN TESTING COMPONENT
MEAN SCORE MEAN SCORES AS PROFICIENCY BAND
% OF STUDENTS WHO ACHIEVED THE NMS
2014 2015 2016 2014 2015 2016 2014 2015 2016
READING 570.4 566.7 567 7 7 7 93 91 96
WRITING 560.7 522.6 538.3 7 6 7 90 79 83
SPELLING 574.7 563.3 570.6 7 7 7 93 87 92
GRAMMAR & PUNCTUATION 552.4 546.9 562.5 7 7 7 85 86 89
NUMERACY 560 559.9 562.3 7 7 7 98 99 98
ST COLUMBA COLLEGE | 2016 ANNUAL REPORT

School Mean Scores - Year 9, 2014 -2016
In looking at student progress between their NAPLAN tests in Year 7 (2014) to their NAPLAN tests in Year 9 (2016) reading and numeracy are considered. Results are estimated based on comparison of student achievement with students of similar ability. These results indicate that:
• 25% of students have demonstrated low progress in Reading and 26% of students have demonstrated low progress in Numeracy
• 48% of students have demonstrated average progress in Reading and 51% of students have demonstrated average progress in Numeracy
• 27% of students have demonstrated high progress in Reading and 22% of students have demonstrated high progress in Numeracy
Overall, the majority of students are indicating sufficient progress between Year 7 and Year 9. However, there are approximately 25% of students who are not demonstrating sufficient progress in reading and numeracy and this is concerning.
19
20
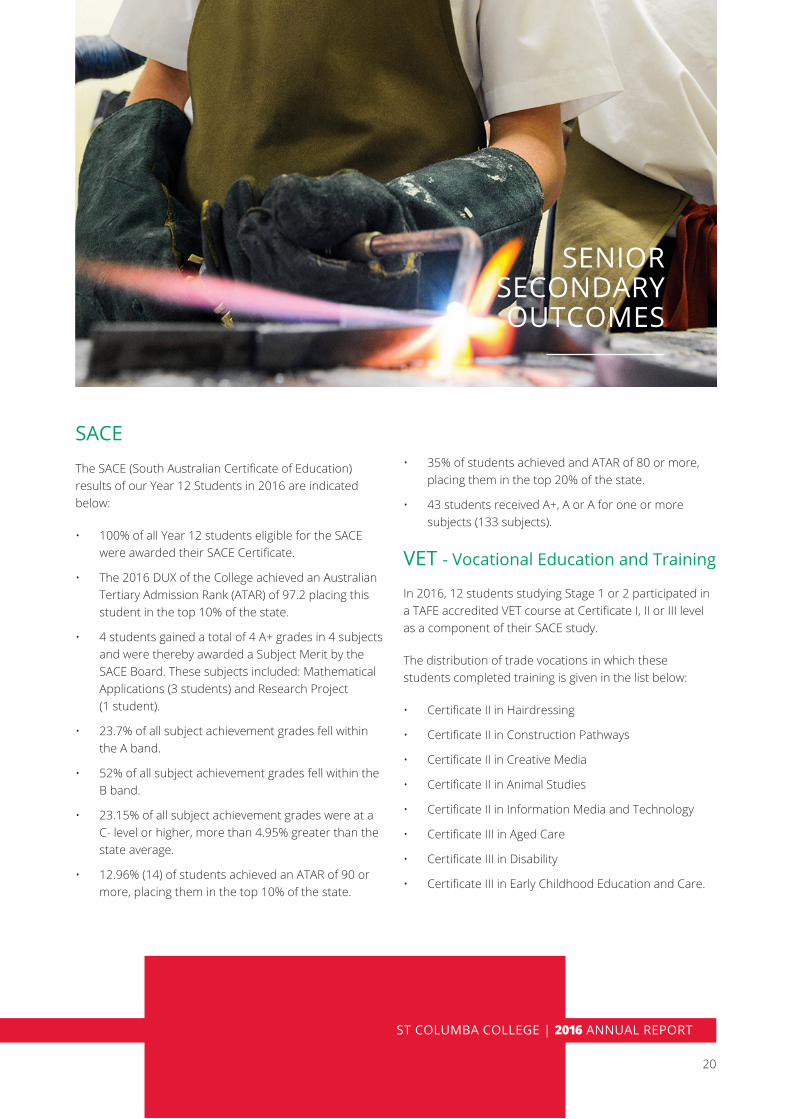
SENIOR SECONDARY OUTCOMES
SACEThe SACE (South Australian Certificate of Education) results of our Year 12 Students in 2016 are indicated below:
• 100% of all Year 12 students eligible for the SACE were awarded their SACE Certificate.
• The 2016 DUX of the College achieved an Australian Tertiary Admission Rank (ATAR) of 97.2 placing this student in the top 10% of the state.
• 4 students gained a total of 4 A+ grades in 4 subjects and were thereby awarded a Subject Merit by the SACE Board. These subjects included: Mathematical Applications (3 students) and Research Project (1 student).
• 23.7% of all subject achievement grades fell within the A band.
• 52% of all subject achievement grades fell within the B band.
• 23.15% of all subject achievement grades were at a C- level or higher, more than 4.95% greater than the state average.
• 12.96% (14) of students achieved an ATAR of 90 or more, placing them in the top 10% of the state.
• 35% of students achieved and ATAR of 80 or more, placing them in the top 20% of the state.
• 43 students received A+, A or A for one or more subjects (133 subjects).
VET - Vocational Education and Training
In 2016, 12 students studying Stage 1 or 2 participated in a TAFE accredited VET course at Certificate I, II or III level as a component of their SACE study.
The distribution of trade vocations in which these students completed training is given in the list below:
• Certificate II in Hairdressing
• Certificate II in Construction Pathways
• Certificate II in Creative Media
• Certificate II in Animal Studies
• Certificate II in Information Media and Technology
• Certificate III in Aged Care
• Certificate III in Disability
• Certificate III in Early Childhood Education and Care.
ST COLUMBA COLLEGE | 2016 ANNUAL REPORT
Post School Destinations• 82 lodged an application for entry to a formal
University (tertiary)
• 78 students who lodged an application received a formal University (tertiary) offer.
• 58 students were accepted in to their First or Second Preferences.
Tertiary courses offered to St Columba students in 2017 included:
• Bachelor of Law (U/G Entry) Double Degree
• Bachelor of English (Honours) (Software)
• Bachelor of Criminology
• Bachelor of Engineering Science
• Bachelor of Sports, Health and Physical
• Bachelor of Science (Animal Science)
• Bachelor of Economics / Bachelor of Finance
• Bachelor of Environmental Policy and Management
• Bachelor of Psychological Science
• Bachelor of Education (Primary and Middle)
• Bachelor of Arts / Master of Teaching (Secondary)
• Bachelor of Medical Science
• Bachelor of Human Movement / Bachelor of Psychological Science
• Bachelor of Arts (Performing Arts)
• Bachelor of Nursing (Pre-Reg)
• Bachelor of Languages
• Bachelor of Arts (Indigenous Culture) / Bachelor Social Work
• Bachelor of Disability and Develop Education
• Bachelor of Engineering (Honours) (Mechanical and Sustainable Energy)
• Bachelor of Aviation (Pilot)
21
PARENT, STUDENT & TEACHER SATISFACTION WITH THE SCHOOL
During 2016, the College Leadership team have engaged in a consultation process with parents, students and teachers in order to inform the future directions of the school.
An external consultant was engaged to assist in the review of the organisational structure of the College and a number of teaching staff and support staff were engaged in this process to provide feedback.
Student forums were held in order to seek student feedback around their experiences at the College and their learning experience so far as well as determining their preferred modes of engaging with their learning and the school community in to the future.
Students were also surveyed from Years 1-12 using an online survey called WHITS (What’s Happening in this School?). This survey is designed to support schools in developing effective school improvement plans. Through the WHITS data, was have analysed attitudinal, structural and cultural processes in ways that empower teachers, leaders and students to examine these processes. In turn, this will empower students to develop abilities, authority and agency to make decisions and implement change in their own lives and for the betterment of the lives of other people.
Some students have also been surveyed using the Classroom Climate Questionnaire by individual subject teachers, seeking feedback on their teaching. The student feedback was used to inform teachers about strengths and weaknesses, in order to improve their teaching practice in to the future and enhance the learning experience of students.
A number of parent forums have also been held throughout the year in order to gather feedback from parents. Again, the feedback has been used to shape the future directions of the College.
Teacher satisfaction is determined through the teacher professional review process, staff meetings, Consultative Committee and informal conversations.
22
ST COLUMBA COLLEGE | 2016 ANNUAL REPORT
23
OVERALL FINANCIAL POSITION
• An operating surplus of $247 k
• Net assets increased to $18.7 million
• Total income up 4.8%
• Total expenses up 5.6%, however, total expenses excluding salaries fell 1.2%
• The College held, as at the end of December 2016, a cash reserve of $1.7 million, up 8.4% on the previous year
• Borrowing reduced from $4.3 million in 2015 to $3.3 million
• The College spent $772 k in capital, infrastructure and equipment.
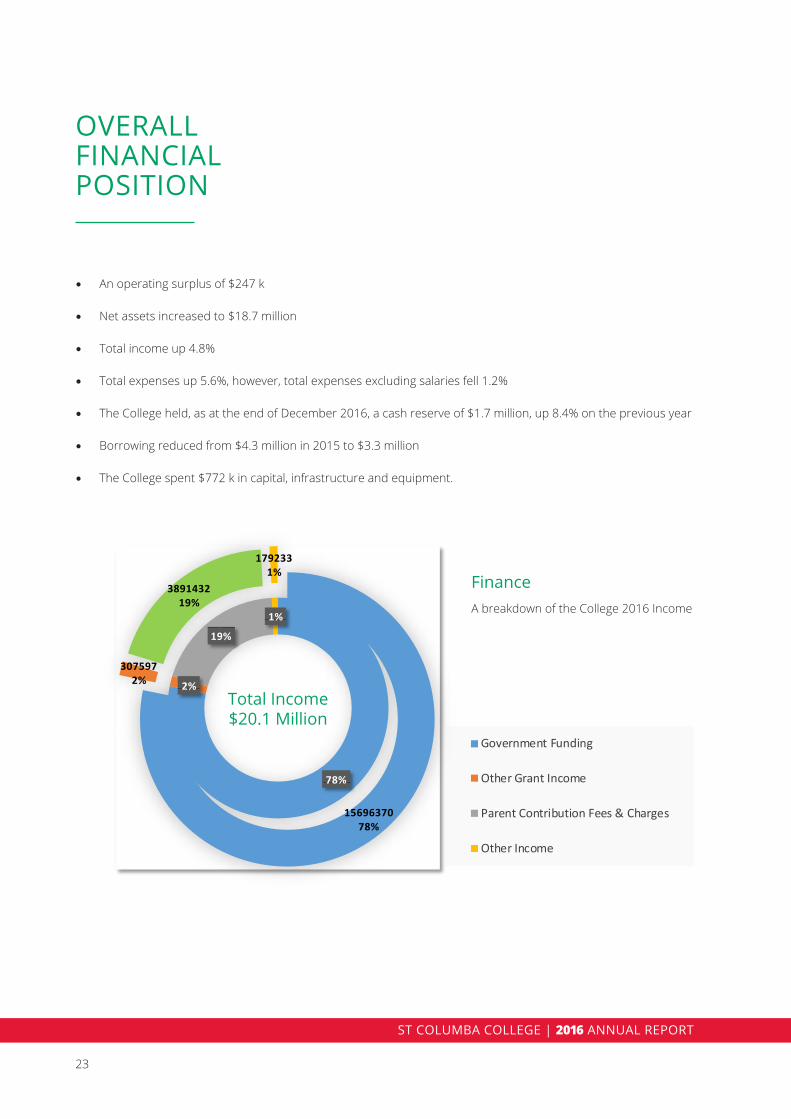
78%
2%
19%
1%
1569637078%
3075972%
389143219%
1792331%
Government Funding
Other Grant Income
Parent Contribution Fees & Charges
Other Income
FinanceA breakdown of the College 2016 Income
Total Income $20.1 Million
ST COLUMBA COLLEGE | 2016 ANNUAL REPORT


SHOULD YOU HAVE ANY FURTHER QUESTIONS, PLEASE CONTACT THE COLLEGE:
T 8254 0600 | E [email protected] | W www.stcolumba.sa.edu.au President Avenue, Andrews Farm SOUTH AUSTRALIA 5114
© Copyright 2017 St Columba College