Embed Size (px)
Citation preview
O F F I C E O F TH E GO V E RNOR | M I S S I S S I P P I D I V I S I O N O F MED I C A I D 1
EmploymentStatistics
State of the Division of Medicaid Workforce
September2016
O f f i c e o f t h e G o v e r n o r | M i s s i s s i p p i D i v i s i o n o f M e d i c a i d
O F F I C E O F TH E GO V E RNOR | M I S S I S S I P P I D I V I S I O N O F MED I C A I D 2
AttritionPerYear
10.31%
11.12% 11.05%
11.95%
10.66%
FY2012 FY2013 FY2014 FY2015 FY20169.00%
9.50%
10.00%
10.50%
11.00%
11.50%
12.00%
12.50%
Dataasof08/22/2016– SPAHRSseparationreport
O F F I C E O F TH E GO V E RNOR | M I S S I S S I P P I D I V I S I O N O F MED I C A I D 3
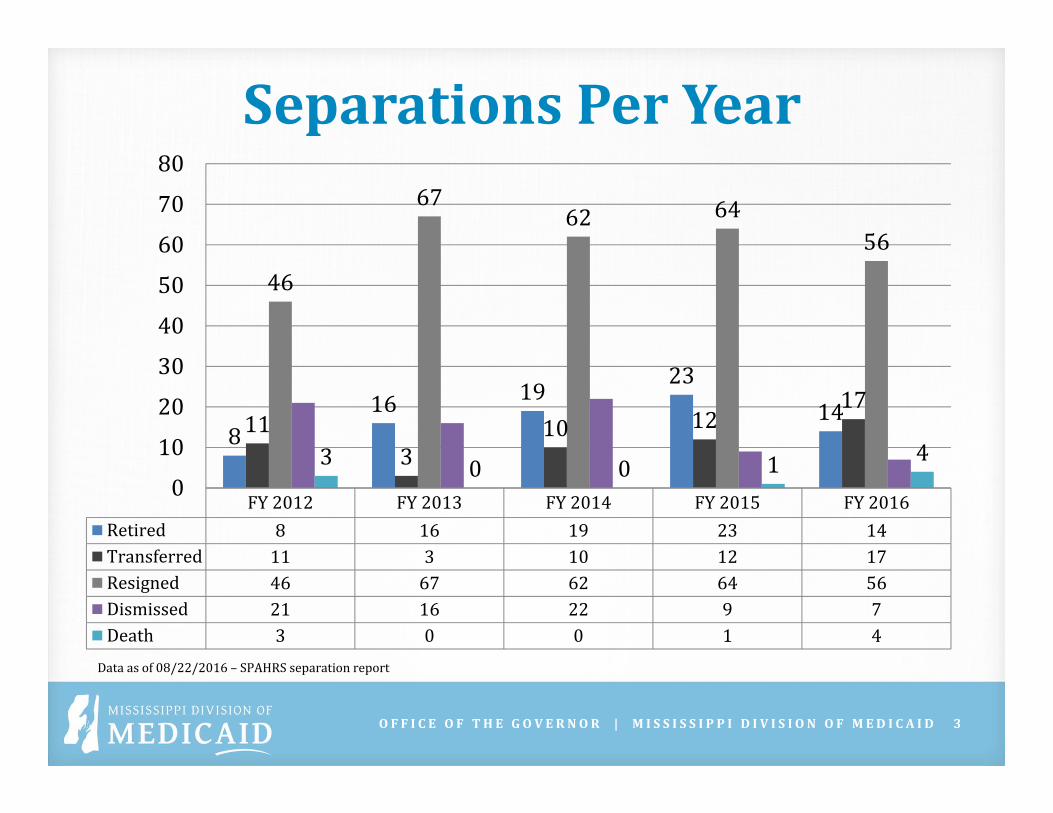
SeparationsPerYear
FY2012 FY2013 FY2014 FY2015 FY2016Retired 8 16 19 23 14Transferred 11 3 10 12 17Resigned 46 67 62 64 56Dismissed 21 16 22 9 7Death 3 0 0 1 4
816 19
231411
310 12
17
46
6762 64
56
3 0 0 1 40
10
20
30
40
50
60
70
80
Dataasof08/22/2016– SPAHRSseparationreport
O F F I C E O F TH E GO V E RNOR | M I S S I S S I P P I D I V I S I O N O F MED I C A I D 4
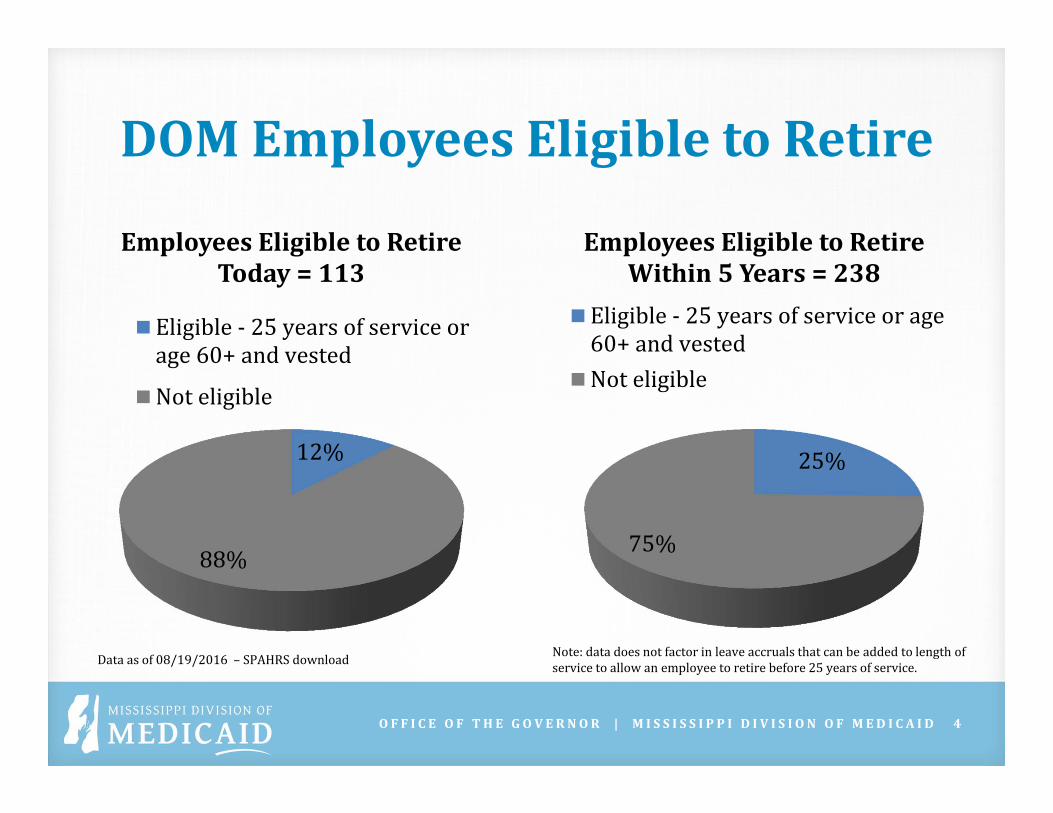
DOMEmployeesEligibletoRetire
12%
88%
EmployeesEligibletoRetireToday=113
Eligible‐25yearsofserviceorage60+andvested
Noteligible
25%
75%
EmployeesEligibletoRetireWithin5Years=238
Eligible‐25yearsofserviceorage60+andvestedNoteligible
Dataasof08/19/2016– SPAHRSdownload Note:datadoesnotfactorinleaveaccrualsthatcanbeaddedtolengthofservicetoallowanemployeetoretirebefore25yearsofservice.
O F F I C E O F TH E GO V E RNOR | M I S S I S S I P P I D I V I S I O N O F MED I C A I D 5
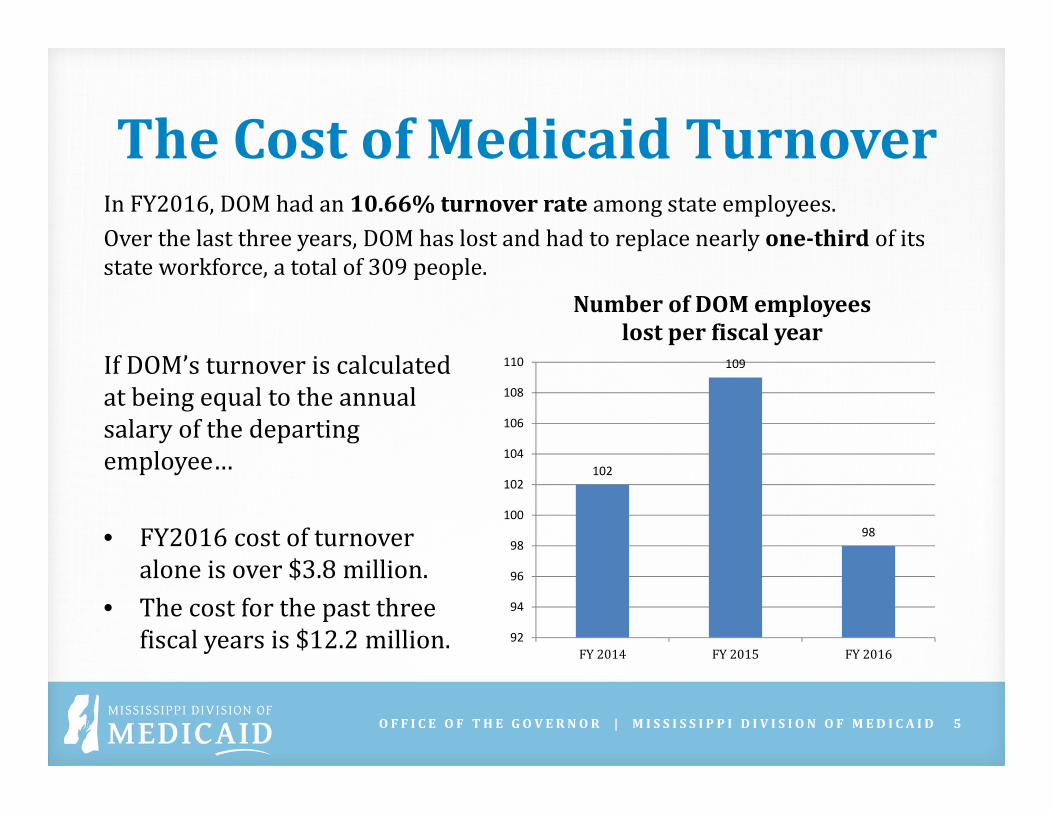
TheCostofMedicaidTurnoverInFY2016,DOMhadan10.66%turnoverrate amongstateemployees.Overthelastthreeyears,DOMhaslostandhadtoreplacenearlyone‐thirdofitsstateworkforce,atotalof309people.
IfDOM’sturnoveriscalculatedatbeingequaltotheannualsalaryofthedepartingemployee…
• FY2016costofturnoveraloneisover$3.8million.
• Thecostforthepastthreefiscalyearsis$12.2million.
102
109
98
92
94
96
98
100
102
104
106
108
110
FY2014 FY2015 FY2016
NumberofDOMemployeeslostperfiscalyear
O F F I C E O F TH E GO V E RNOR | M I S S I S S I P P I D I V I S I O N O F MED I C A I D 6
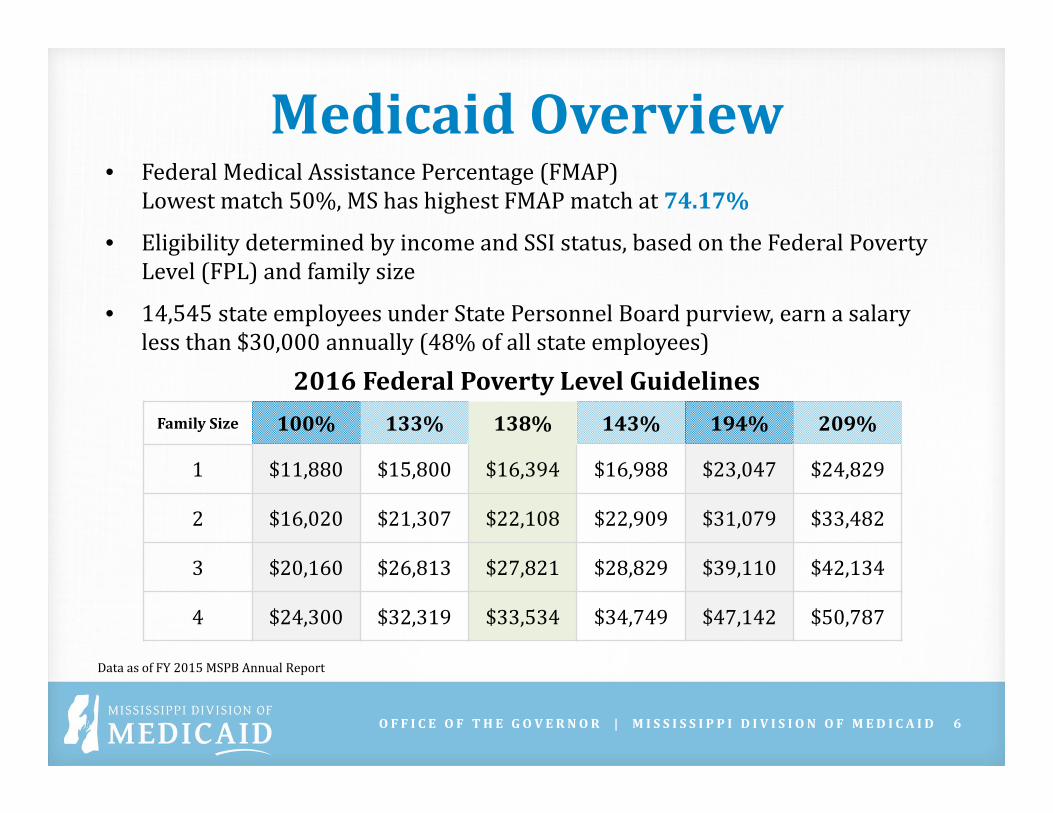
MedicaidOverview• FederalMedicalAssistancePercentage(FMAP)
Lowestmatch50%,MShashighestFMAPmatchat74.17%
• EligibilitydeterminedbyincomeandSSIstatus,basedontheFederalPovertyLevel(FPL)andfamilysize
• 14,545stateemployeesunderStatePersonnelBoardpurview,earnasalarylessthan$30,000annually(48%ofallstateemployees)
FamilySize 100% 133% 138% 143% 194% 209%
1 $11,880 $15,800 $16,394 $16,988 $23,047 $24,829
2 $16,020 $21,307 $22,108 $22,909 $31,079 $33,482
3 $20,160 $26,813 $27,821 $28,829 $39,110 $42,134
4 $24,300 $32,319 $33,534 $34,749 $47,142 $50,787
2016FederalPovertyLevelGuidelines
DataasofFY2015MSPBAnnualReport