Embed Size (px)
Citation preview

EMPLOYMENT
EXCHANGE STATISTICS
2019
भारत सरकार GOVERNMENT OF INDIA
श्रम एवं रोजगार मंत्रालय MINISTRY OF LABOUR & EMPLOYMENT
रोजगार महानिदेशालय DIRECTORATE GENERAL OF EMPLOYMENT
िई ददल्ली NEW DELHI
www.ncs.gov.in

Annual Report
EMPLOYMENT EXCHANGE STATISTICS
2019
Government of India Ministry of Labour & Employment
Directorate General of Employment Shram Shakti Bhawan, New Delhi.

भारत सरकार
रोजगार महानिदेशालय
श्रम एवं रोजगार मंत्रालय
Government of India
Directorate General of Employment
Ministry of Labour & Employment
PREFACE
Employment Exchanges are the major source in India to provide assistance to job
seekers by helping them in finding suitable employment, provide vocational guidance to
shape their careers and present Labour Market Information for policy planning and research
purposes. The details of educational, vocational and other qualifications of job seekers
registered with the Employment Exchanges provide a useful source of data at national as well
as local levels. While the State Governments compile this data at the district/ State level,
Directorate General of Employment (DGE) compiles and publishes the data at national level.
2. The present publication, 22nd
in series, contains annual and time series data on various
fields of activities of the Employment Exchanges such as registration, placement, live
register, submission, etc. Efforts have been made to make the publication as up-to-date as
possible. I hope this will meet the growing need of manpower planners, job seekers,
employers and other users.
3. The publication has been possible only with the active support and co-operation of the
State Governments/Union Territory Administrations. I am grateful to the Directors/Officers-
in-charge of Employment of various States/Union Territories and their officials in the
employment exchanges for furnishing the information in the prescribed format.
4. I must also place on record my sincere appreciation of the work accomplished by
officers & staff of Statistical Section under the able guidance and supervision of Shri S.B.
Singh, Deputy Director General (Employment) in systematic data collection, compilation,
analysis and presenting in an analytical manner in the publication.
5. We are in continuous process of improving the publication in all respects and,
therefore, request the users for their valuable comments/suggestions.
New Delhi
April, 2021

Employment Exchange Statistics-2019
i
STUDY TEAM
Sl. No. Name Designation
1. Sh. S.B. Singh Deputy Director General (Employment)
2. Dr. Shikha Anand Director (Employment)
3. Sh. Om Pal Singh Joint Director (Employment)
4. Smt. Meena Nandwani Deputy Director (Employment)
5. Sh. Davinder Singh Senior Statistical Officer
6. Sh. Nitesh Jaggia Junior Statistical Officer
7. Smt. Manisha Raj Junior Statistical Officer
8. Sh. Vikas Verma Junior Computor
9. Smt. Kamla Rani Junior Computor
10. Smt. Rajinder Kaur Junior Computor
11. Smt. Sunita Junior Computor
12. Smt. Shashi Sharma Junior Computor
13. Sh. Muninder Kumar DEO Gr. D
14. Sh. Harish Kumar DEO Gr. D
15. Smt. Ekta Gandhoke DEO Gr. B

Employment Exchange Statistics-2019
i
CONTENTS
I. TITLE PAGE NO.
LIST OF TABLES iii
HIGHLIGHTS iv-vi
CHAPTER-1 II. Frame Work for Data Collection
1.1 Introduction 1
1.2 Reference Period 1-2
1.3 Concepts and Definitions 3-4
1.4 Limitations of Data 4
1.5 National Career Service Portal 5
CHAPTER-2 Employment Exchanges Statistics: An Analysis
2.0 Live Register 6-9
2.1 Age-wise distribution of the job seekers 10
2.2 Educated job seekers (10th & Above) 11-13
2.3 Women job seekers 14-15
2.4 Scheduled Caste/Scheduled Tribe /
Other Backward Classes job seekers 16-18
2.5 Differently abled job seekers 18-20
2.6 Migrant and Repatriate job seekers 20
2.7 Minority Communities’ job seekers 20-21
2.8 Ex-ITI's and Full-Term apprentices job seekers 22
2.9 Occupational group-wise job seekers 22
Tables 24-54
Appendix 55-73

Employment Exchange Statistics-2019
ii
Table No. LIST OF TABLES PAGE No.
1. Employment Exchange Statistics (2007-2018) - All India 24
2. Employment Exchange Statistics (2018) - State-wise 25
3. Job seekers on the live register of employment exchanges –
classified by age group (2010-2017) – All India
26
4. Job seekers on the live register of employment exchanges –
classified by Age Group (2017) - State-wise
27
5. Educated job seekers (10th Standard and Above)
in employment exchanges (2007-2017) - All India
28
6. Educated Job Seekers (10th
Standard and Above)
by education level (2017) - All India
29
7. Women job seekers in employment exchanges (2007-2018) -All India 30
8. Women Job seekers in Employment Exchanges (2018) - State-wise 31
9. Educated Women job seekers (2007-2017) - All India 32
10. Scheduled Castes job seekers
in employment exchanges (2007-2017) - All India
33
11. Educated Scheduled Castes job seekers
in employment exchanges (2007-2017) - All India
34
12. Scheduled Tribes job seekers
in employment exchanges (2007-2017) - All India
35
13. Educated Scheduled Tribes job seekers
in employment exchanges (2007-2017) - All India
36
13-A Scheduled Castes/ Tribes/OBC job-seekers (2017) - State-wise 37-38
14. Reserved vacancies notified and filled by
employment exchanges (2007-2017) - All India
39
15. Differently abled job seekers (2010-2017) - All India 40
16. Differently abled job seekers in employment exchange/
special employment exchange (2007-2017) - All India
41-43
17. Differently abled job seekers
in special employment exchange (2017) - All India
44-46
18. Differently abled job seekers in special cell
under employment exchanges (2017) - All India
47
19. Statistics of work done by National Career Service Centers
for Differently Abled persons (2018)
48-50
20. Migrant job seekers in employment exchanges
(2010-2017) - All India
51
21. Minority Communities’ job seekers
in employment exchange (2017) - All India
52
22. Employment Exchange Statistics in respect of Ex-ITI/Full term
Apprentices (2007-2017) – All-India
53
23. Job seekers on the live register of employment exchanges
classified by broad occupational groups (2017) - All India
54
Appendix List of Employment Exchanges functioning in the country 56-71
Addresses of Employment Directorate of State/UTs 72-73
Employment Exchange Statistics-2019
iii
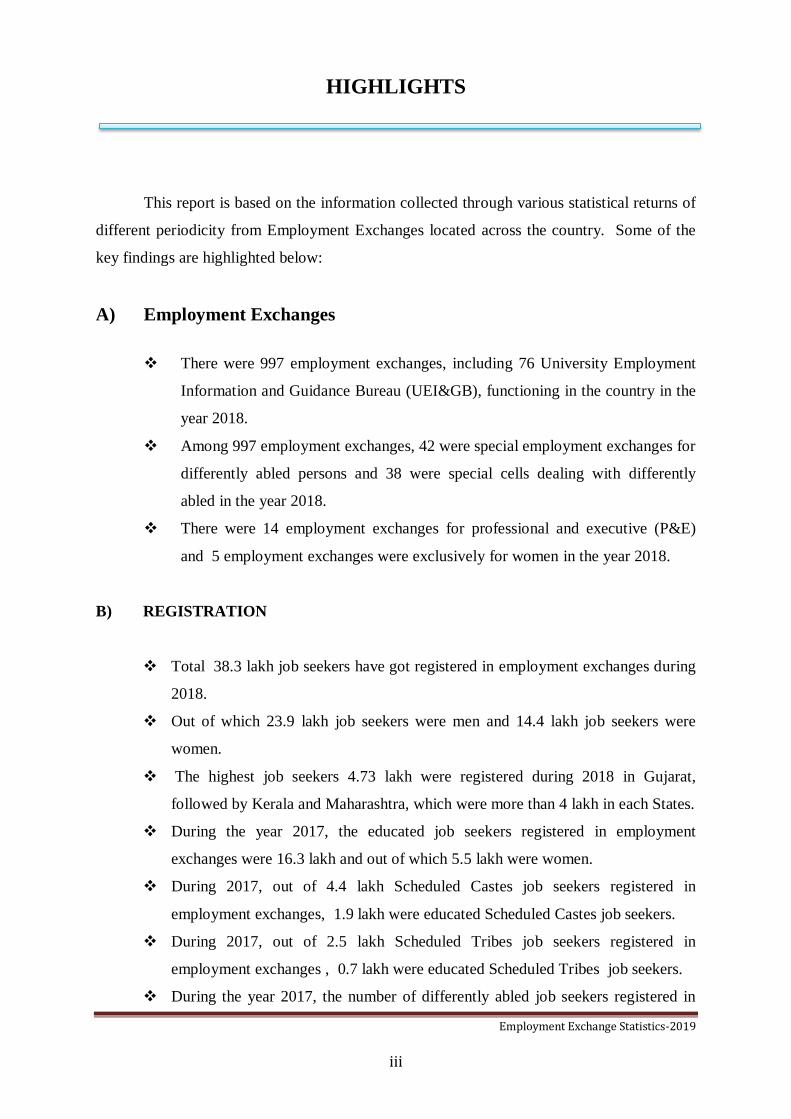
HIGHLIGHTS
This report is based on the information collected through various statistical returns of
different periodicity from Employment Exchanges located across the country. Some of the
key findings are highlighted below:
A) Employment Exchanges
There were 997 employment exchanges, including 76 University Employment
Information and Guidance Bureau (UEI&GB), functioning in the country in the
year 2018.
Among 997 employment exchanges, 42 were special employment exchanges for
differently abled persons and 38 were special cells dealing with differently
abled in the year 2018.
There were 14 employment exchanges for professional and executive (P&E)
and 5 employment exchanges were exclusively for women in the year 2018.
B) REGISTRATION
Total 38.3 lakh job seekers have got registered in employment exchanges during
2018.
Out of which 23.9 lakh job seekers were men and 14.4 lakh job seekers were
women.
The highest job seekers 4.73 lakh were registered during 2018 in Gujarat,
followed by Kerala and Maharashtra, which were more than 4 lakh in each States.
During the year 2017, the educated job seekers registered in employment
exchanges were 16.3 lakh and out of which 5.5 lakh were women.
During 2017, out of 4.4 lakh Scheduled Castes job seekers registered in
employment exchanges, 1.9 lakh were educated Scheduled Castes job seekers.
During 2017, out of 2.5 lakh Scheduled Tribes job seekers registered in
employment exchanges , 0.7 lakh were educated Scheduled Tribes job seekers.
During the year 2017, the number of differently abled job seekers registered in
Employment Exchange Statistics-2019
iv
employment exchanges was around 32 thousand that include 2.8 thousand job
seekers registered in special employment exchanges.
During the year 2017, the number of minorities communities job seekers
Muslim, Christian, Sikh, Buddhist and Jain registered in employment exchanges
in the country were 124.9 thousand, 96.4 thousand, 50.9 thousand, 3.4 thousand
and 0.4 thousand respectively.
C) PLACEMENT
Around 4.05 lakh job seekers were placed through employment exchanges during
the year 2018.
Among the 4.05 lakh job seekers placed, 3.5 lakh were men and 0.6 lakh were
women.
During the year 2017, the number of educated (10th standard and above) job
seekers placed were 3.75 lakh and whereas the educated women placed through
employment exchanges were around 72 thousand.
During the year 2017, the Scheduled Castes, Scheduled Tribes and Other
Backward Classes job seekers placed through employment exchanges were
around 31 thousand, 33 thousand and 5 thousand, respectively.
D) LIVE REGISTER
As reported by the State/UTs, 421.2 lakh job seekers were registered on the live
register of employment exchanges in the country at the end of December 2018.
Out of which 156.1 lakh job seekers registered were women.
Total 424.4 lakh job seekers were registered on live registered at the end of Dec,
2017, out of which 270.7 lakh job seekers were youth in the age group of 15-29
year which constitute 63.8% of total job seekers. At the same time, educated (10th
standard and above) job seekers were 345 lakh and educated women job seekers
were 133.9 lakh. Among educated job seekers, the Scheduled Castes were 36.8
lakh and the Scheduled Tribes were 21.3 lakh.
The job seekers belong to Scheduled Castes, Scheduled Tribes and Other
Backward Classes registered on live register of employment exchange across the

Employment Exchange Statistics-2019
v
country were 71.1 lakh, 26.1 lakh and 118.2 lakh at the end of the December,
2017.
During the year 2017, the differently abled job seekers registered on live register
in the country were around 7 lakh.
Total job seekers belong to minorities communities on live registered were 58.9
lakh at the end of December, 2017.
E) VACANCIES NOTIFIED
Total numbers of vacancies notified during the year 2018 (January to December)
were 12.3 lakh.
Total numbers of vacancies notified during the year 2017 were around 8.1 lakh, in
which the vacancies notified for Scheduled Castes were 19 thousand, for
Scheduled Tribes 21.6 thousand and 14.3 thousand for Other Backward Classes.
F) SUBMISSION MADE
The submission made by the employment exchanges in the country at the end of
December, 2018 was 25.8 lakh.

Employment Exchange Statistics-2019
1
CHAPTER– 1
FRAME WORK FOR DATA COLLECTION
1.1 Introduction
National Employment Service in the country functions in the legal framework of
Employment Exchange (Compulsory Notification of Vacancies) Act, 1959 through a network
of Employment Exchanges located in various parts of the country. The services rendered by
the Employment Exchanges include registration & placement, vocational guidance and career
counseling and collection of Employment Market Information, etc. National Employment
Service covers all the States and Union Territories with a network of 997 Employment
Exchanges (Except Sikkim, since there is no employment exchange is functioning in this
State). Administrative and financial control of Employment Exchanges lies with the
respective State/U.T. Governments. As part of their administrative functioning, Employment
Exchanges collect data on various aspects of employment and unemployment and submit it to
the respective State Directorate of Employment and to the Directorate General of
Employment (DGE). State Governments are required to compile this data at the State level,
While Directorate General of Employment (DGE) compiles and releases this data at all India
level.
Directorate General of Employment is responsible for laying down the policies,
standards, norms and guidelines for coordination of the National Employment Service at all
India level. In addition, it also evaluates and monitors employment and unemployment
situation at all India level using various sources of employment data such as Census, Labour
Force Surveys conducted by National Statistical Office (NSO) and Employment Market
Information (EMI) Programme etc. In this publication, data on job seekers registered with
the Employment Exchanges has been analyzed to evaluate incidence of unemployment
in the country.
1.2 Reference Period
Employment Exchanges furnishes data through various returns known as
Employment Exchange Statistical Returns covering a specific field of activity like
registration, placement, etc. of different periodicity. The data presented in the report refer to

Employment Exchange Statistics-2019
2
the year 2017 and 2018 (from 1st January to 31
st December). There are 4 annual, 4 half-yearly
and 1 monthly return. Name and brief description of Statistical Returns is as follows.
Statistical
returns
Name and brief description of
statistical return Periodicity
E.S. 1.1
Registrations, placements, submissions made, number
on live register and vacancies notified in respect of all
categories of applicants.
Monthly
E.S. 2.1
Educated applicants (All categories, women,
Scheduled Castes, Scheduled Tribes and OBCs) -
registrations, placement, live register by educational
levels.
Half-yearly
E.S. 2.3 Registrations, placements, live register and
submissions made in respect of minority communities. Half-yearly
E.S. 2.4
Registrations, placements, live register, reserved
vacancies notified, filled etc. In respect of SC, ST &
OBC applicants.
Half -Yearly
E.S. 2.5
Registrations, placements, live register vacancies
notified, filled, cancelled and outstanding etc. in
respect of differently abled applicants.
Half-Yearly
E.S. 1.2
Applicants on live register, vacancies notified, filled,
cancelled, outstanding by National Classification of
Occupation (NCO)
Annual
E.S. 1.4 Number of applicants on live register by age-group,
sex and educational levels Annual
E.S. 2.2
Registration, placements and live register by NCO in
respect of full term apprentices and Ex-ITI trainees by
designated trades
Annual
E.S. 2.6
Registrations, placement, live register in respect of
displaced persons from East Pakistan, repatriates from
Burma and Sri Lanka.
Annual
Employment Exchange Statistics-2019
3
1.3 Concepts and Definitions
For the sake of clarity, some of the important terms, relevant to the administrative
records generated in the Employment Exchanges are explained below:
Applicant A person who voluntarily registers at an employment exchange and is
eligible for employment and other assistance in accordance with the
prescribed procedure.
Apprentice A person who is undergoing apprenticeship training in a trade in
pursuance of a contract of apprenticeship.
Apprentices Act The Apprentices Act, 1961, provides for the regulation and control of
training of apprentices in trades and matters connected therewith.
Dead Register Systematic arrangement of Index Cards of applicants who for various
reasons are not entitled to placement assistance.
Displaced Person A person who, on account of the setting up of India and Pakistan or on
account of civil disturbances or fear of such disturbances in any area
which formed part of the erstwhile Pakistan had been displaced from or
left his place of residence in such an area after 1st day of March, 1947,
and who has subsequently been residing in India (Government of India
Ordnance No. XX of 1948). Where, however, State Government has
evolved a system of registration of Displaced Persons only those
persons who are in possession of evidence if such registration should be
regarded as "Displaced Persons" by Employment Exchanges for
purposes of employment under that State.
Differently Abled A person who on account of injury, disease or congenital deformity is
substantially handicapped in obtaining or keeping employment or in
undertaking work on his own account of a kind which apart from the
injury, disease or deformity would be suited to his age, experience and
qualifications.
Educated A job seeker who is having qualification of the level of 10th
standard
and above.
Group Discussion A discussion with a homogenous group of applicants or students
involving detailed information on job opportunities, training facilities
and such other matters pertaining to career planning or choosing
appropriate to the group.
Group Guidance
All group activities conducted for guidance purposes.
Index Card A card on which particulars pertaining to and action in respect of an
applicant are recorded.
Live Register Systematic arrangement of Index Cards pertains to applicants who are
in need of employment assistance.

Employment Exchange Statistics-2019
4
Placement An employer's acceptance of a person into a remunerative job through
the Employment Exchange. This includes: acceptance by employers of
applicants submitted by Exchanges for training/apprenticeship with the
object of their becoming paid employees on completion of their
training/apprenticeship.
Registration The process of recording the particulars of an employment seeker
according to prescribed procedure with a view to render him
employment assistance.
Registration
Guidance
Brief counseling given to an applicant at the time of registration.
Submission Forwarding of applicant's particulars to an employer for consideration
against a notified, advertised or speculative vacancy.
Vocational
Guidance
Assistance given to an individual in solving problems related to
vocational planning and to occupational choice and profession with due
regard for the individual characteristics and their relation to
occupational opportunities.
Renewal of
Registration
The process of extension of the period for which registration is valid for
purposes of rendering employment assistance.
1.4 Limitations of Data
Data flowing from the Employment Exchanges suffers from some limitations. These
limitations arise out of the fact that the Employment Exchanges are mostly located in urban
areas. The job seekers from the rural areas may find it difficult to register their names with
the Employment Exchanges. Further, the registration of applicants with the Employment
Exchanges is voluntary in nature. As such, the following limitations of the data may be kept
in view while using the information contained in the publication: -
The job seekers who are registered with the Employment Exchanges, all of whom
may not necessarily be unemployed.
All the job seekers who are unemployed do not necessarily register themselves with
the Employment Exchanges.
In some exceptional cases, there is a chance of duplication of registration.
The job seekers, after finding employment through agencies other than Employment
Exchanges, do not intimate the Employment Exchanges for deletion of their names
from the Live Register.
Employers do not always intimate the Employment Exchanges about the selection
of candidates even when selection is made from the list supplied by Employment
Exchanges.

Employment Exchange Statistics-2019
5
There can be cases when job seekers could not renew their cards within the
stipulated period and by virtue of their non-renewal, their names get deleted from
the live register.
A number of registrants do have some employment or the other, but are registered
for better jobs, particularly, in the Public Sector.
1.5 National Career Service Portal
Ministry of Labour and Employment is implementing National Career Service (NCS)
Project as a Mission Mode Project for transformation of the National Employment Service to
provide a variety of employment related services like career counselling, vocational
guidance, information on skill development courses, apprenticeship, internships etc. Under
this project, the NCS Portal (NCSP) has been made functional at the URL (www.ncs.gov.in).
The portal was dedicated to the Nation by Hon’ble Prime Minister of India on 20.07.2015.
The NCSP is supported by a dedicated helpdesk (multi-lingual) available from Tuesday to
Sunday (8.00 AM to 8.00 PM) on 1800-425-1514 for assisting users. The services under
NCS are available online and can be accessed directly, through Career Centres, Common
Service Centres, post offices, mobile devices, cyber cafes etc. The various stakeholders on
the NCS platform include job seekers, industries, employers, employment exchanges (career
centres), training providers, educational institutions and placement organizations.
The NCS Project also envisaged setting up of Model Career Centres (MCCs) to be
established in collaboration with States and other institutions to deliver employment services.
The Government has approved establishment of 200 Model Career Centres. The Government
provides financial assistance to these centres based on the proposals and scheme guidelines.
These Model Career Centres can be replicated by the States from their own resources. In
addition, the NCS project has a component of interlinking of employment exchanges with
NCS and provides central funding to States for up-gradation of infrastructures in employment
exchanges and organizing Job fairs. The Government provides part financial assistance based
on the proposals received from States and scheme guidelines.
Statistics given in this publication are exclusively received through
employment exchanges of State/UTs in the country. The job seeker’s data
available on National Career Service Portal (NCSP) is not included in this report.
“For data of job seekers, etc. registered on NCS portal please refer to report section of
www.ncs.gov.in” (https://www.ncs.gov.in/_layouts/15/ncsp/ViewStaticReport.aspx)

Employment Exchange Statistics-2019
6
CHAPTER – 2
EMPLOYMENT EXCHANGE STATISTICS: AN ANALYSIS
In this Chapter, Employment Exchange Statistics pertaining to the year ending
December 2017 and 2018 have been presented. A comparison with earlier report results is
also done in some cases. The number of job seekers on the live register of Employment
Exchanges in the country has been classified according to several variables such as age,
gender, education level, etc. and analyzed with a view to understand the labour market
formation.
2.0 LIVE REGISTER
Live Register means systematic arrangement of Index Cards pertaining to applicants
who are in need of employment assistance. Live Register, therefore, provides the total
number of persons waiting for job as on a particular day. The number of job seekers on the
Live Register of Employment Exchanges is often taken as an indicator of the level of
unemployment in the country.
Annual time-series data on total number of job seekers registered with the
Employment Exchanges, placement effected against the vacancies notified, along with the
number of job seekers waiting for the job at end of the year (Live Register) for the period
2007-2018 are given in detail in Table-1. Some of salient features of the trends observed are
given as under:
Statement 1: Job seekers in employment exchanges at the end of the year (All-India)
(in lakh)
Year 2014 2015 2016 2017 2018
Registration 59.6 69.4 59.6 39.5 38.3
Placement 3.4 3.9 4.1 4.2 4.0
Vacancies Notified 7.6 8.1 14.0 8.1 12.3
Submission made 42.2 43.1 39.1 18.5 25.8
Live Register 482.6 435.0 433.8 424.4 421.2

Employment Exchange Statistics-2019
7
The statement 1 shows that:
As on 31st December 2018, 421.2 lakh persons were registered on live register with
employment exchanges as compared to 424.4 lakh during previous year. Job seekers
on live register were declined compared to last year as registration was decreased
during the current year.
On an average, around 53 lakh job seekers got registered with the employment
exchanges per year during the last five years.
The number of vacancies notified during the year 2018 was 12.3 lakh that varied from
7.6 lakh to 12.3 lakh during 2014-18.
The placement has slightly decreased from 4.2 lakh in 2017 to 4.0 lakh in the year
2018.
Out of the total number of vacancies notified during 2018, around one third were
filled through the Employment Exchanges.
Decreasing trend in job seekers on live register has been observed since registration
was declined and a number of job seekers in the category of job seekers removed
from live register for reasons other than transfer to other exchanges (which were not
active), which has decreased the number of job seekers in overall live register.
Trend in the live register of all job seekers is given in Table-1.
399.7
391.1
381.5
388.3
401.7 447.9
468.0 482.6
435.0
433.8
424.4
421.2
0
100
200
300
400
500
600
2007 2008 2009 2010 2011 2012 2013 2014 2015 2016 2017 2018
No
. of
job
see
kers
( in
lakh
)
YEAR JOB SEEKERS
Figure 1: Trend in live register of all job seekers (All- India)

Employment Exchange Statistics-2019
8
Live Register: State wise
The State-wise distribution of Job seekers registered with employment
exchanges for the year 2018 is given in Table-2. From the table, it is observed that:
Maximum number of employment exchanges are functioning in Uttar Pradesh
(100) followed by Kerala (89) and West Bengal (77).
The highest job seekers who got registered during 2018 were in Gujarat (4.7
lakh) followed by Kerala (4.3 lakh) and Maharashtra (4.1 lakh).
During the year 2018, more than 5.6 lakh vacancies were notified by the Gujarat
which was the highest among all State/UTs followed by Uttarakhand (2.5 lakh)
and in Uttar Pradesh 1.7 lakh.
25.5 lakh job seekers were sponsored by the employment exchanges and out of
these 4 lakh could find the placement which is less than the vacancies notified
(12.3 lakh) during the year 2018.
The largest number of job seekers on live register during the year 2018 were in
West Bengal (around 77 lakh), Tamil Nadu (73.7 lakh) and in Maharashtra (4.0
lakh).
During the year 2018, Gujarat has placed 3.4 lakh job seekers that were the
highest among all State/UTs.
Live Register: Category wise
Category-wise number of job seekers on the live register of employment exchanges
during 2013 to 2017 is given below:
Statement 2: Category wise job seekers on live register of employment exchanges
at the end of the year (All -India)
(in lakh)
Year Women Scheduled
Castes
Scheduled
Tribes
Differently
Abled
All Job
Seekers
2013 165.5
(35.4)
72.9
(15.6)
24.9
(5.3)
7.2
(1.5) 468.0
2014 170.8
(35.4)
76.4
(16.3)
25.2
(5.2)
7.0
(1.4) 482.6
2015 155.4
(35.7)
70.5
(16.2)
25.2
(5.8)
6.9
(1.6) 435.0
2016 157.3
(36.3)
71.4
(16.4)
25.7
(5.9)
7.0
(1.6) 433.8
2017 155.2
(36.6)
71.1
(16.7)
26.1
(6.1)
7.0
(1.6) 424.4
Note: Percentage to total is given in brackets;

Employment Exchange Statistics-2019
9
The statement 2 shows that:
There is decreasing trend in live register of women job seekers. However, the
percentage of women job seekers to the total job seekers has also increased
gradually from 35.4% in 2013 to 36.6% in 2017.
The number of Scheduled Castes job seekers on live register has fluctuated form
around 73 lakh to 71 lakh during the year 2013 to 2017.
Scheduled Tribes job seekers have increased from 24.9 lakh to 26.1 lakh on live
register during the same period.
The live register of differently abled persons has marginally decreased from 7.2
lakh in 2013 to 7.0 lakh in 2017. The percentage of live register of differently
abled to total live register was around 1.6% in 2017.
Graphical presentation of category wise live register for the period 2012 to 2017 is
given below:
165.
5
170.
8
155.
4
157.
3
155.
2
72.
9
76.4
70.5
71.4
71.1
24.9
25.2
25.2
25.7
26.1
7.2
7.0
6.9
7.0
7.0
468.0 482.6
435.0 433.8 424.4
0
50
100
150
200
250
300
350
400
450
500
2013 2014 2015 2016 2017
JOB
SEE
KER
S (i
n la
kh)
YEAR
Women SC ST DA Total
Figure 2: Category wise job seekers on live register (All - India)
Employment Exchange Statistics-2019
10
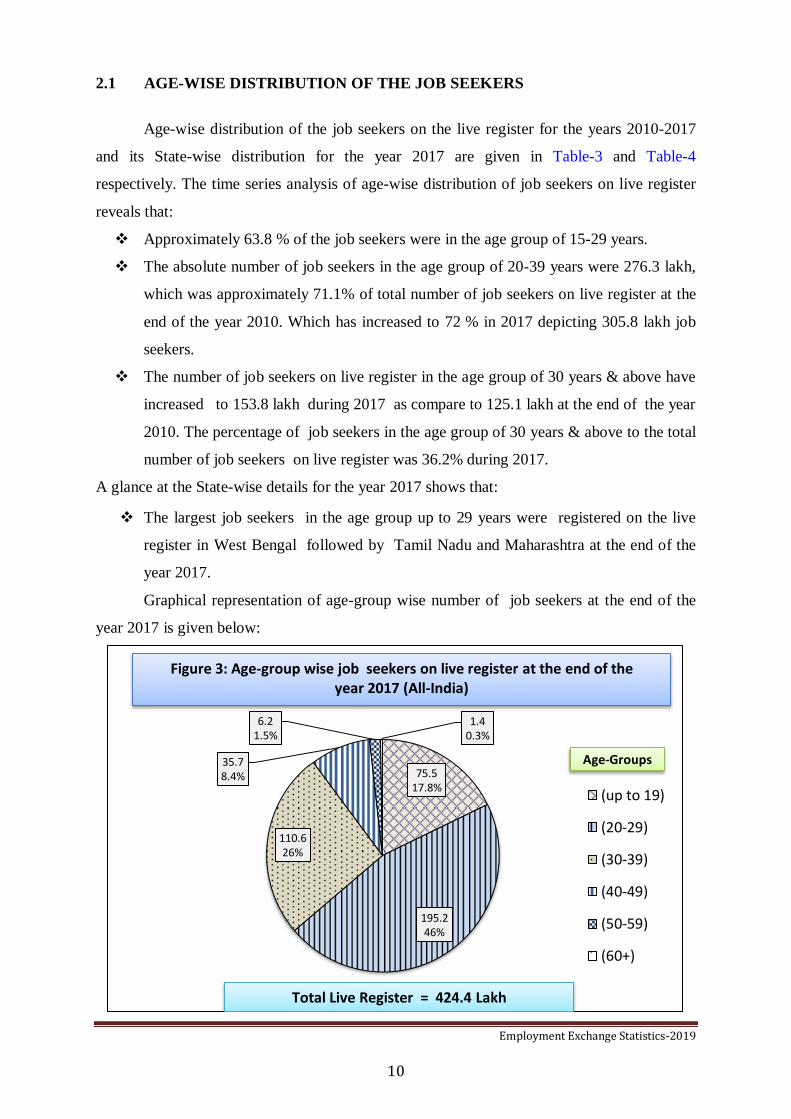
2.1 AGE-WISE DISTRIBUTION OF THE JOB SEEKERS
Age-wise distribution of the job seekers on the live register for the years 2010-2017
and its State-wise distribution for the year 2017 are given in Table-3 and Table-4
respectively. The time series analysis of age-wise distribution of job seekers on live register
reveals that:
Approximately 63.8 % of the job seekers were in the age group of 15-29 years.
The absolute number of job seekers in the age group of 20-39 years were 276.3 lakh,
which was approximately 71.1% of total number of job seekers on live register at the
end of the year 2010. Which has increased to 72 % in 2017 depicting 305.8 lakh job
seekers.
The number of job seekers on live register in the age group of 30 years & above have
increased to 153.8 lakh during 2017 as compare to 125.1 lakh at the end of the year
2010. The percentage of job seekers in the age group of 30 years & above to the total
number of job seekers on live register was 36.2% during 2017.
A glance at the State-wise details for the year 2017 shows that:
The largest job seekers in the age group up to 29 years were registered on the live
register in West Bengal followed by Tamil Nadu and Maharashtra at the end of the
year 2017.
Graphical representation of age-group wise number of job seekers at the end of the
year 2017 is given below:
75.5 17.8%
195.2 46%
110.6 26%
35.7 8.4%
6.2 1.5%
1.4 0.3%
(up to 19)
(20-29)
(30-39)
(40-49)
(50-59)
(60+)
Total Live Register = 424.4 Lakh
Age-Groups
Figure 3: Age-group wise job seekers on live register at the end of the year 2017 (All-India)

Employment Exchange Statistics-2019
11
2.2 EDUCATED JOB SEEKERS (10th
Standard & above)
The major share of job seekers awaiting jobs in the employment exchanges was that of
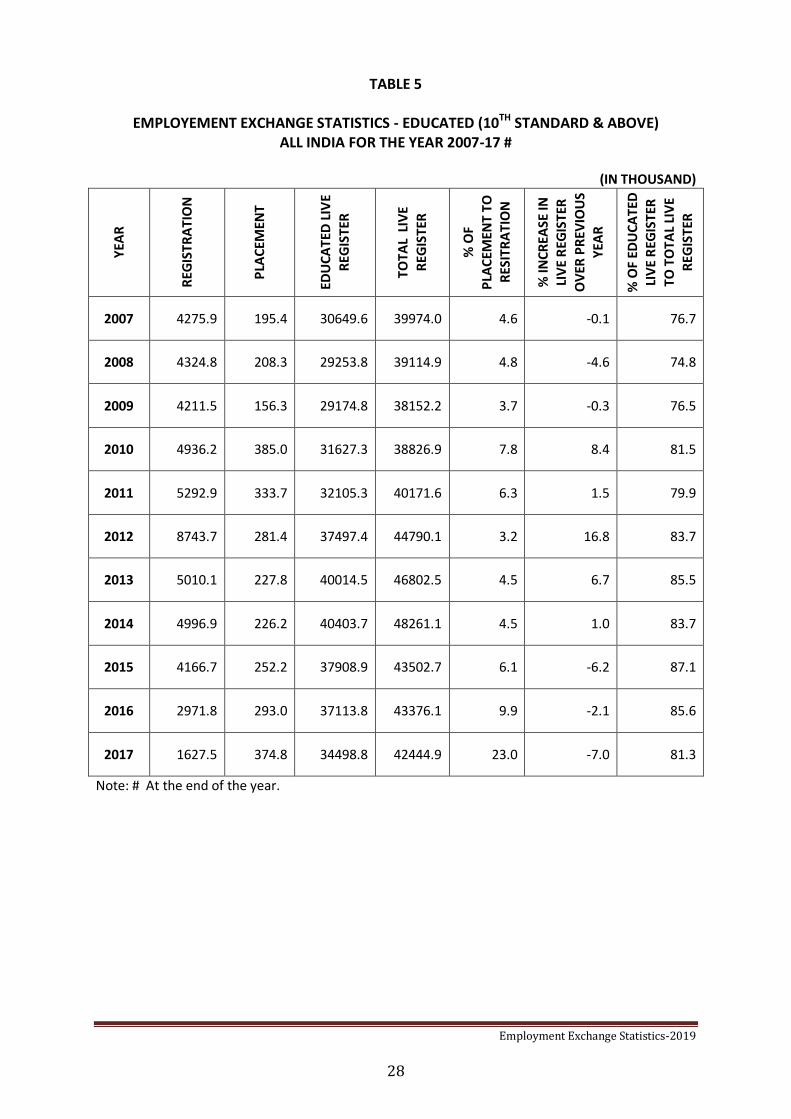
educated persons. Year-wise details of the educated job seekers are given in Table-5.
Statement 3: Educated job seekers - trend thereof - (All-India)
(in lakh)
Educated job seekers Total
Live Register
% of educated
live register to
total live register Year Registration Placement Live Register
2013 50.1 2.3 400.1 468.0 85.5
2014 50.0 2.3 404.0 482.6 83.7
2015 41.7 2.5 379.1 435.0 87.1
2016 29.7 2.9 371.1 433.8 85.6
2017 16.3 3.7 345.0 424.4 81.3
The statement 3 reveals that:
Around 16 lakh educated job seekers got registered themselves with the employment
exchanges during the year 2017.
The percentage of educated job seekers on live register to the all job seekers on live
register has decreased from 85.5 % at the end of 2013 to 81.3% at the end of 2017.
The placement of educated job seekers was 88.3% of total placements during the
year 2017.
The number of educated job seeker registered on live register of employment
exchanges according to their levels of education for the year 2017 is given in Table-6. It is
observed that:
The maximum number of job-seekers (140 lakh i.e. 40.6 %) was educated 10th
standard level.
Higher Secondary or 12thpassed accounted for 108.4 lakh (31.4%), Graduates, Post-
Graduates and Diploma Holders & Others were 61.6 lakh (17.8%), 15.3 lakh (4.4%)
and 19.7 lakh (5.2%) respectively.
Among the total educated job seekers on live register of employment exchanges, the
number of educated women job seekers were 38.8%. 51.7 lakh were 10th class
passed, 42.1 lakh were 12th
passed and Graduates and Post-Graduates were 24.8 lakh
& 8.2 lakh respectively. The educated women having education level of Diploma
Holders & Other were 6.9 lakh at the end of the year 2017.

Employment Exchange Statistics-2019
12
A graphical presentation of year wise registration trend of educated job seekers for the
period 2007-2017 is given below:
Category-wise educated job-seekers for the period 2012-2017 is given below:
Statement 4: Category wise Educated job seekers on live register of employment
exchanges at the end of the year (All-India)
(in lakh)
Year Women Scheduled
Castes
Scheduled
Tribes
Total Educated
Live Register
2013 148.4 66.0 19.8 400.1
(37.1) (16.5 (4.9)
2014 147.2 66.9 20.8 404.0
(36.4) (16.6) (5.2)
2015 137.8 62.2 21.1 379.1
(36.3) (16.4) (5.6)
2016 136.0 60.7 20.9 371.1
(36.6) (16.3) (5.6)
2017 133.9 36.8 21.3 345.0
(38.8) (10.7) (6.2) Note: Percentage to total educated job seekers in brackets
42.8 43.2 42.1 49.4
52.9
87.4
50.1
50.0 41.7
29.7
16.3
0
10
20
30
40
50
60
70
80
90
100
2007 2008 2009 2010 2011 2012 2013 2014 2015 2016 2017
No
. of
job
se
eker
s (i
n la
kh)
YEAR JOB SEEKERS
Figure 4: Trends in registration of Educated job seekers (All - India)

Employment Exchange Statistics-2019
13
It may be seen from the statement 4 that:
The percentage of educated women job seekers of the total educated job-seekers at
the end of the year 2017 has increased to 38.8% from 36.6% in 2016.
The educated Scheduled Caste job seekers have declined to 36.8 lakh in 2017
from 60.7 lakh in compare to previous year that was 10.7% and 16.3% of total
educated job seekers respectively.
Educated Scheduled Tribes job seekers have marginally increased during the same
period.
A graphical representation of category-wise educated job seekers is given below:
148.4 147.2 137.8 136.0 133.9
66.0 66.9 62.2 60.7
36.8
19.8 20.8 21.1 20.9 21.3
400.1 404.0
379.1 371.1
345
0
50
100
150
200
250
300
350
400
450
2013 2014 2015 2016 2017
No
. of
ed
uca
ted
job
- s
eeke
rs(i
n L
akh
)
YEAR
WOMEN SC ST TOTAL
Figure 5: Category wise educated job seekers on live register (All - India)

Employment Exchange Statistics-2019
14
2.3 WOMEN JOB-SEEKERS
The number of women seeking jobs through employment exchange for the period
2007-2018 is given in Table-7.
Statement 5: Women job seekers in employment exchanges
at the end of the year (All-India)
(in lakh)
Year 2014 2015 2016 2017 2018
Registration 21.9 25.3 22.6 15.5 14.4
Placement 0.6 0.6 0.6 0.9 0.6
Live Register 170.8 155.4 157.3 155.2 156.1
The statement 5 shows that:
Women job seekers constituted around 37.1% of the total live register in 2018.
Registration of women job seekers has declined in compare to previous year.
The placement of women job seekers through employment exchanges has decreased
to 0.6 lakh during the year 2018 against the previous year that was 0.9 lakh.
The number of women job seekers on live register have incrased during 2018 against
the previous year.
The position of women job seekers in different State/UTs at the end of the year 2018
is given in Table-8. Some of the main features observed in this table are as under:
Among the major states, Tamil Nadu had the highest number of women job seekers
(38.7 lakh) on live register of employment exchanges followed by West Bengal and
Kerala. Among the States, the lowest number of women job seekers was in Mizoram
(0.16 lakh).
The number of women job seekers who got registered in employment exchanges in
the country during 2018 were highest in Kerala (2.6 lakh) followed by Maharashtra.
(1.77 lakh) and Tamil Nadu (1.46 lakh)
Out of 58.2 thousand women job seekers placed through employment exchanges
across the country, 43.4 thousand women job-seekers were placed by Gujarat State.
Live register for educated women job seekers and total women job seekers has
registered a decline over the previous year.

Employment Exchange Statistics-2019
15
A graphical representation and comparison of live register of total women and
educated women job seekers is given below:-
120.0
123.3
124.0
129.3
136.9 156.5
165.5 170.8
155.4
157.3
155.2
156.1
0
50
100
150
200
2007 2008 2009 2010 2011 2012 2013 2014 2015 2016 2017 2018
No
. of
wo
men
job
see
kers
(in
lakh
)
YEAR JOB SEEKERS
Figure 6: Trend in live register of women job seekers (All- India)
123.9
148.4 147.2
137.8 136.0 133.9
156.5 165.5
170.8
155.4 157.3 155.2
0
20
40
60
80
100
120
140
160
180
2012 2013 2014 2015 2016 2017
Wo
men
job
see
kers
(in
lakh
)
YEAR
Educated women job seekers Total women job seekers
Figure 7: Comparison of total women job seekers with educated women job seekers (All- India)

Employment Exchange Statistics-2019
16
2.4 SCHEDULED CASTES (SC)/ SCHEDULED TRIBES (ST)/ OTHER
BACKWARD CLASSES(OBC) JOB SEEKERS
The employment service, as in the past, continued making efforts to cater to the
special needs of Scheduled Castes (SC), Scheduled Tribes (ST) and Other Backward Classes
(OBC) job-seekers. Over the years, a number of special measures were adopted by the
employment exchanges to safeguard the interest of the job seekers belonging to these
categories. These includes:
Maintenance of their registration cards separately,
Ensuring that the vacancy notifications from public sector establishments invariably
indicate details regarding reservation,
Providing vocational guidance and imparting recruitment training,
Sponsoring suitable candidates against unreserved vacancies,
Eliciting the cooperation of SC and ST association in locating suitable candidates.
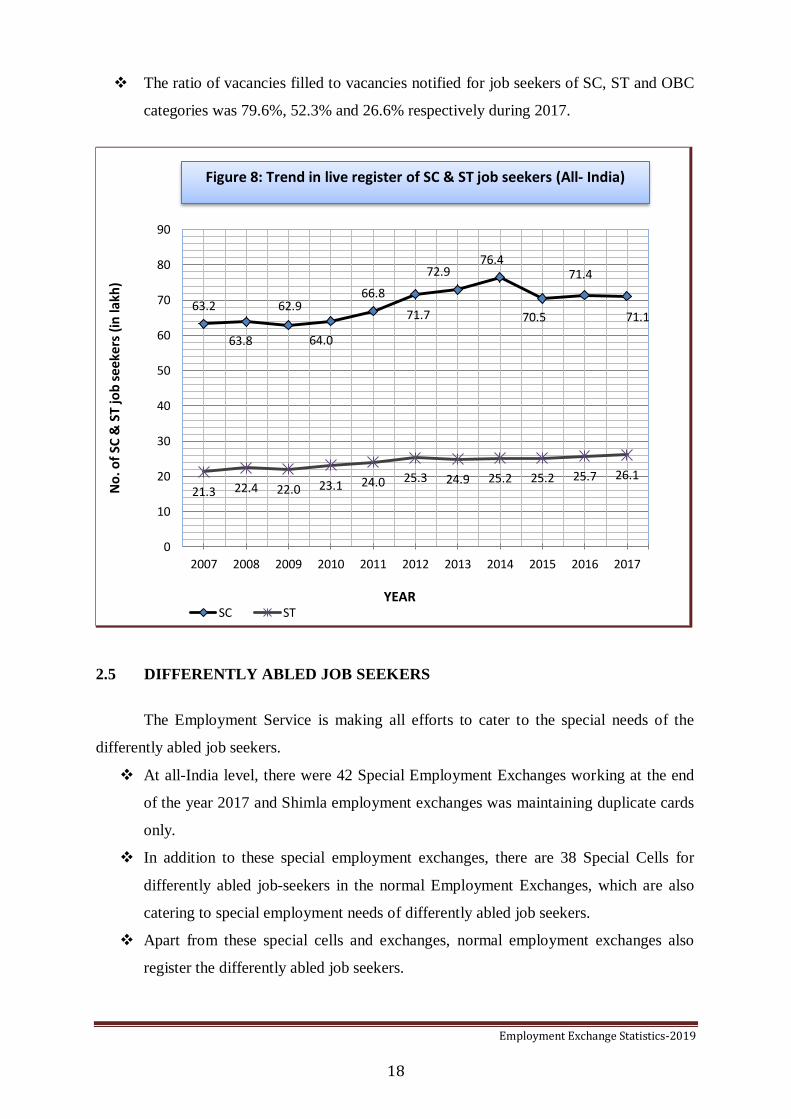
The year wise performance of employment exchanges in respect of Scheduled Castes
job seekers is given in Table-10.
Over the period from 2007 to 2017, live register of SC job-seekers has increased
from around 63 lakh in 2007 to 71 lakh in 2017, showing an increase over the period.
SC job seekers were 16.7% of the total job seekers on the live register at the end of
year 2017.
Registration of SC job seekers has declined to 4.4 lakh during the year 2017 against
the previous year, which was 6.2 lakh.
Placement of SC job seekers during 2017 has increased against previous year.
Percentage of placement to the registration of SC job seekers during the year 2017
was 7.2%.
The year-wise performance of employment exchanges in respect of educated
Scheduled Castes job seekers is given in Table-11.
The percentage of educated SC job seekers to the total SC job seekers has decreased
in 2017 against previous year.
Out of around 31 thousand SC job seekers placed through employment exchanges
during 2017, 28 thousand were educated SC job seekers. Live register of educated SC
job seekers has been fluctuated between 46.5 lakh to 36.8 lakh during 2007 to 2017.

Employment Exchange Statistics-2019
17
The year wise performance of employment exchanges in respect of Scheduled Tribes
(ST) job seekers is given in Table-12.
Live register of ST job seekers has marginally increased during the year 2017 against
the previous year. ST job seekers were 6.1% of the total job seekers on the live
register at the end of year 2017.
Registration of ST job seekers has varied from around 2.6 lakh to 2.5 lakh over the
period of 2007 to 2017.
Placement of ST job seekers has increased during 2017 against the previous year.
Placement to registration ratio of ST job seekers was around 13.3% in 2017.
The year wise performance of employment exchanges in respect of educated
Scheduled Tribes (ST) job seekers is given in Table-13.
The percentage of educated ST Job seekers to the all ST job seekers was 81.6% at the
end of the year 2017, which were 21.3 lakh.
Out of 0.33 lakh ST job seekers placed through the employment exchanges during
the year 2017, around 73 % were educated ST job seekers.
State-wise performance of employment exchanges in respect of Scheduled Castes
(SC), Scheduled Tribes (ST) and Other Backward Classes (OBC) job seekers for the year
2017 is given in Table 13-A.
The State wise table reveals that Tamil Nadu has maximum number of SC and OBC
job seekers around 18 lakh and 49.8 lakh respectively on the live register whereas
Chhattisgarh and Assam have maximum number of ST job seekers (3.9 lakh) and (2.9
lakh) respectively on the live register of the employment exchanges.
Gujarat has placed maximum number of SC and ST job seekers around 29 thousand
and 31 thousand respectively, whereas for OBC job seekers, maximum placement
was made in Tamil Nadu during 2017.
Percentage of placement to registration was maximum in Gujarat among major States
for SC, ST and OBC job seekers.
The position of reserved vacancies notified and filled by employment exchanges is
given in Table-14.
Employment Exchange Statistics-2019
18
The ratio of vacancies filled to vacancies notified for job seekers of SC, ST and OBC
categories was 79.6%, 52.3% and 26.6% respectively during 2017.
2.5 DIFFERENTLY ABLED JOB SEEKERS
The Employment Service is making all efforts to cater to the special needs of the
differently abled job seekers.
At all-India level, there were 42 Special Employment Exchanges working at the end
of the year 2017 and Shimla employment exchanges was maintaining duplicate cards
only.
In addition to these special employment exchanges, there are 38 Special Cells for
differently abled job-seekers in the normal Employment Exchanges, which are also
catering to special employment needs of differently abled job seekers.
Apart from these special cells and exchanges, normal employment exchanges also
register the differently abled job seekers.
63.2
63.8
62.9
64.0
66.8
71.7
72.9 76.4
70.5
71.4
71.1
21.3 22.4 22.0 23.1 24.0 25.3 24.9 25.2 25.2 25.7 26.1
0
10
20
30
40
50
60
70
80
90
2007 2008 2009 2010 2011 2012 2013 2014 2015 2016 2017
No
. of
SC &
ST
job
see
kers
(in
lakh
)
YEAR SC ST
Figure 8: Trend in live register of SC & ST job seekers (All- India)

Employment Exchange Statistics-2019
19
Besides these, there are 21 National Career Service Centre for Differently Abled
(NCSC-DA) erstwhile Vocational Rehabilitation Centres (VRCs) functioning at
Mumbai, Hyderabad, Jabalpur, Delhi, Ludhiana, Kanpur, Calcutta, Chennai,
Ahmedabad, Trivandrum, Bangalore, Guwahati, Bhubaneswar, Jaipur, Vadodara,
Patna, Agartala, Una, Srinagar, Ranchi and Puducherry. These Centres are working
under the direct administrative control of Directorate General of Employment and
evaluate the residual capacity of the differently abled persons, impart them
vocational training and guidance and try to put them into the job or self-employment
according to their capabilities.
National Career Service Centre for Differently Abled (NCSC-DA) had rehabilitated
as many as 10.6 thousand persons during 2018 and 11.5 thousand during 2017.
Tables-15, Tables-16, Tables-17, Tables-18 and Tables-19 mentions the work done
by employment exchanges and NCSC-DA for the differently abled job seekers.
Statement 6: Differently abled job seekers at the end of the year (All-India)
(in thousand)
All Employment Exchanges Special Employment Exchanges
Year 2013 2014 2015 2016 2017 2013 2014 2015 2016 2017
Registration 30.5 28.4 42.1 38.7 32.1 5.65 3.25 4.43 3.78 2.79
Placement 1.9 1.7 2.8 3.1 2.2 0.25 0.06 0.15 0.13 0.07
Live
Register 717.3 698.2 689.0 697.5 700.6 94.66 96.25 93.20 93.15 93.30
The statement 6 shows that:
The number of differently abled job seekers on live register of all employment
exchanges has increased during the year 2017 against previous year. The placement
through employment exchanges has decreased during the said period.
Performance of Employment Exchanges/Special Exchanges in respect of differently
abled job seekers by category of their infirmity is given in Table-16.
The differently abled job seekers having infirmity of orthopedics was found to be
maximum in number on the live register of employment exchanges followed by deaf
& dumbs at the end of the year 2017.

Employment Exchange Statistics-2019
20
Disability wise graphical representation of live register of differently abled job
seekers for the year 2017 is given below.
2.6 MIGRANTS AND REPATRIATES
The employment service continued to render assistance in the resettlement of
migrants and repatriates from Myanmar, Sri Lanka and East Pakistan. Table-20 shows the
performance of employment exchanges in respect of migrant job seekers from East Pakistan,
repatriates from Myanmar and Sri Lanka to India. Table-20 depicted that the live register of
migrant was 0.01% of total job seekers on live register at the end of the year 2017.
2.7 MINORITY COMMUNITIES JOB SEEKERS
The main minority communities in India are Muslims, Christians, Sikhs, Buddhists,
Jain and Zoroastrians. The statement showing the performance of employment exchanges in
respect of Minority Communities is given in Table-21
.
Number of job seekers belonging to all minority communities put together at the end
of 2017 on live register of employment exchanges in India was 58.9 lakh, accounting
for 13.9% of total job seekers on the live register.
66.8
70.3
552.8
9.3 1.5
All Employment Exchanges
Blind
Deaf & Dumb
Orthopaedics
Res. Disorder
NegativeLeprosy
Total live register Differently abled = 700.6 thousand
12.5
15.3
63.4
1.7 0.4
Special Employment Exchanges
Blind
Deaf & Dumb
Orthopaedics
Res. Disorder
NegativeLeprosy
Total live register Differently abled = 93.3 thousand
Figure 9: Disability-wise differently abled job seekers on live register during 2017 (All-India)

Employment Exchange Statistics-2019
21
Out of these, 36 lakh (61.1%) were Muslims, 18.2 lakh (31%) Christians, 2.4 lakh
(4%) Sikhs, 2.2 lakh (3.8%) Buddhists, 10 thousand (0.2%) Jains and Zoroastrians
were around nine hundred.
During the year 2017, around 3 lakh minority job seekers got registered with the
employment exchanges throughout India. The maximum registration was made in
respect of Muslim job seekers (1.2 lakh) followed by Christians (0.96 lakh) and Sikh
job seekers (0.5 lakh) respectively.
The maximum placement was made in respect of Muslim job-seekers (6.6 thousand).
The percentage of placement to submission was maximum for Muslims (13.2%)
followed by Sikhs (7.4%) and Christians (7.2%).
Graphical representation of the live register of minority communities job seekers for
the year 2017 is given below:
3596.6
1822.0
236.6
221.2 0.9
10.0
Muslims
Christians
Sikhs
Buddhists
Zoroastrians
Jain
Figure 10: Live register of of minority communities for the year 2015 (All-India)
Total job seekers of minority communities = 5887.5 thousand

Employment Exchange Statistics-2019
22
2.8 EX-ITI AND FULL TERM APPRENTICES
The performance of employment exchanges in respect of Ex-ITI and Full Term
Apprentices during the period 2007- 2017 is given in Table-22. The job seekers who have
completed ITI courses and got themselves registered with the employment exchange was
around 0.9 lakh at the end of the year 2017. The Ex-ITI job seekers placed through the
employment exchanges were around 8 thousand during the year 2017. The live register of
job-seekers, who have completed full term apprentice has also shown mixed trend over the
period from 2007 to 2017. Number of full term apprentice job seekers has decreased from
1.88 lakh in 2016 to 1.77 lakh in 2017.
2.9 OCCUPATION GROUP-WISE JOB-SEEKERS (NCO 2004)
Number of job seekers on the live register of employment exchanges classified by
broad occupational groups at the end of 2017 is given in Table-23. It may be seen that out
of 424.4 lakh job seekers on live register of employment exchanges in the country at the
end of the year 2017, around 328.4 lakh i.e. the majority of the job seekers (77.4%) were
found to be in the category of workers not classified by any occupation, meaning thereby
that the majority of job seekers were inexperienced, fresher and therefore did not fall under
any category of occupation. Second highest around 27 lakh (6.5%) job seekers were in the
category of Professionals followed by Technician and Associate Professionals 18.5 lakh
(4.4%) and Craft and Related Trades workers were 14.7 lakh (3.5%). The lowest number of
job seekers were belonged to Skilled agricultural and fishery workers. In case of woman
job-seekers which were 155.2 lakh, out of which 123.76 lakh (79.7%) were in the category
of workers not elsewhere classified followed by 7.8% in the category of Professionals and
5% in Technician and Associate Professionals category.
Employment Exchange Statistics-2019
23
DETAILED TABLES

Employment Exchange Statistics-2019
24
TABLE 1
EMPLOYMENT EXCHANGE STATISTICS -ALL INDIA-FOR THE YEAR 2007–2018#
YEA
R
EMP
LOY
MEN
T EX
CH
NA
GES
/UEI
GB
s (in Thousand)
% O
F P
LAC
EMEN
T TO
SUB
MIS
SIO
N
% O
F P
LAC
EMEN
T TO
V
AC
AN
CIE
S N
OTI
FIED
% IN
CR
EASE
IN L
IVE
REG
ISTE
R O
VER
PR
EVIO
US
YEA
R
REG
ISTR
ATI
ON
PLA
CEM
ENT
VA
CA
NC
IES
NO
TIFI
ED
SUB
MIS
SIO
NS
LIV
E R
EGIS
TER
2007 965 5434.2 263.5 525.8 3666.1 39974.0 7.2 50.1 -3.6
2008 968 5315.7 304.9 571.0 3345.6 39114.9 9.1 53.4 -2.1
2009 969 5693.7 261.5 419.5 2589.3 38152.2 10.1 62.3 -2.5
2010 969 6186.0 509.6 706.9 3747.1 38826.9 13.6 72.1 1.8
2011 966 6206.3 471.5 819.7 5142.9 40171.6 9.2 57.5 3.5
2012 956 9722.2 427.6 682.8 2982.2 44790.1 14.3 62.6 11.5
2013 956 5969.4 348.5 510.7 3002.1 46802.5 11.6 68.2 4.5
2014 978 5957.2 338.5 762.0 4220.4 48261.1 8.0 44.4 3.1
2015 978 6939.4 395.0 810.3 4307.6 43502.7 9.2 48.7 -9.9
2016 997 5959.9 405.5 1401.4 3906.4 43376.1 10.4 28.9 -0.3
2017 997 3948.85 424.6 813.2 1851.1 42444.9 22.9 52.2 -2.1
2018 997 3831.8 404.7 1225.3 2584.6 42122.3 15.7 33.0 -0.8
Note :# At the end of the year.

Employment Exchange Statistics-2019
25
TABLE 2
EMPLOYMENT EXCHANGE STATISTICS STATE-WISE FOR THE YEAR 2018#
(IN THOUSAND)
SL. N
.
STA
TE/U
T
EMP
LOY
MEN
T EX
CH
NA
GES
/
UEI
GB
S
REG
ISTR
ATI
ON
VA
CA
NC
IES
NO
TIFI
ED
SUB
MIS
SIO
NS
PLA
CEM
ENT
LIV
E R
EGIS
TER
% O
F LI
VE
REG
ISTE
R T
O
TOTA
L LI
VE
REG
ISTE
R
% O
F PL
AC
EMEN
T
TO S
UB
MIS
SIO
N
1 ANDHRA PRADESH 17 167.9 1.7 89.6 0.2 966.6 2.3 0.3
2 ARUNACHAL PRADESH 12 8.9 0.0 0.1 0.0 110.6 0.3 0.0
3 ASSAM 52 239.7 1.1 48.6 1.0 1885.9 4.5 2.1
4 BIHAR 47 5.5 0.0 0.0 0.0 794.3 1.9 0.0
5 CHHATTISGARH 26 283.3 9.8 8.6 1.0 2279.2 5.4 11.7
6 DELHI 14 0.0 0.0 0.0 0.0 1262.6 3.0 0.0
7 GOA 1 0.0 0.0 0.0 0.0 118.7 0.3 0.0
8 GUJARAT 48 473.5 562.3 1765.9 342.4 464.9 1.1 19.4 9 HARYANA 59 183.1 16.5 19.7 0.2 689.0 1.6 0.9
10 HIMACHAL PRADESH 15 130.4 33.3 50.4 2.5 848.0 2.0 5.0
11 JAMMU AND KASHMIR 17 5.4 0.0 0.0 0.3 232.3 0.6 0.0
12 JHARKHAND 42 36.8 3.1 9.3 1.4 426.5 1.0 15.4
13 KARNATAKA 40 48.2 4.2 11.6 0.8 347.7 0.8 7.0
14 KERALA 89 433.2 15.3 219.1 9.6 3513.3 8.3 4.4
15 MADHYA PRADESH 49 327.5 0.0 0.1 0.0 1989.5 4.7 0.0
16 MAHARASHTRA 47 408.3 149.7 50.5 41.6 4000.5 9.5 82.3
17 MANIPUR 11 25.8 0.8 14.4 0.2 337.0 0.8 1.4
18 MEGHALAYA 12 3.5 0.2 0.9 0.1 33.6 0.1 12.7
19 MIZORAM 3 3.8 0.4 4.5 0.0 37.1 0.1 0.0
20 NAGALAND 8 23.6 0.0 36.8 0.0 74.9 0.2 0.0
21 ODISHA 40 60.7 0.1 0.8 0.5 977.2 2.3 54.8
22 PUNJAB 47 108.6 5.7 40.8 1.0 319.4 0.8 2.6
23 RAJASTHAN 38 127.4 1.0 3.9 0.0 667.2 1.6 0.0
24 TAMIL NADU 35 271.8 2.4 9.6 1.2 7365.8 17.5 12.0
25 TELANGANA 14 3.1 0.0 0.0 0.0 961.5 2.3 0.0
26 TRIPURA 5 8.2 0.0 0.1 0.1 295.9 0.7 132.0 27 UTTARAKHAND 24 106.4 248.8 27.5 0.0 850.5 2.0 0.1
28 UTTAR PRADESH 100 324.0 168.5 160.3 0.4 2208.5 5.2 0.2
29 WEST BENGAL 77 0.0 0.0 0.0 0.0 7760.7 18.4 0.0
30 A. & N. ISLANDS 1 0.0 0.0 0.0 0.0 42.7 0.1 0.0
31 CHANDIGARH 2 1.2 0.3 2.7 0.1 17.1 0.0 3.6
32 D. & N. HAVELI 1 0.0 0.0 0.0 0.0 9.4 0.0 0.0
33 DAMAN AND DIU 2 0.0 0.0 0.0 0.0 10.5 0.0 0.0
34 LAKSHADWEEP 1 0.0 0.0 0.0 0.0 19.0 0.0 0.0
35 PUDUCHERRY 1 12.0 0.3 8.9 0.0 204.8 0.5 0.1
TOTAL 997 3831.8 1225.3 2584.5 404.7 42122.3 100.0 15.7 NOTE :- # AT THE END OF THE YEAR
TOTAL MAY NOT TALLY DUE TO ROUNDING OFF

Employment Exchange Statistics-2019
26
TABLE 3
NUMBER OF JOB-SEEKERS ON THE LIVE REGISTER OF EMPLOYMENT EXCHANGES IN THE COUNTRY CLASSIFIED BY AGE-GROUP FOR THE YEAR 2010-2017#
YEAR
AGE GROUPS (IN YEARS) ( IN THOUSAND)
TOTAL 15-19 20-29 30-39 40-49 50-59 60+
2010 8141.3 18174.0 9453.2 2540.3 411.1 107.0 38826.9
21.0 46.8 24.3 6.5 1.1 0.3 100.0
2011 8402.2 18487.3 9889.3 2848.1 477.9 66.9 40171.6
20.9 46.0 24.6 7.1 1.2 0.2 100.0
2012 8262.5 20378.7 12261.4 3301.8 528.0 57.6 44790.1
18.4 45.5 27.4 7.4 1.2 0.1 100.0
2013 8514.2 21738.4 12137.7 3642.8 651.3 118.1 46802.5
18.2 46.4 25.9 7.8 1.4 0.3 100.0
2014 8438.9 22536.2 12716.8 3864.6 600.5 104.1 48261.0
17.5 46.7 26.4 8.0 1.2 0.2 100.0
2015 7497.2 20435.4 11241.6 3602.7 580.8 145.0 43502.7
17.2 47.0 25.8 8.3 1.3 0.3 100.0
2016 7588.5 20252.9 11245.6 3502.2 660.6 126.4 43376.1
17.5 46.7 25.9 8.1 1.5 0.3 100.0
2017 7545.6 19523.2 11056.0 3565.2 619.8 135.2 42444.9
17.8 46.0 26.0 8.4 1.5 0.3 100.0
NOTE: #At the end of the year.
Percentage to the total are in shaded in second line. Total may not tally due to rounding off

Employment Exchange Statistics-2019
27
TABLE 4
TOTAL NUMBER OF JOB SEEKERS ON THE LIVE REGISTER OF EMPLOYMENT EXCHANGES INTHE COUNTRY CLASSIFIED BY AGE-GROUP (STATE-WISE) FOR THE YEAR 2017#
(IN THOUSAND)
AGE GROUP (IN YEARS)
Sl. N. STATE/UT 15-19 20-29 30-39 40-49 50-59 60+ TOTAL
1 ANDHRA PRADESH 143.8 449.1 238.6 79.4 11.2 1.2 923.3
2 ARUNACHAL PRADESH 21.8 67.7 9.8 2.0 0.8 0.6 102.7
3 ASSAM 477.6 869.4 424.6 117.3 16.7 1.0 1906.5
4 BIHAR 153.2 421.7 177.0 31.7 5.6 1.1 790.2
5 CHHATTISGARH 360.7 1235.5 629.1 80.5 5.1 0.1 2311.0
6 DELHI 313.8 539.5 350.0 53.1 6.2 0.0 1262.6
7 GOA 5.1 66.2 39.0 8.2 0.2 0.0 118.7
8 GUJARAT 67.9 336.4 113.5 12.9 0.8 0.1 531.6
9 HARYANA 96.7 324.6 168.0 31.2 3.3 0.4 624.3
10 HIMACHAL PRADESH 205.2 367.7 195.5 48.2 18.3 0.4 835.3
11 JAMMU & KASHMIR 5.6 100.6 68.7 38.9 10.7 8.3 232.8
12 JHARKHAND 113.0 228.0 113.9 22.4 1.8 0.1 479.1
13 KARNATAKA 67.9 160.5 90.0 18.0 2.2 0.3 338.9
14 KERALA 1094.9 1268.8 715.8 320.5 92.3 7.8 3500.1
15 MADHYA PRADESH 439.4 999.9 424.3 81.2 10.2 0.8 1955.9
16 MAHARASHTRA 189.6 2236.8 1028.0 222.8 30.7 6.8 3714.8
17 MANIPUR 68.8 133.7 95.5 72.2 2.8 0.0 373.0
18 MEGHALAYA 15.2 18.8 5.0 1.7 0.0 0.0 40.7
19 MIZORAM 9.5 18.5 7.5 0.8 0.0 0.0 36.3
20 NAGALAND 12.7 38.4 15.6 2.0 0.0 0.0 68.8
21 ODISHA 191.9 544.6 235.7 31.3 2.4 2.0 1007.8
22 PUNJAB 63.8 145.9 77.2 24.6 2.4 0.1 313.9
23 RAJASTHAN 104.0 302.4 139.1 20.6 0.6 0.0 566.7
24 TAMIL NADU 1787.2 2454.9 1746.3 1083.3 310.4 87.7 7469.8
25 TELANGANA 99.9 436.1 310.7 96.7 12.2 1.3 956.8
26 TRIPURA 64.3 132.4 69.1 19.3 3.8 0.2 289.2
27 UTTARAKHAND 160.8 489.5 214.1 43.7 1.5 0.0 909.8
28 UTTAR PRADESH 248.1 1293.5 980.0 179.0 10.4 0.3 2711.3
29 WEST BENGAL 880.6 3706.3 2300.7 804.5 54.4 14.1 7760.7
30 A. & N. ISLANDS 10.6 19.7 10.6 1.7 0.0 0.0 42.7
31 CHANDIGARH 6.1 7.7 4.4 0.7 0.1 0.0 19.0
32 D. & N. HAVELI 0.1 7.2 1.8 0.2 0.0 0.0 9.4
33 DAMAN AND DIU 2.0 3.6 2.6 1.2 0.8 0.3 10.5
34 LAKSHADWEEP 1.1 10.5 4.9 1.9 0.5 0.0 19.0
35 PUDUCHERRY 62.7 86.9 49.3 11.4 1.4 0.2 212.0
TOTAL 7545.6 19523.2 11056.0 3565.2 619.8 135.2 42444.9 NOTE :- # AT THE END OF THE YEAR
TOTAL MAY NOT TALLY DUE TO ROUNDING OFF
Employment Exchange Statistics-2019
28
TABLE 5
EMPLOYEMENT EXCHANGE STATISTICS - EDUCATED (10TH STANDARD & ABOVE) ALL INDIA FOR THE YEAR 2007-17 #
(IN THOUSAND)
YEA
R
REG
ISTR
ATI
ON
PLA
CEM
ENT
EDU
CA
TED
LIV
E
REG
ISTE
R
TOTA
L L
IVE
REG
ISTE
R
% O
F
PLA
CEM
ENT
TO
RES
ITR
ATI
ON
% IN
CR
EASE
IN
LIV
E R
EGIS
TER
OV
ER P
REV
IOU
S Y
EAR
% O
F ED
UC
AT
ED
LIV
E R
EGIS
TER
TO T
OTA
L LI
VE
REG
ISTE
R
2007 4275.9 195.4 30649.6 39974.0 4.6 -0.1 76.7
2008 4324.8 208.3 29253.8 39114.9 4.8 -4.6 74.8
2009 4211.5 156.3 29174.8 38152.2 3.7 -0.3 76.5
2010 4936.2 385.0 31627.3 38826.9 7.8 8.4 81.5
2011 5292.9 333.7 32105.3 40171.6 6.3 1.5 79.9
2012 8743.7 281.4 37497.4 44790.1 3.2 16.8 83.7
2013 5010.1 227.8 40014.5 46802.5 4.5 6.7 85.5
2014 4996.9 226.2 40403.7 48261.1 4.5 1.0 83.7
2015 4166.7 252.2 37908.9 43502.7 6.1 -6.2 87.1
2016 2971.8 293.0 37113.8 43376.1 9.9 -2.1 85.6
2017 1627.5 374.8 34498.8 42444.9 23.0 -7.0 81.3
Note: # At the end of the year.

Employment Exchange Statistics-2019
29
TABLE 6
NUMBER OF EDUCATED JOB SEEKERS (10TH STANDARD & ABOVE) BY EDUCATION LEVEL ALL INDIA FOR THE YEAR 2017#
SL. NO. EDUCATIONAL LEVEL
NUMBER ON LIVE REGISTER (IN THOUSAND)
MEN WOMEN TOTAL % OF EACH
LEVEL TO TOTAL
1 10TH CLASS PASSED 8827.7 5171.5 13999.3 40.6
2 10TH + 2 PASSED 6627.0 4213.5 10840.5 31.4
3 GRADUATES 3665.8 2489.2 6155.0 17.8
4 POST-GRADUATES 710.3 822.9 1533.1 4.4
5 DIPLOMA HOLDERS & OTHERS
1278.9 692.0 1970.8 5.7
GRAND TOTAL 21109.7 13389.1 34498.8 100.0
NOTE:- # At the end of the year. Total may not tally due to rounding off.

Employment Exchange Statistics-2019
30
TABLE 7
EMPLOYEMENT EXCHANGE STATISTICS ON WOMEN JOB SEEKERS ALL INDIA FOR THE YEAR 2007-18 #
(IN THOUSAND)
YEA
R
REG
ISTR
ATI
ON
PLA
CEM
ENT
LIV
E R
EGIS
TER
W
OM
EN
TO
TAL
LIV
E R
EGIS
TER
% O
F P
LAC
EMEN
T TO
R
ESIT
RA
TIO
N
% IN
CR
EASE
IN
LIV
E R
EGIS
TER
W
OM
EN O
VER
P
REV
IOU
S YE
AR
% O
F L
IVE
REG
ISTE
R O
F
WO
MEN
TO
TO
TAL
LIV
E R
EGIS
TER
2007 1835.5 46.5 12001.5 39974.0 2.5 1.9 30.0
2008 1756.1 51.9 12328.2 39114.9 3.0 2.7 31.5
2009 1989.9 53.4 12404.7 38152.2 2.7 0.6 32.5
2010 2005.2 107.1 12927.6 38829.0 5.3 4.2 33.3
2011 2122.6 85.7 13694.8 40171.6 4.0 5.9 34.1
2012 3511.0 67.8 15645.8 44790.1 1.9 14.2 34.9
2013 2233.2 58.8 16549.1 46802.5 2.6 5.8 35.4
2014 2189.4 60.8 17078.3 48261.1 2.8 3.2 35.4
2015 2532.7 59.9 15540.0 43502.7 2.4 -9.0 35.7
2016 2256.8 59.7 15731.4 43376.1 2.6 1.2 36.3
2017 1548.5 85.1 15519.4 42444.9 5.5 -1.3 36.6
2018 1437.0 58.2 15611.0 42122.3 4.1 0.6 37.1
NOTE:- # At the end of the year.

Employment Exchange Statistics-2019
31
TABLE 8
EMPLOYEMENT EXCHANGE STATISTICS ON WOMEN JOB SEEKERS STATE-WISE FOR THE YEAR 2018 #
(IN THOUSAND)
SL. N
.
STA
TE/U
T
EMP
LOY
MEN
T EX
CH
NA
GES
/ U
EIG
Bs
REG
ISTR
ATI
ON
PLA
CEM
ENT
LIV
E R
EGIS
TER
% O
F P
LAC
EMEN
T TO
R
EGIS
TRA
TIO
N
1 ANDHRA PRADESH 17 66.5 0.1 289.6 0.1
2 ARUNACHAL PRADESH 12 4.6 0.0 48.9 0.0
3 ASSAM 52 95.2 0.1 600.4 0.1
4 BIHAR 47 1.1 0.0 120.7 0.0
5 CHHATTISGARH 26 101.2 0.1 792.6 0.1
6 DELHI 14 0.0 0.0 371.3 0.0 7 GOA 1 0.0 0.0 45.0 0.0
8 GUJARAT 48 75.6 43.4 123.6 57.4
9 HARYANA 59 83.9 0.0 256.3 0.0
10 HIMACHAL PRADESH 15 61.9 0.6 361.7 1.0
11 JAMMU AND KASHMIR 17 1.0 0.1 71.8 7.0
12 JHARKHAND 42 4.2 0.0 61.5 1.2
13 KARNATAKA 40 18.8 0.2 100.7 1.1
14 KERALA 89 260.2 4.5 2244.0 1.7
15 MADHYA PRADESH 49 116.5 0.0 516.8 0.0
16 MAHARASHTRA 47 176.7 8.1 1068.6 4.6
17 MANIPUR 11 7.9 0.0 108.4 0.4
18 MEGHALAYA 12 2.1 0.0 18.4 0.4
19 MIZORAM 3 1.6 0.0 16.1 0.0
20 NAGALAND 8 8.5 0.0 23.2 0.0
21 ODISHA 40 19.0 0.1 287.8 0.4
22 PUNJAB 47 35.8 0.2 99.4 0.5
23 RAJASTHAN 38 37.7 0.0 163.2 0.0
24 TAMIL NADU 35 146.0 0.7 3868.3 0.5 25 TELANGANA 14 1.0 0.0 273.6 0.0
26 TRIPURA 5 3.7 0.0 103.8 1.2
27 UTTARAKHAND 24 43.0 0.0 330.5 0.0
28 UTTAR PRADESH 100 56.3 0.0 642.0 0.0
29 WEST BENGAL 77 0.0 0.0 2461.5 0.0
30 A. & N. ISLANDS 1 0.0 0.0 19.3 0.0
31 CHANDIGARH 2 0.5 0.0 5.4 9.1
32 D. & N. HAVELI 1 0.0 0.0 3.7 0.0
33 DAMAN AND DIU 2 0.0 0.0 2.7 0.0
34 LAKSHADWEEP 1 0.0 0.0 7.2 0.0
35 PUDUCHERRY 1 6.5 0.0 102.7 0.1
TOTAL 997 1437.0 58.2 15611.0 4.1
NOTE :- # AT THE END OF THE YEAR TOTAL MAY NOT TALLY DUE TO ROUNDING OFF

Employment Exchange Statistics-2019
32
TABLE 9
EMPLOYEMENT EXCHANGE STATISTICS ON EDUCATED WOMEN JOB SEEKERS (ALL INDIA) FOR THE YEAR 2007-2017 #
(IN THOUSAND)
YEAR
EDUCATED WOMEN
TO
TAL
LIV
E R
EGIS
TER
W
OM
EN
% O
F P
LAC
EMEN
T TO
REG
ISTR
ATI
ON
%
INC
REA
SE IN
LIV
E R
EGIS
TER
WO
MEN
OV
ER P
REV
IOU
S Y
EAR
% O
F ED
UC
AT
ED
WO
MEN
TO
TO
TAL
LIV
E R
EGIS
TER
REG
ISTR
ATI
ON
PLA
CEM
ENT
LIV
E R
EGIS
TER
2007 1478.9 38.7 9553.7 12001.5 2.6 7.3 79.6
2008 1436.0 40.9 9557.5 12328.2 2.8 0.0 77.5
2009 1453.5 30.4 9689.0 12404.7 2.1 1.4 78.1
2010 1685.3 76.8 10015.6 12927.6 4.6 3.4 77.5
2011 1804.7 59.8 11676.5 13694.8 3.3 16.6 85.3
2012 2769.5 37.8 12391.8 15645.8 1.4 6.1 79.2
2013 1322.0 39.6 14841.3 16549.1 3.0 19.8 89.7
2014 1925.3 40.2 14722.4 17078.3 2.1 -0.8 86.2
2015 1364.7 38.5 13775.2 15540.0 2.8 -6.4 88.6
2016 1082.9 43.6 13595.7 15731.4 4.0 -1.3 86.4
2017 549.9 72.4 13389.1 15519.4 13.2 -1.5 86.3
Note: # At the end of the year.

Employment Exchange Statistics-2019
33
TABLE 10
EMPLOYMENT EXCHANGE STATISTICS ON SCHEDULED CASTE JOB SEEKERS (ALL INDIA) FOR THE YEAR 2007-2017 #
(IN THOUSAND)
YEA
R
REG
ISTR
ATI
ON
PLA
CEM
ENT
LIV
E R
EGIS
TER
TOTA
L LI
VE
REG
ISTE
R
% O
F P
LAC
EMEN
T
TO R
EGIS
TRA
TIO
N
% IN
CR
EASE
IN L
IVE
REG
ISTE
R O
F
SCH
EDU
LED
CA
STE
OV
ER P
REV
IOU
S
YEA
R
% O
F LI
VE
REG
ISTE
R O
F
SCH
EDU
LED
CA
STE
TO T
OTA
L L
IVE
REG
ISTE
R
2007 668.6 21.5 6320.9 39974.0 3.2 -2.0 15.8
2008 659.0 26.5 6384.1 39114.9 4.0 1.0 16.3
2009 648.4 19.3 6287.7 38152.2 3.0 -1.5 16.5
2010 684.2 32.3 6404.9 38826.9 4.7 1.9 16.5
2011 882.1 29.6 6682.2 40171.6 3.4 4.3 16.6
2012 1275.1 30.9 7166.3 44790.1 2.4 7.2 16.0
2013 1025.2 31.8 7291.9 46802.5 3.1 1.8 15.6
2014 766.1 22.3 7644.2 48261.1 2.9 4.8 15.8
2015 799.6 26.7 7048.1 43502.7 3.3 -7.8 16.2
2016 615.5 29.2 7135.3 43376.1 4.7 1.2 16.4
2017 437.0 31.3 7105.8 42444.9 7.2 -0.4 16.7
Note: # At the end of the year.

Employment Exchange Statistics-2019
34
TABLE 11
EMPLOYMENT EXCHANGE STATISTICS ON EDUCATED SCHEDULED CASTE JOB SEEKERS (10TH STANDARD & ABOVE) – ALL INDIA-FOR THE YEAR 2007-2017 #
(IN THOUSAND)
YEA
R
REG
ISTR
ATI
ON
PLA
CEM
ENT
LIV
E R
EGIS
TER
TOTA
L LI
VE
REG
ISTE
R F
OR
SCH
EDU
LED
CA
STE
% O
F
PLA
CEM
ENT
TO
REG
ISTR
ATI
ON
% O
F ED
UC
ATE
D
SCH
EDU
LED
C
AST
E TO
TO
TAL
LIV
E R
EGIS
TER
2007 524.0 18.2 4646.0 6320.9 3.5 73.5
2008 508.7 17.1 4740.7 6384.1 3.4 74.3
2009 514.9 12.3 4608.2 6287.7 2.4 73.3
2010 620.2 30.8 5036.2 6404.9 5.0 78.6
2011 834.3 22.5 5450.0 6682.2 2.7 81.6
2012 1010.7 21.8 5917.1 7166.3 2.2 82.6
2013 594.0 20.6 6600.6 7291.9 3.5 90.5
2014 731.8 15.6 6692.9 7644.2 2.1 87.6
2015 516.4 16.9 6220.0 7048.1 3.3 88.2
2016 361.7 20.4 6066.6 7134.8 5.6 85.0
2017 189.1 28.0 3681.1 7105.8 14.8 51.8
Note: # At the end of the year.
Employment Exchange Statistics-2019
35
TABLE 12
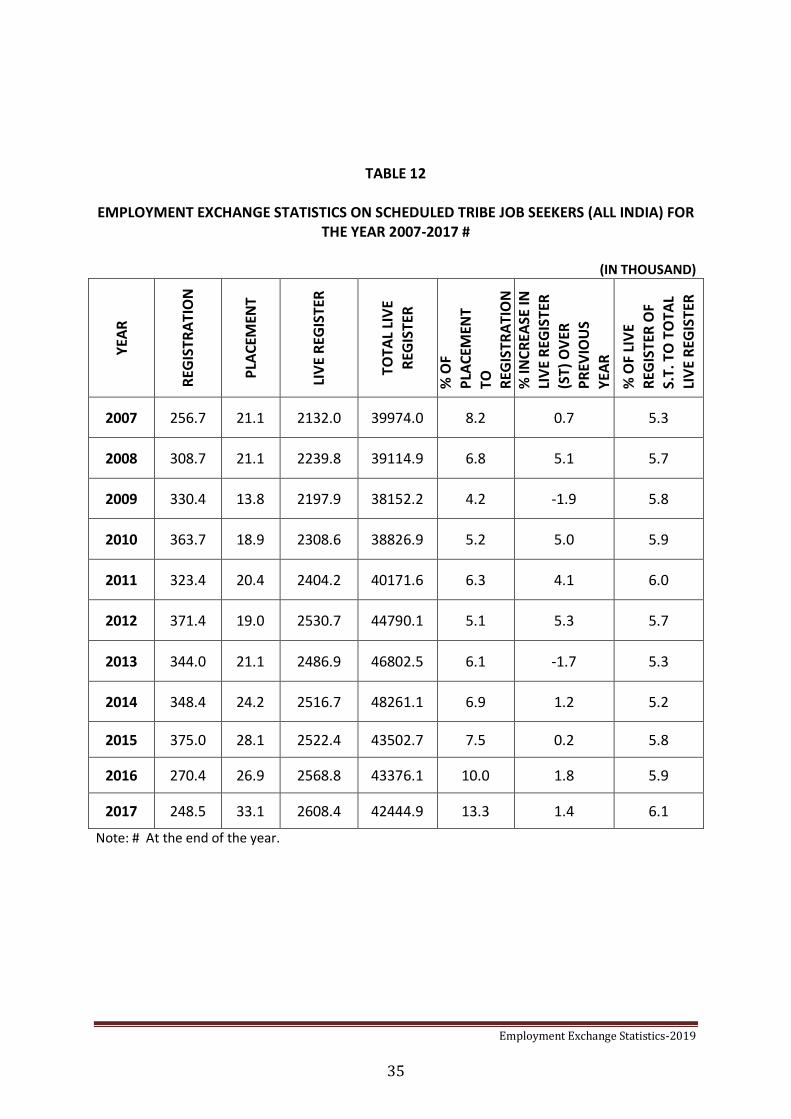
EMPLOYMENT EXCHANGE STATISTICS ON SCHEDULED TRIBE JOB SEEKERS (ALL INDIA) FOR THE YEAR 2007-2017 #
(IN THOUSAND)
YEA
R
REG
ISTR
ATI
ON
PLA
CEM
ENT
LIV
E R
EGIS
TER
TOTA
L LI
VE
REG
ISTE
R
% O
F
PLA
CEM
ENT
TO
REG
ISTR
ATI
ON
%
INC
REA
SE IN
LI
VE
REG
ISTE
R
(ST)
OV
ER
PR
EVIO
US
YEA
R
% O
F LI
VE
REG
ISTE
R O
F S.
T. T
O T
OTA
L
LIV
E R
EGIS
TER
2007 256.7 21.1 2132.0 39974.0 8.2 0.7 5.3
2008 308.7 21.1 2239.8 39114.9 6.8 5.1 5.7
2009 330.4 13.8 2197.9 38152.2 4.2 -1.9 5.8
2010 363.7 18.9 2308.6 38826.9 5.2 5.0 5.9
2011 323.4 20.4 2404.2 40171.6 6.3 4.1 6.0
2012 371.4 19.0 2530.7 44790.1 5.1 5.3 5.7
2013 344.0 21.1 2486.9 46802.5 6.1 -1.7 5.3
2014 348.4 24.2 2516.7 48261.1 6.9 1.2 5.2
2015 375.0 28.1 2522.4 43502.7 7.5 0.2 5.8
2016 270.4 26.9 2568.8 43376.1 10.0 1.8 5.9
2017 248.5 33.1 2608.4 42444.9 13.3 1.4 6.1
Note: # At the end of the year.

Employment Exchange Statistics-2019
36
TABLE 13
EMPLOYMENT EXCHANGE STATISTICS ON EDUCATED SCHEDULED TRIBE JOB SEEKERS (10TH STANDARD AND ABOVE) - ALL INDIA - FOR THE YEAR 2007-2017 #
(IN THOUSAND)
YEA
R
REG
ISTR
ATI
ON
PLA
CEM
ENT
LIV
E R
EGIS
TER
TOTA
L LI
VE
REG
ISTE
R F
OR
S.T.
% O
F P
LAC
EMEN
T
TO
REG
ISTR
ATI
ON
% O
F ED
UC
ATE
D S
.T.
TO T
OTA
L LI
VE
REG
ISTE
R
2007 201.3 18.5 1481.2 2132.0 9.2 69.5
2008 233.6 13.1 1576.7 2239.8 5.6 70.4
2009 240.1 7.9 1655.5 2197.9 3.3 75.3
2010 294.6 16.6 1795.2 2308.6 5.6 77.8
2011 274.8 14.4 1824.7 2399.2 5.2 76.1
2012 288.3 12.2 1939.9 2530.7 4.2 76.7
2013 264.1 15.6 1980.2 2486.9 5.9 79.6
2014 266.5 16.7 2083.6 2516.7 6.3 82.8
2015 279.5 18.4 2110.1 2522.4 6.6 83.7
2016 171.4 23.1 2092.2 2567.9 13.5 81.5
2017 75.0 24.3 2129.4 2608.4 32.4 81.6
Note: # At the end of the year.

Employment Exchange Statistics-2019
37
TABLE 13-A
EMPLOYMENT EXCHANGE STATISTICS ON SCHEDULED CASTE, SCHEDULED TRIBE AND OTHER BACKWARD CLASSES JOB SEEKERS (STATE-WISE) FOR THE YEAR 2017#
(IN THOUSAND)
Sl. No.
State/UT SCHEDULED CASTE (SC) SCHEDULED TRIBE (ST)
Registration Placement Live Register
Registration Placement Live Register
1 ANDHRA PRADESH 29.03 0.03 257.80 10.11 0.01 46.50
2 ARUNACHAL PRADESH 0.03 0.00 1.39 2.60 0.00 31.66
3 ASSAM 17.61 0.00 133.73 22.60 0.05 286.20
4 BIHAR 0.23 0.00 109.59 0.11 0.00 8.47
5 CHHATTISGARH 29.48 0.06 185.93 49.23 0.04 393.47
6 DELHI 0.00 0.00 90.11 0.00 0.00 19.94
7 GOA 0.00 0.00 3.38 0.00 0.00 5.443
8 GUJARAT 50.60 29.08 101.38 49.96 30.92 79.71
9 HARYANA 9.11 0.01 175.80 0.02 0.00 0.04
10 HIMACHAL PRADESH 28.76 0.22 201.90 2.66 0.06 45.52
11 JAMMU & KASHMIR 0.00 0.00 6.22 0.00 0.00 4.93
12 JHARKHAND 3.67 0.49 64.76 7.91 1.60 85.06
13 KARNATAKA 2.89 0.02 101.77 0.37 0.01 23.36
14 KERALA 19.42 0.82 616.54 2.81 0.10 45.98 15 MADHYA PRADESH 39.98 0.00 306.95 46.31 0.00 254.65
16 MAHARASHTRA 2.52 0.05 544.75 1.33 0.15 132.83
17 MANIPUR 0.36 0.00 8.91 1.05 0.04 226.60
18 MEGHALAYA 0.01 0.00 0.08 5.57 0.01 34.83
19 MIZORAM 0.00 0.00 0.00 6.03 0.03 37.95
20 NAGALAND 0.01 0.00 0.21 9.28 0.00 66.18
21 ODISHA 8.15 0.03 192.37 11.29 0.04 157.49
22 PUNJAB 26.14 0.06 107.26 0.00 0.00 0.00
23 RAJASTHAN 19.76 0.01 123.47 8.61 0.02 74.76
24 TAMIL NADU 65.24 0.13 1816.17 3.47 0.00 66.46
25 TELANGANA 7.80 0.03 266.61 2.25 0.00 104.44
26 TRIPURA 1.02 0.01 100.85 1.79 0.01 131.66
27 UTTARAKHAND 17.63 0.01 138.01 1.98 0.00 32.55
28 UTTAR PRADESH 54.22 0.03 493.52 1.17 0.00 5.45
29 WEST BENGAL 0.00 0.00 920.49 0.00 0.00 193.10
30 A. & N. ISLANDS 0.00 0.00 0.00 0.00 0.00 1.62
31 CHANDIGARH 0.82 0.02 6.07 0.01 0.00 0.10
32 D. & N. HAVELI 0.00 0.00 0.41 0.00 0.00 3.74 33 DAMAN AND DIU 0.00 0.00 0.56 0.00 0.00 0.24
34 LAKSHADWEEP 0.00 0.00 0.00 0.00 0.00 7.32
35 PUDUCHERRY 2.59 0.15 28.78 0.03 0.00 0.16
Grand Total 437.04 31.26 7105.78 248.52 33.10 2608.41
Continued on next page Note: # At the end of the year.
Figures may not tally due to rounding off.

Employment Exchange Statistics-2019
38
TABLE 13-A
EMPLOYMENT EXCHANGE STATISTICS ON SCHEDULED CASTE, SCHEDULED TRIBE AND OTHER BACKWARD CLASSES JOB SEEKERS (STATE-WISE) FOR THE YEAR 2017#
(IN THOUSAND)
Sl. No.
State/UT
OTHER BACKWARD CLASSES (OBC)
% o
f SC
Pla
cem
en
t to
SC
R
egi
stra
tio
n
% o
f ST
P
lace
me
nt
to
ST
Re
gist
rati
on
% o
f O
BC
P
lace
me
nt
to
OB
C
Re
gist
rati
on
Registration Placement Live Register
1 ANDHRA PRADESH 55.58 0.04 415.78 0.1 0.1 0.1
2 ARUNACHAL PRADESH 0.04 0.00 1.08 0.0 0.0 0.0
3 ASSAM 35.77 0.05 332.97 0.0 0.2 0.1
4 BIHAR 0.68 0.00 247.18 0.0 0.0 0.0 5 CHHATTISGARH 81.06 0.15 488.04 0.2 0.1 0.2
6 DELHI 0.00 0.00 27.32 0.0 0.0 0.0
7 GOA 0.00 0.00 11.26 0.0 0.0 0.0
8 GUJARAT 0.92 0.13 6.32 57.5 61.9 14.0
9 HARYANA 3.51 0.00 48.85 0.1 0.0 0.0
10 HIMACHAL PRADESH 17.59 0.28 97.51 0.8 2.4 1.6
11 JAMMU & KASHMIR 0.00 0.00 1.19 0.0 0.0 0.0
12 JHARKHAND 12.64 1.08 159.79 13.5 20.2 8.6
13 KARNATAKA 0.59 0.01 15.08 0.8 1.9 1.7
14 KERALA 77.58 2.09 1525.36 4.2 3.4 2.7
15 MADHYA PRADESH 97.84 0.00 537.48 0.0 0.0 0.0
16 MAHARASHTRA 4.60 0.16 921.34 2.0 11.2 3.4
17 MANIPUR 0.54 0.01 18.09 0.8 3.7 1.7
18 MEGHALAYA 0.00 0.00 0.02 0.0 0.2 0.0
19 MIZORAM 0.00 0.00 0.00 0.0 0.5 0.0
20 NAGALAND 0.00 0.00 0.00 0.0 0.0 0.0
21 ODISHA 10.81 0.09 125.51 0.4 0.3 0.8
22 PUNJAB 5.55 0.03 11.40 0.2 0.0 0.5
23 RAJASTHAN 41.73 0.06 224.95 0.0 0.3 0.1 24 TAMIL NADU 210.67 0.49 4976.79 0.2 0.1 0.2
25 TELANGANA 12.40 0.03 317.19 0.4 0.1 0.3
26 TRIPURA 0.88 0.01 46.61 0.9 0.8 0.7
27 UTTARAKHAND 13.20 0.01 90.95 0.1 0.1 0.1
28 UTTAR PRADESH 101.69 0.04 787.00 0.0 0.0 0.0
29 WEST BENGAL 0.00 0.00 283.88 0.0 0.0 0.0
30 A. & N. ISLANDS 0.00 0.00 8.56 0.0 0.0 0.0
31 CHANDIGARH 0.31 0.01 2.02 2.1 0.0 3.5
32 D. & N. HAVELI 0.00 0.00 0.22 0.0 0.0 0.0
33 DAMAN AND DIU 0.00 0.00 1.28 0.0 0.0 0.0
34 LAKSHADWEEP 0.00 0.00 0.00 0.0 0.0 0.0
35 PUDUCHERRY 12.41 0.29 90.34 5.9 0.0 2.4
Grand Total 798.60 5.04 11821.35 7.2 13.3 0.6
Note: # At the end of the year. FIGURES MAY NOT TALLY DUE TO ROUNDING OFF.

Employment Exchange Statistics-2019
39
TABLE 14
RESERVED VACANCIES NOTIFIED AND FILLED BY THE EMPLOYMENT EXCHANGES - ALL INDIA - FOR THE YEAR 2007-2017 #
(IN THOUSAND)
YEAR
SCHEDULED CASTE SCHEDULED TRIBE OTHER BACKWARD CLASSES
VA
CA
NC
IES
NO
TIFI
ED
VA
CA
NC
IES
FILL
ED
% O
F V
AC
AN
CIE
S FI
LLED
TO
NO
TIFI
ED
VA
CA
NC
IES
NO
TIFI
ED
VA
CA
NC
IES
FILL
ED
% O
F V
AC
AN
CIE
S FI
LLED
TO
N
OTI
FIED
VA
CA
NC
IES
NO
TIFI
ED
VA
CA
NC
IES
FILL
ED
% O
F V
AC
AN
CIE
S
FILL
ED T
O
NO
TIFI
ED
2007 18.23 7.29 40.00 17.41 7.73 44.40 26.70 6.94 25.99
2008 18.40 9.10 49.46 16.00 6.70 41.88 23.60 9.60 40.68
2009 15.00 5.70 38.00 14.50 4.60 31.72 24.30 6.80 27.98
2010 18.70 11.20 59.89 19.70 11.40 57.87 21.60 6.30 29.17
2011 18.60 10.70 57.53 21.70 11.50 53.00 31.60 10.80 34.18
2012 18.83 10.78 57.23 16.83 10.26 60.96 41.75 15.68 37.54
2013 20.44 10.02 49.03 16.63 10.52 63.28 32.87 12.93 39.35
2014 14.67 8.44 57.53 15.92 8.95 56.22 25.17 5.91 23.48
2015 25.66 7.41 28.87 13.47 5.40 40.09 10.25 5.32 51.90
2016 23.46 14.53 61.94 13.34 10.66 79.93 12.60 7.82 62.10
2017 19.04 15.15 79.56 21.63 11.32 52.31 14.26 3.79 26.57
Note: # At the end of the year

Employment Exchange Statistics-2019
40
TABLE 15
STATISTICS ON DIFFERENTLY ABLED JOB SEEKERS (ALL INDIA) FOR THE YEAR 2011-2017 #
(IN THOUSAND)
YEAR REGISTRATION PLACEMENT LIVE
REGISTER
% OF PLACEMENT TO REGISTRATION
% OF PLACEMENT TO
LIVE REGISTER
(A) SPECIAL EMPLOYMENT EXCHANGES
2013 5.7 0.2 94.7 3.5 0.2
2014 3.3 0.6 96.3 18.2 0.6
2015 4.4 0.2 93.2 4.5 0.2
2016 3.8 0.1 93.3 2.6 0.1
2017 2.8 0.1 93.2 2.5 0.1
(B) ALL EXCHANGES (EXCLUDING SPECIAL EMPLOYMENT EXCHANGE)
2013 24.8 1.6 622.6 6.5 0.3
2014 25.1 1.1 601.9 4.4 0.2
2015 37.7 2.6 595.8 6.9 0.4
2016 34.9 3.0 604.0 8.6 0.5
2017 29.3 2.13 607.4 7.3 0.4
(C) ALL INDIA INFORMATION FOR DIFFERENTLY ABLED JOB SEEKERS REGISTERED WITH EMPLOYMENT EXCHANGES (A + B)
2013 30.5 1.9 717.3 6.2 0.3
2014 28.4 1.7 698.2 6.0 0.2
2015 42.1 2.8 689.0 6.7 0.4
2016 38.7 3.1 697.3 8.0 0.4
2017 32.1 2.2 700.6 6.9 0.3
(D) NATIONAL CAREER SERVICE CENTRES FOR DIFFERENTLY ABLED
YEAR CLIENTS
ADMITTED CLIENTS
REHABILITATED
CLIENTS UNDER EVALUATION AT THE
END OF THE YEAR
% OF REHABILITATED TO ADMITTED
2013 33.4 11.5 0.1 34.4
2014 37.4 12.4 0.1 33.2
2015 33.1 12.3 0.8 37.2
2016 31.8 11.3 1.1 35.5
2017 33.7 11.5 6.2 34.3
2018 29.4 10.6 0.7 36.1
Note: # At the end of the year

Employment Exchange Statistics-2019
41
TABLE 16
EMPLOYMENT EXCHANGE/SPECIAL EMPLOYMENT EXCHANGE STATISTICS
ON DIFFERENTLY ABLED JOB-SEEKERS (ALL INDIA) – 2007-2017 #
(IN THOUSAND)
REGISTRATION
YEAR BLIND DEAF & DUMB
ORTHOPEDICS RESPIRATORY
DISORDERS
NEGATIVE LEPROSY PERSONS
TOTAL WOMEN
ALL EMPLOYMENT EXCHANGES*
2007 3.8 3.9 49.6 0.4 0.1 57.7 11.1
2008 4.1 4.1 46.3 0.4 @ 54.9 10.2
2009 4.4 4.6 46.7 0.4 0.0 56.1 10.9
2010 4.6 5.0 46.6 0.7 0.1 57.0 10.9
2011 5.4 5.8 51.2 0.7 0.1 63.2 12.5
2012 4.3 4.5 44.2 0.7 0.4 54.1 11.5
2013 2.2 2.8 25.0 0.5 0.3 30.5 5.8
2014 2.8 2.7 22.1 0.7 0.1 28.4 5.2
2015 4.1 4.3 32.5 1.0 0.2 42.1 8.4
2016 3.7 4.1 29.8 1.0 0.2 38.7 7.3
2017 3.1 3.1 24.8 1.0 0.1 32.1 5.8
SPECIAL EMPLOYMENT EXCHANGES
2007 0.9 1.1 11.0 @ @ 13.0 2.7
2008 1.0 1.2 9.9 0.1 @ 12.1 2.5
2009 0.9 1.1 7.0 0.1 @ 9.1 2.0
2010 0.9 1.1 7.3 0.2 @ 9.6 2.1
2011 1.1 1.4 7.6 0.2 @ 10.2 2.3
2012 1.1 1.2 11.1 0.2 @ 13.6 2.7
2013 0.4 0.7 4.5 0.1 0.0 5.6 0.6
2014 0.3 0.4 2.3 0.2 @ 3.3 0.5
2015 0.3 0.4 3.5 0.2 0.0 4.4 1.0
2016 0.3 0.3 3.1 0.1 @ 3.8 0.9
2017 0.3 0.3 2.0 0.3 @ 2.8 0.6 Note: # At the end of the year
* Includes figures for special employment exchanges for differently abled. @Figures less than 50

Employment Exchange Statistics-2019
42
TABLE 16 (CONTINUED……..)
EMPLOYMENT EXCHANGE/SPECIAL EMPLOYMENT EXCHANGE STATISTICS ON DIFFERENTLY ABLED JOB-SEEKERS (ALL INDIA) – 2007-2017 #
(IN THOUSAND)
PLACEMENT
YEAR BLIND DEAF & DUMB
ORTHOPEDICS RESPIRATORY
DISORDERS
NEGATIVE LEPROSY PERSONS
TOTAL WOMEN
ALL EMPLOYMENT EXCHANGES*
2007 0.4 0.3 2.6 @ - 3.4 0.7
2008 0.3 0.3 3.1 @ @ 3.7 0.8
2009 0.3 0.2 2.8 @ @ 3.3 0.8
2010 0.3 0.2 2.6 @ - 3.2 0.8
2011 0.3 0.2 2.8 @ - 3.3 0.7
2012 0.2 0.1 1.8 @ - 2.1 0.5
2013 0.1 0.1 1.6 @ - 1.9 0.4
2014 0.1 0.2 1.4 @ - 1.7 0.4
2015 0.2 0.2 2.4 @ @ 2.8 0.6
2016 0.2 0.3 2.6 @ @ 3.1 0.7
2017 0.2 0.2 1.9 @ @ 2.2 0.5
SPECIAL EMPLOYMENT EXCHANGES
2007 0.1 0.1 0.8 - - 1.1 0.2
2008 0.1 0.1 0.8 @ - 1.1 0.2
2009 0.1 @ 0.5 @ @ 0.6 0.2
2010 0.1 @ 0.4 @ @ 0.5 0.2
2011 0.1 @ 0.4 0.0 0.0 0.5 0.1
2012 @ @ 0.2 @ 0.0 0.2 @
2013 @ @ 0.2 0.0 0.0 0.2 0.1
2014 @ @ @ 0.0 0.0 0.6 @
2015 @ @ 0.1 @ @ 0.1 @
2016 @ @ 0.1 @ 0.0 0.1 @
2017 @ @ 0.1 @ @ 0.1 @ Note: # At the end of the year
* Includes figures for special employment exchanges for differently abled. @Figures less than 50

Employment Exchange Statistics-2019
43
TABLE 16 (CONTINUED……..)
EMPLOYMENT EXCHANGE/SPECIAL EMPLOYMENT EXCHANGE STATISTICS ON DIFFERENTLY ABLED JOB-SEEKERS (ALL INDIA) – 2007-2017 #
(IN THOUSAND)
LIVE REGISTER
YEAR BLIND DEAF & DUMB
ORTHOPEDICS RESPIRATORY
DISORDERS
NEGATIVE LEPROSY PERSONS
TOTAL WOMEN
ALL EMPLOYMENT EXCHANGES*
2007 44.5 45.9 564.2 3.1 2.0 660.0 130.8
2008 46.1 48.0 570.6 3.3 1.4 669.4 130.3
2009 48.5 50.1 562.0 3.7 1.2 665.5 129.9
2010 50.5 53.5 553.4 5.2 1.5 664.2 131.6
2011 52.6 56.2 571.5 5.6 1.5 687.3 139.0
2012 61.3 63.5 582.1 6.7 1.6 715.2 145.3
2013 61.1 63.0 585.0 6.7 1.5 711.3 146.0
2014 63.0 65.7 561.3 7.2 1.1 698.2 146.5
2015 65.1 68.1 545.1 9.1 1.5 689.0 153.2
2016 66.1 69.9 549.9 10.0 1.4 697.3 153.3
2017 66.8 70.3 552.8 9.3 1.5 700.6 147.9
SPECIAL EMPLOYMENT EXCHANGES
2007 11.1 13.2 85.8 0.2 0.5 110.8 23.1
2008 11.5 13.9 86.2 0.3 0.5 112.4 23.4
2009 11.7 14.0 72.7 0.4 0.5 99.3 22.0
2010 12.0 14.4 71.6 0.4 0.5 99.0 22.3
2011 11.7 14.2 71.7 0.6 0.4 98.6 23.6
2012 13.0 15.4 73.2 0.6 0.4 102.7 24.6
2013 12.4 14.7 66.5 0.7 0.4 94.7 22.0
2014 12.5 15.0 67.7 0.9 0.4 96.3 22.3
2015 12.2 14.6 64.8 1.2 0.4 93.2 22.3
2016 12.3 14.6 64.7 1.4 0.3 93.3 22.4
2017 12.5 15.3 63.4 1.7 0.4 93.3 23.2 Note: # At the end of the year
* Includes figures for special employment exchanges for differently abled. @Figures less than 50

Employment Exchange Statistics-2019
44
TABLE-17
SPECIAL EMPLOYMENT EXCHANGE STATISTICS FOR DIFFERENTLY ABLED JOB-SEEKERS FOR THE YEAR 2017 #
(IN NUMBER)
REGISTRATION
Sl. No.
Special Exchange Name
Blind Deaf & Dumb
Orthopedics Respiratory Disorder
Negative Leprosy
Total Women (in Total)
1 Agartala 59 68 215 4 5 351 87
2 Agra 3 2 101 0 0 106 18
3 Ajamgarh 2 6 44 1 0 53 0
4 Aligarh 0 0 0 0 0 0 0
5 Allahabad 0 0 0 0 0 0 0
6 Bangalor 0 0 0 0 0 0 0
7 Barabanki 0 0 0 0 0 0 0
8 Bareilly 0 0 0 0 0 0 0
9 Bhubneshwar 55 28 129 0 0 212 0
10 Bokaro Steel 12 11 93 0 0 116 19
11 Calcutta 0 0 0 0 0 0 0 12 Chandigarh 0 0 0 0 0 0 0
13 Chennai Anna Nagar 0 0 0 0 0 0 0
14 Curjon Road K.G.Marg 0 0 0 0 0 0 0
15 Dehradun 0 0 0 0 0 0 0
16 Ernakulam 21 9 60 0 0 90 22
17 Faizabad 0 0 0 0 0 0 0
18 Ghaziabad 0 3 32 0 0 35 8
19 Gorakhpur 2 6 41 0 0 49 5
20 Hyderabad 0 0 0 0 0 0 0
21 Imphal 8 3 36 0 0 47 19
22 Jabalpur 0 0 0 0 0 0 0
23 Jaipur 5 4 142 0 0 151 21
24 Jamshedpur 15 36 268 0 0 319 58
25 Jhansi 9 20 167 0 0 196 58
26 Kanpur 0 0 0 0 0 0 0
27 Kollam 7 5 37 24 0 73 0
28 Kottayam 0 0 0 0 0 0 0
29 Kozhikod 29 49 230 237 0 545 150 30 Lucknow 1 1 24 0 0 26 5
31 Mathura 0 0 0 0 0 0 0
32 Meerut 0 0 0 0 0 0 0
33 Mirzapur 2 2 39 0 0 43 7
34 Mumbai 0 0 0 0 0 0 0
35 Muradabad 0 0 70 0 0 70 10
36 Neyyattinkara 7 23 63 21 0 114 38
37 Patna 0 0 0 0 0 0 0
38 Ranchi 2 3 85 0 0 90 89
39 Shimla * 0 0 0 0 0 0 0
40 Shrawasti 0 0 0 0 0 0
41 Thiruvanathapuram 0 0 0 0 0 0 0
42 Varanasi 12 18 74 8 0 112 16
Total 251 297 1950 295 5 2798 630
Note: # At the end of the year. * Duplicate cards are maintained.

Employment Exchange Statistics-2019
45
TABLE-17 (CONTINUED....)
SPECIAL EMPLOYMENT EXCHANGE STATISTICS FOR DIFFERENTLY ABLED JOB-SEEKERS FOR THE YEAR 2017 #
(IN NUMBER)
PLACEMENT
Sl. No.
Special Exchange Name
Blind Deaf & Dumb
Orthopedics Respiratory Disorder
Negative Leprosy
Total Women (in Total)
1 Agartala 0 0 0 0 0 0 0
2 Agra 0 0 0 0 0 0 0
3 Ajamgarh 0 0 0 0 0 0 0
4 Aligarh 0 0 0 0 0 0 0
5 Allahabad 0 0 0 0 0 0 0
6 Bangalor 0 0 0 0 0 0 0
7 Barabanki 0 0 0 0 0 0 0
8 Bareilly 0 0 0 0 0 0 0
9 Bhubneshwar 0 0 0 0 0 0 0
10 Bokaro Steel 0 0 0 0 0 0 0
11 Calcutta 0 0 0 0 0 0 0 12 Chandigarh 0 0 0 0 0 0 0
13 Chennai Anna Nagar 0 0 0 0 0 0 0
14 Curjon Road K.G.Marg 0 0 0 0 0 0 0
15 Dehradun 0 0 0 0 0 0 0
16 Ernakulam 0 1 8 0 0 9 3
17 Faizabad 0 0 0 0 0 0 0
18 Ghaziabad 0 0 0 0 0 0 0
19 Gorakhpur 0 0 0 0 0 0 0
20 Hyderabad 0 0 0 0 0 0 0
21 Imphal 0 0 0 0 0 0 0
22 Jabalpur 0 0 0 0 0 0 0
23 Jaipur 0 0 0 0 0 0 0
24 Jamshedpur 0 0 0 0 0 0 0
25 Jhansi 0 0 0 0 0 0 0
26 Kanpur 0 0 0 0 0 0 0
27 Kollam 2 1 10 0 0 13 0
28 Kottayam 0 0 0 0 0 0 0
29 Kozhikod 3 3 20 0 0 26 8 30 Lucknow 0 0 0 0 0 0 0
31 Mathura 0 0 0 0 0 0 0
32 Meerut 0 0 0 0 0 0 0
33 Mirzapur 0 0 0 0 0 0 0
34 Mumbai 0 0 0 0 0 0 0
35 Muradabad 0 0 0 0 0 0 0
36 Neyyattinkara 3 4 16 0 0 23 8
37 Patna 0 0 0 0 0 0 0
38 Ranchi 0 0 0 0 0 0 0
39 Shimla * 0 0 0 0 0 0 0
40 Shrawasti 0 0 0 0 0 0 0
41 Thiruvanathapuram 0 0 0 0 0 0 0
42 Varanasi 0 0 0 0 0 0 0
Total 8 9 54 0 0 71 19
Note: # At the end of the year. * Duplicate cards are maintained.

Employment Exchange Statistics-2019
46
TABLE-17 (CONTINUED....)
SPECIAL EMPLOYMENT EXCHANGE STATISTICS FOR DIFFERENTLY ABLED JOB-SEEKERS
FOR THE YEAR 2017 #
(IN NUMBER) LIVE REGISTER
Sl. No.
Special Exchange Name
Blind Deaf & Dumb
Orthopedics Respiratory Disorder
Negative Leprosy
Total Women (in Total)
1 Agartala 445 485 2163 70 43 3206 1077
2 Agra 20 24 435 0 0 479 52
3 Ajamgarh 10 11 398 1 0 420 55
4 Aligarh 4 12 424 0 0 440 72
5 Allahabad 210 205 4249 0 0 4664 501
6 Bangalor 322 620 4075 0 0 5017 1268
7 Barabanki 3 4 143 0 0 150 24
8 Bareilly 35 52 971 0 0 1058 175
9 Bhubneshwar 665 532 1518 0 0 2715 168
10 Bokaro Steel 279 316 2456 0 0 3051 594
11 Calcutta 405 980 4079 0 0 5464 1644
12 Chandigarh 3 1 28 0 0 32 0
13 Chennai Anna Nagar 5782 5140 4485 0 0 15407 3108
14 Curzon Road K.G.Marg 0 0 0 0 0 0 0
15 Dehradun 45 74 1214 0 0 1333 389
16 Ernakulam 151 197 796 48 0 1192 444
17 Faizabad 14 28 848 1 0 891 159
18 Ghaziabad 8 28 312 0 0 348 76 19 Gorakhpur 236 240 2232 0 0 2708 338
20 Hyderabad 682 960 3810 0 313 5765 1958
21 Imphal 370 292 2283 0 0 2945 969
22 Jabalpur 211 136 777 0 0 1124 254
23 Jaipur 65 125 1045 0 0 1235 222
24 Jamshedpur 79 125 495 0 0 699 135
25 Jhansi 44 42 588 0 0 674 176
26 Kanpur 405 980 4079 0 10 5474 1644
27 Kollam 112 210 1128 109 0 1559 208
28 Kottayam 138 212 858 98 0 1306 578
29 Kozhikod 382 676 1632 639 0 3329 1179
30 Lucknow 32 39 2375 0 0 2446 541
31 Mathura 18 17 1018 0 0 1053 109
32 Meerut 8 22 598 0 0 628 112
33 Mirzapur 24 9 401 1 0 435 74
34 Mumbai 650 1301 3872 1 3 5827 1933
35 Muradabad 4 5 437 0 0 446 94
36 Neyyattinkara 236 325 1824 589 0 2974 1132
37 Patna 53 135 2194 0 0 2382 224 38 Ranchi 53 63 1265 0 0 1381 545
39 Shimla * 0 0 0 0 0 0 0
40 Shrawasti 0 0 0 0 0 0 0
41 Thiruvanathapuram 249 575 1533 143 0 2500 890
42 Varanasi 48 63 407 20 0 538 96
Total 12500 15261 63445 1720 369 93295 23217
Note: # At the end of the year. * Duplicate cards are maintained.

Employment Exchange Statistics-2019
47
TABLE 18
SPECIAL CELL STATISTICS ON DIFFERENTLY ABLED JOB SEEKERS
FOR THE YEAR 2017 #
(In Number)
SL. N. Name of Special Cell Registration Placement Live Register % of
Placement to Register
% of Placement
to Live Register
1 Aluva 140 13 1004 9.29 1.29 2 Amritsar (S.E.E.) 53 0 761 0.00 0.00
3 Barrackpore 0 0 4419 0.00 0.00
4 Bilaspur (Chg.) 110 0 2286 0.00 0.00
5 Bokaro Thermal 0 0 3437 0.00 0.00
6 Chingleput (Kancheepuram)
222 8 3481 3.60 0.23
7 Coimbatore 0 0 2533 0.00 0.00
8 Cuddalore 206 46 3977 22.33 1.16
9 Cuttack 53 0 582 0.00 0.00
10 Dewas 0 0 485 0.00 0.00
11 Dharmsala 93 0 3405 0.00 0.00
12 Durg 134 0 988 0.00 0.00
13 Erode 94 21 2181 22.34 0.96
14 Howrah 0 0 622 0.00 0.00
15 Irrinjalakuda 17 3 621 17.65 0.48
16 Kayamkulam 0 0 1915 0.00 0.00
17 Kharagpur 8 0 789 0.00 0.00 18 Kohima 7 0 781 0.00 0.00
19 Kolhapur 130 0 1771 0.00 0.00
20 Mohindergarh 0 0 258 0.00 0.00
21 Nasik 87 0 2411 0.00 0.00
22 Nedumangad 0 0 1494 0.00 0.00
23 Palghat (Palakkad) 0 0 1267 0.00 0.00
24 Purulia 21 0 1486 0.00 0.00
25 Rewa 167 0 826 0.00 0.00
26 Salem 0 0 4945 0.00 0.00
27 Shillong 22 0 165 0.00 0.00
28 Sikar 0 0 145 0.00 0.00
29 Siri-Ganganagar 39 0 329 0.00 0.00
30 Solapur 0 0 860 0.00 0.00
31 Sonepat 0 0 349 0.00 0.00
32 Thanjavur 44 17 3529 38.64 0.48
33 Tirunelveli 0 0 5853 0.00 0.00
34 Tumkur 0 0 1141 0.00 0.00
35 Uthagamandlam 0 0 1299 0.00 0.00 36 Vellore 115 11 6859 9.57 0.16
37 Vijayawada 240 2 7838 0.83 0.03
38 Vishakhapatnam 0 0 5525 0.00 0.00
TOTAL 2002 121 82617 6.04 0.15
Note: # At the end of the year.

Employment Exchange Statistics-2019
48
TABLE 19
STATISTICS OF WORK DONE BY NATIONAL CAREER SERVICECENTRES FOR DIFFERENTLY ABLED
PERSONS DURING 2018 #
(In Numbers)
SL.
N.
Name Of VRC
CLIENTS AT THE BEGINING OF 2018 CLIENTS ADMITTED DURING 2018
Blin
d
De
af &
Du
mb
Ort
ho
pae
dic
s
Ne
gati
ve
Lep
rosy
Pe
rso
ns
Mild
Me
nta
lly
Re
tard
ed
Tota
l
Blin
d
De
af &
Du
mb
Ort
ho
pae
dic
s
Ne
gati
ve
Lep
rosy
Pe
rso
ns
Mild
Me
nta
lly
Re
tard
ed
Tota
l
1 AGARTALA 0 1 0 0 1 2 39 34 139 0 16 228
2 AHMEDABAD 0 0 0 0 0 0 276 401 1418 0 91 2186
3 BANGALORE 0 0 0 0 0 0 50 183 542 1 39 815
4 BHUBANESWAR 1 1 6 0 1 9 427 345 1354 0 153 2279
5 CHENNAI 1 4 2 0 0 7 70 504 674 0 57 1305
6 DELHI 9 16 50 0 7 82 123 176 764 0 32 1095
7 GUWAHATI 0 0 0 0 0 0 160 248 1034 0 121 1563
8 HYDERABAD 0 14 35 0 0 49 27 854 1016 1 130 2028
9 JABALPUR 0 0 0 0 0 0 234 220 1325 0 195 1974
10 JAIPUR 0 0 1 0 0 1 27 61 1219 0 13 1320
11 KANPUR 11 18 58 0 0 87 195 444 3379 0 3 4021
12 KOLKATA 7 54 15 0 12 88 232 300 876 0 84 1492
13 LUDHIANA 0 0 1 0 0 1 56 187 1069 0 55 1367
14 MUMBAI 0 3 1 0 5 9 277 389 1302 1 95 2064
15 PATNA 0 0 0 0 0 0 26 72 760 4 23 885
16 PUDUCHERRY 0 0 5 0 0 5 9 82 175 1 19 286
17 RANCHI 7 24 134 0 0 165 3 25 119 0 1 148
18 SHRINAGAR 0 0 0 0 1 1 52 48 210 0 30 340
19 TRIVANTHAPURAM 3 37 27 2 103 172 220 836 892 0 1126 3074
20 UNA 2 3 4 0 13 22 47 42 423 0 84 596
21 VADODARA (W) 3 1 1 0 0 5 38 57 256 0 11 362
TOTAL 44 176 340 2 143 705 2588 5508 18946 8 2378 29428
Note: # At the end of the year.

Employment Exchange Statistics-2019
49
TABLE 19 (CONTINUED……..)
STATISTICS OF WORK DONE BY NATIONAL CAREER SERVICE CENTRES FOR DIFFERENTLY ABLED
PERSONS DURING 2018 #
(In Numbers)
SL.
N.
Name Of VRC
NUMBER OF CLIENTS EVALUATED DURING 2018 NUMBER OF CLIENTS WHO LEFT THE CENTRE B
lind
De
af &
Du
mb
Ort
ho
pae
dic
s
Ne
gati
ve
Lep
rosy
Pe
rso
ns
Mild
Me
nta
lly
Re
tard
ed
Tota
l
Blin
d
De
af &
Du
mb
Ort
ho
pae
dic
s
Ne
gati
ve
Lep
rosy
Pe
rso
ns
Mild
Me
nta
lly
Re
tard
ed
Tota
l
1 AGARTALA 81 66 271 0 26 444 0 0 0 0 0 0
2 AHMEDABAD 276 401 1418 0 91 2186 0 0 0 0 0 0
3 BANGALORE 50 183 542 0 39 814 0 0 0 0 0 0
4 BHUBANESWAR 426 344 1349 0 152 2271 0 0 0 0 0 0
5 CHENNAI 69 500 672 0 57 1298 0 0 0 0 0 0
6 DELHI 121 173 750 0 25 1069 0 2 0 0 0 2
7 GUWAHATI 160 248 1034 0 121 1563 0 0 0 0 0 0
8 HYDERABAD 27 844 1000 1 130 2002 0 0 0 0 0 0
9 JABALPUR 234 220 1325 0 195 1974 0 0 0 0 0 0
10 JAIPUR 27 60 1219 0 13 1319 0 0 0 0 0 0
11 KANPUR 191 442 3358 0 3 3994 1 0 7 0 0 8
12 KOLKATA 222 293 873 0 82 1470 0 5 11 0 1 17
13 LUDHIANA 56 187 1070 0 55 1368 0 0 0 0 0 0
14 MUMBAI 277 389 1302 1 94 2063 0 0 0 0 0 0
15 PATNA 26 72 760 4 23 885 0 0 0 0 0 0
16 PUDUCHERRY 9 82 175 0 20 286 0 0 0 0 0 0
17 RANCHI 2 0 21 0 0 23 0 0 0 0 0 0
18 SHRINAGAR 52 48 210 0 29 339 0 0 0 0 0 0
19 TRIVANTHAPURAM 218 841 896 0 1125 3080 0 0 0 0 0 0
20 UNA 47 40 421 0 78 586 0 0 0 0 0 0
21 VADODARA (W) 46 57 245 0 11 359 0 0 0 0 0 0
TOTAL 2617 5490 18911 6 2369 29393 1 7 18 0 1 27
Note: # At the end of the year.
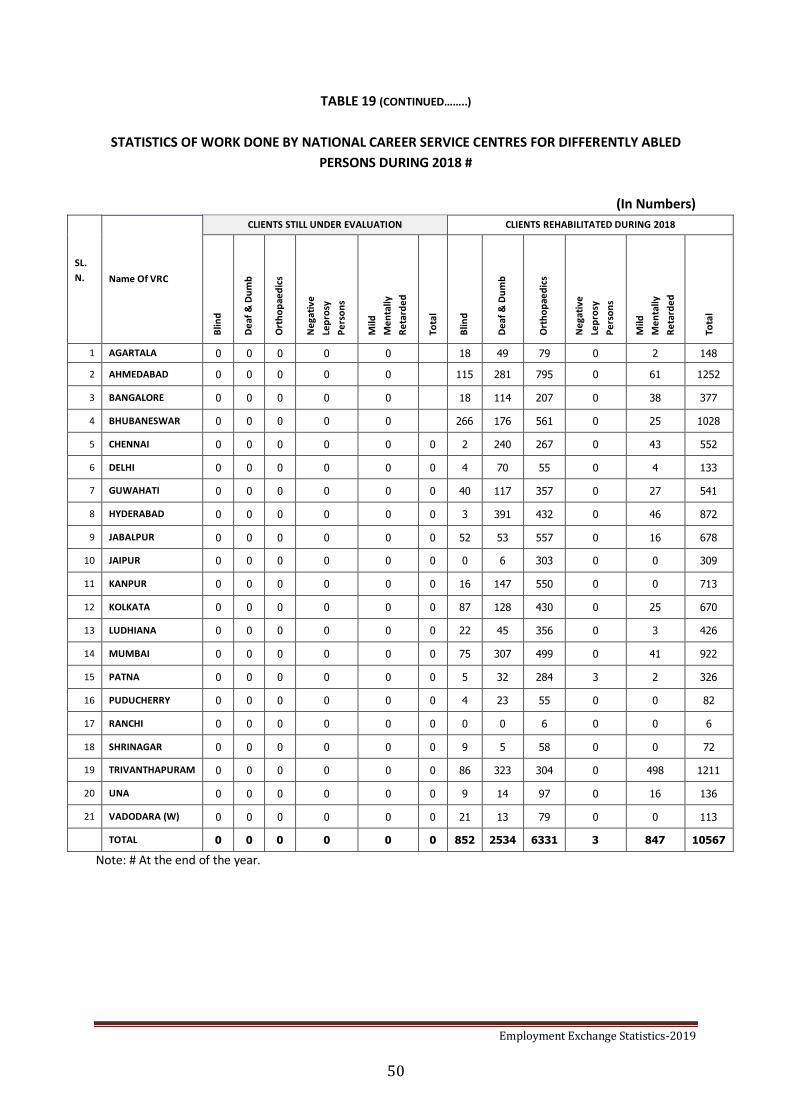
Employment Exchange Statistics-2019
50
TABLE 19 (CONTINUED……..)
STATISTICS OF WORK DONE BY NATIONAL CAREER SERVICE CENTRES FOR DIFFERENTLY ABLED
PERSONS DURING 2018 #
(In Numbers)
SL.
N.
Name Of VRC
CLIENTS STILL UNDER EVALUATION CLIENTS REHABILITATED DURING 2018 B
lind
De
af &
Du
mb
Ort
ho
pae
dic
s
Ne
gati
ve
Lep
rosy
Pe
rso
ns
Mild
Me
nta
lly
Re
tard
ed
Tota
l
Blin
d
De
af &
Du
mb
Ort
ho
pae
dic
s
Ne
gati
ve
Lep
rosy
Pe
rso
ns
Mild
Me
nta
lly
Re
tard
ed
Tota
l
1 AGARTALA 0 0 0 0 0 18 49 79 0 2 148
2 AHMEDABAD 0 0 0 0 0 115 281 795 0 61 1252
3 BANGALORE 0 0 0 0 0 18 114 207 0 38 377
4 BHUBANESWAR 0 0 0 0 0 266 176 561 0 25 1028
5 CHENNAI 0 0 0 0 0 0 2 240 267 0 43 552
6 DELHI 0 0 0 0 0 0 4 70 55 0 4 133
7 GUWAHATI 0 0 0 0 0 0 40 117 357 0 27 541
8 HYDERABAD 0 0 0 0 0 0 3 391 432 0 46 872
9 JABALPUR 0 0 0 0 0 0 52 53 557 0 16 678
10 JAIPUR 0 0 0 0 0 0 0 6 303 0 0 309
11 KANPUR 0 0 0 0 0 0 16 147 550 0 0 713
12 KOLKATA 0 0 0 0 0 0 87 128 430 0 25 670
13 LUDHIANA 0 0 0 0 0 0 22 45 356 0 3 426
14 MUMBAI 0 0 0 0 0 0 75 307 499 0 41 922
15 PATNA 0 0 0 0 0 0 5 32 284 3 2 326
16 PUDUCHERRY 0 0 0 0 0 0 4 23 55 0 0 82
17 RANCHI 0 0 0 0 0 0 0 0 6 0 0 6
18 SHRINAGAR 0 0 0 0 0 0 9 5 58 0 0 72
19 TRIVANTHAPURAM 0 0 0 0 0 0 86 323 304 0 498 1211
20 UNA 0 0 0 0 0 0 9 14 97 0 16 136
21 VADODARA (W) 0 0 0 0 0 0 21 13 79 0 0 113
TOTAL 0 0 0 0 0 0 852 2534 6331 3 847 10567
Note: # At the end of the year.
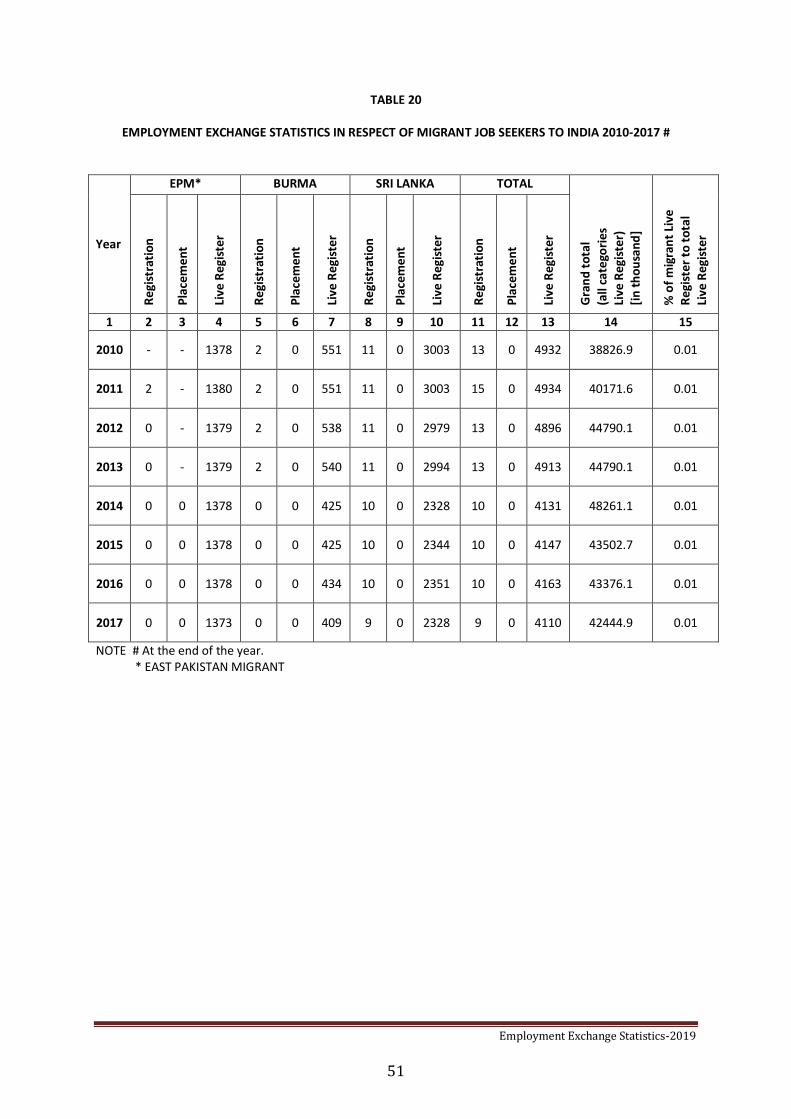
Employment Exchange Statistics-2019
51
TABLE 20
EMPLOYMENT EXCHANGE STATISTICS IN RESPECT OF MIGRANT JOB SEEKERS TO INDIA 2010-2017 #
Year
EPM* BURMA SRI LANKA TOTAL
Gra
nd
to
tal
(all
cate
gori
es
Live
Re
gist
er)
[i
n t
ho
usa
nd
]
% o
f m
igra
nt
Live
R
egi
ste
r to
to
tal
Live
Re
gist
er
Re
gist
rati
on
Pla
cem
en
t
Live
Re
gist
er
Re
gist
rati
on
Pla
cem
en
t
Live
Re
gist
er
Re
gist
rati
on
Pla
cem
en
t
Live
Re
gist
er
Re
gist
rati
on
Pla
cem
en
t
Live
Re
gist
er
1 2 3 4 5 6 7 8 9 10 11 12 13 14 15
2010 - - 1378 2 0 551 11 0 3003 13 0 4932 38826.9 0.01
2011 2 - 1380 2 0 551 11 0 3003 15 0 4934 40171.6 0.01
2012 0 - 1379 2 0 538 11 0 2979 13 0 4896 44790.1 0.01
2013 0 - 1379 2 0 540 11 0 2994 13 0 4913 44790.1 0.01
2014 0 0 1378 0 0 425 10 0 2328 10 0 4131 48261.1 0.01
2015 0 0 1378 0 0 425 10 0 2344 10 0 4147 43502.7 0.01
2016 0 0 1378 0 0 434 10 0 2351 10 0 4163 43376.1 0.01
2017 0 0 1373 0 0 409 9 0 2328 9 0 4110 42444.9 0.01
NOTE # At the end of the year. * EAST PAKISTAN MIGRANT

Employment Exchange Statistics-2019
52
TABLE 21
EMPLOYMENT EXCHANGE STATISTICS IN RESPECT OF MINORITY COMMUNITIES’ JOB SEEKER FOR THE YEAR 2017 #
(IN THOUSAND)
PARTICULARS MINORITY COMMUNITIES
Muslims Christians Sikhs Buddhists Zoroastrians Jain Total
Registration 124.9 96.4 50.9 3.4 0.1 0.4 276.0
Placement 6.6 2.0 0.9 0.1 @ @ 9.6
Submission 50.2 28.2 11.8 1.3 0.0 0.0 91.5
Live Register 3596.6 1822.0 236.6 221.2 0.9 10.2 5887.5
% of Placement to Submission
13.2 7.2 7.4 4.9 0.0 0.0 10.5
% of Total LR of minorities communities
61.1 30.9 4.0 3.8 0.0 0.2 100
NOTE: # At the end of the year.
@ Figures less than 50 Figures may not add up to total due to rounding off.

Employment Exchange Statistics-2019
53
TABLE 22
EMPLOYMENT EXCHANGE STATISTICS IN RESPECT OF EX-ITI/FULL TERM APPRENTICES (ALL INDIA)
FOR THE YEAR 2007-2017 #
(IN NUMBER)
YEA
R
REGISTRATION PLACEMENTS LIVE REGISTER
% O
F PL
AC
EMEN
T TO
LIV
E R
EGIS
TER
OF
Ex-
ITI
% O
F PL
AC
EMEN
T TO
LIV
E R
EGIS
TER
AP
PR
ENTI
CES
Ex-
ITI
TRA
INEE
S
FULL
TER
M
AP
PR
ENT
ICES
Ex-
ITI
TRA
INEE
S
FULL
TER
M
AP
PR
ENTI
CES
Ex-
ITI
TRA
INEE
S
FULL
TER
M
AP
PR
ENT
ICES
2007 130753 20001 12047 1626 1383845 188594 0.9 0.9
2008 129612 19150 15284 1556 1401418 185544 1.1 0.8
2009 128708 18064 13170 2232 1316184 187468 1.0 1.2
2010 125480 16687 10592 2561 1226887 172953 0.9 1.5
2011 125477 11779 10951 2023 1261689 161680 0.9 1.3
2012 100776 8921 9721 1492 1290164 177560 0.8 0.8
2013 117588 7976 10490 924 1360979 184956 0.8 0.5
2014 75458 5765 12809 809 1338792 182933 1.0 0.4
2015 85380 5797 11676 845 1316849 185416 0.9 0.5
2016 92081 5849 10964 814 1319377 188102 0.8 0.4
2017 91084 4914 8167 577 1269027 177098 0.6 0.3
NOTE: # At the end of the year.

Employment Exchange Statistics-2019
54
TABLE 23
NUMBER OF JOB SEEKERS ON THE LIVE REGISTER OF EMPLOYMENT EXCHANGES
CLASSIFIED BY BROAD OCCUPATIONAL GROUP FOR THE YEAR 2017#
(In Thousand)
DIVISION
(NCO-2004)
TITLE
LIVE REGISTER
Total
Percentage
To Total
Women
(Included
in Total)
Percentage
To Total
Women
1 LEGISLATORS, SENIOR OFFICIALS &
MANGERS 172.6 0.4 76.7 0.5
2 PROFESSIONALS 2741.7 6.5 1217.0 7.8
3 TECHNICIANS & ASSOCIATE
PROFESSIONALS 1846.8 4.4 772.1 5.0
4 CLERKS 1169.3 2.8 506.2 3.3
5 SERVICE WORKERS AND SHOP &
MARKET SALES WORKERS 241.2 0.6 35.0 0.2
6 SKILLED AGRICULTURAL AND FISHERY
WORKERS 147.1 0.3 61.5 0.4
7 CRAFT AND RELATED TRADES
WORKERS 1474.6 3.5 160.2 1.0
8 PLANT AND MACHINE OPERATORS 850.6 2.0 27.9 0.2
9 ELEMENTARY OCCUPATIONS 957.6 2.3 287.4 1.9
X WORKERS NOT CLASSIFIED BY
OCCUPATIONS 32843.6 77.4 12375.5 79.7
TOTAL 42444.9 100.0 15519.4 100.0
NOTE: # At the end of the year. Totals may not tally due to rounding off.

Employment Exchange Statistics-2019
55
APPENDIX

Employment Exchange Statistics-2019
56
List of employment exchanges functioning in the country
Andhra Pradesh
S.No. Exchange Code
Employment Exchanges
S.No. Exchange Code
Employment Exchanges
1 002 Anantapur 10 023 Srikakulam
2 003 Chittoor 11 024 Vijayawada (Krishna)
3 004 Cuddapah (Kadapa) 12 025 Vishakhapatnam (Cler.)
4 005 Eluru 13 026 Vishakhapatnam (Tech.Unsk)
5 006 Guntur 14 027 Vishakhapatnam (Steel.Plant)
6 012 Kakinada (Godavari) 15 029 Vizianagram
7 015 Kurnool 16 042 U.E.I.G.B. Tirupathy
8 018 Nellore 17 043 U.E.I.G.B. Waltair (V.Patnam)
9 020 Ongole (Parkasam)
Arunachal Pradesh
S.No. Exchange Code
Employment Exchanges
S.No. Exchange Code
Employment Exchanges
1 001 Nahar Lagun 7 007 Seepa (East Kameng Distt)
2 002 Pasighat 8 008 Roing
3 003 Along 9 009 Konsa
4 004 Ziro 10 010 Daporijo
5 005 Bomdila 11 011 Changlong
6 006 Tezu (Lohit Distt) 12 012 Yingkiong
Assam
S.No. Exchange Code
Employment Exchanges
S.No. Exchange Code
Employment Exchanges
1 001 Barpeta 27 028 Nagaon
2 002 Bongaigaon 28 029 Sibsagar
3 003 Dhemaji 29 030 Silchar
4 004 Dhubri 30 031 Tinsukhia
5 005 Diphu 31 032 Tezpur
6 006 Dibrugarh 32 033 Chariali-Biswanath
7 007 Dibrugarh (P.L.) 33 034 Gossaigaon
8 008 Digboi 34 035 Hojai
9 009 Doom-Dooma 35 036 Hatsinghimari
10 010 Gauhati 36 037 Jonai
11 011 Gauhati (P&E) 37 038 Manjuli (Garamur)
12 013 Gauhati (Unskilled) 38 039 Rangia
13 014 Goalpara 39 040 Chapakhowa (Sadiya)
14 015 Golaghat 40 041 Sonari
15 016 Haflong 41 042 Udalguri
16 017 Hailakandi 42 043 Garampani
17 018 Hamren 43 044 Bokajan
18 019 Jorhat 44 045 Jagiroad
19 020 Karimganj 45 046 Moranhat

Employment Exchange Statistics-2019
57
List of employment exchanges functioning in the country
20 021 Kokrajhar 46 047 Patharkandi
21 022 Mangaldai 47 048 Duliajan
22 023 Morigaon 48 049 Kaliabor
23 024 Nalbari 49 050 Barpather (Dhansiri)
24 025 Namrup 50 060 U.E.I.G.B. Dibrugarh
25 026 Nazira 51 061 U.E.I.G.B. Guwahati
26 027 North Lakhimpur 52 062 U.E.I.G.B Jorhat
Bihar
S.No. Exchange Code
Employment Exchanges
S.No. Exchange Code
Employment Exchanges
1 001 Arrah (Bhojpur) 24 024 Purnia
2 002 Aurangabad 25 025 Saharsa
3 003 Bagusarai (Barauni) 26 026 Samastipur
4 004 Beetiah (W. Champaran) 27 027 Siwan
5 005 Bhagalpur 28 028 Sitamarhi
6 006 Biharsharif (Nalanda) 29 029 Vaishali (Hajipur)
7 007 Buxar 30 030 Dalmia Nagar
8 008 Chapra 31 031 Jehanabad
9 009 Darbhanga (Laharisarai) 32 032 Woman Patna
10 010 Gaya 33 033 Araria
11 011 Gopalganj 34 034 Lakkhisarai
12 012 Kathiar 35 035 Kishangunj
13 013 Khagaria 36 036 Supaul
14 014 Madhubani 37 037 Sheikhpura
15 015 Madhepura 38 038 Taimur Bhabua
16 016 Munger 39 039 Jamui
17 017 Motihari (East Champaran) 40 040 Arwal
18 018 Muzaffarpur 41 041 Banka
19 019 Nawada 42 151 U.E.I.G.B. Bhagalpur
20 020 Patna 43 152 U.E.I.G.B. Darbhanga
21 021 Patna (P.&E.) 44 153 U.E.I.G.B. Magadh (Bodh Gaya)
22 022 Patna (P.H.) 45 154 U.E.I.G.B. Mujaffarpur
23 023 Patna (SC) 46 155 U.E.I.G.B. Patna
47 047 Sheoher
Chhattisgarh
S.No. Exchange Code
Employment Exchanges
S.No. Exchange Code
Employment Exchanges
1 001 Ambikapur 14 014 Kanker
2 002 Bilaspur 15 015 Kawarda (Kabirdham)
3 003 Durg 16 016 Dhamtari
4 004 Jagdalpur 17 017 Narayanpur
5 005 Jashpur 18 018 Bijapur
6 006 Jaspurchappa (Janjgir Chappa) 19 019 Baloda Bazaar

Employment Exchange Statistics-2019
58
List of employment exchanges functioning in the country
7 007 Dantwada 20 020 Goriyabind
8 008 Korba 21 021 Kondagaon
9 009 Mahasamund 22 022 Mungeli
10 010 Manendragarh 23 023 Sukma
11 011 Raipur 24 024 Surajpur
12 012 Raigarh 25 025 Balod
13 013 Rajnandgaon 26 026 Balrampur
Delhi
S.No. Exchange Code
Employment Exchanges
S.No. Exchange Code
Employment Exchanges
1 001 Central (K.G. Marg) 8 008 East
2 002 North 9 009 North East
3 003 South (R.K. Puram) 10 010 Curjon Road K.G.Marg (P.H.)
4 004 West Pusa (P&E) 11 011 Delhi U.E.I.G.B.
5 005 New Delhi (K.G. Marg) 12 012 Jamia Millia
6 006 South West (Kirby Place) 13 013 J.N.U. (U.E.I.G.B.)
7 007 North West + Ex-Servicemen 14 014 Sahadra (PH)
Goa
S.No. Exchange Code
Employment Exchanges
S.No. Exchange Code
Employment Exchanges
1 001 Panaji - - -
Gujarat
S.No. Exchange Code
Employment Exchanges
S.No. Exchange Code
Employment Exchanges
1 001 Amreli 25 031 Surendranagar
2 002 Ahmedabad 26 032 Valsad
3 005 Ahwa-Dangs 27 033 Khedbrahma
4 006 Baroda (Clerical)(PH) 28 034 Patan
5 009 Bhavnagar 29 035 Navsari
6 010 Bharuch 30 036 Annand
7 011 Bhuj-Kutch 31 039 Ahmedabad (Women)
8 012 Chhota-Udepur 32 040 Jamnagar (Women)
9 013 Dharampur 33 041 Tapi
10 014 Dahod 34 151 U.E.I.G.B. Ahmedabad
11 015 Gandhinagar 35 152 U.E.I.G.B. Baroda
12 016 Godhara (Panchmahal) 36 153 U.E.I.G.B. Bhavnagar
13 017 Himatnagar 37 154 U.E.I.G.B. Rajkot
14 018 Jamnagar 38 155 U.E.I.G.B. Surat
15 019 Junagadh 39 156 U.E.I.G.B. V.V. Nagar
16 020 Mandvi 40 157 U.E.I.G.B. Patan

Employment Exchange Statistics-2019
59
List of employment exchanges functioning in the country
17 021 Mehsana (Clerical) 41 158 U.E.I.G.B. Bhuj
18 022 Nadiad (Clerical) 42 042 Arvali
19 023 Palanpur 43 043 Chhota-Udepur(town)
20 024 Porbandar 45 045 Botad
21 025 Rojkot 47 047 Gir-Somnath
22 027 Rajpipla (Narmada) 44 044 Mahisagar
23 028 Songadh 46 046 Morbi
24 029 Surat 48 048 Devbhumi-Dwarka
Haryana
S.No. Exchange Code
Employment Exchanges
S.No. Exchange Code
Employment Exchanges
1 001 Ambala 29 029 Gohana
2 002 Bahadurgarh 30 030 Narwana
3 003 Bhiwani 31 031 Tohana
4 004 Chandigarh 32 032 Assandh
5 005 Chandigarh PH 33 033 Barara
6 006 S.C. Cell Dire of Emp. Exc. 34 034 Ellenabad
7 007 Charkhi Dadri 35 035 Ferozepur-Jhirka
8 008 Faridabad 36 036 Gulhachekka
9 009 Gurgaon 37 037 Gannaur
10 010 Hansi 38 038 Hathin
11 011 Hisar 39 039 Hodal
12 012 Jhajjhar 40 040 Indri
13 013 Jind 41 041 Kosli
14 014 Panchkula 42 042 Loharu
15 015 Kaithal 43 043 Maham
16 016 Karnal 44 044 Morni Hills
17 017 Kurukshetra 45 045 Mohindergarh
18 018 Narnaul 46 046 Narayangarh
19 019 Palwal 47 047 Nuh
20 020 Panipat 48 048 Pihowa
21 021 Rewari 49 051 Rattia
22 022 Rohtak 50 052 R.E.E. Kalka
23 023 Sirsa 51 054 Samalka
24 024 Sonepat 52 055 Safidon
25 025 Yamunanagar 53 056 Siwani
26 026 Balabhgarh 54 068 U.E.I.G.B. Hisar
27 027 Dabwali 55 069 U.E.I.G.B. Kurukshetra
28 028 Fatehabad 56 070 U.E.I.G.B. Rohtak
57 57 Guhla
58 58 REE Tosham
59 59 Ganaur

Employment Exchange Statistics-2019
60
List of employment exchanges functioning in the country
Himachal Pradesh
S.No. Exchange Code
Employment Exchanges
S.No. Exchange Code
Employment Exchanges
1 001 Bilaspur 9 009 Nahan (Sirmour)
2 002 Chamba 10 010 Shimla
3 003 Dharmsala 11 011 Shimla PH*
4 004 Hamirpur 12 012 Solan
5 005 Keylong 13 013 Una
6 006 Kinnaur (R.Peo) 14 018 U.E.I.G.B. Shimla
7 007 Kulu 15 019 U.E.I.G.B. Palampur
8 008 Mandi
Jammu & Kashmir
S.No. Exchange Code
Employment Exchanges
S.No. Exchange Code
Employment Exchanges
1 001 Anantnag 10 010 Poonch
2 002 Badgam 11 011 Pulwama
3 003 Baramulla 12 012 Rajouri
4 004 Doda 13 013 Srinagar
5 005 Jammu 14 014 Udhampur
6 006 Kargil 15 015 Kistwar
7 007 kathua 16 016 Samba
8 008 Kupwara 17 017 Shopian
9 009 Leh
Jharkhand
S.No. Exchange Code
Employment Exchanges
S.No. Exchange Code
Employment Exchanges
1 001 Adityapur 22 022 Kiriburu
2 002 Bokaro Thermal 23 023 Lalmatia
3 003 Bokaro Steel City 24 024 Latehar
4 004 Chaibasa 25 025 Lohardaga
5 005 Chakardharpur 26 026 Ramgarh
6 006 Chandil 27 027 Ranchi
7 007 Kumardhubi 28 028 Pakur
8 008 Daltonganj 29 029 Sahibganj
9 009 Deoghar 30 030 Simdega
10 010 Dhanbad 31 031 Sindri
11 011 Dumka 32 032 Tenughat
12 012 Garhwa 33 033 Torpa
13 013 Ghatshila 34 034 Ranchi (P.E.)
14 014 Giridih 35 035 Ranchi (PH)
15 015 Gumla 36 036 Jamshedpur (PH)
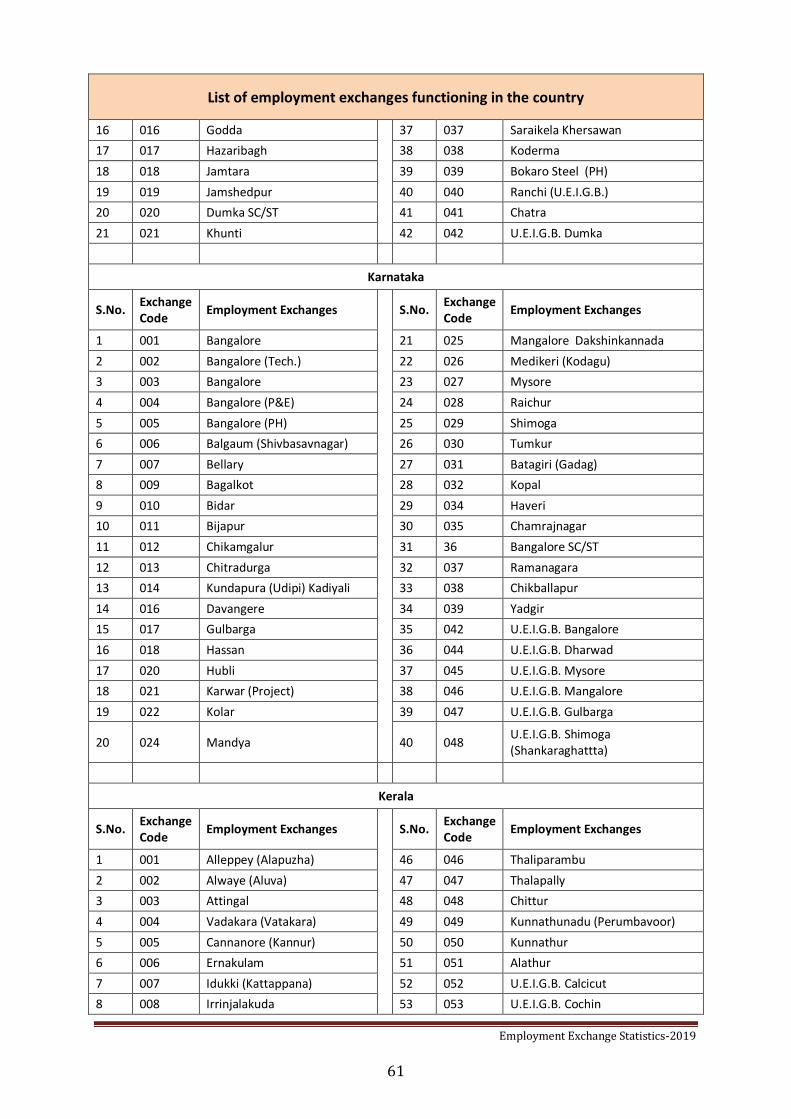
Employment Exchange Statistics-2019
61
List of employment exchanges functioning in the country
16 016 Godda 37 037 Saraikela Khersawan
17 017 Hazaribagh 38 038 Koderma
18 018 Jamtara 39 039 Bokaro Steel (PH)
19 019 Jamshedpur 40 040 Ranchi (U.E.I.G.B.)
20 020 Dumka SC/ST 41 041 Chatra
21 021 Khunti 42 042 U.E.I.G.B. Dumka
Karnataka
S.No. Exchange Code
Employment Exchanges
S.No. Exchange Code
Employment Exchanges
1 001 Bangalore 21 025 Mangalore Dakshinkannada
2 002 Bangalore (Tech.) 22 026 Medikeri (Kodagu)
3 003 Bangalore 23 027 Mysore
4 004 Bangalore (P&E) 24 028 Raichur
5 005 Bangalore (PH) 25 029 Shimoga
6 006 Balgaum (Shivbasavnagar) 26 030 Tumkur
7 007 Bellary 27 031 Batagiri (Gadag)
8 009 Bagalkot 28 032 Kopal
9 010 Bidar 29 034 Haveri
10 011 Bijapur 30 035 Chamrajnagar
11 012 Chikamgalur 31 36 Bangalore SC/ST
12 013 Chitradurga 32 037 Ramanagara
13 014 Kundapura (Udipi) Kadiyali 33 038 Chikballapur
14 016 Davangere 34 039 Yadgir
15 017 Gulbarga 35 042 U.E.I.G.B. Bangalore
16 018 Hassan 36 044 U.E.I.G.B. Dharwad
17 020 Hubli 37 045 U.E.I.G.B. Mysore
18 021 Karwar (Project) 38 046 U.E.I.G.B. Mangalore
19 022 Kolar 39 047 U.E.I.G.B. Gulbarga
20 024 Mandya 40 048 U.E.I.G.B. Shimoga (Shankaraghattta)
Kerala
S.No. Exchange Code
Employment Exchanges
S.No. Exchange Code
Employment Exchanges
1 001 Alleppey (Alapuzha) 46 046 Thaliparambu
2 002 Alwaye (Aluva) 47 047 Thalapally
3 003 Attingal 48 048 Chittur
4 004 Vadakara (Vatakara) 49 049 Kunnathunadu (Perumbavoor)
5 005 Cannanore (Kannur) 50 050 Kunnathur
6 006 Ernakulam 51 051 Alathur
7 007 Idukki (Kattappana) 52 052 U.E.I.G.B. Calcicut
8 008 Irrinjalakuda 53 053 U.E.I.G.B. Cochin

Employment Exchange Statistics-2019
62
List of employment exchanges functioning in the country
9 009 Kayamkulam 54 054 U.E.I.G.B. Mannuthy (Thrissor)
10 010 Kasargod 55 055 U.E.I.G.B.Thiruvanthapuram
11 011 Kottayam 56 056 U.E.I.G.B. Kottayam
12 012 Kozhikode 57 057 Mannarkkad
13 013 Malapuram 58 058 Kanjirapalli
14 014 Muvattupuzha 59 059 Mananthavady
15 015 Nedumangad 60 060 Sultan Battery
16 016 Neyyattinkra 61 061 Devi Kulam (Adimaly)
17 017 Palghat (Palakkad) 62 062 Peerumade
18 018 Palai (Pala) 63 063 Mallappally
19 019 Punalur 64 064 Kothamangalam
20 020 Quilon (Kollam) 65 065 Nilamboor
21 021 Sheritalla (Cherthala) 66 066 Kozhikod (PH)
22 022 Trichur (Thrissour) 67 067 Adoor
23 023 Thiruvanathapuram 68 068 Ranny
24 024 Thiruvanathapuram (P&E) 69 069 Paravoor
25 025 Thiruvanathapuram (PH) 70 070 Thiroorangadi
26 026 Waynad (Kalpetta) 71 071 Kollam (PH)
27 027 Pathannamthitta 72 072 Changannur
28 028 Tellicherry (Thalassery) 73 073 Balussery
29 029 Thodupuzha 74 074 Mattannur
30 030 Changnacherry 75 075 Kuttipuram
31 031 Karunagapally 76 076 Kottakkada
32 032 Tirur 77 078 Thamarassery
33 033 Ponnani 78 079 Ernakulam (PH)
34 034 North Paravoor 79 080 Kilmanoor
35 035 Koyilandi 80 081 Kundara
36 036 Thiruvalla 81 082 Kottayam (PH)
37 037 Perinthalmanna 82 083 Kozhikode (P&E)
38 038 Shorannur 83 084 Neyyattinkara (PH)
39 039 Vaikam 84 085 Kadakkal
40 040 Kodungallur 85 086 Ernakulam (P&E)
41 041 Chavakkad 86 087 Kuttand
42 042 Kochi 87 088 Tripurithura
43 043 Kottarakkara 88 089 Kazhakuttom
44 044 Mavelikara 89 090 Chalakudy
45 045 Hosdurg
Madhya Pradesh
S.No. Exchange Code
Employment Exchanges
S.No. Exchange Code
Employment Exchanges
1 001 Balaghat 25 027 Mandsaur
2 002 Barwani 26 028 Mandla
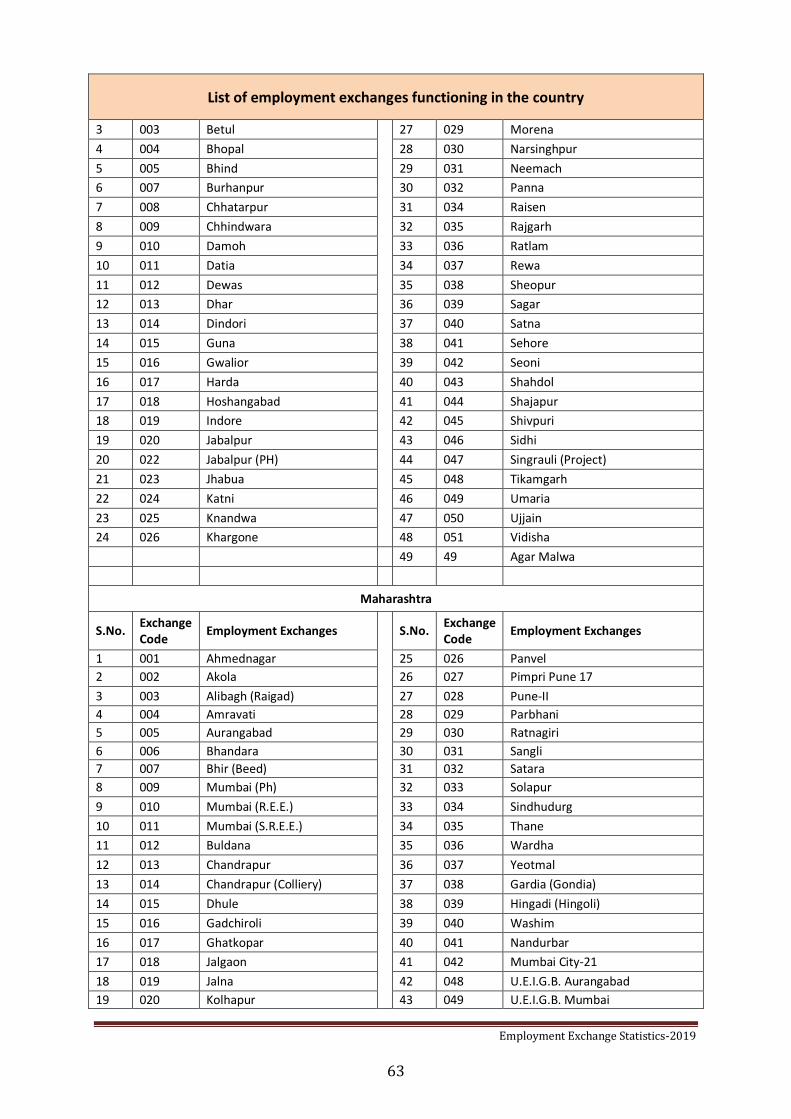
Employment Exchange Statistics-2019
63
List of employment exchanges functioning in the country
3 003 Betul 27 029 Morena
4 004 Bhopal 28 030 Narsinghpur
5 005 Bhind 29 031 Neemach
6 007 Burhanpur 30 032 Panna
7 008 Chhatarpur 31 034 Raisen
8 009 Chhindwara 32 035 Rajgarh
9 010 Damoh 33 036 Ratlam
10 011 Datia 34 037 Rewa
11 012 Dewas 35 038 Sheopur
12 013 Dhar 36 039 Sagar
13 014 Dindori 37 040 Satna
14 015 Guna 38 041 Sehore
15 016 Gwalior 39 042 Seoni
16 017 Harda 40 043 Shahdol
17 018 Hoshangabad 41 044 Shajapur
18 019 Indore 42 045 Shivpuri
19 020 Jabalpur 43 046 Sidhi
20 022 Jabalpur (PH) 44 047 Singrauli (Project)
21 023 Jhabua 45 048 Tikamgarh
22 024 Katni 46 049 Umaria
23 025 Knandwa 47 050 Ujjain
24 026 Khargone 48 051 Vidisha
49 49 Agar Malwa
Maharashtra
S.No. Exchange Code
Employment Exchanges
S.No. Exchange Code
Employment Exchanges
1 001 Ahmednagar 25 026 Panvel
2 002 Akola 26 027 Pimpri Pune 17
3 003 Alibagh (Raigad) 27 028 Pune-II
4 004 Amravati 28 029 Parbhani
5 005 Aurangabad 29 030 Ratnagiri
6 006 Bhandara 30 031 Sangli
7 007 Bhir (Beed) 31 032 Satara
8 009 Mumbai (Ph) 32 033 Solapur
9 010 Mumbai (R.E.E.) 33 034 Sindhudurg
10 011 Mumbai (S.R.E.E.) 34 035 Thane
11 012 Buldana 35 036 Wardha
12 013 Chandrapur 36 037 Yeotmal
13 014 Chandrapur (Colliery) 37 038 Gardia (Gondia)
14 015 Dhule 38 039 Hingadi (Hingoli)
15 016 Gadchiroli 39 040 Washim
16 017 Ghatkopar 40 041 Nandurbar
17 018 Jalgaon 41 042 Mumbai City-21
18 019 Jalna 42 048 U.E.I.G.B. Aurangabad
19 020 Kolhapur 43 049 U.E.I.G.B. Mumbai

Employment Exchange Statistics-2019
64
List of employment exchanges functioning in the country
20 021 Latur 44 050 U.E.I.G.B. Kolhapur Shivaji
21 022 Nagpur 45 051 U.E.I.G.B. Nagpur
22 023 Nanded 46 052 U.E.I.G.B. Pune
23 024 Nasik 47 053 U.E.I.G.B. Amravati
24 025 Osmanabad
Manipur
S.No. Exchange Code
Employment Exchanges
S.No. Exchange Code
Employment Exchanges
1 001 Chandel 7 007 Ukhrul
2 002 Churchandpur 8 008 Bishnupur
3 003 Imphal (West) 9 009 Thoubal
4 004 Imphal (PH) 10 010 Imphal (E)
5 005 Senapati 11 151 U.E.I.G.B. Canchipur
6 006 Tamenglong
Meghalaya
S.No. Exchange Code
Employment Exchanges
S.No. Exchange Code
Employment Exchanges
1 001 Jowai 7 007 Resubelpara
2 002 Nongstoin 8 008 Mairang
3 003 Shillong 9 009 Nongpoh
4 004 Tura 10 010 Ampati
5 005 Willim Nagar 11 011 Baghmara
6 006 Sohra 12 012 Khliehriat
Mizoram
S.No. Exchange Code
Employment Exchanges
S.No. Exchange Code
Employment Exchanges
1 001 Aizwal 3 003 Saiha
2 002 Lunglei
Nagaland
S.No. Exchange Code
Employment Exchanges
S.No. Exchange Code
Employment Exchanges
1 001 Kohima 5 005 Mon
2 002 Mokokchung 6 006 Phek
3 003 Tuensang 7 007 Wokha
4 004 Zunheboto 8 008 Dimapur
Orissa
S.No. Exchange Code
Employment Exchanges
S.No. Exchange Code
Employment Exchanges
1 001 Balasore 21 022 Bhadrak
2 002 Baripada (Mayurbhanj) 22 023 Puri
3 003 Berhampur (Ganjam) 23 024 Nayagarh

Employment Exchange Statistics-2019
65
List of employment exchanges functioning in the country
4 004 Bhubneshwar (Khurda) 24 025 Jajpur
5 005 Bhubneshwar (P&E) 25 026 Kendrapara
6 006 Bhubneshwar (PH) 26 027 Jagatsinghpur
7 007 Bhubneshwar (SC/ST) 27 028 Paralakhamundi (Gajapati)
8 008 Bolangir 28 029 Sonepur (Subarnapur)
9 009 Cuttack 29 030 Bargarh
10 010 Dhenkanal 30 031 Navrangpur
11 011 Kalahandi (Bhawanipatna) 31 032 U.E.I.G.B. Berhampur
12 012 Keonjhar 32 033 U.E.I.G.B. Bhubneshwar
13 013 Koraput 33 034 U.E.I.G.B. Vini -vihar
14 014 Phullbani 34 035 U.E.I.G.B. Sambalpur
15 016 Rourkela 35 036 Rayagada
16 017 Sambalpur 36 037 Malkangiri
17 018 Talchar (South Buldana) 37 038 Jajpur Road
18 019 Angul 38 039 Boudh
19 020 Paradeep 39 040 Deogarh
20 021 Jharsuguda 40 041 Nuapada
Punjab
S.No. Exchange Code
Employment Exchanges
S.No. Exchange Code
Employment Exchanges
1 001 Abohar 24 025 Pathankot
2 002 Amritsar 25 026 Patiala
3 003 Barnala 26 027 Phagawara
4 004 Batala 27 028 Rajpura
5 005 Bhatinda 28 029 Rampuraphul
6 006 Patti 29 030 Roopnagar (Ropar)
7 007 Faridkot 30 031 Sangrur
8 008 Ferozepur 31 032 Fatehgarh-Sahib
9 009 Gurudaspur 32 033 Talwara
10 010 Hoshiarpur 33 034 Tarn-Taran
11 011 Jagraon 34 035 Phillaur
12 012 Jallandar 35 036 Nabha
13 013 Kapurthala 36 037 Samana
14 014 Khanna 37 038 Fazilka
15 015 Ludhiana 38 039 Zira
16 017 Malerkotla 39 040 Sunam
17 018 Mansa 40 041 Ajnala
18 019 Moga 41 042 Samrala
19 020 Mohali 42 043 Talwandi-Sahib
20 021 Muktsar 43 044 Amritsar
21 022 Nakodar 44 045 Ferozepur
22 023 Nangal (Township) 45 046 Jalandar

Employment Exchange Statistics-2019
66
List of employment exchanges functioning in the country
23 024 Nawanshar 46 047 Patiala
47 048 Srimuktsar Sahib
Rajasthan
S.No. Exchange Code
Employment Exchanges
S.No. Exchange Code
Employment Exchanges
1 001 Ajmer 20 020 Kota
2 002 Alwar 21 021 Nagaur
3 003 Banswara 22 022 Pali
4 004 Barmer 23 023 Sikar
5 005 Bharatpur 24 024 Sirohi
6 006 Bhilwara 25 025 Sir-Ganganagar
7 007 Bikaner 26 026 Swai-Madhopur
8 008 Bundi 27 027 Tonk
9 009 Chittorgarh 28 028 Udaipur
10 010 Churu 29 029 Rajsamand
11 011 Dungurpur 30 030 Baran
12 012 Jaipur (Women) 31 031 Dosa
13 013 Jaipur (P&E) 32 032 Hanumangarh
14 014 Jaipur (PH) 33 037 Dholpur
15 015 Jaiselmer 34 038 Karouli
16 016 Jalore 35 039 U.E.I.G.B. Jaipur
17 017 Jhalawar 36 040 U.E.I.G.B. Jodhpur
18 018 Jhunjhunu 37 041 U.E.I.G.B. Udaipur
19 019 Jodhpur 38 042 U.E.I.G.B. Bikaner
SIKKIM
No Employment Exchange is functioning in this State.
Tamil Nadu
S.No. Exchange Code
Employment Exchanges
S.No. Exchange Code
Employment Exchanges
1 001 Chingleput (Kancheepuram) 19 019 Thanjavur
2 002 Coimbatore 20 020 Tiruchirapally (Trichy)
3 003 Cuddalore (Arcot) (Tech.) DEO-1
21 022 Tirunelveli
4 004 Dharmapuri (Krishnagiri) 22 023 Tuticorin (Thoothukudi)
5 005 Dindigul 23 024 Uthagamandlam (Nilgiris)
6 006 Erode 24 025 Vellore (North Arcot)
7 007 Chennai-40 (Anna-Nagar)(Santhome)
25 026 Sivaganga
8 008 Chennai North (Uns) 20 Adyar 26 027 Virudhunagar

Employment Exchange Statistics-2019
67
List of employment exchanges functioning in the country
9 009 Chennai (P&E) 17 27 028 Coimbatore (T.P.)
10 010 Chennai (Ph) Anna Nagar 28 029 Thiruvannamalai
11 011 Chennai (T.P) DEO, (Tech Personal) Ch.4
29 030 Thiruvallur
12 012 Madurai - 7 DEO (P&E) 30 031 Villupuram
13 013 Madurai (T.P) (Theni) DEO 31 032 Tiruvarur
14 014 Nagapattinam 32 033 Namakal
15 015 Nagercoil (K.Kumari) 33 034 Peramblur
16 016 Pudukottai 34 035 Karur
17 017 Ramanathapuram 35 36 Ariyalur
18 018 Salem-7 DEO Asstt. Director
Telangana
S.No. Exchange Code
Employment Exchanges
S.No. Exchange Code
Employment Exchanges
1 001 Adilabad 8 016 Mahboobnagar
2 007 Hyderabad (Clerc.& Tech.) 9 017 Nalgonda
3 008 Hyderabad (Labour) 10 019 Nizamabad
4 009 Hyderabad (PH) 11 021 Rangareddy
5 010 Hyderabd (P&E) 12 022 Sangareddy
6 013 Karimnagar 13 030 Warangal
7 014 Khammameth (Khamam) 14 041 U.E.I.G.B. Hyderabad
Tripura
S.No. Exchange Code
Employment Exchanges
S.No. Exchange Code
Employment Exchanges
1 001 Agartala 4 004 Udaipur
2 002 Agartala (PH) 5 005 Ambasa
3 003 Kailashahr
Uttarakhand
S.No. Exchange Code
Employment Exchanges
S.No. Exchange Code
Employment Exchanges
1 001 Almora 13 014 Tehri-Garhwal
2 002 Chamoli 14 015 Udhamsingh Nagar
3 003 Dehradun 15 016 Uttarkashi
4 004 Haldwani 16 017 Rudraprayag
5 005 Hardwar 17 018 Dehradun (PH)
6 006 Kalsi (SC/ST) 18 019 Champawat
7 007 Kashipur 19 020 Bageshwar
8 008 Lansdowne 20 021 Ramnagar

Employment Exchange Statistics-2019
68
List of employment exchanges functioning in the country
9 009 Nainital 21 151 U.E.I.G.B.Hardwar (Gurukulkangri)
10 011 Pauri (Gharwal) 22 152 U.E.I.G.B. Nainital
11 012 Pithoragarh 23 153 U.E.I.G.B. Roorkee
12 013 Ranikhet 24 154 U.E.I.G.B. Srinagar Garhwal
Uttar Pradesh
S.No. Exchange Code
Employment Exchanges
S.No. Exchange Code
Employment Exchanges
1 001 Agra 51 051 Mathura (PH)
2 002 Agra (PH) 52 052 Meerut
3 003 Aligarh 53 053 Mirzapur
4 004 Aligarh (PH) 54 054 Modinagar
5 005 Allahabad 55 055 Moradabad
6 006 Allahabad (PH) 56 056 Muzaffarnagar
7 007 Ambedkar nagar 57 057 Orai
8 008 Azamgarh 58 058 Pilibhit
9 009 Banda 59 059 Pratapgarh
10 010 Badaun 60 060 Rai Bareilly
11 011 Ballia 61 061 Rampur
12 012 Barabanki 62 062 Sant Ravi das nagar
13 013 Bareilly 63 063 Robertganj (Sonbhadrah)
14 014 Bareilly (PH) 64 064 Saharanpur
15 015 Basti 65 065 Shahjahanpur
16 016 Behraich 66 066 Siddarthnagar
17 017 Bijnore 67 067 Sitapur
18 018 Bulandshar 68 068 Sultanpur
19 019 Deoria 69 069 Surajpur
20 020 Etah 70 070 Unnao
21 021 Etawah 71 071 Varanasi
22 022 Faizabad 72 072 Varanasi (PH)
23 023 Fatehgarh 73 073 Padrona (Kushinagar)
24 024 Fatehpur 74 074 Azamgarh (PH)
25 025 Ferozabad 75 075 Faizabad (PH)
26 026 Ghaziabad 76 076 Mirzapur (PH)
27 027 Ghaziabad (PH) 77 077 Moradabad (PH)
28 028 Gazipur 78 078 Jhansi (PH)
29 029 Ghatampur 79 079 Meerut (PH)
30 030 Gonda 80 080 Janpad Koshambi at Allahabad
31 031 Gorakhpur 81 081 U.E.I.G.B. Agra
32 032 Gorakhpur (PH) 82 082 U.E.I.G.B. Aligarh
33 033 Hamirpur 83 083 U.E.I.G.B. Allahabad
34 034 Hardoi 84 084 U.E.I.G.B. Bareilly (Ruhelkhand)
35 035 Hathras (Mahamaya Nagar) 85 085 U.E.I.G.B. Faizabad
36 036 Hapur 86 086 U.E.I.G.B. Gorakhpur
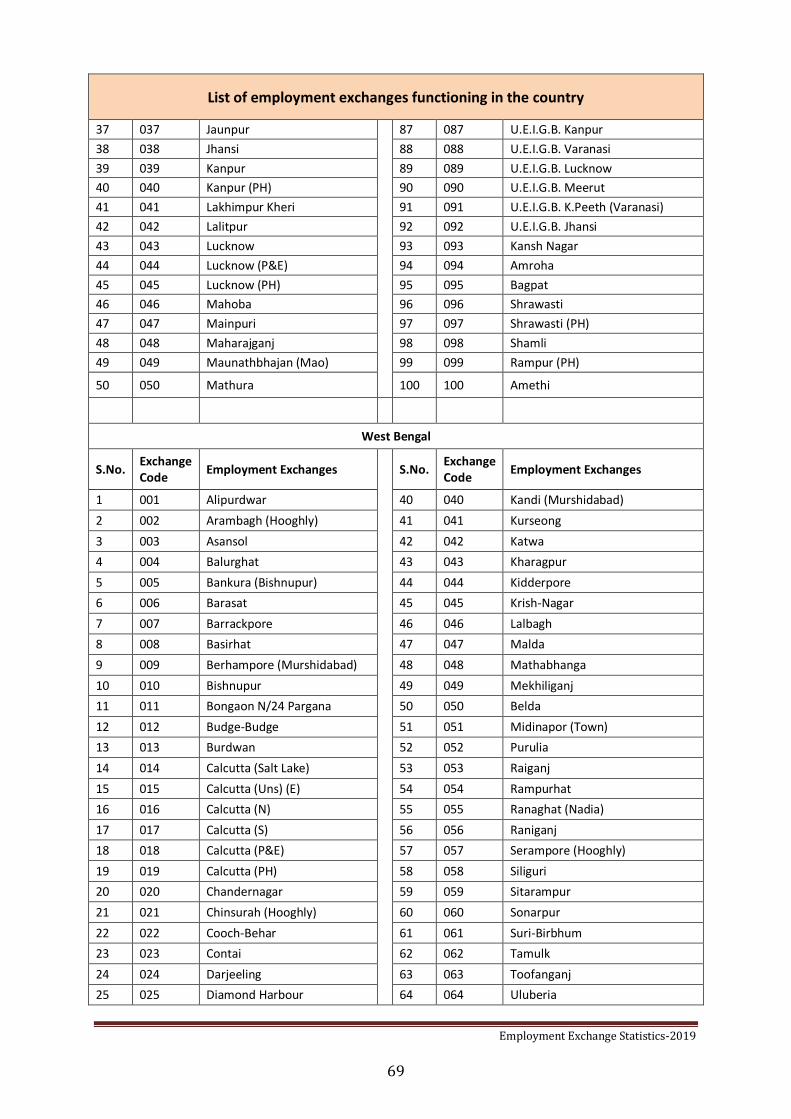
Employment Exchange Statistics-2019
69
List of employment exchanges functioning in the country
37 037 Jaunpur 87 087 U.E.I.G.B. Kanpur
38 038 Jhansi 88 088 U.E.I.G.B. Varanasi
39 039 Kanpur 89 089 U.E.I.G.B. Lucknow
40 040 Kanpur (PH) 90 090 U.E.I.G.B. Meerut
41 041 Lakhimpur Kheri 91 091 U.E.I.G.B. K.Peeth (Varanasi)
42 042 Lalitpur 92 092 U.E.I.G.B. Jhansi
43 043 Lucknow 93 093 Kansh Nagar
44 044 Lucknow (P&E) 94 094 Amroha
45 045 Lucknow (PH) 95 095 Bagpat
46 046 Mahoba 96 096 Shrawasti
47 047 Mainpuri 97 097 Shrawasti (PH)
48 048 Maharajganj 98 098 Shamli
49 049 Maunathbhajan (Mao) 99 099 Rampur (PH)
50 050 Mathura 100 100 Amethi
West Bengal
S.No. Exchange Code
Employment Exchanges
S.No. Exchange Code
Employment Exchanges
1 001 Alipurdwar 40 040 Kandi (Murshidabad)
2 002 Arambagh (Hooghly) 41 041 Kurseong
3 003 Asansol 42 042 Katwa
4 004 Balurghat 43 043 Kharagpur
5 005 Bankura (Bishnupur) 44 044 Kidderpore
6 006 Barasat 45 045 Krish-Nagar
7 007 Barrackpore 46 046 Lalbagh
8 008 Basirhat 47 047 Malda
9 009 Berhampore (Murshidabad) 48 048 Mathabhanga
10 010 Bishnupur 49 049 Mekhiliganj
11 011 Bongaon N/24 Pargana 50 050 Belda
12 012 Budge-Budge 51 051 Midinapor (Town)
13 013 Burdwan 52 052 Purulia
14 014 Calcutta (Salt Lake) 53 053 Raiganj
15 015 Calcutta (Uns) (E) 54 054 Rampurhat
16 016 Calcutta (N) 55 055 Ranaghat (Nadia)
17 017 Calcutta (S) 56 056 Raniganj
18 018 Calcutta (P&E) 57 057 Serampore (Hooghly)
19 019 Calcutta (PH) 58 058 Siliguri
20 020 Chandernagar 59 059 Sitarampur
21 021 Chinsurah (Hooghly) 60 060 Sonarpur
22 022 Cooch-Behar 61 061 Suri-Birbhum
23 023 Contai 62 062 Tamulk
24 024 Darjeeling 63 063 Toofanganj
25 025 Diamond Harbour 64 064 Uluberia

Employment Exchange Statistics-2019
70
List of employment exchanges functioning in the country
26 026 Dinhata 65 065 Chanchel
27 027 Dum-Dum 66 066 Bholpur
28 028 Durgapur 67 067 Khathra
29 029 Farrakha Project 68 068 Raghunathpur
30 030 Ghatal 69 069 Kakdweep
31 031 Haldia Project 70 070 Canning
32 032 Howrah 71 071 Egra
33 033 Islampur 72 072 Mal
34 034 Jalpaiguri (Murshidabad) 73 073 Domkal (Murshidabad)
35 035 Jangipur 74 080 U.E.I.G.B. Burdwan
36 036 Jhargram 75 081 U.E.I.G.B. Calcutta
37 037 Kalimpong 76 082 U.E.I.G.B. Calcutta (RBU)
38 038 Kalna 77 083 U.E.I.G.B. Jhadavpur
39 039 Kalyani (Nadia)
A & N Island
S.No. Exchange Code
Employment Exchanges
S.No. Exchange Code
Employment Exchanges
1 001 Port-Blair - - -
Chandigarh
S.No. Exchange Code
Employment Exchanges
S.No. Exchange Code
Employment Exchanges
1 001 Chandigarh 2 002 U.E.B. Chandigarh
D & N Haveli
S.No. Exchange Code
Employment Exchanges
S.No. Exchange Code
Employment Exchanges
1 001 Silvassa - - -
Daman & Diu
S.No. Exchange Code
Employment Exchanges
S.No. Exchange Code
Employment Exchanges
1 001 Daman 2 002 Diu
Lakshadweep
S.No. Exchange Code
Employment Exchanges
S.No. Exchange Code
Employment Exchanges
1 001 Kavaratti - - -

Employment Exchange Statistics-2019
71
List of employment exchanges functioning in the country
Puducherry
S.No. Exchange Code
Employment Exchanges
S.No. Exchange Code
Employment Exchanges
1 001 Puducherry - - -
NOTE: * Duplicate cards are maintained

Employment Exchange Statistics-2019
72
ADDRESSES OF STATE/UTs EMPLOYMENT DIRECTORATE
1. ANDHRA PRADESH Commissioner/Director, Employment & Training, Government of Andhra Pradesh, Govt. ITI Campus, Ramesh Hospital Road, Polytechnique (P.O.), Vijaywada-520008, (Distt. Krishna)
2. ARUNACHAL PRADESH
Labour Commissioner, Directorate of Employment, Department of Labour & Employment, Government of Arunachal Pradesh, Naharlagun-791110
3. ASSAM Director, Directorate of Employment & Craftsmen Training, Govt. of Assam, A.K. Azad Road, Rehabari, Guwahati-781008, Assam
4. BIHAR Director, Directorate of Employment & Training, Government of BiharVikas Bhawan Sachivalaya (Empt. Wing), Patna-800015
5. CHHATTISGARH Director, Directorate of Employment & Training Govt. of Chhattisgarh,Women Polytechnic Compound, Barran Bazar, Raipur- (Chhattisgarh)
6. DELHI Director, Directorate of Employment, Govt. of NCT of Delhi, 15-Rajpur Road, Delhi-110054
7. GOA Commissioner, Labour and Employment, Govt. of Goa, Shram Shakti Bhawan, 2nd floor, Patto Plaza, Panaji
8. GUJARAT Director, Directorate of Employment & Training, Block no. 1/8, 3rd Floor,Dr. Jivraj Meheta Bhavan, Gandhi Nagar, Gujarat
9. HARYANA Director, Department of Employment, Govt. of Haryana, Bays no.55-58, Sector-2, Panchkula.
10. HIMACHAL PRADESH
Labour Commissioner-cum, Director of Employment, Department of Labour and Employment, Govt. of Himachal Pradesh, New Himrus Bhawan, Circular Road, Shimla-171001
11. JAMMU &KASHMIR
The Director, Directorate of Employment, Govt. of J&K, 38 A Samandar bagh, Exchange Road, Srinagar-190001
12. JHARKHAND Director, Directorate of Employment & Training, Govt. of Jharkhand,Nepal House, Dorenda, Ranchi-834001
13. KARNATAKA Director, Directorate of Employment & Training, Govt. of Karnataka, No. 9/1, Sri Prashnath Complex, P. Kalingarao Road, Bangalore-560027
14. KERALA Director, Directorate of Employment & Training, Jagathy, Thycaud P.O., Thiruvanathapuram-695014
15. MADHYA PRADESH
Director, Directorate of Employment, Govt. of Madhya Pradesh,6th floor, Vindyachal Bhawan, Bhopal
16. MAHARASHTRA Commissioner, Employment & Self Employment, Govt. of Maharashtra,3rd floor, Konkan Bhawan Annexe, C.B.D. Belapur, Navi Mumbai-400614,
17. MANIPUR Director, Director of Employment, Govt. of Manipur, Employment Exchange Complex, Lamphelpat, Manipur-795004
18. MEGHALAYA Labour Commissioner & Director, Directorate of Employment & Craftsmen Training, Govt. of Meghalaya, Nigrum Bldg., Lower Lachumiere,Shilling-793001
19. MIZORAM Director, Directorate of Employment & Labour, Govt. of Mizoram,Republic Road, Aizwal-797001
20. NAGALAND Director, Directorate of Employment, Skill Development & Entrepreneurship, Govt. of Nagaland, Kohima-797001
21. ODISHA Director, Directorate of Employment, Govt. of Odisha, Niyojan Bhawan, Unit-3, Kharvsela Nagar, Bhubaneshwar-751001

Employment Exchange Statistics-2019
73
22. PUNJAB Director, Directorate of Employment, Govt. of Punjab, SCO No.47/2, Sector 17-E, Chandigarh-160016
23. RAJASTHAN Director, Directorate of Employment, Govt. of Rajasthan, Darbar School Parisar, Gopinath Marg, Jaipur (Rajasthan)
24. SIKKIM No Employment Exchange is working.
25. TAMIL NADU Commissioner, Commissionerate of Employment & Training, Govt. of Tamilnadu, Alandur Road Guindy, Chennai-600032
26. TELANGANA Director, Employment & Training, B.R.K. Bhavan 4th Floor, Tankbund Road, Hyderabad-
27. TRIPURA Director, Directorate of Employment Service & Manpower Planning, Office Lane, Agartala -799001, Tripura
28. UTTARAKHAND Director, Directorate of Employment & Training, Govt. of Uttarakhand,Nainital Road, Uttarakhand
29. UTTAR PRADESH Director, Directorate of Employment & Training, Govt. of Uttar Pradesh, U.P. Rozgar Bhawan, Guru Govind Singh Marg, Basmabndi Chowk, Lucknow-226001
30. WEST BENGAL Director, Directorate of Employment, Govt. of West Bengal, 67, Bentinck Street, 4th floor, Kolkata-110069
31. A. & N. ISLANDS Director, Directorate of Employment & Training, Andaman & Nicobar Administration, Dollygunj, Port Blair-
32. CHANDIGARH Director, Directorate of Employment, Chandigarh Administration, Regional Employment Exchange, Sector-17, U.T. Chandigarh
33. D. & N. HAVELI Collector & Directorate of Employment, UT Administration of Dadra and Nagar Haveli, Collectorate, Silvassa-396230
34. DAMAN AND DIU Development Commissioner, U.T. Administration, U.T. of Daman & Diu,Moti Daman-396220
35. LAKSHADWEEP Director, District Employment Officer, Administration of the U.T. of Lakshadweep, Kavaratti-682555
36. PUDUCHERRY Director, Directorate of Employment & Training, Govt. of Puducherry,Labour Complex, Vazhudavour Road, Thattanchavady Post Office, Gandhinagar, Puducherry-605009


![Mba employment statistics[1]](https://img.pdfslide.us/doc/110x75/54c190cc4a795995228b4656/mba-employment-statistics1.jpg)