Embed Size (px)
Citation preview
Employee Treatment, Labor Investment Efficiency andFirm Performance
This version: November 30, 2017
Abstract
Using a sample of 20,583 US firm-year observations that represents more than 3,000individual firms over the period of 1995 to 2015, we investigate the link between em-ployee treatment and labor investment efficiency. We argue that firms reduce informa-tion asymmetry by signalling its ability to honor implicit claims via employee-friendlytreatment policies and predict that firms with better employee treatment performancehave a higher level of labor investment efficiency. Our empirical results confirm ourprediction. We find strong and robust evidence that firms with more employee-friendlypractices have a lower level of abnormal net hiring. Moreover, we find employee treat-ment concerns distort normal labor hiring and specifically lead to underinvestment inlabor, thus lowering firms labor investment efficiency. Finally, we find employee-friendlytreatment facilitates higher labor productivity and profitability whereas abnormal nethiring reduces labor productivity and profitability. Taken together, our findings high-light the important role of employee treatment in contributing to firms investmentbehaviour and value creation.
Keywords : Employee Treatment; Employee Welfare; Labor Investment Efficiency; Invest-ment Efficiency; Employee Governance

1. Introduction
Irrespective of the company size, employees usually are argued as a firm’s most valuable
asset and a critical source of corporate success. For example, Larry Page, the CEO of
Google, in an interview with Fortune magazine said that ‘It’s important that the company
be a family, that people feel that they’re part of the company, and that the company is like
a family to them. When you treat people that way, you get better productivity. Rather than
really caring what hours you worked, you care about output. We should continue to innovate
in our relationship with our employees and figure out the best things we can do for them.’
In today’s labor market, as the development of knowledge-based industries, firms become
more human-capital-intensive and employees are the key source of value creation. Numerous
prior studies find labor-friendly corporate practices are positively associated with better
firm performance (Edmans, 2011, 2012; Ertugrul, 2013; Faleye and Trahan, 2011). Recent
studies in employee treatment investigate how a firm’s labor-friendly corporate practices can
influence its innovation, financial policies and capital structure decisions (Bae, Kang, and
Wang, 2011; Chemmanur, Cheng, and Zhang, 2013; Chen, Chen, Hsu, and Podolski, 2016;
Ghaly, Dang, and Stathopoulos, 2015; Serfling, 2016) whereas very little is known about
the impact of employee treatment on firms’ employment decisions, and in particular labor
investment efficiency.
Finance research has long shown that agency conflicts and information asymmetry be-
tween managers and outsiders lead firms to undertake suboptimal levels of investment. A
number of recent studies have explored the factors that can mitigate such market imperfec-
tions and improve investment efficiency (Biddle and Hilary, 2006; Biddle, Hilary, and Verdi,
2009; Healy and Palepu, 2001; Lambert, Leuz, and Verrecchia, 2007).We follow this line of
research by extending capital investment efficiency to the investment efficiency in labor, an
important factor of production that has been largely overlooked by previous literature.
We posit that employee treatment help firms to lower information asymmetry and em-
ployee adverse behavior, which helps firms to maintain net hiring that is closer to a level
justified by firms underlying economics and to be less subject to the labor adjustment costs,
thus having more efficient investments in labor. An examination of the relationship between
employee treatment and labor investment efficiency is particularly interesting in this context
for two reasons. First, in today’s competitive labor market, firms become more human-
capital-intensive and maintaining high commitments to employees’ welfare in addition to
variable wage becomes more crucial for firms to obtain human capital. Echoing this trend,
numerous recent studies have increasingly paid attention to the influence of employee treat-
ment on firms’ capital structure decisions and financial policies (Bae et al., 2011; Chemmanur
1
et al., 2013; Chen et al., 2016; Ghaly et al., 2015; Serfling, 2016). Second, Benlemlih and
Bitar (2015) provide an evidence that a firms social performance can positively contribute
to its investment efficiency owing to low information asymmetry and high stakeholder sol-
idarity. However, their study looks at the investment efficiency in capital expenditure and
focuses mainly on general CSR instead of employee treatment. Despite the classical view
considers labor as a variable factor that does not involve any adjustment costs and therefore
the financing imperfections caused by information asymmetry is irrelevant for employment
decisions, a large number of labor economics studies have suggested that labor frictions not
only exist but the costs associated with labor adjustment can be substantial (Danthine and
Donaldson, 2002; Diamond, 1982; Mortensen and Pissarides, 1994; Yashiv, 2007). We follow
this line of literature and address the gap in the literature about whether the labor-relevant
dimension of social performance, namely, employee-friendly treatment policies can improve
firms’ efficiency in labor investment. In addition, we further address the economic implica-
tion of employee treatment and abnormal net hiring on firms’ value creation by investigating
the impact of employee treatment and labor investment efficiency on labor productivity and
profitability. In light of previous literature suggesting that employee-friendly policies can
positively influence value creation, we posit that firms treating their employees well enjoy
higher labor productivity and profitability whereas a high deviation from a firms employ-
ment level justified by its underlying economics deteriorate a firms labor productivity and
profitability.
In order to examine the relation between employee treatment and labor investment ef-
ficiency, we follow previous studies (Pinnuck and Lillis, 2007; Jung, Lee, and Weber, 2014)
and use firms’ net hiring (percentage change in the number of employees) to proxy for in-
vestment in labor. For our primary analyses, the expected level of net hiring is based on the
model of Pinnuck and Lillis (2007), which includes economic variables that explain normal
hiring practices, such as sales growth, liquidity, leverage, and profitability. Thus, our mea-
sure of abnormal net hiring captures the amount of net hiring not attributable to underlying
economic factors.
Our employee treatment measure is obtained from MSCI ESG Research which formerly
known as KLD database. The KLD database has been extensively employed in a large
number of previous studies in employee welfare (Bae et al., 2011; Cronqvist, Heyman, Nils-
son, Svaleryd, and Vlachos, 2009; Ertugrul, 2013; Faleye and Trahan, 2011; Ghaly et al.,
2015; Verwijmeren and Derwall, 2010). We construct our employee treatment scores by us-
ing certain KLD’s rating on ‘Employee Relations’, with a higher net scores demonstrating
better employee treatment. Our primary measure of employee treatment, EMP TREAT, is
estimated by summing identified strengths and subtracting identified concerns included in
2
‘Employee Relations’ dimensions in a given year (Faleye and Trahan, 2011; Verwijmeren and
Derwall, 2010). Following Ertugrul (2013) and Ghaly et al. (2015), we also include the
‘Work/Life Benefits’ variable from the ‘Diversity’ dimension.
Our results are consistent with the notion that employee treatment facilitates more effi-
cient investments in labor. In particular, firms’ employee treatment performance is negatively
associated with absolute abnormal net hiring. This result holds across different measures of
employee treatment and expected net hiring, and it is robust to controlling for various other
factors that might affect the efficiency of net hiring practices, including other concurrent
investments, labor power, institutional shareholdings, corporate governance and financial
reporting quality. We also provide evidence on the association between employee treatment
and specific forms of inefficiencies. In particular, we examine overinvestment (actual net
hiring greater than expected) and underinvestment (actual net hiring less than expected)
and find that each specific type of inefficiency is mitigated by employee-friendly treatment.
In addition, our results also find employee-friendly treatment facilitate higher labor produc-
tivity and profitability whereas labor investment inefficiency in form of abnormal net hiring
lowers labor productivity and profitability.
Our results contribute to the literature in several ways. First, to the best of our knowl-
edge, this is the first paper to investigate the relationship between employee treatment and
labor investment efficiency. The results of our research suggest that firms with employee-
friendly treatment policies are associated with more efficient labor investments in general.
Based on stakeholder theory and modern human capital theory of corporate governance, we
interpret our results that firms with employee-friendly treatment schemes mitigate market
friction caused by information asymmetry and mitigates employee moral hazard problems by
providing more efficient contracting with employee-friendly treatment embedded. Second,
previous literature emphasizes more on the role of financial reporting in improving invest-
ment efficiency (Biddle and Hilary, 2006; Biddle et al., 2009; Beatty and Liao, 2014; Jung
et al., 2014; Lara, Osma, and Penalva, 2016), but only few studies investigate labor invest-
ment efficiency. Jung et al. (2014) find that higher-quality financial reporting contributes
to more efficient investment in labor. Our study complements their research and suggests
that firm-level employee treatment policies also have an important implication for firm-level
employment decisions and the consideration for efficient allocation of corporate resource to
labor aspect. Third, Servaes and Tamayo (2013) suggest that employee channel of CSR can
be a fruitful area for empirical research in CSR. Our study specifically investigates one of
the integral part of CSR, employee treatment, and its impact on labor investment efficiency
and find that employee-friendly treatment positively contribute to employee productivity
whereas abnormal net hiring negatively affect employee productivity. Fourth, Benlemlih
3
and Bitar (2015) find better social performance improves corporate investment efficiency
in capital expenditure. Our analysis is different from that of Benlemlih and Bitar (2015)
from two aspects. First, we focus on employee treatment, a particular dimension of cor-
porate social performance, to examine the benefits of employee-friendly practices. Second,
unlike Benlemlih and Bitar (2015) that focuses on firms’ capital investment efficiency, our
study emphasizes on investment efficiency in labor. Hence, we contribute to this stream
of literature by extending capital investment efficiency to labor investment efficiency. Fi-
nally, our study contributes to the recent literature of employee treatment and address the
economic implication of employee treatment and labor investment efficiency for firms’ value
creation.
In the next section, we discuss the related literature and develop our hypotheses. In
Section 3, we describe our research design and empirical models and in Section 4 we present
results. In Section 5, we provide a range of robustness tests and a summary of our findings
and concluding remarks appear in Section 6.
2. Literature review and hypothesis
2.1. Market frictions and capital investment efficiency
In the frictionless capital market of Modigliani and Miller (1958) paradigm, the marginal
Q ratio is the sole drive of capital investment policy. Under the Modigliani and Miller (1958)
paradigm, firms invest until the marginal benefit of capital investment equal the marginal
costs and firms only invest in projects with positive net present value. In practice, however,
firms need to face capital market imperfections stemming from information asymmetry and
there is a possibility that firms may depart from the optimal level and either over- or under-
invest owing to the capital market frictions (Stein, 2003). Specifically, managers may invest
inefficiently by making bad investment selections in order to expropriate firms’ existing re-
sources, thus leading to overinvestment. On the contrary, firms may withdraw from projects
with positive NPV owing to costly cost of capital if they face financing constraints, thus
leading underinvestment.
Previous literature has identified the issues of moral hazard and adverse selection are the
two primary imperfections in the market that make firms depart from the optimal investment
level. First, managers may pursue certain self-serving objective to maximize their own
personal welfares and therefore may invest in projects that are not in line with the objective
of shareholder maximizations (Jensen and Meckling, 1976).Moral hazard can contribute to
either over- or underinvestment depending on the availability of capital. On one hand,
4

overinvestments are more likely to occur if firms have resource to invest. In that case,
managers have incentives to consume perquisites and engage in empire building (Jensen,
1986; Richardson, 2006).On the other hand, underinvestment occur when suppliers of capital
concern the moral hazard problem and therefore tend to ration capital ex-ante or managers
prefer to have peaceful life so that projects with positive NPV are given up (Bertrand and
Mullainathan, 2003; Lambert et al., 2007).
Adverse selection can be attributed to the existence of information asymmetry between
managers and outside suppliers of capital, which may also affect the efficiency of capital in-
vestment. If managers are better informed about the value of firms’ securities than investors,
they are more likely to time capital issuance in order to issue overpriced securities (Baker,
Stein, and Wurgler, 2003). However, investors may respond to their information disadvan-
tage by discounting new issuance of securities and charging a higher cost of capital. If
managers are reluctant to raise funds at a discounted price, projects with positive NPV
will be renounced and underinvestment occurs (Myers and Majluf, 1984). Overall, previous
literature suggests that the capital market in reality is not frictionless and capital market
imperfections stemming from information asymmetry between firms and suppliers of capital
can cause firms to deviate from the optimal level, thus leading to either overinvestment or
underinvestment.
2.2. Employee treatment and labor investment efficiency
As one of the most critical nonfinancial stakeholders and corporate assets, employees have
a significant influence on a firm’s success and recent studies have increasingly paid attention
to firms’ employee treatment schemes and its relevance to firm performance. Previous studies
shows that firms with better employee treatment schemes are usually associated with better
performance (Edmans, 2011, 2012; Ertugrul, 2013; Faleye and Trahan, 2011). For example,
Edmans (2011) finds that firms with satisfied employees exhibit considerably more positive
earnings surprises and announcement returns, showing that employee satisfaction has a pos-
itive influence on firms’ long-term stock returns. Chen et al. (2016) find that firms treating
their employees well produce more and better patents through improving employee satis-
faction and teamwork, which suggests that better employee treatment schemes are in line
with the benefits of shareholders. Recently, a number of studies also examine the impact of
employee treatment on firms’ capital structure decisions and financial policies. Specifically,
several studies test the predictions of Titman (1984) by studying the relationship between
leverage and employee treatment. For example, Chemmanur et al. (2013) find that leverage
has a positive and significant influence on average employee pay and the incremental total
5
labor expenses associated with an increase in leverage offset the incremental tax benefits of
debt, thus supporting the theoretical prediction that labor costs constrain the use of debt.
Similarly, Bae et al. (2011) find firms treating their employees well maintain low debt ratio
and suggest firms’ incentive to treat their employee well is an important determinant of
their financing policies. Moreover, Serfling (2016) finds that firms adopting state-level labor
protection laws that exogenously increase employee firing costs reduce their debt ratios. In
addition to the firm leverage, prior studies also find firms with better employee treatment
schemes and operating in industries with a higher share of skilled workers tend to hold larger
cash balances (Ghaly et al., 2015; Ghaly, Dang, and Stathopoulos, 2017). Broadly speaking,
corporate social responsibility, of which employee welfare and treatment is considered as one
of the integral parts, also has been found to reduce information asymmetry (Dhaliwal, Li,
Tsang, and Yang, 2011; Cho, Lee, and Pfeiffer, 2013), and analyst forecast error (Dhaliwal,
Radhakrishnan, Tsang, and Yang, 2012) and increase financial reporting quality (Kim, Park,
and Wier, 2012) and investment efficiency (Benlemlih and Bitar, 2015).
Prior studies on employee treatment mainly focus on the impact of employee treatment
on firms’ capital structure decisions and financial policies while previous financial literature
on market frictions and investment efficiency mainly focus on capital investment. Hence,
there is a lack of attention to market frictions and investment efficiency in labor in previous
accounting literature as well as the potential influence of employee treatment on labor in-
vestment efficiency. Jung et al. (2014) fill the gap by investigating the impact of financial
reporting quality on labor investment efficiency and find that high-quality financial reporting
improves investment efficiency in labor by lowering market frictions stemming from informa-
tion asymmetry between managers and suppliers of capital. Our study focus on employee
treatment and examines whether employee-friendly treatment helps the firm to maintain net
hiring that is close to the level justified by a firm’s underlying economics. We argue the
relation between employee treatment and firms’ net hiring likely stems from two potential
channels, information asymmetry and employees’ adverse behavior.
First, we argue one possible explanation for the connection between employee treatment
and firms’ net hiring can stem from information asymmetry. Previous literature recognizes
that friction do exist in the market and one of the most pervasive source of friction comes
from information asymmetry. In terms of labor friction, while the classical view considers
labor as a variable factor that does not involve any adjustment costs and financing because
the timing of labor costs is perfectly matched with the benefits they create, previous labor
economics studies find that despite wages can be largely treated as variable in nature, labor
frictions in fact exist in terms of search and matching (Diamond, 1982; Mortensen and
Pissarides, 1994), wage (Danthine and Donaldson, 2002) and hiring and firing (Yashiv, 2007).
6
Moreover, the existence of other fixed components in labor costs such as recruiting costs,
training costs, firing costs and disruption costs suggest that adjusting labor stock for firms
is not costless the costs associated with adjusting its labor force can be substantial (Farmer,
1985; Hamermesh, 1993). As firms become more human-capital-intensive under today’s
competitive business environment, maintaining high commitments to employees’ welfare in
addition to variable wage becomes more important for many firms to obtain human capital
as their most valuable assets (Turban and Greening, 1997; Zingales, 2000). Owing to the
existence of fixed components in labor costs, adjustment costs also apply to investments in
labor and financing labor costs is necessary for labor investments and thus labor investments
are also subject to inefficiencies caused information asymmetry between managers and the
outside suppliers of capital.
Stakeholder theory (Cornell and Shapiro, 1987) suggests that a firm need to satisfy not
only its financial stakeholders with explicit claims (e.g shareholders, bondholders) but also
its non-financial stakeholders with implicit claims. Prior literature suggests stakeholders are
more likely to increase more costly explicit claims if they doubt a firm’s ability to honor
its implicit claims and a firm’s value can be affected by its reputation for honoring implicit
claims of non-financial stakeholders (Cornell and Shapiro, 1987; Maksimovic and Titman,
1991). Zingales (2000, p. 1634) argues: ‘Once we recognize the existence of implicit contracts,
then there are other residual claimants besides equity holders who may need to be protected.
It then becomes unclear whether control should reside in the hands of shareholders, because
the pursuit of shareholder’s value maximization may lead to inefficient action, such as the
breach of value implicit contracts’. From labor perspective, a firm’s failure of achieving a
good relationship with its employees can lead to low employee morale and high employee
turnover, which can ultimately erodes the firm’s reputation in the labor market. Stuebs and
Sun (2010) find that corporate reputation is associated with improved labor efficiency and
labor productivity and therefore has important implication for corporate social activities and
initiatives. On the contrary, the adverse reputation in employee relationship is likely to make
other non-financial stakeholders cast doubt to the firm’s ability to honor their implicit claims
and lead to a reduction in the value of implicit claims sold to new stakeholders, resulting in
a reduction in future cash flows and the value of the firm (Bowen, DuCharme, and Shores,
1995; Cornell and Shapiro, 1987). Prior studies find that firms having harmonious relations
with their stakeholders enjoy higher value of implicit claims sold to its stakeholders and
its future cash flows and firm value are less likely to be adversely affected by unsatisfied
non-financial stakeholders, thus leading to a lower cost of financing (Cheng, Ioannou, and
Serafeim, 2014; Dhaliwal et al., 2011; El Ghoul, Guedhami, Kwok, and Mishra, 2011). In
this respect, firms’ employee-friendly treatment convey additional information to the market
7

about their ability to honor implicit claims, which ultimately helps firms to reduce adverse
selection problems and lower the information asymmetry between corporate managers and
market participants that creates market friction.
Moreover, current human capital theory of corporate governance emphasizes on the im-
portance of shifting from the classical agency problem between manager and shareholder
to examine human capital treatment for corporate governance (Rajan and Zingales, 1998,
2000; Zingales, 2000). For instance, Guo, Huang, Zhang, and Zhou (2015) find that employee
treatment policies are an important predictor of ineffective internal control and firms with
employee-friendly policies enjoy significantly lower propensity for employee-related material
weaknesses. From this perspective, firms with employee-friendly treatment policies are more
likely to have reliable internal control and better corporate governance from employee aspect.
By aligning the interest between firms and their employees, firms with employee-friendly
treatment mitigates moral hazard problems by enabling more effective internal monitoring,
thus contributing to lower information asymmetry.
The second potential mechanism via which employee treatment affect firms’ net hiring can
stem from employee governance. Previous literature shows that employment contracts are
generally incomplete because it is too costly to govern all aspect of labor performance (Dem-
ski and Feltham, 1978; Klein, 1980). Divergence also exists among different groups in society
regarding employee monitoring since each advocate has its own rationale for or against em-
ployee monitoring whether it be economic, legal or ethical (Martin and Freeman, 2003). In
reality, firm face various employee adverse behavior situations where the interests of em-
ployees and the firm are misaligned and employees’ motivation and effort are imperfectly
observed (Flammer and Luo, 2017). Examples of employee adverse behaviour can be those
counterproductive behaviour and disengaged behaviour, such as shirking responsibilities, on-
the-job searches for better jobs and using company resources for personal business and so on.
Flammer and Luo (2017) suggest that if employees perceive their current job to be superior
in comparison to their alternative options, they are less likely to engage in adverse behavior.
One way to lower the attractiveness of alternative options and mitigate employee adverse
behavior is to align employees with their firms’ interest. Akerlof (1982) and Akerlof and
Yellen (1986, 1990) suggest that the reciprocity in the gift exchange model makes employee
invest more effort in work because employees treat the benefits from their firms as a gift and
are assumed to respond to the benefits by reciprocating their firms with a gift of greater
effort. Moreover, employee-friendly treatment align the interests between employees and
their firms, which makes employees more likely to perceive their current employment special
and mitigate employee adverse behavior (Organ, 1997; Shapiro and Stiglitz, 1984; Akerlof
and Yellen, 1986). In addition to precuniary employee treatment, Flammer and Luo (2017)
8

find that relationship-based incentives such as CSR can be used as employee governance tool
to entail nurturing and constraining mechanism that facilitate firms to align the interests
between employees and their firms, lower the attractiveness of alternative options and di-
minish information asymmetry. In light of aforementioned literature above, we posit that
employee-friendly treatment mitigates employees’ adverse behavior and provides employees
to devote more efforts and firms with employee-friendly treatment therefore suffer less unex-
pected employment changes and are better informed of the net hiring level justified by their
underlying economics.
In light of the two channels above, we posit that firms with better employee treatment
schemes alleviate market friction caused by information asymmetry and mitigates employee
adverse behavior. Therefore, we predict that employee-friendly treatment schemes enable
firms to have employment level that is close to the level justified by their underlying eco-
nomics and therefore firm’s employee treatment is negatively associated with labor invest-
ment inefficiency. Following the above discussion, we develop the following hypothesis:
HYPOTHESIS 1: Employee treatment is negatively associated with labor investment
inefficiency.
In addition, we also examine the impact of employee treatment and abnormal net hiring
on a firms employee productivity. Numerous previous studies show that companies’ social
efforts including employee-friendly practices can facilitate higher labor productivity (Faleye
and Trahan, 2011; Sun and Stuebs, 2013; Sanchez and Benito-Hernandez, 2015; Hasan,
Kobeissi, Liu, and Wang, 2016). For instance, Sanchez and Benito-Hernandez (2015) find
that firms’ social involvements in internal aspects of the company most contribute to a short-
term increase in labor productivity. Faleye and Trahan (2011) also find that top executives
derive no pecuniary benefits from labor-friendly practices and suggest that genuine concern
for employees facilitate higher productivity and profitability, showing that employee-friendly
treatment is beneficial for both employees and shareholders. We argue that one of the
potential channels via which employee treatment and labor investment efficiency can affect
value creation is via labor productivity and therefore we examine the impact of employee
treatment and abnormal net hiring on labor productivity. Given previous literature suggests
that employee-friendly policies can positively influence value creation, we posit that firms
treating their employees well enjoy higher labor productivity. On the contrary, a larger
magnitude of abnormal net hiring suggests a higher deviation from a firms employment level
justified by its underlying economics and signals inefficient labor investment and we predict
that abnormal net hiring has negative impact on a firms employee productivity. Therefore,
we predict there is a positive relation between employee treatment and labor productivity
9

and a negative relation between abnormal net hiring and labor productivity. Following the
above discussion, we also develop the following hypothesis:
HYPOTHESIS 2: Employee treatment is positively associated with employee pro-
ductivity whereas labor investment inefficiency is negatively associated with employee pro-
ductivity.
3. Research design
3.1. Sample
Our sample selection process is detailed in Table 1. The sample selection begins with all
COMPUSTAT firm-year between 1991-2016 with non-negative sales and asset observations
and nonmissing historical SIC codes. We merge our data with CRSP to obtain total annual
stock return and also exclude firm-year observations associated with firms in financial ser-
vices (primary two-digit SIC codes between 60-69). We further delete 24,257 firm-years with
insufficient data for use to estimate abnormal net hiring in Model 1. This leaves us with
96,221 observations to estimate our Model 1. After merged with KLD database, our sample
consists of an unbalanced panel of 20,583 firm-year observations from more than 3,000 US
firms over the period of 1995 to 2015. Our final sample for the estimation of our baseline
regression includes all firms that meet the following criteria: The firm is in the MSCI ESG
Research database, the firm is publicly traded and has financial data available from the
COMPUSTAT and security price and return information from Center for Research in Secu-
rity Prices (CRSP). We exclude firms in the financial industry (primary two-digit SIC code
between 60-69). We obtain the industry-level rate of industry unionization rate from the
website of UNIONSTATS which provides estimates of union membership and coverage data
by industry. In order to test the impact of employee treatment and abnormal net hiring on
employee productivity, we exclude 6,902 firm-years with insufficient data to compute Model
3, resulting in a test sample of 13,681 firm-years.
[Insert Table 1 near here]
3.2. Measure of labor investment efficiency
To measure labor investment, we use firms’ net hiring, as measured in the change in their
number of employees (Pinnuck and Lillis, 2007; Li, 2011). We then measure investment
10

inefficiencies using abnormal net hiring. We define abnormal net hiring as the difference
between the actual change in a firm’s labor force and the expected change based on funda-
mental economic factors and the absolute value of abnormal net hiring is the proxy for labor
investment inefficiency. A high value of abnormal net hiring indicates a high deviation of
actual labor investment from its expected value and therefore suggests a low level of labor
investment efficiency.
Our primary estimate of expected net hiring is based on the model of Pinnuck and Lillis
(2007), which is a regression of the percentage change in employees on several explanatory
variables capturing underlying economic fundamentals:
NET HIREit = β0+β1SALEGROWTHit−1+β2SALEGROWTHit+β3∆ROAit+β4∆ROAit−1
+ β5ROAit + β64RETURNit + β7SIZE Pit−1 + β8LIQit−1 + β9∆LIQit−1 + β10∆LIQit
+ β11LEVit−1 + β12LOSSBIN1it−1 + β13LOSSBIN2it−1 + β14LOSSBIN3it−1
+ β15LOSSBIN4it−1 + β16LOSSBIN5it−1 + Industry Dummies+ εit (1)
where:
NET HIRE = The percentage change in employees;
SALESGROWTH = The percentage change in sale revenue;
ROA = Net income scaled by beginning of the year total assets;
RETURN = The annual stock return for year t;
SIZE P = Log of market value of equity at the beginning of the year, ranked into per-
centiles;
LIQ = The ratio of cash and short-term investments plus receivables to current liabilities;
LEV = The ratio of long-term debt to total assets at the beginning of the year;
PROFITBIN = Indicator variables for each 0.005 interval of prior year ROA from 0 to
0.025;
LOSSBIN = Indicator variables for each 0.005 interval of prior year ROA from 0 to -0.025;
Consistent with Pinnuck and Lillis (2007) and Jung et al. (2014), we find NET HIREit is
positively associated with sale growth (SALEGROWTHit−1, SALEGROWTHit), profitability
(∆ROAit, ROAit−1), stock return (RETURNit), firm size (SIZEit−1), and liquidity (LIQit−1,
∆LIQit−1); negatively associated with current year changes in profitability (∆ROAit) and
small reported losses (LOSSBINit−1) variables; and for variables with potentially competing
effect, we find NET HIREit is negatively associated with liquidity (∆LIQit) and leverage
(LEVit−1). We report the descriptive statistics and results generated from Equation 1 in
11
Appendix.
After estimating Equation 1, we apply the estimated coefficients to each firm-year in our
sample to determine the expected level of net hiring. Our primary measure of abnormal net
hiring, AB NETHIRE, is the absolute difference between actual net hiring and the expected
level.
3.3. Measure of employee treatment
In order to assess a firm’s employee treatment, we obtain data from MSCI ESG Re-
search, which is the successor of Kinder, Lydenberg, Domini & Co. (KLD), innovest and
IRRC, which were acquired through MSCI’s acquisition of RiskMetrics. KLD specializes
in compiling rating of firms’ CSR performance and it started to track firms’ social perfor-
mance since 1991. Over time, KLD has expanded its coverage and included CSR strengths
and weaknesses for a large subset of its constituent firms. The database covers firms that
comprise the Standard & Poor’s (S&P) 500 and the Domini 400 Social Index until 2000. In
2001, it further extended its coverage to firms in the Russell 1,000 Index. Specifically, for
the period from 1991 to 2000, it includes approximately 650 companies; for the period from
2001 to 2002, 1100 companies; for the period from 2003 to 2012, 3000 companies. The KLD
database has been extensively employed in a large number of previous studies (Deng, Kang,
and Low, 2013; Servaes and Tamayo, 2013; Flammer, 2015; Khan, Serafeim, and Yoon, 2016;
Lins, Servaes, and Tamayo, 2017). The KLD database constructs a firm’s CSR performance
a wide range of sources, including company filings, government data, nongovernmental or-
ganization data, and more than 14 thousand global media sources. The database contains
seven dimensions of CSR, including community, employee relations, diversity, environment,
human rights, product quality and corporate governance. It also contains five exclusion-
ary screen classifications defined by whether a firm operate in the ’sin’ industries, including
alcohol, firearms, gambling, tobacco, nuclear power, and military contracting. For each di-
mension, the KLD is designed as a binary system and there are indicators representing a
firm’s strengths and indicators representing a firm’s concerns in certain social areas. KLD
includes a 1 indicating the presence of that criterion and a 0 indicating its absence.
Following previous studies in employee treatment and welfare (Bae et al., 2011; Cronqvist
et al., 2009; Ertugrul, 2013; Faleye and Trahan, 2011; Ghaly et al., 2015; Verwijmeren and
Derwall, 2010). we construct our employee treatment scores by using KLD’s rating on
‘Employee Relations’, with a higher net scores demonstrating better employee treatment
performance. Our primary measure of employee treatment, EMP TREAT, is estimated
by summing identified strengths and subtracting identified concerns included in ‘Employee
12

Relations’ dimensions in a given year (Faleye and Trahan, 2011; Verwijmeren and Derwall,
2010). Specifically, our employee treatment variable contains labor-relevant components
including union relations, cash profit sharing, employee involvement and retirement benefits.
Following Ertugrul (2013) and Ghaly et al. (2015), we also include the ‘Work/Life Benefits’
variable from the ‘Diversity’ dimension1.
3.4. Empirical models
Our primary analyses on the relation between employee treatment and labor investment
efficiency are based on the following model:
AB NETHIREit = β0 + β1EMP TREATit + β2MTBit−1 + β3SIZEit−1 + β4LIQit−1
+ β5LEVit−1 + β6DIV Dit−1 + β7TANGIBLESit−1 + β8LOSSit−1 + β9LABINTit−1
+ β10SD CFOit−1 + β11SD SALESit−1 + β12SD NETHIREit−1 + β13UNIONit−1
+ β14AB INV ESTit + FirmDummies+ Y earDummies+ εit (2)
where:
AB NETHIRE = Absolute value of the difference between actual net hiring and the
expected level measured on Pinnuck and Lillis (2007);
EMP TREAT = Employee treatment scores constructed from KLD database;
MTB = Ratio of market to book value of common equity at the beginning of the year;
SIZE = Log of market value of equity at the beginning of the year;
DIVD = An indicator variable equal to 1 if the firm pays dividends in the previous year,
0 otherwise;
LIQ = The ratio of cash and short-term investments plus receivables to current liabilities;
LEV = The ratio of long-term debt to total assets at the beginning of the year;
SD CFO = The standard deviation of cash flow from operation over year t-5 to t-1;
SD SALES = The standard deviation of sales revenue over year t-5 to t-1;
TANGIBLES = Ratio of property, plant and equipment to total assets at the beginning
of the year;
LOSS = An indicator variable equal to 1 if the firm reported a loss in the previous year,
0 otherwise;
1As an alternative measure of employee treatment, we also calculate a firm’s overall employee treatmentbased on Guo et al. (2015) as the variable of interest to run our regressions. In untabulated results, we findthe results qualitatively similar to those reported results
13
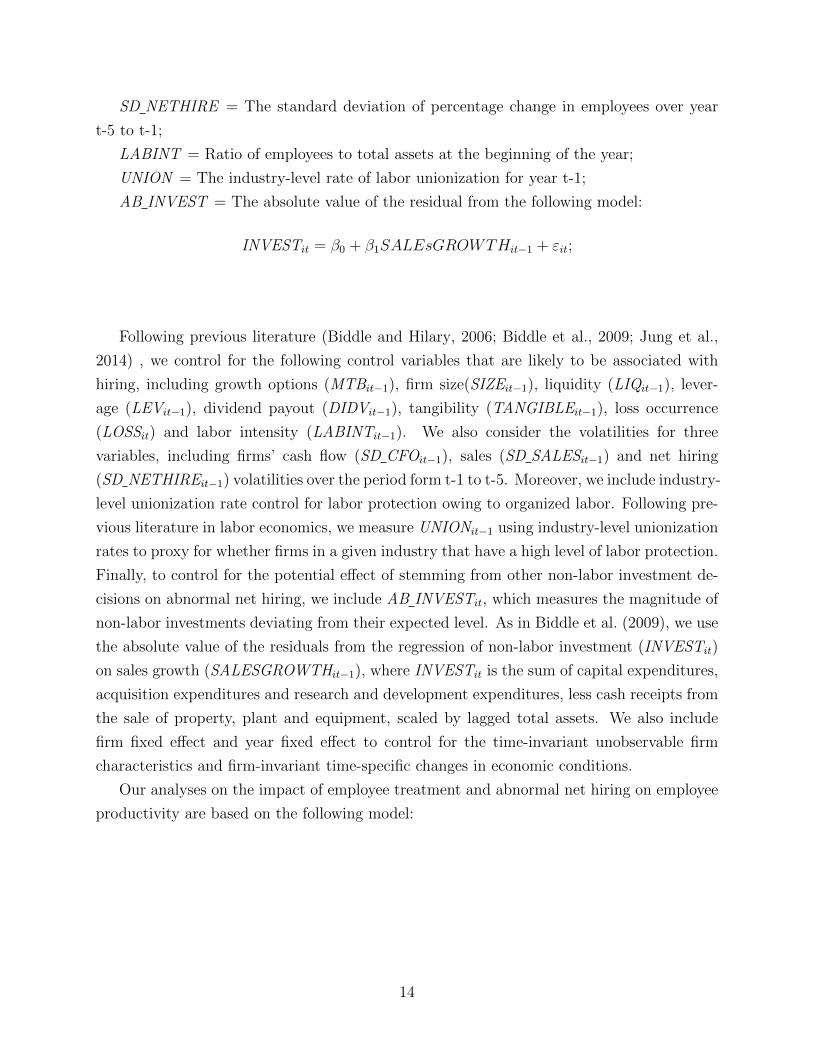
SD NETHIRE = The standard deviation of percentage change in employees over year
t-5 to t-1;
LABINT = Ratio of employees to total assets at the beginning of the year;
UNION = The industry-level rate of labor unionization for year t-1;
AB INVEST = The absolute value of the residual from the following model:
INVESTit = β0 + β1SALEsGROWTHit−1 + εit;
Following previous literature (Biddle and Hilary, 2006; Biddle et al., 2009; Jung et al.,
2014) , we control for the following control variables that are likely to be associated with
hiring, including growth options (MTBit−1), firm size(SIZEit−1), liquidity (LIQit−1), lever-
age (LEVit−1), dividend payout (DIDVit−1), tangibility (TANGIBLEit−1), loss occurrence
(LOSSit) and labor intensity (LABINTit−1). We also consider the volatilities for three
variables, including firms’ cash flow (SD CFOit−1), sales (SD SALESit−1) and net hiring
(SD NETHIREit−1) volatilities over the period form t-1 to t-5. Moreover, we include industry-
level unionization rate control for labor protection owing to organized labor. Following pre-
vious literature in labor economics, we measure UNIONit−1 using industry-level unionization
rates to proxy for whether firms in a given industry that have a high level of labor protection.
Finally, to control for the potential effect of stemming from other non-labor investment de-
cisions on abnormal net hiring, we include AB INVESTit, which measures the magnitude of
non-labor investments deviating from their expected level. As in Biddle et al. (2009), we use
the absolute value of the residuals from the regression of non-labor investment (INVESTit)
on sales growth (SALESGROWTHit−1), where INVESTit is the sum of capital expenditures,
acquisition expenditures and research and development expenditures, less cash receipts from
the sale of property, plant and equipment, scaled by lagged total assets. We also include
firm fixed effect and year fixed effect to control for the time-invariant unobservable firm
characteristics and firm-invariant time-specific changes in economic conditions.
Our analyses on the impact of employee treatment and abnormal net hiring on employee
productivity are based on the following model:
14
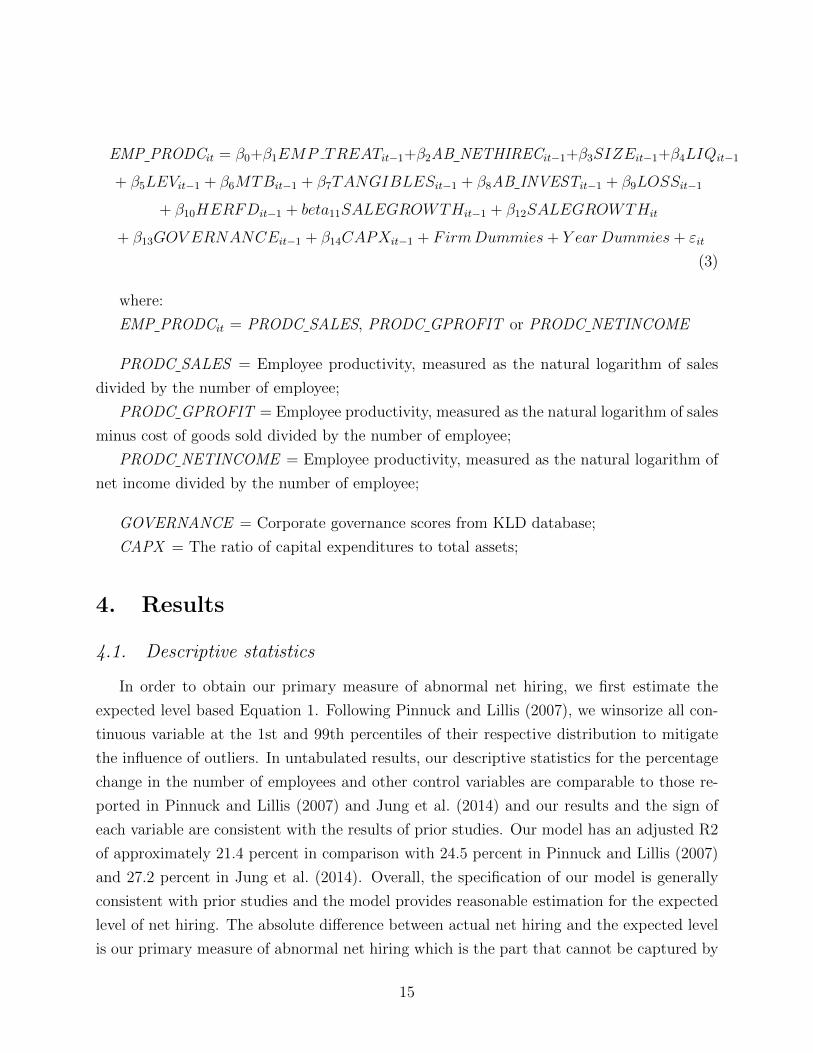
EMP PRODCit = β0+β1EMP TREATit−1+β2AB NETHIRECit−1+β3SIZEit−1+β4LIQit−1
+ β5LEVit−1 + β6MTBit−1 + β7TANGIBLESit−1 + β8AB INVESTit−1 + β9LOSSit−1
+ β10HERFDit−1 + beta11SALEGROWTHit−1 + β12SALEGROWTHit
+ β13GOV ERNANCEit−1 + β14CAPXit−1 + FirmDummies+ Y earDummies+ εit
(3)
where:
EMP PRODCit = PRODC SALES, PRODC GPROFIT or PRODC NETINCOME
PRODC SALES = Employee productivity, measured as the natural logarithm of sales
divided by the number of employee;
PRODC GPROFIT = Employee productivity, measured as the natural logarithm of sales
minus cost of goods sold divided by the number of employee;
PRODC NETINCOME = Employee productivity, measured as the natural logarithm of
net income divided by the number of employee;
GOVERNANCE = Corporate governance scores from KLD database;
CAPX = The ratio of capital expenditures to total assets;
4. Results
4.1. Descriptive statistics
In order to obtain our primary measure of abnormal net hiring, we first estimate the
expected level based Equation 1. Following Pinnuck and Lillis (2007), we winsorize all con-
tinuous variable at the 1st and 99th percentiles of their respective distribution to mitigate
the influence of outliers. In untabulated results, our descriptive statistics for the percentage
change in the number of employees and other control variables are comparable to those re-
ported in Pinnuck and Lillis (2007) and Jung et al. (2014) and our results and the sign of
each variable are consistent with the results of prior studies. Our model has an adjusted R2
of approximately 21.4 percent in comparison with 24.5 percent in Pinnuck and Lillis (2007)
and 27.2 percent in Jung et al. (2014). Overall, the specification of our model is generally
consistent with prior studies and the model provides reasonable estimation for the expected
level of net hiring. The absolute difference between actual net hiring and the expected level
is our primary measure of abnormal net hiring which is the part that cannot be captured by
15

underlying economic fundamentals.
[Insert Table 1 near here]
In panel A of Table 2, we present descriptive statistics for the variables in Equation 2 and
Equation 3. In terms of Equation 2, our dependent variable, AB NETHIRE, has mean of 0.12
and median of 0.08 with standard deviation of 0.19, which is close to Jung et al. (2014). that
has mean of 0.11 and median of 0.07 with standard deviation of 0.13 for abnormal net hiring.
Apart from the absolute value of abnormal net hiring as our primary measure of labor in-
vestment efficiency, we also divided the variable into two parts based on the sign of abnormal
net hiring. The positive abnormal net hiring, OVER LABOR, indicates that a firm’s actual
net hiring is greater than expected and therefore is a measure of overinvestment in labor
whereas the negative abnormal net hiring, UNDER LABOR, indicates that a firm’s actual
net hiring is less than expected and is a measure of underinvestment. Consistent with Ghaly
et al. (2015), our main variable of interest, EMP TREAT, range from -4 to 4, has a mean of
-0.04 and median of 0, suggesting that the number of firms with negative employee treatment
scores outweighs the number of firms with positive employee treatment scores. The descrip-
tive statistics of other control variables are generally consistent with Biddle et al. (2009)
and Jung et al. (2014).For Equation 3, our descriptive statistics includes three employee
productivity measures, PRODC SALES, PRODC GPROFIT and PRODC NETINCOME
and additional control variables including corporate governance (GOVERNANCEit−1) and
capital expenditure (CAPXit−1). In Panel B of Table 2, we report the frequency of firms
in our sample by year. Consistent with our expectation, our sample increases over time as
KLD database extends its coverage over time.
In panel C of Table 2, we define firms with positive employee treatment scores as
employee-friendly firms, and firms with negative employee treatment scores as non-employee-
friendly firms. We compare the characteristics of these two subsample groups of firms. Sec-
tion A provides the number of observations, the mean and the median of employee-friendly
firms. Section B presents the descriptive statistics for non-employee-friendly firms. Con-
sistent with prior studies in employee treatment, most observations in our sample fall into
category with neutral employee treatment subgroup, namely, EMP TREAT is equal to 0.
The comparison indicates that firms with employee-friendly treatment policies have lower
abnormal net hiring and therefore enjoy higher labor investment efficiency. Specifically, the
average abnormal net hiring is 10.6% for employee-friendly firms in comparison with 12.8%
for non-employee-friendly firms. The median comparison also indicates similar results. The
median of abnormal net hiring for employee-friendly firms is approximately 7% in comparison
16
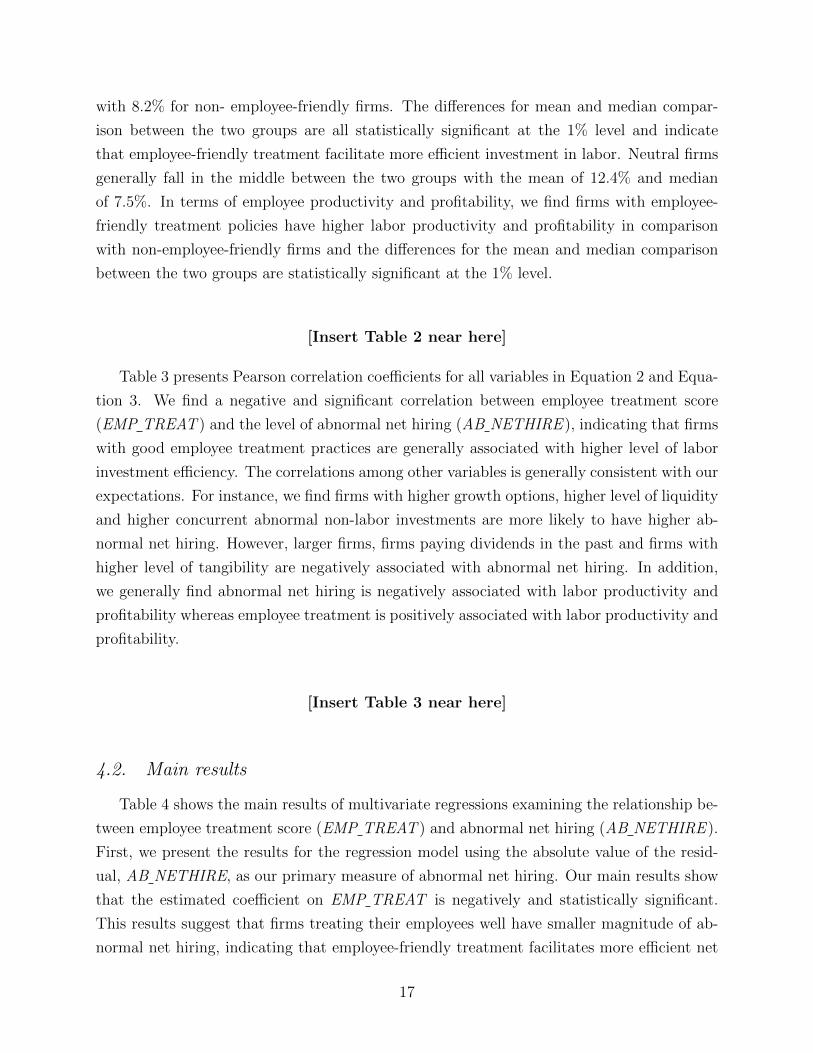
with 8.2% for non- employee-friendly firms. The differences for mean and median compar-
ison between the two groups are all statistically significant at the 1% level and indicate
that employee-friendly treatment facilitate more efficient investment in labor. Neutral firms
generally fall in the middle between the two groups with the mean of 12.4% and median
of 7.5%. In terms of employee productivity and profitability, we find firms with employee-
friendly treatment policies have higher labor productivity and profitability in comparison
with non-employee-friendly firms and the differences for the mean and median comparison
between the two groups are statistically significant at the 1% level.
[Insert Table 2 near here]
Table 3 presents Pearson correlation coefficients for all variables in Equation 2 and Equa-
tion 3. We find a negative and significant correlation between employee treatment score
(EMP TREAT ) and the level of abnormal net hiring (AB NETHIRE ), indicating that firms
with good employee treatment practices are generally associated with higher level of labor
investment efficiency. The correlations among other variables is generally consistent with our
expectations. For instance, we find firms with higher growth options, higher level of liquidity
and higher concurrent abnormal non-labor investments are more likely to have higher ab-
normal net hiring. However, larger firms, firms paying dividends in the past and firms with
higher level of tangibility are negatively associated with abnormal net hiring. In addition,
we generally find abnormal net hiring is negatively associated with labor productivity and
profitability whereas employee treatment is positively associated with labor productivity and
profitability.
[Insert Table 3 near here]
4.2. Main results
Table 4 shows the main results of multivariate regressions examining the relationship be-
tween employee treatment score (EMP TREAT ) and abnormal net hiring (AB NETHIRE ).
First, we present the results for the regression model using the absolute value of the resid-
ual, AB NETHIRE, as our primary measure of abnormal net hiring. Our main results show
that the estimated coefficient on EMP TREAT is negatively and statistically significant.
This results suggest that firms treating their employees well have smaller magnitude of ab-
normal net hiring, indicating that employee-friendly treatment facilitates more efficient net
17
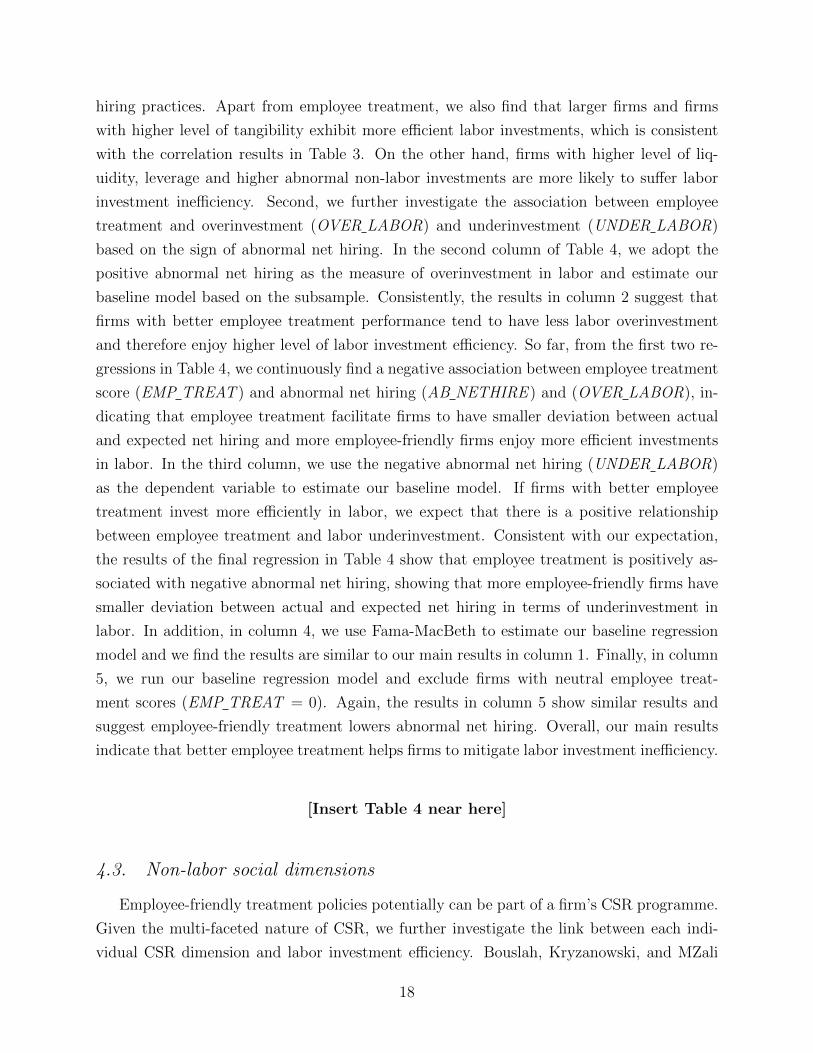
hiring practices. Apart from employee treatment, we also find that larger firms and firms
with higher level of tangibility exhibit more efficient labor investments, which is consistent
with the correlation results in Table 3. On the other hand, firms with higher level of liq-
uidity, leverage and higher abnormal non-labor investments are more likely to suffer labor
investment inefficiency. Second, we further investigate the association between employee
treatment and overinvestment (OVER LABOR) and underinvestment (UNDER LABOR)
based on the sign of abnormal net hiring. In the second column of Table 4, we adopt the
positive abnormal net hiring as the measure of overinvestment in labor and estimate our
baseline model based on the subsample. Consistently, the results in column 2 suggest that
firms with better employee treatment performance tend to have less labor overinvestment
and therefore enjoy higher level of labor investment efficiency. So far, from the first two re-
gressions in Table 4, we continuously find a negative association between employee treatment
score (EMP TREAT ) and abnormal net hiring (AB NETHIRE ) and (OVER LABOR), in-
dicating that employee treatment facilitate firms to have smaller deviation between actual
and expected net hiring and more employee-friendly firms enjoy more efficient investments
in labor. In the third column, we use the negative abnormal net hiring (UNDER LABOR)
as the dependent variable to estimate our baseline model. If firms with better employee
treatment invest more efficiently in labor, we expect that there is a positive relationship
between employee treatment and labor underinvestment. Consistent with our expectation,
the results of the final regression in Table 4 show that employee treatment is positively as-
sociated with negative abnormal net hiring, showing that more employee-friendly firms have
smaller deviation between actual and expected net hiring in terms of underinvestment in
labor. In addition, in column 4, we use Fama-MacBeth to estimate our baseline regression
model and we find the results are similar to our main results in column 1. Finally, in column
5, we run our baseline regression model and exclude firms with neutral employee treat-
ment scores (EMP TREAT = 0). Again, the results in column 5 show similar results and
suggest employee-friendly treatment lowers abnormal net hiring. Overall, our main results
indicate that better employee treatment helps firms to mitigate labor investment inefficiency.
[Insert Table 4 near here]
4.3. Non-labor social dimensions
Employee-friendly treatment policies potentially can be part of a firm’s CSR programme.
Given the multi-faceted nature of CSR, we further investigate the link between each indi-
vidual CSR dimension and labor investment efficiency. Bouslah, Kryzanowski, and MZali
18

(2013) point out the drawbacks associated with the use of aggregate CSR measure and ar-
gue that the aggregate CSR measure may confound the influence of each individual CSR
dimension that may not be equally relevant and therefore each individual CSR dimension
should be considered separately. One issue that can potentially mislead our interpretation
is that firms with employee-friendly treatment practices are also firms that perform well in
other non-labor social dimensions. In that case, as one of the integral parts of CSR, good
employee treatment can be merely a reflection of a firm’s social performance and the evidence
that better employee treatment increases labor investment efficiency should attribute to a
firm’s social performance instead of solely employee treatment. To rule out this possibility,
we test the impact of each dimension of CSR on abnormal net hiring, which potentially
serves as the placebo test function to indicate whether the relationship between employee
treatment and abnormal net hiring is driven by a firm’s social performance or merely em-
ployee treatment. Among the six individual social dimensions (environment, community,
employee-relations, diversity, product and human rights), the most employee-related CSR
dimension that is employee-relations (EMP RELATION ). The employee-relation dimension
(EMP RELATION ) includes employee cash profit sharing, employee involvement, employee
health & safety, human capital development, labor management relations and supply chain
issues. While other non-labor CSR dimensions may also be relevant for firms to build culture
that enforces certain social norms, the employee-relation dimension is the most labor-relevant
CSR dimensions that align employee interests with firms’ objectives and therefore more likely
to facilitate efficiency labor investments. We use individual CSR dimension and see whether
other non-labor CSR dimensions also significantly affect labor investment efficiency. If it is
the social performance that drives a firm to have higher labor investment efficiency, we will
observe significant results on the relation between abnormal net hiring and other individual
social dimensions. On the other hand, if it is employee treatment policies that drive more
efficient labor investment, we should only observe significant results between employee di-
mension and labor investment efficiency. In Table 5, our results show that only the labor
dimension of CSR (employee-relations) is significantly associated with abnormal net hiring.
Specifically, we find employee-relations scores are negatively associated with abnormal net
hiring, which is consistent with our main results and shows that firms with better employee
relations tend to have higher labor investment efficiency. On the other hand, we do not
find any significant results for other non-labor dimensions of CSR, confirming that our main
results are driven by employee treatment instead of a firm’s other non-labor social perfor-
mance.
[Insert Table 5 near here]
19
4.4. Employee treatment strengths and concerns on abnormal net hiring
Mattingly and Berman (2006) highlight the importance of distinguishing between strengths
and concerns in recent social responsibility research because they are empirically and con-
ceptually distinct constructs and there could be compensating effects. In the same spirit of
Mattingly and Berman (2006), we split the employee treatment measure into employee treat-
ment strengths (EMP STR) and employee treatment concerns (EMP CON ), which helps us
to observe how the components of the primary employee treatment (EMP TREAT ) affect
firms’ labor investment efficiency. Specifically, we predict that the strengths of employee
treatment can enhance firms’ labor investment efficiency and therefore are negatively associ-
ated with abnormal net hiring whereas the concerns of employee treatment pose a misalign-
ment between the interests of employees and a firm’s objective and signal a firm’s failure in
honoring its implicit claims and therefore are expected to lower a firm’s labor investment
efficiency.
In Table 6, we investigate the impact of employee treatment strengths (EMP STR) and
concerns (EMP CON ) on overall abnormal net hiring (AB NETHIRE ), labor overinvestment
(OVER LABOR) and labor underinvestment (UNDER LABOR). In the first three columns
in Table 6, we only find negative and relatively weak association between EMP STR and
abnormal net hiring (AB NETHIRE ) and overinvestment in labor (OVER LABOR), which
indicates that employee treatment strengths reduce labor investment inefficiency. We do
not find significant results regarding overall employee treatment strengths in reducing labor
underinvestment. On the other hand, we find employee treatment concerns, EMP CON, is
positively associated with abnormal net hiring, suggesting that firms with more employee
treatment concerns suffer more labor investment inefficiency. Moreover, we find EMP CON
variable is also negatively associated with underinvestment in labor (negative abnormal net
hiring), which suggests that firms with more employee treatment concerns are more likely to
have actual net hiring less than expected, thus leading to labor underinvestment. Overall,
we find solid evidence that employee treatment concerns can distort normal labor hiring and
lead to labor investment inefficiency and relatively weak evidence that employee treatment
strengths effectively increase labor investment efficiency.
[Insert Table 6 near here]
20
5. Sensitivity Analysis
To examine the validity of our main results indicating that corporate employee treatment
facilitates more efficient investments in labor, we conduct additional robustness tests. These
tests assess the sensitivity of our results to alternative measures of employee treatment,
investment efficiency and additional control variables.
5.1. Analysis of instrumental variable estimation
While using an extensive list of control variables that facilitate to mitigate the poten-
tial omitted variable bias in estimating the association between a firm’s employee treatment
and labor investment efficiency, we cannot rule out the possibility that our results gener-
ated from the baseline model suffer from endogeneity bias. In order to address the concerns
about endogeneity, we use several approaches by adopting the instrumental variable esti-
mation. First, as an instrument for employee treatment of firm i in year t, we use the
average employee treatment scores of firms having their headquarters located in the same
state as instrumental variable to address the endogeneity issue. Prior research shows that
geographic proximity can be an important factor for corporate policies (Pirinsky and Wang,
2010; Jiraporn, Jiraporn, Boeprasert, and Chang, 2014). As one of the integral part of a
firm’s social performance, employee welfare and treatment practices are likely to be affected
by firms’ geographic proximity as well. Firms located geographically close to each other are
more likely to be affected by the same local factors and preferences and hence tend to exhibit
similar employee treatment practices. Moreover, factors such as social connectedness, peer
effect and local competition among firms in the same geographic area may drive geographi-
cally proximate firms to adopt similar employee treatment practices. Hence, the underlying
motivation for adopting this instrument is that employee treatment tends to be correlated
among firms in a given state, but arguably the state-level employee treatment performance
is not likely to affect the labor investment efficiency of a specifically individual firm. In order
to avoid the situation where the employee treatment performance of one given firm affects
the average employee treatment score of the geographically proximate firms in a given state,
we require each state contains at least ten firm for each year 2. Thus, we mitigate a situa-
tion where a single firm’s employee treatment performance in a specific year is used as the
state-level employee treatment performance. In the same vein, firms operating in the same
industry also tend to exhibit similar employee treatment practices and we therefore use the
mean of the employee treatment score in year t of all firms belonging to firm i ’s 2-digit SIC
2To ensure robustness, we further change the minimum number of firms in each state to 5 and 15. Inuntabulated results, we find the results qualitatively unchanged.
21
code an instrument for employee treatment of firm i in year t (El Ghoul et al., 2011).
Table 7 reports results for our baseline model using instrumental variable estimation.
The first column reports estimates for the first-stage equation, indicating a strong correlation
between firm and state/industry employee treatment level. Columns 2-4 present the results
regarding the relation between employee treatment and labor investment efficiency from
the second stage regression estimated through GMM, LIML and 2SLS. The results confirm
that the negative and significant association between employee treatment and abnormal net
hiring, which is consistent with the results generated from our baseline OLS regressions. In
addition, the two instrument variables pass both the Cragg and Donald (1993) instrument
relevance test and the Sargan (1958) overidentification test.
[Insert Table 7 near here]
5.2. Alternative employee treatment: Fortune’s Best 100 List
So far, the results of our research suggest that employee-friendly treatment policies facil-
itate firms to have lower level of labor investment inefficiency as measured by abnormal net
hiring. We further show that the firms treating their employees mitigate the risk of labor
overinvestment and labor underinvestment. In order to ensure the robustness of our results,
we reestimate our main results by using the alternative employee treatment. Following prior
studies in employee treatment (Bae et al., 2011; Edmans, 2011; Faleye and Trahan, 2011;
Ghaly et al., 2015; Guo et al., 2015; Chen et al., 2016), we replace the employee treatment
scores obtained from KLD database with a dummy variable (BEST100 ) that is equal to
one if the firm is listed in Fortune magazine’s list of the ‘100 Best Companies to Work
For’ (Fortune List hereafter) between 1998 and 2012. Fortune List is created by combin-
ing employee surveys and company response and it consists of companies known for their
employee-friendly treatment policies. Since the maximum year of Fortune List we can get is
2012, our sample drops to 15,776 after we merge Fortune List with our full sample.
We report the results of regressions using the alternative employee treatment in Table
8. Our results suggest that the robustness test using BEST100 as the alternative employee
treatment yields similar results and the results are still consistent with those reported re-
sults in Table 4. Specifically, we find the estimated coefficient on BEST100 is negatively
associated with abnormal net hiring and the result suggests that better employee treatment
facilitate more efficient investment in labor. Moreover, we also divided the variable into over-
investment (OVER LABOR) and underinvestment (UNDER LABOR) based on the sign of
abnormal net hiring. Consistent with the main results in Table 4, our robustness tests using
22
BEST100 as the alternative employee treatment also indicate that employee-friendly treat-
ment policies mitigate the risk of overinvestment and underinvestment in labor. Overall,
Table 8 suggests that our findings are robust to alternative proxies of employee treatment3.
[Insert Table 8 near here]
5.3. Alternative measures of labor investment efficiency
In Table 9, we adopt three alternative measures of labor investment efficiency. First,
following Cella (2009), we use a firm’s industry median level of net hiring as a proxy for its
optimal level and measure abnormal investment as the difference between a firm’s actual level
of net hiring and its industry median. Therefore, the more a firm’s net hiring deviates from
its industry peers, the larger the measure of abnormal net hiring. Second, we follow Biddle
et al. (2009) and estimate a firm-specific model of labor investment as a function of sales
growth and use the absolute value of the residuals as the proxy for deviations from expected
investment in labor. Third, we use the augmented version of Pinnuck and Lillis (2007) model.
Specifically, we augment Equation 1 with a number of additional variables, including indus-
try unionization rate, capital expenditure, research and development expenses, acquisition
expenses, lagged value of observed labor investment and logarithm of GDP per capita. We
report the results of the models using alternative measure of abnormal net hiring in Table
9. Overall, we find the results generated from the regressions using alternative abnormal net
hiring show similar results to the results of our baseline regression model. Consistent with
the results of our baseline model using the primary measure of abnormal net hiring, we find
employee treatment is negatively associated with abnormal net hiring in general across all
three alternative abnormal net hiring. For other control variables, we generally find the sign
for each control variables are consistent with the results of our baseline regression.
[Insert Table 9 near here]
3As an alternative measure of employee treatment, we also calculate a firm’s overall employee treatmentbased on Guo et al. (2015) as the variable of interest to run our regressions. In untabulated results, thealternative test yields similar results as robustness tests and the results are still consistent with those reportedresults.
23
5.4. Additional control variables
We also include various additional control variables that are not included in our baseline
model because the data requirements lead to additional sample loss. We include governance
proxies, corporate governance and institutional ownership respectively, in our baseline regres-
sion because corporate governance and the influence of institutional investor may potentially
affect investment policies and employee treatment. Moreover, Jung et al. (2014) find that
high-quality financial reporting facilitate more efficient investments in labor and show that
financial reporting quality is also one of the factors that have influential impact on labor in-
vestment efficiency. Therefore, we also use financial reporting quality as an additional control
variable in our regression to test the robustness of our results. We use discretionary accrual
as the proxy for financial reporting quality and estimate discretionary accrual by using the
performance-adjusted modified Jones model suggested in Kothari, Leone, and Wasley (2005)
given the less restrictive data requirements of cross-sectional version of modified Jones model.
The model for estimating discretionary accrual includes lagged return on assets (ROAit−1)
as a regressor to control for the effect of performance on measured discretionary accruals.
In terms of the estimation of the discretionary accruals, we estimate the model for every
industry classified by two-digit SIC code for each year. Following previous studies, we use
the absolute value of discretionary accrual (AB DISC ) as the proxy for financial report-
ing quality. The large value of the absolute value of discretionary accrual, the lower level
of financial reporting quality. We further multiply AB DISC by -1 so that large value of
AB DISC indicates higher-quality of financial reporting4. In untabulated results, the re-
gression including additional control variables yield similar results and the results are still
consistent with those reported results. Overall, the results generated from our robustness
tests show that our results are robust to additional control variables.
6. Additional Analysis
6.1. The impact of employee treatment and abnormal net hiring on labor
productivity
To demonstrate the economic implication of employee treatment (EMP TREAT ) and
abnormal net hiring (AB NETHIRE ), we further investigate the impact of employee treat-
4As an alternative measure of financial reporting quality, we also calculate a firm’s financial reportingquality based on Dechow and Dichev (2002) as an additional control variable to run our regressions. Theresults of financial reporting quality based on Dechow and Dichev (2002) yields similar results and are stillconsistent with those results generated from the performance-adjusted modified Jones model suggested inKothari et al. (2005).
24
ment and abnormal net hiring on labor productivity (PRODC SALES, PRODC GPROFIT
and PRODC NETINCOME ) and profitability (ROA). Numerous previous studies investi-
gate the value creation of employee-friendly treatment (Zingales, 2000; Filbeck and Preece,
2003; Edmans, 2011). We argue that one of the potential channels via which employee
treatment and labor investment efficiency can affect value creation is via labor productivity
and we examine the impact of employee treatment and abnormal net hiring on labor pro-
ductivity. Given previous literature suggests that employee-friendly policies can positively
influence value creation, we posit that firms treating their employees well enjoy higher labor
productivity and profitability. On the other hand, because abnormal net hiring deviates from
firms employment level justified by their underlying economics, we predict that abnormal
net hiring deteriorates labor productivity and profitability.
The results in Table 10 confirm our prediction. Specifically, we find the estimated coef-
ficients on employee treatment are positive and significant when gross profit per employee
(PRODC GPROFIT ), income per employee (PRODC NETINCOME ) and ROA are the
dependent variables, indicating that employee-friendly treatment positively enhances labor
productivity and firms’ profitability. On the other hand, we find the lagged abnormal net
hiring is negatively associated with labor productivity and profitability, which suggests that
abnormal net hiring deteriorates labor productivity and firms’ profitability. Overall, our
tests for the impact of employee treatment and abnormal net hiring on labor productivity
suggest that employee-friendly treatment policies enhance labor productivity whereas sub-
optimal net hiring is costly in terms of labor productivity.
[Insert Table 10 near here]
6.2. The Effect of CSR Dimensions and Abnormal Net Hiring on Labor
Productivity and Profitability
We further investigate the impact of each CSR dimension on labor productivity and prof-
itability to observe whether there are specific CSR dimensions considerably contributes to
labor productivity and profitability. In Table 11, we report the results of the tests. In terms
of profitability, we find that the estimated coefficient of employee relation is positive and
statistically significant at 1% level, showing that employee relation dimension significantly
contributes to firms profitability measured as ROA. In contrast, we generally find that other
dimensions of CSR are negatively associated with firms’ profitability. Particularly, we find
the estimated coefficient on human rights dimension is negative and statistically significant
25
at 1%, showing that investing in human right dimension of CSR is more likely to lower firms’
profitability. In terms of labor productivity, we find that the product dimension of CSR sig-
nificantly contributes to employee productivity measured as gross profit per employee and net
income per employee whereas the environment dimension of CSR lowers employee produc-
tivity measured as sales per employee. In addition, in all of our regressions, we consistently
find that the lagged abnormal net hiring is negatively associated with all measures of labor
productivity and profitability, confirming that the deviation from firms employment level
justified by underlying economics lowers firms’ labor productivity and profitability. Overall,
our results suggest that employee and product dimensions of CSR are generally beneficial
to firms’ labor productivity and profitability whereas human rights dimensions of CSR and
abnormal net hiring tend to deteriorates labor productivity and profitability.
[Insert Table 11 near here]
6.3. The Effect of Employee Treatment Strengths, Concerns and Abnormal
Net Hiring on Employee Productivity and Profitability
Similar to Table 6, we divide the employee treatment measure into employee treatment
strengths (EMP STR) and employee treatment concerns (EMP CON ) to observe how em-
ployee treatment strengths and concerns affect firms’ labor productivity and profitability. In
light of previous argument, we predict that the strengths of employee treatment are more
likely to enhance firms’ labor productivity and profitability and therefore are positively as-
sociated with employee productivity proxies and ROA whereas the concerns of employee
treatment pose a misalignment between the interests of employees and a firm’s objective and
therefore tend to be negatively associated with employee productivity proxies and ROA.
In Table 12, our results show a marginal significant relationship between employee strengths
and labor productivity measured as net income per employee and suggest that firms with
employee-friendly policies may have higher labor productivity. For other types of labor pro-
ductivity and profitability measures, we do not find significant results. In contrast, when
we test the impact of employee concerns on labor productivity and profitability, we find
that the estimated coefficients of labor productivity as measured by gross profit per em-
ployee (PRODC GPROFIT ) and net income per employee (PRODC NETINCOME ) and
profitability (ROA) are significant negative, suggesting that firms with employee concerns
are more likely to have lower labor productivity and profitability. Apart from above, our
results still consistently show that abnormal net hiring significantly lower firms’ labor pro-
ductivity and profitability.
26
[Insert Table 12 near here]
7. Conclusion
The capital market in reality is not frictionless and market imperfections stemming from
information asymmetry between firms and suppliers of capital can cause firms to deviate
from the optimal level, thus leading to either overinvestment or underinvestment. Previous
literature studying investment efficiency emphasizes more on the role of financial reporting
and its relation with capital investment efficiency. We follow this line of research by ex-
tending capital investment efficiency to the investment efficiency in labor and investigate the
impact of employee-treatment on labor investment efficiency. We argue employee-friendly
treatment policies facilitate firms to lower information asymmetry and employees moral haz-
ard (adverse behavior), thus helping firms to maintain net hiring that is closer to a level
justified by firms underlying economics. Instead of focusing on investment efficiency in capi-
tal expenditure, we distinguish our study from prior research and extend the line of research
by investigating investment efficiency in labor and argue that employee treatment is also a
significant determinants of labor investment efficiency. In addition, we also investigate the
impact of employee treatment and labor investment inefficiency in form of abnormal net hir-
ing on labor productivity and profitability and suggest the important economic implication
of employee treatment and abnormal net hiring on firms’ value creation.
We find that firms with employee-friendly treatment policies have lower level of abnormal
net hiring and are less likely to over or under-invest in labor, therefore investing in labor
more efficiently. When analyse employee treatment strengths and concerns, we find rela-
tively weak evidence that employee treatment strengths effectively improve labor investment
efficiency whereas we find strong evidence that employee treatment concerns distort normal
labor hiring and lead to underinvestment in labor. Our results are robust to a variety of
robustness tests and continue to hold when we adopt instrumental variable estimation, alter-
native measures for employee treatment and labor investment efficiency as well as additional
control variables. In addition, we find employee-friendly treatment policies contribute to
higher labor productivity and profitability whereas abnormal net hiring reduces labor pro-
ductivity and profitability. Our results generally suggest that firm-level employee treatment
policies have important implication for firm-level employment decisions and the allocation of
resource to investment in labor. Taken together, our findings highlight the important role of
employee treatment in contributing to firms investment behaviour, efficiency and value cre-
ation. Hence, from a broad sense, our study also speaks to the literature about stakeholder
27

relationship, employee welfare and corporate investment policies, and relevant legislation
regarding employment policies.
28
References
Akerlof, G. A., 1982. Labor contracts as partial gift exchange. The Quarterly Journal of
Economics 97, 543–569.
Akerlof, G. A., Yellen, J. L., 1986. Efficiency wage models of the labor market. Cambridge
University Press.
Akerlof, G. A., Yellen, J. L., 1990. The fair wage-effort hypothesis and unemployment. The
Quarterly Journal of Economics 105, 255–283.
Bae, K.-H., Kang, J.-K., Wang, J., 2011. Employee treatment and firm leverage: A test of
the stakeholder theory of capital structure. Journal of Financial Economics 100, 130–153.
Baker, M., Stein, J. C., Wurgler, J., 2003. When does the market matter? stock prices
and the investment of equity-dependent firms. The Quarterly Journal of Economics 118,
969–1005.
Beatty, A., Liao, S., 2014. Financial accounting in the banking industry: A review of the
empirical literature. Journal of Accounting and Economics 58, 339–383.
Benlemlih, M., Bitar, M., 2015. Corporate social responsibility and investment efficiency.
Journal of Business Ethics pp. 1–25.
Bertrand, M., Mullainathan, S., 2003. Enjoying the quiet life? corporate governance and
managerial preferences. Journal of political Economy 111, 1043–1075.
Biddle, G. C., Hilary, G., 2006. Accounting quality and firm-level capital investment. The
Accounting Review 81, 963–982.
Biddle, G. C., Hilary, G., Verdi, R. S., 2009. How does financial reporting quality relate to
investment efficiency? Journal of accounting and economics 48, 112–131.
Bouslah, K., Kryzanowski, L., MZali, B., 2013. The impact of the dimensions of social
performance on firm risk. Journal of Banking & Finance 37, 1258–1273.
Bowen, R. M., DuCharme, L., Shores, D., 1995. Stakeholders’ implicit claims and accounting
method choice. Journal of accounting and economics 20, 255–295.
Cella, C., 2009. Institutional investors and corporate investment .
Chemmanur, T. J., Cheng, Y., Zhang, T., 2013. Human capital, capital structure, and
employee pay: An empirical analysis. Journal of Financial Economics 110, 478–502.
29

Chen, C., Chen, Y., Hsu, P.-H., Podolski, E. J., 2016. Be nice to your innovators: Employee
treatment and corporate innovation performance. Journal of corporate finance 39, 78–98.
Cheng, B., Ioannou, I., Serafeim, G., 2014. Corporate social responsibility and access to
finance. Strategic Management Journal 35, 1–23.
Cho, S. Y., Lee, C., Pfeiffer, R. J., 2013. Corporate social responsibility performance and
information asymmetry. Journal of Accounting and Public Policy 32, 71–83.
Cornell, B., Shapiro, A. C., 1987. Corporate stakeholders and corporate finance. Financial
management pp. 5–14.
Cragg, J. G., Donald, S. G., 1993. Testing identifiability and specification in instrumental
variable models. Econometric Theory 9, 222–240.
Cronqvist, H., Heyman, F., Nilsson, M., Svaleryd, H., Vlachos, J., 2009. Do entrenched
managers pay their workers more? the Journal of Finance 64, 309–339.
Danthine, J.-P., Donaldson, J. B., 2002. Labour relations and asset returns. The Review of
Economic Studies 69, 41–64.
Dechow, P. M., Dichev, I. D., 2002. The quality of accruals and earnings: The role of accrual
estimation errors. The accounting review 77, 35–59.
Demski, J. S., Feltham, G. A., 1978. Economic incentives in budgetary control systems.
Accounting Review pp. 336–359.
Deng, X., Kang, J.-k., Low, B. S., 2013. Corporate social responsibility and stakeholder value
maximization: Evidence from mergers. Journal of Financial Economics 110, 87–109.
Dhaliwal, D. S., Li, O. Z., Tsang, A., Yang, Y. G., 2011. Voluntary nonfinancial disclosure
and the cost of equity capital: The initiation of corporate social responsibility reporting.
The accounting review 86, 59–100.
Dhaliwal, D. S., Radhakrishnan, S., Tsang, A., Yang, Y. G., 2012. Nonfinancial disclosure
and analyst forecast accuracy: International evidence on corporate social responsibility
disclosure. The Accounting Review 87, 723–759.
Diamond, P. A., 1982. Aggregate demand management in search equilibrium. Journal of
political Economy 90, 881–894.
Edmans, A., 2011. Does the stock market fully value intangibles? employee satisfaction and
equity prices. Journal of Financial economics 101, 621–640.
30
Edmans, A., 2012. The link between job satisfaction and firm value, with implications for
corporate social responsibility. The Academy of Management Perspectives 26, 1–19.
El Ghoul, S., Guedhami, O., Kwok, C. C., Mishra, D. R., 2011. Does corporate social
responsibility affect the cost of capital? Journal of Banking & Finance 35, 2388–2406.
Ertugrul, M., 2013. Employeefriendly acquirers and acquisition performance. Journal of Fi-
nancial Research 36, 347–370.
Faleye, O., Trahan, E. A., 2011. Labor-friendly corporate practices: Is what is good for
employees good for shareholders? Journal of Business Ethics 101, 1–27.
Farmer, R. E., 1985. Implicit contracts with asymmetric information and bankruptcy: The
effect of interest rates on layoffs. The Review of Economic Studies 52, 427–442.
Filbeck, G., Preece, D., 2003. Fortunes best 100 companies to work for in america: Do they
work for shareholders? Journal of Business Finance & Accounting 30, 771–797.
Flammer, C., 2015. Does product market competition foster corporate social responsibility?
evidence from trade liberalization. Strategic Management Journal 36, 1469–1485.
Flammer, C., Luo, J., 2017. Corporate social responsibility as an employee governance tool:
Evidence from a quasi-experiment. Strategic Management Journal 38, 163–183.
Ghaly, M., Dang, V. A., Stathopoulos, K., 2015. Cash holdings and employee welfare. Journal
of Corporate Finance 33, 53–70.
Ghaly, M., Dang, V. A., Stathopoulos, K., 2017. Cash holdings and labor heterogeneity: the
role of skilled labor. The Review of Financial Studies p. hhx045.
Guo, J., Huang, P., Zhang, Y., Zhou, N., 2015. The effect of employee treatment policies
on internal control weaknesses and financial restatements. The Accounting Review 91,
1167–1194.
Hamermesh, D. S., 1993. Labor demand and the source of adjustment costs. Report, National
Bureau of Economic Research.
Hasan, I., Kobeissi, N., Liu, L., Wang, H., 2016. Corporate social responsibility and firm
financial performance: The mediating role of productivity. Journal of Business Ethics pp.
1–18.
31

Healy, P. M., Palepu, K. G., 2001. Information asymmetry, corporate disclosure, and the
capital markets: A review of the empirical disclosure literature. Journal of accounting and
economics 31, 405–440.
Jensen, M. C., 1986. Agency costs of free cash flow, corporate finance, and takeovers. The
American economic review 76, 323–329.
Jensen, M. C., Meckling, W. H., 1976. Theory of the firm: Managerial behavior, agency
costs and ownership structure. Journal of financial economics 3, 305–360.
Jiraporn, P., Jiraporn, N., Boeprasert, A., Chang, K., 2014. Does corporate social respon-
sibility (csr) improve credit ratings? evidence from geographic identification. Financial
Management 43, 505–531.
Jung, B., Lee, W., Weber, D. P., 2014. Financial reporting quality and labor investment
efficiency. Contemporary Accounting Research 31, 1047–1076.
Khan, M., Serafeim, G., Yoon, A., 2016. Corporate sustainability: First evidence on mate-
riality. The Accounting Review 91, 1697–1724.
Kim, Y., Park, M. S., Wier, B., 2012. Is earnings quality associated with corporate social
responsibility? The Accounting Review 87, 761–796.
Klein, B., 1980. Transaction cost determinants of” unfair” contractual arrangements. The
American economic review 70, 356–362.
Kothari, S. P., Leone, A. J., Wasley, C. E., 2005. Performance matched discretionary accrual
measures. Journal of accounting and economics 39, 163–197.
Lambert, R., Leuz, C., Verrecchia, R. E., 2007. Accounting information, disclosure, and the
cost of capital. Journal of accounting research 45, 385–420.
Lara, J. M. G., Osma, B. G., Penalva, F., 2016. Accounting conservatism and firm investment
efficiency. Journal of Accounting and Economics 61, 221–238.
Li, F., 2011. Earnings quality based on corporate investment decisions. Journal of Accounting
Research 49, 721–752.
Lins, K. V., Servaes, H., Tamayo, A., 2017. Social capital, trust, and firm performance: The
value of corporate social responsibility during the financial crisis. The Journal of Finance
.
32

Maksimovic, V., Titman, S., 1991. Financial policy and reputation for product quality.
Review of Financial Studies 4, 175–200.
Martin, K., Freeman, R. E., 2003. Some problems with employee monitoring. Journal of
Business Ethics 43, 353–361.
Mattingly, J. E., Berman, S. L., 2006. Measurement of corporate social action: Discovering
taxonomy in the kinder lydenburg domini ratings data. Business & Society 45, 20–46.
Modigliani, F., Miller, M. H., 1958. The cost of capital, corporation finance and the theory
of investment. The American economic review pp. 261–297.
Mortensen, D. T., Pissarides, C. A., 1994. Job creation and job destruction in the theory of
unemployment. The review of economic studies 61, 397–415.
Myers, S. C., Majluf, N. S., 1984. Corporate financing and investment decisions when firms
have information that investors do not have. Journal of financial economics 13, 187–221.
Organ, D. W., 1997. Organizational citizenship behavior: It’s construct clean-up time. Hu-
man performance 10, 85–97.
Pinnuck, M., Lillis, A. M., 2007. Profits versus losses: Does reporting an accounting loss
act as a heuristic trigger to exercise the abandonment option and divest employees? The
Accounting Review 82, 1031–1053.
Pirinsky, C. A., Wang, Q., 2010. Geographic location and corporate finance. World Scientific
Book Chapters pp. 23–38.
Rajan, R. G., Zingales, L., 1998. Power in a theory of the firm. The Quarterly Journal of
Economics 113, 387–432.
Rajan, R. G., Zingales, L., 2000. The governance of the new enterprise. Tech. rep., National
Bureau of Economic Research.
Richardson, S., 2006. Over-investment of free cash flow. Review of accounting studies 11,
159–189.
Sanchez, P. E., Benito-Hernandez, S., 2015. Csr policies: effects on labour productivity in
spanish micro and small manufacturing companies. Journal of Business Ethics 128, 705–
724.
Sargan, J. D., 1958. The estimation of economic relationships using instrumental variables.
Econometrica: Journal of the Econometric Society pp. 393–415.
33
Serfling, M., 2016. Firing costs and capital structure decisions. The Journal of Finance 71,
2239–2286.
Servaes, H., Tamayo, A., 2013. The impact of corporate social responsibility on firm value:
The role of customer awareness. Management Science 59, 1045–1061.
Shapiro, C., Stiglitz, J. E., 1984. Equilibrium unemployment as a worker discipline device.
The American Economic Review 74, 433–444.
Stein, J. C., 2003. Agency, information and corporate investment. Handbook of the Eco-
nomics of Finance 1, 111–165.
Stuebs, M., Sun, L., 2010. Business reputation and labor efficiency, productivity, and cost.
Journal of Business Ethics 96, 265–283.
Sun, L., Stuebs, M., 2013. Corporate social responsibility and firm productivity: Evidence
from the chemical industry in the united states. Journal of Business Ethics 118, 251–263.
Titman, S., 1984. The effect of capital structure on a firm’s liquidation decision. Journal of
financial economics 13, 137–151.
Turban, D. B., Greening, D. W., 1997. Corporate social performance and organizational
attractiveness to prospective employees. Academy of management journal 40, 658–672.
Verwijmeren, P., Derwall, J., 2010. Employee well-being, firm leverage, and bankruptcy risk.
Journal of Banking & Finance 34, 956–964.
Yashiv, E., 2007. Labor and the market value of the firm. The American Economic Review
97, 1419–1431.
Zingales, L., 2000. In search of new foundations. The journal of Finance 55, 1623–1653.
34
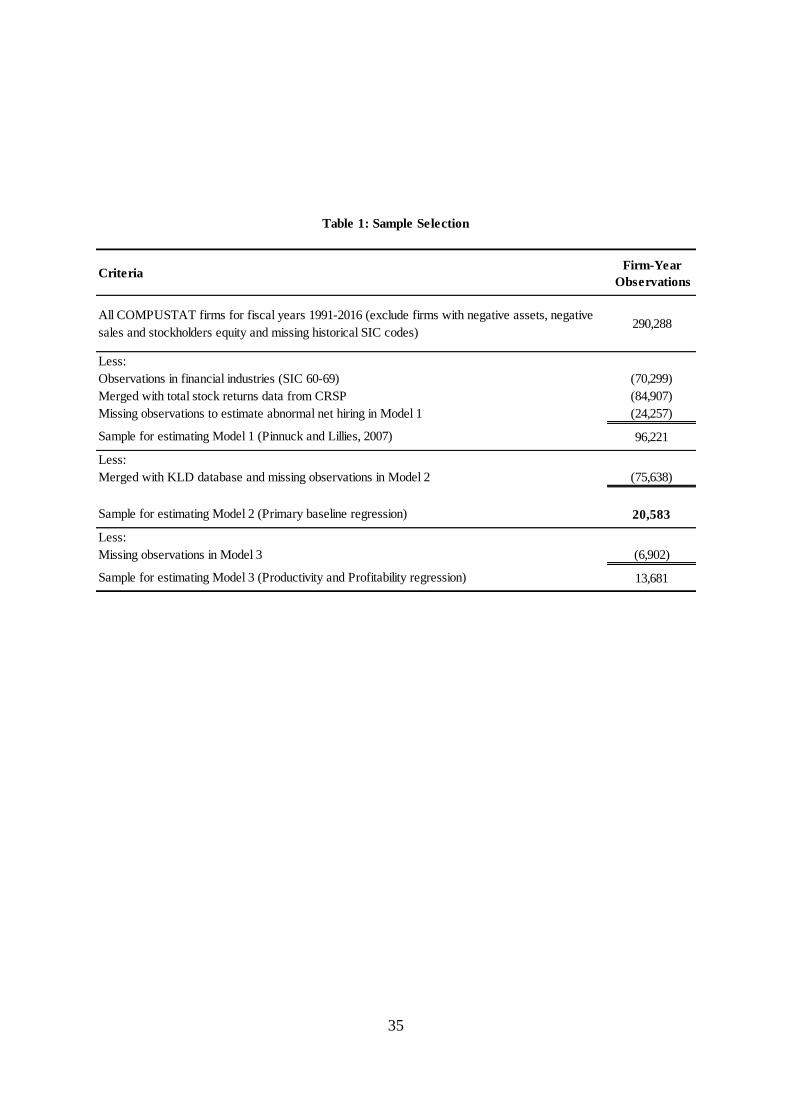
35
Firm-Year
Observations
290,288
(70,299)
(84,907)
(24,257)
96,221
Less:
(75,638)
20,583
(6,902)
13,681Sample for estimating Model 3 (Productivity and Profitability regression)
Less:
Sample for estimating Model 1 (Pinnuck and Lillies, 2007)
Merged with KLD database and missing observations in Model 2
Sample for estimating Model 2 (Primary baseline regression)
Criteria
Table 1: Sample Selection
Missing observations in Model 3
All COMPUSTAT firms for fiscal years 1991-2016 (exclude firms with negative assets, negative
sales and stockholders equity and missing historical SIC codes)
Observations in financial industries (SIC 60-69)
Merged with total stock returns data from CRSP
Missing observations to estimate abnormal net hiring in Model 1
Less:

36
N Mean Median Std.Dev 25th Percentile 75th Percentile
AB_NETHIRE it 20,583 0.122 0.075 0.181 0.037 0.137
OVER_LABOR it 6,527 0.162 0.072 0.273 0.028 0.169
UNDER_LABOR it 14,056 -0.103 -0.076 0.110 -0.130 -0.040
EMP_TREAT it 20,583 -0.035 0.000 0.768 0.000 0.000
MTB it-1 20,583 3.206 2.263 3.930 1.479 3.725
SIZE it-1 20,583 7.253 7.117 1.558 6.100 8.275
LIQ it-1 20,583 1.870 1.240 2.063 0.770 2.136
LEV it-1 20,583 0.243 0.206 0.247 0.032 0.356
DIVD it-1 20,583 0.469 0.000 0.499 0.000 1.000
TANGIBLES it-1 20,583 0.289 0.213 0.237 0.099 0.428
LOSS it-1 20,583 0.209 0.000 0.406 0.000 0.000
LABINT it-1 20,583 0.006 0.003 0.011 0.002 0.006
INVEST it 20,583 0.108 0.084 0.171 0.046 0.120
SD_CFO it-1 20,583 0.053 0.037 0.058 0.022 0.062
SD_SALES it-1 20,583 0.144 0.103 0.135 0.060 0.180
SD_NETHIRE it-1 20,583 0.177 0.111 0.237 0.061 0.201
UNION it-1 20,583 0.104 0.074 0.089 0.040 0.143
PRODC_SALES it 13,681 5.682 5.640 0.880 5.190 6.130
PRODC_GPROFIT it 13,374 4.637 4.673 1.030 4.047 5.248
PRODC_NETINCOME it 11,149 2.902 2.930 1.374 2.080 3.762
ROA it 13,627 0.044 0.054 0.127 0.017 0.097
GOVERNANCE it-1 13,681 -0.274 0.000 0.687 -1.000 0.000
CAPX it-1 13,681 0.055 0.038 0.058 0.020 0.068
TABLE 2
Panel A
Descriptive Statistics of Selected Variables in Model 2 and Model 3
The Panel A of Table 2 presents the descriptive statistics for the 20,583 firm-year observations over the period
between 1995 and 2015. This table presents the number of observations, the mean, the median, the standard deviation,
the values for the first and the third quartile for all the variables in Equation 2 and Equation 3.
AB_NETHIRE is the aboslute value of the difference between actual net hiring and the expected level measrued on
Pinnuck and Lillis (2007). OVER_LABOR is the positive abnormal net hiring as the measure for labor overinvestment.
UNDER_LABOR is the negative abnormal net hiring as the measure for labor underinvestment. EMP_TREAT is the
employee treatment score constructed from KLD. MTB is the ratio of market to book value of common equity at the
beginning of the year. SIZE is the log of market value of equity at the beginning of the year. DIVD is an indicator
variable equal to 1 if the firm pays dividends in the previous year, 0 otherwise. LIQ is the ratio of cash and short-term
investments plus receivables to current liabilities. LEV is the ratio of long-term debt to total assets at the beginning of
the year. SD_CFO is the standard dviation of cash flow from operation over year t-5 to t-1. SD_SALES is the
standard deviation of sales revenue over year t-5 to t-1. TANGIBLES is the ratio of property , plant and equipment to
total assets at the beginning of the year. LOSS is an indicator variable equal to 1 if the firm reported a loss in the
previous year, 0 otherwise. SD_NETHIRE is the standard deviation of percentage change in employee over year t-5 to
t-1. LABINT is the ratio of employees to total assets at the beginning of the year. UNION is the industry-level rate of
labor unionization for year t-1. AB_INVEST it the absolute value of the residual from the model of Biddle et al (2009).
PRODC_SALES, PRODC_GPROFIT and PRODC_NETINCOME are three measures of employee productivity
measured as the natural logarithm of sales divided by the number of employee, the natural logarithm of gross profit
divided by the number of employee and the natural logarithm of net income divided by the number of employee. ROA is
the return on assets. GOVERNANCE is the corporate governance score from KLD database. CAPX is the ratio of
capital expenditures to total assets.

37
Panel B
Year N AB_NETHIRE EMP_TREAT
1995 299 0.111 0.271
1996 303 0.102 0.274
1997 313 0.098 0.307
1998 323 0.120 0.390
1999 324 0.121 0.383
2000 326 0.125 0.374
2001 494 0.150 0.231
2002 642 0.103 0.106
2003 1,375 0.137 -0.149
2004 1,432 0.141 -0.235
2005 1,285 0.129 -0.270
2006 1,276 0.126 -0.313
2007 1,218 0.123 -0.286
2008 1,348 0.119 -0.279
2009 1,409 0.128 -0.238
2010 1,471 0.127 -0.011
2011 1,429 0.117 0.013
2012 1,424 0.112 0.100
2013 1,437 0.110 0.174
2014 1,333 0.112 0.140
2015 1,122 0.113 0.199
Mean Abnormal Net Hiring and Employee Treatment
Scores by Year
The Panel B of Table 2 presents the mean abnormal net hiring
(AB_NETHIRE ) and employee treatment (EMP_TREAT ) by year
over the period between 1995 and 2015.
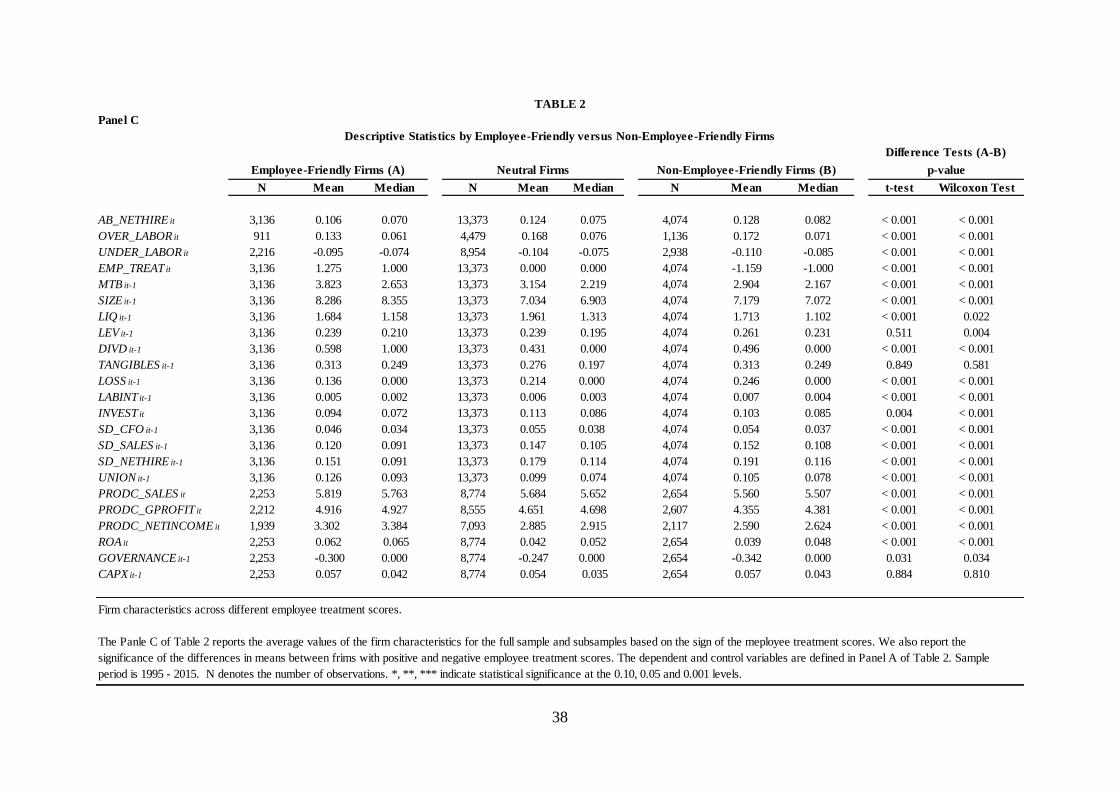
38
N Mean Median N Mean Median N Mean Median t-test Wilcoxon Test
AB_NETHIRE it 3,136 0.106 0.070 13,373 0.124 0.075 4,074 0.128 0.082 < 0.001 < 0.001
OVER_LABOR it 911 0.133 0.061 4,479 0.168 0.076 1,136 0.172 0.071 < 0.001 < 0.001
UNDER_LABOR it 2,216 -0.095 -0.074 8,954 -0.104 -0.075 2,938 -0.110 -0.085 < 0.001 < 0.001
EMP_TREAT it 3,136 1.275 1.000 13,373 0.000 0.000 4,074 -1.159 -1.000 < 0.001 < 0.001
MTB it-1 3,136 3.823 2.653 13,373 3.154 2.219 4,074 2.904 2.167 < 0.001 < 0.001
SIZE it-1 3,136 8.286 8.355 13,373 7.034 6.903 4,074 7.179 7.072 < 0.001 < 0.001
LIQ it-1 3,136 1.684 1.158 13,373 1.961 1.313 4,074 1.713 1.102 < 0.001 0.022
LEV it-1 3,136 0.239 0.210 13,373 0.239 0.195 4,074 0.261 0.231 0.511 0.004
DIVD it-1 3,136 0.598 1.000 13,373 0.431 0.000 4,074 0.496 0.000 < 0.001 < 0.001
TANGIBLES it-1 3,136 0.313 0.249 13,373 0.276 0.197 4,074 0.313 0.249 0.849 0.581
LOSS it-1 3,136 0.136 0.000 13,373 0.214 0.000 4,074 0.246 0.000 < 0.001 < 0.001
LABINT it-1 3,136 0.005 0.002 13,373 0.006 0.003 4,074 0.007 0.004 < 0.001 < 0.001
INVEST it 3,136 0.094 0.072 13,373 0.113 0.086 4,074 0.103 0.085 0.004 < 0.001
SD_CFO it-1 3,136 0.046 0.034 13,373 0.055 0.038 4,074 0.054 0.037 < 0.001 < 0.001
SD_SALES it-1 3,136 0.120 0.091 13,373 0.147 0.105 4,074 0.152 0.108 < 0.001 < 0.001
SD_NETHIRE it-1 3,136 0.151 0.091 13,373 0.179 0.114 4,074 0.191 0.116 < 0.001 < 0.001
UNION it-1 3,136 0.126 0.093 13,373 0.099 0.074 4,074 0.105 0.078 < 0.001 < 0.001
PRODC_SALES it 2,253 5.819 5.763 8,774 5.684 5.652 2,654 5.560 5.507 < 0.001 < 0.001
PRODC_GPROFIT it 2,212 4.916 4.927 8,555 4.651 4.698 2,607 4.355 4.381 < 0.001 < 0.001
PRODC_NETINCOME it 1,939 3.302 3.384 7,093 2.885 2.915 2,117 2.590 2.624 < 0.001 < 0.001
ROA it 2,253 0.062 0.065 8,774 0.042 0.052 2,654 0.039 0.048 < 0.001 < 0.001
GOVERNANCE it-1 2,253 -0.300 0.000 8,774 -0.247 0.000 2,654 -0.342 0.000 0.031 0.034
CAPX it-1 2,253 0.057 0.042 8,774 0.054 0.035 2,654 0.057 0.043 0.884 0.810
Firm characteristics across different employee treatment scores.
The Panle C of Table 2 reports the average values of the firm characteristics for the full sample and subsamples based on the sign of the meployee treatment scores. We also report the
significance of the differences in means between frims with positive and negative employee treatment scores. The dependent and control variables are defined in Panel A of Table 2. Sample
period is 1995 - 2015. N denotes the number of observations. *, **, *** indicate statistical significance at the 0.10, 0.05 and 0.001 levels.
TABLE 2
Panel C
Descriptive Statistics by Employee-Friendly versus Non-Employee-Friendly Firms
Difference Tests (A-B)
Employee-Friendly Firms (A) Neutral Firms Non-Employee-Friendly Firms (B) p-value
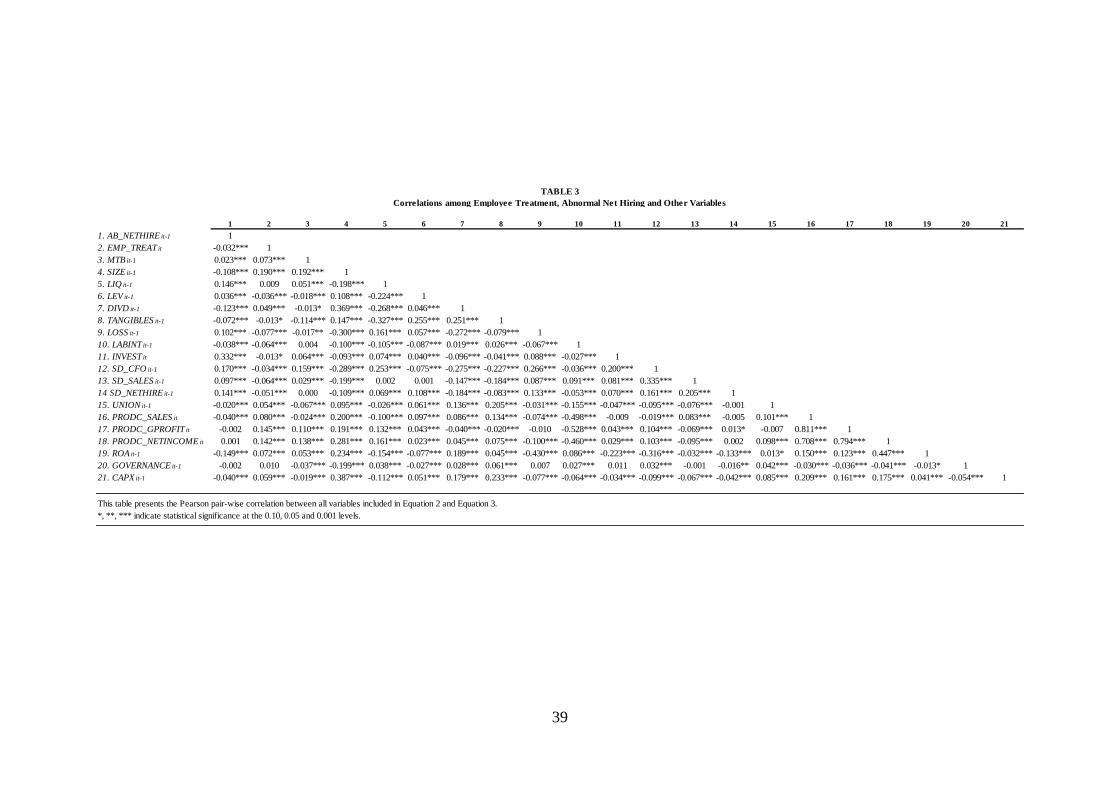
39
1 2 3 4 5 6 7 8 9 10 11 12 13 14 15 16 17 18 19 20 21
1. AB_NETHIRE it-1 1
2. EMP_TREAT it -0.032*** 1
3. MTB it-1 0.023*** 0.073*** 1
4. SIZE it-1 -0.108*** 0.190*** 0.192*** 1
5. LIQ it-1 0.146*** 0.009 0.051*** -0.198*** 1
6. LEV it-1 0.036*** -0.036*** -0.018*** 0.108*** -0.224*** 1
7. DIVD it-1 -0.123*** 0.049*** -0.013* 0.369*** -0.268*** 0.046*** 1
8. TANGIBLES it-1 -0.072*** -0.013* -0.114*** 0.147*** -0.327*** 0.255*** 0.251*** 1
9. LOSS it-1 0.102*** -0.077*** -0.017** -0.300*** 0.161*** 0.057*** -0.272*** -0.079*** 1
10. LABINT it-1 -0.038*** -0.064*** 0.004 -0.100*** -0.105*** -0.087*** 0.019*** 0.026*** -0.067*** 1
11. INVEST it 0.332*** -0.013* 0.064*** -0.093*** 0.074*** 0.040*** -0.096*** -0.041*** 0.088*** -0.027*** 1
12. SD_CFO it-1 0.170*** -0.034*** 0.159*** -0.289*** 0.253*** -0.075*** -0.275*** -0.227*** 0.266*** -0.036*** 0.200*** 1
13. SD_SALES it-1 0.097*** -0.064*** 0.029*** -0.199*** 0.002 0.001 -0.147*** -0.184*** 0.087*** 0.091*** 0.081*** 0.335*** 1
14 SD_NETHIRE it-1 0.141*** -0.051*** 0.000 -0.109*** 0.069*** 0.108*** -0.184*** -0.083*** 0.133*** -0.053*** 0.070*** 0.161*** 0.205*** 1
15. UNION it-1 -0.020*** 0.054*** -0.067*** 0.095*** -0.026*** 0.061*** 0.136*** 0.205*** -0.031*** -0.155*** -0.047*** -0.095*** -0.076*** -0.001 1
16. PRODC_SALES it -0.040*** 0.080*** -0.024*** 0.200*** -0.100*** 0.097*** 0.086*** 0.134*** -0.074*** -0.498*** -0.009 -0.019*** 0.083*** -0.005 0.101*** 1
17. PRODC_GPROFIT it -0.002 0.145*** 0.110*** 0.191*** 0.132*** 0.043*** -0.040*** -0.020*** -0.010 -0.528*** 0.043*** 0.104*** -0.069*** 0.013* -0.007 0.811*** 1
18. PRODC_NETINCOME it 0.001 0.142*** 0.138*** 0.281*** 0.161*** 0.023*** 0.045*** 0.075*** -0.100*** -0.460*** 0.029*** 0.103*** -0.095*** 0.002 0.098*** 0.708*** 0.794*** 1
19. ROA it-1 -0.149*** 0.072*** 0.053*** 0.234*** -0.154*** -0.077*** 0.189*** 0.045*** -0.430*** 0.086*** -0.223*** -0.316*** -0.032*** -0.133*** 0.013* 0.150*** 0.123*** 0.447*** 1
20. GOVERNANCE it-1 -0.002 0.010 -0.037*** -0.199*** 0.038*** -0.027*** 0.028*** 0.061*** 0.007 0.027*** 0.011 0.032*** -0.001 -0.016** 0.042*** -0.030*** -0.036*** -0.041*** -0.013* 1
21. CAPX it-1 -0.040*** 0.059*** -0.019*** 0.387*** -0.112*** 0.051*** 0.179*** 0.233*** -0.077*** -0.064*** -0.034*** -0.099*** -0.067*** -0.042*** 0.085*** 0.209*** 0.161*** 0.175*** 0.041*** -0.054*** 1
TABLE 3
Correlations among Employee Treatment, Abnormal Net Hiring and Other Variables
This table presents the Pearson pair-wise correlation between all variables included in Equation 2 and Equation 3.
*, **, *** indicate statistical significance at the 0.10, 0.05 and 0.001 levels.
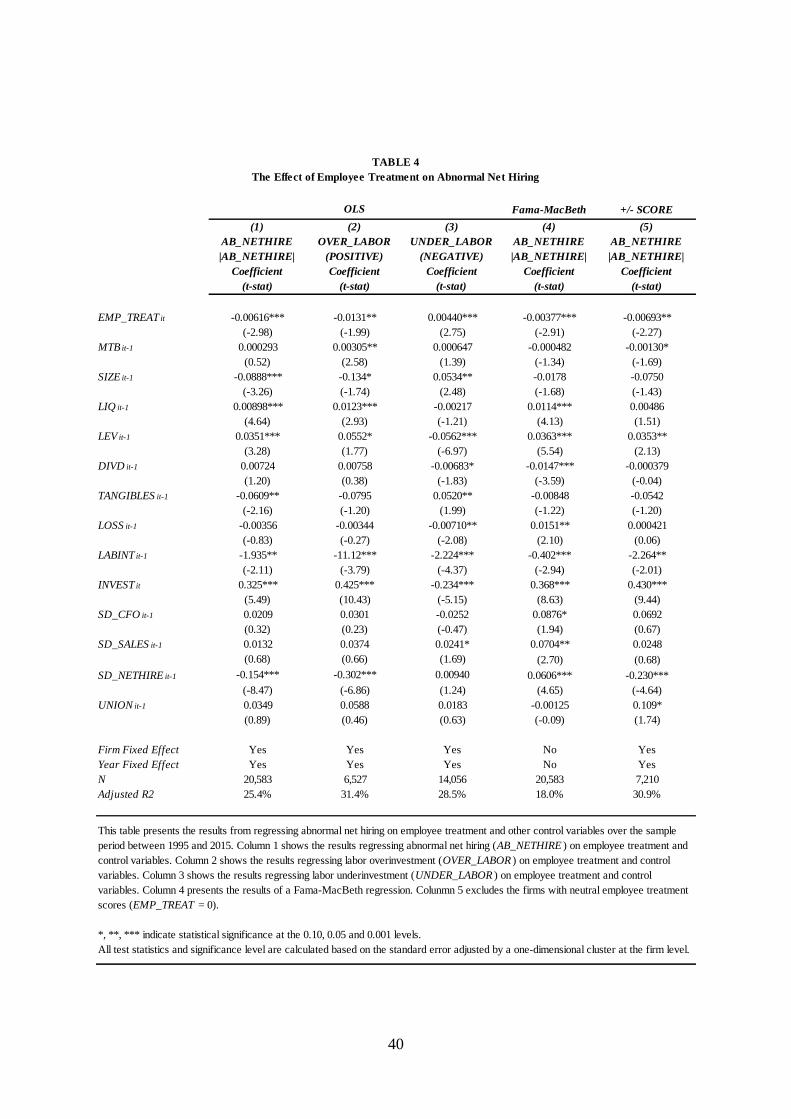
40
Fama-MacBeth +/- SCORE
(1)
AB_NETHIRE
|AB_NETHIRE|
Coefficient
(t-stat)
(2)
OVER_LABOR
(POSITIVE)
Coefficient
(t-stat)
(3)
UNDER_LABOR
(NEGATIVE)
Coefficient
(t-stat)
(4)
AB_NETHIRE
|AB_NETHIRE|
Coefficient
(t-stat)
(5)
AB_NETHIRE
|AB_NETHIRE|
Coefficient
(t-stat)
EMP_TREAT it -0.00616*** -0.0131** 0.00440*** -0.00377*** -0.00693**
(-2.98) (-1.99) (2.75) (-2.91) (-2.27)
MTB it-1 0.000293 0.00305** 0.000647 -0.000482 -0.00130*
(0.52) (2.58) (1.39) (-1.34) (-1.69)
SIZE it-1 -0.0888*** -0.134* 0.0534** -0.0178 -0.0750
(-3.26) (-1.74) (2.48) (-1.68) (-1.43)
LIQ it-1 0.00898*** 0.0123*** -0.00217 0.0114*** 0.00486
(4.64) (2.93) (-1.21) (4.13) (1.51)
LEV it-1 0.0351*** 0.0552* -0.0562*** 0.0363*** 0.0353**
(3.28) (1.77) (-6.97) (5.54) (2.13)
DIVD it-1 0.00724 0.00758 -0.00683* -0.0147*** -0.000379
(1.20) (0.38) (-1.83) (-3.59) (-0.04)
TANGIBLES it-1 -0.0609** -0.0795 0.0520** -0.00848 -0.0542
(-2.16) (-1.20) (1.99) (-1.22) (-1.20)
LOSS it-1 -0.00356 -0.00344 -0.00710** 0.0151** 0.000421
(-0.83) (-0.27) (-2.08) (2.10) (0.06)
LABINT it-1 -1.935** -11.12*** -2.224*** -0.402*** -2.264**
(-2.11) (-3.79) (-4.37) (-2.94) (-2.01)
INVEST it 0.325*** 0.425*** -0.234*** 0.368*** 0.430***
(5.49) (10.43) (-5.15) (8.63) (9.44)
SD_CFO it-1 0.0209 0.0301 -0.0252 0.0876* 0.0692
(0.32) (0.23) (-0.47) (1.94) (0.67)
SD_SALES it-1 0.0132 0.0374 0.0241* 0.0704** 0.0248
(0.68) (0.66) (1.69) (2.70) (0.68)
SD_NETHIRE it-1 -0.154*** -0.302*** 0.00940 0.0606*** -0.230***
(-8.47) (-6.86) (1.24) (4.65) (-4.64)
UNION it-1 0.0349 0.0588 0.0183 -0.00125 0.109*
(0.89) (0.46) (0.63) (-0.09) (1.74)
Firm Fixed Effect Yes Yes Yes No Yes
Year Fixed Effect Yes Yes Yes No Yes
N 20,583 6,527 14,056 20,583 7,210
Adjusted R2 25.4% 31.4% 28.5% 18.0% 30.9%
TABLE 4
The Effect of Employee Treatment on Abnormal Net Hiring
OLS
This table presents the results from regressing abnormal net hiring on employee treatment and other control variables over the sample
period between 1995 and 2015. Column 1 shows the results regressing abnormal net hiring (AB_NETHIRE ) on employee treatment and
control variables. Column 2 shows the results regressing labor overinvestment (OVER_LABOR ) on employee treatment and control
variables. Column 3 shows the results regressing labor underinvestment (UNDER_LABOR ) on employee treatment and control
variables. Column 4 presents the results of a Fama-MacBeth regression. Colunmn 5 excludes the firms with neutral employee treatment
scores (EMP_TREAT = 0).
*, **, *** indicate statistical significance at the 0.10, 0.05 and 0.001 levels.
All test statistics and significance level are calculated based on the standard error adjusted by a one-dimensional cluster at the firm level.
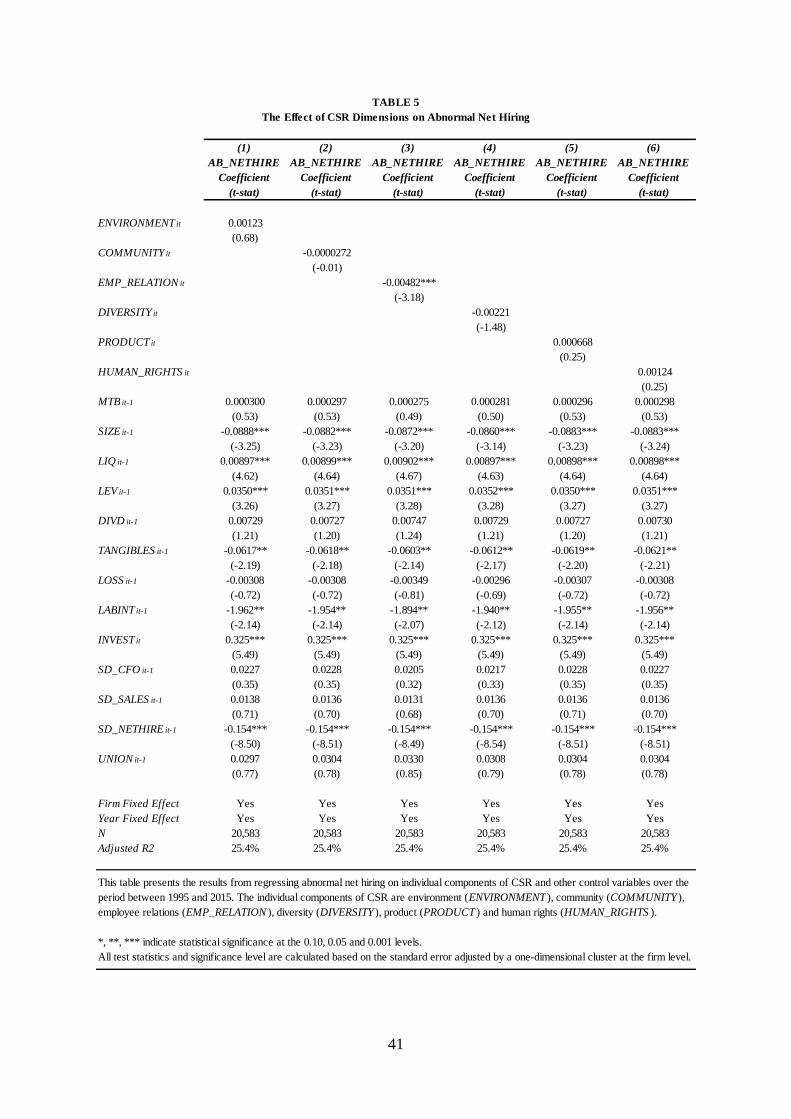
41
(1)
AB_NETHIRE
Coefficient
(t-stat)
(2)
AB_NETHIRE
Coefficient
(t-stat)
(3)
AB_NETHIRE
Coefficient
(t-stat)
(4)
AB_NETHIRE
Coefficient
(t-stat)
(5)
AB_NETHIRE
Coefficient
(t-stat)
(6)
AB_NETHIRE
Coefficient
(t-stat)
ENVIRONMENT it 0.00123
(0.68)
COMMUNITY it -0.0000272
(-0.01)
EMP_RELATION it -0.00482***
(-3.18)
DIVERSITY it -0.00221
(-1.48)
PRODUCT it 0.000668
(0.25)
HUMAN_RIGHTS it 0.00124
(0.25)
MTB it-1 0.000300 0.000297 0.000275 0.000281 0.000296 0.000298
(0.53) (0.53) (0.49) (0.50) (0.53) (0.53)
SIZE it-1 -0.0888*** -0.0882*** -0.0872*** -0.0860*** -0.0883*** -0.0883***
(-3.25) (-3.23) (-3.20) (-3.14) (-3.23) (-3.24)
LIQ it-1 0.00897*** 0.00899*** 0.00902*** 0.00897*** 0.00898*** 0.00898***
(4.62) (4.64) (4.67) (4.63) (4.64) (4.64)
LEV it-1 0.0350*** 0.0351*** 0.0351*** 0.0352*** 0.0350*** 0.0351***
(3.26) (3.27) (3.28) (3.28) (3.27) (3.27)
DIVD it-1 0.00729 0.00727 0.00747 0.00729 0.00727 0.00730
(1.21) (1.20) (1.24) (1.21) (1.20) (1.21)
TANGIBLES it-1 -0.0617** -0.0618** -0.0603** -0.0612** -0.0619** -0.0621**
(-2.19) (-2.18) (-2.14) (-2.17) (-2.20) (-2.21)
LOSS it-1 -0.00308 -0.00308 -0.00349 -0.00296 -0.00307 -0.00308
(-0.72) (-0.72) (-0.81) (-0.69) (-0.72) (-0.72)
LABINT it-1 -1.962** -1.954** -1.894** -1.940** -1.955** -1.956**
(-2.14) (-2.14) (-2.07) (-2.12) (-2.14) (-2.14)
INVEST it 0.325*** 0.325*** 0.325*** 0.325*** 0.325*** 0.325***
(5.49) (5.49) (5.49) (5.49) (5.49) (5.49)
SD_CFO it-1 0.0227 0.0228 0.0205 0.0217 0.0228 0.0227
(0.35) (0.35) (0.32) (0.33) (0.35) (0.35)
SD_SALES it-1 0.0138 0.0136 0.0131 0.0136 0.0136 0.0136
(0.71) (0.70) (0.68) (0.70) (0.71) (0.70)
SD_NETHIRE it-1 -0.154*** -0.154*** -0.154*** -0.154*** -0.154*** -0.154***
(-8.50) (-8.51) (-8.49) (-8.54) (-8.51) (-8.51)
UNION it-1 0.0297 0.0304 0.0330 0.0308 0.0304 0.0304
(0.77) (0.78) (0.85) (0.79) (0.78) (0.78)
Firm Fixed Effect Yes Yes Yes Yes Yes Yes
Year Fixed Effect Yes Yes Yes Yes Yes Yes
N 20,583 20,583 20,583 20,583 20,583 20,583
Adjusted R2 25.4% 25.4% 25.4% 25.4% 25.4% 25.4%
TABLE 5
The Effect of CSR Dimensions on Abnormal Net Hiring
This table presents the results from regressing abnormal net hiring on individual components of CSR and other control variables over the
period between 1995 and 2015. The individual components of CSR are environment (ENVIRONMENT ), community (COMMUNITY ),
employee relations (EMP_RELATION ), diversity (DIVERSITY ), product (PRODUCT ) and human rights (HUMAN_RIGHTS ).
*, **, *** indicate statistical significance at the 0.10, 0.05 and 0.001 levels.
All test statistics and significance level are calculated based on the standard error adjusted by a one-dimensional cluster at the firm level.
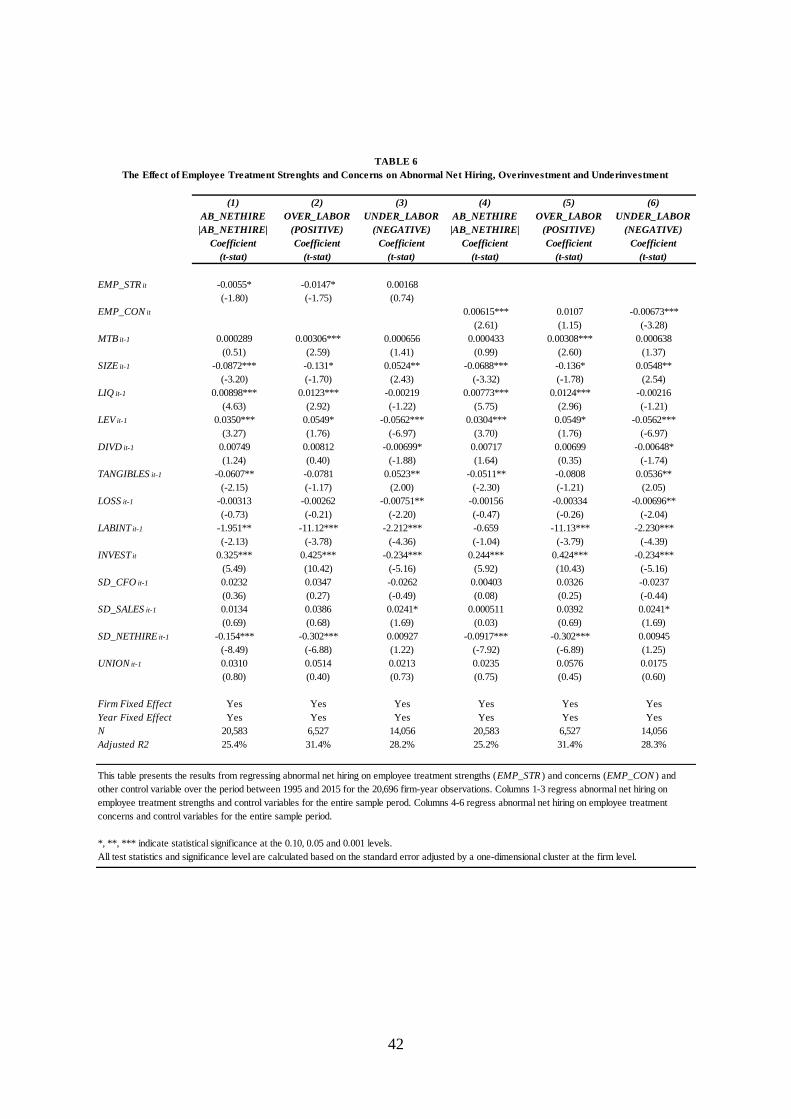
42
(1)
AB_NETHIRE
|AB_NETHIRE|
Coefficient
(t-stat)
(2)
OVER_LABOR
(POSITIVE)
Coefficient
(t-stat)
(3)
UNDER_LABOR
(NEGATIVE)
Coefficient
(t-stat)
(4)
AB_NETHIRE
|AB_NETHIRE|
Coefficient
(t-stat)
(5)
OVER_LABOR
(POSITIVE)
Coefficient
(t-stat)
(6)
UNDER_LABOR
(NEGATIVE)
Coefficient
(t-stat)
EMP_STR it -0.0055* -0.0147* 0.00168
(-1.80) (-1.75) (0.74)
EMP_CON it 0.00615*** 0.0107 -0.00673***
(2.61) (1.15) (-3.28)
MTB it-1 0.000289 0.00306*** 0.000656 0.000433 0.00308*** 0.000638
(0.51) (2.59) (1.41) (0.99) (2.60) (1.37)
SIZE it-1 -0.0872*** -0.131* 0.0524** -0.0688*** -0.136* 0.0548**
(-3.20) (-1.70) (2.43) (-3.32) (-1.78) (2.54)
LIQ it-1 0.00898*** 0.0123*** -0.00219 0.00773*** 0.0124*** -0.00216
(4.63) (2.92) (-1.22) (5.75) (2.96) (-1.21)
LEV it-1 0.0350*** 0.0549* -0.0562*** 0.0304*** 0.0549* -0.0562***
(3.27) (1.76) (-6.97) (3.70) (1.76) (-6.97)
DIVD it-1 0.00749 0.00812 -0.00699* 0.00717 0.00699 -0.00648*
(1.24) (0.40) (-1.88) (1.64) (0.35) (-1.74)
TANGIBLES it-1 -0.0607** -0.0781 0.0523** -0.0511** -0.0808 0.0536**
(-2.15) (-1.17) (2.00) (-2.30) (-1.21) (2.05)
LOSS it-1 -0.00313 -0.00262 -0.00751** -0.00156 -0.00334 -0.00696**
(-0.73) (-0.21) (-2.20) (-0.47) (-0.26) (-2.04)
LABINT it-1 -1.951** -11.12*** -2.212*** -0.659 -11.13*** -2.230***
(-2.13) (-3.78) (-4.36) (-1.04) (-3.79) (-4.39)
INVEST it 0.325*** 0.425*** -0.234*** 0.244*** 0.424*** -0.234***
(5.49) (10.42) (-5.16) (5.92) (10.43) (-5.16)
SD_CFO it-1 0.0232 0.0347 -0.0262 0.00403 0.0326 -0.0237
(0.36) (0.27) (-0.49) (0.08) (0.25) (-0.44)
SD_SALES it-1 0.0134 0.0386 0.0241* 0.000511 0.0392 0.0241*
(0.69) (0.68) (1.69) (0.03) (0.69) (1.69)
SD_NETHIRE it-1 -0.154*** -0.302*** 0.00927 -0.0917*** -0.302*** 0.00945
(-8.49) (-6.88) (1.22) (-7.92) (-6.89) (1.25)
UNION it-1 0.0310 0.0514 0.0213 0.0235 0.0576 0.0175
(0.80) (0.40) (0.73) (0.75) (0.45) (0.60)
Firm Fixed Effect Yes Yes Yes Yes Yes Yes
Year Fixed Effect Yes Yes Yes Yes Yes Yes
N 20,583 6,527 14,056 20,583 6,527 14,056
Adjusted R2 25.4% 31.4% 28.2% 25.2% 31.4% 28.3%
TABLE 6
The Effect of Employee Treatment Strenghts and Concerns on Abnormal Net Hiring, Overinvestment and Underinvestment
This table presents the results from regressing abnormal net hiring on employee treatment strengths (EMP_STR ) and concerns (EMP_CON ) and
other control variable over the period between 1995 and 2015 for the 20,696 firm-year observations. Columns 1-3 regress abnormal net hiring on
employee treatment strengths and control variables for the entire sample perod. Columns 4-6 regress abnormal net hiring on employee treatment
concerns and control variables for the entire sample period.
*, **, *** indicate statistical significance at the 0.10, 0.05 and 0.001 levels.
All test statistics and significance level are calculated based on the standard error adjusted by a one-dimensional cluster at the firm level.
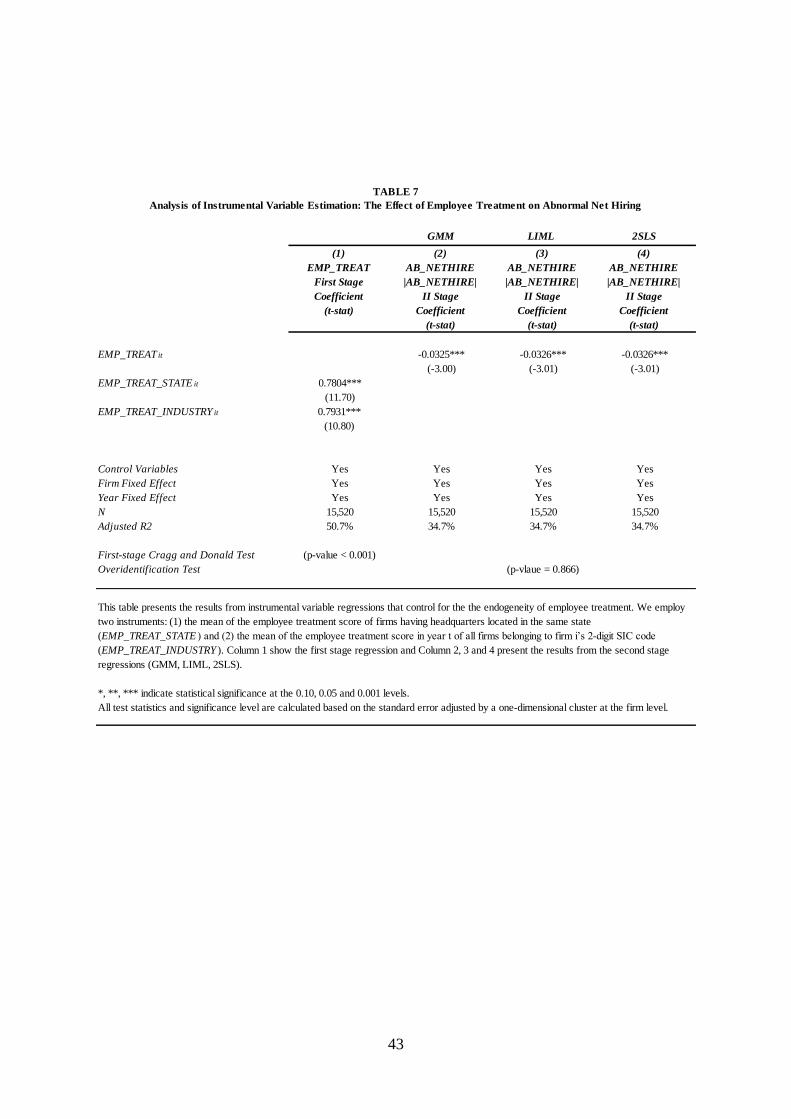
43
GMM LIML 2SLS
(1)
EMP_TREAT
First Stage
Coefficient
(t-stat)
(2)
AB_NETHIRE
|AB_NETHIRE|
II Stage
Coefficient
(t-stat)
(3)
AB_NETHIRE
|AB_NETHIRE|
II Stage
Coefficient
(t-stat)
(4)
AB_NETHIRE
|AB_NETHIRE|
II Stage
Coefficient
(t-stat)
EMP_TREAT it -0.0325*** -0.0326*** -0.0326***
(-3.00) (-3.01) (-3.01)
EMP_TREAT_STATE it 0.7804***
(11.70)
EMP_TREAT_INDUSTRY it 0.7931***
(10.80)
Control Variables Yes Yes Yes Yes
Firm Fixed Effect Yes Yes Yes Yes
Year Fixed Effect Yes Yes Yes Yes
N 15,520 15,520 15,520 15,520
Adjusted R2 50.7% 34.7% 34.7% 34.7%
First-stage Cragg and Donald Test (p-value < 0.001)
Overidentification Test
TABLE 7
Analysis of Instrumental Variable Estimation: The Effect of Employee Treatment on Abnormal Net Hiring
(p-vlaue = 0.866)
This table presents the results from instrumental variable regressions that control for the the endogeneity of employee treatment. We employ
two instruments: (1) the mean of the employee treatment score of firms having headquarters located in the same state
(EMP_TREAT_STATE ) and (2) the mean of the employee treatment score in year t of all firms belonging to firm i’s 2-digit SIC code
(EMP_TREAT_INDUSTRY ). Column 1 show the first stage regression and Column 2, 3 and 4 present the results from the second stage
regressions (GMM, LIML, 2SLS).
*, **, *** indicate statistical significance at the 0.10, 0.05 and 0.001 levels.
All test statistics and significance level are calculated based on the standard error adjusted by a one-dimensional cluster at the firm level.

44
(1)
AB_NETHIRE
|AB_NETHIRE|
Coefficient
(t-stat)
(2)
OVER_LABOR
(POSITIVE)
Coefficient
(t-stat)
(3)
UNDER_LABOR
(NEGATIVE)
Coefficient
(t-stat)
BEST100 it -0.142** -0.220*** 0.0787***
(-2.46) (-5.15) -8.73
MTB it-1 0.00009 0.00166 0.000924
-0.14 -1.06 -1.58
SIZE it-1 -0.0944*** -0.0337 0.0640**
(-2.99) (-0.38) -2.45
LIQ it-1 0.00848*** 0.0108** -0.00231
-4.07 -2.22 (-1.11)
LEV it-1 0.0444*** 0.0359 -0.0656***
-3.63 -0.99 (-7.20)
DIVD it-1 0.00335 0.00135 -0.00719
-0.42 -0.05 (-1.49)
TANGIBLES it-1 -0.0727** -0.0509 0.0737**
(-2.14) (-0.62) -2.28
LOSS it-1 -0.00473 -0.00791 -0.00777*
(-0.98) (-0.52) (-1.94)
LABINT it-1 -2.219* -14.07*** -2.510***
(-1.88) (-3.86) (-3.71)
INVEST it 0.391*** 0.420*** -0.237***
-11.63 -8.95 (-5.02)
SD_CFO it-1 0.0332 0.055 -0.012
-0.45 -0.35 (-0.20)
SD_SALES it-1 0.0178 0.104 0.0305*
-0.87 -1.59 -1.93
SD_NETHIRE it-1 -0.191*** -0.372*** 0.0178*
(-9.00) (-6.59) -1.92
UNION it-1 0.0191 0.166 0.0361
-0.45 -1.1 -1.13
Firm Fixed Effect Yes Yes Yes
Year Fixed Effect Yes Yes Yes
N 15,776 4,989 10,787
Adjusted R2 26.7% 33.5% 29.5%
TABLE 8
The Effect of Alternative Employee Treatment on Abnormal Net Hiring
OLS
This table presents the results from regressing abnormal net hiring on alternative employee treatment
measured as Fortune's Best 100 List and other control variables over the period between 1998 and
2012. Column 1 shows the results regressing abnormal net hiring on alternative employee treatment and
control variables. Column 2 shows the results regressing labor overinvestment on alternative employee
treatment and control variables. Column 3 shows the results regressing labor underinvestment on
employee treatment and control variables.
*, **, *** indicate statistical significance at the 0.10, 0.05 and 0.001 levels.
All test statistics and significance level are calculated based on the standard error adjusted by a one-
dimensional cluster at the firm level.

45
Cella (2010) Biddle (2009) Augmented Pinnuck and Lillis (2007)
(1)
AB_NETHIRE
|AB_NETHIRE|
Coefficient
(t-stat)
(2)
AB_NETHIRE
|AB_NETHIRE|
Coefficient
(t-stat)
(3)
AB_NETHIRE
|AB_NETHIRE|
Coefficient
(t-stat)
EMP_TREAT it -0.00514*** -0.00598*** -0.00501**
(-2.58) (-2.71) (-2.35)
MTB it-1 0.00115** 0.000709 0.000819
(2.02) (1.13) (1.42)
SIZE it-1 -0.0681** -0.0743** -0.0826***
(-2.28) (-2.33) (-2.68)
LIQ it-1 0.00852*** 0.00756*** 0.00806***
(4.22) (3.80) (4.14)
LEV it-1 -0.00442 0.0314*** 0.0240**
(-0.31) (2.71) (2.08)
DIVD it-1 0.00209 0.00708 0.00625
(0.32) (1.08) (0.97)
TANGIBLES it-1 -0.0715*** -0.0643** -0.0763***
(-2.68) (-2.17) (-2.65)
LOSS it-1 -0.00132 0.00611 -0.00256
(-0.30) (1.34) (-0.57)
LABINT it-1 -2.698*** -2.954*** -1.865**
(-2.75) (-2.81) (-2.00)
INVEST it 0.275*** 0.356*** 0.301***
(6.46) (5.48) (5.46)
SD_CFO it-1 -0.0715 -0.00236 -0.0294
(-1.01) (-0.03) (-0.44)
SD_SALES it-1 0.0365* 0.00369 0.00590
(1.83) (0.17) (0.31)
SD_NETHIRE it-1 -0.170*** -0.168*** -0.175***
(-8.46) (-8.41) (-8.99)
UNION it-1 0.0460 0.0264 0.0873**
(1.03) (0.63) (2.19)
Firm Fixed Effect Yes Yes Yes
Year Fixed Effect Yes Yes Yes
N 20,696 20,696 19,994
Adjusted R2 23.7% 25.9% 24.0%
TABLE 9
The Effect of Employee Treatment on Alternative Abnormal Net Hiring
This table presents the results from regressing alternative measure of abnormal net hiring on employee treatment and other control variables
over the period between 1995 and 2015. Columns 1 shows the results of regression using the alternative abnormal net hiring is based on Cella
(2010). Column 2 shows the resultsof regression using the alternative abnormal net hiring is based on Biddle (2009). Column 3 shows the
resultsof regression using the alternative abnormal net hiring is based on augmented Pinnuck and Lillis (2007).
*, **, *** indicate statistical significance at the 0.10, 0.05 and 0.001 levels.
All test statistics and significance level are calculated based on the standard error adjusted by a one-dimensional cluster at the firm level.
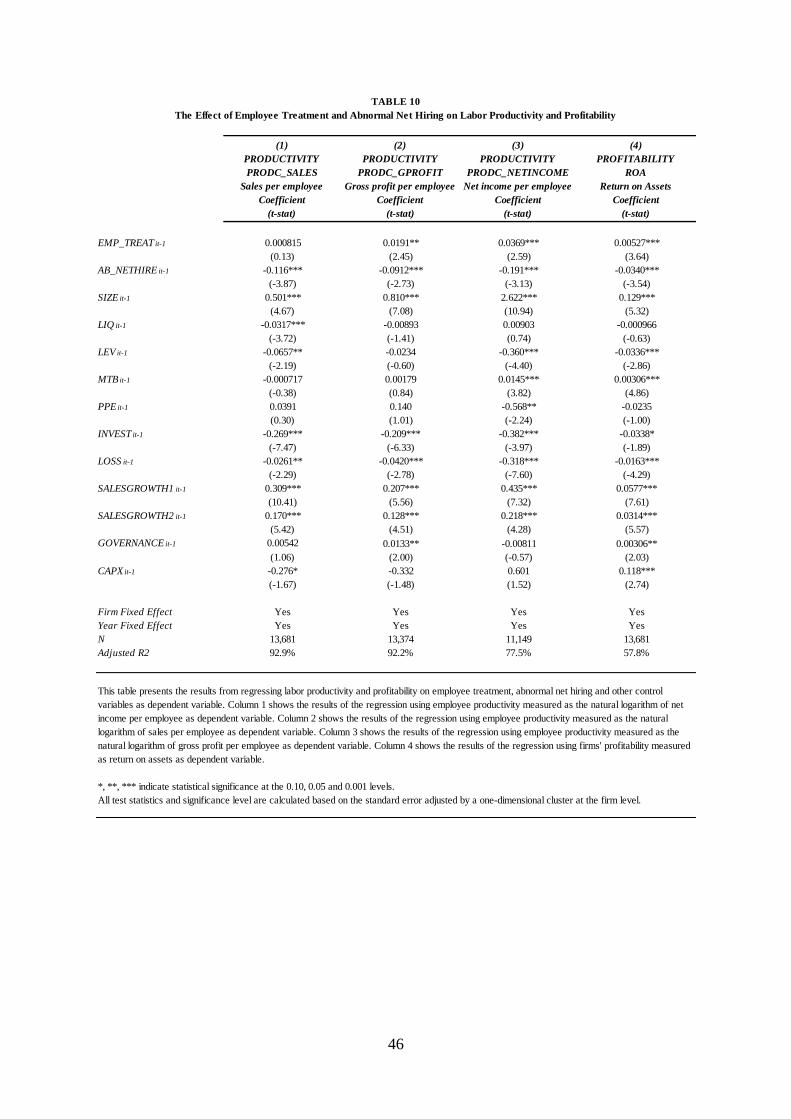
46
(1)
PRODUCTIVITY
PRODC_SALES
Sales per employee
Coefficient
(t-stat)
(2)
PRODUCTIVITY
PRODC_GPROFIT
Gross profit per employee
Coefficient
(t-stat)
(3)
PRODUCTIVITY
PRODC_NETINCOME
Net income per employee
Coefficient
(t-stat)
(4)
PROFITABILITY
ROA
Return on Assets
Coefficient
(t-stat)
EMP_TREAT it-1 0.000815 0.0191** 0.0369*** 0.00527***
(0.13) (2.45) (2.59) (3.64)
AB_NETHIRE it-1 -0.116*** -0.0912*** -0.191*** -0.0340***
(-3.87) (-2.73) (-3.13) (-3.54)
SIZE it-1 0.501*** 0.810*** 2.622*** 0.129***
(4.67) (7.08) (10.94) (5.32)
LIQ it-1 -0.0317*** -0.00893 0.00903 -0.000966
(-3.72) (-1.41) (0.74) (-0.63)
LEV it-1 -0.0657** -0.0234 -0.360*** -0.0336***
(-2.19) (-0.60) (-4.40) (-2.86)
MTB it-1 -0.000717 0.00179 0.0145*** 0.00306***
(-0.38) (0.84) (3.82) (4.86)
PPE it-1 0.0391 0.140 -0.568** -0.0235
(0.30) (1.01) (-2.24) (-1.00)
INVEST it-1 -0.269*** -0.209*** -0.382*** -0.0338*
(-7.47) (-6.33) (-3.97) (-1.89)
LOSS it-1 -0.0261** -0.0420*** -0.318*** -0.0163***
(-2.29) (-2.78) (-7.60) (-4.29)
SALESGROWTH1 it-1 0.309*** 0.207*** 0.435*** 0.0577***
(10.41) (5.56) (7.32) (7.61)
SALESGROWTH2 it-1 0.170*** 0.128*** 0.218*** 0.0314***
(5.42) (4.51) (4.28) (5.57)
GOVERNANCE it-1 0.00542 0.0133** -0.00811 0.00306**
(1.06) (2.00) (-0.57) (2.03)
CAPX it-1 -0.276* -0.332 0.601 0.118***
(-1.67) (-1.48) (1.52) (2.74)
Firm Fixed Effect Yes Yes Yes Yes
Year Fixed Effect Yes Yes Yes Yes
N 13,681 13,374 11,149 13,681
Adjusted R2 92.9% 92.2% 77.5% 57.8%
This table presents the results from regressing labor productivity and profitability on employee treatment, abnormal net hiring and other control
variables as dependent variable. Column 1 shows the results of the regression using employee productivity measured as the natural logarithm of net
income per employee as dependent variable. Column 2 shows the results of the regression using employee productivity measured as the natural
logarithm of sales per employee as dependent variable. Column 3 shows the results of the regression using employee productivity measured as the
natural logarithm of gross profit per employee as dependent variable. Column 4 shows the results of the regression using firms' profitability measured
as return on assets as dependent variable.
*, **, *** indicate statistical significance at the 0.10, 0.05 and 0.001 levels.
All test statistics and significance level are calculated based on the standard error adjusted by a one-dimensional cluster at the firm level.
The Effect of Employee Treatment and Abnormal Net Hiring on Labor Productivity and Profitability
TABLE 10

47
(1)
PRODUCTIVITY
PRODC_SALES
Sales per employee
Coefficient
(t-stat)
(2)
PRODUCTIVITY
PRODC_GPROFIT
Gross profit per employee
Coefficient
(t-stat)
(3)
PRODUCTIVITY
PRODC_NETINCOME
Net income per employee
Coefficient
(t-stat)
(4)
PROFITABILITY
ROA
Return on Assets
Coefficient
(t-stat)
ENVIRONMENT it-1 -0.0119** -0.00329 -0.000619 -0.00136
(-2.44) (-0.50) (-0.05) (-1.29)
AB_NETHIRE it-1 -0.116*** -0.0919*** -0.192*** -0.0342***
(-3.90) (-2.76) (-3.14) (-3.55)
COMMUNITY it-1 -0.0150* 0.00252 0.0192 -0.00326*
(-1.77) (0.24) (0.98) (-1.71)
AB_NETHIRE it-1 -0.116*** -0.0918*** -0.192*** -0.0342***
(-3.89) (-2.75) (-3.12) (-3.56)
EMP_RELATION it-1 -0.00386 0.00764 0.0181* 0.00386***
(-0.91) (1.38) (1.86) (3.81)
AB_NETHIRE it-1 -0.116*** -0.0913*** -0.191*** -0.0339***
(-3.88) (-2.74) (-3.12) (-3.53)
DIVERSITY it-1 0.00645* -0.0001 0.00543 -0.00167*
(1.79) (-0.02) (0.59) (-1.69)
AB_NETHIRE it-1 -0.115*** -0.0918*** -0.192*** -0.0343***
(-3.86) (-2.76) (-3.13) (-3.57)
PRODUCT it-1 0.0009 0.0188** 0.0382** 0.00240
(0.06) (2.05) (2.14) (1.33)
AB_NETHIRE it-1 -0.116*** -0.0912*** -0.191*** -0.0341***
(-3.87) (-2.73) (-3.12) (-3.54)
HUMAN_RIGHTS it-1 -0.0001 0.0162 -0.0169 -0.00969***
(-0.01) (0.75) (-0.51) (-3.67)
AB_NETHIRE it-1 -0.116*** -0.0921*** -0.192*** -0.0341***
(-3.87) (-2.77) (-3.13) (-3.54)
Control Variables Yes Yes Yes Yes
Firm Fixed Effect Yes Yes Yes Yes
Year Fixed Effect Yes Yes Yes Yes
N 13,681 13,374 11,149 13,681
Adjusted R2 92.9% 92.2% 77.5% 57.8%
This table presents the results from regressing individual components of CSR on employee productivity (PRODC_SALES,
PRODC_GPROFIT and PRODC_NETINCOME ) and profitability (ROA ). The individual components of CSR are environment
(ENVIRONMENT ), community (COMMUNITY ), employee relations (EMP_RELATION ), diversity (DIVERSITY ), product
(PRODUCT ) and human rights (HUMAN_RIGHTS ).
*, **, *** indicate statistical significance at the 0.10, 0.05 and 0.001 levels.
All test statistics and significance level are calculated based on the standard error adjusted by a one-dimensional cluster at the firm level.
TABLE 11
The Effect of CSR Dimensions and Abnormal Net Hiring on Labor Productivity and Profitabiltiy

48
(1)
PRODUCTIVITY
PRODC_SALES
Sales per employee
Coefficient
(t-stat)
(2)
PRODUCTIVITY
PRODC_GPROFIT
Gross profit per employee
Coefficient
(t-stat)
(3)
PRODUCTIVITY
PRODC_NETINCOME
Net income per employee
Coefficient
(t-stat)
(4)
PROFITABILITY
ROA
Return on Assets
Coefficient
(t-stat)
(5)
PRODUCTIVITY
PRODC_SALES
Sales per employee
Coefficient
(t-stat)
(6)
PRODUCTIVITY
PRODC_GPROFIT
Gross profit per employee
Coefficient
(t-stat)
(7)
PRODUCTIVITY
PRODC_NETINCOME
Net income per employee
Coefficient
(t-stat)
(8)
PROFITABILITY
ROA
Return on Assets
Coefficient
(t-stat)
EMP_STR it-1 0.0100 0.0120 0.0326* 0.00206
(1.17) (1.09) (1.77) (0.98)
EMP_CON it-1 0.00820 -0.0250** -0.0392** -0.00814***
(1.14) (-2.49) (-1.97) (-4.33)
AB_NETHIRE it-1 -0.116*** -0.0917*** -0.192*** -0.0342*** -0.116*** -0.0913*** -0.192*** -0.0340***
(-3.87) (-2.75) (-3.13) (-3.55) (-3.88) (-2.74) (-3.13) (-3.54)
SIZE it-1 0.498*** 0.803*** 2.609*** 0.128*** 0.497*** 0.818*** 2.632*** 0.131***
(4.64) (7.02) (10.87) (5.27) (4.65) (7.14) (10.99) (5.41)
LIQ it-1 -0.0317*** -0.00878 0.00935 -0.000947 -0.0316*** -0.00888 0.00928 -0.000965
(-3.73) (-1.39) (0.76) (-0.62) (-3.71) (-1.41) (0.76) (-0.63)
LEV it-1 -0.0657** -0.0233 -0.360*** -0.0335*** -0.0655** -0.0233 -0.359*** -0.0336***
(-2.19) (-0.60) (-4.39) (-2.85) (-2.18) (-0.60) (-4.39) (-2.87)
MTB it-1 -0.000706 0.00185 0.0147*** 0.00307*** -0.000688 0.00175 0.0146*** 0.00304***
(-0.38) (0.87) (3.87) (4.88) (-0.37) (0.82) (3.83) (4.83)
PPE it-1 0.0357 0.143 -0.567** -0.0222 0.0396 0.148 -0.545** -0.0216
(0.27) (1.04) (-2.23) (-0.95) (0.30) (1.06) (-2.13) (-0.92)
INVEST it-1 -0.269*** -0.209*** -0.381*** -0.0335* -0.269*** -0.209*** -0.380*** -0.0338*
(-7.47) (-6.30) (-3.97) (-1.87) (-7.46) (-6.33) (-3.97) (-1.89)
LOSS it-1 -0.0261** -0.0434*** -0.321*** -0.0167*** -0.0267** -0.0417*** -0.319*** -0.0161***
(-2.28) (-2.87) (-7.65) (-4.37) (-2.34) (-2.76) (-7.60) (-4.24)
SALESGROWTH1 it-1 0.309*** 0.208*** 0.436*** 0.0578*** 0.309*** 0.207*** 0.435*** 0.0577***
(10.41) (5.58) (7.31) (7.61) (10.42) (5.56) (7.31) (7.63)
SALESGROWTH2 it-1 0.170*** 0.128*** 0.219*** 0.0314*** 0.170*** 0.127*** 0.217*** 0.0313***
(5.43) (4.50) (4.30) (5.58) (5.42) (4.46) (4.27) (5.56)
GOVERNANCE it-1 0.00515 0.0134** -0.00831 0.00314** 0.00542 0.0139** -0.00647 0.00322**
(1.01) (2.02) (-0.58) (2.07) (1.07) (2.09) (-0.45) (2.13)
CAPX it-1 -0.275* -0.335 0.600 0.118*** -0.277* -0.335 0.595 0.118***
(-1.66) (-1.50) (1.52) (2.71) (-1.68) (-1.49) (1.50) (2.72)
Firm Fixed Effect Yes Yes Yes Yes Yes Yes Yes Yes
Year Fixed Effect Yes Yes Yes Yes Yes Yes Yes Yes
N 13,681 13,374 11,149 13,681 13,681 13,374 11,149 13,681
Adjusted R2 92.9% 92.2% 77.5% 57.8% 92.9% 92.2% 77.5% 57.9%
This table presents the results from regressing employee treatment strengths (EMP_STR ), concerns (EMP_CON ) and abnormal net hiring (AB_NETHIRE ) on various employee producitivty measures (PRODC_SALES,
PRODC_GPROFIT and PRODC_NETINCOME ) and profitability (ROA ).
*, **, *** indicate statistical significance at the 0.10, 0.05 and 0.001 levels.
All test statistics and significance level are calculated based on the standard error adjusted by a one-dimensional cluster at the firm level.
The Effect of Employee Treatment Strenghts, Concerns and Abnormal Net Hiring on Employee Productivity and Profitability
TABLE 12

49
Appendix
Variable Description (COMPUSTAT data items in parentheses)
Model (1) Variables:
NET_HIRE it Percentage change in the number of employees (EMP) from year t-1 to year t for firm i.
SALESGROWTH it Percentage change in sales (REVT) in year t for firm i.
ROA it Return on assets (NI / lag(AT)) in year t for firm i.
ΔROA it Change in return on assets in year t for firm.
RETURN it Total stock return during fiscal year t for firm i.
SIZE it-1 Natural log of market value (CSHO* PRCC_F) at the end of fiscal year t-1 fro firm i.
SIZE_P it-1 Percentile rank of SIZE it-1
LIQ it-1 Quick ratio ((CHE + RECT) / LCT) at the end of year t -1 for firm i.
ΔLIQ it-1 Percentage change in the quick ratio in year t for firm i.
LEV it-1Leverage for firm I, measured as the sum of debt in current liabilities and total long-term
debt (DLC + DLTT) at the end of year t-1, devided by year t-1 total assets.
LOSSBIN it-1There are five seprate loss bins to indicate each 0.005 interval of ROA from 0 to -0.025 in
period t-1 for firm i. LOSSBIN1 is equal to 1 if ROA ranges from -0.005 to 0.
Model (2) Variables:
EMP_TREAT it Employee treatment score from KLD database.
DIVD it-1 Indicator variable coded as 1 if the firm paid dividends (DVPSPS_F) in year t-1.
TANGIBLES it-1Property, plant and equipment (PPENT) at the end of year t-1, divided by total assets at
year t-1, for firm i.
LOSS it-1 Indicator variable coded as 1 if firm I had negative ROA for year t-1.
LABINT it-1Labor intensity, measured as the number of employees divided by total assets at the end of
year t-1 for firm i.
INVEST it
Abnormal other (nonlabor) investments, defined as the absolute magnitude of the residual
from the following model: INVESTit = β0 + β1SALESGROWTHit-1 + εit, where INVEST
is the sum of capital expenditure (CAPX), acquisition expenditure (AQC), and research and
development expenditure (XRD), less cash receipts from the sale of property, plant, and
equipment (SPPE), all scaled by lagged total assets.
SD_CFO it-1 Standard deviation of firm i's cash flows from operation (OANCF) from year t-5 to t-1.
SD_SALES it-1 Standard deviation of firm i's sales from year t-5 to t-1.
SD_NETHIRE it-1 Standard deviation of firm i's change in the number of employees from year t-5 to t-1.
UNION it-1 Industry-level rateof labor unionization for year t-1.
Model (3) Variables:
PRODC_SALES itEmployee productivity, measured as the natural logarithm of sales (REVT) divided by the
number of employee (EMP).
PRODC_GPROFIT itEmployee productivity, measured as the natural logarithm of sales (REVT) minus cost of
goods sold (COGS) divided by the number of employee (EMP).
PRODC_NETINCOME itEmployee productivity, measured as the natural logarithm of net income (NI) divided by the
number of employee (EMP).
HERFD it-1 Herfindahl-Hirschman Index (3-digit SIC) based on firm's sales.
GOVERNANCE it-1 Corporate governance score from KLD database.
CAPX it-1 The ratio of capital expenditures (CAPX) to total assets (AT).

50
Other Variables:
BEST100 itIndicator variable coded as 1 if the firm is listed in Fortune magazine's list of the "100 best
companies to work for" between 1995 and 2012.
ENVIRONMENT it-1 Environmen score from KLD database.
COMMUNITY it-1 Community score from KLD database.
EMP_RELATION it-1 Employee relation score from KLD database.
DIVERSITY it-1 Diversity score from KLD database.
PRODUCT it-1 Product score from KLD database.
HUMAN_RIGHTS it-1 Human rights score from KLD database.
AB_DISC it-1
Discretionary accrual is estimated by using the performance-adjusted modified Jones model
suggested in Kothari et al. (2005). We estimate the model for every industry classified by
two-digit SIC code for each year and caputre the residuals. The absolute value of
discretionary accrual, AB_DISC , is used as the proxy for financial reporting quality. The
large value of the absolute value of discretionary accrual, the lower level of financial
reporting quality. We further multiply AB_DISC by -1 so that large value of AB_DISC
indicates higher-quality of financial reporting.
DD_DISC it-1
Discretionary accrual is estimated by using the Dechow and Dichiev (2002) model as
modified by McNichols (2002) and Francis et al (2005). We estimate the model for every
industry classified by two-digit SIC code for each year and caputre the residuals. We then
compuste the standard deviation of firm i's residuals over the years t-5 to t-1. We further
multiply that standard deviation by -1 so that large value indicates higher-quality of financial
reporting.
INST_INVESTOR it-1 Institutional shareholders at the end of year t-1 for firm i.
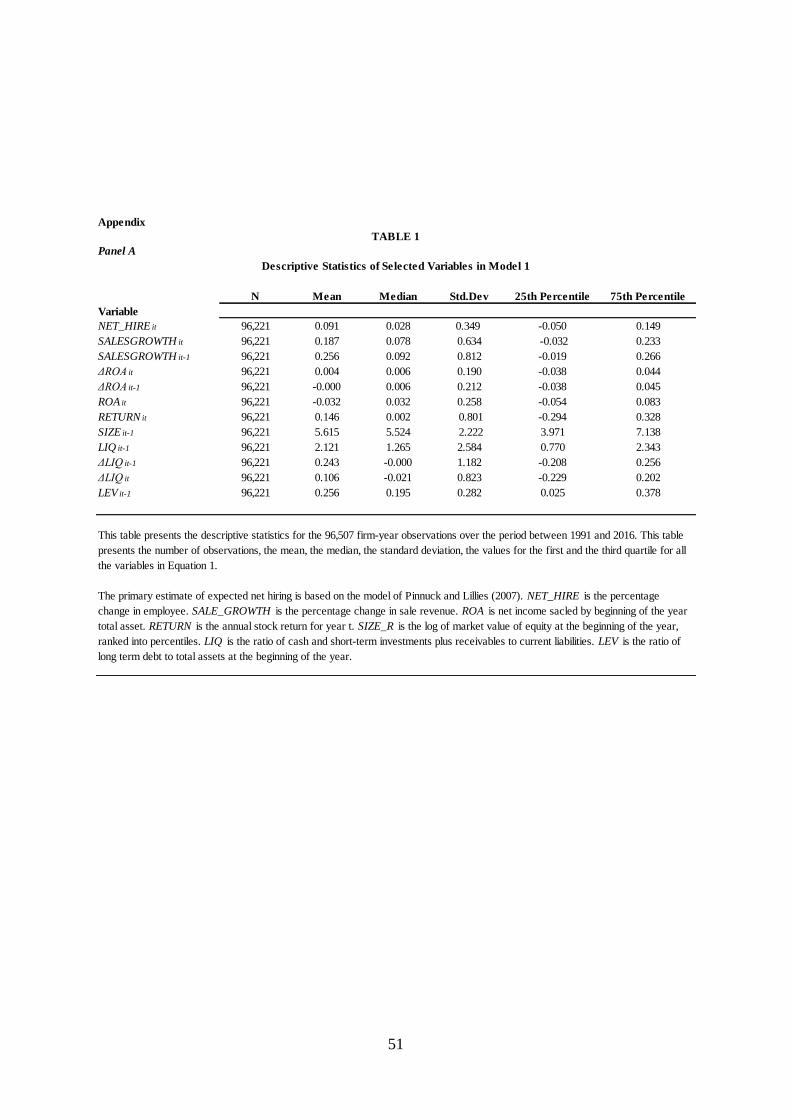
51
Appendix
Panel A
N Mean Median Std.Dev 25th Percentile 75th Percentile
Variable
NET_HIRE it 96,221 0.091 0.028 0.349 -0.050 0.149
SALESGROWTH it 96,221 0.187 0.078 0.634 -0.032 0.233
SALESGROWTH it-1 96,221 0.256 0.092 0.812 -0.019 0.266
ΔROA it 96,221 0.004 0.006 0.190 -0.038 0.044
ΔROA it-1 96,221 -0.000 0.006 0.212 -0.038 0.045
ROA it 96,221 -0.032 0.032 0.258 -0.054 0.083
RETURN it 96,221 0.146 0.002 0.801 -0.294 0.328
SIZE it-1 96,221 5.615 5.524 2.222 3.971 7.138
LIQ it-1 96,221 2.121 1.265 2.584 0.770 2.343
ΔLIQ it-1 96,221 0.243 -0.000 1.182 -0.208 0.256
ΔLIQ it 96,221 0.106 -0.021 0.823 -0.229 0.202
LEV it-1 96,221 0.256 0.195 0.282 0.025 0.378
TABLE 1
Descriptive Statistics of Selected Variables in Model 1
This table presents the descriptive statistics for the 96,507 firm-year observations over the period between 1991 and 2016. This table
presents the number of observations, the mean, the median, the standard deviation, the values for the first and the third quartile for all
the variables in Equation 1.
The primary estimate of expected net hiring is based on the model of Pinnuck and Lillies (2007). NET_HIRE is the percentage
change in employee. SALE_GROWTH is the percentage change in sale revenue. ROA is net income sacled by beginning of the year
total asset. RETURN is the annual stock return for year t. SIZE_R is the log of market value of equity at the beginning of the year,
ranked into percentiles. LIQ is the ratio of cash and short-term investments plus receivables to current liabilities. LEV is the ratio of
long term debt to total assets at the beginning of the year.
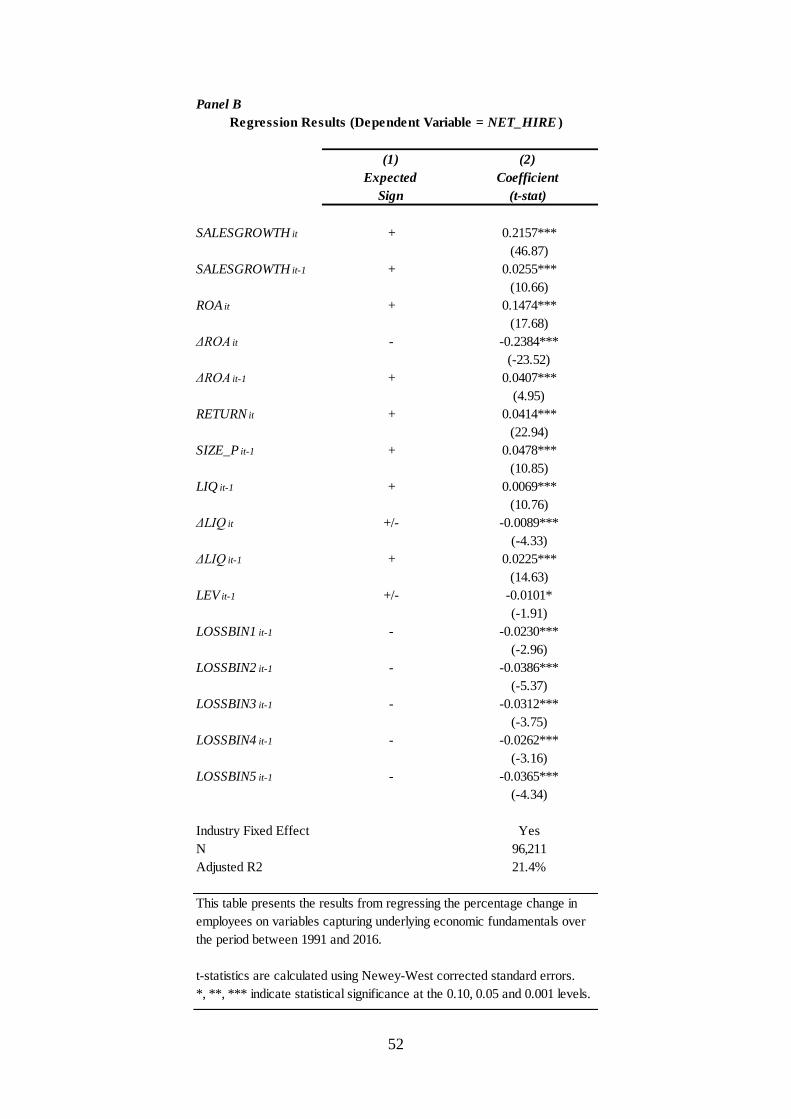
52
Panel B
(1)
Expected
Sign
(2)
Coefficient
(t-stat)
SALESGROWTH it + 0.2157***
(46.87)
SALESGROWTH it-1 + 0.0255***
(10.66)
ROA it + 0.1474***
(17.68)
ΔROA it - -0.2384***
(-23.52)
ΔROA it-1 + 0.0407***
(4.95)
RETURN it + 0.0414***
(22.94)
SIZE_P it-1 + 0.0478***
(10.85)
LIQ it-1 + 0.0069***
(10.76)
ΔLIQ it +/- -0.0089***
(-4.33)
ΔLIQ it-1 + 0.0225***
(14.63)
LEV it-1 +/- -0.0101*
(-1.91)
LOSSBIN1 it-1 - -0.0230***
(-2.96)
LOSSBIN2 it-1 - -0.0386***
(-5.37)
LOSSBIN3 it-1 - -0.0312***
(-3.75)
LOSSBIN4 it-1 - -0.0262***
(-3.16)
LOSSBIN5 it-1 - -0.0365***
(-4.34)
Industry Fixed Effect Yes
N 96,211
Adjusted R2 21.4%
Regression Results (Dependent Variable = NET_HIRE )
This table presents the results from regressing the percentage change in
employees on variables capturing underlying economic fundamentals over
the period between 1991 and 2016.
t-statistics are calculated using Newey-West corrected standard errors.
*, **, *** indicate statistical significance at the 0.10, 0.05 and 0.001 levels.

35
Firm-Year
Observations
290,288
(70,299)
(84,907)
(24,257)
96,221
Less:
(75,638)
20,583
(6,902)
13,681Sample for estimating Model 3 (Productivity and Profitability regression)
Less:
Sample for estimating Model 1 (Pinnuck and Lillies, 2007)
Merged with KLD database and missing observations in Model 2
Sample for estimating Model 2 (Primary baseline regression)
Criteria
Table 1: Sample Selection
Missing observations in Model 3
All COMPUSTAT firms for fiscal years 1991-2016 (exclude firms with negative assets, negative
sales and stockholders equity and missing historical SIC codes)
Observations in financial industries (SIC 60-69)
Merged with total stock returns data from CRSP
Missing observations to estimate abnormal net hiring in Model 1
Less:
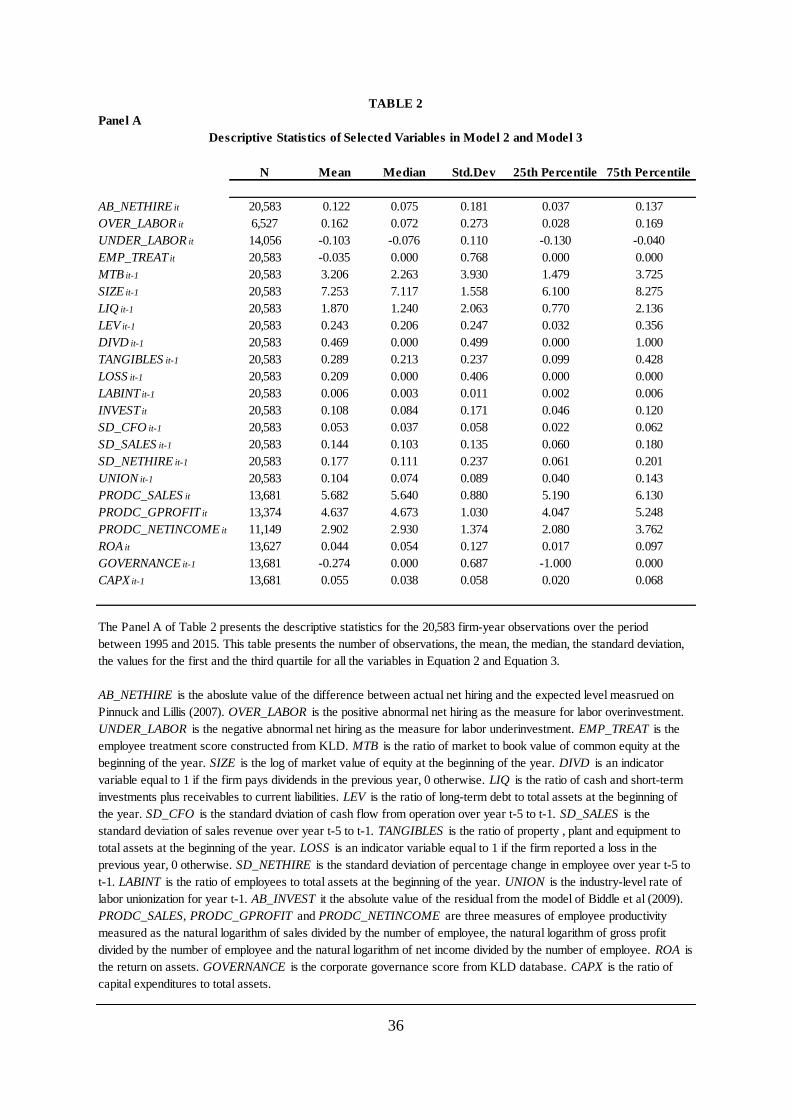
36
N Mean Median Std.Dev 25th Percentile 75th Percentile
AB_NETHIRE it 20,583 0.122 0.075 0.181 0.037 0.137
OVER_LABOR it 6,527 0.162 0.072 0.273 0.028 0.169
UNDER_LABOR it 14,056 -0.103 -0.076 0.110 -0.130 -0.040
EMP_TREAT it 20,583 -0.035 0.000 0.768 0.000 0.000
MTB it-1 20,583 3.206 2.263 3.930 1.479 3.725
SIZE it-1 20,583 7.253 7.117 1.558 6.100 8.275
LIQ it-1 20,583 1.870 1.240 2.063 0.770 2.136
LEV it-1 20,583 0.243 0.206 0.247 0.032 0.356
DIVD it-1 20,583 0.469 0.000 0.499 0.000 1.000
TANGIBLES it-1 20,583 0.289 0.213 0.237 0.099 0.428
LOSS it-1 20,583 0.209 0.000 0.406 0.000 0.000
LABINT it-1 20,583 0.006 0.003 0.011 0.002 0.006
INVEST it 20,583 0.108 0.084 0.171 0.046 0.120
SD_CFO it-1 20,583 0.053 0.037 0.058 0.022 0.062
SD_SALES it-1 20,583 0.144 0.103 0.135 0.060 0.180
SD_NETHIRE it-1 20,583 0.177 0.111 0.237 0.061 0.201
UNION it-1 20,583 0.104 0.074 0.089 0.040 0.143
PRODC_SALES it 13,681 5.682 5.640 0.880 5.190 6.130
PRODC_GPROFIT it 13,374 4.637 4.673 1.030 4.047 5.248
PRODC_NETINCOME it 11,149 2.902 2.930 1.374 2.080 3.762
ROA it 13,627 0.044 0.054 0.127 0.017 0.097
GOVERNANCE it-1 13,681 -0.274 0.000 0.687 -1.000 0.000
CAPX it-1 13,681 0.055 0.038 0.058 0.020 0.068
TABLE 2
Panel A
Descriptive Statistics of Selected Variables in Model 2 and Model 3
The Panel A of Table 2 presents the descriptive statistics for the 20,583 firm-year observations over the period
between 1995 and 2015. This table presents the number of observations, the mean, the median, the standard deviation,
the values for the first and the third quartile for all the variables in Equation 2 and Equation 3.
AB_NETHIRE is the aboslute value of the difference between actual net hiring and the expected level measrued on
Pinnuck and Lillis (2007). OVER_LABOR is the positive abnormal net hiring as the measure for labor overinvestment.
UNDER_LABOR is the negative abnormal net hiring as the measure for labor underinvestment. EMP_TREAT is the
employee treatment score constructed from KLD. MTB is the ratio of market to book value of common equity at the
beginning of the year. SIZE is the log of market value of equity at the beginning of the year. DIVD is an indicator
variable equal to 1 if the firm pays dividends in the previous year, 0 otherwise. LIQ is the ratio of cash and short-term
investments plus receivables to current liabilities. LEV is the ratio of long-term debt to total assets at the beginning of
the year. SD_CFO is the standard dviation of cash flow from operation over year t-5 to t-1. SD_SALES is the
standard deviation of sales revenue over year t-5 to t-1. TANGIBLES is the ratio of property , plant and equipment to
total assets at the beginning of the year. LOSS is an indicator variable equal to 1 if the firm reported a loss in the
previous year, 0 otherwise. SD_NETHIRE is the standard deviation of percentage change in employee over year t-5 to
t-1. LABINT is the ratio of employees to total assets at the beginning of the year. UNION is the industry-level rate of
labor unionization for year t-1. AB_INVEST it the absolute value of the residual from the model of Biddle et al (2009).
PRODC_SALES, PRODC_GPROFIT and PRODC_NETINCOME are three measures of employee productivity
measured as the natural logarithm of sales divided by the number of employee, the natural logarithm of gross profit
divided by the number of employee and the natural logarithm of net income divided by the number of employee. ROA is
the return on assets. GOVERNANCE is the corporate governance score from KLD database. CAPX is the ratio of
capital expenditures to total assets.
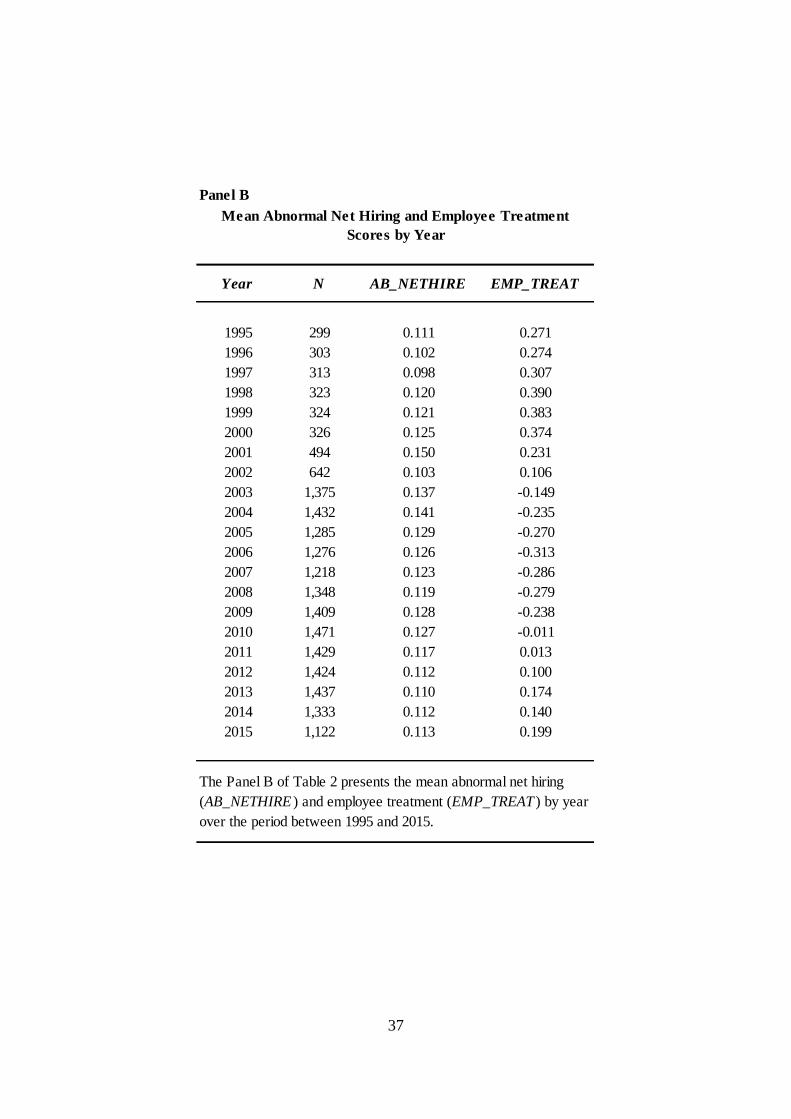
37
Panel B
Year N AB_NETHIRE EMP_TREAT
1995 299 0.111 0.271
1996 303 0.102 0.274
1997 313 0.098 0.307
1998 323 0.120 0.390
1999 324 0.121 0.383
2000 326 0.125 0.374
2001 494 0.150 0.231
2002 642 0.103 0.106
2003 1,375 0.137 -0.149
2004 1,432 0.141 -0.235
2005 1,285 0.129 -0.270
2006 1,276 0.126 -0.313
2007 1,218 0.123 -0.286
2008 1,348 0.119 -0.279
2009 1,409 0.128 -0.238
2010 1,471 0.127 -0.011
2011 1,429 0.117 0.013
2012 1,424 0.112 0.100
2013 1,437 0.110 0.174
2014 1,333 0.112 0.140
2015 1,122 0.113 0.199
Mean Abnormal Net Hiring and Employee Treatment
Scores by Year
The Panel B of Table 2 presents the mean abnormal net hiring
(AB_NETHIRE ) and employee treatment (EMP_TREAT ) by year
over the period between 1995 and 2015.

38
N Mean Median N Mean Median N Mean Median t-test Wilcoxon Test
AB_NETHIRE it 3,136 0.106 0.070 13,373 0.124 0.075 4,074 0.128 0.082 < 0.001 < 0.001
OVER_LABOR it 911 0.133 0.061 4,479 0.168 0.076 1,136 0.172 0.071 < 0.001 < 0.001
UNDER_LABOR it 2,216 -0.095 -0.074 8,954 -0.104 -0.075 2,938 -0.110 -0.085 < 0.001 < 0.001
EMP_TREAT it 3,136 1.275 1.000 13,373 0.000 0.000 4,074 -1.159 -1.000 < 0.001 < 0.001
MTB it-1 3,136 3.823 2.653 13,373 3.154 2.219 4,074 2.904 2.167 < 0.001 < 0.001
SIZE it-1 3,136 8.286 8.355 13,373 7.034 6.903 4,074 7.179 7.072 < 0.001 < 0.001
LIQ it-1 3,136 1.684 1.158 13,373 1.961 1.313 4,074 1.713 1.102 < 0.001 0.022
LEV it-1 3,136 0.239 0.210 13,373 0.239 0.195 4,074 0.261 0.231 0.511 0.004
DIVD it-1 3,136 0.598 1.000 13,373 0.431 0.000 4,074 0.496 0.000 < 0.001 < 0.001
TANGIBLES it-1 3,136 0.313 0.249 13,373 0.276 0.197 4,074 0.313 0.249 0.849 0.581
LOSS it-1 3,136 0.136 0.000 13,373 0.214 0.000 4,074 0.246 0.000 < 0.001 < 0.001
LABINT it-1 3,136 0.005 0.002 13,373 0.006 0.003 4,074 0.007 0.004 < 0.001 < 0.001
INVEST it 3,136 0.094 0.072 13,373 0.113 0.086 4,074 0.103 0.085 0.004 < 0.001
SD_CFO it-1 3,136 0.046 0.034 13,373 0.055 0.038 4,074 0.054 0.037 < 0.001 < 0.001
SD_SALES it-1 3,136 0.120 0.091 13,373 0.147 0.105 4,074 0.152 0.108 < 0.001 < 0.001
SD_NETHIRE it-1 3,136 0.151 0.091 13,373 0.179 0.114 4,074 0.191 0.116 < 0.001 < 0.001
UNION it-1 3,136 0.126 0.093 13,373 0.099 0.074 4,074 0.105 0.078 < 0.001 < 0.001
PRODC_SALES it 2,253 5.819 5.763 8,774 5.684 5.652 2,654 5.560 5.507 < 0.001 < 0.001
PRODC_GPROFIT it 2,212 4.916 4.927 8,555 4.651 4.698 2,607 4.355 4.381 < 0.001 < 0.001
PRODC_NETINCOME it 1,939 3.302 3.384 7,093 2.885 2.915 2,117 2.590 2.624 < 0.001 < 0.001
ROA it 2,253 0.062 0.065 8,774 0.042 0.052 2,654 0.039 0.048 < 0.001 < 0.001
GOVERNANCE it-1 2,253 -0.300 0.000 8,774 -0.247 0.000 2,654 -0.342 0.000 0.031 0.034
CAPX it-1 2,253 0.057 0.042 8,774 0.054 0.035 2,654 0.057 0.043 0.884 0.810
Firm characteristics across different employee treatment scores.
The Panle C of Table 2 reports the average values of the firm characteristics for the full sample and subsamples based on the sign of the meployee treatment scores. We also report the
significance of the differences in means between frims with positive and negative employee treatment scores. The dependent and control variables are defined in Panel A of Table 2. Sample
period is 1995 - 2015. N denotes the number of observations. *, **, *** indicate statistical significance at the 0.10, 0.05 and 0.001 levels.
TABLE 2
Panel C
Descriptive Statistics by Employee-Friendly versus Non-Employee-Friendly Firms
Difference Tests (A-B)
Employee-Friendly Firms (A) Neutral Firms Non-Employee-Friendly Firms (B) p-value

39
1 2 3 4 5 6 7 8 9 10 11 12 13 14 15 16 17 18 19 20 21
1. AB_NETHIRE it-1 1
2. EMP_TREAT it -0.032*** 1
3. MTB it-1 0.023*** 0.073*** 1
4. SIZE it-1 -0.108*** 0.190*** 0.192*** 1
5. LIQ it-1 0.146*** 0.009 0.051*** -0.198*** 1
6. LEV it-1 0.036*** -0.036*** -0.018*** 0.108*** -0.224*** 1
7. DIVD it-1 -0.123*** 0.049*** -0.013* 0.369*** -0.268*** 0.046*** 1
8. TANGIBLES it-1 -0.072*** -0.013* -0.114*** 0.147*** -0.327*** 0.255*** 0.251*** 1
9. LOSS it-1 0.102*** -0.077*** -0.017** -0.300*** 0.161*** 0.057*** -0.272*** -0.079*** 1
10. LABINT it-1 -0.038*** -0.064*** 0.004 -0.100*** -0.105*** -0.087*** 0.019*** 0.026*** -0.067*** 1
11. INVEST it 0.332*** -0.013* 0.064*** -0.093*** 0.074*** 0.040*** -0.096*** -0.041*** 0.088*** -0.027*** 1
12. SD_CFO it-1 0.170*** -0.034*** 0.159*** -0.289*** 0.253*** -0.075*** -0.275*** -0.227*** 0.266*** -0.036*** 0.200*** 1
13. SD_SALES it-1 0.097*** -0.064*** 0.029*** -0.199*** 0.002 0.001 -0.147*** -0.184*** 0.087*** 0.091*** 0.081*** 0.335*** 1
14 SD_NETHIRE it-1 0.141*** -0.051*** 0.000 -0.109*** 0.069*** 0.108*** -0.184*** -0.083*** 0.133*** -0.053*** 0.070*** 0.161*** 0.205*** 1
15. UNION it-1 -0.020*** 0.054*** -0.067*** 0.095*** -0.026*** 0.061*** 0.136*** 0.205*** -0.031*** -0.155*** -0.047*** -0.095*** -0.076*** -0.001 1
16. PRODC_SALES it -0.040*** 0.080*** -0.024*** 0.200*** -0.100*** 0.097*** 0.086*** 0.134*** -0.074*** -0.498*** -0.009 -0.019*** 0.083*** -0.005 0.101*** 1
17. PRODC_GPROFIT it -0.002 0.145*** 0.110*** 0.191*** 0.132*** 0.043*** -0.040*** -0.020*** -0.010 -0.528*** 0.043*** 0.104*** -0.069*** 0.013* -0.007 0.811*** 1
18. PRODC_NETINCOME it 0.001 0.142*** 0.138*** 0.281*** 0.161*** 0.023*** 0.045*** 0.075*** -0.100*** -0.460*** 0.029*** 0.103*** -0.095*** 0.002 0.098*** 0.708*** 0.794*** 1
19. ROA it-1 -0.149*** 0.072*** 0.053*** 0.234*** -0.154*** -0.077*** 0.189*** 0.045*** -0.430*** 0.086*** -0.223*** -0.316*** -0.032*** -0.133*** 0.013* 0.150*** 0.123*** 0.447*** 1
20. GOVERNANCE it-1 -0.002 0.010 -0.037*** -0.199*** 0.038*** -0.027*** 0.028*** 0.061*** 0.007 0.027*** 0.011 0.032*** -0.001 -0.016** 0.042*** -0.030*** -0.036*** -0.041*** -0.013* 1
21. CAPX it-1 -0.040*** 0.059*** -0.019*** 0.387*** -0.112*** 0.051*** 0.179*** 0.233*** -0.077*** -0.064*** -0.034*** -0.099*** -0.067*** -0.042*** 0.085*** 0.209*** 0.161*** 0.175*** 0.041*** -0.054*** 1
TABLE 3
Correlations among Employee Treatment, Abnormal Net Hiring and Other Variables
This table presents the Pearson pair-wise correlation between all variables included in Equation 2 and Equation 3.
*, **, *** indicate statistical significance at the 0.10, 0.05 and 0.001 levels.

40
Fama-MacBeth +/- SCORE
(1)
AB_NETHIRE
|AB_NETHIRE|
Coefficient
(t-stat)
(2)
OVER_LABOR
(POSITIVE)
Coefficient
(t-stat)
(3)
UNDER_LABOR
(NEGATIVE)
Coefficient
(t-stat)
(4)
AB_NETHIRE
|AB_NETHIRE|
Coefficient
(t-stat)
(5)
AB_NETHIRE
|AB_NETHIRE|
Coefficient
(t-stat)
EMP_TREAT it -0.00616*** -0.0131** 0.00440*** -0.00377*** -0.00693**
(-2.98) (-1.99) (2.75) (-2.91) (-2.27)
MTB it-1 0.000293 0.00305** 0.000647 -0.000482 -0.00130*
(0.52) (2.58) (1.39) (-1.34) (-1.69)
SIZE it-1 -0.0888*** -0.134* 0.0534** -0.0178 -0.0750
(-3.26) (-1.74) (2.48) (-1.68) (-1.43)
LIQ it-1 0.00898*** 0.0123*** -0.00217 0.0114*** 0.00486
(4.64) (2.93) (-1.21) (4.13) (1.51)
LEV it-1 0.0351*** 0.0552* -0.0562*** 0.0363*** 0.0353**
(3.28) (1.77) (-6.97) (5.54) (2.13)
DIVD it-1 0.00724 0.00758 -0.00683* -0.0147*** -0.000379
(1.20) (0.38) (-1.83) (-3.59) (-0.04)
TANGIBLES it-1 -0.0609** -0.0795 0.0520** -0.00848 -0.0542
(-2.16) (-1.20) (1.99) (-1.22) (-1.20)
LOSS it-1 -0.00356 -0.00344 -0.00710** 0.0151** 0.000421
(-0.83) (-0.27) (-2.08) (2.10) (0.06)
LABINT it-1 -1.935** -11.12*** -2.224*** -0.402*** -2.264**
(-2.11) (-3.79) (-4.37) (-2.94) (-2.01)
INVEST it 0.325*** 0.425*** -0.234*** 0.368*** 0.430***
(5.49) (10.43) (-5.15) (8.63) (9.44)
SD_CFO it-1 0.0209 0.0301 -0.0252 0.0876* 0.0692
(0.32) (0.23) (-0.47) (1.94) (0.67)
SD_SALES it-1 0.0132 0.0374 0.0241* 0.0704** 0.0248
(0.68) (0.66) (1.69) (2.70) (0.68)
SD_NETHIRE it-1 -0.154*** -0.302*** 0.00940 0.0606*** -0.230***
(-8.47) (-6.86) (1.24) (4.65) (-4.64)
UNION it-1 0.0349 0.0588 0.0183 -0.00125 0.109*
(0.89) (0.46) (0.63) (-0.09) (1.74)
Firm Fixed Effect Yes Yes Yes No Yes
Year Fixed Effect Yes Yes Yes No Yes
N 20,583 6,527 14,056 20,583 7,210
Adjusted R2 25.4% 31.4% 28.5% 18.0% 30.9%
TABLE 4
The Effect of Employee Treatment on Abnormal Net Hiring
OLS
This table presents the results from regressing abnormal net hiring on employee treatment and other control variables over the sample
period between 1995 and 2015. Column 1 shows the results regressing abnormal net hiring (AB_NETHIRE ) on employee treatment and
control variables. Column 2 shows the results regressing labor overinvestment (OVER_LABOR ) on employee treatment and control
variables. Column 3 shows the results regressing labor underinvestment (UNDER_LABOR ) on employee treatment and control
variables. Column 4 presents the results of a Fama-MacBeth regression. Colunmn 5 excludes the firms with neutral employee treatment
scores (EMP_TREAT = 0).
*, **, *** indicate statistical significance at the 0.10, 0.05 and 0.001 levels.
All test statistics and significance level are calculated based on the standard error adjusted by a one-dimensional cluster at the firm level.

41
(1)
AB_NETHIRE
Coefficient
(t-stat)
(2)
AB_NETHIRE
Coefficient
(t-stat)
(3)
AB_NETHIRE
Coefficient
(t-stat)
(4)
AB_NETHIRE
Coefficient
(t-stat)
(5)
AB_NETHIRE
Coefficient
(t-stat)
(6)
AB_NETHIRE
Coefficient
(t-stat)
ENVIRONMENT it 0.00123
(0.68)
COMMUNITY it -0.0000272
(-0.01)
EMP_RELATION it -0.00482***
(-3.18)
DIVERSITY it -0.00221
(-1.48)
PRODUCT it 0.000668
(0.25)
HUMAN_RIGHTS it 0.00124
(0.25)
MTB it-1 0.000300 0.000297 0.000275 0.000281 0.000296 0.000298
(0.53) (0.53) (0.49) (0.50) (0.53) (0.53)
SIZE it-1 -0.0888*** -0.0882*** -0.0872*** -0.0860*** -0.0883*** -0.0883***
(-3.25) (-3.23) (-3.20) (-3.14) (-3.23) (-3.24)
LIQ it-1 0.00897*** 0.00899*** 0.00902*** 0.00897*** 0.00898*** 0.00898***
(4.62) (4.64) (4.67) (4.63) (4.64) (4.64)
LEV it-1 0.0350*** 0.0351*** 0.0351*** 0.0352*** 0.0350*** 0.0351***
(3.26) (3.27) (3.28) (3.28) (3.27) (3.27)
DIVD it-1 0.00729 0.00727 0.00747 0.00729 0.00727 0.00730
(1.21) (1.20) (1.24) (1.21) (1.20) (1.21)
TANGIBLES it-1 -0.0617** -0.0618** -0.0603** -0.0612** -0.0619** -0.0621**
(-2.19) (-2.18) (-2.14) (-2.17) (-2.20) (-2.21)
LOSS it-1 -0.00308 -0.00308 -0.00349 -0.00296 -0.00307 -0.00308
(-0.72) (-0.72) (-0.81) (-0.69) (-0.72) (-0.72)
LABINT it-1 -1.962** -1.954** -1.894** -1.940** -1.955** -1.956**
(-2.14) (-2.14) (-2.07) (-2.12) (-2.14) (-2.14)
INVEST it 0.325*** 0.325*** 0.325*** 0.325*** 0.325*** 0.325***
(5.49) (5.49) (5.49) (5.49) (5.49) (5.49)
SD_CFO it-1 0.0227 0.0228 0.0205 0.0217 0.0228 0.0227
(0.35) (0.35) (0.32) (0.33) (0.35) (0.35)
SD_SALES it-1 0.0138 0.0136 0.0131 0.0136 0.0136 0.0136
(0.71) (0.70) (0.68) (0.70) (0.71) (0.70)
SD_NETHIRE it-1 -0.154*** -0.154*** -0.154*** -0.154*** -0.154*** -0.154***
(-8.50) (-8.51) (-8.49) (-8.54) (-8.51) (-8.51)
UNION it-1 0.0297 0.0304 0.0330 0.0308 0.0304 0.0304
(0.77) (0.78) (0.85) (0.79) (0.78) (0.78)
Firm Fixed Effect Yes Yes Yes Yes Yes Yes
Year Fixed Effect Yes Yes Yes Yes Yes Yes
N 20,583 20,583 20,583 20,583 20,583 20,583
Adjusted R2 25.4% 25.4% 25.4% 25.4% 25.4% 25.4%
TABLE 5
The Effect of CSR Dimensions on Abnormal Net Hiring
This table presents the results from regressing abnormal net hiring on individual components of CSR and other control variables over the
period between 1995 and 2015. The individual components of CSR are environment (ENVIRONMENT ), community (COMMUNITY ),
employee relations (EMP_RELATION ), diversity (DIVERSITY ), product (PRODUCT ) and human rights (HUMAN_RIGHTS ).
*, **, *** indicate statistical significance at the 0.10, 0.05 and 0.001 levels.
All test statistics and significance level are calculated based on the standard error adjusted by a one-dimensional cluster at the firm level.
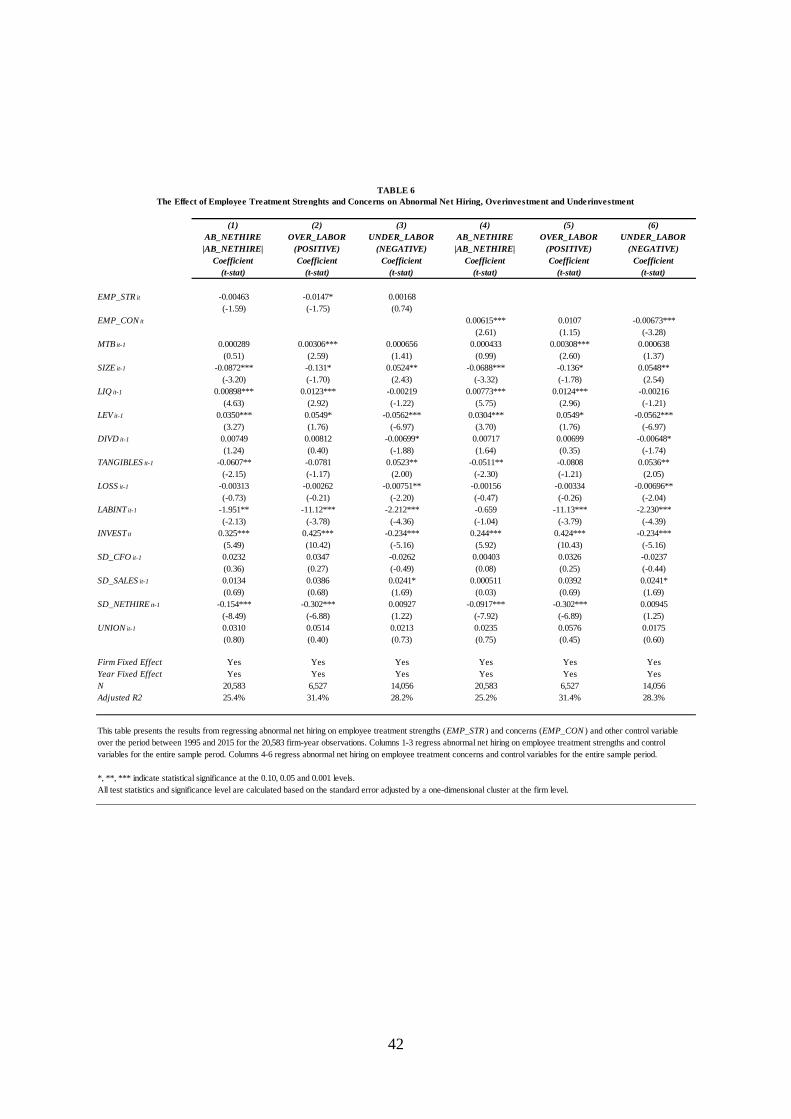
42
(1)
AB_NETHIRE
|AB_NETHIRE|
Coefficient
(t-stat)
(2)
OVER_LABOR
(POSITIVE)
Coefficient
(t-stat)
(3)
UNDER_LABOR
(NEGATIVE)
Coefficient
(t-stat)
(4)
AB_NETHIRE
|AB_NETHIRE|
Coefficient
(t-stat)
(5)
OVER_LABOR
(POSITIVE)
Coefficient
(t-stat)
(6)
UNDER_LABOR
(NEGATIVE)
Coefficient
(t-stat)
EMP_STR it -0.00463 -0.0147* 0.00168
(-1.59) (-1.75) (0.74)
EMP_CON it 0.00615*** 0.0107 -0.00673***
(2.61) (1.15) (-3.28)
MTB it-1 0.000289 0.00306*** 0.000656 0.000433 0.00308*** 0.000638
(0.51) (2.59) (1.41) (0.99) (2.60) (1.37)
SIZE it-1 -0.0872*** -0.131* 0.0524** -0.0688*** -0.136* 0.0548**
(-3.20) (-1.70) (2.43) (-3.32) (-1.78) (2.54)
LIQ it-1 0.00898*** 0.0123*** -0.00219 0.00773*** 0.0124*** -0.00216
(4.63) (2.92) (-1.22) (5.75) (2.96) (-1.21)
LEV it-1 0.0350*** 0.0549* -0.0562*** 0.0304*** 0.0549* -0.0562***
(3.27) (1.76) (-6.97) (3.70) (1.76) (-6.97)
DIVD it-1 0.00749 0.00812 -0.00699* 0.00717 0.00699 -0.00648*
(1.24) (0.40) (-1.88) (1.64) (0.35) (-1.74)
TANGIBLES it-1 -0.0607** -0.0781 0.0523** -0.0511** -0.0808 0.0536**
(-2.15) (-1.17) (2.00) (-2.30) (-1.21) (2.05)
LOSS it-1 -0.00313 -0.00262 -0.00751** -0.00156 -0.00334 -0.00696**
(-0.73) (-0.21) (-2.20) (-0.47) (-0.26) (-2.04)
LABINT it-1 -1.951** -11.12*** -2.212*** -0.659 -11.13*** -2.230***
(-2.13) (-3.78) (-4.36) (-1.04) (-3.79) (-4.39)
INVEST it 0.325*** 0.425*** -0.234*** 0.244*** 0.424*** -0.234***
(5.49) (10.42) (-5.16) (5.92) (10.43) (-5.16)
SD_CFO it-1 0.0232 0.0347 -0.0262 0.00403 0.0326 -0.0237
(0.36) (0.27) (-0.49) (0.08) (0.25) (-0.44)
SD_SALES it-1 0.0134 0.0386 0.0241* 0.000511 0.0392 0.0241*
(0.69) (0.68) (1.69) (0.03) (0.69) (1.69)
SD_NETHIRE it-1 -0.154*** -0.302*** 0.00927 -0.0917*** -0.302*** 0.00945
(-8.49) (-6.88) (1.22) (-7.92) (-6.89) (1.25)
UNION it-1 0.0310 0.0514 0.0213 0.0235 0.0576 0.0175
(0.80) (0.40) (0.73) (0.75) (0.45) (0.60)
Firm Fixed Effect Yes Yes Yes Yes Yes Yes
Year Fixed Effect Yes Yes Yes Yes Yes Yes
N 20,583 6,527 14,056 20,583 6,527 14,056
Adjusted R2 25.4% 31.4% 28.2% 25.2% 31.4% 28.3%
TABLE 6
The Effect of Employee Treatment Strenghts and Concerns on Abnormal Net Hiring, Overinvestment and Underinvestment
This table presents the results from regressing abnormal net hiring on employee treatment strengths (EMP_STR ) and concerns (EMP_CON ) and other control variable
over the period between 1995 and 2015 for the 20,583 firm-year observations. Columns 1-3 regress abnormal net hiring on employee treatment strengths and control
variables for the entire sample perod. Columns 4-6 regress abnormal net hiring on employee treatment concerns and control variables for the entire sample period.
*, **, *** indicate statistical significance at the 0.10, 0.05 and 0.001 levels.
All test statistics and significance level are calculated based on the standard error adjusted by a one-dimensional cluster at the firm level.
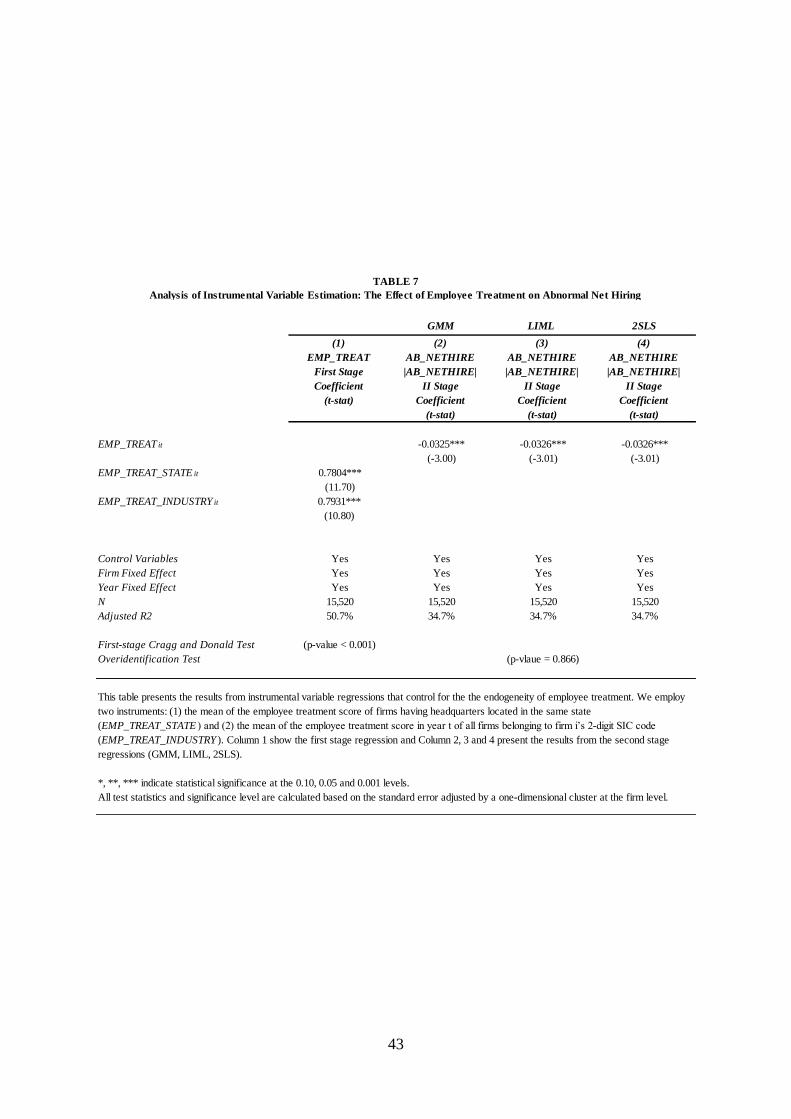
43
GMM LIML 2SLS
(1)
EMP_TREAT
First Stage
Coefficient
(t-stat)
(2)
AB_NETHIRE
|AB_NETHIRE|
II Stage
Coefficient
(t-stat)
(3)
AB_NETHIRE
|AB_NETHIRE|
II Stage
Coefficient
(t-stat)
(4)
AB_NETHIRE
|AB_NETHIRE|
II Stage
Coefficient
(t-stat)
EMP_TREAT it -0.0325*** -0.0326*** -0.0326***
(-3.00) (-3.01) (-3.01)
EMP_TREAT_STATE it 0.7804***
(11.70)
EMP_TREAT_INDUSTRY it 0.7931***
(10.80)
Control Variables Yes Yes Yes Yes
Firm Fixed Effect Yes Yes Yes Yes
Year Fixed Effect Yes Yes Yes Yes
N 15,520 15,520 15,520 15,520
Adjusted R2 50.7% 34.7% 34.7% 34.7%
First-stage Cragg and Donald Test (p-value < 0.001)
Overidentification Test
TABLE 7
Analysis of Instrumental Variable Estimation: The Effect of Employee Treatment on Abnormal Net Hiring
(p-vlaue = 0.866)
This table presents the results from instrumental variable regressions that control for the the endogeneity of employee treatment. We employ
two instruments: (1) the mean of the employee treatment score of firms having headquarters located in the same state
(EMP_TREAT_STATE ) and (2) the mean of the employee treatment score in year t of all firms belonging to firm i’s 2-digit SIC code
(EMP_TREAT_INDUSTRY ). Column 1 show the first stage regression and Column 2, 3 and 4 present the results from the second stage
regressions (GMM, LIML, 2SLS).
*, **, *** indicate statistical significance at the 0.10, 0.05 and 0.001 levels.
All test statistics and significance level are calculated based on the standard error adjusted by a one-dimensional cluster at the firm level.

44
(1)
AB_NETHIRE
|AB_NETHIRE|
Coefficient
(t-stat)
(2)
OVER_LABOR
(POSITIVE)
Coefficient
(t-stat)
(3)
UNDER_LABOR
(NEGATIVE)
Coefficient
(t-stat)
BEST100 it -0.142** -0.220*** 0.0787***
(-2.46) (-5.15) -8.73
MTB it-1 0.00009 0.00166 0.000924
-0.14 -1.06 -1.58
SIZE it-1 -0.0944*** -0.0337 0.0640**
(-2.99) (-0.38) -2.45
LIQ it-1 0.00848*** 0.0108** -0.00231
-4.07 -2.22 (-1.11)
LEV it-1 0.0444*** 0.0359 -0.0656***
-3.63 -0.99 (-7.20)
DIVD it-1 0.00335 0.00135 -0.00719
-0.42 -0.05 (-1.49)
TANGIBLES it-1 -0.0727** -0.0509 0.0737**
(-2.14) (-0.62) -2.28
LOSS it-1 -0.00473 -0.00791 -0.00777*
(-0.98) (-0.52) (-1.94)
LABINT it-1 -2.219* -14.07*** -2.510***
(-1.88) (-3.86) (-3.71)
INVEST it 0.391*** 0.420*** -0.237***
-11.63 -8.95 (-5.02)
SD_CFO it-1 0.0332 0.055 -0.012
-0.45 -0.35 (-0.20)
SD_SALES it-1 0.0178 0.104 0.0305*
-0.87 -1.59 -1.93
SD_NETHIRE it-1 -0.191*** -0.372*** 0.0178*
(-9.00) (-6.59) -1.92
UNION it-1 0.0191 0.166 0.0361
-0.45 -1.1 -1.13
Firm Fixed Effect Yes Yes Yes
Year Fixed Effect Yes Yes Yes
N 15,776 4,989 10,787
Adjusted R2 26.7% 33.5% 29.5%
TABLE 8
The Effect of Alternative Employee Treatment on Abnormal Net Hiring
OLS
This table presents the results from regressing abnormal net hiring on alternative employee treatment
measured as Fortune's Best 100 List and other control variables over the period between 1998 and
2012. Column 1 shows the results regressing abnormal net hiring on alternative employee treatment and
control variables. Column 2 shows the results regressing labor overinvestment on alternative employee
treatment and control variables. Column 3 shows the results regressing labor underinvestment on
employee treatment and control variables.
*, **, *** indicate statistical significance at the 0.10, 0.05 and 0.001 levels.
All test statistics and significance level are calculated based on the standard error adjusted by a one-
dimensional cluster at the firm level.
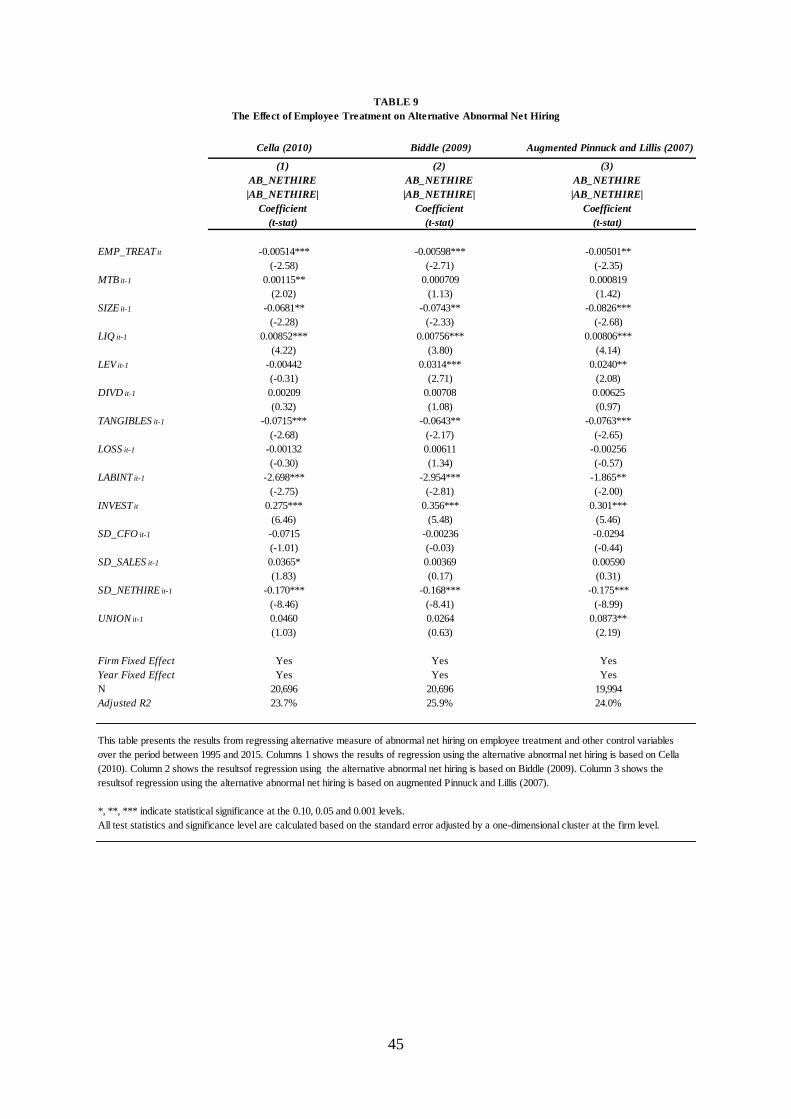
45
Cella (2010) Biddle (2009) Augmented Pinnuck and Lillis (2007)
(1)
AB_NETHIRE
|AB_NETHIRE|
Coefficient
(t-stat)
(2)
AB_NETHIRE
|AB_NETHIRE|
Coefficient
(t-stat)
(3)
AB_NETHIRE
|AB_NETHIRE|
Coefficient
(t-stat)
EMP_TREAT it -0.00514*** -0.00598*** -0.00501**
(-2.58) (-2.71) (-2.35)
MTB it-1 0.00115** 0.000709 0.000819
(2.02) (1.13) (1.42)
SIZE it-1 -0.0681** -0.0743** -0.0826***
(-2.28) (-2.33) (-2.68)
LIQ it-1 0.00852*** 0.00756*** 0.00806***
(4.22) (3.80) (4.14)
LEV it-1 -0.00442 0.0314*** 0.0240**
(-0.31) (2.71) (2.08)
DIVD it-1 0.00209 0.00708 0.00625
(0.32) (1.08) (0.97)
TANGIBLES it-1 -0.0715*** -0.0643** -0.0763***
(-2.68) (-2.17) (-2.65)
LOSS it-1 -0.00132 0.00611 -0.00256
(-0.30) (1.34) (-0.57)
LABINT it-1 -2.698*** -2.954*** -1.865**
(-2.75) (-2.81) (-2.00)
INVEST it 0.275*** 0.356*** 0.301***
(6.46) (5.48) (5.46)
SD_CFO it-1 -0.0715 -0.00236 -0.0294
(-1.01) (-0.03) (-0.44)
SD_SALES it-1 0.0365* 0.00369 0.00590
(1.83) (0.17) (0.31)
SD_NETHIRE it-1 -0.170*** -0.168*** -0.175***
(-8.46) (-8.41) (-8.99)
UNION it-1 0.0460 0.0264 0.0873**
(1.03) (0.63) (2.19)
Firm Fixed Effect Yes Yes Yes
Year Fixed Effect Yes Yes Yes
N 20,696 20,696 19,994
Adjusted R2 23.7% 25.9% 24.0%
TABLE 9
The Effect of Employee Treatment on Alternative Abnormal Net Hiring
This table presents the results from regressing alternative measure of abnormal net hiring on employee treatment and other control variables
over the period between 1995 and 2015. Columns 1 shows the results of regression using the alternative abnormal net hiring is based on Cella
(2010). Column 2 shows the resultsof regression using the alternative abnormal net hiring is based on Biddle (2009). Column 3 shows the
resultsof regression using the alternative abnormal net hiring is based on augmented Pinnuck and Lillis (2007).
*, **, *** indicate statistical significance at the 0.10, 0.05 and 0.001 levels.
All test statistics and significance level are calculated based on the standard error adjusted by a one-dimensional cluster at the firm level.

46
(1)
PRODUCTIVITY
PRODC_SALES
Sales per employee
Coefficient
(t-stat)
(2)
PRODUCTIVITY
PRODC_GPROFIT
Gross profit per employee
Coefficient
(t-stat)
(3)
PRODUCTIVITY
PRODC_NETINCOME
Net income per employee
Coefficient
(t-stat)
(4)
PROFITABILITY
ROA
Return on Assets
Coefficient
(t-stat)
EMP_TREAT it-1 0.000815 0.0191** 0.0369*** 0.00527***
(0.13) (2.45) (2.59) (3.64)
AB_NETHIRE it-1 -0.116*** -0.0912*** -0.191*** -0.0340***
(-3.87) (-2.73) (-3.13) (-3.54)
SIZE it-1 0.501*** 0.810*** 2.622*** 0.129***
(4.67) (7.08) (10.94) (5.32)
LIQ it-1 -0.0317*** -0.00893 0.00903 -0.000966
(-3.72) (-1.41) (0.74) (-0.63)
LEV it-1 -0.0657** -0.0234 -0.360*** -0.0336***
(-2.19) (-0.60) (-4.40) (-2.86)
MTB it-1 -0.000717 0.00179 0.0145*** 0.00306***
(-0.38) (0.84) (3.82) (4.86)
PPE it-1 0.0391 0.140 -0.568** -0.0235
(0.30) (1.01) (-2.24) (-1.00)
INVEST it-1 -0.269*** -0.209*** -0.382*** -0.0338*
(-7.47) (-6.33) (-3.97) (-1.89)
LOSS it-1 -0.0261** -0.0420*** -0.318*** -0.0163***
(-2.29) (-2.78) (-7.60) (-4.29)
SALESGROWTH1 it-1 0.309*** 0.207*** 0.435*** 0.0577***
(10.41) (5.56) (7.32) (7.61)
SALESGROWTH2 it-1 0.170*** 0.128*** 0.218*** 0.0314***
(5.42) (4.51) (4.28) (5.57)
GOVERNANCE it-1 0.00542 0.0133** -0.00811 0.00306**
(1.06) (2.00) (-0.57) (2.03)
CAPX it-1 -0.276* -0.332 0.601 0.118***
(-1.67) (-1.48) (1.52) (2.74)
Firm Fixed Effect Yes Yes Yes Yes
Year Fixed Effect Yes Yes Yes Yes
N 13,681 13,374 11,149 13,681
Adjusted R2 92.9% 92.2% 77.5% 57.8%
This table presents the results from regressing labor productivity and profitability on employee treatment, abnormal net hiring and other control
variables as dependent variable. Column 1 shows the results of the regression using employee productivity measured as the natural logarithm of net
income per employee as dependent variable. Column 2 shows the results of the regression using employee productivity measured as the natural
logarithm of sales per employee as dependent variable. Column 3 shows the results of the regression using employee productivity measured as the
natural logarithm of gross profit per employee as dependent variable. Column 4 shows the results of the regression using firms' profitability measured
as return on assets as dependent variable.
*, **, *** indicate statistical significance at the 0.10, 0.05 and 0.001 levels.
All test statistics and significance level are calculated based on the standard error adjusted by a one-dimensional cluster at the firm level.
The Effect of Employee Treatment and Abnormal Net Hiring on Labor Productivity and Profitability
TABLE 10

47
(1)
PRODUCTIVITY
PRODC_SALES
Sales per employee
Coefficient
(t-stat)
(2)
PRODUCTIVITY
PRODC_GPROFIT
Gross profit per employee
Coefficient
(t-stat)
(3)
PRODUCTIVITY
PRODC_NETINCOME
Net income per employee
Coefficient
(t-stat)
(4)
PROFITABILITY
ROA
Return on Assets
Coefficient
(t-stat)
ENVIRONMENT it-1 -0.0119** -0.00329 -0.000619 -0.00136
(-2.44) (-0.50) (-0.05) (-1.29)
AB_NETHIRE it-1 -0.116*** -0.0919*** -0.192*** -0.0342***
(-3.90) (-2.76) (-3.14) (-3.55)
COMMUNITY it-1 -0.0150* 0.00252 0.0192 -0.00326*
(-1.77) (0.24) (0.98) (-1.71)
AB_NETHIRE it-1 -0.116*** -0.0918*** -0.192*** -0.0342***
(-3.89) (-2.75) (-3.12) (-3.56)
EMP_RELATION it-1 -0.00386 0.00764 0.0181* 0.00386***
(-0.91) (1.38) (1.86) (3.81)
AB_NETHIRE it-1 -0.116*** -0.0913*** -0.191*** -0.0339***
(-3.88) (-2.74) (-3.12) (-3.53)
DIVERSITY it-1 0.00645* -0.0001 0.00543 -0.00167*
(1.79) (-0.02) (0.59) (-1.69)
AB_NETHIRE it-1 -0.115*** -0.0918*** -0.192*** -0.0343***
(-3.86) (-2.76) (-3.13) (-3.57)
PRODUCT it-1 0.0009 0.0188** 0.0382** 0.00240
(0.06) (2.05) (2.14) (1.33)
AB_NETHIRE it-1 -0.116*** -0.0912*** -0.191*** -0.0341***
(-3.87) (-2.73) (-3.12) (-3.54)
HUMAN_RIGHTS it-1 -0.0001 0.0162 -0.0169 -0.00969***
(-0.01) (0.75) (-0.51) (-3.67)
AB_NETHIRE it-1 -0.116*** -0.0921*** -0.192*** -0.0341***
(-3.87) (-2.77) (-3.13) (-3.54)
Control Variables Yes Yes Yes Yes
Firm Fixed Effect Yes Yes Yes Yes
Year Fixed Effect Yes Yes Yes Yes
N 13,681 13,374 11,149 13,681
Adjusted R2 92.9% 92.2% 77.5% 57.8%
This table presents the results from regressing individual components of CSR on employee productivity (PRODC_SALES,
PRODC_GPROFIT and PRODC_NETINCOME ) and profitability (ROA ). The individual components of CSR are environment
(ENVIRONMENT ), community (COMMUNITY ), employee relations (EMP_RELATION ), diversity (DIVERSITY ), product
(PRODUCT ) and human rights (HUMAN_RIGHTS ).
*, **, *** indicate statistical significance at the 0.10, 0.05 and 0.001 levels.
All test statistics and significance level are calculated based on the standard error adjusted by a one-dimensional cluster at the firm level.
TABLE 11
The Effect of CSR Dimensions and Abnormal Net Hiring on Labor Productivity and Profitabiltiy
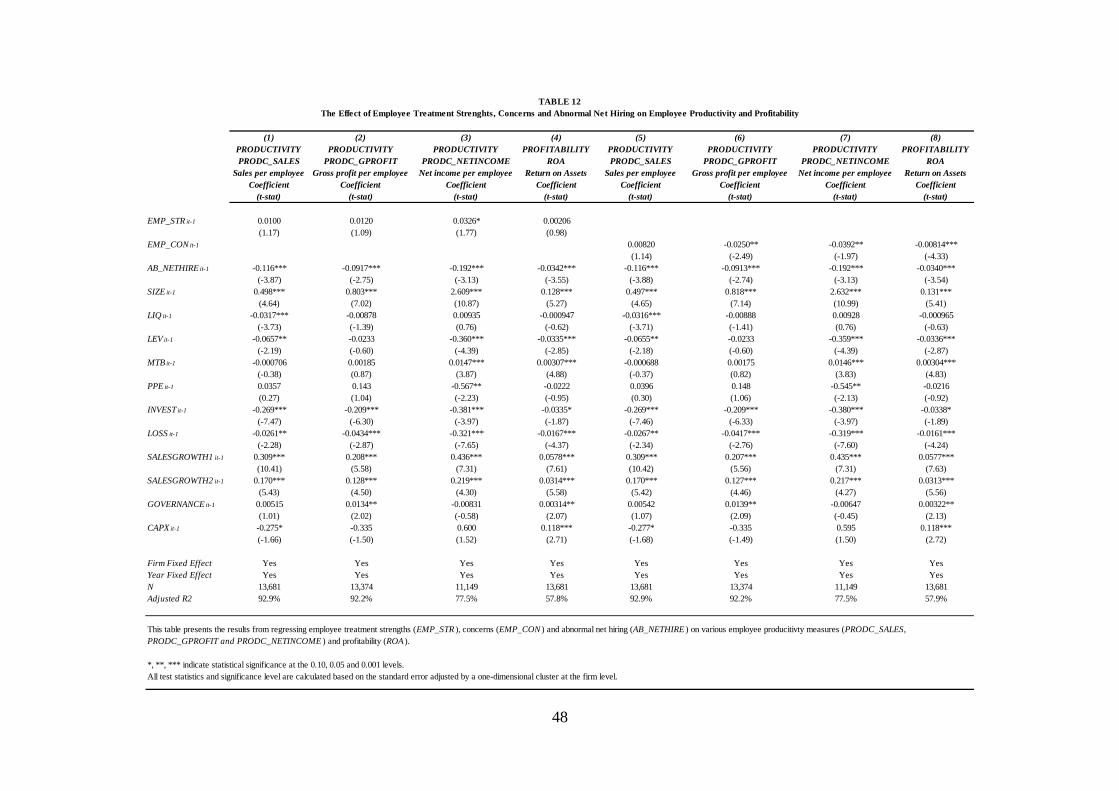
48
(1)
PRODUCTIVITY
PRODC_SALES
Sales per employee
Coefficient
(t-stat)
(2)
PRODUCTIVITY
PRODC_GPROFIT
Gross profit per employee
Coefficient
(t-stat)
(3)
PRODUCTIVITY
PRODC_NETINCOME
Net income per employee
Coefficient
(t-stat)
(4)
PROFITABILITY
ROA
Return on Assets
Coefficient
(t-stat)
(5)
PRODUCTIVITY
PRODC_SALES
Sales per employee
Coefficient
(t-stat)
(6)
PRODUCTIVITY
PRODC_GPROFIT
Gross profit per employee
Coefficient
(t-stat)
(7)
PRODUCTIVITY
PRODC_NETINCOME
Net income per employee
Coefficient
(t-stat)
(8)
PROFITABILITY
ROA
Return on Assets
Coefficient
(t-stat)
EMP_STR it-1 0.0100 0.0120 0.0326* 0.00206
(1.17) (1.09) (1.77) (0.98)
EMP_CON it-1 0.00820 -0.0250** -0.0392** -0.00814***
(1.14) (-2.49) (-1.97) (-4.33)
AB_NETHIRE it-1 -0.116*** -0.0917*** -0.192*** -0.0342*** -0.116*** -0.0913*** -0.192*** -0.0340***
(-3.87) (-2.75) (-3.13) (-3.55) (-3.88) (-2.74) (-3.13) (-3.54)
SIZE it-1 0.498*** 0.803*** 2.609*** 0.128*** 0.497*** 0.818*** 2.632*** 0.131***
(4.64) (7.02) (10.87) (5.27) (4.65) (7.14) (10.99) (5.41)
LIQ it-1 -0.0317*** -0.00878 0.00935 -0.000947 -0.0316*** -0.00888 0.00928 -0.000965
(-3.73) (-1.39) (0.76) (-0.62) (-3.71) (-1.41) (0.76) (-0.63)
LEV it-1 -0.0657** -0.0233 -0.360*** -0.0335*** -0.0655** -0.0233 -0.359*** -0.0336***
(-2.19) (-0.60) (-4.39) (-2.85) (-2.18) (-0.60) (-4.39) (-2.87)
MTB it-1 -0.000706 0.00185 0.0147*** 0.00307*** -0.000688 0.00175 0.0146*** 0.00304***
(-0.38) (0.87) (3.87) (4.88) (-0.37) (0.82) (3.83) (4.83)
PPE it-1 0.0357 0.143 -0.567** -0.0222 0.0396 0.148 -0.545** -0.0216
(0.27) (1.04) (-2.23) (-0.95) (0.30) (1.06) (-2.13) (-0.92)
INVEST it-1 -0.269*** -0.209*** -0.381*** -0.0335* -0.269*** -0.209*** -0.380*** -0.0338*
(-7.47) (-6.30) (-3.97) (-1.87) (-7.46) (-6.33) (-3.97) (-1.89)
LOSS it-1 -0.0261** -0.0434*** -0.321*** -0.0167*** -0.0267** -0.0417*** -0.319*** -0.0161***
(-2.28) (-2.87) (-7.65) (-4.37) (-2.34) (-2.76) (-7.60) (-4.24)
SALESGROWTH1 it-1 0.309*** 0.208*** 0.436*** 0.0578*** 0.309*** 0.207*** 0.435*** 0.0577***
(10.41) (5.58) (7.31) (7.61) (10.42) (5.56) (7.31) (7.63)
SALESGROWTH2 it-1 0.170*** 0.128*** 0.219*** 0.0314*** 0.170*** 0.127*** 0.217*** 0.0313***
(5.43) (4.50) (4.30) (5.58) (5.42) (4.46) (4.27) (5.56)
GOVERNANCE it-1 0.00515 0.0134** -0.00831 0.00314** 0.00542 0.0139** -0.00647 0.00322**
(1.01) (2.02) (-0.58) (2.07) (1.07) (2.09) (-0.45) (2.13)
CAPX it-1 -0.275* -0.335 0.600 0.118*** -0.277* -0.335 0.595 0.118***
(-1.66) (-1.50) (1.52) (2.71) (-1.68) (-1.49) (1.50) (2.72)
Firm Fixed Effect Yes Yes Yes Yes Yes Yes Yes Yes
Year Fixed Effect Yes Yes Yes Yes Yes Yes Yes Yes
N 13,681 13,374 11,149 13,681 13,681 13,374 11,149 13,681
Adjusted R2 92.9% 92.2% 77.5% 57.8% 92.9% 92.2% 77.5% 57.9%
This table presents the results from regressing employee treatment strengths (EMP_STR ), concerns (EMP_CON ) and abnormal net hiring (AB_NETHIRE ) on various employee producitivty measures (PRODC_SALES,
PRODC_GPROFIT and PRODC_NETINCOME ) and profitability (ROA ).
*, **, *** indicate statistical significance at the 0.10, 0.05 and 0.001 levels.
All test statistics and significance level are calculated based on the standard error adjusted by a one-dimensional cluster at the firm level.
The Effect of Employee Treatment Strenghts, Concerns and Abnormal Net Hiring on Employee Productivity and Profitability
TABLE 12
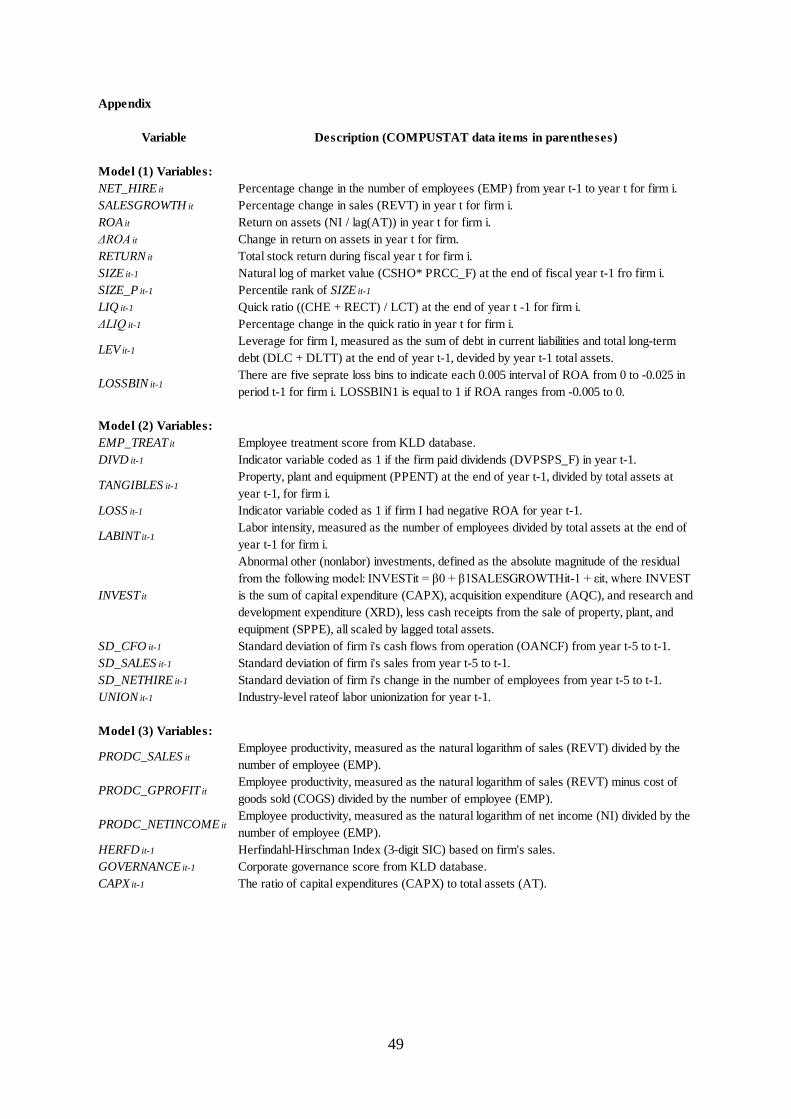
49
Appendix
Variable Description (COMPUSTAT data items in parentheses)
Model (1) Variables:
NET_HIRE it Percentage change in the number of employees (EMP) from year t-1 to year t for firm i.
SALESGROWTH it Percentage change in sales (REVT) in year t for firm i.
ROA it Return on assets (NI / lag(AT)) in year t for firm i.
ΔROA it Change in return on assets in year t for firm.
RETURN it Total stock return during fiscal year t for firm i.
SIZE it-1 Natural log of market value (CSHO* PRCC_F) at the end of fiscal year t-1 fro firm i.
SIZE_P it-1 Percentile rank of SIZE it-1
LIQ it-1 Quick ratio ((CHE + RECT) / LCT) at the end of year t -1 for firm i.
ΔLIQ it-1 Percentage change in the quick ratio in year t for firm i.
LEV it-1Leverage for firm I, measured as the sum of debt in current liabilities and total long-term
debt (DLC + DLTT) at the end of year t-1, devided by year t-1 total assets.
LOSSBIN it-1There are five seprate loss bins to indicate each 0.005 interval of ROA from 0 to -0.025 in
period t-1 for firm i. LOSSBIN1 is equal to 1 if ROA ranges from -0.005 to 0.
Model (2) Variables:
EMP_TREAT it Employee treatment score from KLD database.
DIVD it-1 Indicator variable coded as 1 if the firm paid dividends (DVPSPS_F) in year t-1.
TANGIBLES it-1Property, plant and equipment (PPENT) at the end of year t-1, divided by total assets at
year t-1, for firm i.
LOSS it-1 Indicator variable coded as 1 if firm I had negative ROA for year t-1.
LABINT it-1Labor intensity, measured as the number of employees divided by total assets at the end of
year t-1 for firm i.
INVEST it
Abnormal other (nonlabor) investments, defined as the absolute magnitude of the residual
from the following model: INVESTit = β0 + β1SALESGROWTHit-1 + εit, where INVEST
is the sum of capital expenditure (CAPX), acquisition expenditure (AQC), and research and
development expenditure (XRD), less cash receipts from the sale of property, plant, and
equipment (SPPE), all scaled by lagged total assets.
SD_CFO it-1 Standard deviation of firm i's cash flows from operation (OANCF) from year t-5 to t-1.
SD_SALES it-1 Standard deviation of firm i's sales from year t-5 to t-1.
SD_NETHIRE it-1 Standard deviation of firm i's change in the number of employees from year t-5 to t-1.
UNION it-1 Industry-level rateof labor unionization for year t-1.
Model (3) Variables:
PRODC_SALES itEmployee productivity, measured as the natural logarithm of sales (REVT) divided by the
number of employee (EMP).
PRODC_GPROFIT itEmployee productivity, measured as the natural logarithm of sales (REVT) minus cost of
goods sold (COGS) divided by the number of employee (EMP).
PRODC_NETINCOME itEmployee productivity, measured as the natural logarithm of net income (NI) divided by the
number of employee (EMP).
HERFD it-1 Herfindahl-Hirschman Index (3-digit SIC) based on firm's sales.
GOVERNANCE it-1 Corporate governance score from KLD database.
CAPX it-1 The ratio of capital expenditures (CAPX) to total assets (AT).
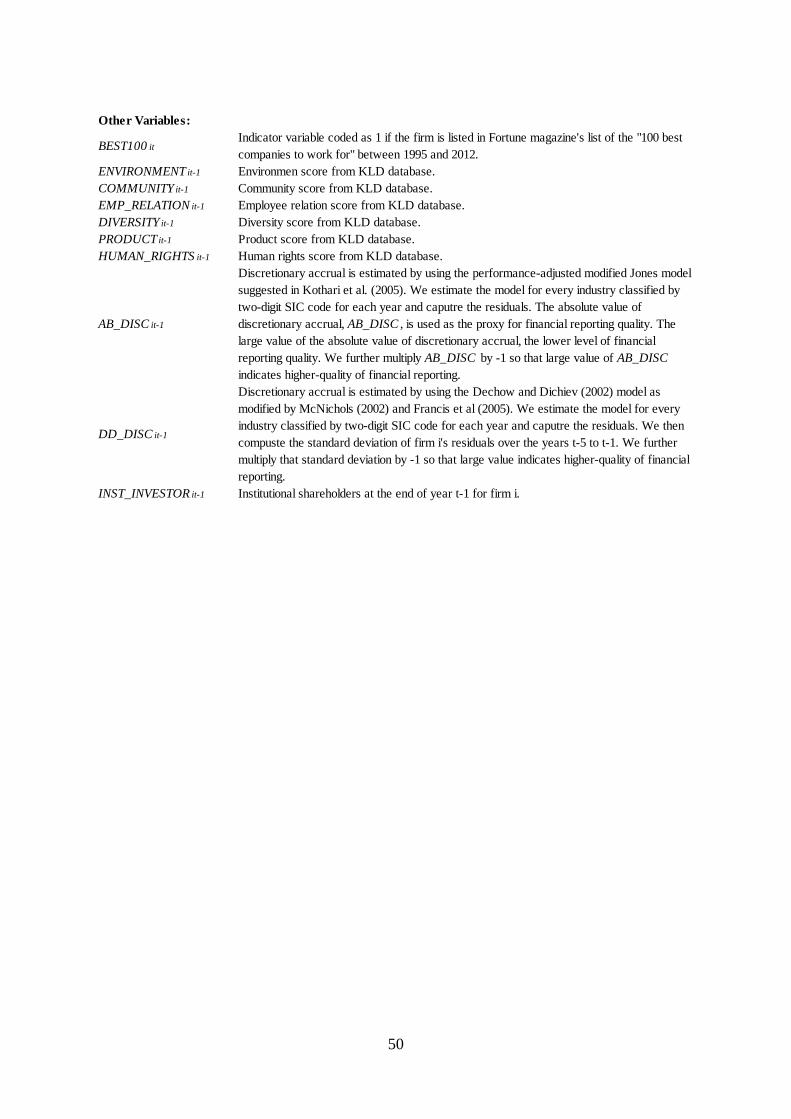
50
Other Variables:
BEST100 itIndicator variable coded as 1 if the firm is listed in Fortune magazine's list of the "100 best
companies to work for" between 1995 and 2012.
ENVIRONMENT it-1 Environmen score from KLD database.
COMMUNITY it-1 Community score from KLD database.
EMP_RELATION it-1 Employee relation score from KLD database.
DIVERSITY it-1 Diversity score from KLD database.
PRODUCT it-1 Product score from KLD database.
HUMAN_RIGHTS it-1 Human rights score from KLD database.
AB_DISC it-1
Discretionary accrual is estimated by using the performance-adjusted modified Jones model
suggested in Kothari et al. (2005). We estimate the model for every industry classified by
two-digit SIC code for each year and caputre the residuals. The absolute value of
discretionary accrual, AB_DISC , is used as the proxy for financial reporting quality. The
large value of the absolute value of discretionary accrual, the lower level of financial
reporting quality. We further multiply AB_DISC by -1 so that large value of AB_DISC
indicates higher-quality of financial reporting.
DD_DISC it-1
Discretionary accrual is estimated by using the Dechow and Dichiev (2002) model as
modified by McNichols (2002) and Francis et al (2005). We estimate the model for every
industry classified by two-digit SIC code for each year and caputre the residuals. We then
compuste the standard deviation of firm i's residuals over the years t-5 to t-1. We further
multiply that standard deviation by -1 so that large value indicates higher-quality of financial
reporting.
INST_INVESTOR it-1 Institutional shareholders at the end of year t-1 for firm i.

51
Appendix
Panel A
N Mean Median Std.Dev 25th Percentile 75th Percentile
Variable
NET_HIRE it 96,221 0.091 0.028 0.349 -0.050 0.149
SALESGROWTH it 96,221 0.187 0.078 0.634 -0.032 0.233
SALESGROWTH it-1 96,221 0.256 0.092 0.812 -0.019 0.266
ΔROA it 96,221 0.004 0.006 0.190 -0.038 0.044
ΔROA it-1 96,221 -0.000 0.006 0.212 -0.038 0.045
ROA it 96,221 -0.032 0.032 0.258 -0.054 0.083
RETURN it 96,221 0.146 0.002 0.801 -0.294 0.328
SIZE it-1 96,221 5.615 5.524 2.222 3.971 7.138
LIQ it-1 96,221 2.121 1.265 2.584 0.770 2.343
ΔLIQ it-1 96,221 0.243 -0.000 1.182 -0.208 0.256
ΔLIQ it 96,221 0.106 -0.021 0.823 -0.229 0.202
LEV it-1 96,221 0.256 0.195 0.282 0.025 0.378
TABLE 1
Descriptive Statistics of Selected Variables in Model 1
This table presents the descriptive statistics for the 96,507 firm-year observations over the period between 1991 and 2016. This table
presents the number of observations, the mean, the median, the standard deviation, the values for the first and the third quartile for all
the variables in Equation 1.
The primary estimate of expected net hiring is based on the model of Pinnuck and Lillies (2007). NET_HIRE is the percentage
change in employee. SALE_GROWTH is the percentage change in sale revenue. ROA is net income sacled by beginning of the year
total asset. RETURN is the annual stock return for year t. SIZE_R is the log of market value of equity at the beginning of the year,
ranked into percentiles. LIQ is the ratio of cash and short-term investments plus receivables to current liabilities. LEV is the ratio of
long term debt to total assets at the beginning of the year.

52
Panel B
(1)
Expected
Sign
(2)
Coefficient
(t-stat)
SALESGROWTH it + 0.2157***
(46.87)
SALESGROWTH it-1 + 0.0255***
(10.66)
ROA it + 0.1474***
(17.68)
ΔROA it - -0.2384***
(-23.52)
ΔROA it-1 + 0.0407***
(4.95)
RETURN it + 0.0414***
(22.94)
SIZE_P it-1 + 0.0478***
(10.85)
LIQ it-1 + 0.0069***
(10.76)
ΔLIQ it +/- -0.0089***
(-4.33)
ΔLIQ it-1 + 0.0225***
(14.63)
LEV it-1 +/- -0.0101*
(-1.91)
LOSSBIN1 it-1 - -0.0230***
(-2.96)
LOSSBIN2 it-1 - -0.0386***
(-5.37)
LOSSBIN3 it-1 - -0.0312***
(-3.75)
LOSSBIN4 it-1 - -0.0262***
(-3.16)
LOSSBIN5 it-1 - -0.0365***
(-4.34)
Industry Fixed Effect Yes
N 96,211
Adjusted R2 21.4%
Regression Results (Dependent Variable = NET_HIRE )
This table presents the results from regressing the percentage change in
employees on variables capturing underlying economic fundamentals over
the period between 1991 and 2016.
t-statistics are calculated using Newey-West corrected standard errors.
*, **, *** indicate statistical significance at the 0.10, 0.05 and 0.001 levels.