Embed Size (px)
Citation preview
This is a repository copy of Empirical Study of BIM Implementation–Based Perceptions among Chinese Practitioners.
White Rose Research Online URL for this paper:http://eprints.whiterose.ac.uk/116347/
Version: Accepted Version
Article:
Jin, R, Hancock, C, Tang, L et al. (3 more authors) (2017) Empirical Study of BIM Implementation–Based Perceptions among Chinese Practitioners. Journal of Managementin Engineering, 33 (5). 04017025. ISSN 0742-597X
https://doi.org/10.1061/(ASCE)ME.1943-5479.0000538
© ASCE. This is an author produced version of a paper published in the Journal of Management in Engineering. Uploaded in accordance with the publisher's self-archiving policy.
[email protected]://eprints.whiterose.ac.uk/
Reuse
Unless indicated otherwise, fulltext items are protected by copyright with all rights reserved. The copyright exception in section 29 of the Copyright, Designs and Patents Act 1988 allows the making of a single copy solely for the purpose of non-commercial research or private study within the limits of fair dealing. The publisher or other rights-holder may allow further reproduction and re-use of this version - refer to the White Rose Research Online record for this item. Where records identify the publisher as the copyright holder, users can verify any specific terms of use on the publisher’s website.
Takedown
If you consider content in White Rose Research Online to be in breach of UK law, please notify us by emailing [email protected] including the URL of the record and the reason for the withdrawal request.
1
An Empirical Study of BIM-Implementation-Based Perceptions among 1
Chinese Practitioners 2
Ruoyu Jin1, Craig M. Hancock2, Llewellyn Tang3, Chao Chen4, Dariusz Wanatowski5, Lin 3
Yang6!
4
Abstract 5
The global movement of Building Information Modeling is spreading the implementation 6
of BIM from developed countries to other developing countries. Practitioners’ perceptions on 7
BIM implementation in these developing countries, such as China, a giant building market 8
which is increasing the BIM application in the industry, have not been thoroughly understood. 9
This research adopted the questionnaire survey to investigate the BIM practice and its related 10
perceptions from 94 randomly recruited Chinese BIM professionals. Reductions in design 11
errors and resulted construction rework were considered the top benefit of using BIM. The 12
most important factor in achieving BIM value was the interoperability among various BIM 13
tools. A comprehensive evaluation of BIM in the company level was considered a major 14
difficulty of implementing BIM. The owner was considered the party that received most 15
benefits from BIM. Subgroup differences based on two major categories (i.e., participants’ 16
profession and BIM proficiency level) were analyzed in these BIM-implementation-related 17
sections. Statistical analysis revealed that generally neither the profession nor BIM proficiency 18
level would affect participants’ perceptions on benefits, factors, challenges, or benefited parties 19
in BIM implementation. 20
1Assistant Professor, Department of Architecture and Built Environment, University of Nottingham Ningbo 21
China, 199 Taikang East Rd., Ningbo China. Email: [email protected] 22 2Assistant Professor, Department of Civil Engineering, University of Nottingham Ningbo China, 199 Taikang 23
East Rd., Ningbo China. Email: [email protected] 24 3Associate Professor, Department of Architecture and Built Environment, University of Nottingham Ningbo 25
China, 199 Taikang East Rd., Ningbo China. Email: [email protected] 26 4Ph.D. candidate, Department of Architecture and Built Environment, University of Nottingham Ningbo China, 27
199 Taikang East Rd., Ningbo China. Email: [email protected] 28 5Professor and Pro-Dean of the SWJTU-Leeds Joint School, University of Leeds, United Kingdom. Email: 29
[email protected] 30 6BIM Consultancy Manager, Shanghai BIM Engineering Centre (SBEC), Email: [email protected] 31
2
CE Database subject headings: 32
Author Keywords: Building information modeling; AEC; Interoperability; Subgroup 33
differences; Statistical analysis; Developing countries. 34
35
Introduction 36
Building Information Modelling (BIM), the digital technology enabling creations of 37
accurate virtual models and supporting further activities in the project delivery process, is one 38
of the most promising developments in the architectural, engineering, and construction (AEC) 39
industries (Eastman et al., 2011). China, the huge AEC market accounted for 47.9% of the 40
Asia-Pacific industry according to MarketLine (2014), was expected to continue the growth of 41
its construction industry from 2013 to 2018 with an average rate at 12.6%. Accompanying 42
China’s AEC market growth is the increased BIM application. BIM has been displaying its 43
impacts on the industry practice (Azhar et al. 2012; Francom and Asmar, 2015). One major 44
concern in terms of current and future BIM implementation is the perceptions of industry 45
professionals towards BIM and how they see BIM affecting their business now and in the 46
future. Practitioners’ perceptions towards BIM implementation has been studied in developed 47
countries (e.g., Eadie et al., 2013; Ahn et al., 2015). However, it has not been thoroughly 48
investigated in developing countries. Using China, the giant AEC market as the case for BIM 49
empirical studies in developing countries, this research aims to evaluate the major benefits and 50
barriers of implementing BIM, factors impacting BIM to achieve its value, and project parties 51
benefitted from BIM. 52
Previously conducted BIM-related surveys in China, including China Construction 53
Industry Association (CCIA, 2013) and Shenzhen Exploration & Design Association (SZEDA, 54
2013), targeted on contractors and design firms respectively to investigate BIM-related 55
activities (e.g., visualization), BIM impacts, and challenges in BIM practice. Collaboration was 56
3
considered by CCIA (2013), SZEDA (2013), and Eadie et al. (2013) the key for successful 57
BIM practice, as staff from different disciplines and various BIM proficiency levels would be 58
involved in the same project. BIM adoption within the same organization, such as a 59
construction company in the study of Sackey et al. (2014), would also involve multidisciplinary 60
professionals in the sociotechnical collaboration. The mechanism of human behavior in a 61
virtual organization, as identified by Lu et al. (2014), should be further explored when adopting 62
information and communicating technology. The perception would have a direct effect on 63
behavior (Dijksterhuis and Bargh, 2001). Currently, it has not been well studied whether the 64
BIM practitioners’ profession (e.g., architects, engineers, consultants, etc.) and their BIM 65
experience would affect the perceptions on BIM implementation. The objectives of this study 66
focus on: 1) gaining the overall picture of how the active BIM practitioners from various fields 67
in China would perceive BIM in terms of its benefits, factors influencing its practice, and 68
challenges to implement it, etc.; 2) recruiting BIM practitioners from multiple disciplines 69
according to their AEC fields and BIM proficiency levels for this empirical study; and 3) 70
adapting statistical methods including Chi-Square test of independence and Analysis of 71
Variance (ANOVA) to explore whether subgroup differences exist in these perceptions. 72
Results from subgroup analysis would provide insights on whether practitioners from different 73
professions and experience levels tend to have consistent perceptions, which could be one of 74
the indicators for the effective collaboration in BIM-involved projects. The findings from this 75
study provide information to international AEC firms involved in or entering the China market 76
as well as relevant building construction authorities in light of the current BIM implementation 77
as well as trend, direction, and movements of future BIM practice. 78
79
80
81
4
Literature Review 82
An Overview of BIM Practice Worldwide !83
BIM is undergoing the increased application in the global AEC industries. Investigations 84
on the current stage of BIM practice have been conducted in different countries. These studies 85
(Both et al, 2013; Davies and Harty, 2013; Masood et al., 2013; Juszczyk et al., 2015) recruited 86
BIM practitioners from a certain profession (e.g., engineers or contractors) on investigating 87
either the current BIM practices (e.g., to achieve visualization), BIM experience (e.g., years of 88
practicing BIM), and visions of BIM (e.g., benefits and barriers in BIM implementation). 89
Although survey respondents from various professions showed limited BIM experience in 90
countries including China (CCIA, 2013), Poland (Juszczyk et al., 2015) and Pakistan (Masood 91
et al., 2013), the BIM application was expected to grow fast in recent years (McGraw-Hill 92
Construction, 2014). Review of previous BIM studies revealed that the perceptions on specific 93
BIM-related issues may vary depend on respondents’ professions. For example, contractors 94
considered themselves benefited most from the BIM technology (CCIA, 2013), while design 95
and staff from other professions tended to perceive the client the party that had the most benefit 96
from BIM (Eadie et al., 2013; SZEDA, 2013). Cost control was perceived by contractors as the 97
major measurement of BIM impact (CCIA, 2013), while the engineers listed the reduction in 98
design changes as the major effect from BIM (SZEDA, 2013). 99
BIM Practice in China’s AEC Industries 100
China’s construction market has the potential to see BIM benefits, but it is restricted to its 101
own structural obstacles (McGraw-Hill Construction, 2014). BIM would be the major 102
breakthrough in China’s building industry, but the BIM development faces these challenges 103
including lack of well-developed standards, insufficient interoperability among project 104
members, and difficulties of applying BIM in the whole building lifecycle, etc (He et al., 2012). 105
Despite that the BIM adoption rate was low in 2012 among major large-sized Chinese 106
5
contractors (CCIA, 2013), the more recently released survey report from Shanghai 107
Construction Trade Association (SCTA) & Luban Consulting (2014) showed that 67% of 108
construction firms nationwide had started BIM practice, and over 10% of clients had used BIM 109
in more than half of their projects by the end of 2014. The governmental policies and industry 110
standards newly announced in recent years could be one driver to the increased BIM usage in 111
China’s AEC industries. 112
As indicated by Cao et al. (2016), government requirements are one motive to implement 113
BIM. Since 2011, BIM-related policies and standards have been undergoing fast movement. 114
According to Jin et al. (2015), the recent movements of BIM-related governmental policies in 115
China have been undergoing major steps from announcing the digitalization visions in 2011, 116
publishing the first version of BIM standard in 2012, listing strategic objectives in 2013 with 117
detailed timeline of BIM adoption, to further proposing the BIM application crossing the whole 118
project life cycle in 2014. ! 119
Benefits of Adopting BIM 120
Two-thirds of BIM users in the report of McGraw-Hill Construction (2014) had a positive 121
view of the return on their investments in BIM. The increase of interoperability of BIM 122
software was estimated to save up to two thirds of the annual overall cost paid by clients, 123
building users and operators (Furneaux and Kivvits, 2008). Contractors had reduced 1%-2% 124
cost of MEP systems in large healthcare projects by using BIM (Khanzode, et al., 2008). Other 125
parties such as software vendors also acquired large returns on the investment of BIM (Becerik-126
Gerber and Rice, 2010; Cheung et al., 2012). 127
Besides the financial benefits gained from multiple parties, other benefits that BIM could 128
bring to the project include 3D visualization, reduction of design errors and rework, clash 129
detection, full understanding of the project, and reduction of construction period (Yan and 130
Damian, 2008; Both et al., 2012; Crotty, 2012; Migilinskas et al., 2013; Ahn et al., 2015). 131
6
However, achieving these benefits would depend on various factors including but not limited 132
to collaboration among different teams (He et al., 2012; Eadie et al., 2013; SZEDA, 2013), 133
BIM expertise within team members (Ku and Taiebat, 2011; Kashiwagi et al., 2012; Eadie et 134
al., 2013; SZEDA, 2013; Cao et al., 2016), legal issues within the contract that involves BIM 135
usage (Oluwole, 2011; Race, 2012), project location, type and nature (Cao et al., 2016), and 136
budget (Bazjanac, 2006). These factors, if not properly handled in a BIM-involved project, 137
would possibly barricade the BIM implementation. 138
Barriers and Challenges of Implementing BIM 139
The potential challenges of implementing BIM include: 140
‚ Insufficient evaluation of BIM value from the company level indicated by Sebastian (2010) 141
when BIM users fail to see the immediate benefits from projects delivered to date 142
‚ Resistance at higher management or operation level (Bender, 2010), which could be partly 143
due to the cultural resistance (Denzer and Hedges, 2008; Dawood and Iqbal, 2010) 144
‚ Lack of requirements from the client (Birkeland, 2009; Breetzke and Hawkins, 2009) 145
‚ High initial cost of BIM (Yan and Damian, 2008; Giel et al., 2010; Azhar, 2011) 146
‚ Availability of governmental policies and industry standards (Smith and Tardif, 2009; He 147
et al., 2012) 148
‚ BIM education and training (Trine, 2008; Jäväjä and Salin, 2014; Tang et al., 2015) 149
‚ The practicability of BIM implementation not well understood (Sackey et al., 2014) and 150
requiring further studies on BIM practice within the AEC organizational context (Lu et al., 151
2014) 152
153
Methodology 154
The research team from the University of Nottingham Ningbo China (UNNC), in 155
collaboration with Shanghai BIM Engineering Centre (SBEC), has been working on the 156
7
investigation of China AEC industries’ BIM practice and perceptions on BIM-related issues, 157
including benefits generated from BIM, impact factors to BIM implementation, challenges in 158
implementing BIM, and financially benefitted parties from BIM. A relevant questionnaire 159
survey was designed by the UNNC research team and peer-reviewed by professionals from 160
SBEC between August 2014 and May 2015, and approved by the Research Ethics Office in 161
June 2015 at the University of Nottingham Ningbo China to ensure that human-subject related 162
research activities met the research ethics requirements. 163
Questionnaires were delivered to totally 200 random attendants including consultants, 164
architects, engineers, owners, and other AEC industry practitioners from China’s national 165
network of Digital Design and Construction during the First Forum of BIM Technology and 166
Lean Construction organized by SBEC in July 2015. In total 81 responses were received out 167
of 200 hardcopies sent. Electronic questionnaire was sent via SOJUMP, a Chinese online 168
survey system (www.sojump.com) to collect more responses from the survey pool of Chinese 169
AEC professionals who have been adopting BIM or planning to start BIM usage in their work. 170
In total 13 responded surveys were received from 97 questionnaires sent during July 2015. 171
Statistical analysis (e.g., two-sample t-test) of responses collected between site survey and on-172
line questionnaire revealed high consistency. Combining the questionnaires responded from 173
both hardcopies and on-line, finally questionnaires from 94 participants were recruited for the 174
follow-up data analysis. 175
Two major types of questions were designed in the questionnaire: multi-choice and Likert 176
scale. The survey sample was divided into subgroups based on two categorizations: profession 177
(e.g., architects, engineer, contractor, software developer, etc.), and BIM proficiency level (e.g., 178
expert, advanced level, intermediate level, entry-level, and no BIM experience). For multi-179
choice questions related to BIM adoption rate and benefited parties, the Chi-Square test of 180
independence from Johnson (2005) at the 5% level of significance was performed to evaluate 181
8
whether subgroups had consistent percentages of selecting the same option in the given 182
question. A corresponding p value lower than 0.05 would reject the null hypothesis that the 183
percentages of subgroups selecting each option is independent on either the profession or BIM 184
proficiency level. 185
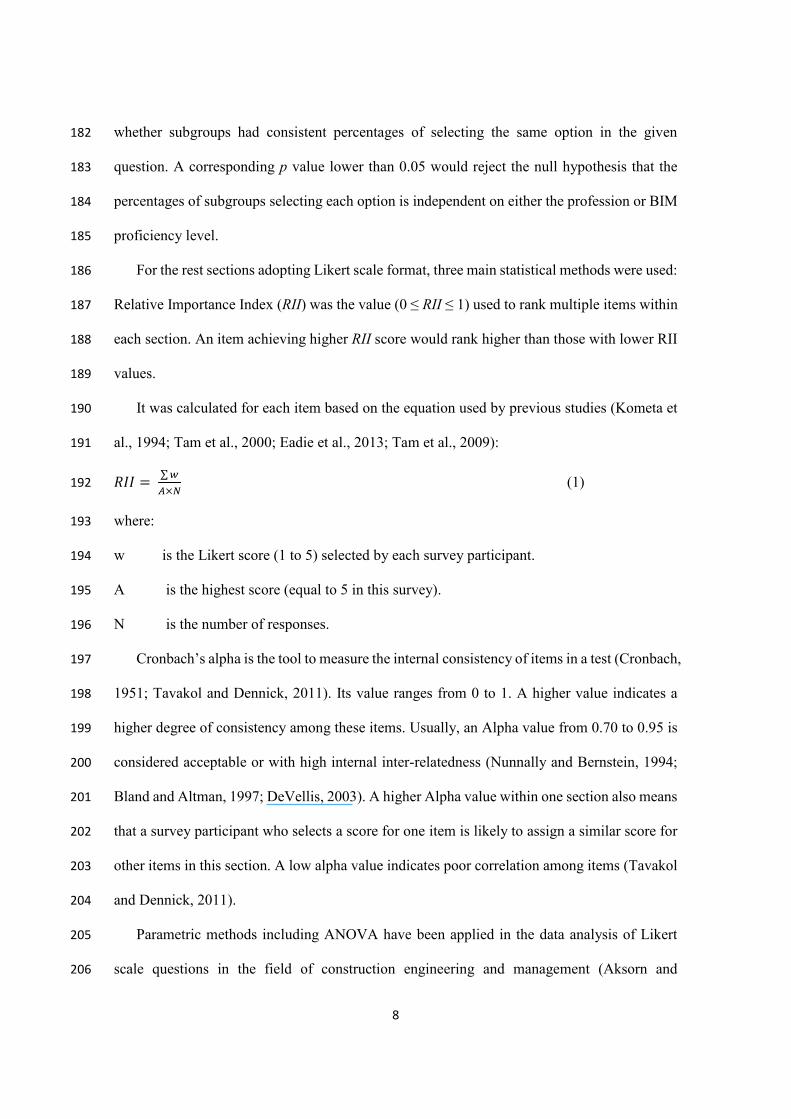
For the rest sections adopting Likert scale format, three main statistical methods were used: 186
Relative Importance Index (RII) was the value (0 ≤ RII ≤ 1) used to rank multiple items within 187
each section. An item achieving higher RII score would rank higher than those with lower RII 188
values. 189
It was calculated for each item based on the equation used by previous studies (Kometa et 190
al., 1994; Tam et al., 2000; Eadie et al., 2013; Tam et al., 2009): 191 迎荊荊 噺 デ 栂凋抜朝 (1) 192
where: 193
w is the Likert score (1 to 5) selected by each survey participant. 194
A is the highest score (equal to 5 in this survey). 195
N is the number of responses. 196
Cronbach’s alpha is the tool to measure the internal consistency of items in a test (Cronbach, 197
1951; Tavakol and Dennick, 2011). Its value ranges from 0 to 1. A higher value indicates a 198
higher degree of consistency among these items. Usually, an Alpha value from 0.70 to 0.95 is 199
considered acceptable or with high internal inter-relatedness (Nunnally and Bernstein, 1994; 200
Bland and Altman, 1997; DeVellis, 2003). A higher Alpha value within one section also means 201
that a survey participant who selects a score for one item is likely to assign a similar score for 202
other items in this section. A low alpha value indicates poor correlation among items (Tavakol 203
and Dennick, 2011). 204
Parametric methods including ANOVA have been applied in the data analysis of Likert 205
scale questions in the field of construction engineering and management (Aksorn and 206
9
Hadikusumo, 2008; Meliá et al., 2008; Tam, 2009). Parametric methods have been proved in 207
multiple studies adopting parametric methods (e.g., Carifio and Perla, 2008; Norman, 2010) in 208
its robustness when applied in samples that were small in size or not normally distributed. 209
Examples of small sample sizes in parametric methods include subgroup size at 4 in Tam 210
(2009)’s study and highly skewed non-normal distributions with subsample sizes as small as 4 211
in Pearson (1931)’ case. The overall sample size and subsample sizes in this research are 212
considered fair compared to all these previous studies. ANOVA tests whether the subgroups 213
had consistent mean values in the given section. Based on a 5% level of significance, a p value 214
lower than 0.05 would suggest that subgroup differences exist when perceiving the given item. 215
216
Findings on the Status of BIM Practice in China’s AEC Industries 217
The major findings from this questionnaire are divided into six sections, namely survey 218
participants’ background and BIM experience, BIM adoption rates in their past projects, BIM 219
benefits, factors that affect BIM implementation, challenges encountered in BIM, and parties 220
that benefit financially from BIM. 221
Survey Participants’ Background 222
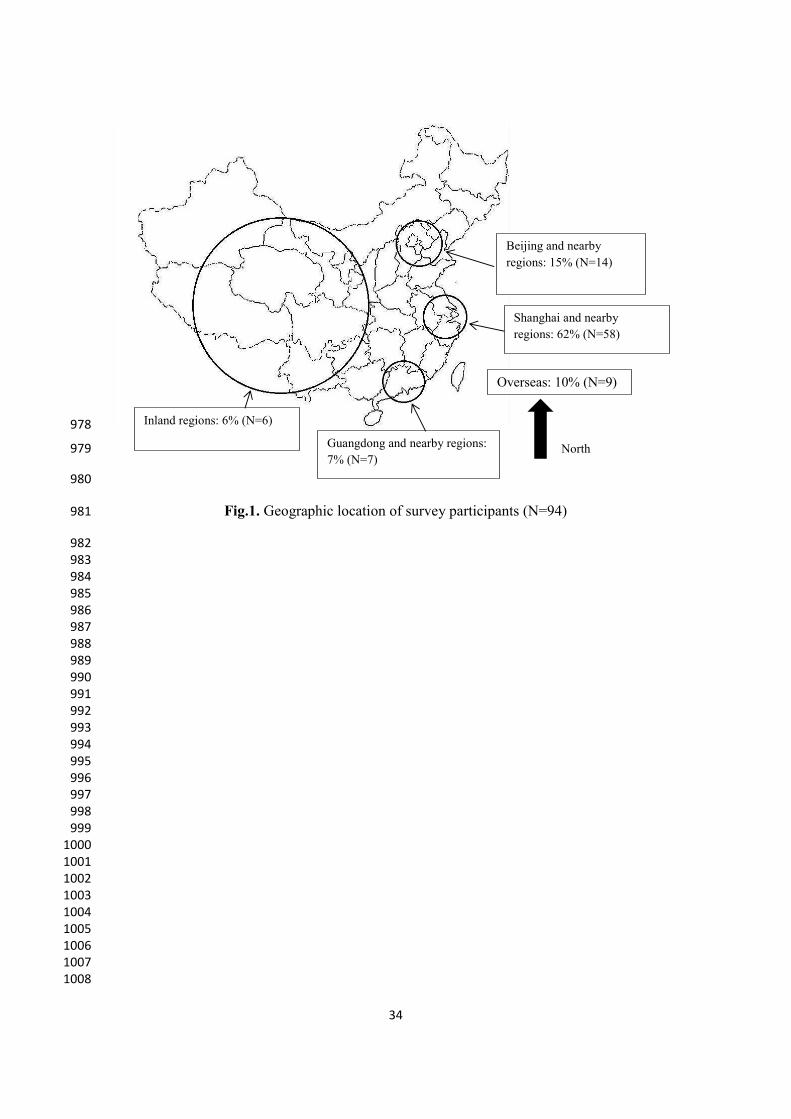
The working locations of survey participants are summarized in Fig.1. 223
Participants in this questionnaire survey came from five major regions as shown in Fig.2. 224
Bejing, Shanghai, and Canton are the major BIM-leading regions in the mainland of China 225
according to the earlier released BIM report (Jin et al., 2015). Participants from Shanghai and 226
its nearby regions contributed to the majority of this survey sample. A small portion of the 227
survey pool came from the inland of China and the remaining were Chinese BIM practitioners 228
working overseas. 229
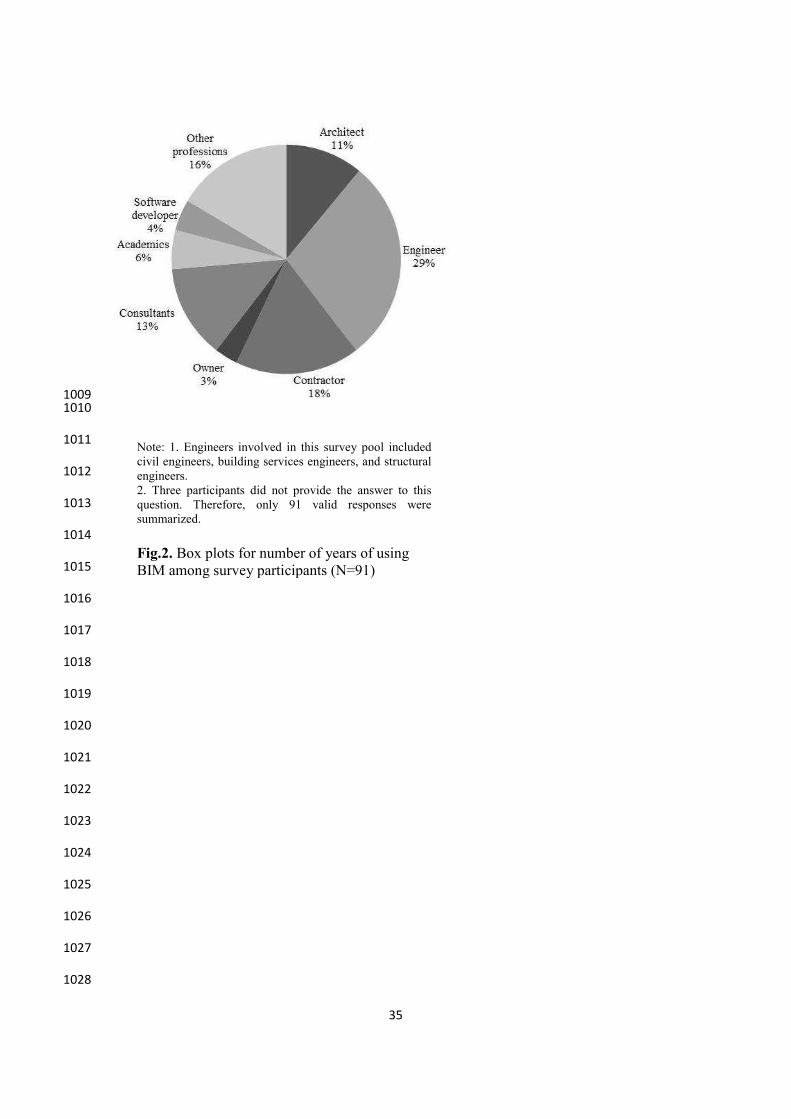
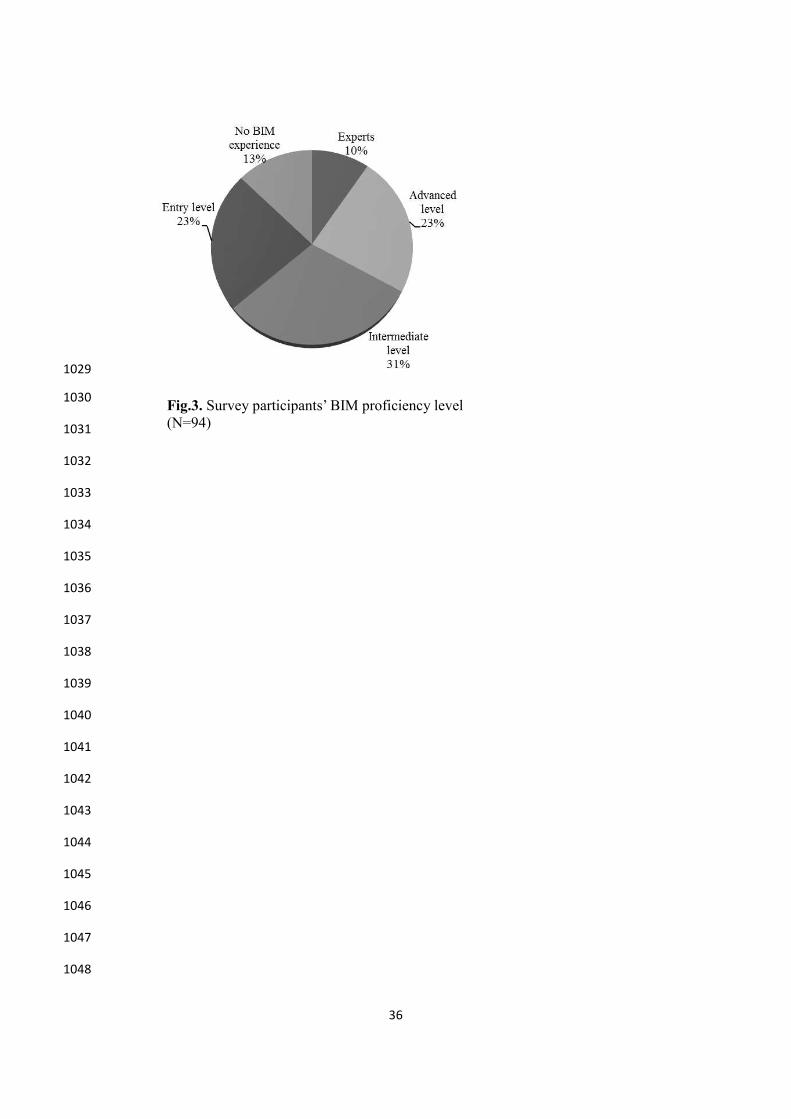
The background of survey participants were also categorized in Fig.2 and Fig. 3 according 230
to their professions and self-perceived BIM proficiency levels. 231
10
Other professions in this survey included material supplier, company administration directors, 232
etc. 233
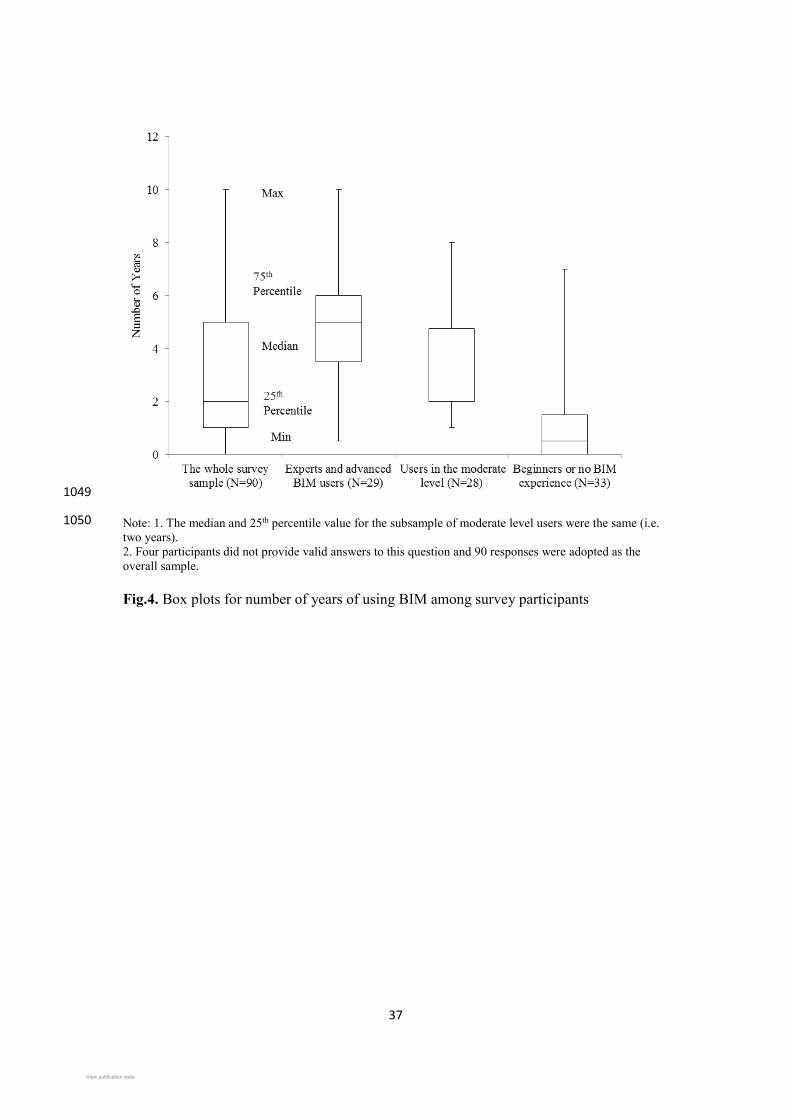
The self-perceived BIM proficiency level was measured by the years of BIM experience. 234
Box plots are provided in Fig. 4 displaying numbers of years of using BIM for the whole sample 235
and three subsamples. 236
The box plot for each sample in Fig.4 has maximum (i.e., max), 75th percentile, median, 237
25th percentile, and minimum (i.e., min) values. It is indicated from Fig.4 that the participants 238
in the overall sample has skewed distribution of years of BIM experience, with the majority 239
from 1 to 5 years. When divided into subsamples, it is indicated that the proficiency levels of 240
BIM usage are in a correlation with the number of years that participants have been adopting 241
BIM, with median values released from the three subsamples at 5 years, 2 years, and 0.5 year 242
respectively. The years-of-experience-based BIM proficiency level will be adopted as one 243
categorization criteria to divide the whole survey sample into subgroups in the following 244
sections. 245
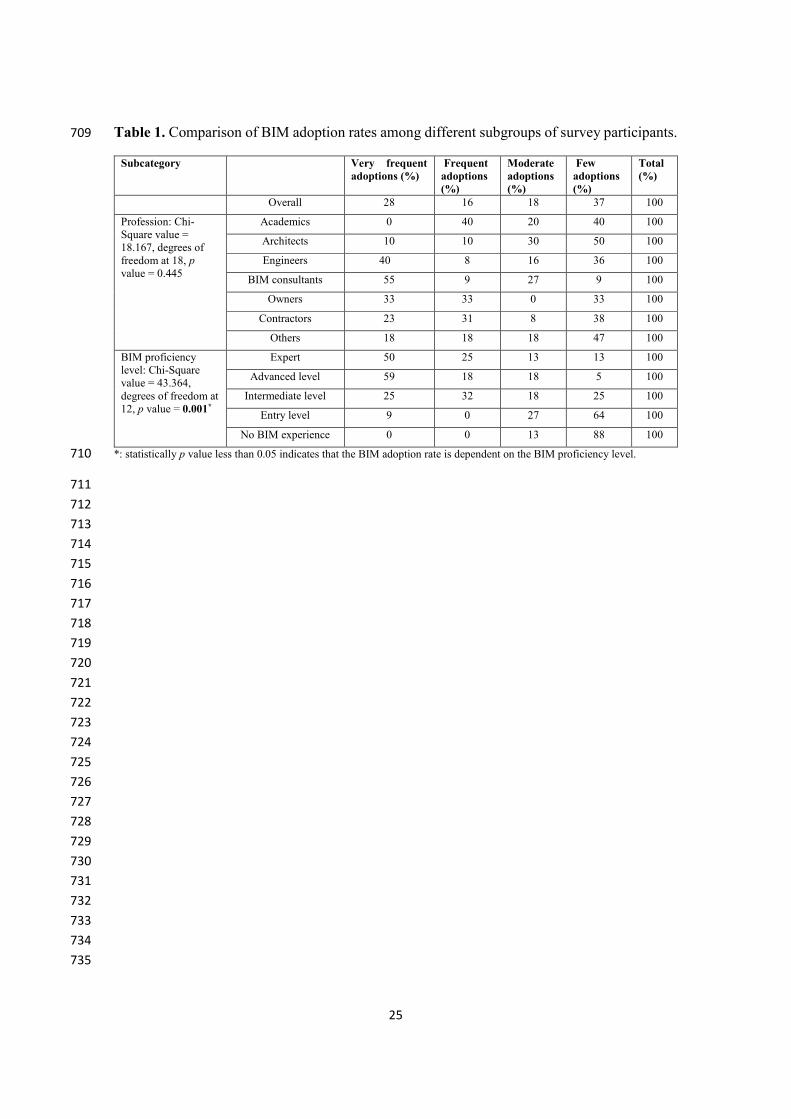
BIM Adoption Rate 246
Survey participants were asked the BIM adoption rate in their past projects in the multi-247
choice question. The adoption rate was categorized as: 1) very frequent adoptions defined as 248
having been using BIM in over 60% of their recent five years’ projects, 2) frequent adoptions 249
(i.e., using BIM between 30% to 60% of their projects), 3) moderate adoption (i.e., 15% to 30% 250
of their projects with BIM involved), and 4) few adoptions with BIM adopted in less than 15% 251
of their projects. In order to capture the information of whether BIM practice is independent of 252
professions or BIM proficiency levels, the adoption rates among subgroups are compared and 253
displayed in Table 1. 254
The calculated Chi-Square value of 18.167 and the corresponding p value of 0.445 indicate 255
that professions of survey participants listed in Table 1 do not affect the BIM adoption rate 256
11
among AEC professionals. In contrast, the p value of 0.001 would suggest that there are 257
significant differences in BIM adoption rates among subgroups at different BIM proficiency 258
levels. Generally experts or participants in the advanced level tended to have more frequent 259
BIM adoptions. 260
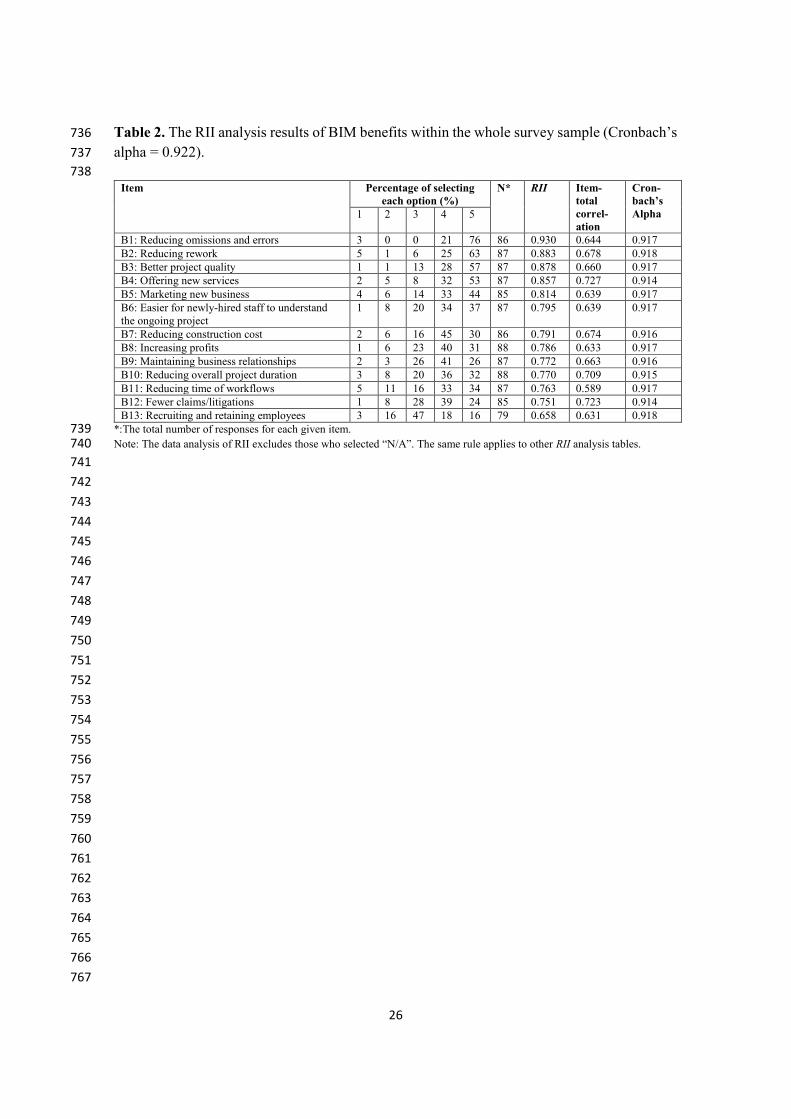
Benefits of Adopting BIM 261
Survey participants were asked to provide their options in the Likert-scale question (with 262
“1” being strongly disagree, “3” denoting neutral, and “5” representing strongly agree) 263
regarding the benefits from BIM. The option of “N/A” was also given for each item when the 264
participant did not have the knowledge to answer it. The overall answers from the survey pool 265
is presented in Table 2 following the RII score ranking of 13 BIM-benefit-related items from 266
B1 to B13. 267
Reductions in design errors and resulted construction rework were ranked highest in benefits 268
of using BIM as shown in Table 2, followed by better project quality. Table 2 reveals that cost 269
and time related items (i.e., B7, B8, B10, B11) were not ranked as high as reductions in errors 270
or rework. Generally all of the proposed benefits from BIM were perceived positively from 271
survey participants. The item B13 was perceived the lowest-ranked item with an average of 272
3.29 out of 5, with nearly half (47%) of respondents selecting the neutral score “3”. That would 273
reflect participants’ views that BIM did not necessarily benefit companies in hiring new 274
employees or keeping the existing staff. 275
The Cronbach’s alpha at 0.922 indicates that a participant that select one Likert scale score 276
in one BIM-benefit-related item is likely to provide a similar score to other items. To analyze 277
the contribution of each given item to the overall consistency of the whole 13 items, the given 278
item can be removed for the rerunning of the internal consistency analysis. The Cronbach’s 279
Alpha values listed in Table 2 show the changed value if the given item is removed. All values 280
slightly lower than the original 0.922 indicate that each of the 13 items would positively 281
12
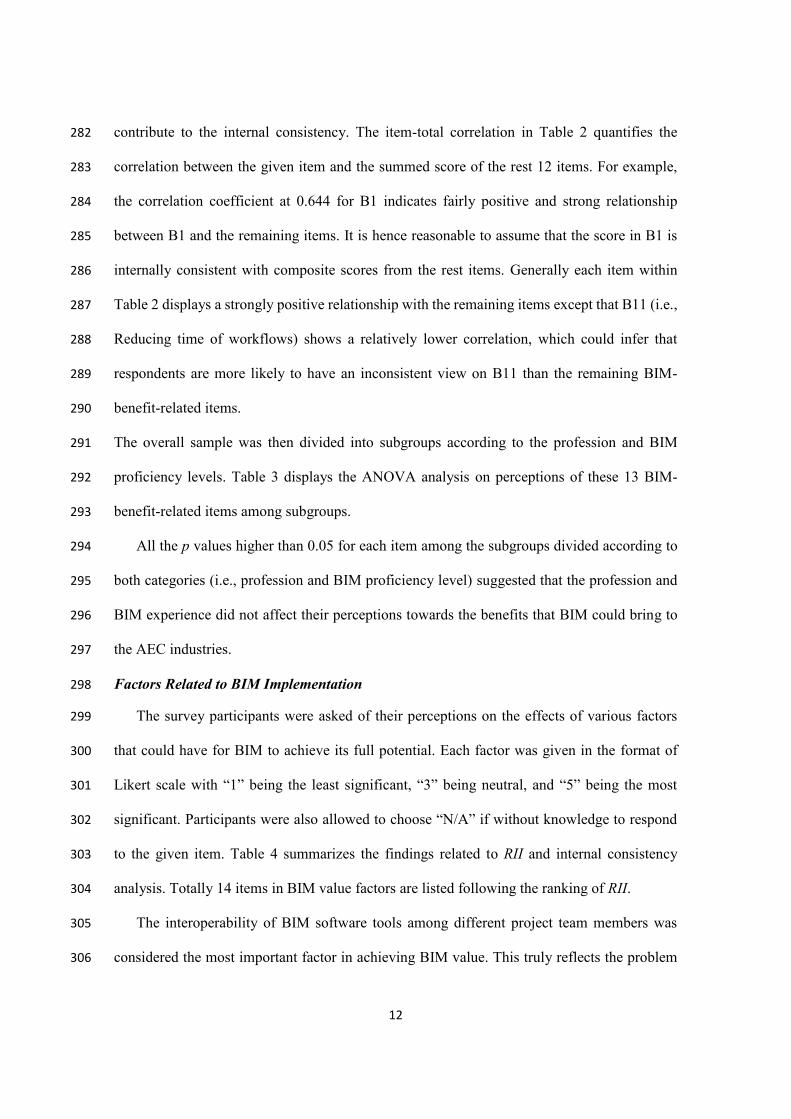
contribute to the internal consistency. The item-total correlation in Table 2 quantifies the 282
correlation between the given item and the summed score of the rest 12 items. For example, 283
the correlation coefficient at 0.644 for B1 indicates fairly positive and strong relationship 284
between B1 and the remaining items. It is hence reasonable to assume that the score in B1 is 285
internally consistent with composite scores from the rest items. Generally each item within 286
Table 2 displays a strongly positive relationship with the remaining items except that B11 (i.e., 287
Reducing time of workflows) shows a relatively lower correlation, which could infer that 288
respondents are more likely to have an inconsistent view on B11 than the remaining BIM-289
benefit-related items. 290
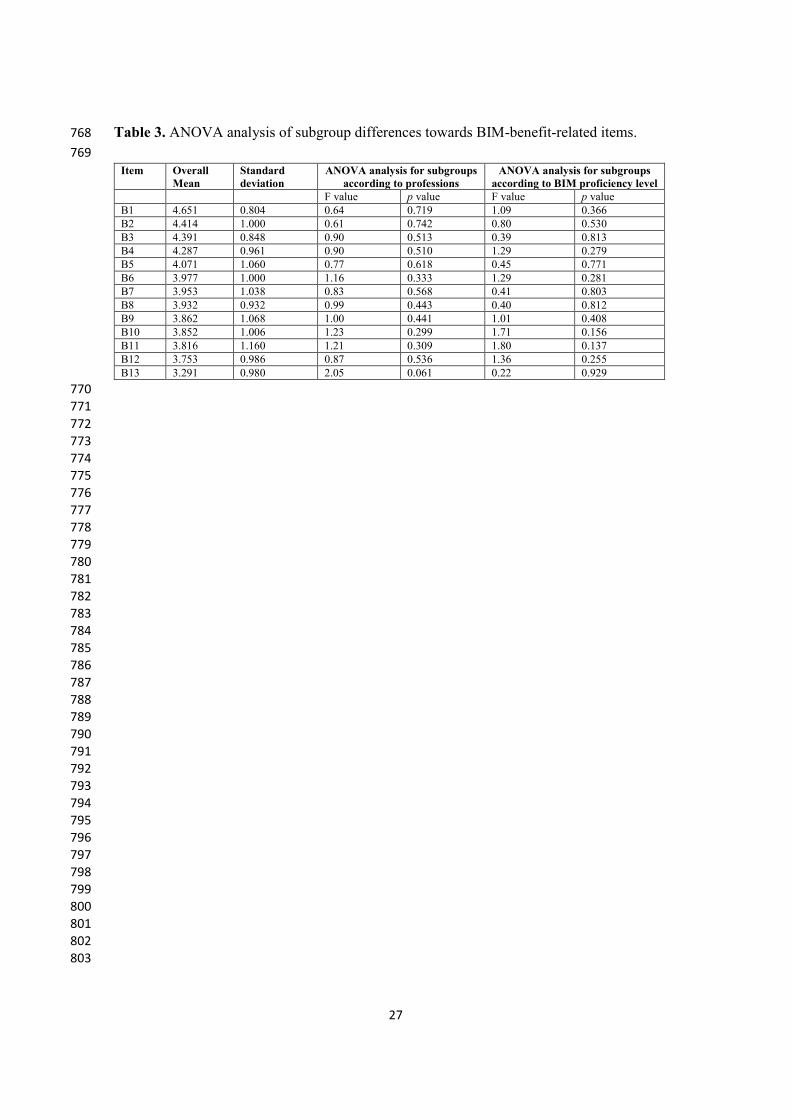
The overall sample was then divided into subgroups according to the profession and BIM 291
proficiency levels. Table 3 displays the ANOVA analysis on perceptions of these 13 BIM-292
benefit-related items among subgroups. 293
All the p values higher than 0.05 for each item among the subgroups divided according to 294
both categories (i.e., profession and BIM proficiency level) suggested that the profession and 295
BIM experience did not affect their perceptions towards the benefits that BIM could bring to 296
the AEC industries. 297
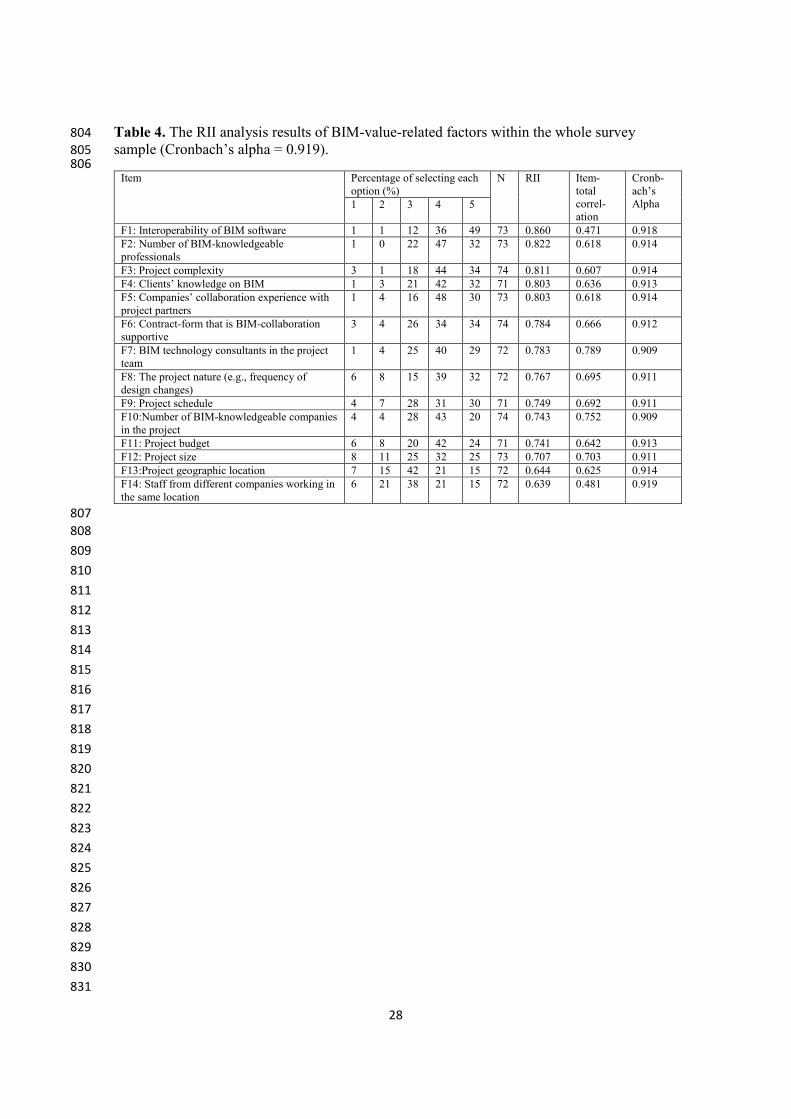
Factors Related to BIM Implementation 298
The survey participants were asked of their perceptions on the effects of various factors 299
that could have for BIM to achieve its full potential. Each factor was given in the format of 300
Likert scale with “1” being the least significant, “3” being neutral, and “5” being the most 301
significant. Participants were also allowed to choose “N/A” if without knowledge to respond 302
to the given item. Table 4 summarizes the findings related to RII and internal consistency 303
analysis. Totally 14 items in BIM value factors are listed following the ranking of RII. 304
The interoperability of BIM software tools among different project team members was 305
considered the most important factor in achieving BIM value. This truly reflects the problem 306
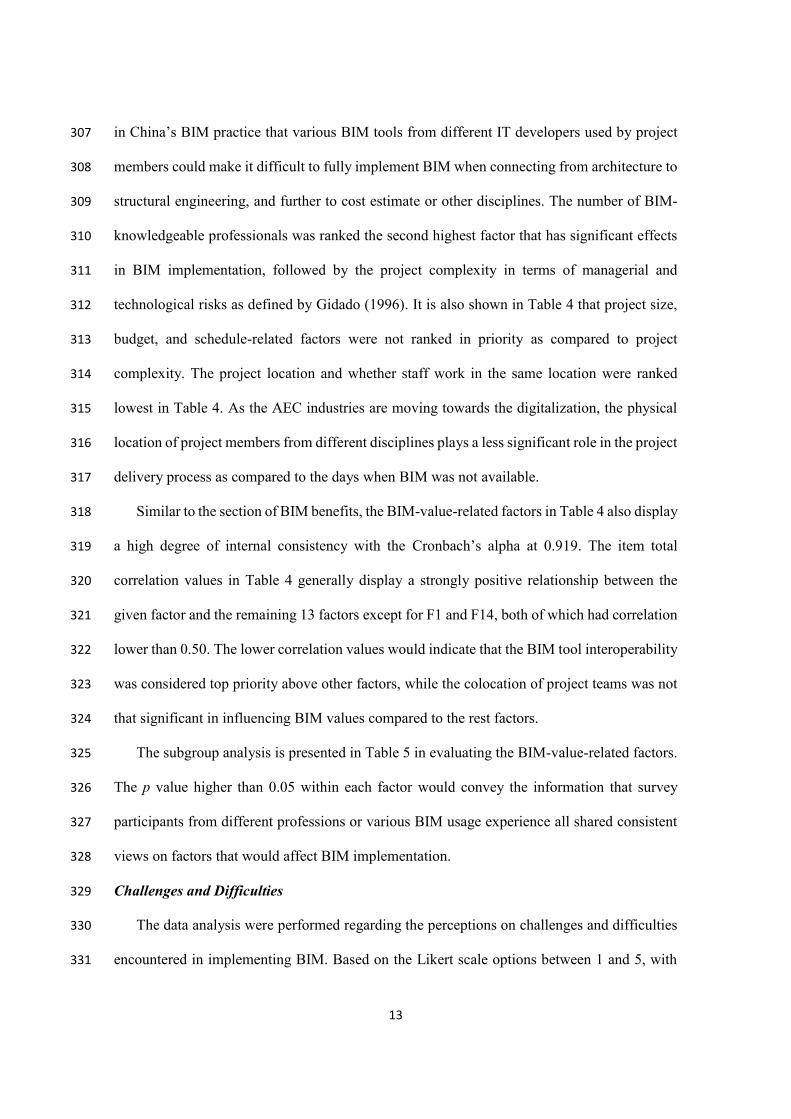
13
in China’s BIM practice that various BIM tools from different IT developers used by project 307
members could make it difficult to fully implement BIM when connecting from architecture to 308
structural engineering, and further to cost estimate or other disciplines. The number of BIM-309
knowledgeable professionals was ranked the second highest factor that has significant effects 310
in BIM implementation, followed by the project complexity in terms of managerial and 311
technological risks as defined by Gidado (1996). It is also shown in Table 4 that project size, 312
budget, and schedule-related factors were not ranked in priority as compared to project 313
complexity. The project location and whether staff work in the same location were ranked 314
lowest in Table 4. As the AEC industries are moving towards the digitalization, the physical 315
location of project members from different disciplines plays a less significant role in the project 316
delivery process as compared to the days when BIM was not available. 317
Similar to the section of BIM benefits, the BIM-value-related factors in Table 4 also display 318
a high degree of internal consistency with the Cronbach’s alpha at 0.919. The item total 319
correlation values in Table 4 generally display a strongly positive relationship between the 320
given factor and the remaining 13 factors except for F1 and F14, both of which had correlation 321
lower than 0.50. The lower correlation values would indicate that the BIM tool interoperability 322
was considered top priority above other factors, while the colocation of project teams was not 323
that significant in influencing BIM values compared to the rest factors. 324
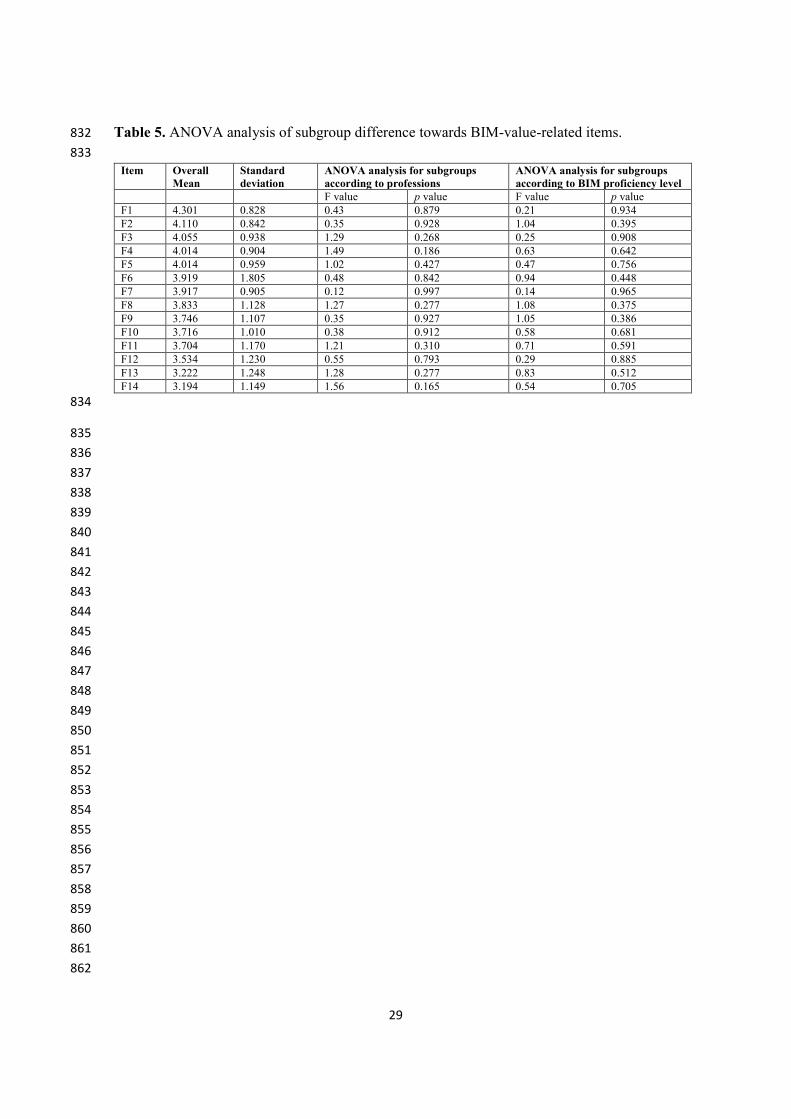
The subgroup analysis is presented in Table 5 in evaluating the BIM-value-related factors. 325
The p value higher than 0.05 within each factor would convey the information that survey 326
participants from different professions or various BIM usage experience all shared consistent 327
views on factors that would affect BIM implementation. 328
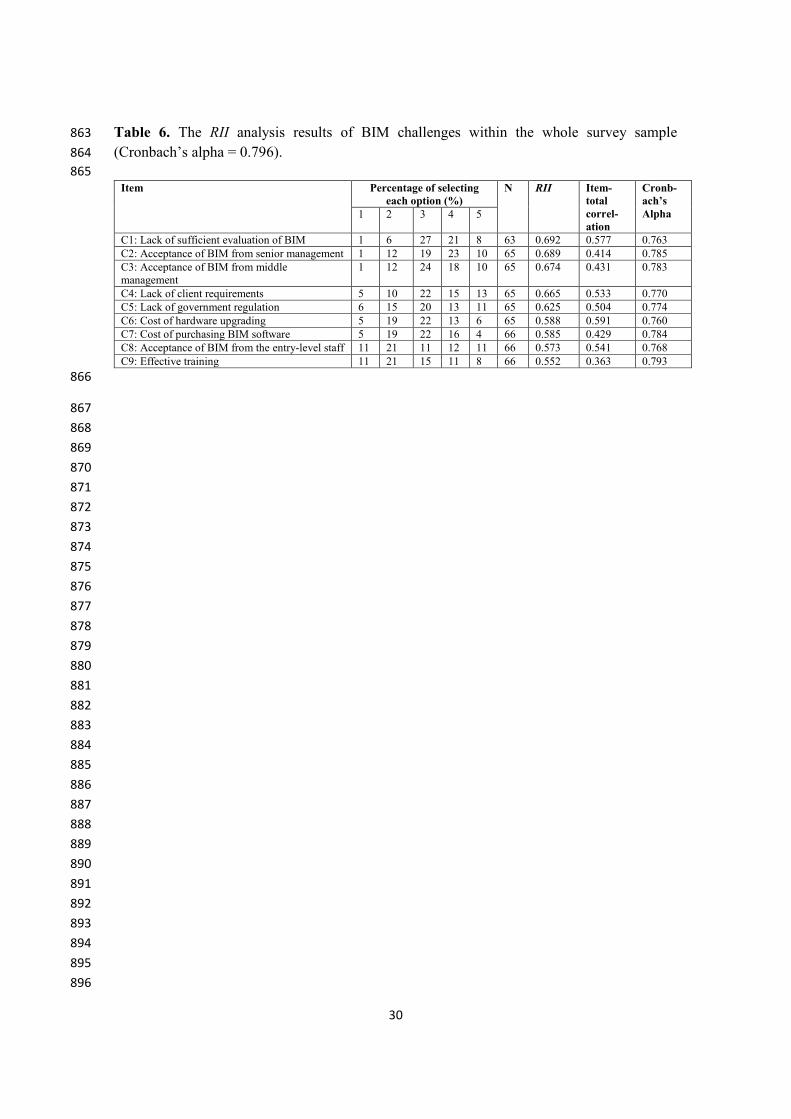
Challenges and Difficulties 329
The data analysis were performed regarding the perceptions on challenges and difficulties 330
encountered in implementing BIM. Based on the Likert scale options between 1 and 5, with 331
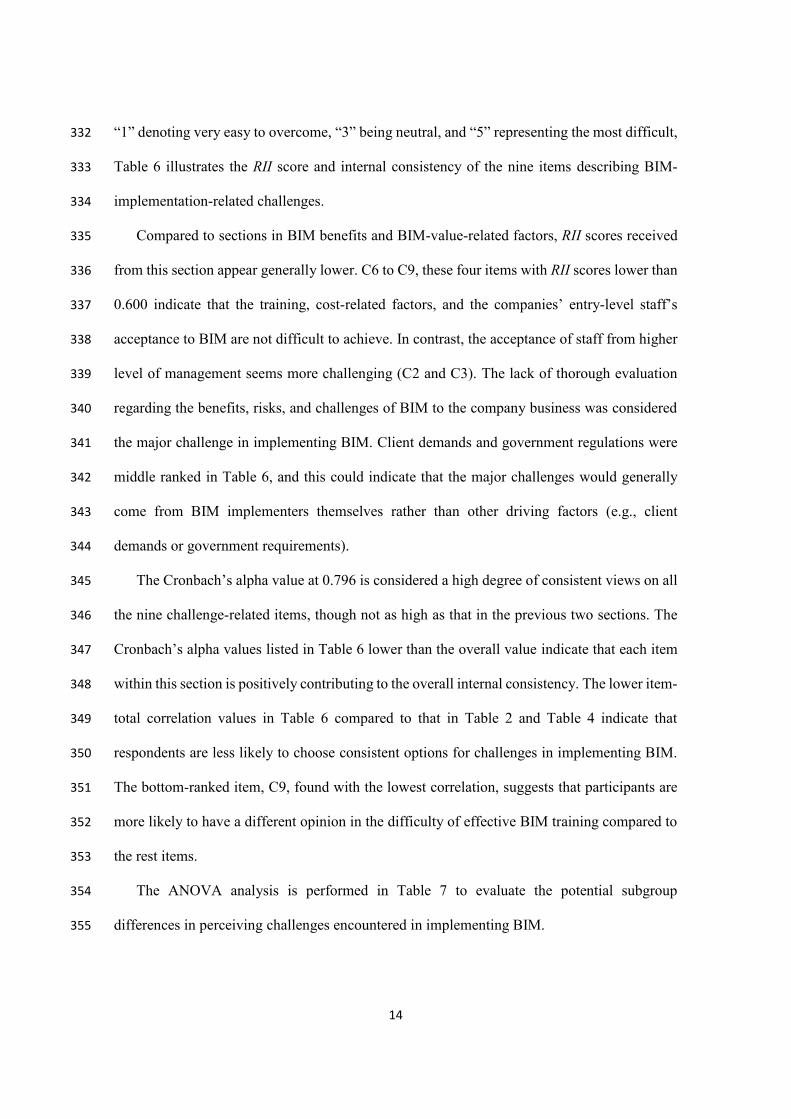
14
“1” denoting very easy to overcome, “3” being neutral, and “5” representing the most difficult, 332
Table 6 illustrates the RII score and internal consistency of the nine items describing BIM-333
implementation-related challenges. 334
Compared to sections in BIM benefits and BIM-value-related factors, RII scores received 335
from this section appear generally lower. C6 to C9, these four items with RII scores lower than 336
0.600 indicate that the training, cost-related factors, and the companies’ entry-level staff’s 337
acceptance to BIM are not difficult to achieve. In contrast, the acceptance of staff from higher 338
level of management seems more challenging (C2 and C3). The lack of thorough evaluation 339
regarding the benefits, risks, and challenges of BIM to the company business was considered 340
the major challenge in implementing BIM. Client demands and government regulations were 341
middle ranked in Table 6, and this could indicate that the major challenges would generally 342
come from BIM implementers themselves rather than other driving factors (e.g., client 343
demands or government requirements). 344
The Cronbach’s alpha value at 0.796 is considered a high degree of consistent views on all 345
the nine challenge-related items, though not as high as that in the previous two sections. The 346
Cronbach’s alpha values listed in Table 6 lower than the overall value indicate that each item 347
within this section is positively contributing to the overall internal consistency. The lower item-348
total correlation values in Table 6 compared to that in Table 2 and Table 4 indicate that 349
respondents are less likely to choose consistent options for challenges in implementing BIM. 350
The bottom-ranked item, C9, found with the lowest correlation, suggests that participants are 351
more likely to have a different opinion in the difficulty of effective BIM training compared to 352
the rest items. 353
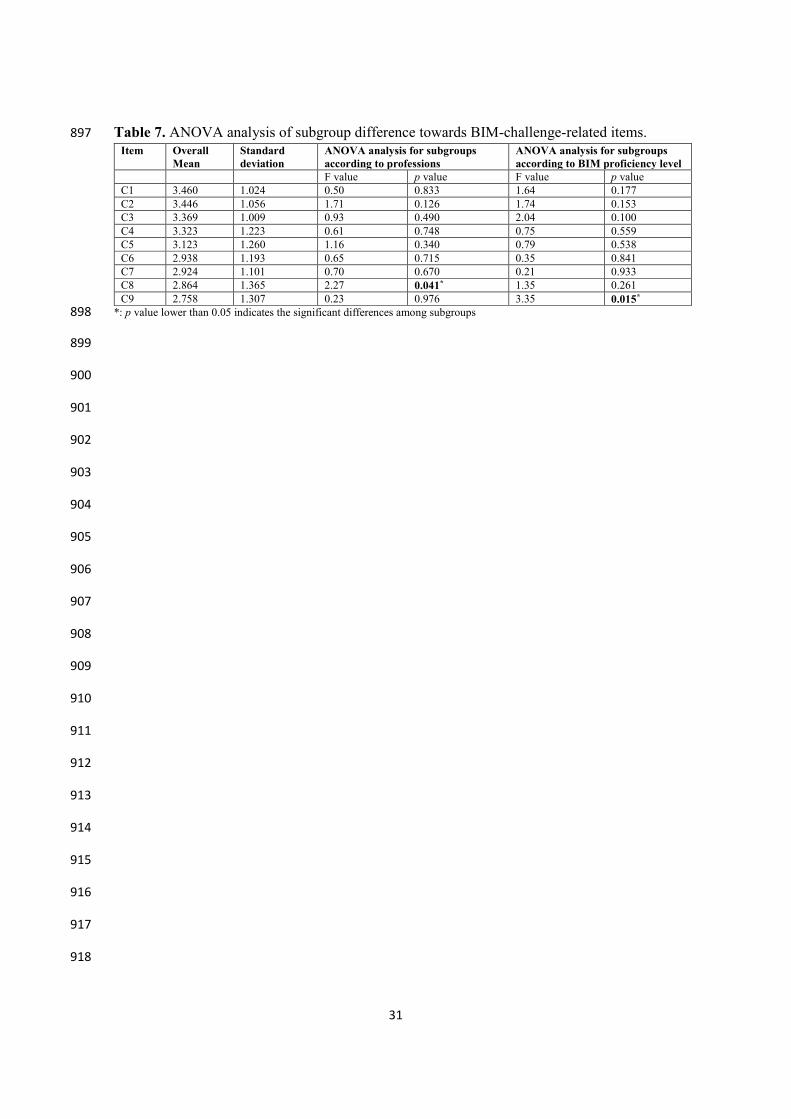
The ANOVA analysis is performed in Table 7 to evaluate the potential subgroup 354
differences in perceiving challenges encountered in implementing BIM. 355
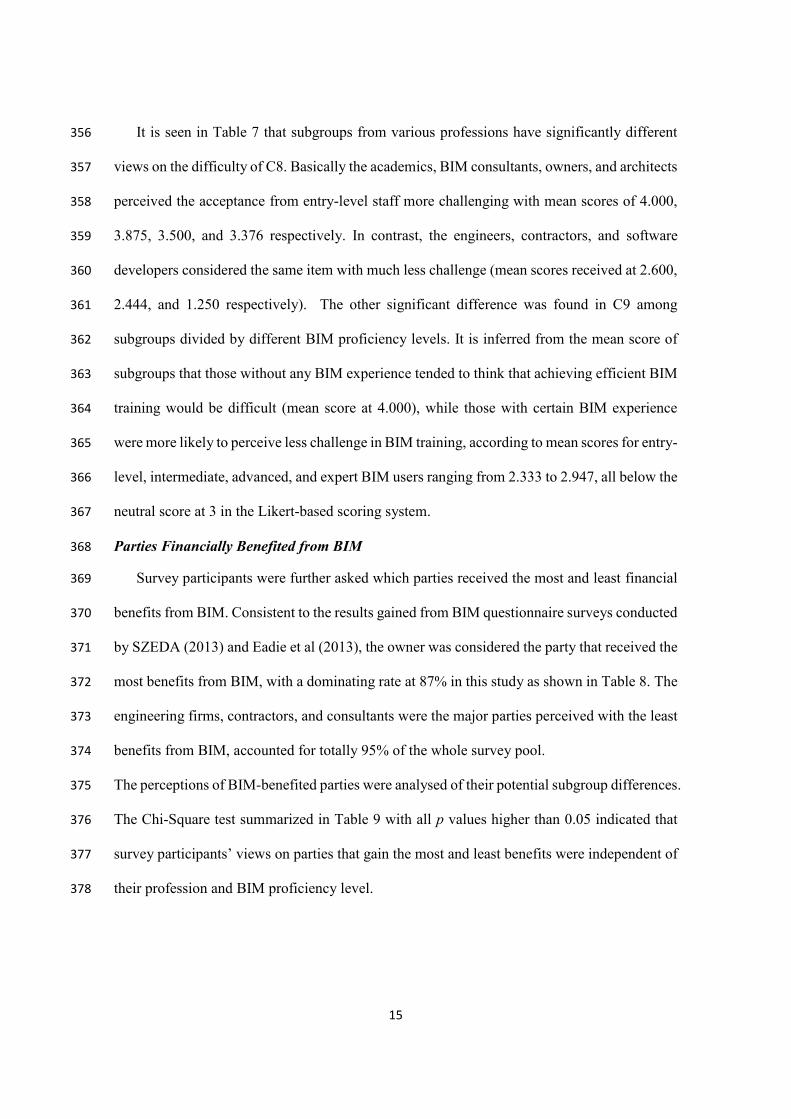
15
It is seen in Table 7 that subgroups from various professions have significantly different 356
views on the difficulty of C8. Basically the academics, BIM consultants, owners, and architects 357
perceived the acceptance from entry-level staff more challenging with mean scores of 4.000, 358
3.875, 3.500, and 3.376 respectively. In contrast, the engineers, contractors, and software 359
developers considered the same item with much less challenge (mean scores received at 2.600, 360
2.444, and 1.250 respectively). The other significant difference was found in C9 among 361
subgroups divided by different BIM proficiency levels. It is inferred from the mean score of 362
subgroups that those without any BIM experience tended to think that achieving efficient BIM 363
training would be difficult (mean score at 4.000), while those with certain BIM experience 364
were more likely to perceive less challenge in BIM training, according to mean scores for entry-365
level, intermediate, advanced, and expert BIM users ranging from 2.333 to 2.947, all below the 366
neutral score at 3 in the Likert-based scoring system. 367
Parties Financially Benefited from BIM 368
Survey participants were further asked which parties received the most and least financial 369
benefits from BIM. Consistent to the results gained from BIM questionnaire surveys conducted 370
by SZEDA (2013) and Eadie et al (2013), the owner was considered the party that received the 371
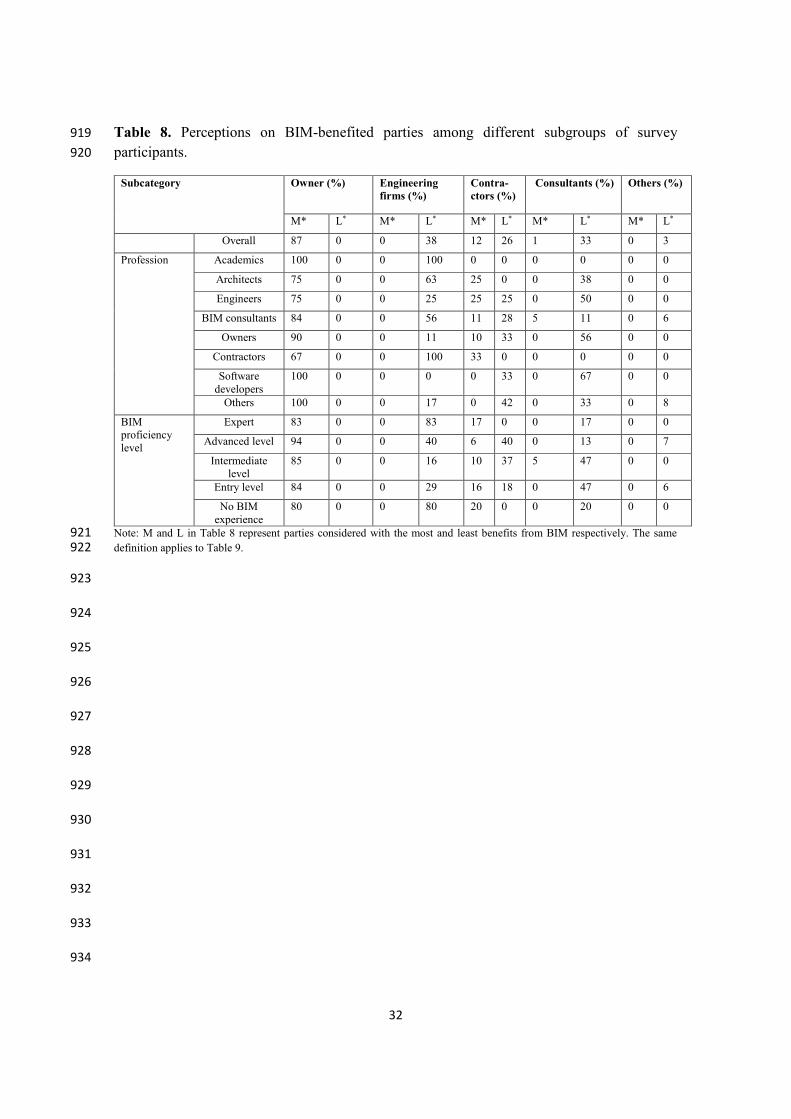
most benefits from BIM, with a dominating rate at 87% in this study as shown in Table 8. The 372
engineering firms, contractors, and consultants were the major parties perceived with the least 373
benefits from BIM, accounted for totally 95% of the whole survey pool. 374
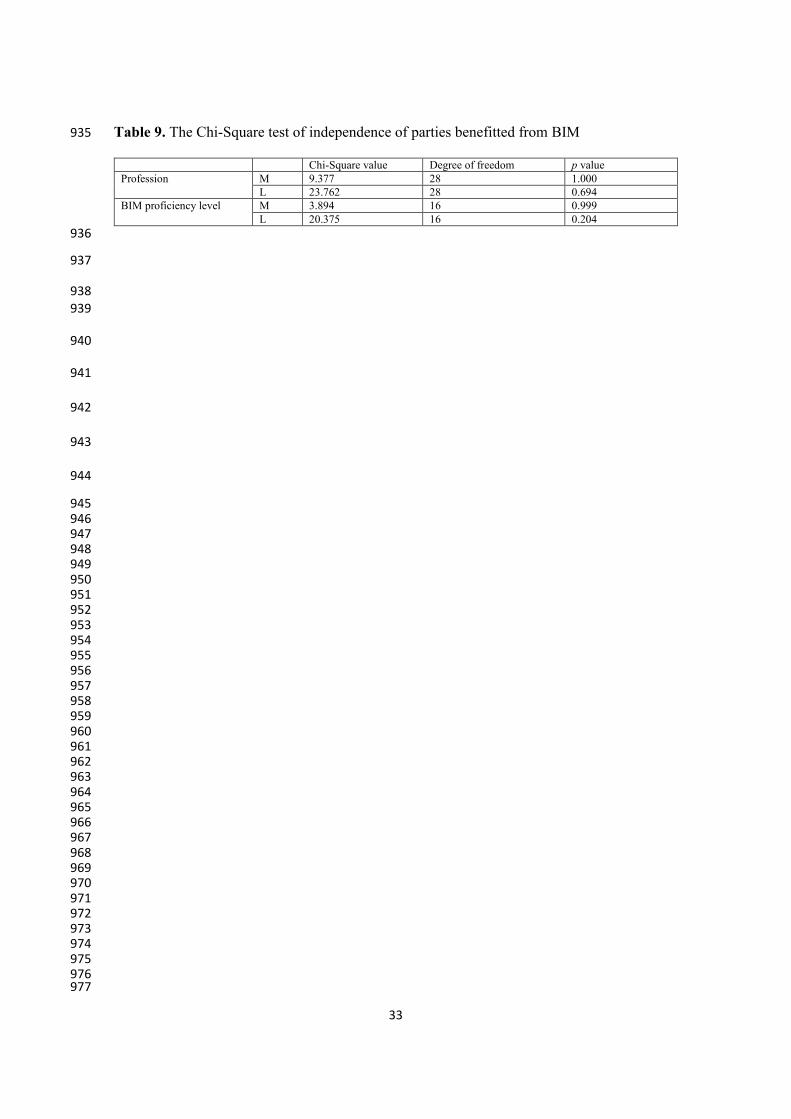
The perceptions of BIM-benefited parties were analysed of their potential subgroup differences. 375
The Chi-Square test summarized in Table 9 with all p values higher than 0.05 indicated that 376
survey participants’ views on parties that gain the most and least benefits were independent of 377
their profession and BIM proficiency level. 378
16
As suggested from the Chi-Square test of independence performed in Table 9, the owner is 379
consistently perceived the party benefited most from BIM among all subgroups. It would be 380
hence worthwhile for the owner to consider more BIM applications in their invested projects. 381
Summary of the Results 382
The findings from this questionnaire-based survey to AEC professionals can be 383
summarized as follows: 384
‚ Participants’ BIM experience level was highly correlated to their years of using BIM, and 385
BIM adoption rate in their previous projects. 386
‚ Reducing design errors and construction rework were deemed the major contributions of 387
adopting BIM. In order to achieve the value that BIM could bring to the industry, the 388
interoperability among different BIM tools was considered the key impact factor. 389
‚ The RII scores received in the challenge-related items were generally lower compared to 390
two other Likert-scale-based sections. It was also shown from the RII scores lower than 391
0.60 that costs spent in BIM-related hardware and software were not major difficulties. 392
Instead, participants considered the major challenge coming from the thorough evaluation 393
of BIM value within the AEC companies, and the acceptance of BIM from the higher 394
management level. 395
‚ The subgroup analysis within the survey sample indicated that the profession and 396
experience level did not affect respondents’ generally positive perceptions on BIM benefits. 397
‚ Merely two items within the section of BIM challenge were found with significant 398
subgroup differences: one being that academics, BIM consultants, owners, and architects 399
considered more the acceptance of BIM from entry-level staff a challenge than engineers, 400
contractors, and software developers; the other being that effective BIM training was not 401
perceived a challenge by most participants except those without any BIM experience. 402
403
17
Conclusion 404
This empirical study collected the data on BIM practitioners’ experience, their perceptions 405
on BIM benefits, factors relevant to achieve BIM values, challenges in BIM implementation, 406
and opinions on BIM-benefited parties. The background information of survey participants was 407
provided including their working locations, professions, and BIM usage experience. The high 408
Cronbach’s alpha value over 0.750 obtained from Likert-scale-based questions indicated that 409
survey participants had generally consistent views over the items within each perception-410
related section and every item within each section positively contributed to the overall 411
consistency. It was a positive signal that perceptions towards BIM-introduced benefits would 412
not be significantly changed as the practitioner gains more BIM experience. Similarly 413
consistent perceptions were found on BIM-value-related factors, challenges encountered in 414
practicing BIM, and parties benefitted from BIM. Some further information generated from 415
this study can be highlighted as below: 416
‚ Encountering the compatibility issues was not uncommon when multiple BIM tools are 417
being used in a single project. Usually no specific BIM software would be required in the 418
project contract. How BIM tools used by different project teams could be interoperable 419
would remain a technical issue to be further discussed. 420
‚ Generally the acceptance of BIM was deemed more difficult to achieve from the senior 421
management level than the lower levels. Consistent to other previous studies conducting 422
BIM-related questionnaire survey, the owner was identified as the party that received the 423
most benefits by adopting BIM. 424
‚ Gaining more BIM experience would change practitioners’ perceptions on training-related 425
difficulties from “it is a challenge” to “it is not really a challenge.” 426
The generally positive and consistent views of participants on BIM benefits could provide 427
the clue that BIM would be increasingly applied in China’s AEC industries following 428
18
government strategies in the coming years. The consistent perceptions towards BIM 429
implementation among respondents from different professions and BIM experience levels 430
would also serve as a positive signal that joint-effort among multiple project teams using BIM 431
as the platform is highly achievable. According to the perception of AEC practitioners, this 432
empirical study provides the picture of BIM implementation in developing countries where 433
BIM is gaining a growing practice. Based on the data analysis generated from this questionnaire 434
survey, future research would target on recruiting case studies of BIM-involved projects to 435
provide quantitative analysis of how BIM could achieve these benefits listed in this 436
questionnaire, with a comprehensive evaluation of BIM values. 437
438
Acknowledgement 439
The work presented herein was undertaken under the aegis of BIM-GIS Application in 440
Green Built Environment Project, funded primarily by Ningbo Science and Technology Bureau 441
(Grant No. 2015B11011) through the Innovation Team at the University of Nottingham Ningbo 442
China. 443
444
References 445
446
Ahn, A.H., Kwak, Y.H., and Suk, S.J. (2015). “Contractors’ transformation strategies for 447
adopting building information modelling.” J. Manage. Eng., 32(1), DOI: 10.1061/ 448
(ASCE)ME.1943-5479.0000390. 449
450
Aksorn, T., and Hadikusumo, B. H. W. (2008). “Critical success factors influencing safety 451
program performance in Thai construction projects.” Safety Sci., 46 (4), 709-727. 452
453
Azhar, S. (2011). “Building information modelling (BIM): trends, benefits, risks and 454
challenges for the AEC industry.” Leadersh. Manag. Eng., 11 (3), 241–252. 455
456
Azhar, S., Khalfan, M., and Maqsood, T. (2012). “Building information modelling (BIM): 457
now and beyond, Australas.” J. Constr. Econ. Build., 12 (4), 15–28. 458
459
Bazjanac, V. (2006). “Virtual building environments (VBE) — applying information 460
modelling to buildings.” in: A. Dikbas, R. Scherer (Eds.), e-Work and e-Business in 461
Architecture Engineering and Construction, Taylor and Francis, London, UK. 462
19
463
Becerik-Gerber, B., and Rice, S. (2010). “The perceived value of building information 464
modeling in the U.S. building industry.” J. Inf. Technol. Constr., (ITcon) 15, 185–201. 465
466
Bender, D. (2010). “Implementing building information modeling in the top 100 architecture 467
firms.” J. Build. Inf. Model., 23–24. 468
469
Birkeland, J. (2009). “Eco-retrofitting with building integrated living systems.” Proceedings 470
of the 3rd CIB International Conference on Smart and Sustainable Built Environment: 471
SASBE09, Delft University of Technology, pp. 1–9. 472
473
Bland, J. and Altman, D. (1997). “Statistics notes: Cronbach's alpha.” BMJ. doi: 474
http://dx.doi.org/10.1136/bmj.314.7080.572 475
476
Both, P., Koch, V., and Kindsvater, A. (2012). “Potentials and barriers for implementing BIM 477
in the German AEC market.” 478
479
Breetzke, K., and Hawkins, M. “Project extranets and e-procurement: user perspectives.” 480
RICS, London, UK. 481
482
Cao, D., Li, H., Wang, G., and Huang, T. (2016). “Identifying and contextualising the 483
motivations for BIM implementation in construction projects: an empirical study in China.” 484
Int. J. Proj. Manage., in Press, http://dx.doi.org/10.1016/j.ijproman.2016.02.002 485
486
Carifio, L., and Perla, R. (2008). “Resolving the 50 year debate around using and misusing 487
Likert scales.” Med. Educ., 42(12), 1150-1152. 488
489
Cheung, F., Rihan, J., Tah, J., Duce, D., and Kurul, E. (2012). “Early stage multi-level cost 490
estimation for schematic BIM models.” Autom. Constr., 27, 67–77. 491
492
China Construction Industry Association (CCIA, 2013). “Research of BIM application in 493
construction firms (1).” Beijing: China Architecture & Building Press, (in Chinese). 494
495
Cronbach, L. J. (1951). “Coefficient alpha and the internal structure of tests.” 496
Psychometrika,16 (3), 297-334. 497
498
Crotty, R. (2012). “The impact of building information modelling transforming construction.” 499
1st ed. Taylor and Francis, London, UK. 500
501
Davies, R., and Harty, C. (2013). “Measurement and exploration of individual beliefs about 502
the consequences of building information modelling use.” Constr. Manag. Econ., 31 (11), 503
1110-1127. 504
505
Dawood, N., and Iqbal, N. (2010). “Building information modelling (BIM): a visual & whole 506
life cycle approach.” CONVR2010, Sendai, Japan, November 4–5, 2010, in: K. Makanae, N. 507
Yabuki, K. Kashiyama (Eds.), Proceedings of the 10th International Conference on 508
Construction Applications of Virtual Reality, CONVR2010 Organizing Committee, pp. 7–14. 509
510
20
Denzer, A., and Hedges, K. (2008). “From CAD to BIM: educational strategies for the 511
coming paradigm shift.” AEI, available on-line at 512
http://ascelibrary.org/doi/abs/10.1061/41002(328)6 (accessed February 2016). 513
514
DeVellis, R. F. (2003). “Scale development: theory and applications.” 2nd Ed., SAGE 515
Publications, Inc., Thousand Oaks, CA. 516
517
Dijksterhuis, A., and Bargh, J. A. (2001). “The perception-behavior expressway: Automatic 518
effects of social perception on social behavior.” Adv. Exp. Soc. Psychol., 33, 1-40. 519
520
Eadie, R., Browne, M, Odeyinka, H., McKeown, C., and McNiff, S. (2013). “BIM 521
implementation throughout the UK construction project lifecycle: An analysis.” Autom. 522
Constr., 36, 145–151. 523
524
Eastman, C., Teicholz, P., Sacks, R., and Liston, K. (2011). “BIM handbook, a guide to 525
building information modeling for owners, managers, designers, engineers, and contractors.” 526
John Wiley & Sons, Inc., Hoboken, New Jersey, pp.1. 527
528
Francom, T.C., and El Asmar, M. (2015). “Project quality and change performance 529
differences associated with the use of building information modeling in design and 530
construction projects. univariate and multivariate analyses.” J. Constr. Eng. Manag., 141 (9), 531
04015028. 532
533
Furneaux, C., Kivvits, R. (2008). “BIM - Implications for government.” CRC for 534
construction innovation, Brisbane, available on-line at http://eprints.qut.edu.au/26997/ 535
(accessed February 2016). 536
537
Gigado, K.I. (1996). “Project complexity: the focal point of construction production 538
planning.” Constr. Manage. Econ., 14, 213-225 539
540
Giel, B., Issa, R.R.A., and Olbina, S. (2010). “Return on investment analysis of building 541
information modelling in construction.” Nottingham University Press, Nottingham. 542
543
He, Q., Qian, L., Duan, Y., and Li, Y. (2012). “Current situation and barriers of BIM 544
implementation.” J. Eng. Manag., 26 (1), 12-16 (in Chinese). 545
546
Jäväjä, S.S.P., and Salin, J. (2014). “BIM education: implementing and reviewing "OpeBIM" 547
- BIM for teachers.” Computing in Civil and Building Engineering, ASCE, pp. 2151-2158. 548
549
Jin, R., Tang, L., and Fang, K. (2015). “Investigation of the current stage of BIM application 550
in China’s AEC industries.” WIT Transactions on The Built Environment, 149, 493-503. 551
552
Johnson, R.A. (2005). “Miller & Freund’s probability and statistics for engineers.” 7th ed. 553
Pearson Prentice Hall, Upper Saddle River, NJ, pp.309-311. 554
555
Juszczyk, M., Výskala, M., and Zima, K. (2015). “Prospects for the use of BIM in Poland and 556
the Czech Republic –Preliminary research results.” Creative Construction Conference 2015, 557
Procedia Eng. 123, 250 – 259. 558
559
21
Kashiwagi, D., Kashiwagi, J., Kashiwagi, A., and Sullivan, K. (2012). “Best value solution 560
designed in a developing country.” J. Adv. Perform. Inf. Value., 4 (2), 223–239. 561
562
Khanzode, A., Fischer, M., and Reed, D. (2008). “Benefits and lessons learned of 563
implementing building virtual design and construction (VDC) technologies for coordination 564
of mechanical, electrical, and plumbing (MEP) systems on a large healthcare project. J. Inf. 565
Technol. Constr., (ITcon) 13, 324–342(Special Issue Case studies of BIM use). 566
567
Kometa, S.T., Olomolaiye, P.O., and Harris, F.C. (1994). “Attribute of UK construction 568
clients influencing project consultants’ performance.” Constr. Manag. Econ., 12 (5), 433-569
443. 570
571
Ku, K., and Taiebat, M. (2011). “BIM experiences and expectations: the constructors' 572
perspective.” Int. J. Constr. Educ. Res., 7 (3), 175–197. 573
574
Lu, Y., Li, Y., Skibniewski, M., Wu, Z., Wang, R., and Le, Y. (2014). “Information and 575
communication technology applications in architecture, engineering, and construction 576
organizations: a 15-year review.” J. Manage. Eng., 31(1), DOI: 10.1061/(ASCE)ME.1943-577
5479.0000319. 578
579
MarketLine Industry Profile (2014). “Construction in China, Reference Code: 0099-2801.” 580
pp. 10. 581
582
Masood, R., Kharal, M.K.N., and Nasir, A.R. (2013). “Is BIM adoption advantageous for 583
construction industry of Pakistan?” Fourth International Symposium on Infrastructure 584
Engineering in Developing Countries, IEDC 2013, Procedia Eng. 77, 229 – 238. 585
586
McGraw-Hill Construction (2014). “The business value of BIM for construction in major 587
global markets.” SmartMarket Report, Research & Analytics, Bedford, MA, pp.10. 588
589
Meliá, J. L., Mearns, K., Silva, S. A., and Lima, M. L. (2008). “Safety climate responses and 590
the perceived risk of accidents in the construction industry.” Safety Sci., 46 (6), 949-958. 591
592
Migilinskas, D., Popov, V., Juocevicius, V., and Ustinovichius, L. (2013). “The benefits, 593
obstacles and problems of practical BIM implementation.” Procedia Eng., 57, 767–774. 594
595
Norman, G. (2010). “Likert scales, levels of measurement and the ‘laws’ of statistics.” Adv. 596
Health Sci. Edu., 15(5), 625-632. 597
598
Nunnally,J. and Bernstein, L. (1994). “Psychometric theory.” McGraw-Hill, Inc., New York. 599
600
Oluwole, A. (2011). “A preliminary review on the legal implications of BIM and model 601
ownership.” J. Inf. Technol. Constr., (ITcon) 16, 687–696, available online at 602
http://www.itcon.org/2011/40 (accessed February 2016). 603
604
Pearson, E. S. (1931). “The analysis of variance in the case of non-normal variation.” 605
Biometrika, 23, 114–133. 606
607
Race, S. (2012). “BIM Demystified.” 1st ed. RIBA Publishing, UK, London. 608
609
22
Sackey, E., Tuuli, M., Dainty, A. (2014). “Sociotechnical systems approach to bim 610
implementation in a multidisciplinary construction context.” J. Manage. Eng., 31(1), DOI: 611
10.1061/(ASCE)ME.1943-5479.0000303. 612
613
Sebastian, R. “Breaking through business and legal barriers of open collaborative processes 614
based on building information modelling (BIM).” Proceedings of W113 — Special Track, 615
18th CIB World Building Congress, Salford, United Kingdom, available on-line at 616
http://www.lawlectures.co.uk/w113/documents/wbc2010-proceedings.pdf#page=172 617
(accessed February 2016). 618
619
Shanghai Construction Trade Association (SCTA) & Luban Consulting, The annual 2014 620
investigation report of the current BIM application in construction firms, available on-line at 621
http://www.lubanway.com/index.php?controller=guandian&action=guandian_front&type=3622
&guandian_id=439 (in Chinese) (accessed February 2016). 623
624
Shenzhen Exploration & Design Association (SZEDA, 2013). “Guide for BIM application 625
and development in the engineering & design industry of Shenzhen.” Tianjin Science & 626
Technology Press, Tianjin, pp. 15-44 (in Chinese). 627
628
Smith, D. K., and Tardif, M. (2009). “Building information modeling: a strategic 629
implementation guide for architects, engineers, constructors, and real estate asset managers.” 630
John Wiley & Sons, pp. 216. 631
632
Tam, C. M., Deng, Z. M., Zeng, S. X., and Ho, C. S. (2000). “Quest for continuous quality 633
improvement for public housing construction in Hong Kong.” Constr. Manage. Econ., 18 (4), 634
437-446. 635
636
Tam, V.W.Y. (2009). “Comparing the implementation of concrete recycling in the Australian 637
and Japanese construction industries.” Constr. Manage. Econ., 17(7), 688-702. 638
639
Tang, L., Jin, R., and Fang, K. (2015). “Launching the innovative BIM module for the 640
architecture and built environment programme in China.” BIM 2015 First International 641
Conference on Building Information Modelling (BIM) in Design, Construction and 642
Operations, WIT Transactions on The Built Environment. 149, 145-156. 643
644
Tavakol, M. and Dennick, R. (2011). “Making sense of Cronbach’s alpha.” Int. J. Med. Edu., 645
2, 53-55. 646
647
Trine, R. (2008). “Engineering education: quality and competitiveness from the European 648
perspective.” TREE-disclosing conference – a report, TREE –teaching and research in 649
engineering in Europe. 650
651
Yan, H., and Damian, P. (2008). “Benefits and barriers of building information modelling.” 652
653
654
655
656
23
Table List 657
Table 1. Comparison of BIM adoption rates among different subgroups of survey participants. 658
Table 2. The RII analysis results of BIM benefits within the whole survey sample (Cronbach’s 659
alpha = 0.922). 660
Table 3. ANOVA analysis of subgroup differences towards BIM-benefit-related items. 661
Table 4. The RII analysis results of BIM-value-related factors within the whole survey 662
sample (Cronbach’s alpha = 0.919). 663
Table 5. ANOVA analysis of subgroup difference towards BIM-value-related items. 664
Table 6. The RII analysis results of BIM challenges within the whole survey sample 665
(Cronbach’s alpha = 0.796). 666
Table 7. ANOVA analysis of subgroup difference towards BIM-challenge-related items. 667
Table 8. Perceptions on BIM-benefited parties among different subgroups of survey 668
participants. 669
Table 9. The Chi-Square test of independence of parties benefitted from BIM. 670
671
672
673
674
675
676
677
678
679
680
681
24
Figure List 682
Fig.1. Geographic location of survey participants (N=94) 683
Fig.2. Professions of participants in this survey (N=91) 684
Fig.3. Survey participants’ BIM proficiency level (N=94) 685
Fig.4. Box plots for number of years of using BIM among survey participants 686
687
688
689
690
691
692
693
694
695
696
697
698
699
700
701
702
703
704
705
706
707
708
25
Table 1. Comparison of BIM adoption rates among different subgroups of survey participants. 709
Subcategory
Very frequent
adoptions (%)
Frequent
adoptions
(%)
Moderate
adoptions
(%)
Few
adoptions
(%)
Total
(%)
Overall 28 16 18 37 100
Profession: Chi-
Square value =
18.167, degrees of
freedom at 18, p
value = 0.445
Academics 0 40 20 40 100
Architects 10 10 30 50 100
Engineers 40 8 16 36 100
BIM consultants 55 9 27 9 100
Owners 33 33 0 33 100
Contractors 23 31 8 38 100
Others 18 18 18 47 100
BIM proficiency
level: Chi-Square
value = 43.364,
degrees of freedom at
12, p value = 0.001*
Expert 50 25 13 13 100
Advanced level 59 18 18 5 100
Intermediate level 25 32 18 25 100
Entry level 9 0 27 64 100
No BIM experience 0 0 13 88 100
*: statistically p value less than 0.05 indicates that the BIM adoption rate is dependent on the BIM proficiency level. 710
711
712
713
714
715
716
717
718
719
720
721
722
723
724
725
726
727
728
729
730
731
732
733
734
735
26
Table 2. The RII analysis results of BIM benefits within the whole survey sample (Cronbach’s 736
alpha = 0.922). 737
!738
Item Percentage of selecting
each option (%)
N* RII Item-
total
correl-
ation
Cron-
bach’s Alpha 1 2 3 4 5
B1: Reducing omissions and errors 3 0 0 21 76 86 0.930 0.644 0.917
B2: Reducing rework 5 1 6 25 63 87 0.883 0.678 0.918
B3: Better project quality 1 1 13 28 57 87 0.878 0.660 0.917
B4: Offering new services 2 5 8 32 53 87 0.857 0.727 0.914
B5: Marketing new business 4 6 14 33 44 85 0.814 0.639 0.917
B6: Easier for newly-hired staff to understand
the ongoing project
1 8 20 34 37 87 0.795 0.639 0.917
B7: Reducing construction cost 2 6 16 45 30 86 0.791 0.674 0.916
B8: Increasing profits 1 6 23 40 31 88 0.786 0.633 0.917
B9: Maintaining business relationships 2 3 26 41 26 87 0.772 0.663 0.916
B10: Reducing overall project duration 3 8 20 36 32 88 0.770 0.709 0.915
B11: Reducing time of workflows 5 11 16 33 34 87 0.763 0.589 0.917
B12: Fewer claims/litigations 1 8 28 39 24 85 0.751 0.723 0.914
B13: Recruiting and retaining employees 3 16 47 18 16 79 0.658 0.631 0.918
*:The total number of responses for each given item. 739
Note: The data analysis of RII excludes those who selected “N/A”. The same rule applies to other RII analysis tables. 740
741
742
743
744
745
746
747
748
749
750
751
752
753
754
755
756
757
758
759
760
761
762
763
764
765
766
767
27
Table 3. ANOVA analysis of subgroup differences towards BIM-benefit-related items. 768
769
Item Overall
Mean
Standard
deviation
ANOVA analysis for subgroups
according to professions
ANOVA analysis for subgroups
according to BIM proficiency level
F value p value F value p value
B1 4.651 0.804 0.64 0.719 1.09 0.366
B2 4.414 1.000 0.61 0.742 0.80 0.530
B3 4.391 0.848 0.90 0.513 0.39 0.813
B4 4.287 0.961 0.90 0.510 1.29 0.279
B5 4.071 1.060 0.77 0.618 0.45 0.771
B6 3.977 1.000 1.16 0.333 1.29 0.281
B7 3.953 1.038 0.83 0.568 0.41 0.803
B8 3.932 0.932 0.99 0.443 0.40 0.812
B9 3.862 1.068 1.00 0.441 1.01 0.408
B10 3.852 1.006 1.23 0.299 1.71 0.156
B11 3.816 1.160 1.21 0.309 1.80 0.137
B12 3.753 0.986 0.87 0.536 1.36 0.255
B13 3.291 0.980 2.05 0.061 0.22 0.929
770
771
772
773
774
775
776
777
778
779
780
781
782
783
784
785
786
787
788
789
790
791
792
793
794
795
796
797
798
799
800
801
802
803
28
Table 4. The RII analysis results of BIM-value-related factors within the whole survey 804
sample (Cronbach’s alpha = 0.919). 805
806
Item Percentage of selecting each
option (%)
N RII Item-
total
correl-
ation
Cronb-
ach’s Alpha 1 2 3 4 5
F1: Interoperability of BIM software 1 1 12 36 49 73 0.860 0.471 0.918
F2: Number of BIM-knowledgeable
professionals
1 0 22 47 32 73 0.822 0.618 0.914
F3: Project complexity 3 1 18 44 34 74 0.811 0.607 0.914
F4: Clients’ knowledge on BIM 1 3 21 42 32 71 0.803 0.636 0.913
F5: Companies’ collaboration experience with project partners
1 4 16 48 30 73 0.803 0.618 0.914
F6: Contract-form that is BIM-collaboration
supportive
3 4 26 34 34 74 0.784 0.666 0.912
F7: BIM technology consultants in the project
team
1 4 25 40 29 72 0.783 0.789 0.909
F8: The project nature (e.g., frequency of
design changes)
6 8 15 39 32 72 0.767 0.695 0.911
F9: Project schedule 4 7 28 31 30 71 0.749 0.692 0.911
F10:Number of BIM-knowledgeable companies
in the project
4 4 28 43 20 74 0.743 0.752 0.909
F11: Project budget 6 8 20 42 24 71 0.741 0.642 0.913
F12: Project size 8 11 25 32 25 73 0.707 0.703 0.911
F13:Project geographic location 7 15 42 21 15 72 0.644 0.625 0.914
F14: Staff from different companies working in
the same location
6 21 38 21 15 72 0.639 0.481 0.919
807
808
809
810
811
812
813
814
815
816
817
818
819
820
821
822
823
824
825
826
827
828
829
830
831
29
Table 5. ANOVA analysis of subgroup difference towards BIM-value-related items. 832
833
Item Overall
Mean
Standard
deviation
ANOVA analysis for subgroups
according to professions
ANOVA analysis for subgroups
according to BIM proficiency level
F value p value F value p value
F1 4.301 0.828 0.43 0.879 0.21 0.934
F2 4.110 0.842 0.35 0.928 1.04 0.395
F3 4.055 0.938 1.29 0.268 0.25 0.908
F4 4.014 0.904 1.49 0.186 0.63 0.642
F5 4.014 0.959 1.02 0.427 0.47 0.756
F6 3.919 1.805 0.48 0.842 0.94 0.448
F7 3.917 0.905 0.12 0.997 0.14 0.965
F8 3.833 1.128 1.27 0.277 1.08 0.375
F9 3.746 1.107 0.35 0.927 1.05 0.386
F10 3.716 1.010 0.38 0.912 0.58 0.681
F11 3.704 1.170 1.21 0.310 0.71 0.591
F12 3.534 1.230 0.55 0.793 0.29 0.885
F13 3.222 1.248 1.28 0.277 0.83 0.512
F14 3.194 1.149 1.56 0.165 0.54 0.705
!834
835
836
837
838
839
840
841
842
843
844
845
846
847
848
849
850
851
852
853
854
855
856
857
858
859
860
861
862
30
Table 6. The RII analysis results of BIM challenges within the whole survey sample 863
(Cronbach’s alpha = 0.796). 864
!865
Item Percentage of selecting
each option (%)
N RII Item-
total
correl-
ation
Cronb-
ach’s Alpha 1 2 3 4 5
C1: Lack of sufficient evaluation of BIM 1 6 27 21 8 63 0.692 0.577 0.763
C2: Acceptance of BIM from senior management 1 12 19 23 10 65 0.689 0.414 0.785
C3: Acceptance of BIM from middle
management
1 12 24 18 10 65 0.674 0.431 0.783
C4: Lack of client requirements 5 10 22 15 13 65 0.665 0.533 0.770
C5: Lack of government regulation 6 15 20 13 11 65 0.625 0.504 0.774
C6: Cost of hardware upgrading 5 19 22 13 6 65 0.588 0.591 0.760
C7: Cost of purchasing BIM software 5 19 22 16 4 66 0.585 0.429 0.784
C8: Acceptance of BIM from the entry-level staff 11 21 11 12 11 66 0.573 0.541 0.768
C9: Effective training 11 21 15 11 8 66 0.552 0.363 0.793
!866
867
868
869
870
871
872
873
874
875
876
877
878
879
880
881
882
883
884
885
886
887
888
889
890
891
892
893
894
895
896
31
Table 7. ANOVA analysis of subgroup difference towards BIM-challenge-related items. 897
Item Overall
Mean
Standard
deviation
ANOVA analysis for subgroups
according to professions
ANOVA analysis for subgroups
according to BIM proficiency level
F value p value F value p value
C1 3.460 1.024 0.50 0.833 1.64 0.177
C2 3.446 1.056 1.71 0.126 1.74 0.153
C3 3.369 1.009 0.93 0.490 2.04 0.100
C4 3.323 1.223 0.61 0.748 0.75 0.559
C5 3.123 1.260 1.16 0.340 0.79 0.538
C6 2.938 1.193 0.65 0.715 0.35 0.841
C7 2.924 1.101 0.70 0.670 0.21 0.933
C8 2.864 1.365 2.27 0.041* 1.35 0.261
C9 2.758 1.307 0.23 0.976 3.35 0.015*
*: p value lower than 0.05 indicates the significant differences among subgroups 898
899
900
901
902
903
904
905
906
907
908
909
910
911
912
913
914
915
916
917
918
32
Table 8. Perceptions on BIM-benefited parties among different subgroups of survey 919
participants. 920
Subcategory Owner (%) Engineering
firms (%)
Contra-
ctors (%)
Consultants (%) Others (%)
M* L* M* L* M* L* M* L* M* L*
Overall 87 0 0 38 12 26 1 33 0 3
Profession Academics 100 0 0 100 0 0 0 0 0 0
Architects 75 0 0 63 25 0 0 38 0 0
Engineers 75 0 0 25 25 25 0 50 0 0
BIM consultants 84 0 0 56 11 28 5 11 0 6
Owners 90 0 0 11 10 33 0 56 0 0
Contractors 67 0 0 100 33 0 0 0 0 0
Software
developers
100 0 0 0 0 33 0 67 0 0
Others 100 0 0 17 0 42 0 33 0 8
BIM
proficiency
level
Expert 83 0 0 83 17 0 0 17 0 0
Advanced level 94 0 0 40 6 40 0 13 0 7
Intermediate
level
85 0 0 16 10 37 5 47 0 0
Entry level 84 0 0 29 16 18 0 47 0 6
No BIM
experience
80 0 0 80 20 0 0 20 0 0
Note: M and L in Table 8 represent parties considered with the most and least benefits from BIM respectively. The same 921
definition applies to Table 9. 922
923
924
925
926
927
928
929
930
931
932
933
934
33
Table 9. The Chi-Square test of independence of parties benefitted from BIM 935
Chi-Square value Degree of freedom p value
Profession M 9.377 28 1.000
L 23.762 28 0.694
BIM proficiency level M 3.894 16 0.999
L 20.375 16 0.204
!936
937
938
939
940
941
942
943
944
!945
!!946
!947
!948
!949
!950
!951
!952
!953
!954
!955
!956
!957
!958
!959
!960
!961
!962
!963
!964
!965
!966
!967
!968
!969
!970
!971
!972
!973
!974
!975
!976
977
34
978
North 979
980
Fig.1. Geographic location of survey participants (N=94) 981
982
983
984
985
986
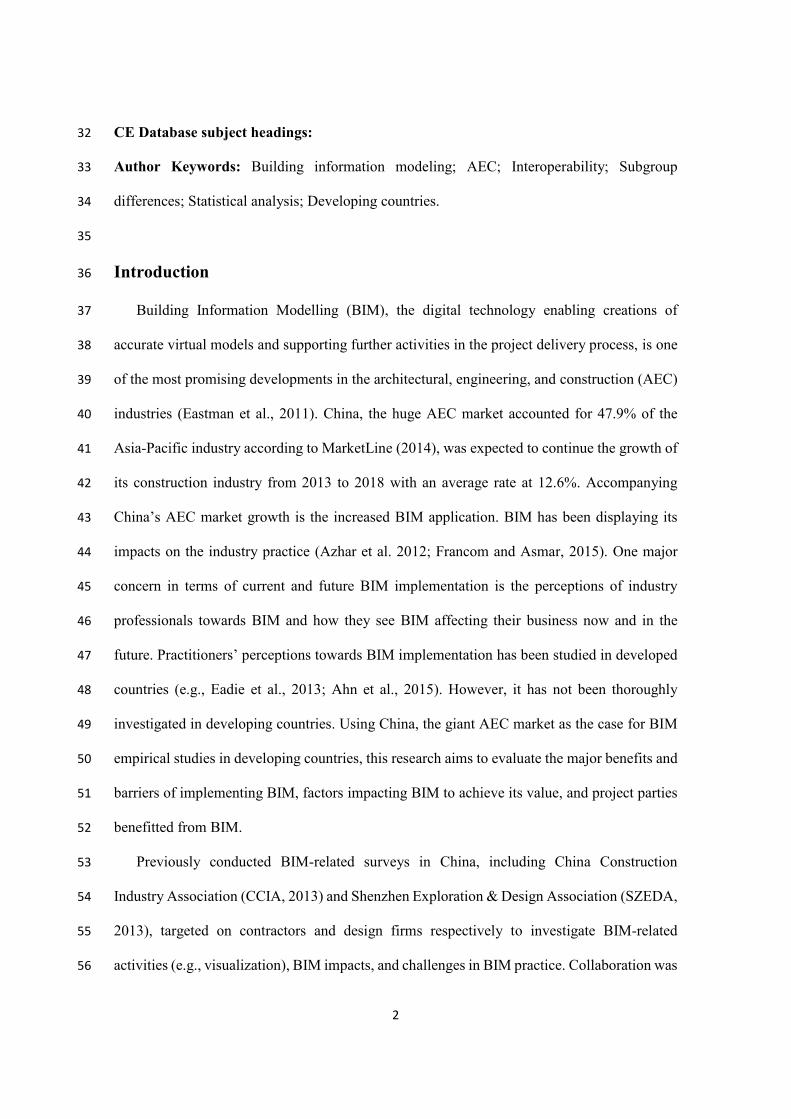
987
988
989
990
991
992
993
994
995
996
997
998
999
1000
1001
1002
1003
1004
1005
1006
1007
1008
Shanghai and nearby
regions: 62% (N=58)
Overseas: 10% (N=9)
Beijing and nearby
regions: 15% (N=14)
Guangdong and nearby regions:
7% (N=7)
Inland regions: 6% (N=6)
35
1009
1010
1011
1012
1013
1014
1015
1016
1017
1018
1019
1020
1021
1022
1023
1024
1025
1026
1027
1028
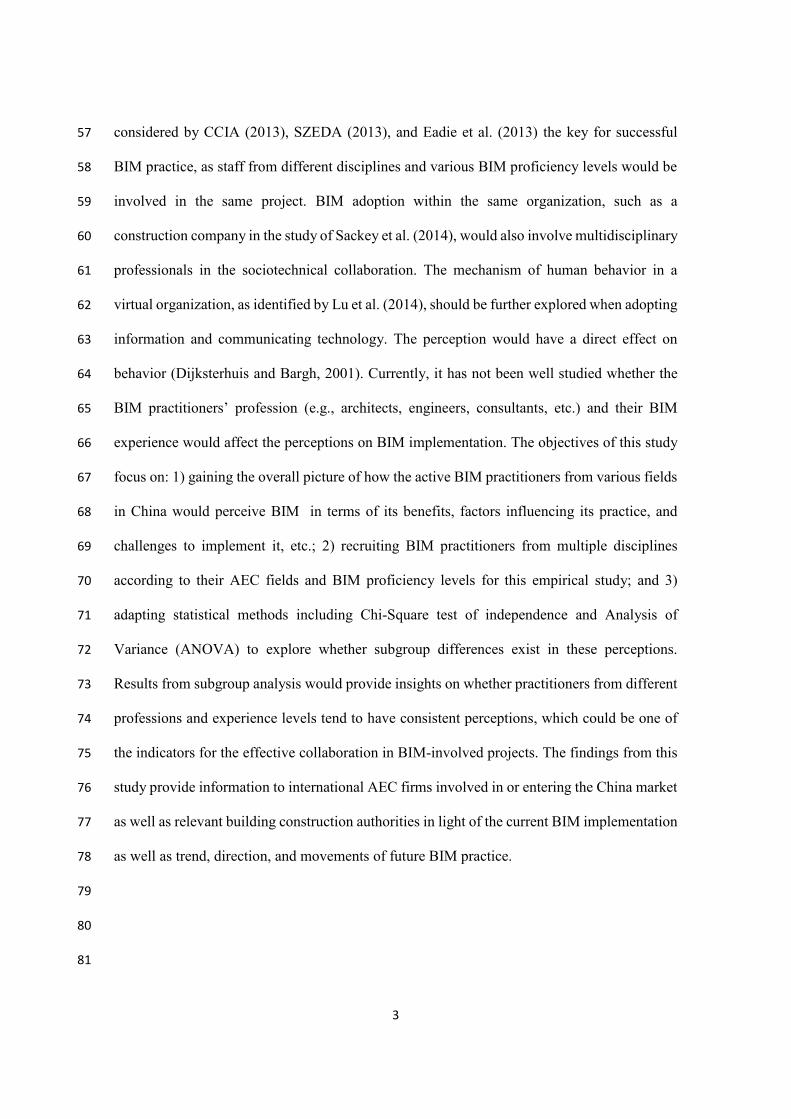
Fig.2. Box plots for number of years of using BIM among survey participants (N=91)
Note: 1. Engineers involved in this survey pool included
civil engineers, building services engineers, and structural
engineers. 2. Three participants did not provide the answer to this
question. Therefore, only 91 valid responses were
summarized.
36
1029
1030
1031
1032
1033
1034
1035
1036
1037
1038
1039
1040
1041
1042
1043
1044
1045
1046
1047
1048
Fig.3. Survey participants’ BIM proficiency level (N=94)
37
1049
1050 Note: 1. The median and 25th percentile value for the subsample of moderate level users were the same (i.e.
two years). 2. Four participants did not provide valid answers to this question and 90 responses were adopted as the
overall sample.
Fig.4. Box plots for number of years of using BIM among survey participants
View publication statsView publication stats