Embed Size (px)
Citation preview
1 3
DOI 10.1007/s00382-016-3164-xClim Dyn (2017) 48:1633–1645
Empirical prediction of the onset dates of South China Sea summer monsoon
Zhiwei Zhu1,2 · Tim Li1,2
Received: 14 October 2015 / Accepted: 1 May 2016 / Published online: 14 May 2016 © Springer-Verlag Berlin Heidelberg 2016
the STPM is constructed using 1979–2004 data. Based on the forecasted zonal wind index, the independent forecast of the SCSSM onset dates achieves a TCC skill of 0.90 for 2005–2014. The STPM provides more detailed informa-tion for the intraseasonal evolution during the period of the SCSSM onset (pentad 25–35). The two models proposed herein are expected to facilitate the real-time prediction of the SCSSM onset.
Keywords The onset dates of South China Sea summer monsoon · Seasonal prediction · Extended-range forecast · Physical–empirical model · Spatial–temporal projection model
1 Introduction
The onset of the South China Sea summer monsoon (SCSSM) signifies the commencement of the East Asian summer monsoon. The earliest onset of Asian summer monsoon occurs in the southeast Bay of Bengal in late April (pentad 23–24) (Zhang et al. 2002; Li et al. 2013) which is characterized by prevailing monsoonal westerlies in the northern Indian Ocean (IO). After that, the monsoon rain extends northeastward rapidly, passing over the Indo-china Peninsula in early May (pentad 25–26) (Zhang et al. 2002), and then over the South China Sea (SCS) in mid-May (pentad 27–28) (Xiang and Wang 2012). The monsoon onset on these contiguous seas is mainly caused by the pro-pulsion of westerly. After the SCSSM onset, the monsoon rain belt moves northward (Wang and LinHo 2002) arriv-ing southern China in late may, middle and lower reaches of Yangtze River basin and southern Japan in early June, and northern China and Korean Peninsula in July. Thus, the SCSSM onset was considered as the starting phase and
Abstract The onset of South China Sea summer monsoon (SCSSM) signifies the commencement of the wet season over East Asia. Predicting the SCSSM onset date is of sig-nificant importance. In this study, we establish two differ-ent statistical models, namely the physical–empirical model (PEM) and the spatial–temporal projection model (STPM) to predict the SCSSM onset. The PEM is constructed from the seasonal prediction perspective. Observational diagno-ses reveal that the early onset of the SCSSM is preceded by (a) a warming tendency in middle and lower troposphere (850–500 hPa) over central Siberia from January to March, (b) a La Niña-like zonal dipole sea surface temperature pat-tern over the tropical Pacific in March, and (c) a dipole sea level pressure pattern with negative center in subtropics and positive center over high latitude of Southern Hemisphere in January. The PEM built on these predictors achieves a cross-validated reforecast temporal correlation coefficient (TCC) skill of 0.84 for the period of 1979–2004, and an independent forecast TCC skill of 0.72 for the period 2005–2014. The STPM is built on the extended-range forecast perspective. Pentad data are used to predict a zonal wind index over the South China Sea region. Similar to PEM,
* Tim Li [email protected]
1 Key Laboratory of Meteorological Disaster, Ministry of Education (KLME)/Joint International Research Laboratory of Climate and Environment Change (ILCEC)/Collaborative Innovation Center on Forecast and Evaluation of Meteorological Disasters (CIC-FEMD), Nanjing University of Information Science and Technology, Nanjing, China
2 International Pacific Research Center and Department of Atmospheric Sciences, University of Hawaii at Manoa, 1680 East West Road, POST Bldg. 401, Honolulu, HI 96822, USA
1634 Z. Zhu, T. Li
1 3
crucial “switch” of the East Asian summer monsoon (Chang and Chen 1995; Wang et al. 2004) which is characterized by large-scales moisture transportation from surrounding oceans to the East Asian continent (Ding and Chan 2005). The onset date of SCSSM exhibits a considerable year-to-year variation. Earlier or later onset is related to the total rainfall amount during the entire monsoon season (He and Zhu 2015). Therefore, study of the interannual variability of the SCSSM onset has not only important illumination of monsoon dynamics but also great values for society needs.
Since the mid-twentieth century, especially after the South China Sea Monsoon Experiment (SCSMEX) in 1998, many efforts have been devoted to exploring the cir-culation features and physical mechanisms of the SCSSM onset (Wang et al. 2009). The monsoon onset over SCS is characterized by a deepening of the India–Burma trough, the development of a couple of low level vortices over equatorial IO, the reversal of lower troposphere zonal winds from easterlies to westerlies, and the significantly enhanced convection and precipitation over SCS. It is accompanied by the eastward and northward retreat of the western North Pacific subtropical high (WNPSH), the con-solidation of Mascarene High and Australian High, and the development of the cross-equatorial flows (Lau and Yang 1997). Various factors may have governed the SCSSM onset. For example, the thermal condition over Tibetan Plateau deepened the India-Burma trough, which might contribute to the SCSSM onset (Wu et al. 2012b). The El Niño is another crucial factor (Wang et al. 2000; Xie et al. 2015). When a warm tropical sea surface tempera-ture anomaly (SSTA) appears in the western Pacific Ocean (PO) and a cold SSTA appears in the central-eastern PO, the Walker circulation is enhanced in the preceding spring, which leads to an early onset of SCSSM, and vice versa (Zhou and Chan 2007). The SCSSM onset is also strongly influenced by the intraseasonal and synoptic perturbations during the seasonal transition period (Krishnamurti 1985; Murakami 1980). For example, the first-branch northward-propagating intraseasonal oscillation over the tropical IO often triggers SCSSM onset (Li et al. 2013). It has been shown that the timing of SCSSM onset is closely related to the active phase of low-frequency oscillations over the East Asian monsoon region, such as a warm phase of the eastward propagating 2–3 week oscillation (TTO) of the upper-level temperature in middle latitudes, an active phase of the northward propagating Madden–Julian Oscillation, and a wet phase of the westward propagating TTO from the western PO (Wu and Zhang 1998). Moreover, the synoptic vortices that formed over the northern IO also excites the onset of Asian summer monsoon (Krishnamurti et al. 1981; Wu et al. 2012a; Zhu and He 2013).
While great advancements have been achieved in understanding the mechanism of the SCSSM onset,
little endeavor has been devoted into its prediction. Pre-dicting the SCSSM onset is difficult due to the following reasons. Firstly, although various factors may affect the onset of SCSSM, the correlations between the predictors and the predictand often vary with decades (Kwon et al. 2005). Thus, it is difficult to obtain skillful prediction by a single predictor based on statistical relationship with the predictand in a limited period. Secondly, the SCSSM onset date is influenced by both interannual and intrasea-sonal modes. A seasonal prediction model could not cap-ture the higher-frequency fluctuation (10–30-day) during the SCSSM onset. Thirdly, an exact SCSSM onset date can only be determined after fully entering the monsoon season. Given that not all the years have robust and sud-den onset character, the ambiguous onset may occur at some year (such as 2009) which is called the ‘fake onset’ or ‘bogus onset’. The difficulty in predicting the onset dates of SCSSM points out a necessity to construct empirical models from both the seasonal prediction and the extended-range forecast perspectives.
The objectives of this study are to investigate the pre-cursor of the SCSSM onset at both interannual and intra-seasonal timescale and to predict the SCSSM onset by establishing two statistical models, namely the physical–empirical model (PEM) and the spatial–temporal projection model (STPM). The remainder of this paper is organized as follows. Section 2 describes the data and method utilized. Section 3 shows the precursor of the SCSSM onset and the prediction skills of the PEM. In Sect. 4, the predictors for the STPM along with the prediction skills are presented. Section 5 provides conclusion and discussion.
2 Data and method
The daily atmospheric circulation data is derived from the National Centers for Environmental Prediction (NCEP) Department of Energy (DOE) Reanalysis II (NCEP/DOE) (Kanamitsu et al. 2002) (NCEP2). Sea surface temperature (SST) data is obtained from monthly mean Hadley Centre Sea Ice and Sea Surface Temperature dataset (Rayner et al. 2003). Additional dataset are the monthly mean Global Pre-cipitation Climatology Project (GPCP) (Adler et al. 2003) and outgoing long-wave radiation (OLR) from the National Oceanic and Atmospheric Administration (NOAA) satellite (Liebmann and Smith 1996). The onset dates of SCSSM in the present study is based on NCEP2. For comparison pur-pose, daily mean zonal wind at 850 hPa from ERA-Interim (ERAI) (Dee et al. 2011) and NCEP/NCAR (Kalnay et al. 1996) (NCEP1) datasets are also employed to calculate the SCSSM onset date index. All the data covers the period 1979–2014. The pentad mean data is obtained by a 5-day mean to the daily data.
1635Empirical prediction of the onset dates of South China Sea summer monsoon
1 3
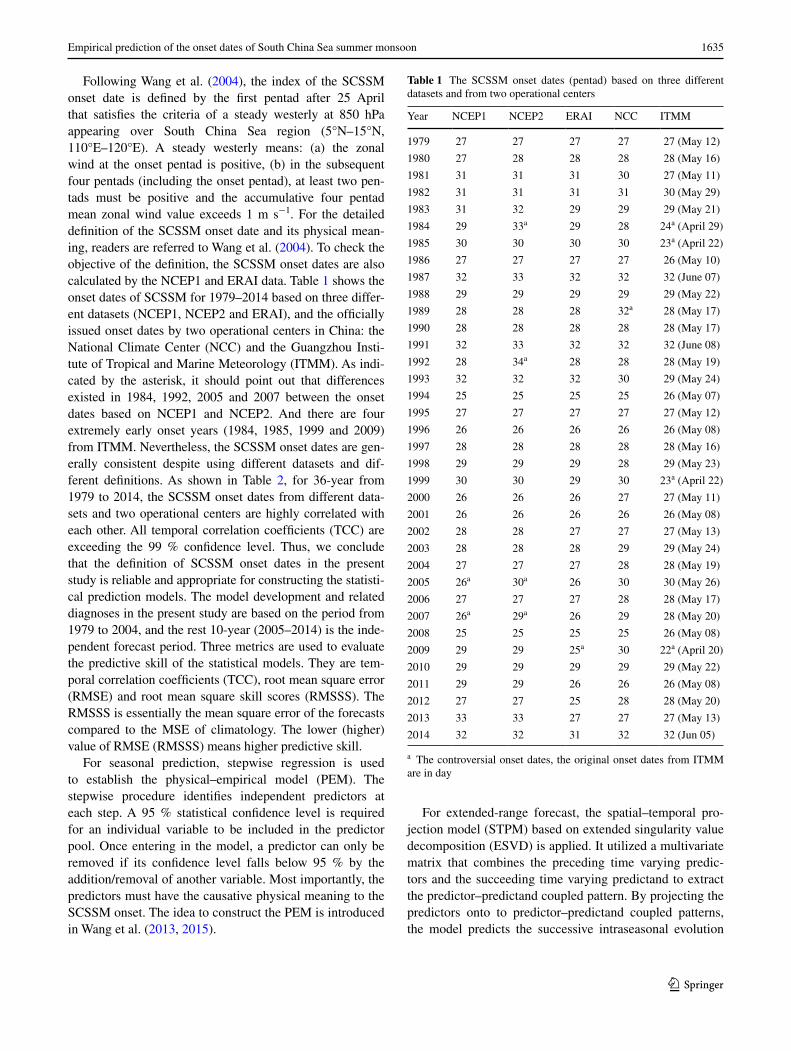
Following Wang et al. (2004), the index of the SCSSM onset date is defined by the first pentad after 25 April that satisfies the criteria of a steady westerly at 850 hPa appearing over South China Sea region (5°N–15°N, 110°E–120°E). A steady westerly means: (a) the zonal wind at the onset pentad is positive, (b) in the subsequent four pentads (including the onset pentad), at least two pen-tads must be positive and the accumulative four pentad mean zonal wind value exceeds 1 m s−1. For the detailed definition of the SCSSM onset date and its physical mean-ing, readers are referred to Wang et al. (2004). To check the objective of the definition, the SCSSM onset dates are also calculated by the NCEP1 and ERAI data. Table 1 shows the onset dates of SCSSM for 1979–2014 based on three differ-ent datasets (NCEP1, NCEP2 and ERAI), and the officially issued onset dates by two operational centers in China: the National Climate Center (NCC) and the Guangzhou Insti-tute of Tropical and Marine Meteorology (ITMM). As indi-cated by the asterisk, it should point out that differences existed in 1984, 1992, 2005 and 2007 between the onset dates based on NCEP1 and NCEP2. And there are four extremely early onset years (1984, 1985, 1999 and 2009) from ITMM. Nevertheless, the SCSSM onset dates are gen-erally consistent despite using different datasets and dif-ferent definitions. As shown in Table 2, for 36-year from 1979 to 2014, the SCSSM onset dates from different data-sets and two operational centers are highly correlated with each other. All temporal correlation coefficients (TCC) are exceeding the 99 % confidence level. Thus, we conclude that the definition of SCSSM onset dates in the present study is reliable and appropriate for constructing the statisti-cal prediction models. The model development and related diagnoses in the present study are based on the period from 1979 to 2004, and the rest 10-year (2005–2014) is the inde-pendent forecast period. Three metrics are used to evaluate the predictive skill of the statistical models. They are tem-poral correlation coefficients (TCC), root mean square error (RMSE) and root mean square skill scores (RMSSS). The RMSSS is essentially the mean square error of the forecasts compared to the MSE of climatology. The lower (higher) value of RMSE (RMSSS) means higher predictive skill.
For seasonal prediction, stepwise regression is used to establish the physical–empirical model (PEM). The stepwise procedure identifies independent predictors at each step. A 95 % statistical confidence level is required for an individual variable to be included in the predictor pool. Once entering in the model, a predictor can only be removed if its confidence level falls below 95 % by the addition/removal of another variable. Most importantly, the predictors must have the causative physical meaning to the SCSSM onset. The idea to construct the PEM is introduced in Wang et al. (2013, 2015).
For extended-range forecast, the spatial–temporal pro-jection model (STPM) based on extended singularity value decomposition (ESVD) is applied. It utilized a multivariate matrix that combines the preceding time varying predic-tors and the succeeding time varying predictand to extract the predictor–predictand coupled pattern. By projecting the predictors onto to predictor–predictand coupled patterns, the model predicts the successive intraseasonal evolution
Table 1 The SCSSM onset dates (pentad) based on three different datasets and from two operational centers
a The controversial onset dates, the original onset dates from ITMM are in day
Year NCEP1 NCEP2 ERAI NCC ITMM
1979 27 27 27 27 27 (May 12)
1980 27 28 28 28 28 (May 16)
1981 31 31 31 30 27 (May 11)
1982 31 31 31 31 30 (May 29)
1983 31 32 29 29 29 (May 21)
1984 29 33a 29 28 24a (April 29)
1985 30 30 30 30 23a (April 22)
1986 27 27 27 27 26 (May 10)
1987 32 33 32 32 32 (June 07)
1988 29 29 29 29 29 (May 22)
1989 28 28 28 32a 28 (May 17)
1990 28 28 28 28 28 (May 17)
1991 32 33 32 32 32 (June 08)
1992 28 34a 28 28 28 (May 19)
1993 32 32 32 30 29 (May 24)
1994 25 25 25 25 26 (May 07)
1995 27 27 27 27 27 (May 12)
1996 26 26 26 26 26 (May 08)
1997 28 28 28 28 28 (May 16)
1998 29 29 29 28 29 (May 23)
1999 30 30 29 30 23a (April 22)
2000 26 26 26 27 27 (May 11)
2001 26 26 26 26 26 (May 08)
2002 28 28 27 27 27 (May 13)
2003 28 28 28 29 29 (May 24)
2004 27 27 27 28 28 (May 19)
2005 26a 30a 26 30 30 (May 26)
2006 27 27 27 28 28 (May 17)
2007 26a 29a 26 29 28 (May 20)
2008 25 25 25 25 26 (May 08)
2009 29 29 25a 30 22a (April 20)
2010 29 29 29 29 29 (May 22)
2011 29 29 26 26 26 (May 08)
2012 27 27 25 28 28 (May 20)
2013 33 33 27 27 27 (May 13)
2014 32 32 31 32 32 (Jun 05)
1636 Z. Zhu, T. Li
1 3
of the predictand at once. We refer the reader to Zhu et al. (2015) and Zhu and Li (2016) for the details of the STPM.
3 Seasonal prediction based on the PEM
3.1 Physical precursor associated with the SCSSM onset
To find the useful hints in selecting the potential predic-tors, we first review the climatological mean circulation
Table 2 The correlation coefficients among the onset dates based on different datasets and from two operational centers
a Four extremely early onset years of ITMM are excluded when cal-culating correlation coefficients with others
NCEP1 NCEP2 ERAI ITMMa NCC
NCEP1 1 0.82 0.80 0.61 0.65
NCEP2 1 0.71 0.67 0.68
ERAI 1 0.8 0.73
ITMM 1 0.87
NCC 1
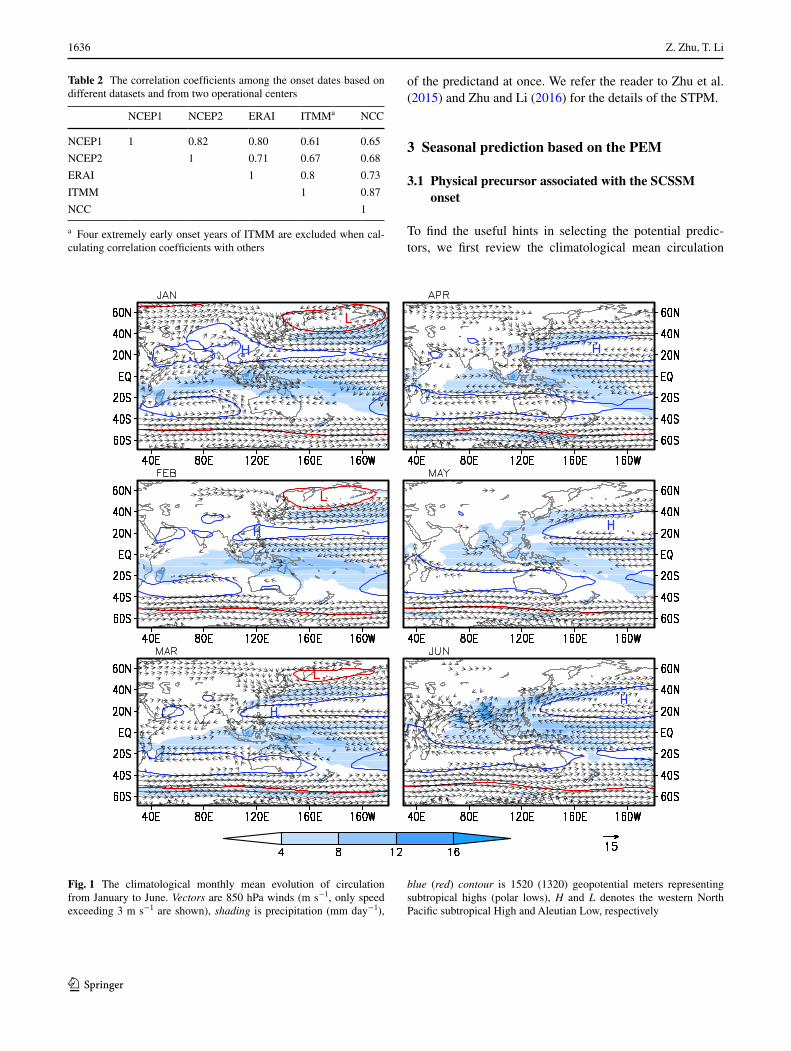
Fig. 1 The climatological monthly mean evolution of circulation from January to June. Vectors are 850 hPa winds (m s−1, only speed exceeding 3 m s−1 are shown), shading is precipitation (mm day−1),
blue (red) contour is 1520 (1320) geopotential meters representing subtropical highs (polar lows), H and L denotes the western North Pacific subtropical High and Aleutian Low, respectively
1637Empirical prediction of the onset dates of South China Sea summer monsoon
1 3
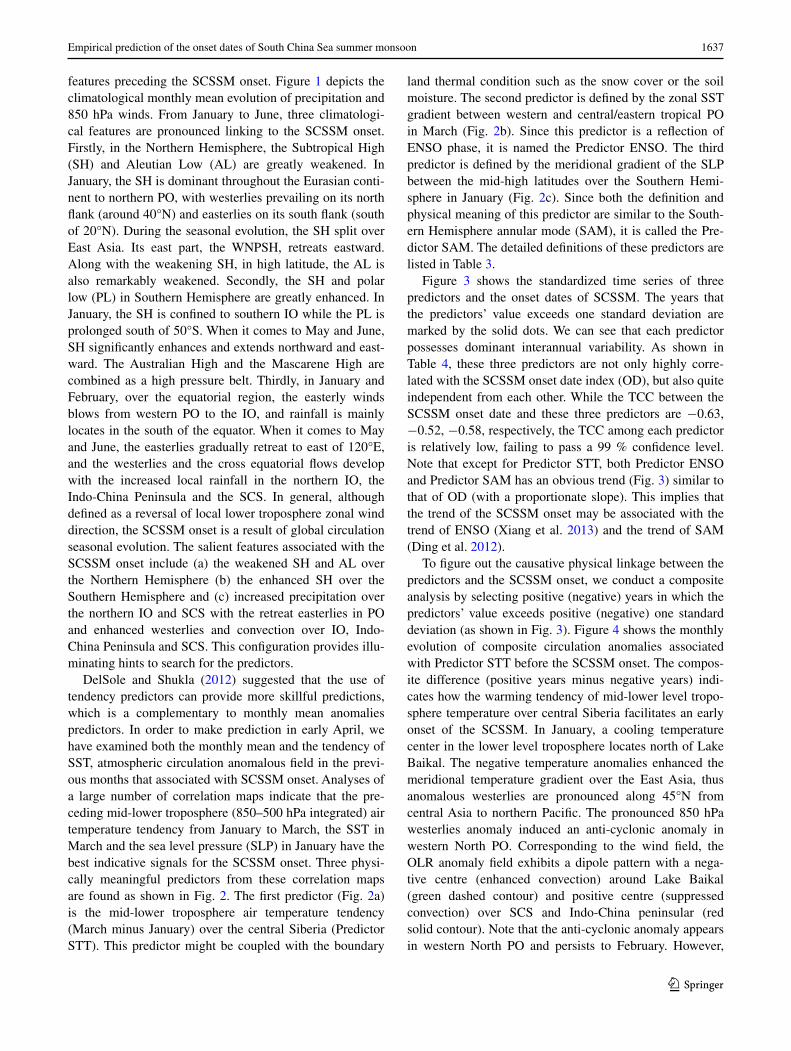
features preceding the SCSSM onset. Figure 1 depicts the climatological monthly mean evolution of precipitation and 850 hPa winds. From January to June, three climatologi-cal features are pronounced linking to the SCSSM onset. Firstly, in the Northern Hemisphere, the Subtropical High (SH) and Aleutian Low (AL) are greatly weakened. In January, the SH is dominant throughout the Eurasian conti-nent to northern PO, with westerlies prevailing on its north flank (around 40°N) and easterlies on its south flank (south of 20°N). During the seasonal evolution, the SH split over East Asia. Its east part, the WNPSH, retreats eastward. Along with the weakening SH, in high latitude, the AL is also remarkably weakened. Secondly, the SH and polar low (PL) in Southern Hemisphere are greatly enhanced. In January, the SH is confined to southern IO while the PL is prolonged south of 50°S. When it comes to May and June, SH significantly enhances and extends northward and east-ward. The Australian High and the Mascarene High are combined as a high pressure belt. Thirdly, in January and February, over the equatorial region, the easterly winds blows from western PO to the IO, and rainfall is mainly locates in the south of the equator. When it comes to May and June, the easterlies gradually retreat to east of 120°E, and the westerlies and the cross equatorial flows develop with the increased local rainfall in the northern IO, the Indo-China Peninsula and the SCS. In general, although defined as a reversal of local lower troposphere zonal wind direction, the SCSSM onset is a result of global circulation seasonal evolution. The salient features associated with the SCSSM onset include (a) the weakened SH and AL over the Northern Hemisphere (b) the enhanced SH over the Southern Hemisphere and (c) increased precipitation over the northern IO and SCS with the retreat easterlies in PO and enhanced westerlies and convection over IO, Indo-China Peninsula and SCS. This configuration provides illu-minating hints to search for the predictors.
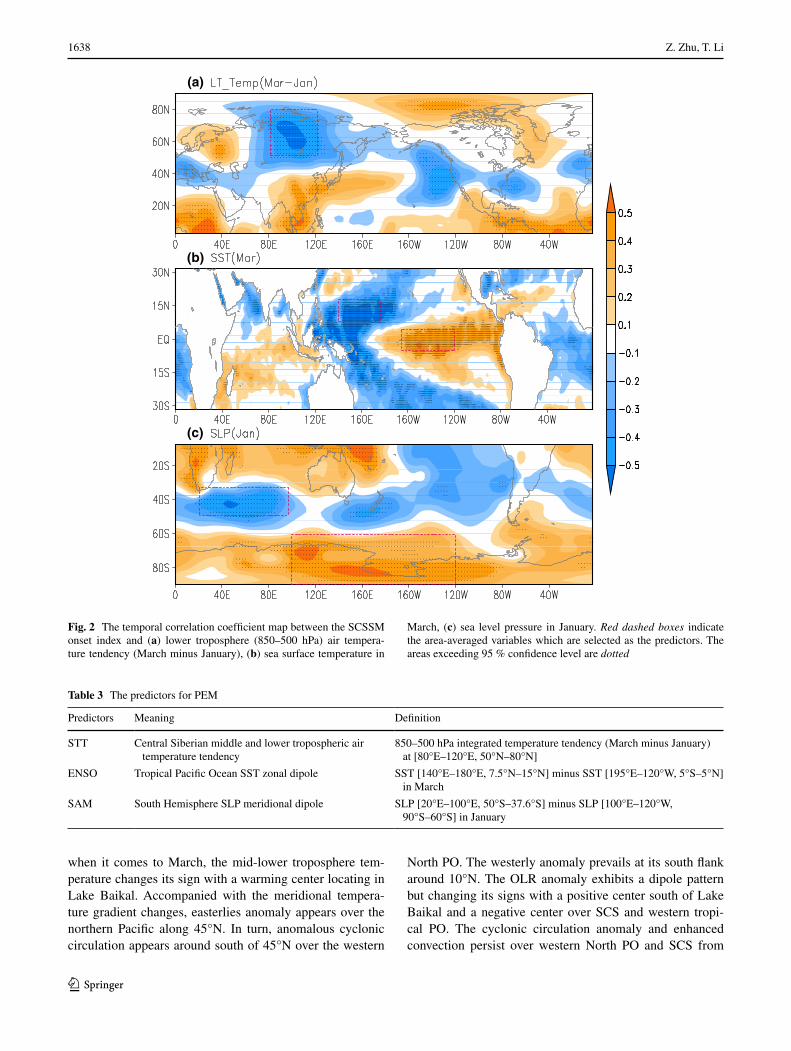
DelSole and Shukla (2012) suggested that the use of tendency predictors can provide more skillful predictions, which is a complementary to monthly mean anomalies predictors. In order to make prediction in early April, we have examined both the monthly mean and the tendency of SST, atmospheric circulation anomalous field in the previ-ous months that associated with SCSSM onset. Analyses of a large number of correlation maps indicate that the pre-ceding mid-lower troposphere (850–500 hPa integrated) air temperature tendency from January to March, the SST in March and the sea level pressure (SLP) in January have the best indicative signals for the SCSSM onset. Three physi-cally meaningful predictors from these correlation maps are found as shown in Fig. 2. The first predictor (Fig. 2a) is the mid-lower troposphere air temperature tendency (March minus January) over the central Siberia (Predictor STT). This predictor might be coupled with the boundary
land thermal condition such as the snow cover or the soil moisture. The second predictor is defined by the zonal SST gradient between western and central/eastern tropical PO in March (Fig. 2b). Since this predictor is a reflection of ENSO phase, it is named the Predictor ENSO. The third predictor is defined by the meridional gradient of the SLP between the mid-high latitudes over the Southern Hemi-sphere in January (Fig. 2c). Since both the definition and physical meaning of this predictor are similar to the South-ern Hemisphere annular mode (SAM), it is called the Pre-dictor SAM. The detailed definitions of these predictors are listed in Table 3.
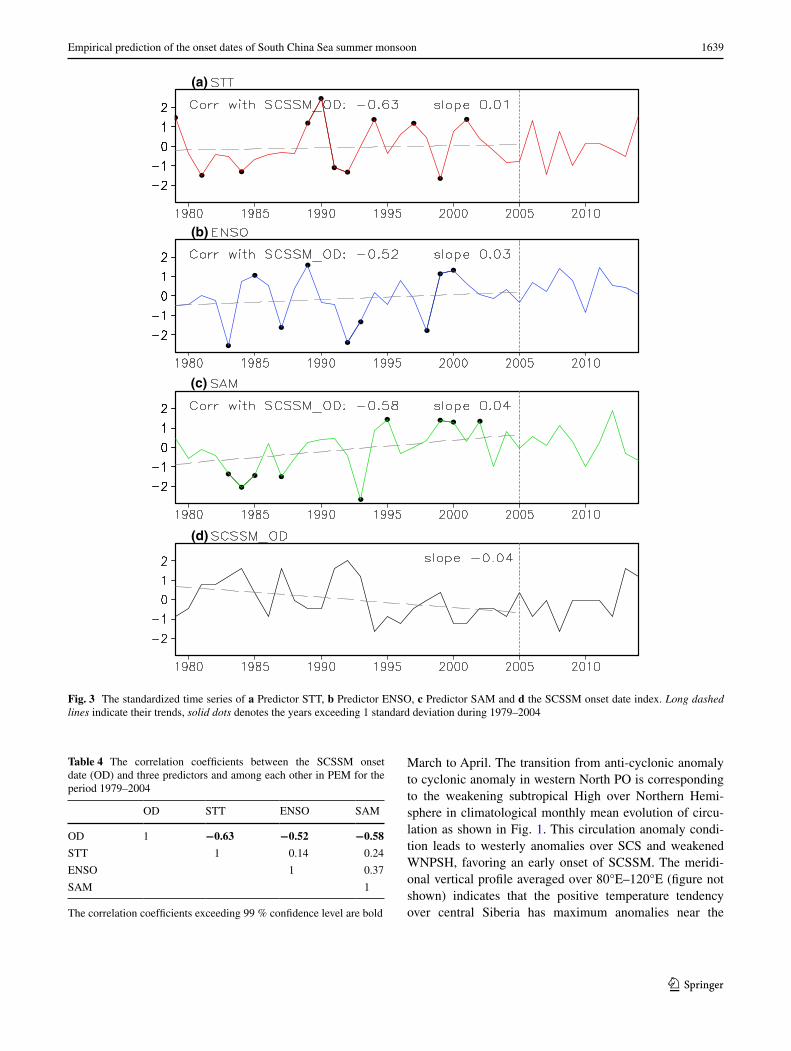
Figure 3 shows the standardized time series of three predictors and the onset dates of SCSSM. The years that the predictors’ value exceeds one standard deviation are marked by the solid dots. We can see that each predictor possesses dominant interannual variability. As shown in Table 4, these three predictors are not only highly corre-lated with the SCSSM onset date index (OD), but also quite independent from each other. While the TCC between the SCSSM onset date and these three predictors are −0.63, −0.52, −0.58, respectively, the TCC among each predictor is relatively low, failing to pass a 99 % confidence level. Note that except for Predictor STT, both Predictor ENSO and Predictor SAM has an obvious trend (Fig. 3) similar to that of OD (with a proportionate slope). This implies that the trend of the SCSSM onset may be associated with the trend of ENSO (Xiang et al. 2013) and the trend of SAM (Ding et al. 2012).
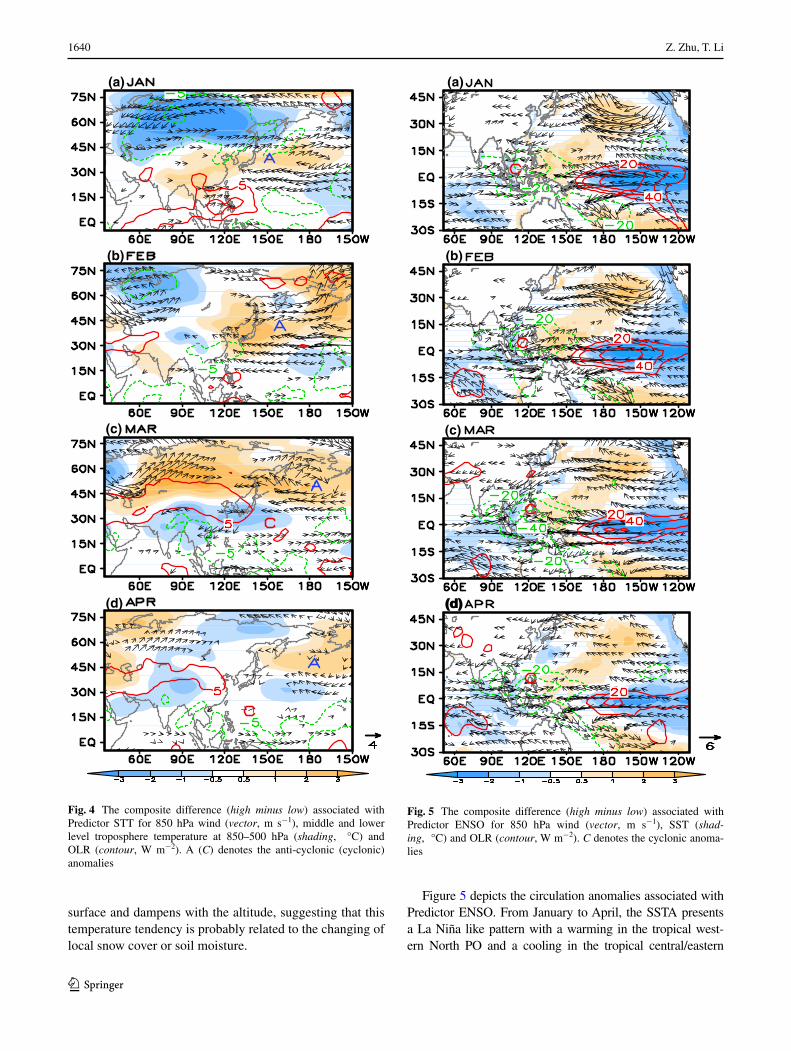
To figure out the causative physical linkage between the predictors and the SCSSM onset, we conduct a composite analysis by selecting positive (negative) years in which the predictors’ value exceeds positive (negative) one standard deviation (as shown in Fig. 3). Figure 4 shows the monthly evolution of composite circulation anomalies associated with Predictor STT before the SCSSM onset. The compos-ite difference (positive years minus negative years) indi-cates how the warming tendency of mid-lower level tropo-sphere temperature over central Siberia facilitates an early onset of the SCSSM. In January, a cooling temperature center in the lower level troposphere locates north of Lake Baikal. The negative temperature anomalies enhanced the meridional temperature gradient over the East Asia, thus anomalous westerlies are pronounced along 45°N from central Asia to northern Pacific. The pronounced 850 hPa westerlies anomaly induced an anti-cyclonic anomaly in western North PO. Corresponding to the wind field, the OLR anomaly field exhibits a dipole pattern with a nega-tive centre (enhanced convection) around Lake Baikal (green dashed contour) and positive centre (suppressed convection) over SCS and Indo-China peninsular (red solid contour). Note that the anti-cyclonic anomaly appears in western North PO and persists to February. However,
1638 Z. Zhu, T. Li
1 3
when it comes to March, the mid-lower troposphere tem-perature changes its sign with a warming center locating in Lake Baikal. Accompanied with the meridional tempera-ture gradient changes, easterlies anomaly appears over the northern Pacific along 45°N. In turn, anomalous cyclonic circulation appears around south of 45°N over the western
North PO. The westerly anomaly prevails at its south flank around 10°N. The OLR anomaly exhibits a dipole pattern but changing its signs with a positive center south of Lake Baikal and a negative center over SCS and western tropi-cal PO. The cyclonic circulation anomaly and enhanced convection persist over western North PO and SCS from
(a)
(b)
(c)
Fig. 2 The temporal correlation coefficient map between the SCSSM onset index and (a) lower troposphere (850–500 hPa) air tempera-ture tendency (March minus January), (b) sea surface temperature in
March, (c) sea level pressure in January. Red dashed boxes indicate the area-averaged variables which are selected as the predictors. The areas exceeding 95 % confidence level are dotted
Table 3 The predictors for PEM
Predictors Meaning Definition
STT Central Siberian middle and lower tropospheric air temperature tendency
850–500 hPa integrated temperature tendency (March minus January) at [80°E–120°E, 50°N–80°N]
ENSO Tropical Pacific Ocean SST zonal dipole SST [140°E–180°E, 7.5°N–15°N] minus SST [195°E–120°W, 5°S–5°N] in March
SAM South Hemisphere SLP meridional dipole SLP [20°E–100°E, 50°S–37.6°S] minus SLP [100°E–120°W, 90°S–60°S] in January
1639Empirical prediction of the onset dates of South China Sea summer monsoon
1 3
March to April. The transition from anti-cyclonic anomaly to cyclonic anomaly in western North PO is corresponding to the weakening subtropical High over Northern Hemi-sphere in climatological monthly mean evolution of circu-lation as shown in Fig. 1. This circulation anomaly condi-tion leads to westerly anomalies over SCS and weakened WNPSH, favoring an early onset of SCSSM. The meridi-onal vertical profile averaged over 80°E–120°E (figure not shown) indicates that the positive temperature tendency over central Siberia has maximum anomalies near the
(a)
(b)
(c)
(d)
Fig. 3 The standardized time series of a Predictor STT, b Predictor ENSO, c Predictor SAM and d the SCSSM onset date index. Long dashed lines indicate their trends, solid dots denotes the years exceeding 1 standard deviation during 1979–2004
Table 4 The correlation coefficients between the SCSSM onset date (OD) and three predictors and among each other in PEM for the period 1979–2004
The correlation coefficients exceeding 99 % confidence level are bold
OD STT ENSO SAM
OD 1 −0.63 −0.52 −0.58
STT 1 0.14 0.24
ENSO 1 0.37
SAM 1
1640 Z. Zhu, T. Li
1 3
surface and dampens with the altitude, suggesting that this temperature tendency is probably related to the changing of local snow cover or soil moisture.
Figure 5 depicts the circulation anomalies associated with Predictor ENSO. From January to April, the SSTA presents a La Niña like pattern with a warming in the tropical west-ern North PO and a cooling in the tropical central/eastern
(a)
(b)
(c)
(d)
Fig. 4 The composite difference (high minus low) associated with Predictor STT for 850 hPa wind (vector, m s−1), middle and lower level troposphere temperature at 850–500 hPa (shading, °C) and OLR (contour, W m−2). A (C) denotes the anti-cyclonic (cyclonic) anomalies
(a)
(b)
(c)
(d)(d)
Fig. 5 The composite difference (high minus low) associated with Predictor ENSO for 850 hPa wind (vector, m s−1), SST (shad-ing, °C) and OLR (contour, W m−2). C denotes the cyclonic anoma-lies
1641Empirical prediction of the onset dates of South China Sea summer monsoon
1 3
PO. The SSTA gradient leads to enhanced convection over the Maritime Continent (MC), and the tropical eastern IO and suppressed convection over tropical central and eastern PO. The enhanced convection over MC and tropical eastern IO causes a positive diabatic heating anomaly. According to Gill’s solution (Gill 1980), as a Rossby wave response to the equatorial heating, an anomalous cyclonic couplet is excited around 120°E at both sides of the equator with westerly anomalies over the equatorial Indian Ocean. This circula-tion anomaly persists from January to April. The enhanced westerly over equatorial Indian Ocean and cyclonic anomaly over SCS and Philippine Sea are corresponding to enhanced rainfall (westerly) over tropics and weakened western North Pacific subtropical High in the climatological monthly mean evolution of circulation as shown in Fig. 1. Thus, the enhanced convection over the northern IO and MC along with the anomalous westerlies over the southern flank of cyclonic anomaly in SCS favors the early onset of SCSSM.
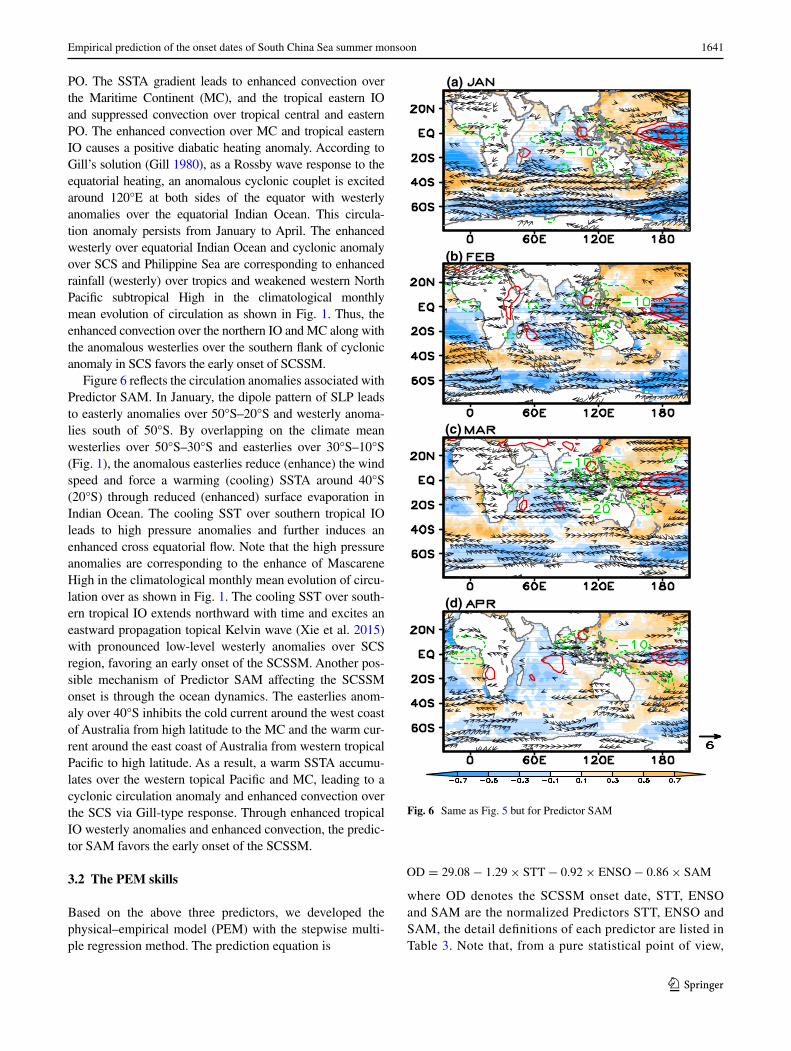
Figure 6 reflects the circulation anomalies associated with Predictor SAM. In January, the dipole pattern of SLP leads to easterly anomalies over 50°S–20°S and westerly anoma-lies south of 50°S. By overlapping on the climate mean westerlies over 50°S–30°S and easterlies over 30°S–10°S (Fig. 1), the anomalous easterlies reduce (enhance) the wind speed and force a warming (cooling) SSTA around 40°S (20°S) through reduced (enhanced) surface evaporation in Indian Ocean. The cooling SST over southern tropical IO leads to high pressure anomalies and further induces an enhanced cross equatorial flow. Note that the high pressure anomalies are corresponding to the enhance of Mascarene High in the climatological monthly mean evolution of circu-lation over as shown in Fig. 1. The cooling SST over south-ern tropical IO extends northward with time and excites an eastward propagation topical Kelvin wave (Xie et al. 2015) with pronounced low-level westerly anomalies over SCS region, favoring an early onset of the SCSSM. Another pos-sible mechanism of Predictor SAM affecting the SCSSM onset is through the ocean dynamics. The easterlies anom-aly over 40°S inhibits the cold current around the west coast of Australia from high latitude to the MC and the warm cur-rent around the east coast of Australia from western tropical Pacific to high latitude. As a result, a warm SSTA accumu-lates over the western topical Pacific and MC, leading to a cyclonic circulation anomaly and enhanced convection over the SCS via Gill-type response. Through enhanced tropical IO westerly anomalies and enhanced convection, the predic-tor SAM favors the early onset of the SCSSM.
3.2 The PEM skills
Based on the above three predictors, we developed the physical–empirical model (PEM) with the stepwise multi-ple regression method. The prediction equation is
where OD denotes the SCSSM onset date, STT, ENSO and SAM are the normalized Predictors STT, ENSO and SAM, the detail definitions of each predictor are listed in Table 3. Note that, from a pure statistical point of view,
OD = 29.08− 1.29× STT− 0.92× ENSO− 0.86× SAM
(a)
(b)
(c)
(d)
Fig. 6 Same as Fig. 5 but for Predictor SAM
1642 Z. Zhu, T. Li
1 3
in a regression model, according a “rule of thumb”, 10–15 observations per term in multiple linear regres-sions is reasonably good (Babyak 2004). Thus, for a 30–40 years sample size, three predictors should be most suitable.
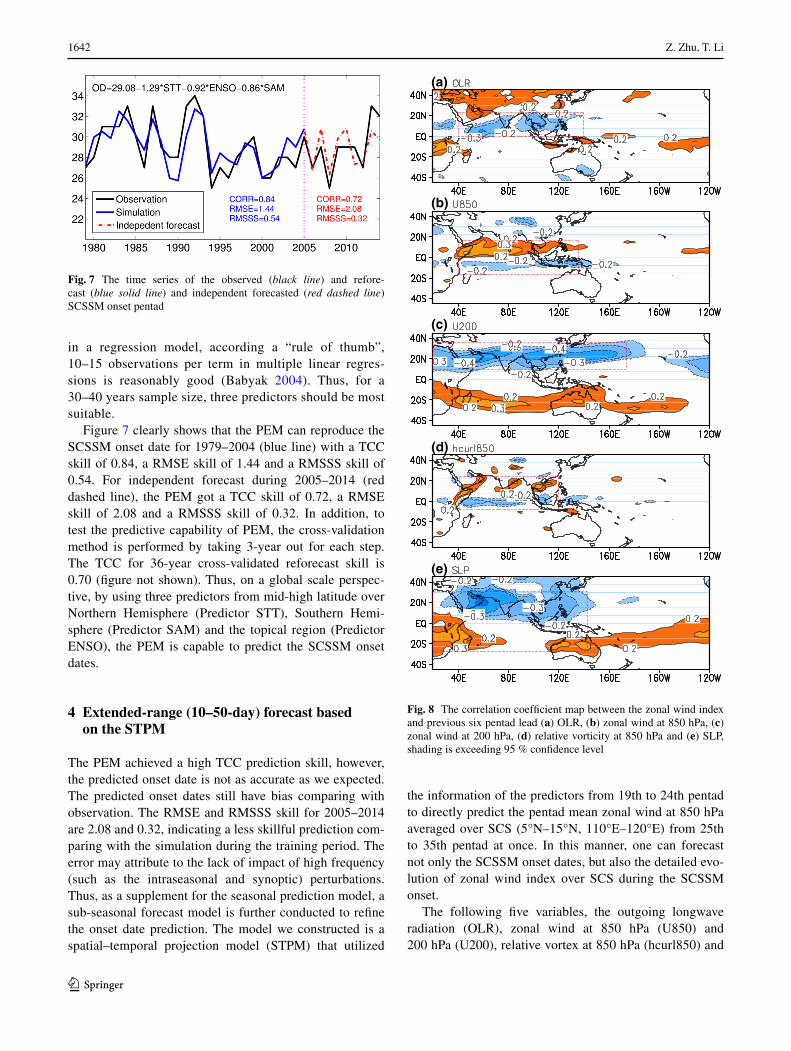
Figure 7 clearly shows that the PEM can reproduce the SCSSM onset date for 1979–2004 (blue line) with a TCC skill of 0.84, a RMSE skill of 1.44 and a RMSSS skill of 0.54. For independent forecast during 2005–2014 (red dashed line), the PEM got a TCC skill of 0.72, a RMSE skill of 2.08 and a RMSSS skill of 0.32. In addition, to test the predictive capability of PEM, the cross-validation method is performed by taking 3-year out for each step. The TCC for 36-year cross-validated reforecast skill is 0.70 (figure not shown). Thus, on a global scale perspec-tive, by using three predictors from mid-high latitude over Northern Hemisphere (Predictor STT), Southern Hemi-sphere (Predictor SAM) and the topical region (Predictor ENSO), the PEM is capable to predict the SCSSM onset dates.
4 Extended‑range (10–50‑day) forecast based on the STPM
The PEM achieved a high TCC prediction skill, however, the predicted onset date is not as accurate as we expected. The predicted onset dates still have bias comparing with observation. The RMSE and RMSSS skill for 2005–2014 are 2.08 and 0.32, indicating a less skillful prediction com-paring with the simulation during the training period. The error may attribute to the lack of impact of high frequency (such as the intraseasonal and synoptic) perturbations. Thus, as a supplement for the seasonal prediction model, a sub-seasonal forecast model is further conducted to refine the onset date prediction. The model we constructed is a spatial–temporal projection model (STPM) that utilized
the information of the predictors from 19th to 24th pentad to directly predict the pentad mean zonal wind at 850 hPa averaged over SCS (5°N–15°N, 110°E–120°E) from 25th to 35th pentad at once. In this manner, one can forecast not only the SCSSM onset dates, but also the detailed evo-lution of zonal wind index over SCS during the SCSSM onset.
The following five variables, the outgoing longwave radiation (OLR), zonal wind at 850 hPa (U850) and 200 hPa (U200), relative vortex at 850 hPa (hcurl850) and
Fig. 7 The time series of the observed (black line) and refore-cast (blue solid line) and independent forecasted (red dashed line) SCSSM onset pentad
(a)
(b)
(c)
(d)
(e)
Fig. 8 The correlation coefficient map between the zonal wind index and previous six pentad lead (a) OLR, (b) zonal wind at 850 hPa, (c) zonal wind at 200 hPa, (d) relative vorticity at 850 hPa and (e) SLP, shading is exceeding 95 % confidence level
1643Empirical prediction of the onset dates of South China Sea summer monsoon
1 3
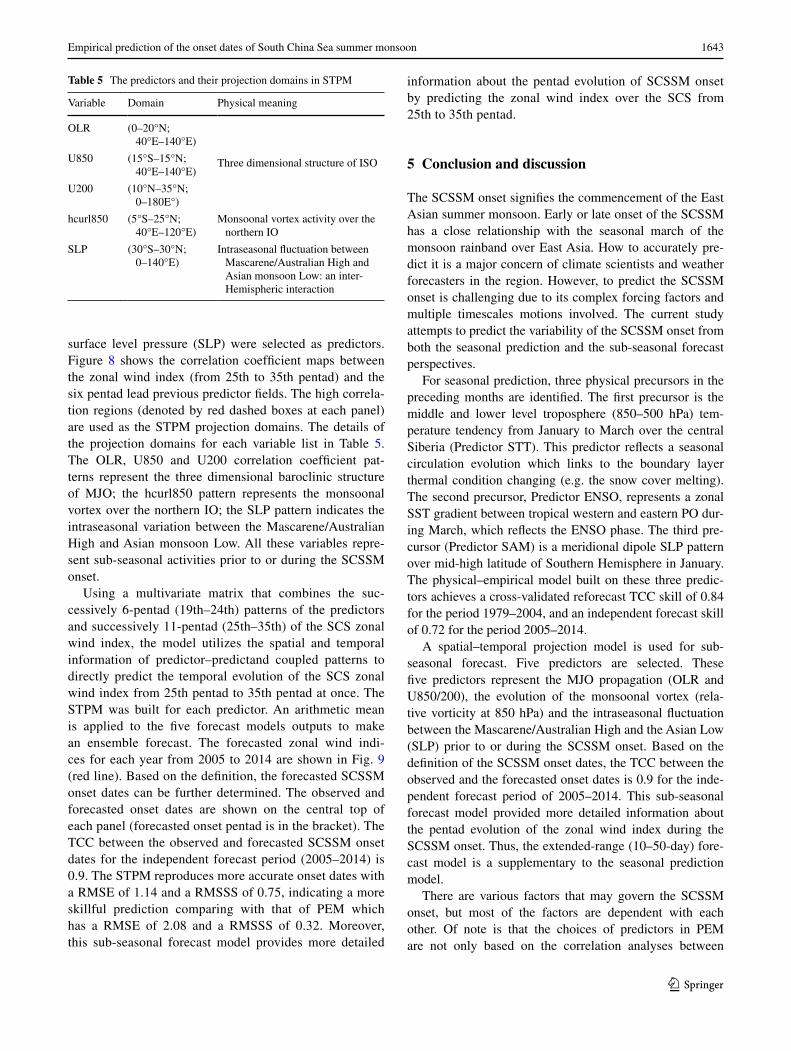
surface level pressure (SLP) were selected as predictors. Figure 8 shows the correlation coefficient maps between the zonal wind index (from 25th to 35th pentad) and the six pentad lead previous predictor fields. The high correla-tion regions (denoted by red dashed boxes at each panel) are used as the STPM projection domains. The details of the projection domains for each variable list in Table 5. The OLR, U850 and U200 correlation coefficient pat-terns represent the three dimensional baroclinic structure of MJO; the hcurl850 pattern represents the monsoonal vortex over the northern IO; the SLP pattern indicates the intraseasonal variation between the Mascarene/Australian High and Asian monsoon Low. All these variables repre-sent sub-seasonal activities prior to or during the SCSSM onset.
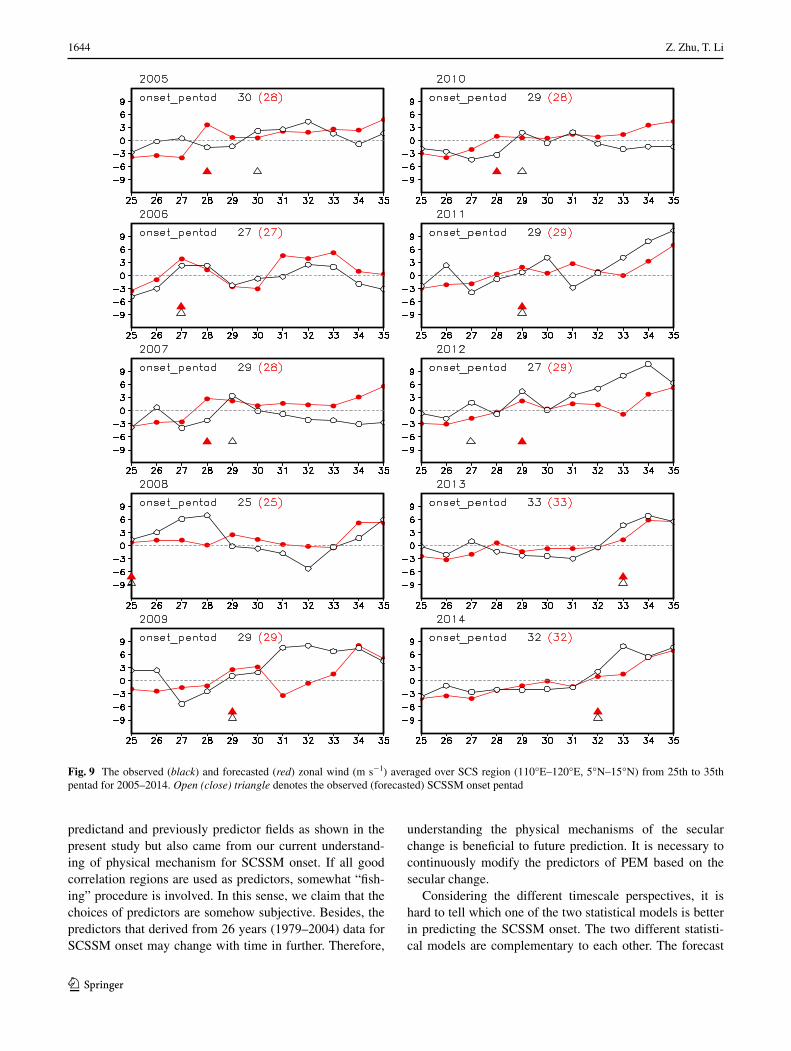
Using a multivariate matrix that combines the suc-cessively 6-pentad (19th–24th) patterns of the predictors and successively 11-pentad (25th–35th) of the SCS zonal wind index, the model utilizes the spatial and temporal information of predictor–predictand coupled patterns to directly predict the temporal evolution of the SCS zonal wind index from 25th pentad to 35th pentad at once. The STPM was built for each predictor. An arithmetic mean is applied to the five forecast models outputs to make an ensemble forecast. The forecasted zonal wind indi-ces for each year from 2005 to 2014 are shown in Fig. 9 (red line). Based on the definition, the forecasted SCSSM onset dates can be further determined. The observed and forecasted onset dates are shown on the central top of each panel (forecasted onset pentad is in the bracket). The TCC between the observed and forecasted SCSSM onset dates for the independent forecast period (2005–2014) is 0.9. The STPM reproduces more accurate onset dates with a RMSE of 1.14 and a RMSSS of 0.75, indicating a more skillful prediction comparing with that of PEM which has a RMSE of 2.08 and a RMSSS of 0.32. Moreover, this sub-seasonal forecast model provides more detailed
information about the pentad evolution of SCSSM onset by predicting the zonal wind index over the SCS from 25th to 35th pentad.
5 Conclusion and discussion
The SCSSM onset signifies the commencement of the East Asian summer monsoon. Early or late onset of the SCSSM has a close relationship with the seasonal march of the monsoon rainband over East Asia. How to accurately pre-dict it is a major concern of climate scientists and weather forecasters in the region. However, to predict the SCSSM onset is challenging due to its complex forcing factors and multiple timescales motions involved. The current study attempts to predict the variability of the SCSSM onset from both the seasonal prediction and the sub-seasonal forecast perspectives.
For seasonal prediction, three physical precursors in the preceding months are identified. The first precursor is the middle and lower level troposphere (850–500 hPa) tem-perature tendency from January to March over the central Siberia (Predictor STT). This predictor reflects a seasonal circulation evolution which links to the boundary layer thermal condition changing (e.g. the snow cover melting). The second precursor, Predictor ENSO, represents a zonal SST gradient between tropical western and eastern PO dur-ing March, which reflects the ENSO phase. The third pre-cursor (Predictor SAM) is a meridional dipole SLP pattern over mid-high latitude of Southern Hemisphere in January. The physical–empirical model built on these three predic-tors achieves a cross-validated reforecast TCC skill of 0.84 for the period 1979–2004, and an independent forecast skill of 0.72 for the period 2005–2014.
A spatial–temporal projection model is used for sub-seasonal forecast. Five predictors are selected. These five predictors represent the MJO propagation (OLR and U850/200), the evolution of the monsoonal vortex (rela-tive vorticity at 850 hPa) and the intraseasonal fluctuation between the Mascarene/Australian High and the Asian Low (SLP) prior to or during the SCSSM onset. Based on the definition of the SCSSM onset dates, the TCC between the observed and the forecasted onset dates is 0.9 for the inde-pendent forecast period of 2005–2014. This sub-seasonal forecast model provided more detailed information about the pentad evolution of the zonal wind index during the SCSSM onset. Thus, the extended-range (10–50-day) fore-cast model is a supplementary to the seasonal prediction model.
There are various factors that may govern the SCSSM onset, but most of the factors are dependent with each other. Of note is that the choices of predictors in PEM are not only based on the correlation analyses between
Table 5 The predictors and their projection domains in STPM
Variable Domain Physical meaning
OLR (0–20°N; 40°E–140°E)
U850 (15°S–15°N; 40°E–140°E)
Three dimensional structure of ISO
U200 (10°N–35°N; 0–180E°)
hcurl850 (5°S–25°N; 40°E–120°E)
Monsoonal vortex activity over the northern IO
SLP (30°S–30°N; 0–140°E)
Intraseasonal fluctuation between Mascarene/Australian High and Asian monsoon Low: an inter-Hemispheric interaction
1644 Z. Zhu, T. Li
1 3
predictand and previously predictor fields as shown in the present study but also came from our current understand-ing of physical mechanism for SCSSM onset. If all good correlation regions are used as predictors, somewhat “fish-ing” procedure is involved. In this sense, we claim that the choices of predictors are somehow subjective. Besides, the predictors that derived from 26 years (1979–2004) data for SCSSM onset may change with time in further. Therefore,
understanding the physical mechanisms of the secular change is beneficial to future prediction. It is necessary to continuously modify the predictors of PEM based on the secular change.
Considering the different timescale perspectives, it is hard to tell which one of the two statistical models is better in predicting the SCSSM onset. The two different statisti-cal models are complementary to each other. The forecast
Fig. 9 The observed (black) and forecasted (red) zonal wind (m s−1) averaged over SCS region (110°E–120°E, 5°N–15°N) from 25th to 35th pentad for 2005–2014. Open (close) triangle denotes the observed (forecasted) SCSSM onset pentad
1645Empirical prediction of the onset dates of South China Sea summer monsoon
1 3
methods and models proposed here are expected to facili-tate real-time prediction of the SCSSM onset.
Acknowledgments The authors would like to thank two anonymous reviewers for their constructive comments and suggestions. We also thank NCC and ITMM for providing the onset dates of SCSSM. This work was supported by China National 973 project 2015CB453200, ONR grant N00014-16-12260, NSFC grant 41475084, Jiangsu Natu-ral Science Foundation Key project (BK20150062), Jiangsu Shuang-Chuang Team (R2014SCT001), and the Priority Academic Program Development of Jiangsu Higher Education Institutions (PAPD). This is SOEST contribution number 9626, IPRC contribution Number 1189, and ESMC Number 106.
References
Adler RF, Huffman GJ, Chang A, Ferraro R, Xie P-P, Janowiak J, Rudolf B, Schneider U, Curtis S, Bolvin D, Gruber A, Susskind J, Arkin P, Nelkin E (2003) The version-2 global precipitation climatology project (GPCP) monthly precipitation analysis (1979 present). J Hydrometeorol 4:1147–1167
Babyak MA (2004) What you see may not be what you get: a brief, nontechnical introduction to overfitting in regression-type mod-els. Psychosom Med 66:411–421
Chang CP, Chen GTJ (1995) Tropical circulations associated with southwest monsoon onset and westerly surges over the South China Sea. Mon Weather Rev 123:3254–3267
Dee DP et al (2011) The ERA-Interim reanalysis: configuration and performance of the data assimilation system. Q J R Meteorol Soc 137:553–597
DelSole T, Shukla J (2012) Climate models produce skillful predic-tions of Indian summer monsoon rainfall. Geophys Res Lett 39:L09703
Ding Y, Chan JCL (2005) The East Asian summer monsoon: an over-view. Meteorol Atmos Phys 89:117–142
Ding Q, Steig EJ, Battisti DS, Wallace JM (2012) Influence of the tropics on the Southern Annular Mode. J Clim 25:6330–6348
Gill AE (1980) Some simple solutions for heat induced tropical circu-lations. Q J R Meteorol Soc 106:447–462
He J, Zhu Z (2015) The relation of South China Sea monsoon onset with the subsequent rainfall over the subtropical East Asia. Int J Climatol 35:4547–4556
Kalnay E et al (1996) The NCEP/NCAR 40-year reanalysis project. Bull Am Meteorol Soc 77:437–471
Kanamitsu M, Ebisuzaki W, Woollen J, Yang SK, Hnilo JJ, Fiorino M, Potter GL (2002) NCEP–DOE AMIP-II reanalysis (R-2). Bull Am Meteorol Soc 83:1631–1643
Krishnamurti TN (1985) Summer monsoon experiment—a review. Mon Weather Rev 113:1590–1626
Krishnamurti TN, Ardanuy P, Ramanathan Y, Pasch R (1981) On the onset vortex of the summer monsoon. Mon Weather Rev 109:344–363
Kwon M, Jhun J-G, Wang B, An S-I, Kug J-S (2005) Decadal change in relationship between East Asian and WNP summer monsoons. Geophys Res Lett 32:L16709. doi:10.1029/2005gl023026
Lau KM, Yang S (1997) Climatology and interannual variability of the Southeast Asian summer monsoon. Adv Atmos Sci 14:141–162
Li K, Yu W, Li T, Murty VSN, Khokiattiwong S, Adi TR, Budi S (2013) Structures and mechanisms of the first-branch
northward-propagating intraseasonal oscillation over the tropical Indian Ocean. Clim Dyn 40:1707–1720
Liebmann B, Smith CA (1996) Description of a complete (interpo-lated) outgoing longwave radiation dataset. Bull Am Meteorol Soc 77:1275–1277
Murakami T (1980) Empirical orthogonal function analysis of satel-lite-observed outgoing longwave radiation during summer. Mon Weather Rev 108:205–222
Rayner NA et al (2003) Global analyses of sea surface temperature, sea ice, and night marine air temperature since the late nine-teenth century. J Geophys Res 108:4407
Wang B, LinHo (2002) Rainy season of the Asian–Pacific summer monsoon. J Clim 15:386–398
Wang B, Wu R, Fu X (2000) Pacific-East Asian teleconnection: how does ENSO affect East Asian climate? J Clim 13:1517–1536
Wang B, LinHo Zhang Y, Lu MM (2004) Definition of South China Sea monsoon onset and commencement of the East Asia Sum-mer Monsoon. J Clim 17:699–710
Wang B, Huang F, Wu Z, Yang J, Fu X, Kikuchi K (2009) Multi-scale climate variability of the South China Sea monsoon: a review. Dyn Atmos Oceans 47:15–37
Wang B, Liu J, Kim H-J, Webster PJ, Yim S-Y, Xiang B (2013) Northern Hemisphere summer monsoon intensified by mega-El Niño/southern oscillation and Atlantic multidecadal oscillation. PNAS 110:5347–5352
Wang B, Xiang B, Li J, Webster PJ, Rajeevan MN, Liu J, Ha K-J (2015) Rethinking Indian monsoon rainfall prediction in the context of recent global warming. Nat Commun 6:7154. doi:10.1038/ncomms8154
Wu G, Zhang Y (1998) Tibetan plateau forcing and the timing of the monsoon onset over South Asia and the South China Sea. Mon Weather Rev 126:913–927
Wu G, Guan Y, Liu Y, Yan J, Mao J (2012a) Air–sea interaction and formation of the Asian summer monsoon onset vortex over the Bay of Bengal. Clim Dyn 38:261–279
Wu G, Liu Y, He B, Bao Q, Duan A, Jin F (2012b) Thermal controls on the Asian summer monsoon. Sci Rep 2:1–7
Xiang B, Wang B (2012) Mechanisms for the advanced Asian Summer Monsoon onset since the mid-to-late 1990s. J Clim 26:1993–2009
Xiang B, Wang B, Li T (2013) A new paradigm for the predominance of standing Central Pacific warming after the late 1990s. Clim Dyn 4:327–340
Xie SP, Kosaka Y, Du Y, Huang G (2015) Indo-western Pacific ocean capacitor and coherent climate anomalies in post-ENSO sum-mer: a review. Adv Atmos Sci. doi:10.1007/s00376-015-5192-6
Zhang Y, Li T, Wang B, Wu G (2002) Onset of the Summer Monsoon over the Indochina Peninsula: climatology and interannual varia-tions. J Clim 15:3206–3221
Zhou WJ, Chan CL (2007) ENSO and the South China Sea summer monsoon onset. Int J Climatol 27:157–167
Zhu Z, He J (2013) The vortex over Bay of Bengal and its relationship with the outbreak of South China Sea summer monsoon. J Trop Meteor (in Chinese) 29:915–923
Zhu Z, Li T (2016) The statistical extended-range (10–30-day) fore-cast of summer rainfall anomalies over the entire China. Clim Dyn. doi:10.1007/s00382-016-3070-2
Zhu Z, Li T, Hsu P-C, He J (2015) A spatial–temporal projection model for extended-range forecast in the tropics. Clim Dyn 45:1085–1098