Embed Size (px)
Citation preview

!"#$%$&'()!*$+,-&,)./'.)0,&($-$-1)2#,&$,3)0$*,%3$.4)5'4)6(.,%)./,)7,%89%"'-&,)98):,%%,3.%$'(!&9343.,"36;./9%<3=>)2/'/$+)?',,"@)A$-+3,4)BC):/9"#39-@)2/'%9-)7C)A'D(,%@)B9/-)EC)A'D.9-@)F$&/'%+5C)G99+8$-29;%&,>)7/$(939#/$&'():%'-3'&.$9-3>)H$9(91$&'()2&$,-&,3@)I9(C)JKL@)?9C)MJNM)<O,PC)NQ@)MRRS=@)##CNKRTNUN7;P($3/,+)P4>):/,)F94'()29&$,.42.'P(,)VFA>)http://www.jstor.org/stable/55946
6&&,33,+>)WRXMWXNWWR)MU>JL
Your use of the JSTOR archive indicates your acceptance of JSTOR's Terms and Conditions of Use, available at
http://www.jstor.org/page/info/about/policies/terms.jsp. JSTOR's Terms and Conditions of Use provides, in part, that unless
you have obtained prior permission, you may not download an entire issue of a journal or multiple copies of articles, and you
may use content in the JSTOR archive only for your personal, non-commercial use.
Please contact the publisher regarding any further use of this work. Publisher contact information may be obtained at
http://www.jstor.org/action/showPublisher?publisherCode=rsl.
Each copy of any part of a JSTOR transmission must contain the same copyright notice that appears on the screen or printed
page of such transmission.
JSTOR is a not-for-profit service that helps scholars, researchers, and students discover, use, and build upon a wide range of
content in a trusted digital archive. We use information technology and tools to increase productivity and facilitate new forms
of scholarship. For more information about JSTOR, please contact [email protected].
The Royal Society is collaborating with JSTOR to digitize, preserve and extend access to PhilosophicalTransactions: Biological Sciences.
http://www.jstor.org

Empirical evidence that declining species diversity may alter the performance of terrestrial ecosystems
SHAHID NAEEM*, LINDSEYJ. THOMPSON, SHARON P. LAWLER?,
JOHN H. LAWTON AND RICHARD M. WOODFIN
NERC Centre for Population Biology, Imperial College at Silwood Park, Ascot, Berkshire SL5 7PY, U.K.
SUMMARY
We examined experimentally the association between species diversity and ecosystem processes in a series
of terrestrial mesocosms. We developed and maintained 14 mesocosms whose biota were assembled from
a single pool of plant and animal species and whose environmental conditions were identically controlled.
Each community contained four trophic levels: primary producers (annual herbs), consumers
(herbivorous molluscs and phloem sucking insects), secondary consumers (parasitoids) and decomposers
(earthworms, Collembola and microbes). All mesocosms received the same diurnal pattern of light,
temperature, relative humidity and water. The initial volume of soil, soil structure, composition, nutrient
content and inocula of both soil microbes and nematodes were also identical among replicates. The only
experimentally manipulated factor was the number of plant and animal species within each trophic level.
High, medium and low diversity communities had nine, 15 or 31 plant and animal species, respectively. We measured five ecosystem processes as response variables in these mesocosms over the course of 206
days: (i) community respiration; (ii) productivity; (iii) decomposition; (iv) nutrient retention; and (v) water retention.
The manipulation of diversity produced communities that differed significantly in their ecosystem
processes. Our results provide the first evidence (obtained by a direct manipulation of diversity under
controlled environmental conditions) that ecosystem processes may be affected by loss of diversity.
1. INTRODUCTION
Biological communities and their associated chemical
and physical processes are collectively referred to as
ecosystems (Tansely 1935; Odum 1971, 1993). Within
ecosystems, physical and chemical processes governed
by biological activities are known variously as eco-
system processes (Odum 1993), biogeochemical pro- cesses (reviewed in Schlesinger 1991), ecosystem functions (reviewed in Schulze & Mooney 1993) or,
anthropocentrically, as ecosystem services (e.g. Ehrlich
& Wilson 1991). Species within an ecosystem can be
divided either into functional groups defined by a
commonality of biogeochemical activities among group members or into trophic groups defined by a com-
monality of resource use by group members. These
species groups contribute both to the gross flow of
energy through, and the cycling of nutrients within an
ecosystem. The loss of a functional group (e.g. all
nitrogen fixers) or trophic group (e.g. all primary
producers) would clearly alter the biogeochemical
processes of an ecosystem. What is less clear, however,
* Current Address: Department of Ecology, Evolution and
Behavior, University of Minnesota, 100 Ecology Building, 1987
Upper Buford Circle, St. Paul, Minnesota 55108, U.S.A.
? Current Address: Morgan School of Biological Sciences, Uni-
versity of Kentucky, Lexington, Kentucky 40506, U.S.A.
Phil. Trans. R. Soc. Lond. B (1995) 347, 249-262 Printed in Great Britain
is whether the loss of a few or a fraction of the species within a functional or trophic group also affects the
biogeochemical performance of an ecosystem. Soule (1991) estimated that as much as 50 % of
biotic diversity will be lost in the next century as a
direct result of activities associated with human
expansion. Although exact numbers and timescales for
extinctions are difficult to derive (Lawton & May
1995), it is well documented that biodiversity - species richness and community complexity - is declining in
the face of human expansion (Wilson & Peter 1988;
Groombridge 1992). Global declines in biotic diversity
imply that the world's ecosystems are losing species,
posing the question: 'will depauperate, but never-
theless intact, ecosystems (containing primary pro-
ducers, consumers and decomposers) perform
differently from the more species-rich systems from
which they are derived?'
Considerable experimental research has been de-
voted to the understanding of the factors which control
diversity in ecosystems (Ricklefs & Schluter 1993)
beginning with the early work on distribution and
abundance of Elton (1927) to the more recent syntheses of the 1970s and 1980s (Cody & Diamond 1975; Price
et al. 1984; Strong et al. 1984; Diamond & Case 1986;
Kikkawa & Anderson 1986; Gee & Giller 1987).
Similarly, research has been centred on the under-
? 1995 The Royal Society 249

250 S. Naeem and others Species diversity and ecosystem processes
4-
/ ,-
species richness
Figure 1. Hypothetical relations between species diversity
(richness) and the level of expression of an ecosystem process, such as community respiration, community productivity or
rate of decomposition. Dashed line, 'redundant species'
hypothesis; dot-dashed line, 'rivet' hypothesis; solid line,
'idiosyncratic response' hypothesis; dotted line, 'null' hy-
pothesis. The point of conversion to the right of the figure
represents current level of species richness, not necessarily the
maximum richness possible in a community.
secondary consumers I
l i _
primary consumers
primary producers
decomposers
high medium low
Figure 2. Schematic representation of the Ecotron ex-
periment. The experiment consisted of terrestrial communi-
ties that were either 'high', 'medium', or 'low' in species
diversity (numbers of species and biotic complexity). Circles
represent individual species present in the different types of
communities (see table 1). Shading of circles illustrates nested
heirarchy of species representation in each community. Filled
circles indicate species in all communities, grey circles indicate species only in high and medium diversity and open circles indicate species only in high diversity communities.
Thus, communities to the right represent increasingly
depauperate versions of communities on their left. Lines
indicate biotic interactions among the species (for clarity, not all interactions are shown). Boxes indicate trophic levels. Note that each community contained species in all four
trophically defined functional groups, irrespective of the total number of species in each community (from Naeem et al.
1994).
standing of nutrient and energy flows (Odum 1993),
beginning with the early work of Lindeman (1942) to
more modern syntheses (e.g. Margalef 1968; Odum
1971; De Angelis 1992). Recent reviews of the
literature (Mooney & Schulze 1993) show, however, that less attention has been paid to how these changes in diversity are associated with changes in nutrient and
energy flow.
From the limited literature available on the subject, four hypotheses summarize the possible general
responses of ecosystems to declining species diversity.
The first hypothesis, the 'redundant species' hypoth-
esis, suggests that there is a minimum diversity
necessary for ecosystem function but beyond that, most
species are redundant in their roles (Lawton & Brown
1993). A second, contrasting view is the 'rivet'
hypothesis which suggests that species are largely
unique in their contribution to ecosystem performance
(Ehrlich & Ehrlich 1981). This hypothesis likens
species to the rivets holding together a complex machine and postulates that the function of an
ecosystem will be altered or impaired as its rivets
(species) fall out. A third view, the 'idiosyncratic
response' hypothesis suggests that ecosystem processes
change when diversity changes but that the response is
unpredictable. Finally, the 'null' hypothesis is that
ecosystem functions (i.e. processes) are insensitive to
species deletions or additions (Vitousek & Hooper
1993). Although these hypotheses are general, serving as primarily heuristic devices to facilitate scientific
discourse, they are nevertheless testable because each
predicts a specific relation between diversity and
ecosystem function (see figure 1). There are currently no direct, empirical tests of
figure 1 in which species richness only has been
manipulated. Studies of the levels of expression of
ecosystem processes across diversity gradients created
by succession (e.g. Ewel et al. 1991), nutrient additions
(e.g. Tilman & Downing 1994) or geographic dines in
geological or climatic conditions (reviewed in
Rosenzweig & Abramsky 1993) are difficult to in-
terpret. Ecosystem responses in these studies are
correlated not only with varying levels of diversity but
also with the factor responsible for creation of the
diversity gradient in the first place (for example, successional age, nutrient level, or the temperature, rainfall and edaphic changes that occur along geo-
graphical gradients).
Ideally, a direct manipulation of diversity would
hold all other ecological factors constant while
manipulating species richness as a single experimental factor alongside replication. It would also ensure that
entire functional or trophic groups are not removed
from the experimental community. Including repre- sentatives from all major groups provides a reasonable
test of the hypotheses because there is no a priori reason
for the level of expression an ecosystem process to be
seriously impaired if all functional or trophic groups are present but species richness is altered. Response variables would be one or more ecosystem processes and population responses within functional or trophic
groups could be monitored to gain insight into possible mechanistic explanations for the observed responses.
We have provided a brief report (Naeem et al. 1994) of such an experiment: to our knowledge the ex-
periment reported here is unique. Previous experiments have either manipulated only one species group or
manipulated diversity indirectly. Intercropping experi- ments directly manipulate crop diversity in agro-
ecological experiments but they seldom manipulate more than two or three species, generally manipulating
only one trophic group, for example plant species
(Swift & Anderson 1993). Ewel etal. (1991), Tilman &
Downing (1994) and McNaughton's New York grass
Phil. Trans. R. Soc. Lond. B (1995)

Species diversity and ecosystem processes S. Naeem and others 251
experiments (1993) similarly manipulate only plant
species, manipulating diversity only indirectly. Note
that manipulations of plant and animal diversity have
a long history in community ecology (Begon et al. 1986; Ricklefs & Schluter 1993) and our experiment builds
on results from these earlier works.
We conducted the present experiment (Naem et al.
1994) using a controlled environmental facility called
the Ecotron (Lawton et al. 1993). We manipulated
species richness experimentally within trophic groups in replicate model terrestrial communities while hold-
ing all other experimental variables constant. Biotically
complex communities were constructed with species
diversity varied between them so that some replicates
represented depauperate versions of others. All
mesocosms, however, contained the same number of
trophic levels and the same initial densities of indi-
viduals in trophic groups. We monitored both eco-
system and population responses to the treatment.
Figure 2 presents a schematic summary of the
experimental design.
2. MATERIALS AND METHODS
(a) Mesocosm development and maintenance:
controlled environmental facility
The Ecotron (Lawton et al. 1993) consists of two banks
of eight chambers, each chamber measures
2 m x 2 m x 2 m. Temperature, humidity, light and
water are controlled by a computer and a 24 h diurnal
pattern without seasonality was maintained (see figure
23
u 0
I
(1) 1..
=S
m
E (U 4-
21
19
17
15
13
110
88
66 b._
66
S
44 I
22
0 0 5 10 15 20 25
time / h
Figure 3. Temperature, light and humidity profiles for the
Ecotron experiment. Shown are average temperature, light and humidity readings taken from sensors within each
chamber on a typical single day (5 September 1993).
Computer-delivered humidified air varied continuously between 57.970% during day and 70.0 % during night
(Lawton et al. 1993). Dashed line at bottom shows deviation
in chamber humidity in millibars partial pressure (m.b.p.p.) from computer set points. Peak deviation (3.70 m.b.p.p.) from computer set point occurred transiently after rain. For
clarity, humidity scale is not shown. Note that temperature rise is associated with the radiant energy from the lights in the
chamber once they come on and the sharp decrease in
temperature is associated with the coincident onsets of the
rain and dark cycles within the chambers. See text and
Lawton et al. (1993) for further detail.
3). Each mesocosm was grown in a separate chamber.
Increasingly, this type of approach (using micro- and
mesocosms) is being used to examine complex issues of
community and ecosystem ecology (e.g. Bazzaz &
Carson 1984; Drake et al. 1989; Lechowicz & Romer
1990; Leonard & Anderson 1991; Strain 1991; Oechel
et al. 1992; Korner & Arnone 1992; Diaz et al. 1993). To our knowledge, this is the first replicated, four-
trophic level experiment conducted with terrestrial
mesocosms.
Rainfall (deionized water) was delivered from an
irrigation lance 150 cm above the soil surface. The
lance provided a conical spray and lances were rotated
biweekly among chambers to reduce the effects of
individual variation in lance delivery patterns. Ir-
rigation occurred at 20h30 ('dusk' in the Ecotron)
delivering water at a rate of 1.75 1 min-1 in two, 2 min
intervals. (Intervals varied somewhat but averaged 120 s with a range of 90-135 s.) Thus, each chamber
received approximately 7 1 day1.- The soil was sterilized by methyl bromylation and
consisted of 0.1 m3 gravel topped with 0.3 m3 of 40:60
sand: Surrey loam mix (40.83 p.p.m. nitrogen, 12.45 p.p.m. phosphorus, 10.69 p.p.m. potassium)
placed in 0.4 m3 containers. Each container received
120 ml of a microbial inoculum prepared from a
Whatman number 4, 20-25 tim pore filtrate of Silwood
Park soil. This treatment also, inevitably, introduced
nematodes to all soil chambers.
The photoperiod was set at 16 h, with lights on
between 04h30 and 20h30. A gradual dusk and dawn
was simulated by varying lamp voltage over 1 h
intervals during the first (04h00) and last (20h00) hour
of each simulated day. The average light intensity at
canopy surface (1 m from lights) when the lights were
on was 300 pm s-l m-.
(b) Biotic components
Selection criteria for our species are described in
Lawton et al. (1993). The communities consisted of
four trophic species groups. Within trophic groups we
chose species that were ecologically similar in their
biology and capable of growing and reproducing under the conditions of the Ecotron. These species are
listed in table 1.
Mesocosm communities were developed in stages; the sequence of additions to soil that had been in situ for
three days was as follows. Seeds and microbes (day 1, 23 April 1993), earthworms and Collembola (day 26), snails and slugs (day 69), aphids (day 132), white flies
(day 145), whitefly predators (day 165) and aphid
predators (day 169). The experiment was terminated
on day 206.
Because of the large number of species (31), common
terms are used in our text (e.g. 'aphids' or 'plants') rather than the latin, generic or specific epithets listed
in table 1.
(i) Primary producers (plants)
All plants (see table 1) were annuals that grew
readily under the light, water and nutrient conditions
Phil. Trans. R. Soc. Lond. B (1995)

252 S. Naeem and others Species diversity and ecosystem processes
Table 1. Ecotron communities of three differing diversities
This table lists the nested sets of species in three types of communities used in this experiment. Each set of species is included in the set beneath it, for example, all comunities contain the basal species Senecio vulgaris but only community III contains Lamium purpureum.)
Herbivores,
Community Plant spp. predators Soil fauna
I Senecio vulgaris aphid, earthworms, Stellaria media Myzus ornatus Lumbricus terrestrisa
aphid parasitoid, Colembola,
Aphidius colmanii Megalothorax incertusa
Folsomia candida
snail, Helix aspersa
Slug,
Agriolimax reticulata
II (+I) Chenopodium album aphid, Collembola,
Spergula arvensis Brevicoryne brassicae Sphaeridia c.f. pumilus Cardamine hirsuta Protaphorura c.f. armata
III (+ I + II) Aphanes arvensis white fly, Collembola,
Arabidopsis thaliana Trialeuroides Proisotoma minuta
Capsella bursa-pastoris vaporariorum Pseudosineela albaa
Conyza canadensis Mesaphorura Lamium purpureum white fly parasitoid, machrochaetaa Poa annua Encarsia formosa
Sinapis arvensis
Sonchus oleraceus
Tripleurospermum inodorum
Veronica arvensis
Veronica persica
Failed to reproduce over course of experiment.
of the Ecotron (Lawton et al. 1993). These plants
require no pollinators, no special germination con-
ditions and reproduce continuously in the absence of
seasonality. They varied considerably in life form, size,
growth rates and leaf morphology. Eighty individuals
were established in each container by placing 80
patches of seeds on the soil surface according to a
Poisson distribution. This step was accomplished by
using the Poisson distribution to draw X and Y
coordinates for points on a sheet of acetate. Holes were
punched at these coordinates and the acetate laid over
the container in the chamber where seeds were to be
planted. Seeds were planted in positions marked by the
holes in the acetate sheet. Only a single species was
planted at each patch. Accordingly, the initial total
number of individual plants of each species in the
experiment fell as number of species increased. Each
patch of seedlings produced from these seeds was
weeded until one plant remained per position. Plants were censused by analysis of the tri-weekly
video recordings made from above the canopy from
day 31 to 199. However, limited video camera
resolution and overtopping by plants made reliable
identification of species from video recordings difficult.
Canopy structure was, therefore, determined by pin
sampling (Goodall 1952). We recorded the height and
species identity of each plant encountered by fine
chains dropped from 24 positions in an evenly spaced grid with the outer chains 10 cm from the container
edge. Heights were recorded in 10 cm increments from
day 60 to 189.
(ii) Primary consumers (herbivores)
Insects and molluscs were used as herbivores.
Because of their long generation time, molluscs
provided a constant level of leaf-chewing herbivory within the Ecotron (approximately 0.5 generations for
snails and 1.0 for slugs). Molluscs were introduced
periodically, once plants were mature, reaching a final
density of 20 snails and seven slugs per container. One
final census was taken at the end of the experiment. Insect herbivores were all homopteran phloem
suckers (aphids and white flies) from cultures reared at
Silwood Park. Initial densities were 50 Myzus ornatus
and 30 Brevicoryne brassicae, although M. ornatus entered
as a contaminant of some of the chambers at an earlier, unknown date. Whitefly initial densities were 50 with
an additional 30 added on day 169. Because these
insects have short generation times and fluctuate
dramatically in density they were introduced late in
the experiment. The relative abundance of insects was sampled bi-
weekly by counting all insects observed on leaves
touching chains that were suspended from the top of
the canopy to the soil surface along an evenly spaced 3 x 3 grid of points with outer chains 10 cm (or more) from the edge. More intensive sampling methods to
Phil. Trans. R. Soc. Lond. B (1995)

Species diversity and ecosystem processes S. Naeem and others 253
obtain absolute densities would have affected both
plants and animals in our mesocosms, so we restricted ourselves to determining relative abundances.
(iii) Secondary consumers (parasitoids) Predators were parasitoids of insect herbivores.
Introduced densities were 15 Aphidius colmanii (in three
sets of five) and five Encarsia formosa per container.
These were censused at the same time as the insect
herbivores (see preceding paragraph for methods) by
counting mummified, successfully parasitized hosts.
(iv) Decomposers (earthworms and Collembola) Earthworms and Collembola were used as metazoan
decomposer species and were introduced after seedlings were established to prevent earthworm casting from
damaging seedlings (Thompson et al. 1993) and to
ensure that fungi and some litter were available for
Collembola. On day 26, 49 earthworms were intro-
duced into each chamber, they were then censused (by
sifting through the entire soil contents of the containers
of each chamber) as a final count when the experiment was terminated.
Over 30 individuals per collembolan species were
introduced into each chamber on days 26 and 111.
Collembola were sampled every 3-4 weeks using 5 cm x 6.5 cm diameter soil cores (232 cm3, mean dry mass = 179 g, s.e. 6.7 g) samples and modified
Kempson bowl extractors (where ethyl alcohol was
substituted for picric acid preservative and heat was
supplied by dimmable, quartz-halogen lamps).
(c) Ecosystem processes
(i) Community respiration
This was measured as the CO2 flux in each chamber:
a PP Systems infra-red gas analyser measured CO2
chamber input and output every 15 min. Over week-
eneds, when all chamber doors were closed and the
system was isolated, readings were taken cumulatively,
every 15 min period for the entire 48 h period.
(ii) Productivity
Productivity of each mesocosm was estimated by
comparing the percent transmittance of photo-
synthetically active radiation (PAR), 400-700 nm,
through the canopy. Assuming no significant differences in individual leaf transmittance among
plant species (Monteith & Elston 1983; Nobel & Long
1985), which was confirmed as true for this study,
percent transmittance serves as a good estimator of the
leaf area index (the photosynthetic surface expanded over a given area). Percent transmittance was
measured by recording mean differences between
above and below canopy light measurements made
with a PAR Quantum Sensor light meter. A uniform
grid was used to record 24 measures per mesocosm at
bi-weekly intervals.
(iii) Decomposition
Short-term surface We used litter bags containing a 0.2 g mixture of
grasses in the genera Agrostis and Holcus with an
initial carbon to nitrogen (C:N) ratio of 35.5:1 The
plant material in these bags was sterilized using methyl- bromylation to prevent introduction of contaminant soil organisms. Six bags were placed on the soil surface of each container for four weeks from day 126-194 and
again from day 171-199.
Long-term below ground
Sets of three flat birch sticks ( 11.5 x 0.9 x 0.2 cm) were bundled using polyester thread and buried 1.5 cm below the surface. Changes in the dry mass of the central stick in the bundle was used to estimate
decomposition. The wood had an initial C:N ratio of 311:1.
(iv) Nutrient retention
Using tri-weekly chemical analyses of soil samples taken from each pot, nutrient retention was monitored. Small samples (less than 100 g) were analysed for total
nitrogen, available nitrites, nitrates, amonium, phos-
phorus and potassium by NRM Laboratories, Berkshire.
(v) Water retention
Each container was fitted with one horizontal exit
port at its base. Water outflow was measured weekly after soil had settled and vegetation had matured. Inflow was occasionally irregular due to problems with
irrigation but the randomization of treatment as-
signment to chambers prevented any treatment bias from occurring. Containers received an excess of water to ensure some runoff.
(d) Experimental design
In this experiment, the single treatment factor was
diversity with three treatment levels: high, medium, and low diversity (six, four and four replicates for each
level, respectively). High diversity mesocosms con- tained all the species listed in table 1 and an initially uniform, but unknown, number of microbial and nematode species introduced with the soil inocula. Medium and low diversity systems represented in-
creasingly depauperate versions of the high diversity mesocosms (see figure 2), each lacking species listed in table 1, parts II and III, accordingly.
Because the 16 chambers were divided into two
separate banks, each with a separate air handling unit, treatment levels were assigned equally to each bank.
Thus, the first bank contained three high-, two
medium- and two low-diversity mesocosms. The second bank also had high-, medium- and low-diversity mesocosms. In both cases these were assigned randomly to chambers within the banks.
(e) Test of robustness
The large number of possible combinations of species that can be drawn from our species pool provides a
very large number of possible more depauperate
communities, of which our experimental communities
Phil. Trans. R. Soc. Lond. B (1995)

254 S. Naeem and others Species diversity and ecosystem processes
are only a small sample. For example, for 16 species of
plants there are 120 two-species combinations, one of
which was used in the Ecotron experiment, and 4368
possible combinations of five species, again, only one of
which was used in the experiment. The particular combinations used were chosen at random and could,
by chance, give unusual results that lie well outside the
range of average performances for all possible
assemblages of these species. To determine where our particular systems lay in the
range of possibilities, we examined experimentally the
general response of a single ecosystem process - plant
productivity- to changes in diversity over a larger
diversity gradient in an auxiliary experiment. We
constructed a representative subset of the 4493 possible
plant species combinations, using 182 combinations
sampled across a log2 scaled gradient of diversity from
monocultures to full richness polycultures. The subset
included four replicates each of the 16 possible monocultures: 20, 30 and 40 replicates each of
intermediate richness polycultures of two, four and
eight species respectively; eight replicates of the
particular five species combination used in the Ecotron
medium diversity treatment; and ten replicates of full
richness (16 species) polycultures. Intermediate rich-
ness polycultures with two, four and eight species were
constructed by using a random number generator which selected species from the pool, discarding
duplicate combinations. Thus all 90 of the intermediate
polycultures were unique. Each replicate in every treatment consisted of 16 individual plants in an evenly
spaced grid, produced by in situ selective weeding of
seedlings, grown on the same soil as used in the Ecotron
experiment, in 7.5 1 pots (20 cm in diameter), placed
randomly on benches in an outdoor environmentally controlled glasshouse.
We then measured total productivity (dry mass of
above ground plant biomass for each pot) for each
combination and compared these to the specific combinations of two, five and 16 species (see table 1) used in the Ecotron.
() Stastical methods
Temporal series of measurements from the Ecotron
for census data and ecosystem processes were analysed
using repeated measures of analysis of variance
(RMANOVA). We used the MGLH module of SYSTAT
(1992) for calculating RMANOVA'S. Each diversity level
was a treatment, with six, four and four replicates per level for low, medium and high diversity systems,
respectively. The variance was partitioned into among-
group variance, within-group variance and the in-
teraction between among- and within-group effects, where 'group' refers to diversity level.
If among-group variation accounts for a significant
part of the overall variance, this indicates that different
diversity mesocosms show different mean levels of
expression of the variable over the course of the
experiment. If the within-group variation accounts for
a significant part of the overall variance, this indicates
that the mean expression of the variable changed
significantly from one point in time to the next during
the experiment. Significance in this term, however, does not indicate that high-, low- and medium-
diversity mesocosms are necessarily different. Finally, if
the interaction between among-group and within-
group variation accounts for a significant part of the
overall variance, it indicates that different diversity mesocosms show different temporal patterns of ex-
pression of the variable. (Note, that this significant result can be obtained even if among-group differences
are not significant.) Other statistical methods are
described, as appropriate, as the results are presented.
3. RESULTS
(a) Community development
(i) Primary producers
Percent cover of surface by vegetation showed a
divergence among treatments that remained constant
throughout the duration of the experiment (see table
2). Higher diversity replicates showed a significantly
greater percentage cover than lower diversity systems
(see figure 4). Chains encountered greater numbers of plants at a
greater range of heights in the higher diversity systems
(see figure 5, table 2). These results imply that higher
diversity systems filled the available space more densely than lower diversity systems.
(ii) Primary consumer
There was no difference in final adult snail
abundances among treatments (ANOVA; d.f. 2,11; p =
0.80) with final mean densities of 6.25, 7.0 and 5.67 in
high, medium and low diversity mesocosms, respect-
ively. All containers contained numerous second-
generation, immature snails but these were not
included in the census. Slugs wandered from the
16 -
12 -
a,
u
e- 0 tab a (d
u
8
4
n
20 50 80 110 140 170 200
time / days (1 = 23 April 1993)
Figure 4. Percent change in percent cover of vegetation. Each line shows the means and standard errors for measures of
percent change in percent vegetation cover as determined from the analyses of above canopy video images. Measure- ments were made on the same date at each interval, but means are shown scattered along the time axis for clarity (from Naeem et al. 1994). Circles, low diversity; triangles, medium diversity; squares, high diversity.
Phil. Trans. R. Soc. Lond. B (1995)

Species diversity and ecosystem processes S. Naeem and others 255
low medium high
,,~~~~~~~~~~~~~~~~~~~~~~~~~~~~~~~~~~~~~~~~~~~~~~~~~~~~~~~1 II c . '
> I
or 50 I O 0 1 O 0 1 O
I~~~~~~~~~~~~~~~~
L L L~ 0 50 100 0 50 100 0 50 100
plant heights / cm
Figure 5. Pin (fine chain) encounters with vegetation as a measure of canopy architecture. Shown are histograms for fine chain encounters with vegetation when lowered from grid positions above the canopy (see text for methods). Vegetation is classed in heights of 10 cm increments. For clarity, only three, evenly spaced dates are shown out of seven
possible; top = day 81, middle = day 123, and bottom = day 165.
containers into numerous regions of the chamber and
could not be retrieved. Only two chambers contained
mature, second generation slugs (one in each) by the
end of the experiment.
Myzus ornatus was the only insect herbivore
sufficiently abundant to merit statistical analysis for
treatment effects. Densities of M. ornatus were quite variable both within and among treatments (see figure
6) but did show higher densities in higher diversity mesocosms (see figure 6 and table 2). Brevicoryne
brassicae were abundant on several crucifers but our
sampling rarely encountered these plants in the high and medium diversity systems. Similarly, whitefly
populations became numerous but because of their
patchy distribution were only detected in our final
census.
(iii) Secondary consumers
Although adult parasitoids were abundant by the
end of the experiment, our sampling methods rarely
encountered these or the patchily distributed
parasitized hosts. Numerous parasitized hosts were
found by direct search and parasitoids successfully
emerged from 100% of the sample collected. Data
were too few to subject to statistical analyses.
(iv) Decomposers
Earthworms were more abundant in higher diversity
systems (ANOVA; d.f. 2,11; p < 0.05) with final mean
earthworm abundances at 16.0, 12.75 and 8.25 in the
high, medium and low diversity systems, respectively. This decline in earthworm abundance from the initial
densities is not uncommon for such mesocosm experi- ments (Thompson et al. 1993).
Collembolan abundances were variable and showed
no significant differences among treatments (ANOVA;
d.f. 2,11; p = 0.26) with final mean densities of 275.8, 578.6 and 508.7 Collembola per 100 g surface soil in
mesocosms, respectively.
(b) Ecosystem processes
(i) Community respiration
Carbon dioxide flux differed significantly among
treatments (see figure 7, table 3). Higher diversity
assemblages showed higher rates of CO2 consumption
averaged over the duration of the experiment.
(ii) Productivity
Productivity differed significantly among treatments
(see table 3). Higher diversity systems showed a higher
Phil. Trans. R. Soc. Lond. B (1995)
E Q
u 2) 2)
6CI
80
60
40
20
0
80
60
40
20
0
80
60
40
20
0
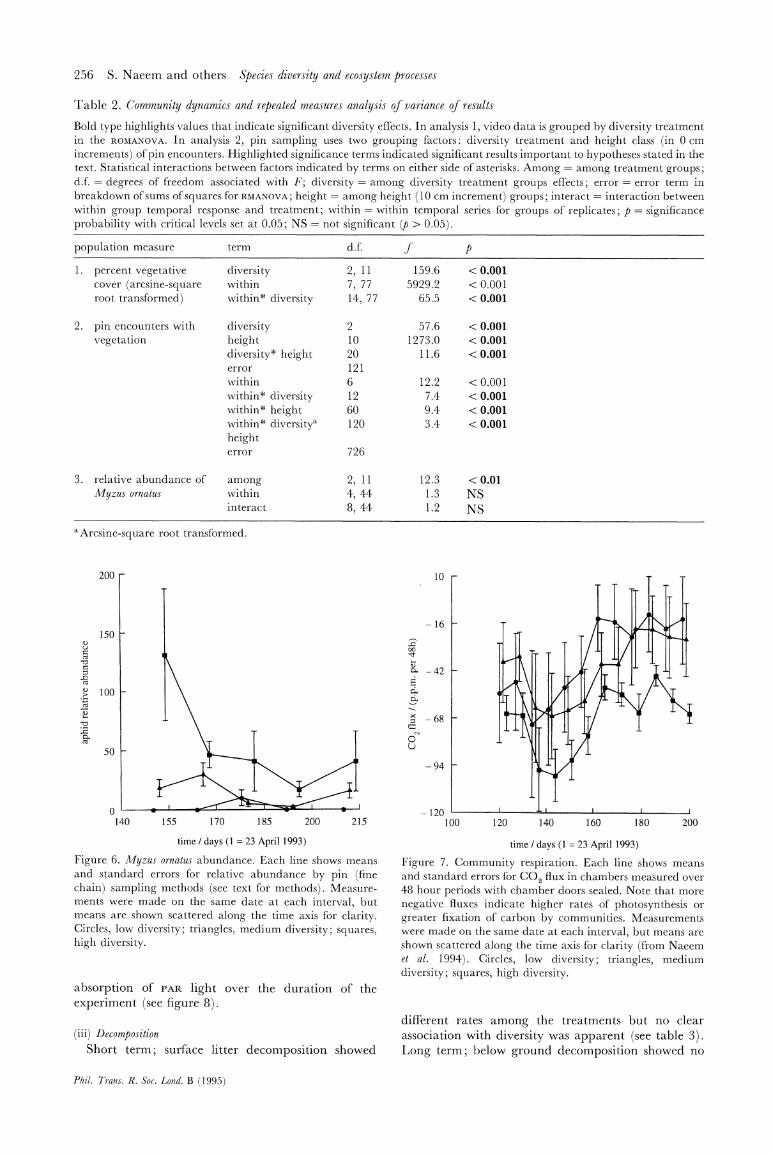
256 S. Naeem and others Species diversity and ecosystem processes
Table 2. Community dynamics and repeated measures analysis of variance of results
Bold type highlights values that indicate significant diversity effects. In analysis 1, video data is grouped by diversity treatment in the ROMANOVA. In analysis 2, pin sampling uses two grouping factors: diversity treatment and height class (in 0 cm
increments) of pin encounters. Highlighted significance terms indicated significant results important to hypotheses stated in the text. Statistical interactions between factors indicated by terms on either side of asterisks. Among = among treatment groups; d.f. = degrees of freedom associated with F; diversity = among diversity treatment groups effects; error = error term in breakdown of sums of squares for RMANOVA; height = among height (10 cm increment) groups; interact = interaction between within group temporal response and treatment; within = within temporal series for groups of replicates; p = significance probability with critical levels set at 0.05; NS = not significant (p > 0.05).
population measure term d.f. f p
1. percent vegetative diversity 2, 11 159.6 < 0.001
cover (arcsine-square within 7, 77 5929.2 < 0.001 root transformed) within* diversity 14, 77 65.5 < 0.001
2. pin encounters with diversity 2 57.6 < 0.001
vegetation height 10 1273.0 < 0.001
diversity* height 20 11.6 < 0.001
error 121 within 6 12.2 < 0.001 within* diversity 12 7.4 < 0.001 within* height 60 9.4 < 0.001 within* diversitya 120 3.4 < 0.001
height error 726
3. relative abundance of among 2, 11 12.3 < 0.01
Myzus ornatus within 4, 44 1.3 NS interact 8, 44 1.2 NS
aArcsine-square root transformed.
200
0)
cl
-ci r-
cc
03 a) -n
a. -0
.0- CO.
cO
150
100
50
0 I5 - _11I2
140 155 170 185 200 215
time / days (1 = 23 April 1993)
Figure 6. Myzus ornatus abundance. Each line shows means and standard errors for relative abundance by pin (fine chain) sampling methods (see text for methods). Measure- ments were made on the same date at each interval, but means are shown scattered along the time axis for clarity. Circles, low diversity; triangles, medium diversity; squares, high diversity.
absorption of PAR light over the duration of the
experiment (see figure 8).
(iii) Decomposition
Short term; surface litter decomposition showed
10
- 16
oo
c -42
C
x -68
-9
-194
- 120 100 120 140 160 180 200
time / days (1 = 23 April 1993)
Figure 7. Community respiration. Each line shows means and standard errors for CO2 flux in chambers measured over 48 hour periods with chamber doors sealed. Note that more
negative fluxes indicate higher rates of photosynthesis or
greater fixation of carbon by communities. Measurements were made on the same date at each interval, but means are shown scattered along the time axis for clarity (from Naeem et al. 1994). Circles, low diversity; triangles, medium
diversity; squares, high diversity.
different rates among the treatments but no clear
association with diversity was apparent (see table 3).
Long term; below ground decomposition showed no
Phil. Trans. R. Soc. Lond. B (1995)

Species diversity and ecosystem processes S. Naeem and others 257
Table 3. Ecosystem processes monitored in communities, and repeated measures analysis of variance of results
Bold type highlights values that indicate significant diversity effects. Among = among treatment groups; d.f. = degrees of
freedom associated with f; interact = interaction between within group temporal response and treatment; within = within
temporal series for groups of replicates; p = significance probability with critical level set at 0.05; NS = not significant
(p > 0.05).
statistical
analyses
Ecosystem function term d.f. f p
1. community respiration
2. decomposition short term, surface
litter
long term, below
ground, wood
3. nutrient retention
available amonium
available nitrate
available total
nitrogen
available phosphorus
available potassium
4. productivity'
5. water retention
amonga within
interact
among within
interact
among within
interact
among within
interact
among within
interact
among within
interact
among within
interact
among within
interact
among within
interact
among within
interact
2, 8
11, 88
22, 88
2, 11
1, 11
2, 11
2, 11
3, 33
6, 33
2, 25
7, 175
14, 175
2, 25
7, 175
14, 175
2, 25
7, 175
14, 175
2, 25
7, 175
14, 175
2, 25
7, 175
14, 175
2, 11
6, 66
12, 66
2, 7
10, 70
20, 70
4.5 < 0.05
0.2 NS
2.7 < 0.001
5.4
17.5
2.9
0.6
145.2
0.8
1.9
74.7
6.7
2.0
1.5
1.8
2.6
65.4
6.2
5.2
129.6
4.3
9.9
40.1
3.9
38.1
402.5
15.1
< 0.05
<0.01
NS
NS
< 0.001
NS
NS
< 0.001
< 0.001
NS
NS
< 0.05
NS
< 0.001
< 0.001
<0.05
< 0.001
< 0.001
<0.01
< 0.001
< 0.001
< 0.001
< 0.001
< 0.001
2.0 NS
8.1 < 0.001
1.8 <0.05
aArcsine square root transformed.
response to differences in diversity (see figure 9, table
3).
(iv) Nutrient retention
Figure 10 shows the results for changes for nitrogen,
phosphorus and potassium with an additional pres- entation of ammonium as part of the nitrogen response. All nutrients showed significant treatment responses
(see table 3), although only available potassium and
phosphorus showed higher retention (higher average
levels) in higher diversity systems. Total nitrogen, ammonium and nitrate showed no clear pattern of
association with the different diversity levels, although
they showed significant treatment effects (see table 3).
(v) Water retention
Problems in the computer controlled irrigation
system became apparent after day 160. We, therefore,
analysed only the first 160 days' data and found
significant treatment effects (see table 3). Neither
before or after our irrigation problems, however, did a
clear pattern of association with diversity appear (see
figure 11).
(c) Test of robustness
Productivities of plant assemblages in the auxiliary
experiment covered a wide range of possible outcomes
(see figure 12). Two replicate monocultures and one
two-species replicate were damaged and discarded,
leaving 179 replicates. The low and medium diversity combinations used in the Ecotron experiment were
unusually productive compared to alternative com-
binations and unusually similar compared with many other combinations (see figure 13). However, consistent
with the data from the Ecotron experiment, the mean
productivity of the plant assemblages is significantly
Phil. Trans. R. Soc. Lond. B (1995)

258 S. Naeem and others Species diversity and ecosystem processes
80
70
60
8 50
C E 40
- 30
20
10
0
8
Figure trasmiti
show m
Note t
transmi
Measur
means
Circles,
high di
10
8
o 0 6
io
vI 1 4
4. DISCUSSION
(a) Summary of findings
The model terrestrial ecosystems established in the
~- '~ i~/^~ 1~\^~ ~Ecotron varied in the dynamics of some of their trophic
groups and in most ecosystem processes, in association
T~~~~~\ /^~~~~ -with different levels of species richness. Higher diversity
\ i / I I systems had more dense, more complex canopies, 9 /
^ I l higher numbers of earthworms and insect herbivores,
greater rates of CO2 flux, greater productivity and
greater accumulation of phosphorus and potassium. Other variables (surface decomposition, water re-
tention, available nitrogen, ammonium and nitrates) showed temporal responses to different diversity levels
but without any consistent or clear correlation with
diversity.
S5 107 129 151 173 195 Correlations between population and community structure offer some explanation for the differences we
time / days (1 = 23 April 1993) time ( = 23 Al observed. Greater CO2 absorption and productivity
8. Community productivity as measured by percent may have occurred in higher diversity systems because tance of photosynthetically active radiation. Lines there was greater light interception in higher diversity leans and standard errors for percent transmittance. systems. Figures 4 and 5 show that the canopies of .. .. systems. Figures 4 and 5 show that the canopies of hat productivity is inversely related to percent ht p y is i y r d to p t
higher diversity systems filled more of the available .ttance, thus lower values indicate denser vegetation. aements were made on the same date at each interval; space. This is due to the greater variety of leaf forms, :ements were made on the same date at each interval; are shown scattered along the time axis for clarity, growth forms and heights of the different plants in the
low diversity; triangles, medium diversity; squares, more complex plant assemblages of the higher diversity
versity. systems, similar to both theory and observations on
'overyielding' in intercropping systems (e.g. Vandermeer 1989).
The auxiliary experiment showed that the higher
productivity of more diverse systems is a consistent
result for other combinations of these plants drawn
from the 16 species pool (see figure 13) and is not likely to be an artifact of the particular combinations we
used. Indeed, our specific low and medium diversity communities were, by chance, highly productive
systems leading us to believe that we would have found
even stronger results with other possible communities.
//
(b) Extrapolation of results to natural ecosystems
2 - The Ecotron mesocosms, although modeled on a
British ruderal community, are not meant to be exact
20 I I/ I analogues of any natural ecosystem. Because of this,
20 58 96 134 172 210 some precautions should be considered before extra-
polating these results to natural systems. time / days (1 = 23 April 1993) 1. Our experiment lasted less than a year and the
Figure 9. Rates of below surface decomposition. Lines show communities were small. Without further experimen- means and standard errors for change in weight of wood
tation, extrapolations to natural systems are necessarily (birch) sticks buried on day 20 just below the soil surface. qualitative rather than quantitative. Measurements were made on the same date at each interval;
2. Our systems are open; continuous loss of nutrients means are shown scattered along the time axis for clarity. means that successional effects account for some of the
Circles, low diversity; triangles, medium diversity; squares, change we observe. However, because most ecosystems high diversity. change we observe. However, because most ecosystems
go through succession we do not regard this as a serious
problem. 3. The developmental sequence of constructing
positively correlated with diversity (least-squares re- complex communities required the late introduction of
gression weighted by the standard deviation of the top trophic levels, dependent on the establishment of
diversity group to correct for the heterogeneity of lower levels. Although time constraints prevented us variances: d.f. 1, 169; F= 2 108.3; p < 0.001). But it from running the Ecotron mesocosms for longer, we is also clear from figure 13 that some individual believe that longer running times would only allow the monocultures and simple polycultures are more pro- different treatments to diverge further in their different ductive than the average for species rich systems. levels of expression of ecosystem processes.
Phil. Trans. R. Soc. Lond. B (1995)
-------------
e-

Species diversity and ecosystem processes S. Naeem and others 259
12 20
15 CLd
0 to 10
,-
0 5
0
12
d ci
a
.
0 I-
8
4
0
8 d
o
0 4
0
100
80
d 60
E
* 40
20
0 30 90 150 210 30 90 150 210
time / days (1 - April 23 1993) time / days (1 - April 23 1993)
Figure 0. Nutrient retention: lines show means and standard errors for changes in abundance of nitrogen (total
nitrogen and ammonium), phosphorus and potassium in soil. Circles, low diversity; triangles, medium diversity;
squares, high diversity.
7000 -
5660 -
E 4320
CZ
2980
1640 -
300 I I I I
60 80 100 120 140 160 180 200
time / days (1 = 23 April 1993)
Figure 11. Water retention: lines show means and standard
errors for volume of water collected from chambers through bottom drainage ports of containers. Measurements were
made on the same date at each interval, but means are shown
scattered along the time axis for clarity. Circles, low diversity;
triangles, medium diversity; squares, high diversity.
4. Different communities with different species may show different patterns of ecosystem response to
alterations in species diversity. 5. More ecosystem processes and population factors
could be measured in such an experiment.
Just as the limited resources of this experiment constrained us to the five measures of ecosystem
processes we chose, the small size of our mesocosms
prevented us from sampling populations in ways that
would either destroy or seriously disturb the com-
munities. For example, our insect sampling methods
had low resolution, earthworms could only be sampled at the end of the experiment and our resources did not
permit measures of possibly important factors such as
below grown productivity and nematode abundance.
Although additional information on these and other
factors might prove useful, our conclusions, that some
ecosystem processes are affected by levels of species
diversity whereas others are not, are likely to remain
unchanged by additional data.
With these caveats in mind, we offer some tentative
conclusions about natural systems which we draw from
our results.
First, a decline in species diversity within an
ecosystem can potentially alter ecosystem processes even if its trophic structure remains intact. To our
knowledge, this is the first demonstration of this
possibility via a direct manipulation of biotic diversity across four trophic levels. The large scale and long term implications of our results, however, are difficult
to extrapolate to the global scale of declining species
diversity on earth.
Second, if the decline in diversity is one in which the
space filling property of the plant assemblage is altered, then the ecosystem may perform differently, showing
Phil. Trans. R. Soc. Lond. B (1995)

260 S. Naeem and others Species diversity and ecosystem processes
1.5 -
1.0 -
0
0.5 -
0.0 VA AA SO AT LP CC CHCBPVP PA CASPA TI SM SV SIA
species
Figure 12. Species-specific plant productivities measured in a
glasshouse. Bars show means and standard errors for total
biomass (dry mass of above ground portion of plant)
produced by monocultures of the species indicated on the
bottom axis. Productivities are ranked in increasing order
from right to left. AA = Aphanes arvensis, AT = Arabidopsis thaliana, CBP = Capsella bursa-pastoris, CH = Cardamine
hirsuta, CA = Chenopodium album, CC = Conyza canadensis, LP = Lamium purpureum, PA = Poa annua, SV = Senecio vulgaris, SO = Sonchus oleraceus, SIA = Sinapis arvensis, SM = Stellaria
media, SA = Spergula arvensis, TI = Tripleurospermum inodorum, VA = Veronica arvensis, and VP = Veronica persica.
25 -
20 - . .
So
15-
E
10 E
c ? o
0 -1 0 1 2 3 4 5
log2(number of plant species)
Figure 13. Productivities of Ecotron experimental plant assemblages and randomly constructed plant assemblages grown in a glasshouse. Filled circles show means and standard errors of productivities of communities with 1, 2, 4, 8, or 16
plant species, plotted on a log2 species richness gradient. Open circles show means and standard errors for com- binations used in the Ecotron experiment, but grown in the same glasshouse conditions as those represented by closed circles. Points show actual values for each assemblage. Line is a least-squares regression line fitted to the data.
different rates of CO2 flux and plant productivity. The
relatively poor knowledge of the individual carbon
budgets of plant species in natural ecosystems and a
similarly poor knowledge of which species are likely to
go extinct in the near future, makes predicting global
change difficult. These results suggest, however, that if
the decline in diversity reflects a decline in architectural
complexity of a plant community, then that com-
munity may show similar declines in CO2 fixation
(Naeem et al. 1994).
Third, different ecosystem processes may show a
variety of responses to changes in species richness.
Some changes in the levels of expression of an
ecosystem's processes are correlated with changes in
species richness, some are insensitive and others show
idiosyncratic responses. In other words, ecosystems
undergoing declines in species richness can exhibit
patterns of association between changing levels of
expression of ecosystem processes (ecosystem function) and changing diversity that fit any of four current
hypotheses (species-redundant, rivet, idiosyncratic, or
null). No one pattern will suitably describe the breadth
of possible outcomes for one or any number of
ecosystems.
Finally, from an applied standpoint, our study
augments a growing list of reasons for conserving
species (Ehrlich & Wilson 1991; Beattie 1992, 1994; Ehrlich & Ehrlich 1992; Goombridge 1992). The list
ranges from aesthetic and moral to practical, including the conservation of economic, genetic, and agricultural resources and the ability of communities to recover
from disturbances (e.g. Tilman & Downing 1994). The
present experiment supports the addition to this list of
the possibility that loss of diversity alters the bio-
geochemical processes of ecosystems. Changes in
current biogeochemical processes attributable to
species extinction may or may not have detrimental
consequences for environmental conditions but if they
do, the irreversibility of extinction means that the
environmental change may also be irreversible.
We thank P. Small, C. Speed and D. Wildman for
engineering development and support. We thank G. Cooper, R. Crompton, A. Hawkins, J. Radley and S. Williamson for technical support and R. Jones for supervision of this
support. P. Heads, J. Grover and H. C. J. Godfray provided input on design and implementation of the experiment. We thank K. H6kansson for assistance in the supplemental greenhouse experiment. P. Greenslade identified the Collembola. Wall's Ice Cream provided the wooden sticks for
decomposition
REFERENCES
Bazzaz, F.A. & Carlson, R.W. 1984 The response of plants to elevated CO2. I. Competition among an assemblage of annuals at different levels of soil moisture. Oecologia, Berl.
62, 196-198.
Beattie, AJ. 1992 Discovering new biological resources- chance or reason? BioScience 42, 290-292.
Beattie, A.J. 1994 Conservation, evolutionary biology and the discovery of future biological resources. In Conservation
biology in Australia and Oceania (ed. C. Moritz, J. Kikkawa & D. Doley), pp. 305-312. Sydney: Surrey Beatty & Sons.
Begon, M., Harper, J.L. & Townsend, C.R. 1986. Ecology.
Phil. Trans. R. Soc. Lond. B (1995)

Species diversity and ecosystem processes S. Naeem and others 261
individuals, populations, and communities. Sunderland: Sinauer
Associates.
Cody, M.L. & Diamond, J.M. 1975 Ecology and evolution of communities. Cambridge: Belknap.
DeAngelis, D.L. 1992 Dynamics of nutrient cycling and food webs. London: Chapman and Hall.
Diamond, J. & Case, T.J. (eds) 1986 Community ecology. New York: Harper and Row.
Diaz, S., Grime, J.P., Harris, J. & McPherson, E. 1993
Evidence of a feedback mechanisms limiting plant response to elevated carbon dioxide. Nature, Lond. 364, 616-617.
Drake, B.G., Leadley, P.W., Arp, W.J., Nassing, D. &
Curtis, P.S. 1989 An open top chamber for field studies of
elevated CO2 concentration on salt marsh vegetation. Funct. Ecol. 3, 363-372.
Ehrlich, P.R. & Ehrlich, A.H. 1981 Extinction. The causes
and consequences of the disappearance of species. New York:
Random House.
Ehrlich, P.R. & Ehrlich, A.H. 1992 The value of
biodiversity. Ambio 21, 219-226.
Ehrlich, P.R. & Wilson, E.O. 1991 Biodiversity studies:
Science and policy. Science, Wash. 253, 758-762.
Elton, C.S. 1927 Animal ecology. Macmillan: New York.
Ewel, J.J., Mazzarino, MJ. & Berish, C.W. 1991 Tropical soil fertility changes under monocultures and successional
communities of different structure. Ecol. Appl. 3, 289-302.
Gee, J.H.R. & Giller, P.S. (eds) 1987 Organization of communities past and present. London: Blackwell Scientific
Publications.
Goodall, D.W. 1952 Point quadrat methods for the analysis of vegetation. Aust. J. scient. Res. series B5, 1-41.
Groombridge, B. 1992 Global biodiversity: status of the Earth's
living resources: a report compiled by the World Conservation
Monitoring Centre. London: Chapman and Hall.
Houghton, J.T., Jenkins, Gj. & Ephraums, JJ. 1990
Climate change: the IPPC scientific assessment. Cambridge
University Press.
Houghton, J.T., Callander, B.A. & Varney, S.K. 1992
Climate change 1992: the supplementary report to the IPCC
scientific assessment. Cambridge University Press.
Jones, C.G. & Lawton, J.H. 1994. Linking species and
ecosystems. New York: Chapman & Hall.
Karieva, P.M., Kingsolver, J.G. & Huey, R.B. 1993 Biotic
interactions and global change. Sunderland: Sinauer
Associates.
Kikkawa,J. & Anderson, DJ. (eds) 1986 Community ecology. London: Blackwell.
Korner, Ch. & Arnone, J. III 1992 Responses to elevated
carbon dioxide in artificial tropical ecosystems. Science, Wash. 257, 1672-1675.
Lawton, J.H. & May, R.M. (eds) 1995 Extinction rates.
Oxford University Press.
Lawton, J.H. & Brown, V.K. 1983 Redundancy in
ecosystems. In Biodiversity and ecosystem function (ed. E. D.
Schulze & H.A. Mooney), pp. 255-270. New York:
Springer Verlag.
Lawton, J.H., Naeem, S., Woodfin, R.M., Brown, V.K.,
Gange, A., Godfray, H.CJ., Heads, P.A., Lawler, S.,
Magda, D., Thomas, C. D. Thompson, LJ. & Young S.
1993 The Ecotron: a controlled environmental facility for
the investigation of population and ecosystem processes. Phil. Trans. R. Soc. Lond. B 341, 181-194.
Lechowicz, M.J. & Romer, M. 1990 The McGill Uni-
versity Phytotron: a centre for research in plant ecology. Evol. Trends Plants 4, 5-6.
Leonard, M.A. & Anderson. J.M. 1991 Growth dynamics of Collembola (Folsomia candida) and a fungus (Mucor
plumbeus) in relation to nitrogen availability in spatially
simple and complex laboratory systems. Pedobiologia 35, 163-173.
Lindeman, R.L. 1942 The trophic-dynamic aspect of
ecology. Ecology 23, 399-418.
McNaughton, S.J. 1993 Biodiversity and function of
grazing ecosystems. In Biodiversity and ecosystem function, (ed.
E. D. Schulze & H. A. Mooney), pp. 361-384. New York:
Springer Verlag. Monteith, J.L. & Elston, J. 1983 Performance and
productivity of forage in the field. In The growth and
functioning of leaves (ed. J. E. Dale & F. L. Newthorpe), pp. 499-518. Cambridge University Press.
Margalef, R. 1968 Perspectives in ecological theory. Chicago: University Press.
Naeem, S., Thompson, LJ., Lawler, S.P., Lawton, J.H. &
Woodfin, R.M. 1994. Declining biodiversity can alter the
performance of ecosystems. Nature, Lond. 368, 734-737.
Nobel, P.S. & Long, S.P. 1985. Canopy structure and light
interception. In, Techniques in bioproductivity andphotosynthesis (ed. J. Coombs, D. 0. Hall, S. 0. Long & J. M. O.
Scurlock), pp. 41-49. Oxford University Press.
Odum, E.P. 1971 Fundamentals of ecology. Philadelphia: W. B. Saunders Co.
Odum, E.P. 1993 Ideas in ecology for the 1990's. BioScience
42, 542-545.
Oechel, W.C., Riechers, G., Lawrence, W.T., Prudhomme,
T.I., Grulke, N. & Hastings, J. 1992 CO2 LT' an
automated, null-balance system for studying the effects of
elevated CO2 and global climate change on unmanaged
ecosystems. Funct. Ecol. 6, 86-100.
Peters, R.L. & Lovejoy, T.J. 1992 Global warming and
biological diversity. New Haven: Yale University Press.
Price, P.W., Slobodchikoff, C.N. & Gaud, W.S. 1984 A
new ecology: novel approaches to interactive systems. New York:
John Wiley and Sons.
Ricklefs, R.E. & Schluter, D. 1993 Species diversity: an
introduction to the problem. In Species diversity in ecological communities: historical and geographical perspectives (ed. R. E.
Ricklefs & D. Schluter), pp. 1-10. Chicago University Press.
Rosenzweig, M.L. & Abramsky, Z. 1993 How are diversity and productivity related? In Species diversity in ecological communities: historical and geographical perspectives (ed. R. E.
Ricklefs & D. Schluter), pp. 52-65. Chicago University Press.
Schlesinger, W.H. 1991 Biogeochemistry: an analysis of global
change. San Diego: Academic Press.
Schulze, E.D. & Mooney, H.A.. 1993 Biodiversity and
ecosystem function. New York: Springer Verlag. Soule, M.E. 1991 Conservation: tactics for a constant crisis.
Science, Wash. 253, 744-750
Strain, B.R. 1991 Available technologies for field ex-
perimentation with elevated CO2 in global change research. In Ecosystem experiments (ed. H. A. Mooney, E.
Medina, D. W. Schindler, E. Schulze & B. H. Walker),
pp. 245-261. New York: John Wiley and Sons.
Strong, D.R. Jr, Simberloff, D., Abele, L.G. & Thistle, A. B. (eds) 1984 Ecological communities: conceptual issues and
the evidence. Princeton University Press.
Swift, M.J. & Anderson, J.M. 1993 Biodiversity and
ecosystem function in agricultural systems. In Biodiversity and ecosystem function (ed. E. D. Schulze & H. A. Mooney)
pp. 15-41. New York: Springer Verlag. SYSTAT 1992 Systatfor Windows: Statistics, version 5 edition.
Evanston: Systat Inc.
Tansley, A.G. 1935 The use and abuse of vegetational
concepts and terms. Ecology 16, 284-307.
Thompson, L.J., Thomas, C.D., Radley, J.M., Williamson,
Phil. Trans. R. Soc. Lond. B (1995)

262 S. Naeem and others Species diversity and ecosystem processes
S. & Lawton, J.H. 1993 The effect of earthworms and
snails in a simple plant community. Oecologia, Berl. 95, 171-178.
Tilman, D.& Downing,J.A. 1994 Biodiversity and stability in grasslands. Nature, Lond. 367, 363-365.
Vandermeer,J. 1989 The ecology of intercropping. Cambridge
University Press.
Vitousek, P.M. & Hooper, D.U. 1993 Biological diversity and terrestrial ecosystem biogeochemistry. In Biodiversity
and ecosystemfunction (ed. E. D. Schulze & H. A. Mooney),
pp. 3-14. New York: Springer Verlag. Wilson, E.O. & Peter, F.M. 1988 Biodiversity. Washington,
DC: National Academy of Science.
Woodward, F.I. (ed.) 1992 The ecological consequences of
global climate change. (Adv. Ecol. Res. 22). London: Academic
Press.
Received 23 June 1994; accepted 6 October 1994
Phil. Trans. R. Soc. Lond. B (1995)


![Biodiversity and conservation Genetic diversity: within species variation (e.g corn [Zea mays] in North vs. Central America) Species diversity: species](https://img.pdfslide.us/doc/110x75/56649db45503460f94aa4ef5/biodiversity-and-conservation-genetic-diversity-within-species-variation.jpg)