Embed Size (px)
Citation preview
EMPIRED LIMITED (ASX:EPD)
BBY TMT Conference
Russell Baskerville, Managing Director
For
per
sona
l use
onl
y
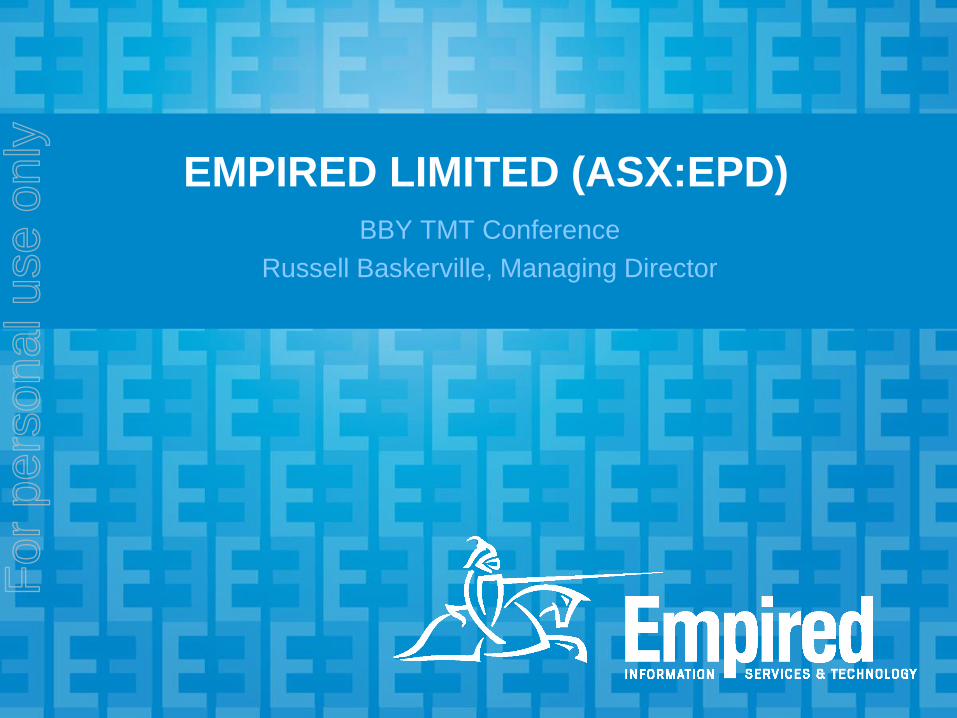
About Empired To be a high performance IT Services company delivering value through
initiative, innovation and growth
» Established 1999 – Listed Oct 2007 (ASX:EPD)
» Revenue from $4.9M to $45M over 6 years
» Employing 275+ IT professionals across Australia
» Operations in WA, VIC & QLD
» Consulting, Applications & Infrastructure
» Stable base of long term recurring revenue
» Alternative to multinationals
Ordinary Shares 67,918,049
Options (ex 25c – 40c) 2,250,000
Current Share Price $0.70
Market Capitalisation $47.5 Million
1Net Cash/(Debt) $(3) Million
2Free Float 35%
Directors & Management 30%
Top 20 62%
$m FY11 FY12 3H1 FY13
Revenue $40 $45 $26
EBITDA $1.3 $2.6 $2.3
NPAT $0.2 $1.3 $1.2
1 Net interest bearing cash / (debt) 2 Estimated 3 Underlying business performance
For
per
sona
l use
onl
y
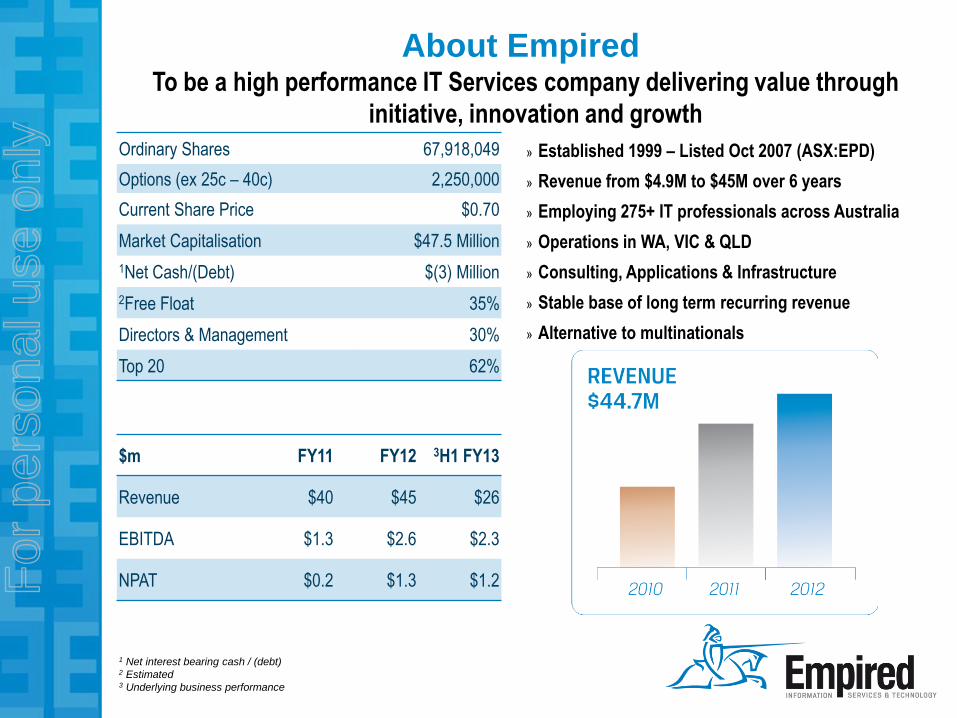
Value Proposition
Growth
• 6 Year CAGR (Revenue) of 45% - $5M to $45M in 6 years
• Solid EBITDA and Earnings growth, with significant upside potential
• Proven organic + acquisitive growth model + $17 Billion Australian Market
Diversification
• 55% Energy and Natural Resources, 25% State Government
• Infrastructure, Applications & Consulting
• Multi Year Managed Services Contracts + High Margin Project Services
Proven Track Record
• Strong, well connected and experienced management team
• Blue Chip References, 275+ staff and scalable business platform
• Currently winning and delivering multi-million dollar contracts
Blue Sky
• Unique market position and timing with $150M+ sales pipeline
• The cloud market is expected to grow from $470M in 2010 to $2B by 2015
• Earnings accretive acquisitions – Fragmented market place
For
per
sona
l use
onl
y
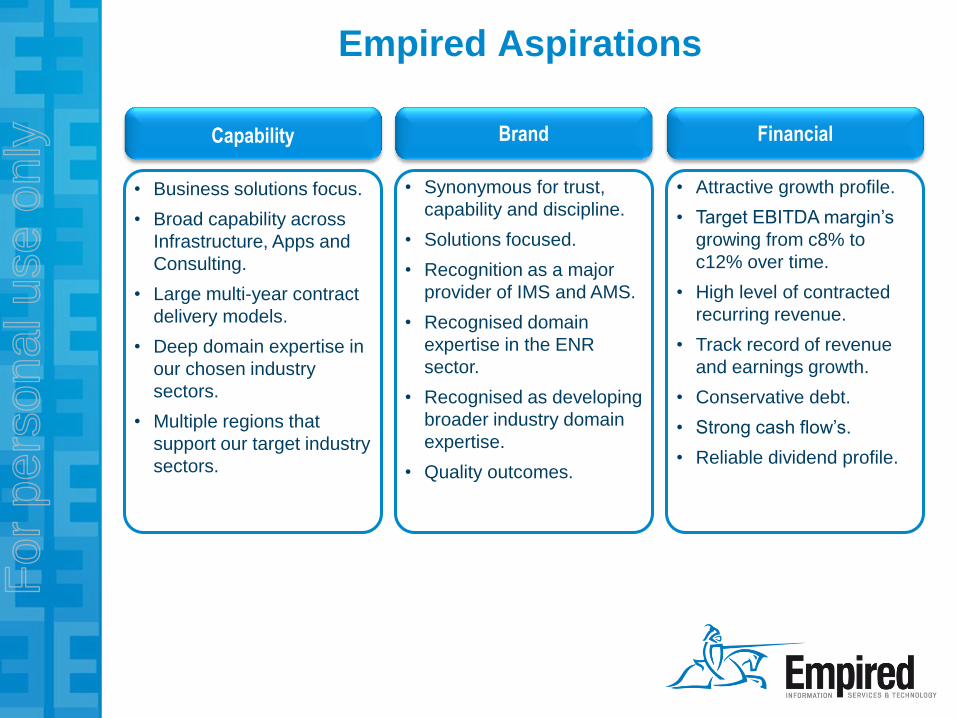
Empired Aspirations
Brand Financial
• Synonymous for trust,
capability and discipline.
• Solutions focused.
• Recognition as a major
provider of IMS and AMS.
• Recognised domain
expertise in the ENR
sector.
• Recognised as developing
broader industry domain
expertise.
• Quality outcomes.
• Attractive growth profile.
• Target EBITDA margin’s
growing from c8% to
c12% over time.
• High level of contracted
recurring revenue.
• Track record of revenue
and earnings growth.
• Conservative debt.
• Strong cash flow’s.
• Reliable dividend profile.
Capability
• Business solutions focus.
• Broad capability across
Infrastructure, Apps and
Consulting.
• Large multi-year contract
delivery models.
• Deep domain expertise in
our chosen industry
sectors.
• Multiple regions that
support our target industry
sectors.
For
per
sona
l use
onl
y
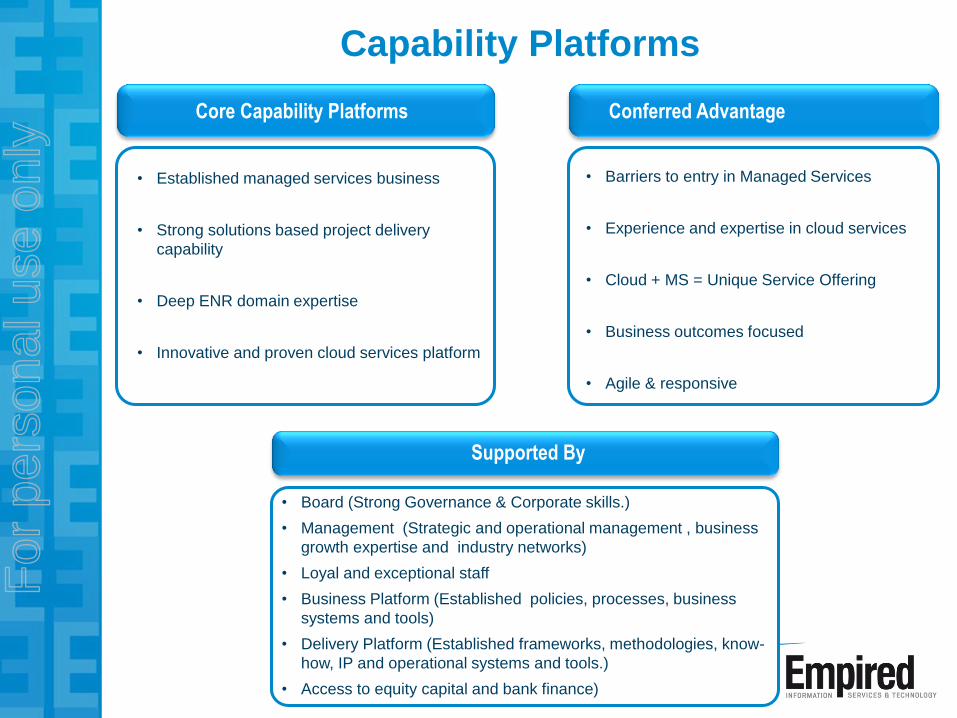
Capability Platforms
Core Capability Platforms
• Established managed services business
• Strong solutions based project delivery
capability
• Deep ENR domain expertise
• Innovative and proven cloud services platform
Conferred Advantage
Supported By
• Barriers to entry in Managed Services
• Experience and expertise in cloud services
• Cloud + MS = Unique Service Offering
• Business outcomes focused
• Agile & responsive
• Board (Strong Governance & Corporate skills.)
• Management (Strategic and operational management , business
growth expertise and industry networks)
• Loyal and exceptional staff
• Business Platform (Established policies, processes, business
systems and tools)
• Delivery Platform (Established frameworks, methodologies, know-
how, IP and operational systems and tools.)
• Access to equity capital and bank finance)
For
per
sona
l use
onl
y
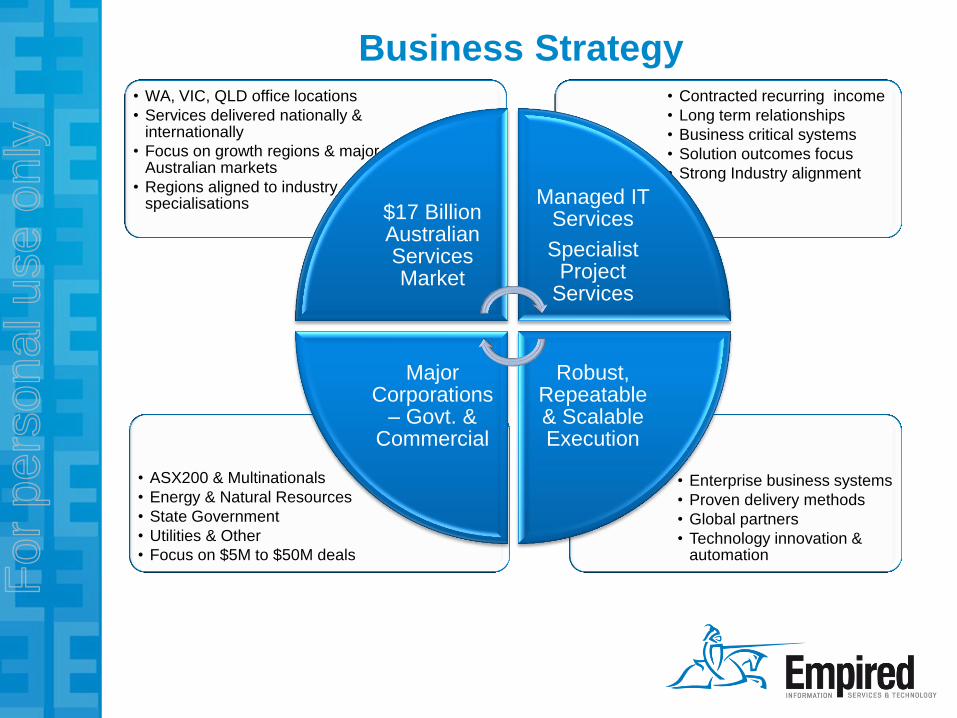
Business Strategy
• Enterprise business systems
• Proven delivery methods
• Global partners
• Technology innovation & automation
• ASX200 & Multinationals
• Energy & Natural Resources
• State Government
• Utilities & Other
• Focus on $5M to $50M deals
• Contracted recurring income
• Long term relationships
• Business critical systems
• Solution outcomes focus
• Strong Industry alignment
• WA, VIC, QLD office locations
• Services delivered nationally & internationally
• Focus on growth regions & major Australian markets
• Regions aligned to industry specialisations
$17 Billion Australian Services Market
Managed IT Services
Specialist Project
Services
Robust, Repeatable & Scalable Execution
Major Corporations
– Govt. & Commercial
For
per
sona
l use
onl
y
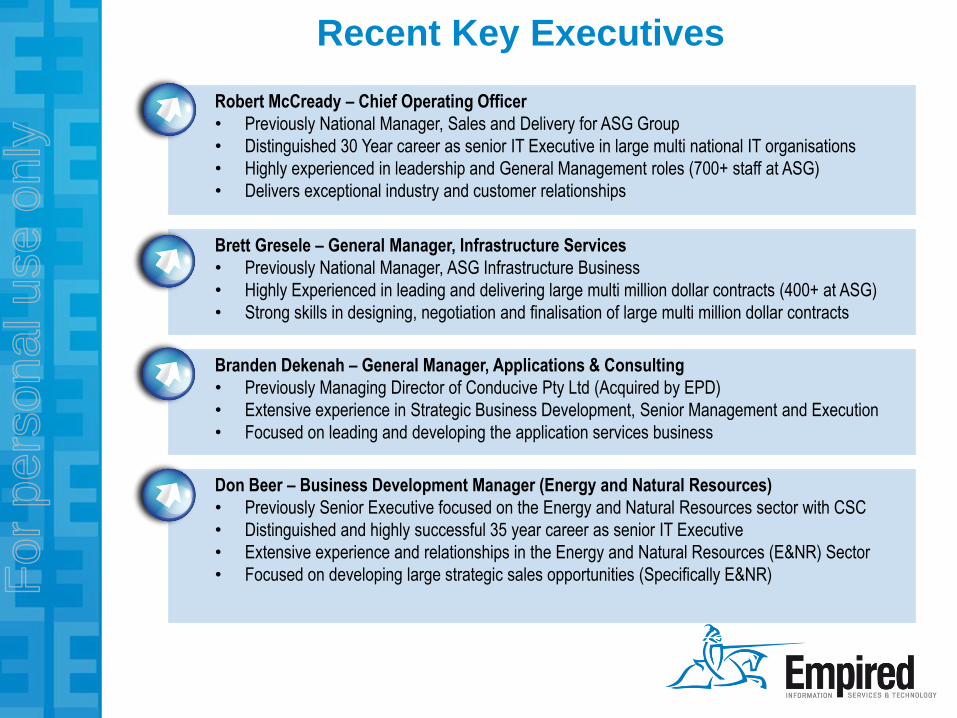
Recent Key Executives
Robert McCready – Chief Operating Officer
• Previously National Manager, Sales and Delivery for ASG Group
• Distinguished 30 Year career as senior IT Executive in large multi national IT organisations
• Highly experienced in leadership and General Management roles (700+ staff at ASG)
• Delivers exceptional industry and customer relationships
Brett Gresele – General Manager, Infrastructure Services
• Previously National Manager, ASG Infrastructure Business
• Highly Experienced in leading and delivering large multi million dollar contracts (400+ at ASG)
• Strong skills in designing, negotiation and finalisation of large multi million dollar contracts
Branden Dekenah – General Manager, Applications & Consulting
• Previously Managing Director of Conducive Pty Ltd (Acquired by EPD)
• Extensive experience in Strategic Business Development, Senior Management and Execution
• Focused on leading and developing the application services business
Don Beer – Business Development Manager (Energy and Natural Resources)
• Previously Senior Executive focused on the Energy and Natural Resources sector with CSC
• Distinguished and highly successful 35 year career as senior IT Executive
• Extensive experience and relationships in the Energy and Natural Resources (E&NR) Sector
• Focused on developing large strategic sales opportunities (Specifically E&NR)
For
per
sona
l use
onl
y
Client Snapshot F
or p
erso
nal u
se o
nly
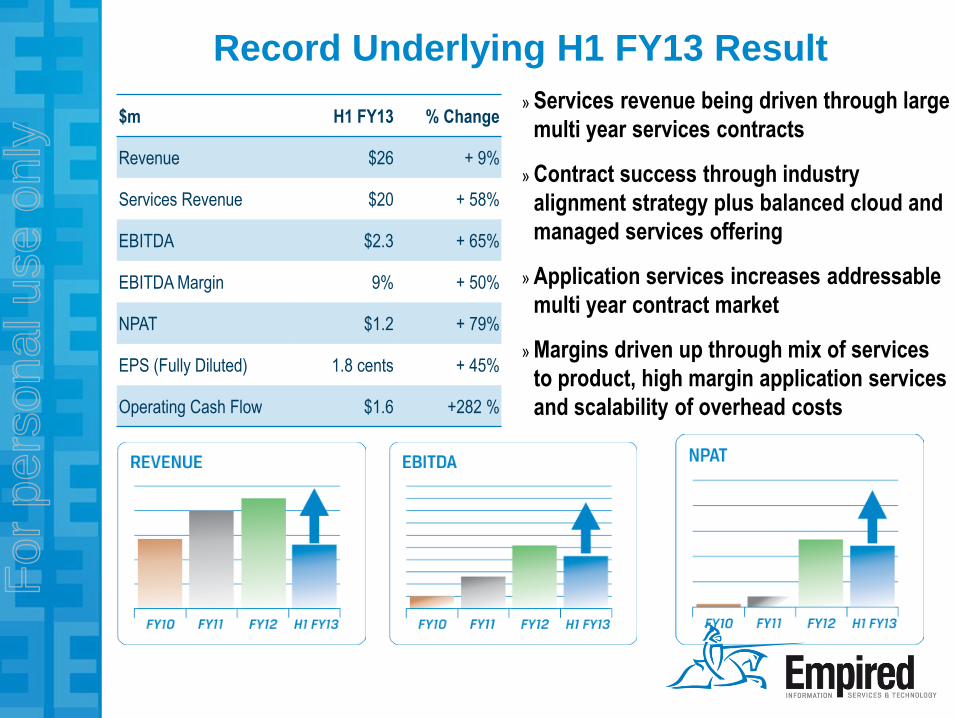
Record Underlying H1 FY13 Result
$m H1 FY13 % Change
Revenue $26 + 9%
Services Revenue $20 + 58%
EBITDA $2.3 + 65%
EBITDA Margin 9% + 50%
NPAT $1.2 + 79%
EPS (Fully Diluted) 1.8 cents + 45%
Operating Cash Flow $1.6 +282 %
» Services revenue being driven through large
multi year services contracts
» Contract success through industry
alignment strategy plus balanced cloud and
managed services offering
» Application services increases addressable
multi year contract market
» Margins driven up through mix of services
to product, high margin application services
and scalability of overhead costs
For
per
sona
l use
onl
y
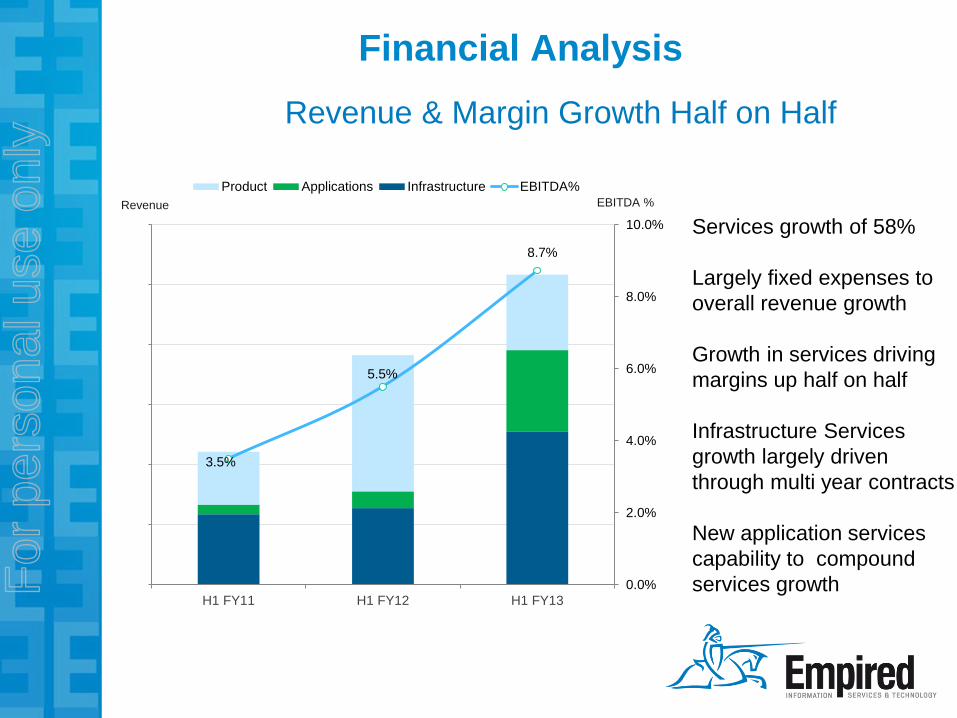
Financial Analysis
Revenue & Margin Growth Half on Half
Services growth of 58%
Largely fixed expenses to
overall revenue growth
Growth in services driving
margins up half on half
Infrastructure Services
growth largely driven
through multi year contracts
New application services
capability to compound
services growth
3.5%
5.5%
8.7%
0.0%
2.0%
4.0%
6.0%
8.0%
10.0%
-
5,000
10,000
15,000
20,000
25,000
30,000
H1 FY11 H1 FY12 H1 FY13
Product Applications Infrastructure EBITDA%
Revenue EBITDA %
For
per
sona
l use
onl
y
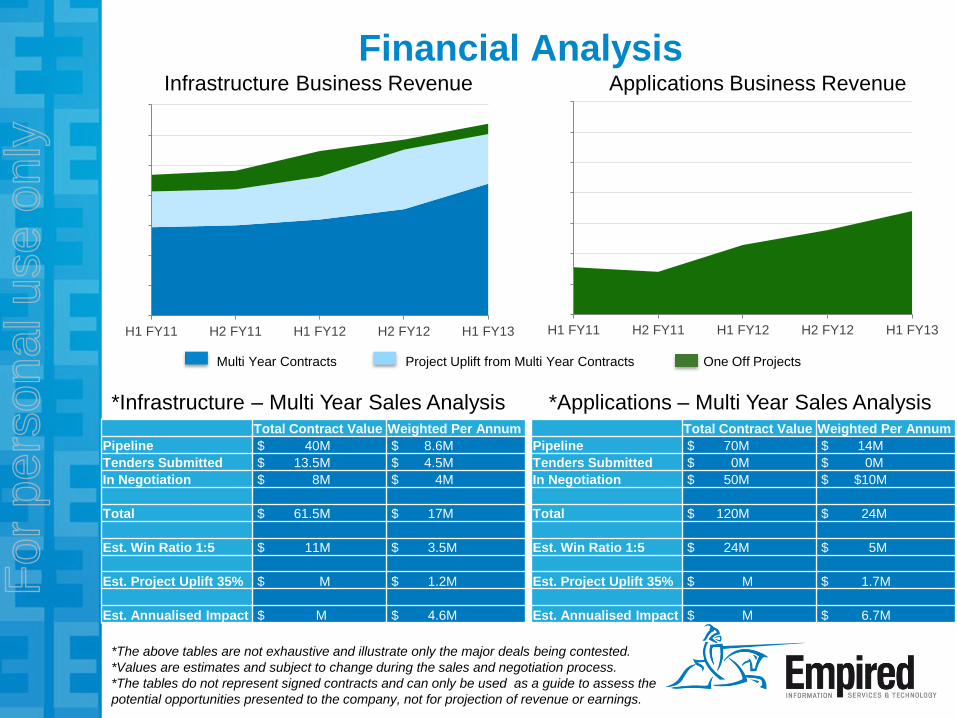
Financial Analysis
-
2,000
4,000
6,000
8,000
10,000
12,000
14,000
H1 FY11 H2 FY11 H1 FY12 H2 FY12 H1 FY13
Total Contract Value Weighted Per Annum
Pipeline $ 40M $ 8.6M
Tenders Submitted $ 13.5M $ 4.5M
In Negotiation $ 8M $ 4M
Total $ 61.5M $ 17M
Est. Win Ratio 1:5 $ 11M $ 3.5M
Est. Project Uplift 35% $ M $ 1.2M
Est. Annualised Impact $ M $ 4.6M
Total Contract Value Weighted Per Annum
Pipeline $ 70M $ 14M
Tenders Submitted $ 0M $ 0M
In Negotiation $ 50M $ $10M
Total $ 120M $ 24M
Est. Win Ratio 1:5 $ 24M $ 5M
Est. Project Uplift 35% $ M $ 1.7M
Est. Annualised Impact $ M $ 6.7M
Infrastructure Business Revenue Applications Business Revenue
*Infrastructure – Multi Year Sales Analysis *Applications – Multi Year Sales Analysis
-
2,000
4,000
6,000
8,000
10,000
12,000
14,000
H1 FY11 H2 FY11 H1 FY12 H2 FY12 H1 FY13
Multi Year Contracts Project Uplift from Multi Year Contracts One Off Projects
*The above tables are not exhaustive and illustrate only the major deals being contested.
*Values are estimates and subject to change during the sales and negotiation process.
*The tables do not represent signed contracts and can only be used as a guide to assess the
potential opportunities presented to the company, not for projection of revenue or earnings.
For
per
sona
l use
onl
y
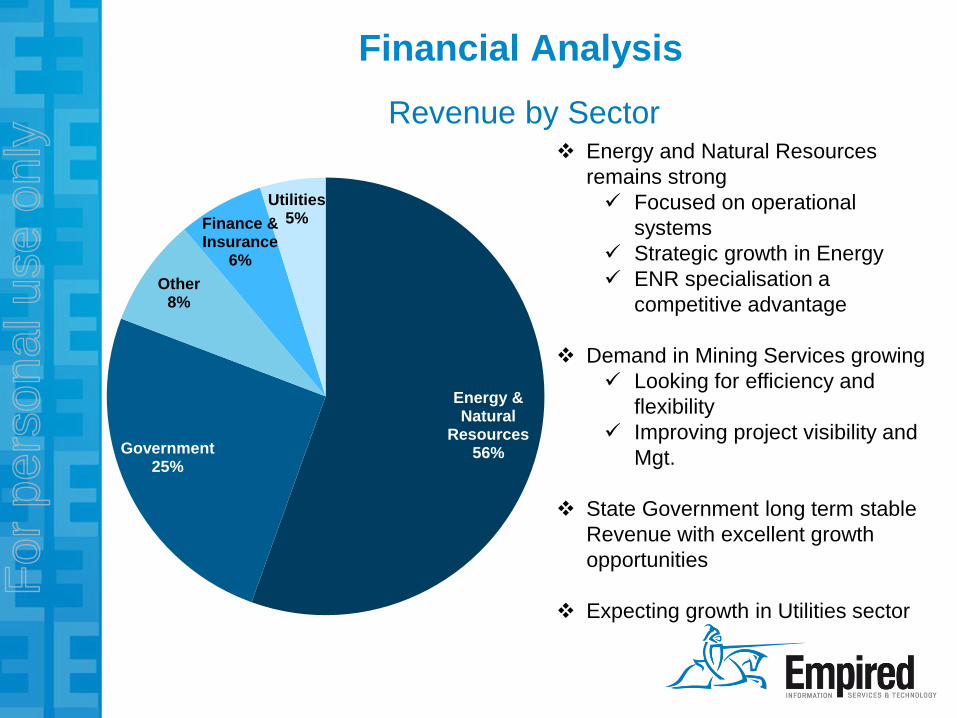
Financial Analysis
Energy & Natural
Resources 56% Government
25%
Other 8%
Finance & Insurance
6%
Utilities 5%
Revenue by Sector Energy and Natural Resources
remains strong
Focused on operational
systems
Strategic growth in Energy
ENR specialisation a
competitive advantage
Demand in Mining Services growing
Looking for efficiency and
flexibility
Improving project visibility and
Mgt.
State Government long term stable
Revenue with excellent growth
opportunities
Expecting growth in Utilities sector
For
per
sona
l use
onl
y
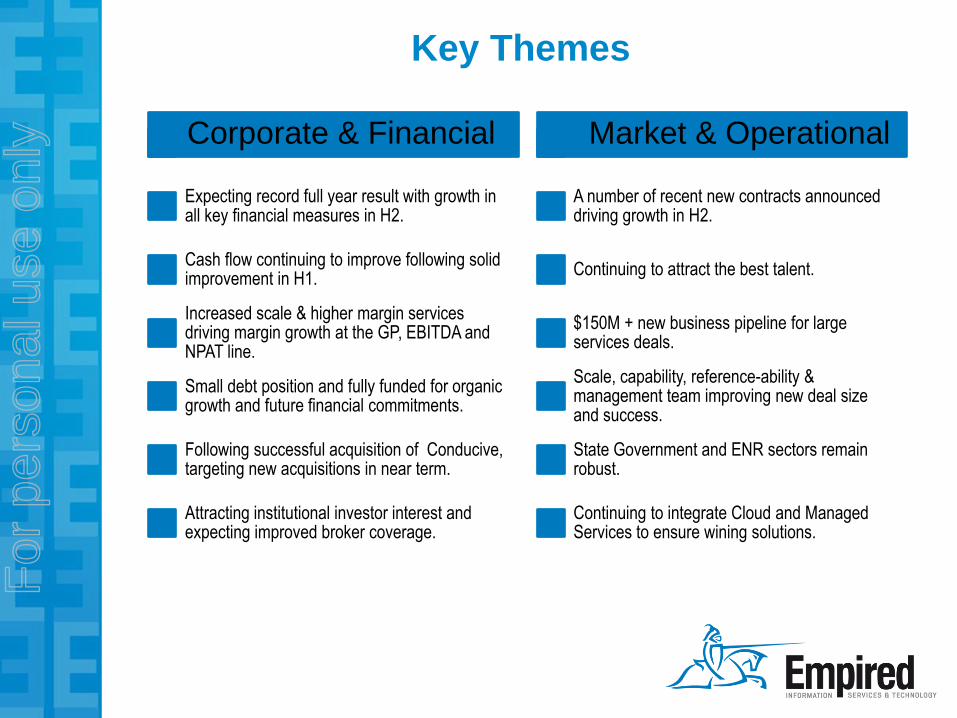
Key Themes
Corporate & Financial
Expecting record full year result with growth in all key financial measures in H2.
Cash flow continuing to improve following solid improvement in H1.
Increased scale & higher margin services driving margin growth at the GP, EBITDA and NPAT line.
Small debt position and fully funded for organic growth and future financial commitments.
Following successful acquisition of Conducive, targeting new acquisitions in near term.
Attracting institutional investor interest and expecting improved broker coverage.
Market & Operational
A number of recent new contracts announced driving growth in H2.
Continuing to attract the best talent.
$150M + new business pipeline for large services deals.
Scale, capability, reference-ability & management team improving new deal size and success.
State Government and ENR sectors remain robust.
Continuing to integrate Cloud and Managed Services to ensure wining solutions.
For
per
sona
l use
onl
y
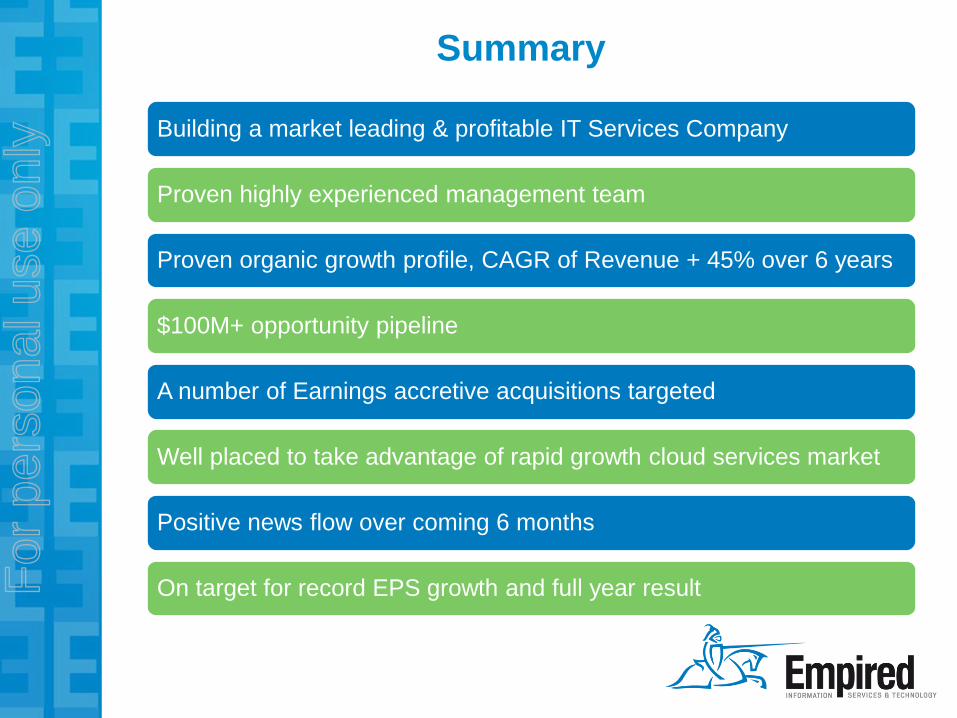
Summary
Building a market leading & profitable IT Services Company
Proven highly experienced management team
Proven organic growth profile, CAGR of Revenue + 45% over 6 years
$100M+ opportunity pipeline
A number of Earnings accretive acquisitions targeted
Well placed to take advantage of rapid growth cloud services market
Positive news flow over coming 6 months
On target for record EPS growth and full year result For
per
sona
l use
onl
y
Appendices
For
per
sona
l use
onl
y
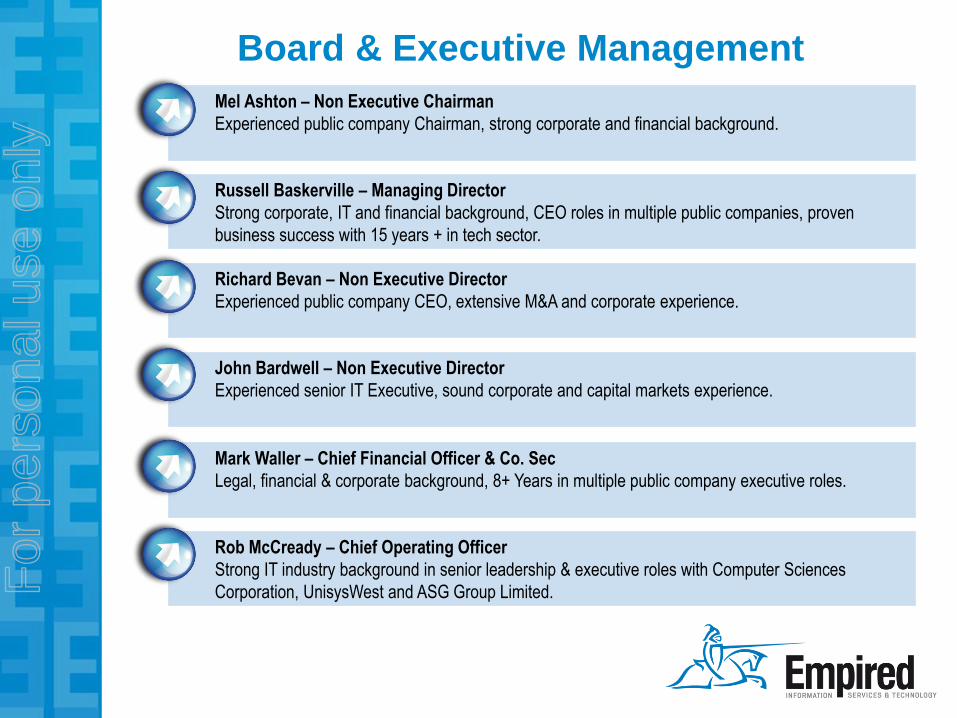
Board & Executive Management
Mel Ashton – Non Executive Chairman
Experienced public company Chairman, strong corporate and financial background.
Russell Baskerville – Managing Director
Strong corporate, IT and financial background, CEO roles in multiple public companies, proven
business success with 15 years + in tech sector.
Richard Bevan – Non Executive Director
Experienced public company CEO, extensive M&A and corporate experience.
John Bardwell – Non Executive Director
Experienced senior IT Executive, sound corporate and capital markets experience.
Mark Waller – Chief Financial Officer & Co. Sec
Legal, financial & corporate background, 8+ Years in multiple public company executive roles.
Rob McCready – Chief Operating Officer
Strong IT industry background in senior leadership & executive roles with Computer Sciences
Corporation, UnisysWest and ASG Group Limited. For
per
sona
l use
onl
y
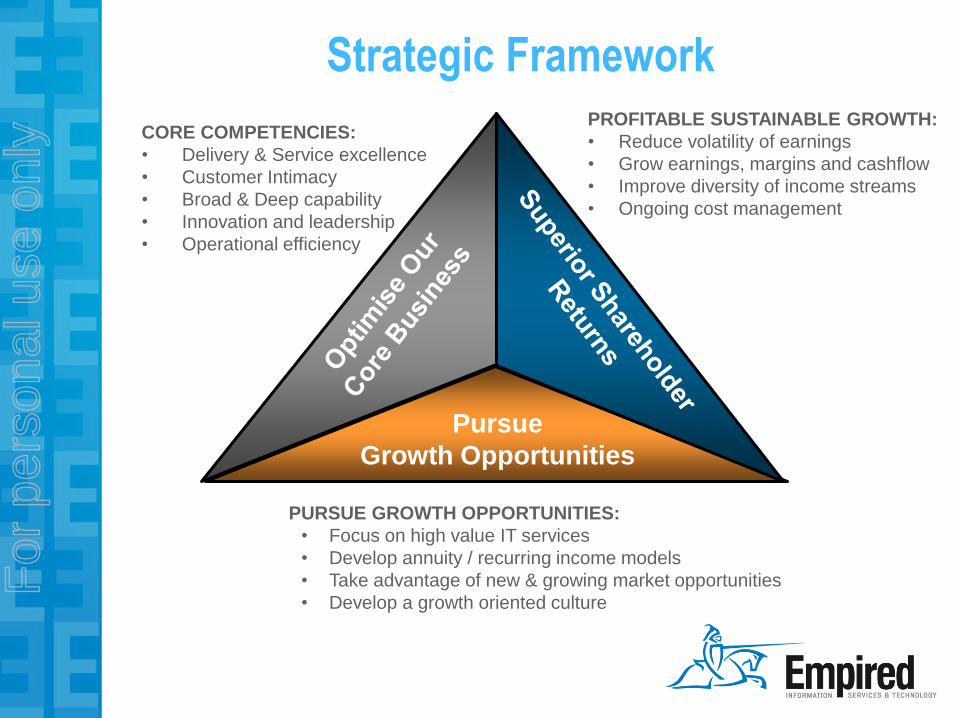
Strategic Framework
Pursue
Growth Opportunities
PURSUE GROWTH OPPORTUNITIES:
• Focus on high value IT services
• Develop annuity / recurring income models
• Take advantage of new & growing market opportunities
• Develop a growth oriented culture
CORE COMPETENCIES:
• Delivery & Service excellence
• Customer Intimacy
• Broad & Deep capability
• Innovation and leadership
• Operational efficiency
PROFITABLE SUSTAINABLE GROWTH:
• Reduce volatility of earnings
• Grow earnings, margins and cashflow
• Improve diversity of income streams
• Ongoing cost management
For
per
sona
l use
onl
y
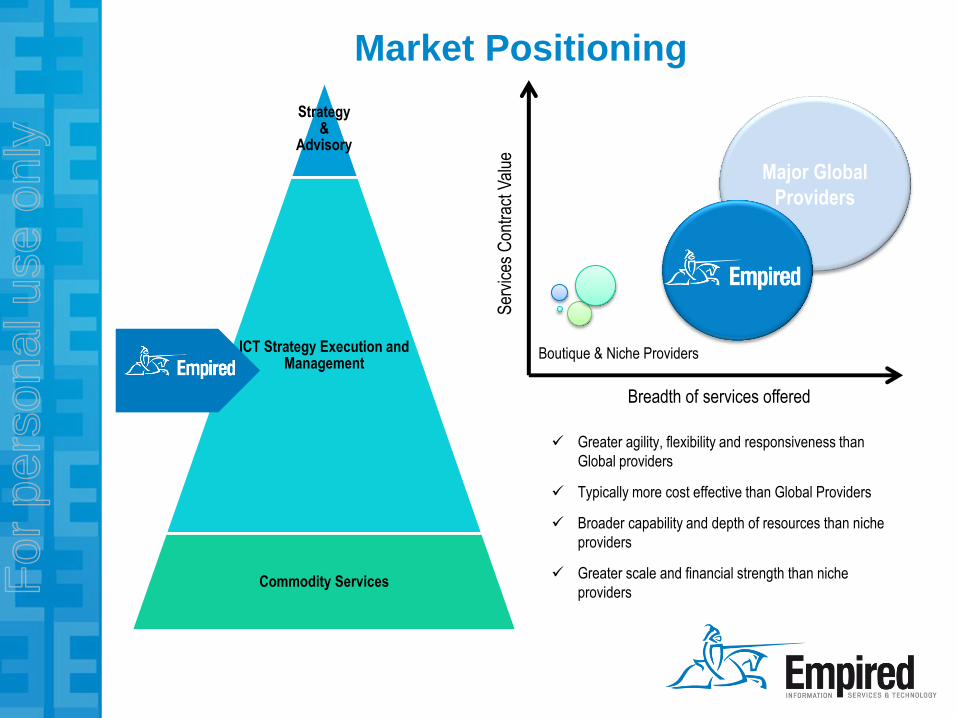
Greater agility, flexibility and responsiveness than
Global providers
Typically more cost effective than Global Providers
Broader capability and depth of resources than niche
providers
Greater scale and financial strength than niche
providers
Market Positioning
Ser
vice
s C
ontr
act V
alue
Breadth of services offered
Major Global
Providers
Boutique & Niche Providers
Strategy &
Advisory
ICT Strategy Execution and Management
Commodity Services For
per
sona
l use
onl
y
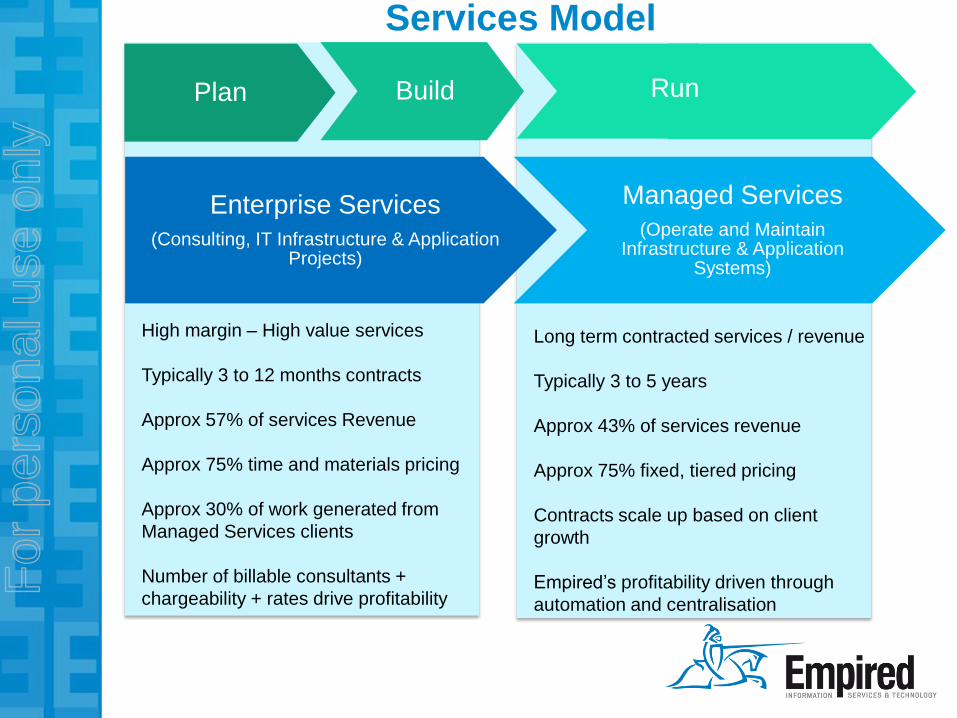
Services Model
Plan Build
Enterprise Services
(Consulting, IT Infrastructure & Application Projects)
Managed Services
(Operate and Maintain Infrastructure & Application
Systems)
Run
High margin – High value services
Typically 3 to 12 months contracts
Approx 57% of services Revenue
Approx 75% time and materials pricing
Approx 30% of work generated from
Managed Services clients
Number of billable consultants +
chargeability + rates drive profitability
Long term contracted services / revenue
Typically 3 to 5 years
Approx 43% of services revenue
Approx 75% fixed, tiered pricing
Contracts scale up based on client
growth
Empired’s profitability driven through
automation and centralisation
For
per
sona
l use
onl
y
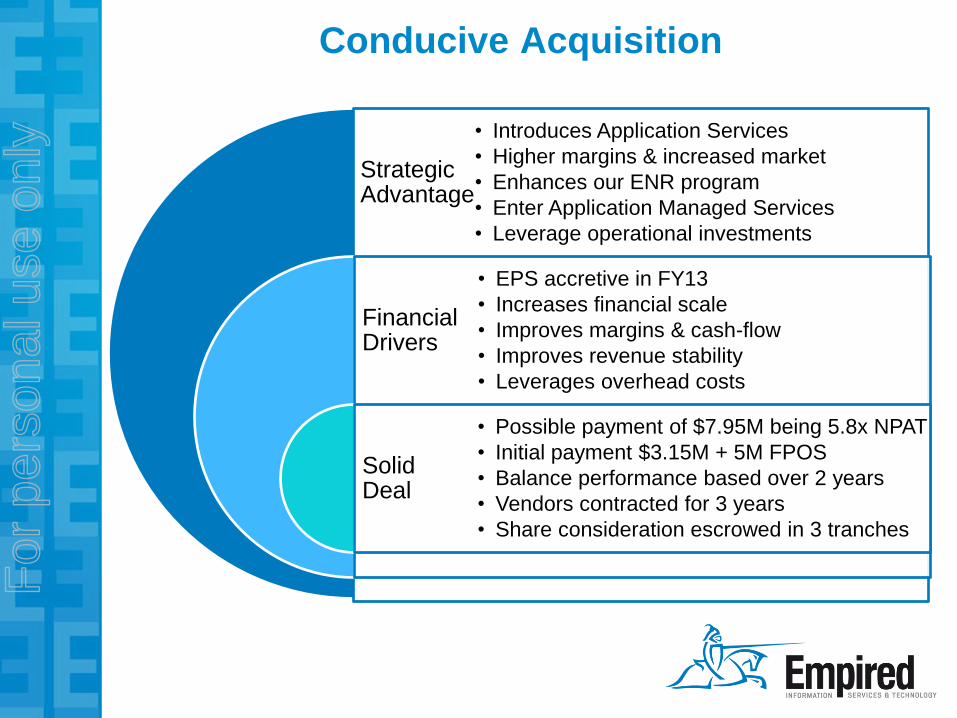
Conducive Acquisition
Strategic Advantage
Financial Drivers
Solid Deal
• Introduces Application Services
• Higher margins & increased market
• Enhances our ENR program
• Enter Application Managed Services
• Leverage operational investments
• EPS accretive in FY13
• Increases financial scale
• Improves margins & cash-flow
• Improves revenue stability
• Leverages overhead costs
• Possible payment of $7.95M being 5.8x NPAT
• Initial payment $3.15M + 5M FPOS
• Balance performance based over 2 years
• Vendors contracted for 3 years
• Share consideration escrowed in 3 tranches
For
per
sona
l use
onl
y
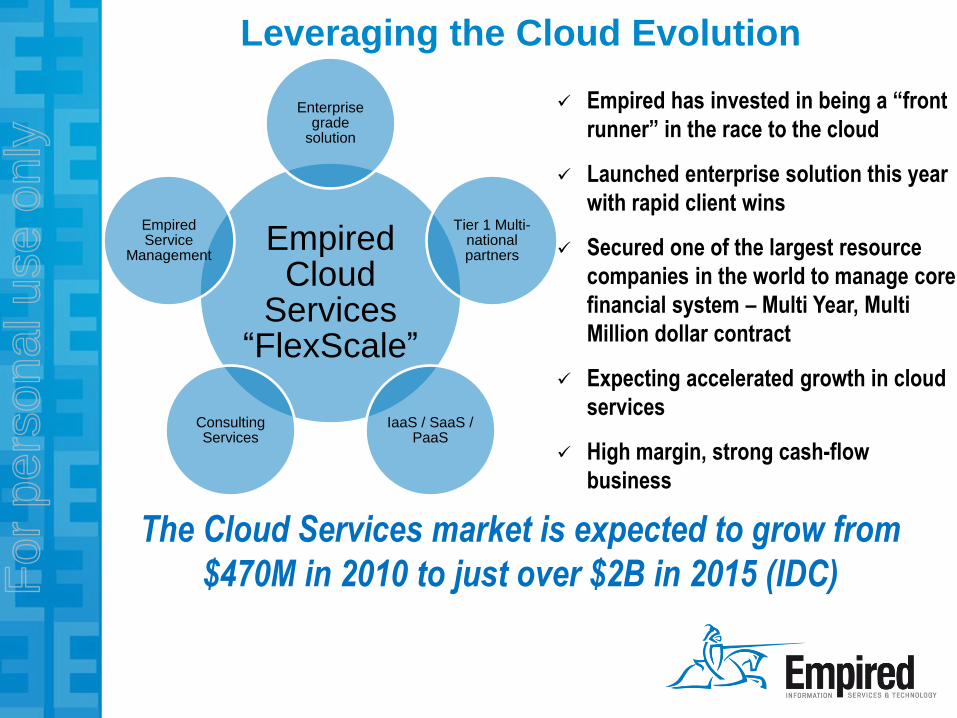
Leveraging the Cloud Evolution
Empired has invested in being a “front
runner” in the race to the cloud
Launched enterprise solution this year
with rapid client wins
Secured one of the largest resource
companies in the world to manage core
financial system – Multi Year, Multi
Million dollar contract
Expecting accelerated growth in cloud
services
High margin, strong cash-flow
business
The Cloud Services market is expected to grow from
$470M in 2010 to just over $2B in 2015 (IDC)
Empired Cloud
Services “FlexScale”
Enterprise grade
solution
Tier 1 Multi-national partners
IaaS / SaaS / PaaS
Consulting Services
Empired Service
Management
For
per
sona
l use
onl
y