Embed Size (px)
Citation preview
1
Emotions, the Horserace Metaphor and the 2008 Presidential Campaign
Matthew Baum, Harvard University
Ann Crigler, University of Southern California
Marion Just, Wellesley College
Jesse Mills, University of Southern California
Paper prepared for the Annual Meeting of the American Political Science Association,
Washington, DC: September, 2010
2
Emotions, the Horserace Metaphor and the 2008 Presidential Campaign
Political advertisements and horserace news stories are two of the dominant forms of
presidential campaign communication. Candidates spend millions of dollars on ads to convey
their images and messages in hopes of persuading undecided voters, energizing their base
supporters and discouraging their opponents‘ partisans. At the same time, journalists and
pollsters follow the pulse of the American public by reporting on who is leading and falling
behind in the race. Do these messages, which form the heart of the campaign, matter? This
paper examines how the horserace metaphor and political ads affect voters during a real world
campaign. Specifically, we analyze the interaction of horserace reporting with threatening and
reassuring ads by the leading Democratic and Republican candidates during the 2008 presidential
primary and general election campaigns. We focus particularly on how horserace coverage and
competing partisan ads shape the public‘s emotional appraisals of candidates and judgments
about who is likely to win. Knowing that candidates‘ ads are targeted to different segments of
the potential electorate and in keeping with intergroup emotions theory in psychology, we
hypothesize that the public‘s responses will not be uniform but will vary by partisanship and
strength of party identity.
The Horserace Metaphor
Does it matter if candidates are described as ahead or behind in the polls and if so, when?
This question is especially important given the ubiquity of horserace coverage in campaign news
3
(Hofstetter 1976; Mann and Orren 1992; Patterson 1993; Just et al. 1996; Farnsworth and Lichter
2006; Project for Excellence in Journalism 2008). Can the barrage of news messages about the
status of the race influence the evaluation of candidates? Do news reports of polls cause the
public to jump on the bandwagon of the leading candidate? Or, do people begin to root for the
underdog—the candidate who is trailing in the polls? Finally, does this differ during the primary
period when there are few partisan cues to rely upon compared to the general election phase of
the presidential election cycle? Past research has found that there are both bandwagon and
underdog effects and that they tend to balance out (Mendelsohn and Crespi 1970). Diana Mutz
(1995) shows that media coverage of viability produces both bandwagon and underdog effects
on campaign contributions. Researchers have also found that evaluations of electability and
viability were indeed influential in primary vote choice (Abramowitz 1989; Crespin 2000;
Gurian 2003). In contrast, by the time the general election unfolds, candidates are well-known,
well-funded and identified with a distinct party label. For members of the public who identify
with one of the political parties, this provides an important heuristic for their evaluations of the
competing candidates. For independents, the party label is not particularly relevant to their
assessments of the candidates. The information about the horserace and viability of the
candidates is therefore more relevant for partisan voters‘ decision-making during the primaries
than the general election. For independent voters, horserace news may still play a significant
role in their appraisals of the candidates during the general election. A hypothesis follows:
H1. The horserace metaphor is more important for distinguishing candidate support in the
primary than in the general election. However, the weaker the voter’s party identification, the
more the horserace metaphor may influence candidate appraisals during the general election.
4
Emotional Appraisals by the Public
Research has demonstrated that political information processed during election
campaigns is not done in an entirely ―cold‖ manner. In fact, political scientists have integrated
the study of emotion into models of voter information processing, decision-making and voting
behavior (Abelson et al. 1982; Brader 2005, 2006; Marcus et al. 2000). While this vein in the
research has improved our understanding of how emotion influences politics, it has generally
treated emotion as an individual-level phenomenon. However, an election campaign is a socially
bound event, where (partisan) groups compete to win voters. In particular, partisan identification
(or lack thereof) is central to individuals‘ understanding of and reactions to the election
campaign. Recent work in political science even suggests that partisanship is a social identity,
much like religious affiliation or ethnicity, and emphasizes its enduring stability (Greene 1999,
Green et al. 2002, Greene 2004).
Emotional appraisals of candidates interact with party identification. As is true for
competitive races in sports, political competitions are fought between teams—in baseball the
competition may be between Red Sox and Yankees fans; in US presidential politics the main
competition is between the Democrats and the Republicans. We rely on Intergroup Emotions
Theory (IET) to capture how partisans are influenced by ads and polling results during the 2008
presidential campaign. IET integrates the fundamental insights of social identity theory (Tajfel
1978) and self-categorization theory (Turner, Hogg, Oakes, Reicher, and Wetherell 1987;
Yzerbyt et al. 2003) with theories of emotion to argue that individuals feel emotions based on the
5
way that they relate to their group rather than simply as an isolated individual (Smith and Mackie
2008). The theory is particularly relevant to elections since the events and ads are largely only
indirectly experienced by the public.
Our analysis of citizens‘ emotional appraisals of the horserace narrative and campaign
advertisements is guided by intergroup emotions theory (IET), which claims that individuals feel
emotions on behalf of groups they identify with, even when they, themselves, are not directly
impacted by the events or stimuli affecting the group. IET also provides expectations regarding
the particular emotions group identifiers are likely to feel towards in-groups and out-groups
when group identity is made salient. There are two foci of group level emotional responses that
are relevant to our analysis of political party identifiers. First, the emotion felt towards an out-
group will be associated with particular behavioral tendencies. For example, not all negative
emotions lead to the same behavior towards the out-group. If an individual feels anger towards
the out-group, he or she is likely to attack or confront the out-group. In contrast, if an individual
feels disgust, that individual is likely to avoid the out-group (Smith and Mackie 2008, p. 430). A
second, broader version of IET, argues that people feel more general emotions when they are
focusing on a particular social identity. These emotions may be directed towards the in-group as
well as the out-group and may lead to a ―typical ‗profile‘ of emotional tendencies‖ for the group
(Smith and Mackie 2008, p. 430). These shared emotional feelings seem to work similarly for
intergroup emotions as for individually felt emotions. Mackie et al. (2000) applied appraisal
theories of emotion to the intergroup context and found that particular emotions are associated
with action tendencies and motives whether they are experienced at the individual or group level.
When applied to partisan identities, this second aspect of IET helps to explain why Democrats
6
and Republicans might have different profiles of emotional tendencies and would consequently
appraise threat or uncertainty of electoral outcomes differently.
The metaphor of the sports fan illustrates how IET works. The fan identifies with his/her
team, and feels emotions as a result of the team‘s successes and failures, while not actually
participating in the contest in the same way as the players. Much like the sports fan who reacts
emotionally to events that occur throughout a sporting event, partisan identifiers in the electorate
react to events that take place during the campaign, such as the airing of political ads and media
horserace coverage (Huddy and Mason 2008; Just et al. 1996). As a result, we wouldn‘t expect
Democrats and Republicans to respond to the campaigns in the same manner; events that would
please one party would likely upset members of the rival party (such as a successful candidate
speech, or a change in the polls). IET provides us with a framework for understanding these
differences, and helps predict how group members will respond emotionally to events in an
intergroup context.
According to IET, the particular emotion(s) felt in an intergroup context depends on two
factors: the tone of the message (does it threaten or reassure the in-group), and the perceived
strength of both the in-group and out-group. Consistent with appraisal theory (Lazarus 1991,
2001; Smith and Kirby 2001), intergroup emotions theory predicts that group identifiers will
respond to reassuring stimuli about their in-group with positive emotions such as hope and
enthusiasm, and to threatening stimuli with negative emotions such as fear and anger (Mackie et
al. 2000, Smith et al. 2007).
Mackie et al. (2004) find that anger and fear are both likely emotional responses to threat.
However individuals more often feel anger when they judge the in-group to be strong, while
typically feeling fear when they perceive the in-group as weak. In October 2008, the Democrats
7
were in a stronger position than Republicans. Democrats were far more confident than
Republicans that their candidate would win. For instance, a Pew Center survey of October 16-19,
2008 showed that 79%, of Democrats believed Barack Obama would win the election, compared
to only 35% of Republicans who believed that John McCain would win. Our second hypothesis
follows:
H2. Both Republicans and Democrats will react with fear and anger when their respective
candidate is portrayed as behind in the polls, or otherwise threatened by campaign advertising.
Democrats will respond with more anger, while Republicans will respond with more fear.
Differences Between Partisans
While the first focus of IET provides a parsimonious model to explain partisans‘
emotional reactions to horserace messages and campaign ads, the second focus of IET helps to
explain differences between the two partisan rivals. Recent work suggests that Democrats and
Republicans and liberals and conservatives may differ on a psychological level, and be more
prone to certain emotions and actions than their counterparts. George Lakoff (2002), identifies
core differences between the moral systems underlying liberalism and conservatism and claims
that conservative morality resembles a ―strict father‖ while liberal morality resembles a
―nurturant parent.‖ While the nurturant parent morality lends itself to compassion and
understanding, the strict father model appears stern and unforgiving. Tying family to the state,
psychologists find that people who recall extensive childhood punishment displace their anger
onto their adult political attitudes (Milburn 1995). This account of conservatives‘ moral
foundation suggests that Republicans may be psychologically more anger-prone when threatened
regardless of the election context.
Researchers argue that anger traits, as well as other negative emotions, are correlated
with political conservatism across cultures (Scherer and Brosh 2009). Jost et al. (2003) also find
8
psychological differences between liberals and conservatives along several psychological
dimensions, including dogmatism and intolerance of ambiguity, lack of openness to experience,
uncertainty avoidance and a personal need for order. Individuals possessing these traits may
respond more angrily to the uncertainty and anxiety brought about by out-group attack than those
who do not. Finally, Ansolabehere and Iyengar (1997) find that Republicans are much more
receptive to anger appeals and may feel more anger than Democrats during an election
campaign. Our final hypothesis follows:
H3. Republicans will respond to threat (from messages portraying their candidate as behind in
the polls, or threatening campaign ads) with more anger than fear.
The Panel Survey Experiment
During the 2008 presidential campaign, the Cooperative Campaign Analysis Project1
(CCAP) provided an opportunity to embed experimental treatments into an ongoing panel study
of the primaries and general election. To test our hypotheses about horserace messages and
emotional appraisals of candidates, we exposed study participants during the on-going primary
and general election campaigns to a statement about the candidates‘ standings in the polls and to
actual political advertisements that either praised the sponsor or attacked the opponent. In
January, the experiment was a 4 x 2 x 2 design: 4 candidates (Clinton, Obama, McCain or
Romney) by 2 horserace messages (ahead or behind) by 2 ad messages (positive or negative),
with an additional control condition consisting of a neutral video in place of the ad messages. In
October, the experiment consisted of a 2 x 2 x 4 design: 2 candidates (McCain or Obama) by 2
1 CCAP was a multi-wave Internet panel survey conducted by Polimetrix under the leadership of
Simon Jackman and Lynn Vavreck.
9
horserace messages (ahead or behind) by 4 ad messages (positive appeals about character,
positive appeals about an issue, negative attacks on character, or negative attacks on an issue),
with additional control condition, again consisting of a neutral video in place of the ad messages.
Participants were randomly assigned to experimental condition. Randomization yielded no
significant differences across conditions in the pre-test variables.
This panel survey experiment allows us to compare the impact of horserace messages and
political ads on a national sample of potential voters in the heat of the early intra-party contests
and again during the last days of the inter-party race. The 2008 campaign was ideal for this
study because both parties‘ nominations were open and heavily contested.
The CCAP study contained six waves of data collection with a potential total panel of
20,000 respondents. Each wave consisted of a core set of questions asked of all participants
followed by a ten minute module (roughly 40 questions) asked of approximately 1000
respondents dedicated to each research team. The baseline survey took place in December 2007,
followed by four campaign waves, two during the primary elections—in January and March—
and two during the general election—September and October 2008. The final wave took place
after the November election. We draw our data from questions asked of the same panel of
respondents during the January and October waves of the study.
The core questions covered broad areas of respondents‘ attentiveness to the campaign,
media consumption, campaign involvement, political knowledge, issue positions and ideology,
candidate preferences and a variety of demographic characteristics. Our January and October
modules asked respondents to rate each of the candidates on three positive and three negative
10
emotions—hope, enthusiasm, pride, anger, fear and worry. In October, we also asked
respondents to rate the importance of different group identifications (randomly rotated among:
political party, race/ethnicity, gender, religion, socio-economic class and political ideology).
This variable allows us to assess the intergroup nature of emotional responses. The exact
wording of this question was ―When deciding who to support for president this November, how
important is your political party to defining who you are?‖
Following the baseline questions, we embedded an experiment into the survey to test
IET‘s hypotheses about threatening and reassuring messages. We used a combination of the
horserace and ad message stimuli to vary the strength of the threat and reassurance. To decrease
question order bias, each survey referred to one candidate randomly selected among the four
leading candidates (Clinton, Obama, McCain and Romney) in January and the two major party
candidates (McCain and Obama) in October. For each candidate, we randomly rotated between
the ahead and behind introductions describing the candidate‘s standing in the polls. To
maximize the credibility of the horserace messages, we attributed the messages to the opposing
candidate‘s campaign. For example, the Barack Obama ―ahead‖ introduction read:
A senior advisor to the Clinton campaign admitted to reporters that Barack Obama has
moved ahead in recent polls.
The behind introduction in January read:
A senior advisor to the Obama campaign conceded to reporters that Barack Obama has
fallen behind in recent polls.
11
Because Obama‘s lead in the polls was growing in October, we modified the ahead and behind
introductions to refer to moving ahead or behind in ―recent polls in the battleground states.‖
This allowed us to maintain a credible horserace message in the midst of the actual campaign.
In January, the ahead and behind statements were paired with ads about healthcare. Forty
percent of respondents saw a positive healthcare ad, 40% saw a negative healthcare ad and 20%
were given a neutral video about the timing of presidential primaries. In October, the ahead and
behind statements were followed by ads about the candidate‘s character/background or about the
economy (including jobs, taxes and energy costs). Forty percent of respondents viewed either a
positive or negative character ad, 40% were shown either a positive or negative issue ad, and
20% were shown a neutral video about vice-presidential debate scheduling. Following the
experimental treatment, the module concluded with questions assessing respondents‘ evaluations
of candidates‘ favorability, feeling-thermometer scores, emotions, traits, and which candidate
could better handle gas prices, the economy and foreclosures.
In order to test the role of emotional appraisals in response to threatening and reassuring
campaign messages, we constructed four treatment conditions for our analyses. The strong
threat and the strong reassurance contained two reinforcing messages (both the horserace and
advertising messages). In the strong threat condition, subjects saw an ad from the out-group
candidate (the opponent) attacking the in-group candidate (either a character or issue-based
attack), preceded by a horserace statement that the in-group‘s candidate has recently fallen
behind in the polls, or that the opponent has moved ahead in key battleground states. Similarly,
participants in the strong reassurance condition viewed an appeal ad from the in-group candidate
12
preceded by a reassuring horserace message that the in-group candidate had moved ahead in the
polls or that the opponent had fallen behind in key battleground states. We also analyzed two
conditions that contained a neutral video discussing the merits of presidential debates preceded
by the threatening or reassuring statements about the horserace. These were the ―weak threat‖
and ―weak reassurance‖ conditions. To reflect real campaign experience, we also explored two
―mixed message‖ conditions, in which either (1) the in-group candidate is ahead and the out-
group candidate attacks the opponent or (2) the in-group candidate is behind and the in-group
candidate attacks the opponent. Both of these conditions contain reassurance and threat.
YouGov-Polimetrix collected our data for a randomized population sample, weighted by
party, ideology, gender, race, education, news interest, and state of residence to maximize
representation of the American electorate. As a result, we do not include such demographic
variables as controls in our regression equations. However, we do use these and other
demographics as needed to test our hypotheses. Our analyses primarily rely on simple t-tests (to
explain the difference of means tests), supplemented with regression analyses (where we
consider the effects of multiple treatment conditions within a single analysis).
Statistical Analysis
Hypothesis 1
We focus first on the impact of the horserace narrative on voters‘ overall favorability
toward the candidates in the primary and general elections. We expect the effects of the
prevalent horserace narrative will be greater in primaries than in the general elections. Standing
in the polls provides more relevant information to primary than general election voters. There are
13
usually more than two candidates in the nominating contests and voters do not wish to waste
their votes. The information embedded in the ahead/behind trope is also more useful in
primaries than in general elections because the party heuristic is not available. In the general
election, the horserace narrative should not affect partisans‘ views of their candidates, since these
assessments are essentially fixed at this point. But there may be room for a horserace effect on
voters who have not yet made up their minds regarding whom to support in the last week of the
campaign.
In testing the impact of the horserace narrative on partisan and independent voters we felt
it necessary to carefully define these groups. We take three approaches to this task. First, we
examine subjects who planned to vote in the primary elections. We consider the ―Democrats‖ to
be those who planned to vote in the Democratic primaries, and ―Republicans‖ as those who
planned to vote in a Republican primary. This grouping allows us to study the effects of the
horserace on actual primary voters, and measure those effects at two points in time (January and
October).
Our second approach utilizes the standard National Election Study 7 point measure of
party identification, combined with a question measuring the importance of party identification
when voting for president. This allows us to gauge how important individuals‘ party
identification is to them when voting. We use this information to classify partisans as either
―strong,‖ ―medium‖ or ―weak‖ identifiers. In this measure, we consider independents who
―lean‖ towards either party to be partisans. We consider participants independent only if they do
not lean towards either major party. Finally, looking only at participants in October (when the
key variable was available), we compare those who plan to vote for Obama to those who plan to
vote for McCain.
14
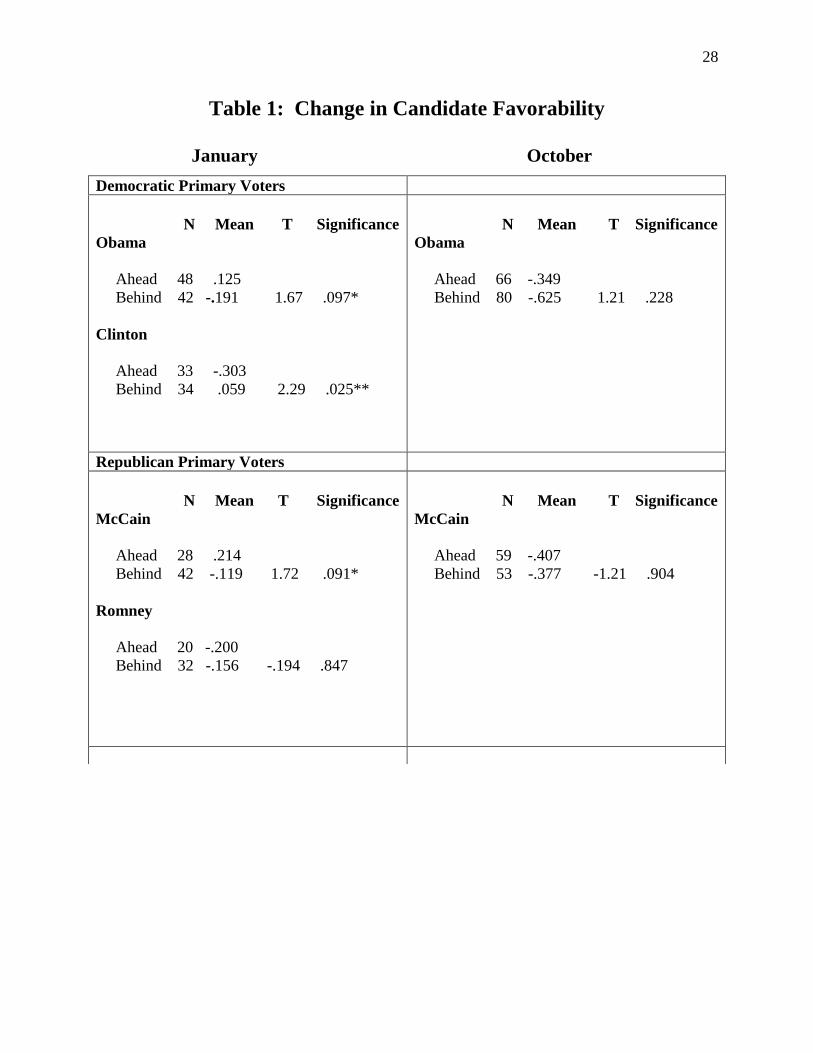
As predicted, the horserace messages had significant effects on candidate favorability
among primary voters in January. For Democratic primary voters, both Hillary Clinton‘s and
Barack Obama‘s favorability ratings differed significantly depending on whether they were
presented as ―ahead‖ or ―behind‖ in the race. Those who viewed the ―Clinton ahead‖ trope
experienced a drop in favorability, while those who viewed the ―Clinton behind‖ message saw a
slight increase in favorability (-.303 vs. .058, p<.05). Subjects who viewed the ―Obama ahead‖
message increased their favorability rating by .125, and those who viewed the ―Obama behind‖
message reduced their favorability rating (.125 vs. -.191, p<.10). It is interesting that while both
sets of horserace messages produced significant results, they moved in opposite directions.
Clinton favorability increased when Clinton was portrayed as losing, while Obama‘s favorability
increased when he was portrayed as the front runner.
The horserace metaphor also had a significant effect on Republican primary voters, but
only on McCain‘s favorability ratings. Exposure to a McCain ―ahead‖ horserace prompt led to
an increase in favorability, while the ―behind‖ prompt led to a decrease (.214 vs. -.119, p<.10).
Romney‘s favorability did not change significantly as a result of the horserace prompt, and
interestingly, went down in roughly equal amounts after exposure to both the ―ahead‖ and
―behind‖ message (-.200 vs. -.156, N.S.). With the exclusion of favorability towards Romney,
we found the horserace metaphor to have significant effects on primary voters‘ evaluations of the
candidates. In most cases, favorability increased after exposure to the ―ahead‖ prompt, and
decreased after exposure to the ―behind‖ prompt. However, Clinton was an exception, as her
favorability decreased when she was portrayed as a front-runner, and increased when she was
seen as losing. Prior research indicates that the decrease for Clinton is attributable to the strong
15
negative feelings she evoked. Apparently when she was portrayed as behind, those who felt
negatively towards her were mildly reassured and felt more favorable to her.
An analysis of subjects in October indicates that the horserace prompts had little to no
effect on partisans‘ favorability ratings of the candidates. Looking first at the respondents who
planned to vote in the primary elections (the same subjects approach we used in the January
analysis), we find no significant differences in candidate favorability between those shown ahead
and behind prompts.2
Using our party identification scale, we considered the possibility that the horserace
messages might affect partisans to different degrees depending on their strength of partisan
identification. While the strongest partisan supporters might be resistant to effects of the
horserace messages, the weaker supporters might be more susceptible. Breaking Democrats and
Republicans down into three groups – strong identifiers, medium identifiers and leaners – we
found the horserace prompts to have no significant effects on favorability.
We considered whether or not our definitions of partisanship might limit the statistical
significance of the tests. The primary vote intention filter limits the sample to subjects who
planned to vote in the primaries (and there was some panel replacement), the second broke
partisans down into three smaller categories. In order to include as much of the sample as
possible, we also compared subjects who planned to vote for Obama with those that planned to
vote for McCain in the general election. Although the number of subjects in our test groups
2 Democratic primary voters‘ favorability ratings went down regardless of prompt, and were -
.349 when shown the ―ahead‖ message and -.625 when shown the ―behind‖ message (N.S.).
Republican primary voters exhibited the same tendency, giving lower favorability ratings
following both prompts. Those who viewed the ―ahead‖ prompt had a favorability change of -
.407, while those shown the ―behind‖ prompt scored -.377 (N.S.).
16
grew, the differences between them remained statistically insignificant. Obama voters were not
significantly affected by the horserace prompts (mean favorability change -.585 vs. -.740, N.S.),
and neither were McCain voters (mean favorability change -.457 vs. -.395, N.S.). These results
confirm our expectation that by the end of the campaign, partisans‘ assessments of their
candidates‘ are largely fixed.
If horserace prompts did not affect partisans in October, the question remains whether or
not such prompts might affect independent voters. Looking just at pure independents (i.e. those
who did not lean to either party), we found that favorability scores for Obama were indeed
influenced by the horserace prompts (-.184 vs. .275, p<.10). Although there were differences in
McCain‘s favorability scores for (.300 vs. .140) they did not reach statistical significance.
Overall our findings support our expectations that the horserace metaphor has more
powerful effects during the primary campaigns than in general elections. The results also
demonstrate that while the horserace narrative had little effect on Democratic or Republican
partisans in the general election, horserace narratives have some influence on independents. In
2008 only the Democratic candidate‘s favorability was significantly affected, but an impact on
only one candidate could be enough to shift last minute votes.
Hypothesis 2
Our second hypothesis, based on IET, predicts that individuals who identify with a
political party are likely to react with heightened negative feelings of fear and anger directed at
an opponent when their own group is threatened. Our experiment simulates either a non-threat
or a threat condition by describing the party‘s candidate as either leading or trailing in the polls.
The non-threat, or rosy scenario, consists of a prompt indicating that one‘s fellow partisan
17
candidate is ahead, followed by a neutral video or positive ads. In both cases, the opposing
candidate was relatively unlikely to be responsible for provoking a spike in fear or anger. At the
opposite end of the spectrum were two levels of threat. The strong threat condition consisted of
a prompt indicating that the in-group candidate is trailing in the polls, reinforced by a subsequent
attack ad from the opposing candidate. The weak threat condition contains a prompt describing
the in-group candidate as behind, followed by a neutral video or a positive ad. We also
examined two mixed conditions -- when the party‘s candidate is projected to be ahead in the
polls but they view an attack on their own candidate; or the party‘s candidate is projected to be
behind and partisans view their own party‘s candidate attacking the opponent.
IET also predicts a relatively greater increase in anger for members of the group who feel
they are in a strong position compared to a group whose members feel they are in a weak
position. As the aforementioned Pew Center survey indicated, in October 2008 Democrats were
far more confident than Republicans that their candidate would win.
To lay out a baseline, we first investigated which party was angrier prior to exposure to
the treatment conditions. As predicted, we found that Republicans were indeed more angry at
Obama than Democrats were at McCain (39% vs. 31% expressing anger), though this 8
percentage point gap is only significant at p<.12. We next turn to the non-threat or rosy scenario.
We examined the change in feelings of anger and fear among Democrats and Republicans from
pre-test readings to post-test follow-ups when their own candidate is described as ahead or the
opposing candidate is characterized as behind, followed by a positive ad (by either candidate) or
a neutral video. In the rosy scenario, we expect partisan fear and anger toward the opponent to
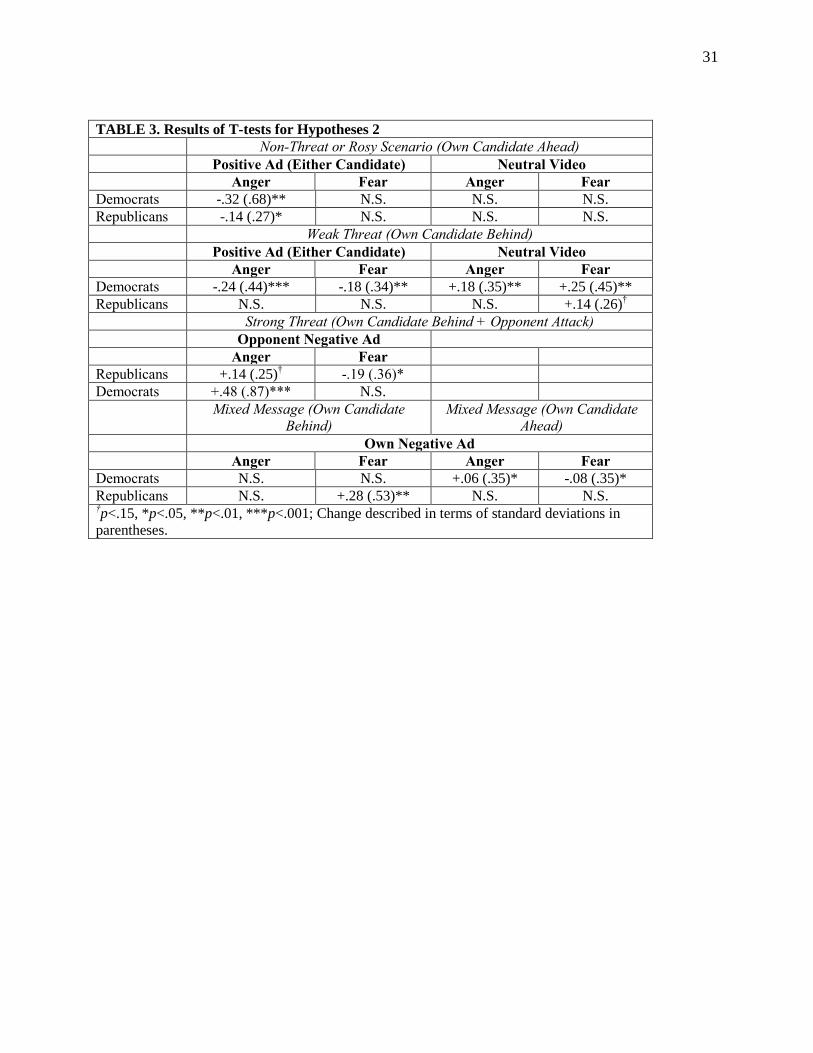
decline. We found that Democrats indeed became less angry at McCain after a reassuring
horserace message and positive ads (by -.32 points, or .68 standard deviations, p<.01)), but they
18
did not become less fearful of him. In the corresponding non-threat condition, Republicans
became less angry (by .14 points, or .27 standard deviations, p<.05), but not less fearful of
Obama. Neither Democrats‘ nor Republicans‘ fear or anger changed in response in neutral video
condition compared to the positive ad condition. Democratic and Republican party identifiers
behaved similarly in terms of fear and anger in the non-threat condition; each displayed lower
levels of anger following the treatments, but no change in fear.
In the strong threat condition – a horserace threat accompanied by an opponent‘s attack
ad – we predict that partisans will experience increased fear or anger directed at the opponent.
We found that Democrats became somewhat more fearful, but not significantly so (p<.16), but
much more angry (by .48 points, or .87 standard deviations, p<.00001). Republicans reacted
differently to the enhanced threat. They felt less fearful (by .19 points, or .36 standard
deviations, p<.05), but more angry, by .14 points, or .25 standard deviations. However, the anger
effect was only significant at p<.11. Democrats and Republicans diverged in terms of which
negative emotion was more heighted by the stimuli. This difference supports IET regarding
partisans in weak and strong conditions. Democrats, the group in the stronger position (i.e. more
confident in victory) did not become less fearful and did become more angry compared to
Republicans.
The weak threat condition emphasizes the impact of the horserace narrative. The
Horserace Threat is not reinforced by attack ads. In the first variant of this condition – Obama
described as behind in the polls, followed by a positive ad – Democrats became much less fearful
of (by .18 points, or .34 standard deviations, p<.01) and less angry at McCain (by .24 points, or
.44 standard deviations, p<.0001) relative to when they were exposed to other ad conditions.
19
Unlike the Democrats, however, Republicans‘ feelings of fear and anger towards Obama were not
significantly moderated when the horserace threat was accompanied by positive ads.
The second variant of the weak threat condition features a neutral video accompanying the
threat that one‘s own candidate is trailing in the polls. Here, as expected, Democrats feel more
fear (by .25 points, or .45 standard deviations, p<.01) and anger (by .18 points, or .35 standard
deviations, p<.01) toward McCain than they do in the positive ad condition. Republicans, in
contrast, do not vary significantly from the positive ad condition on either dimension.
We come next to the mixed message conditions. The first scenario we consider is similar
to the weak threat. The horserace prompt is threatening, but partisans view an ad by their own
candidate attacking the opponent. The contrasting messages should balance out. Indeed
Democrats‘ negative feelings towards McCain were significantly moderated when they received
a threatening horserace prompt, but watched Obama attack McCain. Republicans reacted
differently; they were much more responsive in this condition than they were following the weak
threat, positive ad condition. Watching McCain attack Obama increased their fear of Obama
following the horserace threat (by .277 points, or .53 standard deviations, p<.005). It seems the
McCain attack on Obama reinforced Republicans‘ fear. Again the partisans reacted in opposite
ways. In the weak threat/positive ad conditions, Republicans were unmoved, but Democrats
became less frightened. In the mixed threat, with their fellow partisan candidate on the attack,
Democrats are unmoved but Republicans were more frightened. An attack ad produced different
reactions among Democrats and Republicans.
In our exploration of the variations in fear and anger we encountered an unexpected
response by Democrats. Given a reassuring horserace scenario accompanied by an Obama attack
ad, Democrats become less fearful (by -.08 points, or .37 standard deviations, p<.05) but more
20
angry at Obama (by .06 points, or .35 standard deviations, p<.05). Democrats reacted negatively
to Obama when he went negative. Attack ads appear to interfere with their vision of Obama and
a candidate of hope and change. In the corresponding situation, Republicans were unmoved in
their feelings towards McCain (N.S.) .
Hypothesis 3
IET suggests that group expectations will correspond to threatening or non-threatening
conditions. So, for example, we anticipate that in-groups will expect their candidate to win,
given positive messages and will not expect victory given negative messages. In our October
experiment we have to qualify the nature of threats and non-threats in terms of the external
context of the election. Democrats were far more confident of victory than Republicans, so that
the perception of threat could be modified by the external reality confronting one group of
respondents, but not the other. In addition, people in non-battleground states were likely to know
what the overall expectation was for their candidate‘s success. That is why we employed a
horserace prompt that specified winning or losing in battleground states where the elections were
highly in doubt.
An analysis of our experimental results shows that the impact of news and ads on
emotions towards the candidates was significant and often asymmetrical for Democrats and
Republicans. The discrepancy supports IET‘s second focus on group profiles of emotion. We
found that news and ads had a significant effect on voters‘ expectations about who will win the
election, but Democrats and Republicans responded to very different emotional advertising
appeals. One of the most striking findings is that Democrats reacted to positive ads and
Republicans reacted to attack ads even following the same horserace scenarios. This part of the
analysis employs OLS regression, so that we can more easily control all of the treatment
21
conditions and interpret the results. We conducted separate regressions for each party in the
ahead or behind condition. The independent variables are the ads or neutral videos and the
dependent variable is the prediction of who will win. The coefficients are points on the 5-point
―will win‖ scale (where 1=minimum and 5=maximum expectation that a given candidate will
win the election).
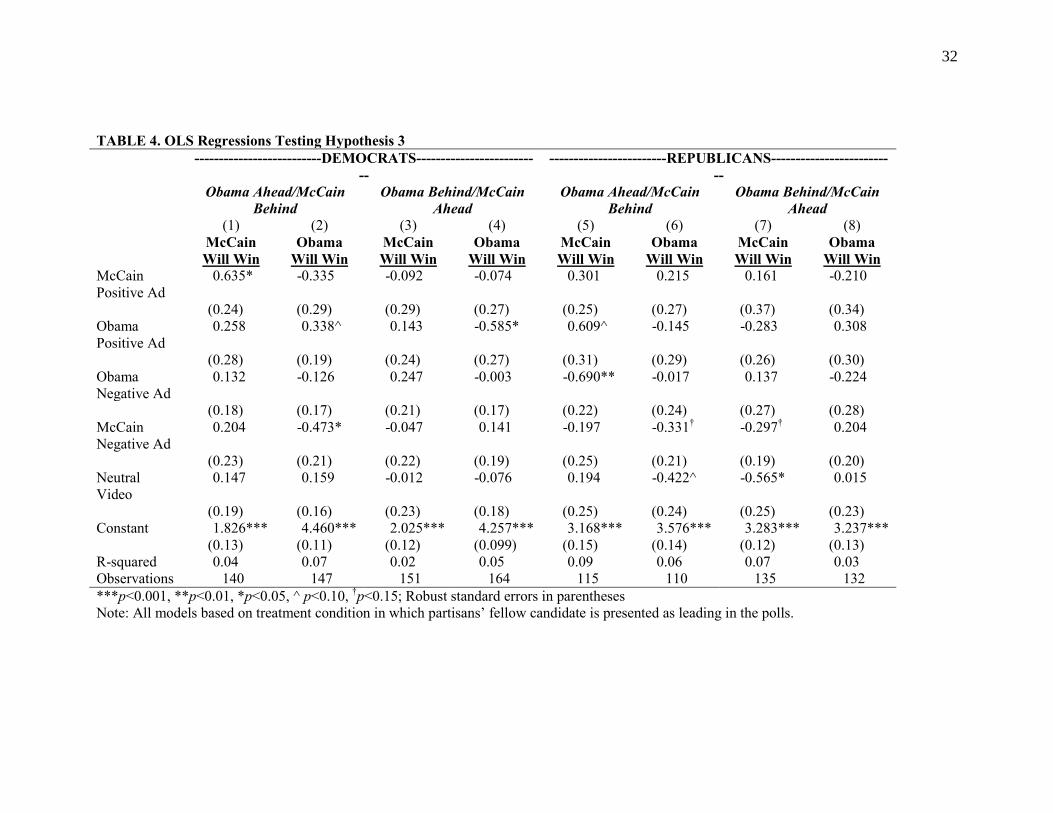
Given a prompt that their own candidate is ahead, a positive Obama ad increased
Democrats‘ perceived likelihood of their own candidate‘s winning the election (b= .34,
p<0.078). For Republicans, given the same kind of reassuring horserace prompt for their
candidate, a neutral video (b-.56, =.p <.129) or a negative McCain ad (b= -.3, p <.027)
decreased the perceived likelihood of McCain‘s winning. The positive ads had no effect on the
Republicans‘ expectation about their candidate‘s victory. What about the chances of the
opponent winning? Given a prompt that their own candidate is ahead, a McCain positive ad
increased Democrats‘ expectation that McCain would win (b=.64, p <0.01). For Republicans,
there were no such ad effects.
Following a threatening horserace prompt, an Obama positive ad decreased Democrats‘
expectation that he would win (b=-.58, p<0.029). Given the same threatening horserace prompt,
Republicans strongly reacted to an Obama negative ad (b= -.61, p<.003) in the anticipated
direction with a lower expectation of a McCain victory. Republicans also reacted to an Obama
positive ad, by increasing their expectations of a McCain victory (b=.61, p <.05).
In estimating the opponent‘s chance of winning when the opponent was ahead,
Democrats displayed no effects from positive or negative ads. Republicans, however, responded
to both a neutral video (b=-.42, p = <.084) and a McCain negative ad (b=-.33, p <.113) by
decreasing their estimated likelihood of an Obama victory.
22
The results (see Table 4) clearly demonstrate that Democrats reacted most strongly, one
way or another, to positive ads, while Republicans reacted most strongly to negative ads. These
are strikingly different results and underscore the different emotional profiles of the two sets of
partisans. As Ansolabehere and Iyengar (1997) suggest, Republicans are much more moved than
Democrats by negative ads. What is new here is that Democrats are much more moved than
Republicans by positive ads.
Conclusion
Our results speak to two issues raised by the pervasiveness of horserace messages in the
media and political advertising in the primary and general election campaigns. For the
nominating period, our results show that reports that a candidate is ahead or behind in the race
for the nomination have a significant impact on respondents‘ favorability toward candidates.
When candidates are described as trailing, their favorability decreases, except in the case of
Hillary Clinton, where the opposite effect prevailed. Previous analysis (Baum and Just, 2009),
shows that Clinton was so negatively perceived by a large portion of the electorate that she
gained in favor as she became less threatening. Still the results show an important impact for the
simple, but ubiquitous, news trope about the on-going campaign. While one might deplore
journalist‘s dependence on the game frame to describe the options for voters, the primaries
constitute a situation in which some messages about the relative viability of candidates could be
helpful to voters in choosing among a large field of candidates.
We expected that the general election would not constitute such a useful environment for
horserace messages. Most voters follow party cues during the general election and, by October,
most voters have made up their minds how to vote. Partisans can be expected to be essentially
resistant to dissonant messages about their party‘s candidate, particularly where they can believe
23
the race is not yet decided, as in battleground states. Given that likely scenario, the only group
that horserace messages are likely to influence is pure independents. Those who do not support
or even lean to one party or the other do not have party cues as a heuristic device and often make
up their minds later in the campaign. The message that one of the two major candidates is ahead
or behind might thus influence their favorability towards that candidate. Indeed, that is what we
found. Independent voters in the general election, while unmoved by information about
McCain‘s standing, were somewhat more favorable to Obama after exposure to the non-
threatening horserace scenario. Our findings suggest that the reason for mixed bandwagon-
underdog effects that previous researchers have described result from the underlying assessment
of the candidates. Candidates who are themselves threatening appear less so when they are
trailing. Social conservatives viewed Hillary Clinton as a feminist and Barack Obama as un-
American. Other candidates may get a boost from being portrayed as leading in the race. Our
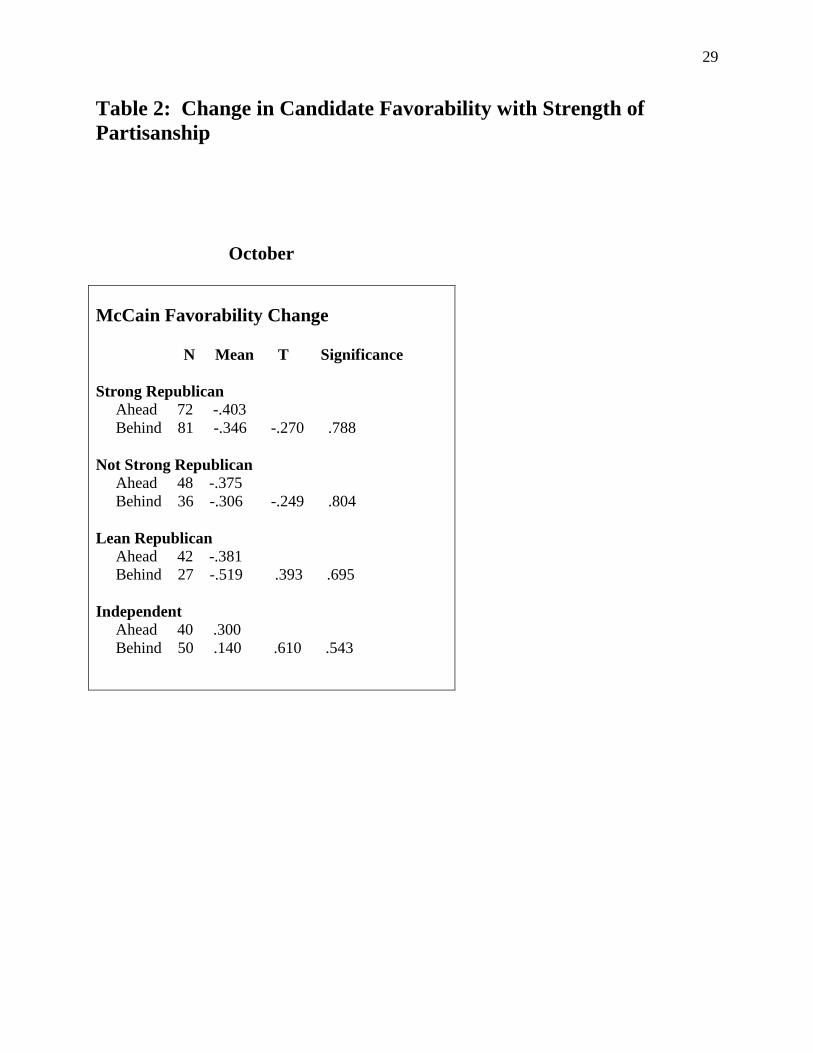
October results show a pattern (consistent, but generally not statistically significant) of candidate
favorability increasing after we showed them treatments featuring candidates portrayed as
leading in the polls. In fact, for weak Democrats the positive message is nearly significant, at p
<. 15 (See Table 2).
Partisan orientation plays an important role in helping us to understand not only the way
that voters will interpret horserace messages, but also the impact of political advertising. Prior
research (Zaller, 1992) suggests that receptivity to messages, especially dissonant messages,
depends on partisan predispositions. We expect that emotional responses of partisans play an
important role in how partisans process advertising messages (Brader, 2006, Neuman et al.,
2007). Our analysis shows that Intergroup Emotions Theory (IET) regarding threats to the in-
group is an effective tool for understanding why one group of partisans may react with fear and
24
another with anger from parallel threats. When a group is in a strong position, as Democrats
were in 2008, they are more likely to feel anger rather than fear when confronting in-group
threats. Table 3 shows strong evidence of a divergence between Democrats and Republicans in
encountering horserace threats. We note, also, that Democrats and Republicans react differently
to mixed messages. Republicans are reassured when their own candidate attacks the opponent,
while Democrats are not. In fact, Democrats responded negatively to their own candidate‘s
attack in a non-threatening condition. This unexpected finding suggests that either Obama‘s self-
presentation was at odds with negative advertising as far as Democrats were concerned or that
Democrats process attacks differently from Republicans.
Our subsequent analysis of the impact of positive and negative ads in different threat
conditions emphatically shows that Republicans prefer negative messages and that Democrats
prefer positive messages. Both preferences are significant and consistent for these data.
Previous research has noted the Republican side of the equation, but not the Democratic side. Of
course we cannot extrapolate from this finding beyond the case of 2008, when the political
context highlighted positive emotions of hope and change focused on the Democratic candidate.
We note that Barack Obama took the Democrats‘ preference into account in his Web ads (though
not his television ads). Knowing that he was addressing co-partisans, Obama posted all positive
ads on the Internet (Crigler et al., 2010). Further research will be required to demonstrate
whether this critical divergence between the parties is an aberration or a partisan cultural theme.
25
References
Abelson, Robert P., Donald R. Kinder, Mark D. Peters, and Susan T. Fiske. 1982. Affective and
Semantic Components in Political Person Perception. Journal of Personality and Social
Psychology 42 (4): 619-30.
Abramowitz, Allan. 1989. Viability, Electability and candidate Choice in a Presidential Primary
Election: A Test of Competing Models. Journal of Politics 51(4):16.
Ansolabehere, Stephen and Shanto Iyengar. 1997. Going Negative: How Political
Advertisements Shrink and Polarize the Electorate. New York: Simon and Schuster.
Baum, Matthew and Marion Just. 2009. Bandwagon and Underdog Effects in the 2008
Presidential Primary Campaign: A Survey Experiment. Paper presented at the annual
meeting of the American Political Science Association, Toronto, Canada.
Brader, Ted. 2005. Striking a responsive chord: How political ads motivate and persuade voters
by appealing to emotions. American Journal of Political Science 49(2): 388-405.
Brader, Ted. 2006. Campaigning for Hearts and Minds. How Emotional Appeals in Political Ads
Work. Chicago: University of Chicago Press.
Crespin, M., Paul-Henri Gurian and Audrey Haynes. 2000. Winnowing: A Longitudinal
Examination of Candidate Drop-Out Rates in the Post Reform Nomination Campaign.
Paper presented at the Annual Meeting of the Southern Political Science Association,
Atlanta, GA.
Crigler, Ann, Marion Just, Lauren Hume, Jesse Mills, and Parker Hevron. 2010. Internet and TV
Advertising Campaigns: Obama vs. McCain in 2008. Paper presented at the Institute of
Leadership Studies, Dilemmas of Democracy Conference, Politics in the Age of New
Media, Loyola Marymount University, Los Angeles, CA.
Crisp, Richard J., Sarah Heuston, Matthew J. Farr and Rhiannon N. Turner. 2007. Seeing red or
feeling blue: Differentiated intergroup emotions and in-group identification in soccer
fans. Group Processes & Intergroup Relations 10(1): 9-26.
Farnsworth, Stephen and S. Robert Lichter. 2006. The Nightly News Nightmare: Network
Television’s Coverage of U.S. Presidential Elections, 1988-2004, 2nd
edition. New York:
Rowman and Littlefield.
Green, Donald, Bradley Palmquist, and Eric Schickler. 2002. Partisan Hearts and Minds:
Political Parties and the Social Identities of Voters. New Haven: Yale University Press.
Greene, S. 1999. Understanding party identification: A social identity approach. Political
Psychology 20(2): 393-403.
Greene, S. 2004. Social identity theory and party identification. Social Science Quarterly 85(1):
136-53.
26
Gurian, Paul-Henri and A. Haynes. Presidential Nomination Campaigns: Toward 2004. PS:
Political Science and Politics 36(2): 6.
Hofstetter, C. Richard. 1976. Bias in the News: Network Television Coverage of the 1972
Election Campaign. Columbus, OH: Ohio State University Press.
Huddy, L, and L. Mason. 2008. Heated campaign politics: An intergroup conflict model of
partisan emotions. Paper presented at the annual meeting of the American Political
Science Association, Boston, Massachusetts.
Jost, John, Jack Glaser, Arie W. Kruglanski and Frank Sulloway. 2003. Political Conservatism
as Motivated Social Cognition. Psychological Bulletin 129(3): 339-375.
Just, Marion, Ann Crigler, Dean Alger, Timothy Cook, Montague Kern and Darrell West. 1996.
Crosstalk: Citizens, Candidates and the Media in a Presidential Campaign. Chicago, IL:
University of Chicago Press.
Lakoff, George. 2002. Moral Politics: What Conservatives Know that Liberals Don’t 2nd
edition. Chicago: University of Chicago Press.
Lazarus, R.S. 1991. Emotion and Adaptation. New York: Oxford University Press.
Lazarus, R.S. 2001. ―Relational Meaning and Discrete Emotions‖. In Appraisal Processes in
Emotion: Theory, Methods, Research, eds. Angela Schorr, Klaus Scherer, Tom Johnston,
37-67. Oxford: Oxford University Press.
Mackie, Diane M., Thierry Devos and Eliot R. Smith. 2000. Intergroup emotions: Explaining
offensive action tendencies in an intergroup context. Journal of Personality and Social
Psychology 79(4): 602-616.
Mackie, D. M., L. Silver, L., & D.M. Smith. 2004. Intergroup emotions: Emotion as an
intergroup phenomenon. In The Social Life of Emotion, eds. L. Z. Tiedens & C. W.
Leach, 227-254. Cambridge, UK: Cambridge University Press.
Mann, Thomas E. and Gary R. Orren, eds. 1992. Media Polls in American Politics. Washington,
DC: The Brookings Institute.
Marcus, George, W. Russell Neuman, Michael MacKuen. 2000. Affective Intelligence and
Political Judgment. Chicago: University of Chicago Press.
Mendelsohn, Harold and Irving Crespi. 1970. Polls, Television and the New Politics. Scranton,
PA: Chandler Publishing Company.
Milburn, Michael A., S.D. Conrad, Fabio Sala, and Sheryl Carberry. 1995. Childhood
Punishment, Denial and Political Attitudes. Political Psychology 16(3): 454-478.
Mutz, Diana. 1995. Effects of Horse-Race Coverage on Campaign Coffers: Strategic
Contributing in Presidential Primaries. Journal of Politics 57(4):28.
27
Neuman, W. Russell, George Marcus, Ann Crigler and Michael MacKuen. 2007. The Affect
Effect: Dynamics of Emotion in Political Thinking and Behavior. Chicago: University of
Chicago Press.
Project for Excellence in Journalism. 2008. Character and the Primaries of 2008.
http://www.journalism.org/node/11266
Scherer, Klaus R. and Tobias Brosch. 2009. Culture-Specific Appraisal Biases Contribute to
Emotion Dispositions. European Journal of Personality. 23: 265-288.
Smith, Craig A. and Leslie D. Kirby. Toward delivering on the promise of appraisal
theory. 2001. In Appraisal Processes in Emotion: Theory, Methods, Research, eds.
Angela Schorr, Klaus Scherer, Tom Johnstone. Oxford: Oxford University Press.
Smith, Eliot R. and Diane M. Mackie. 2008. Intergroup Emotions. In Handbook of Emotions
3rd edition eds. Michael Lewis, Jeannette M. Haviland-Jones, Lisa Feldman Barrett, 428-
439. New York: Guilford Press.
Smith, E. R., Seger, C. R., & Mackie, D. M. 2007. Can emotions be truly group level? Evidence
for four conceptual criteria. Journal of Personality and Social Psychology, 93: 431-46.
Tajfel, H. 1974. Social identity and intergroup behavior. Social Science Information. 3(2): 65-93.
Tajfel, H. 1978. Differentiation between Social Groups: Studies in the Social Psychology of
Intergroup Relations. London: Academic Press.
Tajfel, H. and Turner J.C. 1979. An integrative theory of intergroup conflict. In The Social
Psychology of Intergroup Relations, eds. William G. Austin and Stephen Worchel.
Monterey: Brooks/Cole Publishing Co.
Tajfel, H. and Turner, J. C. 1986. The social identity theory of inter-group behavior. In
Psychology of Intergroup Relations, eds. S. Worchel and L. W. Austin. Chicago:
Nelson-Hall.
Turner, J. C., M.A. Hogg, P. J. Oakes, S. D. Reicher, and M. S. Wetherell. 1987. Rediscovering
the Social Group: A Self-categorization Theory. Oxford: Oxford University Press.
Yzerbyt, V. Y. M. Dumont, D. Wigboldus, and E. Gordijn. 2003. I Feel for Us: The Impact of
Categorization and Identification on Emotions and Action Tendencies. British Journal of
Social Psychology 42: 533-549.
Zaller, John. 1992. The Nature and Origins of Mass Opinion. Cambridge: Cambridge
University Press.
28
Table 1: Change in Candidate Favorability
January October
Democratic Primary Voters
N Mean T Significance
Obama
Ahead 48 .125
Behind 42 -.191 1.67 .097*
Clinton
Ahead 33 -.303
Behind 34 .059 2.29 .025**
N Mean T Significance
Obama
Ahead 66 -.349
Behind 80 -.625 1.21 .228
Republican Primary Voters
N Mean T Significance
McCain
Ahead 28 .214
Behind 42 -.119 1.72 .091*
Romney
Ahead 20 -.200
Behind 32 -.156 -.194 .847
N Mean T Significance
McCain
Ahead 59 -.407
Behind 53 -.377 -1.21 .904
29
Table 2: Change in Candidate Favorability with Strength of
Partisanship
October
McCain Favorability Change N Mean T Significance
Strong Republican
Ahead 72 -.403
Behind 81 -.346 -.270 .788
Not Strong Republican Ahead 48 -.375
Behind 36 -.306 -.249 .804
Lean Republican Ahead 42 -.381
Behind 27 -.519 .393 .695
Independent Ahead 40 .300
Behind 50 .140 .610 .543
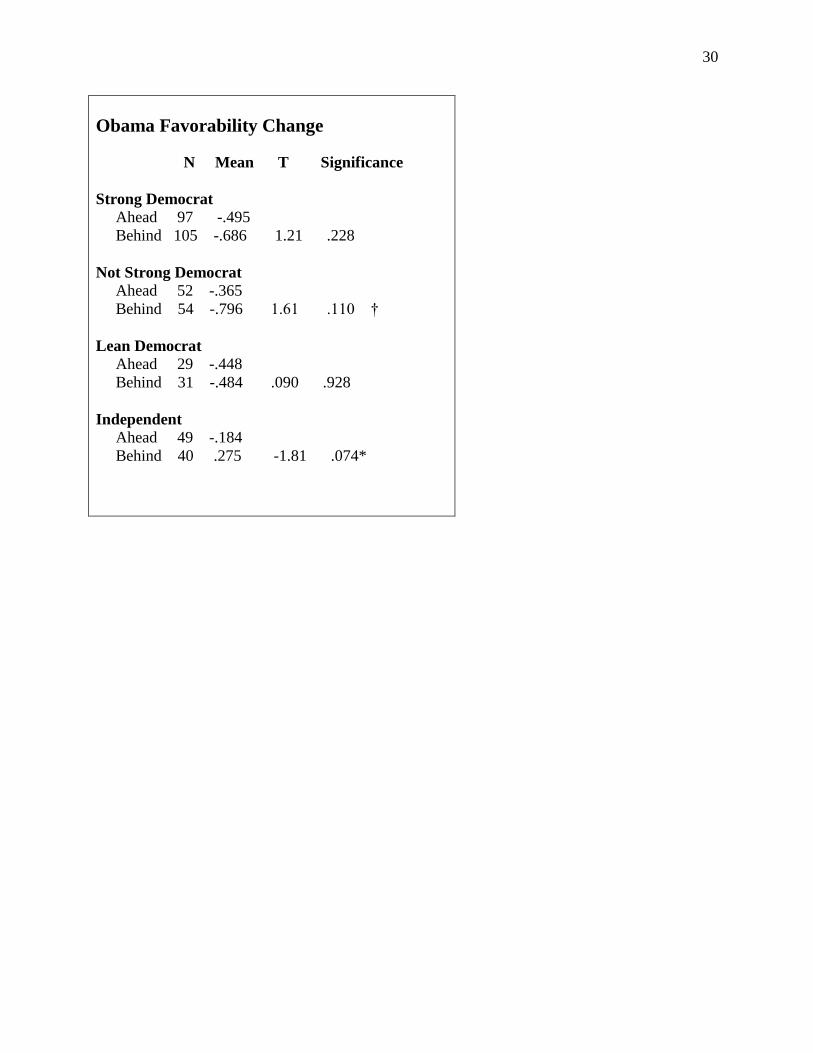
30
Obama Favorability Change
N Mean T Significance
Strong Democrat
Ahead 97 -.495
Behind 105 -.686 1.21 .228
Not Strong Democrat
Ahead 52 -.365
Behind 54 -.796 1.61 .110 †
Lean Democrat
Ahead 29 -.448
Behind 31 -.484 .090 .928
Independent
Ahead 49 -.184
Behind 40 .275 -1.81 .074*
31
TABLE 3. Results of T-tests for Hypotheses 2
Non-Threat or Rosy Scenario (Own Candidate Ahead)
Positive Ad (Either Candidate) Neutral Video
Anger Fear Anger Fear
Democrats -.32 (.68)** N.S. N.S. N.S.
Republicans -.14 (.27)* N.S. N.S. N.S.
Weak Threat (Own Candidate Behind)
Positive Ad (Either Candidate) Neutral Video
Anger Fear Anger Fear
Democrats -.24 (.44)*** -.18 (.34)** +.18 (.35)** +.25 (.45)**
Republicans N.S. N.S. N.S. +.14 (.26)†
Strong Threat (Own Candidate Behind + Opponent Attack)
Opponent Negative Ad
Anger Fear
Republicans +.14 (.25)† -.19 (.36)*
Democrats +.48 (.87)*** N.S.
Mixed Message (Own Candidate
Behind)
Mixed Message (Own Candidate
Ahead)
Own Negative Ad
Anger Fear Anger Fear
Democrats N.S. N.S. +.06 (.35)* -.08 (.35)*
Republicans N.S. +.28 (.53)** N.S. N.S. †p<.15, *p<.05, **p<.01, ***p<.001; Change described in terms of standard deviations in
parentheses.
32
TABLE 4. OLS Regressions Testing Hypothesis 3
--------------------------DEMOCRATS------------------------
--
------------------------REPUBLICANS------------------------
--
Obama Ahead/McCain
Behind
Obama Behind/McCain
Ahead
Obama Ahead/McCain
Behind
Obama Behind/McCain
Ahead
(1) (2) (3) (4) (5) (6) (7) (8)
McCain
Will Win
Obama
Will Win
McCain
Will Win
Obama
Will Win
McCain
Will Win
Obama
Will Win
McCain
Will Win
Obama
Will Win
McCain
Positive Ad
0.635* -0.335 -0.092 -0.074 0.301 0.215 0.161 -0.210
(0.24) (0.29) (0.29) (0.27) (0.25) (0.27) (0.37) (0.34)
Obama
Positive Ad
0.258 0.338^ 0.143 -0.585* 0.609^ -0.145 -0.283 0.308
(0.28) (0.19) (0.24) (0.27) (0.31) (0.29) (0.26) (0.30)
Obama
Negative Ad
0.132 -0.126 0.247 -0.003 -0.690** -0.017 0.137 -0.224
(0.18) (0.17) (0.21) (0.17) (0.22) (0.24) (0.27) (0.28)
McCain
Negative Ad
0.204 -0.473* -0.047 0.141 -0.197 -0.331† -0.297
† 0.204
(0.23) (0.21) (0.22) (0.19) (0.25) (0.21) (0.19) (0.20)
Neutral
Video
0.147 0.159 -0.012 -0.076 0.194 -0.422^ -0.565* 0.015
(0.19) (0.16) (0.23) (0.18) (0.25) (0.24) (0.25) (0.23)
Constant 1.826*** 4.460*** 2.025*** 4.257*** 3.168*** 3.576*** 3.283*** 3.237***
(0.13) (0.11) (0.12) (0.099) (0.15) (0.14) (0.12) (0.13)
R-squared 0.04 0.07 0.02 0.05 0.09 0.06 0.07 0.03
Observations 140 147 151 164 115 110 135 132
***p<0.001, **p<0.01, *p<0.05, ^ p<0.10, †p<0.15; Robust standard errors in parentheses
Note: All models based on treatment condition in which partisans’ fellow candidate is presented as leading in the polls.