Embed Size (px)
Citation preview
© CSIR 2006
Emissions from savanna wildfires
Dr RJ (Bob) Scholes
Council for Scientific and Industrial Research Natural Resources and EnvironmentPretoria, South Africa
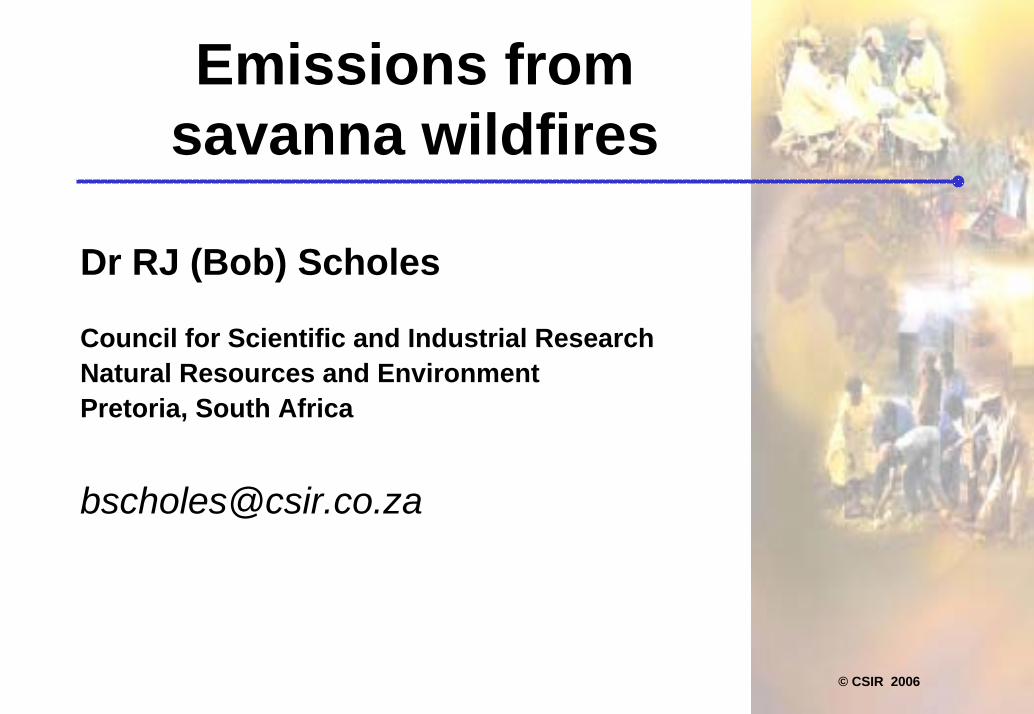
The major extent of wildfire is in savannasAfrica has 60% of the global savanna area
Active fire products: Global Fire Atlas, Modis, AVHRR, DMSP, etc
© CSIR 2006
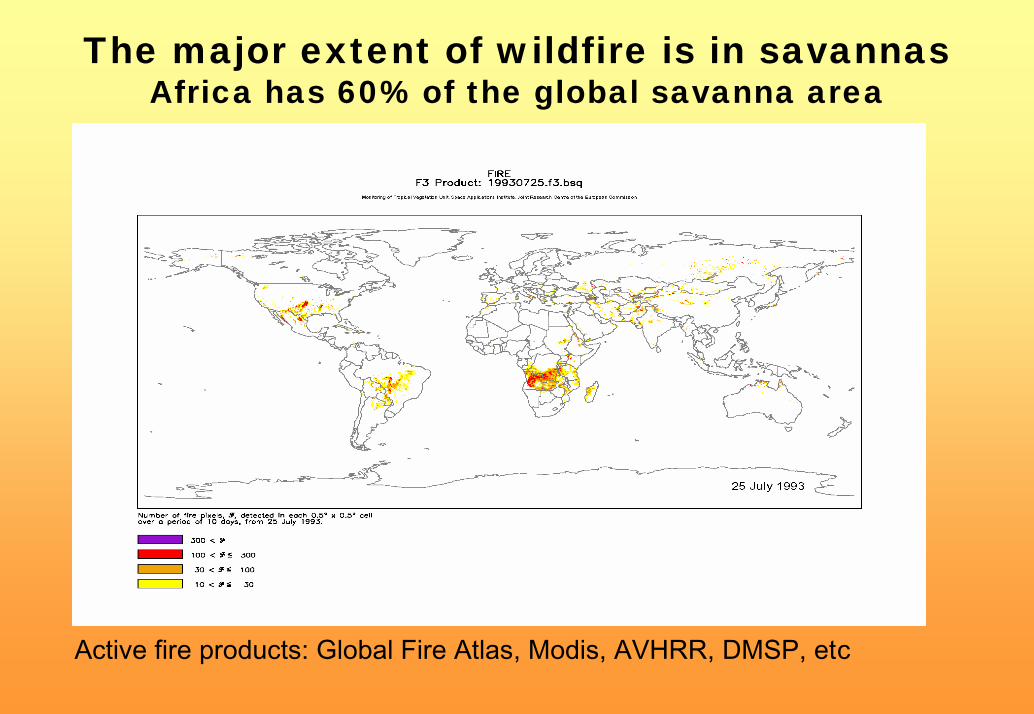
Safari experiments
Key sourcesSpecial edition of JGR 101(D19) for results of SAFARI 92 (1996)Special edition of JGR 108 (D13) for results of SAFARI 2000 (2004)
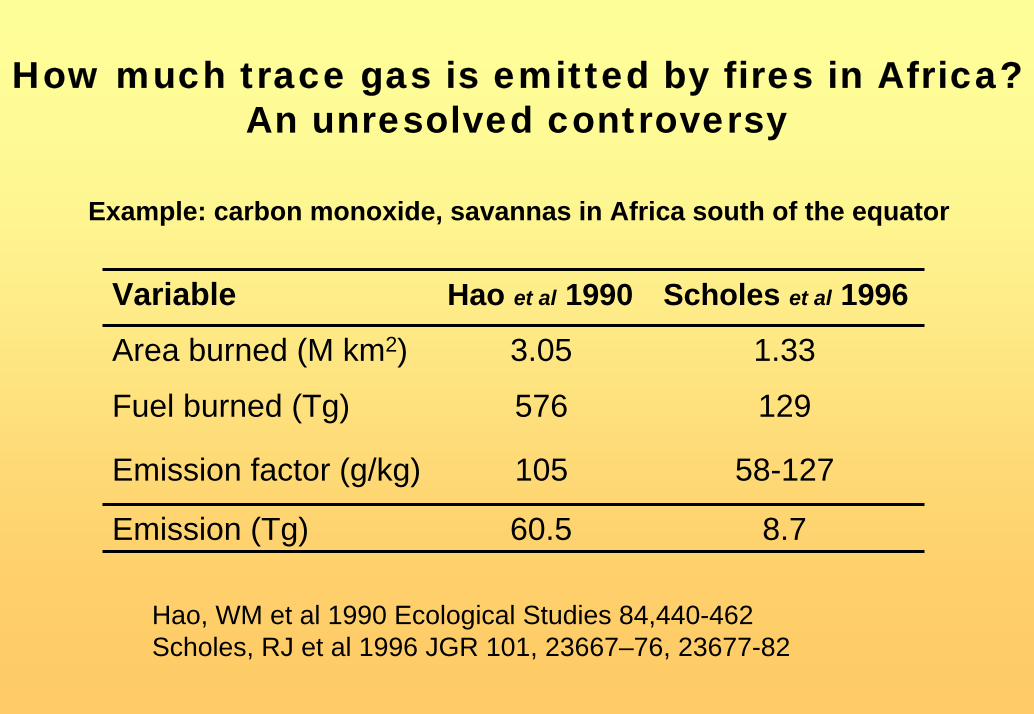
How much trace gas is emitted by fires in Africa?An unresolved controversy
Example: carbon monoxide, savannas in Africa south of the equator
Variable Hao et al 1990 Scholes et al 1996
Area burned (M km2) 3.05 1.33
Fuel burned (Tg) 576 129
Emission factor (g/kg) 105 58-127
Emission (Tg) 60.5 8.7
Hao, WM et al 1990 Ecological Studies 84,440-462Scholes, RJ et al 1996 JGR 101, 23667–76, 23677-82
Outline
• Why do savannas burn?• What area of savannas burn?• How much fuel is consumed?• What gases and particles are emitted?• What are the consequences?

Why does Africa burn?
Active firesMay-Oct 1989NOAA_AVHRRJ Kendall, NASA
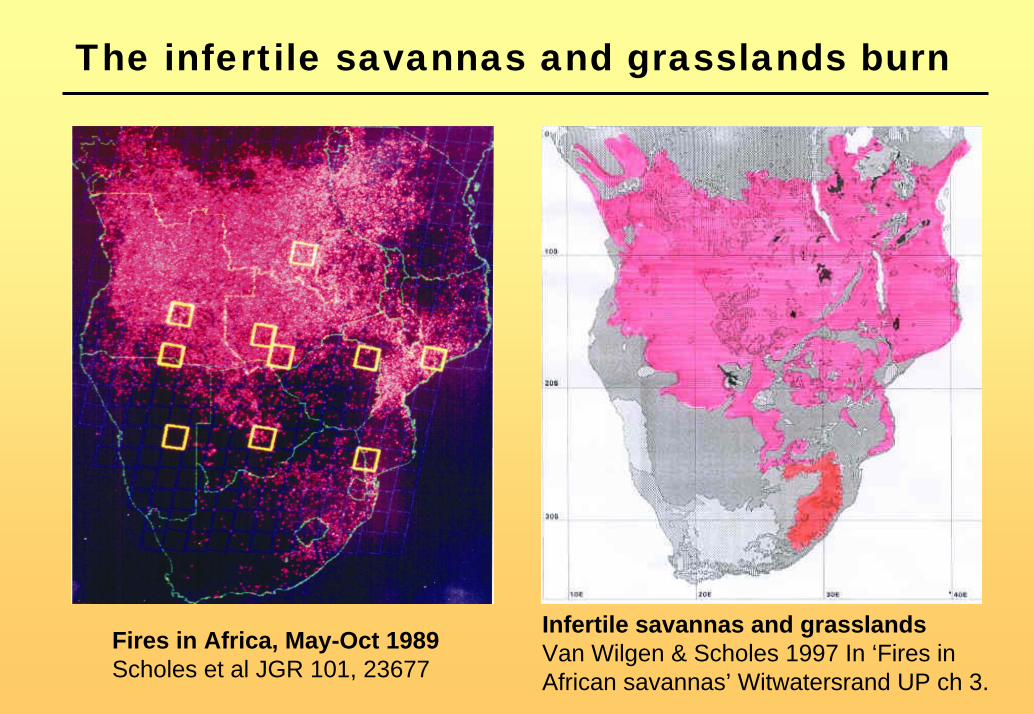
The infertile savannas and grasslands burn
Infertile savannas and grasslandsVan Wilgen & Scholes 1997 In ‘Fires in African savannas’ Witwatersrand UP ch 3.
Fires in Africa, May-Oct 1989Scholes et al JGR 101, 23677
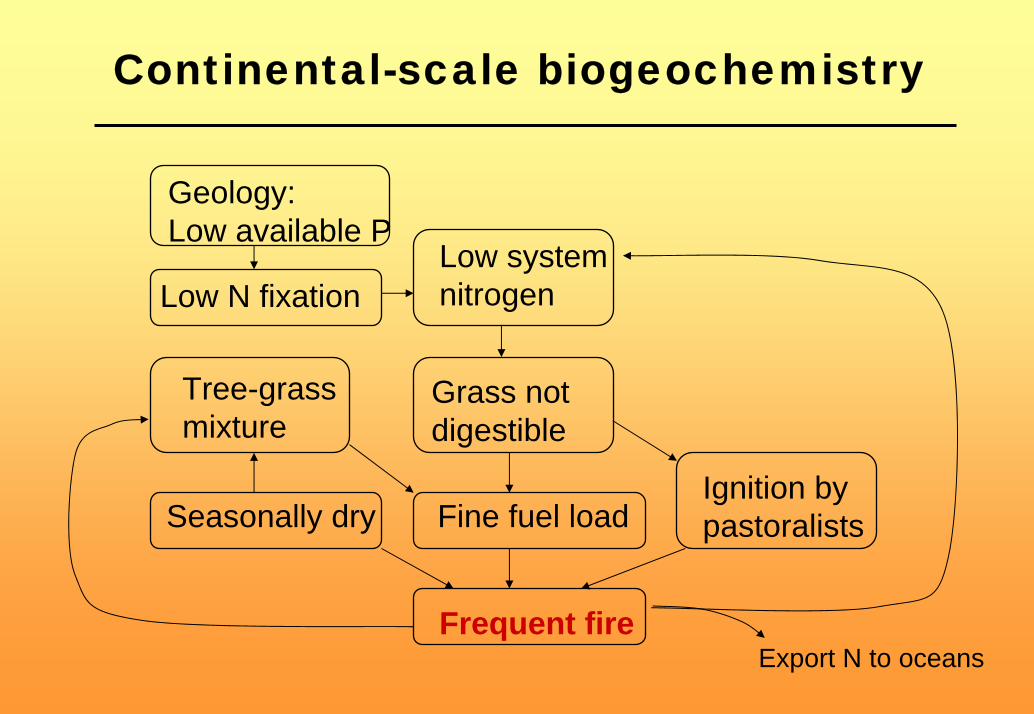
Continental-scale biogeochemistry
Frequent fire
Seasonally dry Fine fuel loadIgnition by pastoralists
Grass notdigestible
Low systemnitrogen
Tree-grassmixture
Geology:Low available P
Low N fixation
Export N to oceans

Environmental evidence of frequent fires in Africa for ~ 5 million years– Seasonal wet/dry in place
since current continental configuration established
– Coevolution of life history strategies
– Nutrient poor savannas are indirect evidence of a long-term nitrogen leak
Africa has burned for millennia
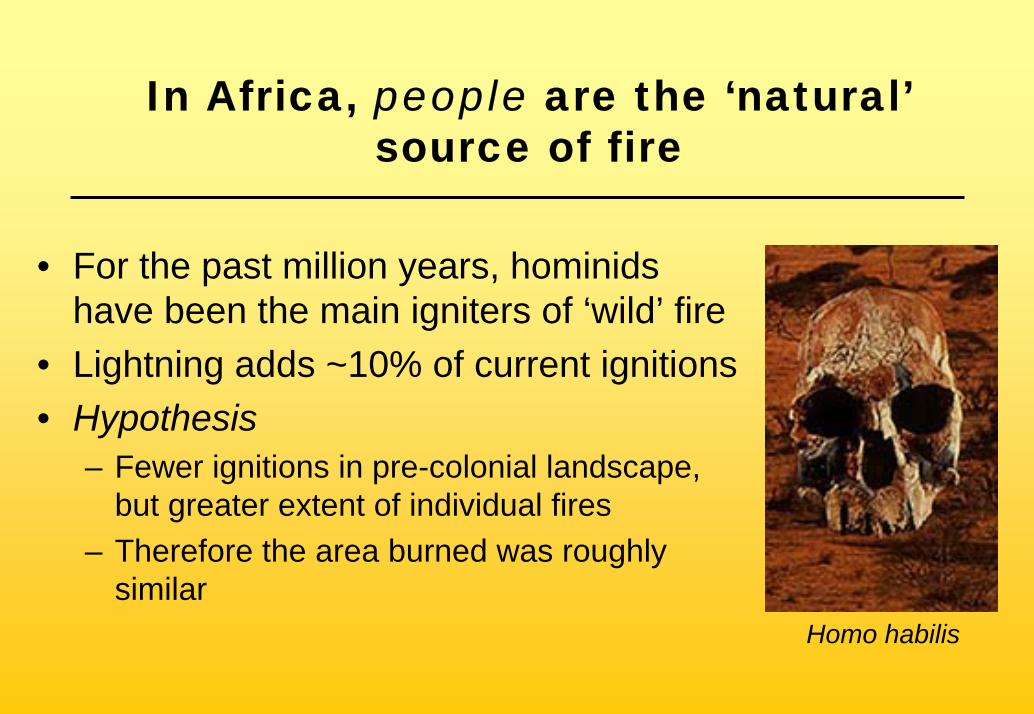
In Africa, people are the ‘natural’source of fire
• For the past million years, hominids have been the main igniters of ‘wild’ fire
• Lightning adds ~10% of current ignitions• Hypothesis
– Fewer ignitions in pre-colonial landscape, but greater extent of individual fires
– Therefore the area burned was roughly similar
Homo habilis
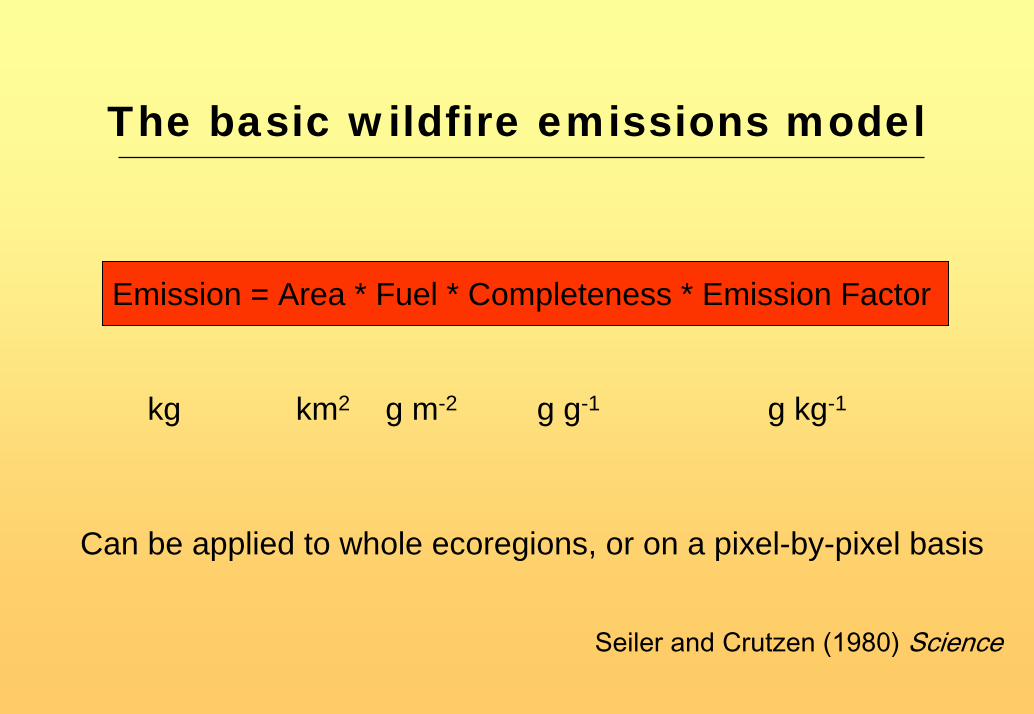
The basic wildfire emissions model
Emission = Area * Fuel * Completeness * Emission Factor
kg km2 g m-2 g g-1 g kg-1
Can be applied to whole ecoregions, or on a pixel-by-pixel basis
Seiler and Crutzen (1980) Science
© CSIR 2006
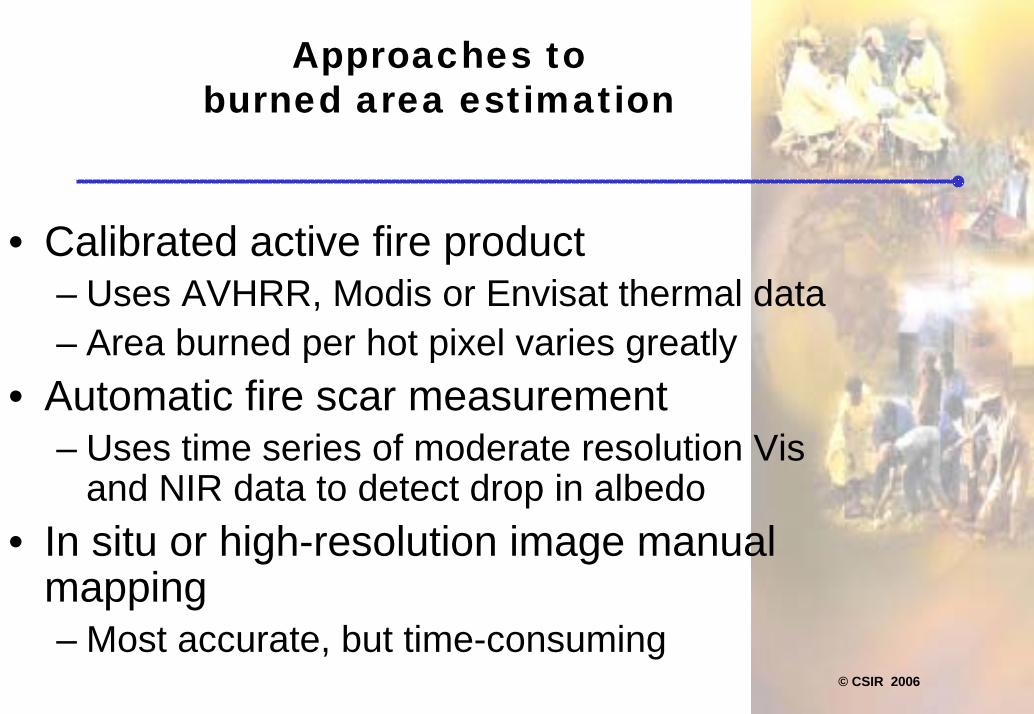
Approaches to burned area estimation
• Calibrated active fire product– Uses AVHRR, Modis or Envisat thermal data– Area burned per hot pixel varies greatly
• Automatic fire scar measurement– Uses time series of moderate resolution Vis
and NIR data to detect drop in albedo• In situ or high-resolution image manual
mapping– Most accurate, but time-consuming
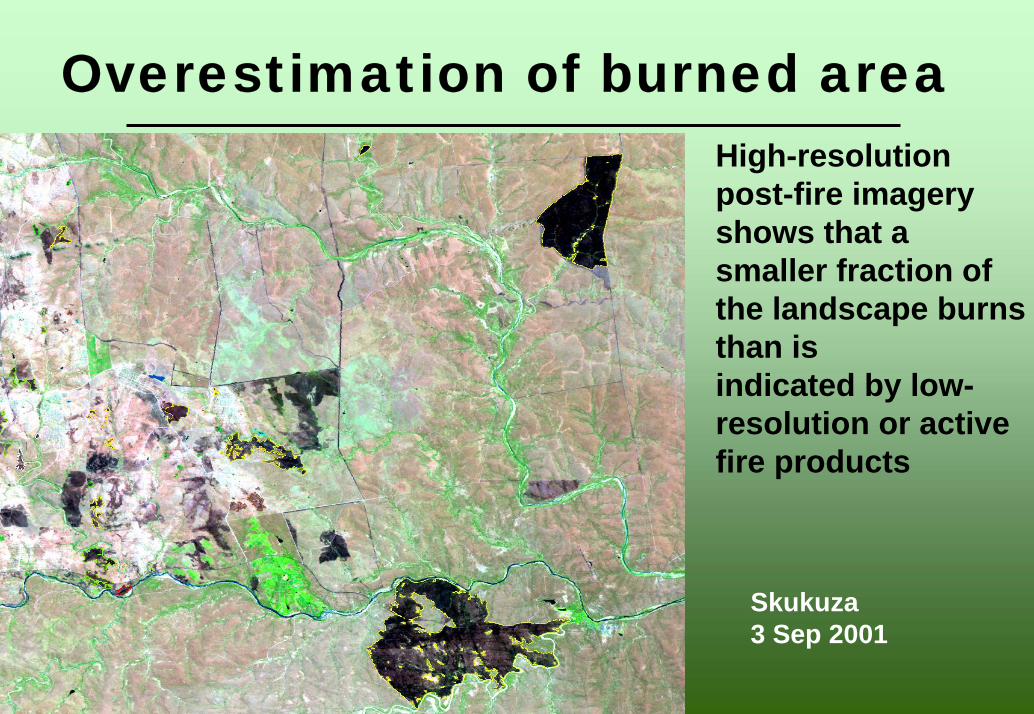
Overestimation of burned areaHigh-resolution post-fire imagery shows that a smaller fraction of the landscape burns than is indicated by low-resolution or active fire products
Skukuza3 Sep 2001
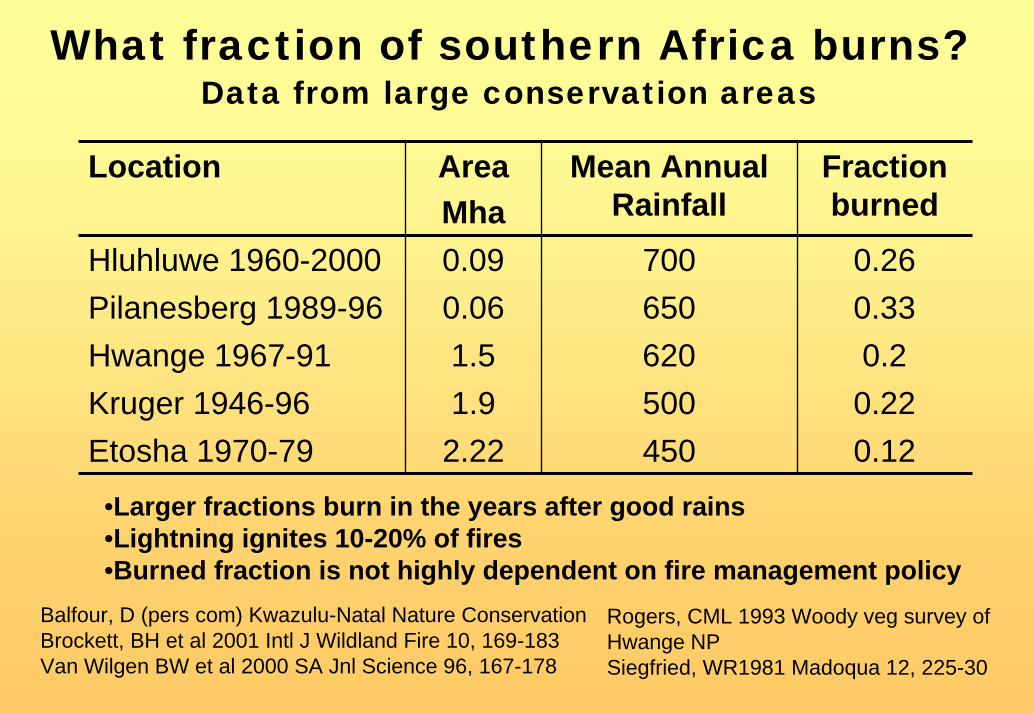
What fraction of southern Africa burns?Data from large conservation areas
Location AreaMha
Mean Annual Rainfall
Fraction burned
Hluhluwe 1960-2000 0.090.06
Hwange 1967-91 1.5 620 0.2Kruger 1946-96 1.9 500 0.22
2.22
700 0.26Pilanesberg 1989-96 650 0.33
Etosha 1970-79 450 0.12
•Larger fractions burn in the years after good rains•Lightning ignites 10-20% of fires•Burned fraction is not highly dependent on fire management policy
Balfour, D (pers com) Kwazulu-Natal Nature ConservationBrockett, BH et al 2001 Intl J Wildland Fire 10, 169-183Van Wilgen BW et al 2000 SA Jnl Science 96, 167-178
Rogers, CML 1993 Woody veg survey of Hwange NPSiegfried, WR1981 Madoqua 12, 225-30
© CSIR 2006
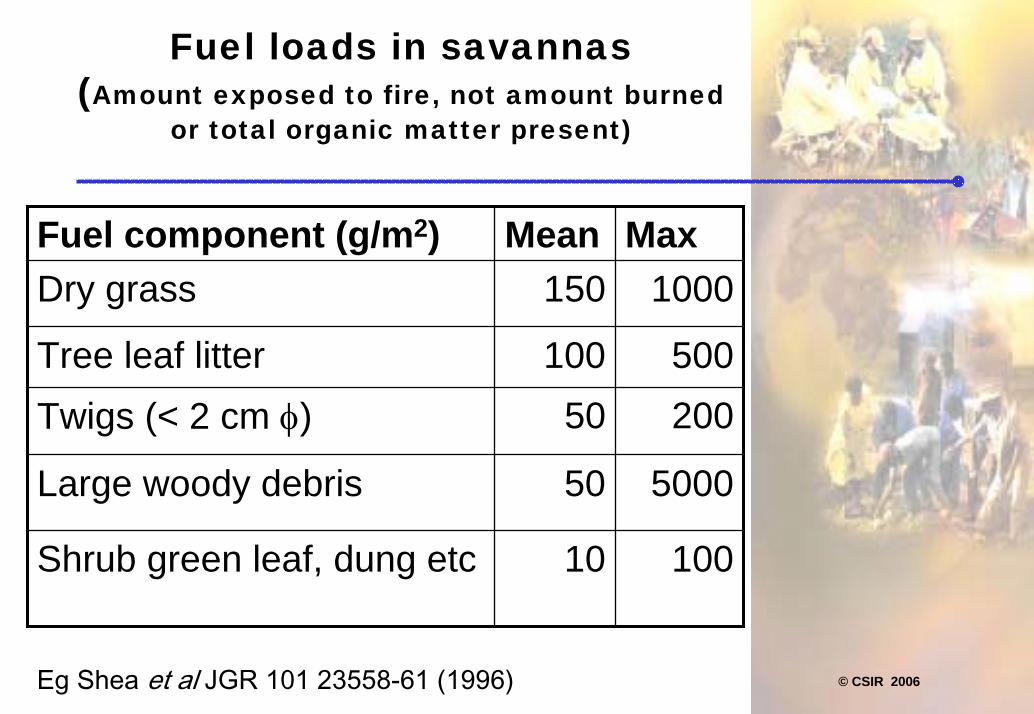
Fuel loads in savannas(Amount exposed to fire, not amount burned
or total organic matter present)
Fuel component (g/m2) Mean MaxDry grass 150 1000
Tree leaf litter 100 500Twigs (< 2 cm φ) 50 200
Large woody debris 50 5000
Shrub green leaf, dung etc 10 100
Eg Shea et al JGR 101 23558-61 (1996)
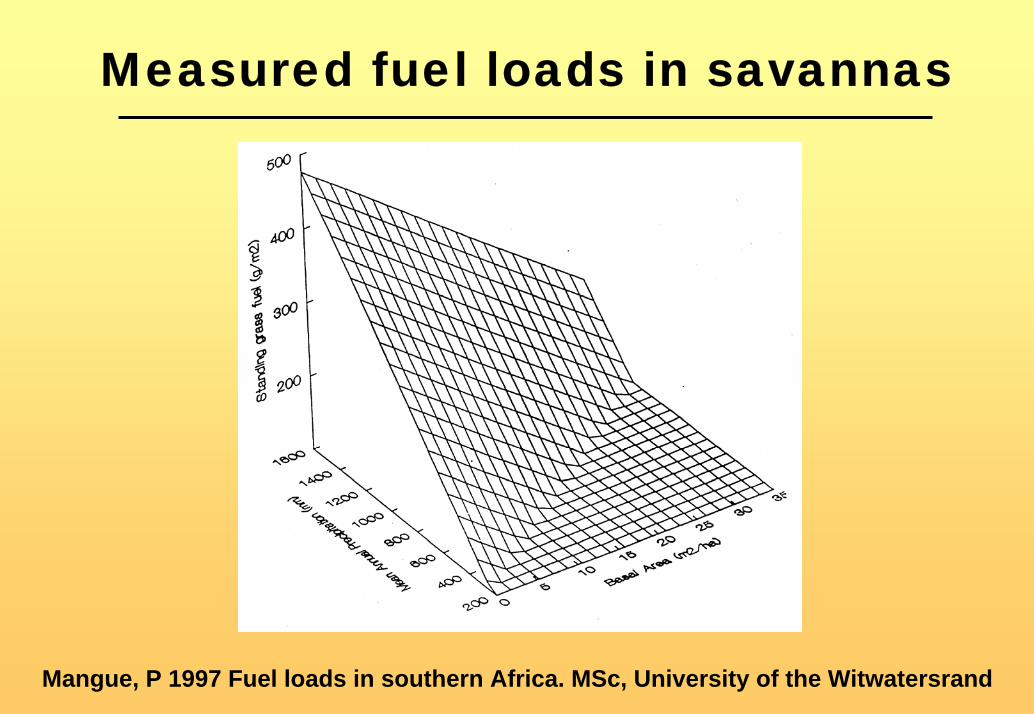
Measured fuel loads in savannas
Mangue, P 1997 Fuel loads in southern Africa. MSc, University of the Witwatersrand
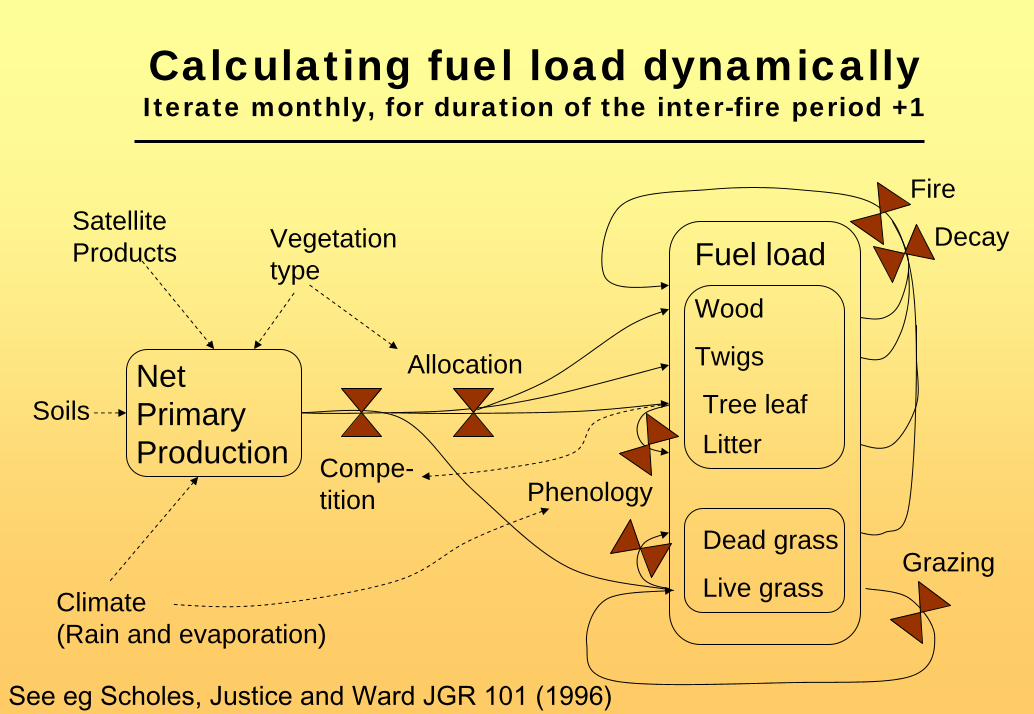
Calculating fuel load dynamicallyIterate monthly, for duration of the inter-fire period +1
Fuel load
Tree leafLitter
Twigs
Wood
Live grass
Dead grass
Net Primary Production
Allocation
Phenology
Decay
Grazing
Compe-tition
Fire
Soils
SatelliteProducts
Climate(Rain and evaporation)
Vegetation type
See eg Scholes, Justice and Ward JGR 101 (1996)
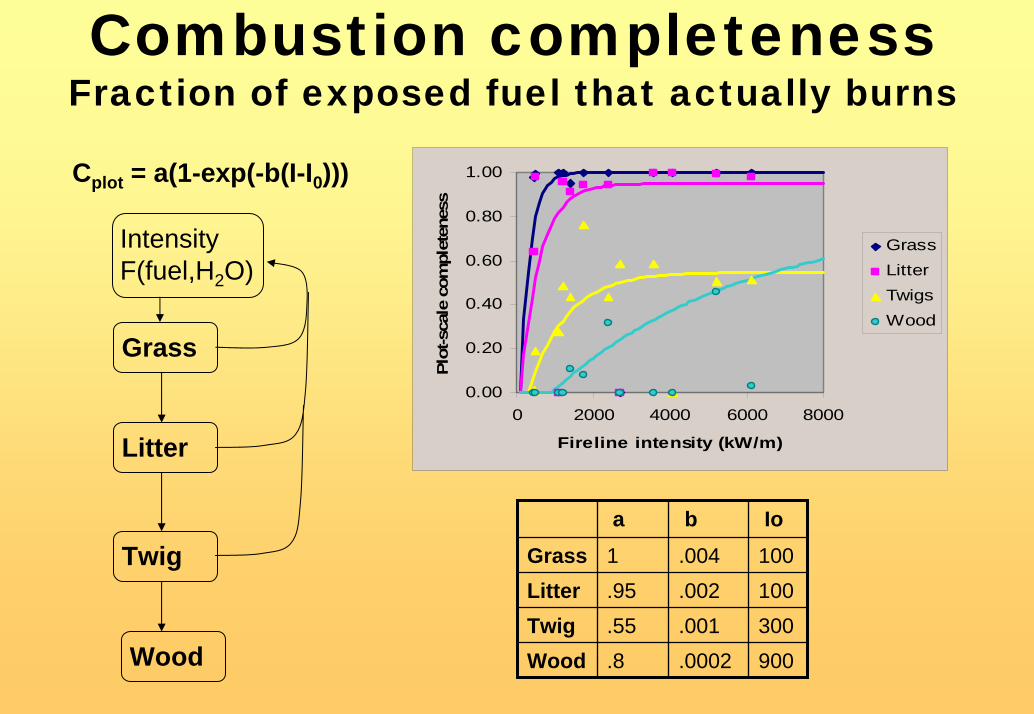
Combustion completenessFraction of exposed fuel that actually burns
0.00
0.20
0.40
0.60
0.80
1.00
0 2000 4000 6000 8000
Fireline intensity (kW/m)Pl
ot-s
cale
com
plet
enes
s
GrassLitterTwigsWood
Cplot = a(1-exp(-b(I-I0)))
Grass
Litter
Twig
Wood
IntensityF(fuel,H2O)
a b IoGrass 1 .004 100Litter .95 .002 100Twig .55 .001 300Wood .8 .0002 900
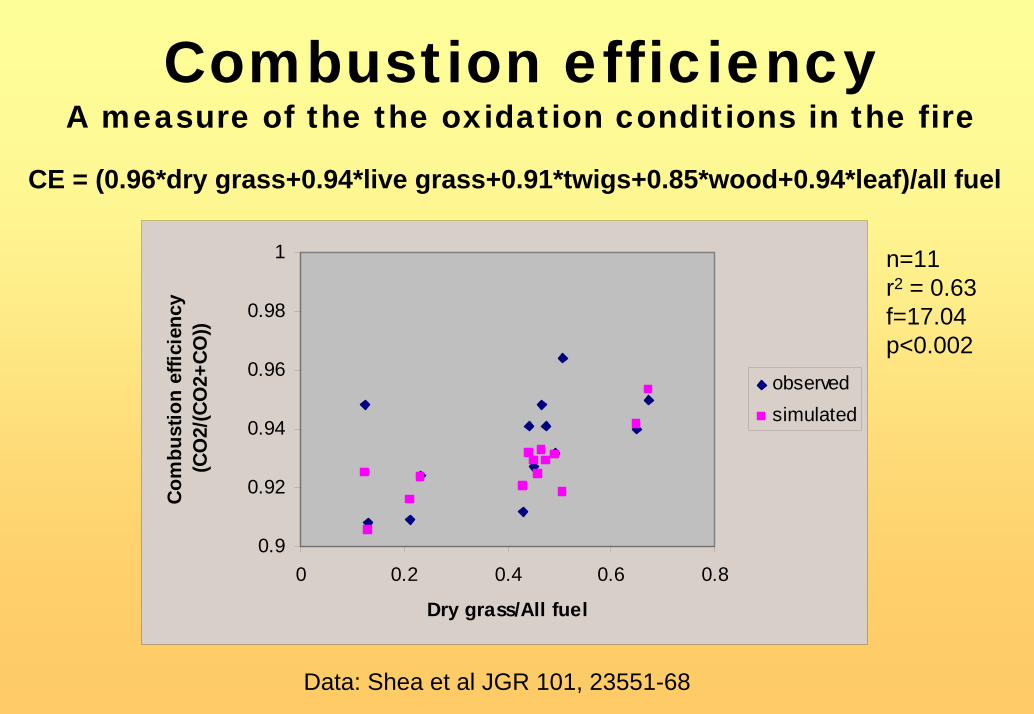
Combustion efficiencyA measure of the the oxidation conditions in the fire
CE = (0.96*dry grass+0.94*live grass+0.91*twigs+0.85*wood+0.94*leaf)/all fuel
0.9
0.92
0.94
0.96
0.98
1
0 0.2 0.4 0.6 0.8
Dry grass/All fuel
Com
bust
ion
effic
ienc
y (C
O2/
(CO
2+CO
))
observedsimulated
n=11r2 = 0.63f=17.04 p<0.002
Data: Shea et al JGR 101, 23551-68
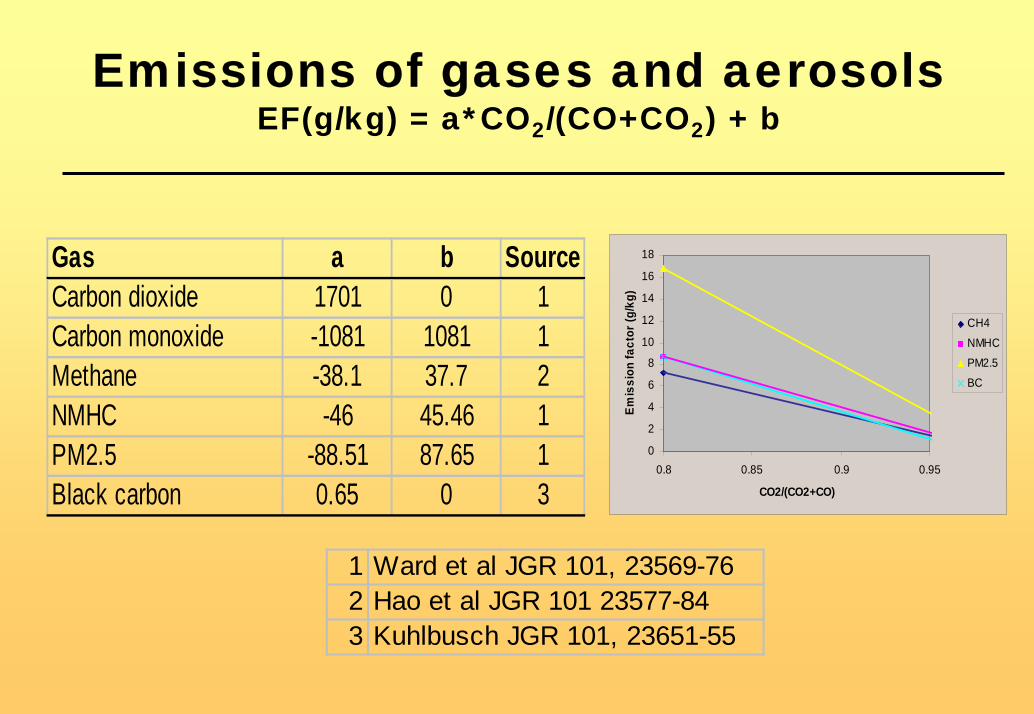
Emissions of gases and aerosolsEF(g/kg) = a*CO2/(CO+CO2) + b
0
2
4
6
8
10
12
14
16
18
0.8 0.85 0.9 0.95
CO2/(CO2+CO)
Emis
sion
fact
or (g
/kg)
CH4
NMHC
PM2.5
BC
Gas a b SourceCarbon dioxide 1701 0 1Carbon monoxide -1081 1081 1Methane -38.1 37.7 2NMHC -46 45.46 1PM2.5 -88.51 87.65 1Black carbon 0.65 0 3
1 Ward et al JGR 101, 23569-762 Hao et al JGR 101 23577-843 Kuhlbusch JGR 101, 23651-55
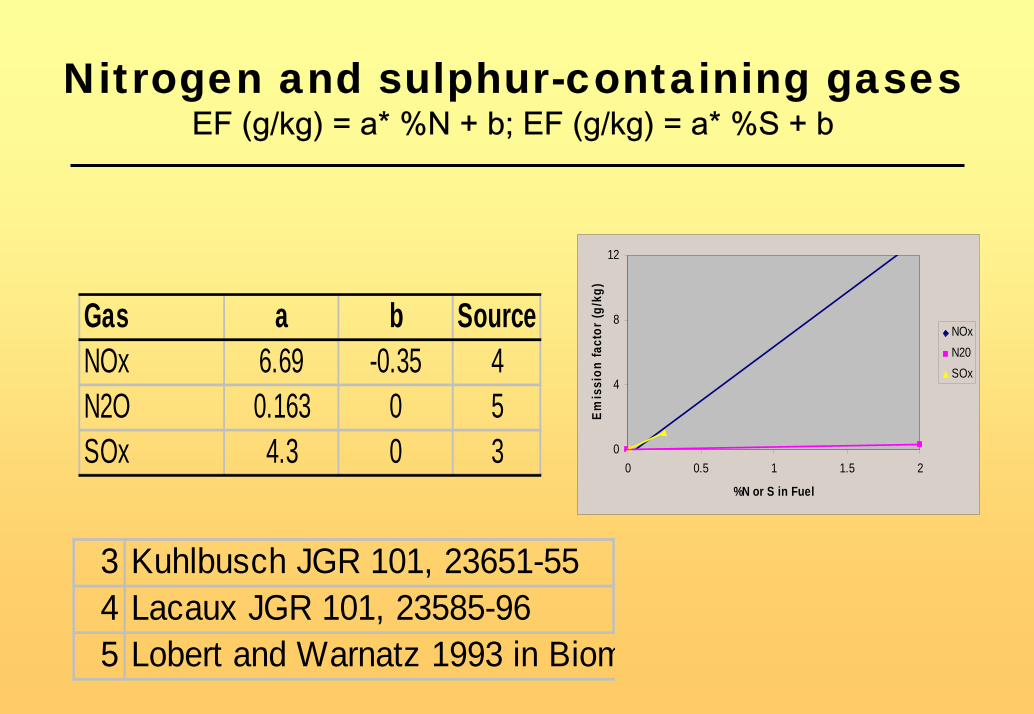
Nitrogen and sulphur-containing gasesEF (g/kg) = a* %N + b; EF (g/kg) = a* %S + b
0
4
8
12
0 0.5 1 1.5 2
%N or S in Fuel
Emis
sion
fact
or (g
/kg)
NOxN20SOx
Gas a b SourceNOx 6.69 -0.35 4N2O 0.163 0 5SOx 4.3 0 3
3 Kuhlbusch JGR 101, 23651-554 Lacaux JGR 101, 23585-965 Lobert and Warnatz 1993 in Biom
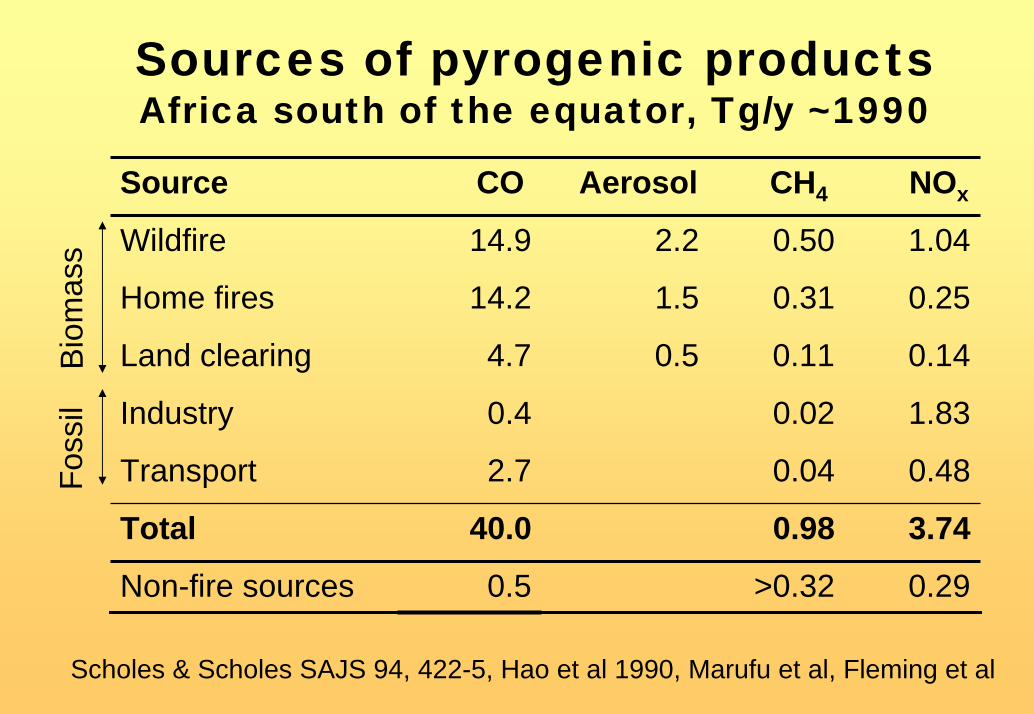
Sources of pyrogenic productsAfrica south of the equator, Tg/y ~1990
Source CO Aerosol CH4 NOx
Wildfire 14.9 2.2 0.50 1.04
Home fires 14.2 1.5 0.31 0.25
Land clearing 4.7 0.5 0.11 0.14
Industry 0.4 0.02 1.83
Transport 2.7 0.04 0.48
Total 40.0 0.98 3.74
Non-fire sources 0.5 >0.32 0.29
Bio
mas
sFo
ssil
Scholes & Scholes SAJS 94, 422-5, Hao et al 1990, Marufu et al, Fleming et al

Impact on global warming• There is no evidence for an overall increase or
decrease in wildfire extent in Africa• Less in dry years, more in wet years
• Therefore assume a zero net impact on additional post-1750 radiative forcing
• CO2 approximately balanced, but– Net radiative forcing due to non-CO2 gases and aerosols– Small export of long-lived carbon to the oceans
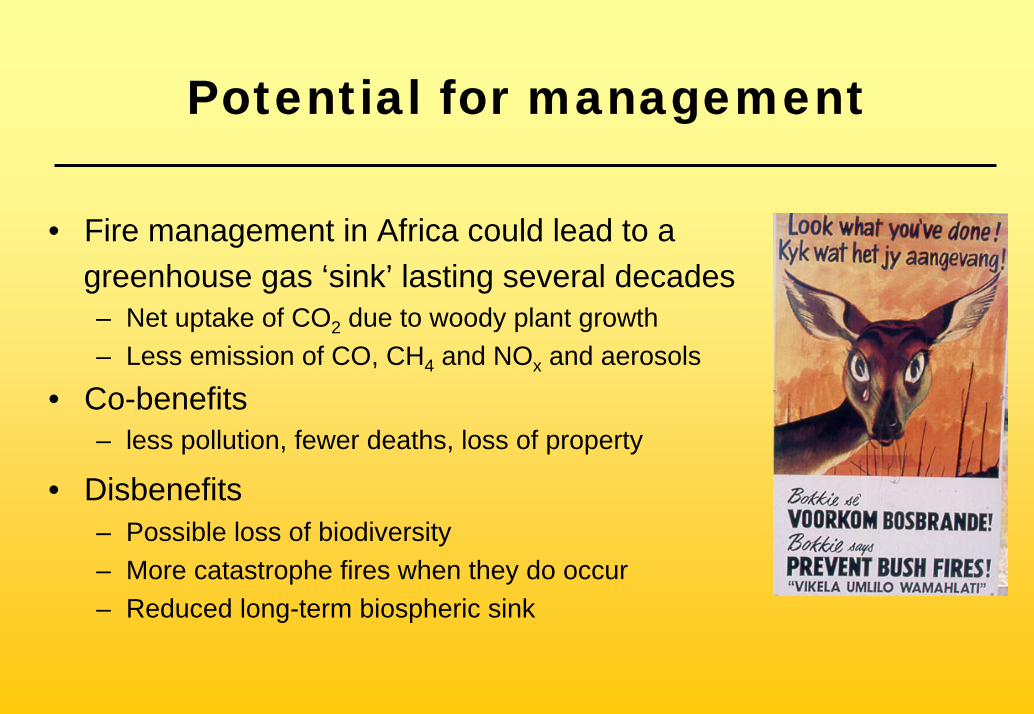
Potential for management
• Fire management in Africa could lead to a greenhouse gas ‘sink’ lasting several decades– Net uptake of CO2 due to woody plant growth– Less emission of CO, CH4 and NOx and aerosols
• Co-benefits– less pollution, fewer deaths, loss of property
• Disbenefits– Possible loss of biodiversity – More catastrophe fires when they do occur– Reduced long-term biospheric sink
Conclusions• Pyrogenic trace gases from
savannas are a significant atmospheric perturbation, with high interannual variability
• Can be estimated using a combination of remote sensing, models and measurementsuel load
• Burned area estimation is much improved as a result of new algorithms
• Fuel load is now the biggest error term