Embed Size (px)
Citation preview
Organic Geochemistry 64 (2013) 76–83
Contents lists available at ScienceDirect
Organic Geochemistry
journal homepage: www.elsevier .com/locate /orggeochem
Predicting pyrogenic organic matter mineralization from its initialproperties and implications for carbon management
0146-6380/$ - see front matter � 2013 Elsevier Ltd. All rights reserved.http://dx.doi.org/10.1016/j.orggeochem.2013.09.006
⇑ Corresponding author. Tel.: +1 607 254 1236; fax: +1 607 255 3207.E-mail address: [email protected] (J. Lehmann).
Thea Whitman, Kelly Hanley, Akio Enders, Johannes Lehmann ⇑Department of Crop and Soil Science, Cornell University, Ithaca, NY 14853, United States
a r t i c l e i n f o
Article history:Received 10 January 2013Received in revised form 4 September 2013Accepted 7 September 2013Available online 17 September 2013
a b s t r a c t
Predicting pyrogenic carbon (PyC) or biochar stability from its precursor properties is critical for evalu-ating and managing terrestrial C stocks. Transmission mode Fourier transform infrared spectroscopy(FTIR) spectroscopy was compared with proximate analysis data and H/C and O/C for predicting C min-eralization. PyC produced at 7 different temperatures from 6 different feedstocks, in addition to the ori-ginal feedstock materials, was incubated for 3 yr at 30 �C in a sand matrix. A C debt or credit ratio wascalculated by comparing the C remaining in the incubated PyC sample (accounting for the measured Clost during initial PyC production) to the C remaining in the incubated original feedstock. A value > 1 indi-cates that more C remains in the PyC than in the original feedstock (credit), while a value < 1 indicates adebt. After 3 yr, PyC produced at 300 �C lost significantly more C than higher temperature PyC material,but significant differences in C loss between PyC produced at temperatures P 350 �C were not detectable.The best predictor of C loss was a multiple linear regression model using the fractional FTIR signals at816, 1048, 1374, 1424, 1460, 1590, 1700 and 2925 cm�1 as parameters (R2 0.80, p < 0.0001). After 3 yr,the C debt or credit ratio reached values significantly > 1 for all corn PyC samples and some bull, dairyand poultry PyC samples, resulting in net C credit, while all pine and oak PyC samples remained in debt.This C debt or credit ratio reveals that, depending on the timeline of interest, producing relatively lowtemperature PyC with less initial C loss can result in greater C savings than producing higher temperaturePyC, even though the C remaining after exposure to higher pyrolysis temperatures is more stable.
� 2013 Elsevier Ltd. All rights reserved.
1. Introduction
The spectrum of material produced during incomplete combus-tion of biomass is heterogeneous and ranges from partially charredorganic matter (OM) to charcoal, soot and graphite (Masiello, 2004;Preston and Schmidt, 2006; Krull et al., 2008). Diverse terms areused to refer to these materials, but here, we use the term pyro-genic carbon (PyC) to refer to carbon (C)-rich organic material pro-duced by partial combustion or pyrolysis (Bird and Ascough, 2012).While PyC can be degraded both chemically and biologically, thedecomposition occurs at a slow rate, with mean residence timeestimated between 102 and 107 yr (Spokas, 2010; Zimmerman,2010; Singh et al., 2012a). If this mineralization rate is slower thanfor fresh OM, the production of PyC could act as a C sink (Ohlsonet al., 2009). The low ‘‘mineralizability’’ of PyC has resulted in re-cent interest in its intentional production for C management, inwhich case it is referred to as ‘‘biochar’’ (Lehmann et al., 2006;Laird, 2008; Whitman et al., 2010).
As interest grows in manipulating the global C cycle to increasethe soil C pool by producing biochar, it becomes important that we
better understand and, ultimately, be able to predict, its minerali-zation. In particular, accurately predicting the net C impact isessential for those interested in calculating C credits for biocharproduction and application systems (Reijnders, 2009; Whitmanand Lehmann, 2009; Whitman et al., 2010). Because PyC includesdiverse materials that may differ substantially from one another(Masiello, 2004; Preston and Schmidt, 2006), we aimed to progresstoward a quantitative understanding of the properties that deter-mine PyC decomposition rate. Factors known to impact mineraliza-tion of PyC include feedstock, charring temperature and charringtime during PyC production, as well as the environmental condi-tions to which the PyC is subjected (Hilscher et al., 2009; Nguyenet al., 2010; Pereira et al., 2011). Chemical or physical changes cor-related with increasing production temperature include the rela-tive decrease in aliphatic C structures and concomitant relativeincrease in aromatic C structures, decreasing H/Corganic and O/Corganic as dehydration takes place, as well as decreasing volatilemass content (Keiluweit et al., 2010; Spokas, 2010; Singh et al.,2012b). However, these broad trends have wide variability whenpredicting PyC mineralization (Baldock and Smernik, 2002; Spokas,2010; Zimmerman, 2010). Singh et al. (2012b) found C mineraliza-tion over 5 yr was strongly predicted by way of nuclear magneticresonance (NMR)-determined proportion of nonaromatic C (expo-nential function, positive) and degree of aromatic condensation
T. Whitman et al. / Organic Geochemistry 64 (2013) 76–83 77
(power function, negative), across five feedstocks and two charringtemperatures. Although an attractive possibility, it is unlikely thata single metric is the optimal way for predicting PyC stability for abroad range of materials. Studies (Kloss et al., 2012) have sug-gested that the chemical signature of PyC detected using Fouriertransform infrared (FTIR) spectroscopy could be correlated withPyC stability, and Nguyen et al. (2008) found strong correlationsof single functional groups with PyC age. It is possible that usinga greater portion of the FTIR spectrum may allow stronger predic-tions of PyC mineralization.
In this study, transmission mode FTIR is compared to other ini-tial properties of PyC to determine which can best predict C miner-alization, using PyC with a range of feedstocks and productiontemperatures, and including the original feedstock materials. Thevast majority of studies of PyC mineralization only examine the fi-nal product and do not account for the original feestock material orthe C lost during PyC production. This may be an appropriate ap-proach for some studies of naturally-produced PyC, but in a biocharcontext, where PyC is produced intentionally for C management, itis essential that the baseline scenario and the original feedstockdecomposition rate be considered.
2. Material and methods
2.1. PyC preparation
PyC material was produced from six different feedstocks: cornstover (Zea mays L.), oak shavings (Quercus sp.), pine shavings (Pi-nus sp.), fryer/broiler poultry bedding consisting primarily of man-ure (Gallus gallus domesticus) mixed with sawdust, bull beddingconsisting of manure (Bos primigenius taurus) mixed with sawdustand dairy bedding consisting of manure (Bos primigenius taurus)mixed with rice hulls (Oryza sativa L.). The feedstocks were se-lected to examine a range of chemical properties and to reflect typ-ical sources of biomass that might be available for PyC production.Each feedstock was used to produce PyC at 7 different tempera-tures (300, 350, 400, 450, 500, 550 and 600 �C), using slow pyroly-sis (DaisyReactor, BestEnergies, Inc., Cashton, WI, USA). Pre-dried(ca. 10% moisture) feedstock (ca. 3 kg) was placed in the mainchamber, which was thoroughly purged with N2 (with the mixerrunning). The material was heated (80–90 min) to the target tem-perature at a few �C/min and isothermically charred at the finaltemperature for ca. 15 min before the furnace was turned off andthe main chamber allowed to cool. The material was collected un-der N2 to reduce rapid oxidation and auto-ignition. It was stored inplastic bag-lined galvanized, epoxy-lined tin paint cans from whichthe ambient air was purged with a vacuum pump and replacedwith Ar. Samples of the original feedstock materials were driedat 60 �C.
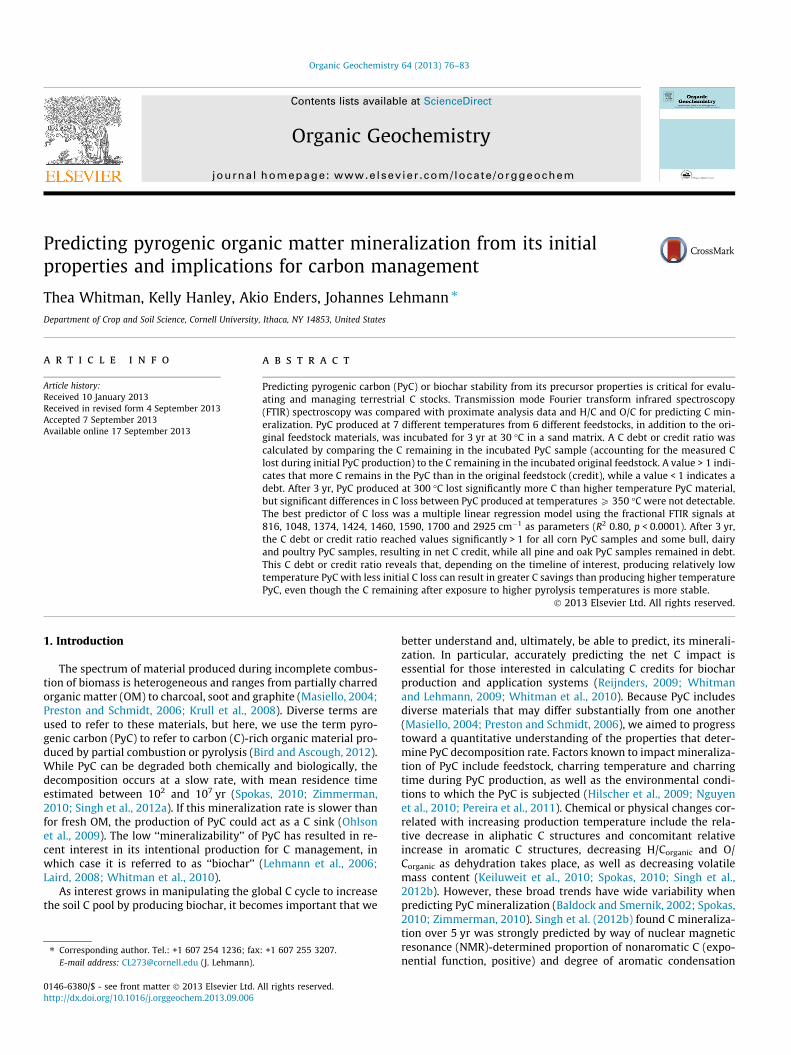
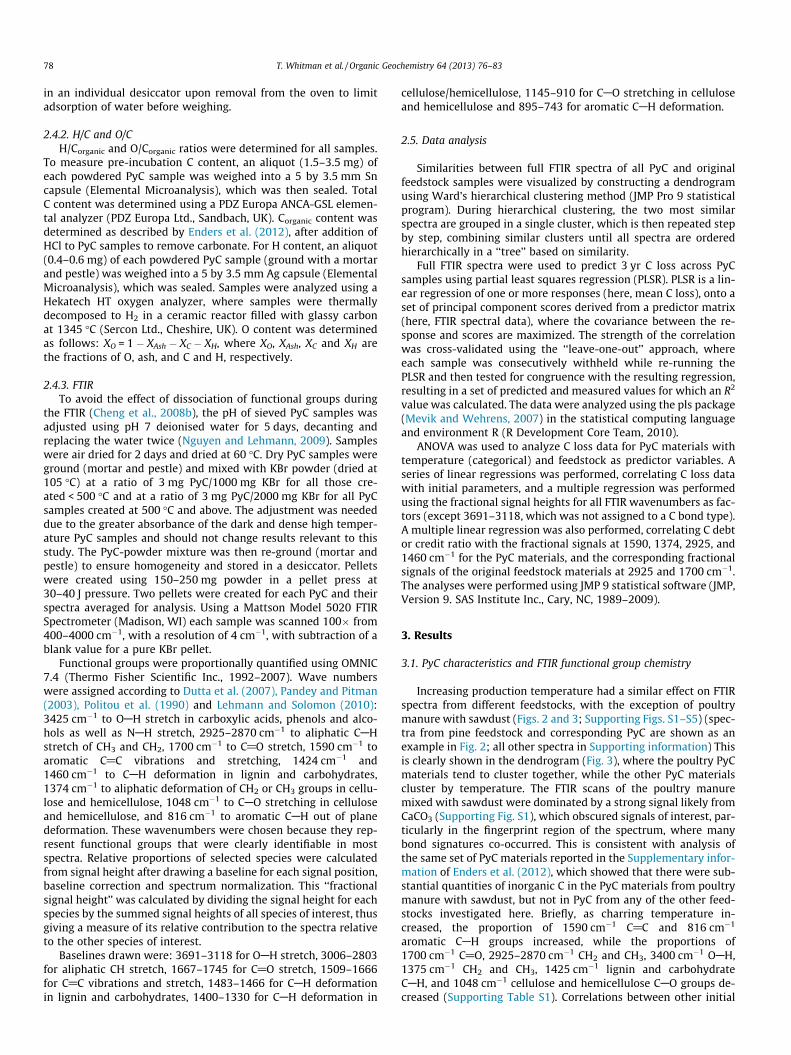
Fig. 1. Conceptual illustration of the C debt or credit ratio. Initial PyC productionresults in a loss of �50% of total C. However, remaining C in PyC decomposes moreslowly than C in initial feedstock. Over time, the debt or credit ratio increasesfrom < 1 (debt) to > 1 (credit).
2.2. Sample preparation
Bottles (30 ml) were washed (10% HCl) and filled with 19.2 gwhite quartz sand (Sigma Aldrich no. 274739, 50 + 70 mesh;heated at 500 �C in a muffle furnace for 24 h). Each PyC samplewas slightly crushed with a mortar and pestle and sieved to a par-ticle size of 500–2000 lm. Sieved PyC (0.8 g) was hand-mixed intoeach sand-filled bottle. Four blank replicates of sand alone werealso prepared.
Water holding capacity (WHC) was determined gravimetricallyfor a sample of each PyC-sand mixture using funnels and filter pa-per, via mass difference after saturating the mixture with distilledwater and allowing it to completely drain freely.
A microbial inoculation was prepared from a soil sample from ahistorical charcoal blast furnace site in Cartersville, GA (Cheng
et al., 2008a). The soil was noted for high PyC content and micro-bial activity, and we expected that the microbial community wouldbe adapted to the presence of PyC. The sample had been stored at4 �C after sampling, and was incubated under 60% WHC at 30 �C for7 days. An aliquot was then mixed with distilled water to 1:50 w/vsoil:water, shaken gently (30 min) and filtered through a Whatmanno. 1 filter paper. The resulting solution had nutrients added togive: 4 mM NH3NO3, 4 mM CaCl2, 2 mM KH2PO4, 1 mM K2SO4,1 mM MgSO4, 25 lM H3BO3, 2 lM MnSO4, 2 lM ZnSO4, 2 lM FeCl2,0.5 lM CuSO4, and 0.5 lM Na2MoO4. Inoculation and micronutri-ent solution (1.8 ml) were added to each jar and sufficient deion-ized water was added to each jar to bring the mixture to 55% WHC.
2.3. Incubation analysis and C debt or credit caclulation
The bottles were incubated in a dark temperature-controlledenvironment at 30 �C under aerobic conditions (i.e. without caps,open to the air, with a partial cover to minimize dust deposition)in a water bath. They were maintained at 55% WHC by weighingthe jars every 3 weeks and adding distilled water to bring themto the starting mass. A long-term [3 yr (1059 days), 3 replicatesper PyC sample] and a short term [5 months (168 days), 4 repli-cates per PyC sample] incubation was prepared, where the bottleswere removed after the designated length of time and sampleswere dried at 105 �C. Each sample was poured onto a tray. Halfof each sample was reserved and half poured into ball milling jarsand ground to a fine powder. The powdered samples were stored inglass vials. A subsample of each vial was weighed in a 12.5 by5 mm Sn capsule (Elemental Microanalysis) and analyzed for totalC with a NC2100 soil analyzer (ThermoQuest Italia S.p.A., Milan,Italy).
Total C lost during incubation was calculated for each PyC sam-ple. We also calculated a C debt or credit ratio by comparing the Cremaining in the incubated PyC sample with the C remaining in theincubated original feedstock material sample. A value > 1 indicatesthat more C remained in the PyC than in the original feedstock,while a value < 1 indicates that less C remained – i.e. C loss duringPyC production outweighed the increased stability obtainedthrough charring (Fig. 1).
2.4. Characterization of unincubated PyC
2.4.1. Proximate analysisVolatile, ash and fixed carbon content were determined for all
samples using standard methods (American Society for Testingand Materials, 2000; Enders et al., 2012). Each sample was placed
78 T. Whitman et al. / Organic Geochemistry 64 (2013) 76–83
in an individual desiccator upon removal from the oven to limitadsorption of water before weighing.
2.4.2. H/C and O/CH/Corganic and O/Corganic ratios were determined for all samples.
To measure pre-incubation C content, an aliquot (1.5–3.5 mg) ofeach powdered PyC sample was weighed into a 5 by 3.5 mm Sncapsule (Elemental Microanalysis), which was then sealed. TotalC content was determined using a PDZ Europa ANCA-GSL elemen-tal analyzer (PDZ Europa Ltd., Sandbach, UK). Corganic content wasdetermined as described by Enders et al. (2012), after addition ofHCl to PyC samples to remove carbonate. For H content, an aliquot(0.4–0.6 mg) of each powdered PyC sample (ground with a mortarand pestle) was weighed into a 5 by 3.5 mm Ag capsule (ElementalMicroanalysis), which was sealed. Samples were analyzed using aHekatech HT oxygen analyzer, where samples were thermallydecomposed to H2 in a ceramic reactor filled with glassy carbonat 1345 �C (Sercon Ltd., Cheshire, UK). O content was determinedas follows: XO = 1 � XAsh � XC � XH, where XO, XAsh, XC and XH arethe fractions of O, ash, and C and H, respectively.
2.4.3. FTIRTo avoid the effect of dissociation of functional groups during
the FTIR (Cheng et al., 2008b), the pH of sieved PyC samples wasadjusted using pH 7 deionised water for 5 days, decanting andreplacing the water twice (Nguyen and Lehmann, 2009). Sampleswere air dried for 2 days and dried at 60 �C. Dry PyC samples wereground (mortar and pestle) and mixed with KBr powder (dried at105 �C) at a ratio of 3 mg PyC/1000 mg KBr for all those cre-ated < 500 �C and at a ratio of 3 mg PyC/2000 mg KBr for all PyCsamples created at 500 �C and above. The adjustment was neededdue to the greater absorbance of the dark and dense high temper-ature PyC samples and should not change results relevant to thisstudy. The PyC-powder mixture was then re-ground (mortar andpestle) to ensure homogeneity and stored in a desiccator. Pelletswere created using 150–250 mg powder in a pellet press at30–40 J pressure. Two pellets were created for each PyC and theirspectra averaged for analysis. Using a Mattson Model 5020 FTIRSpectrometer (Madison, WI) each sample was scanned 100� from400–4000 cm�1, with a resolution of 4 cm�1, with subtraction of ablank value for a pure KBr pellet.
Functional groups were proportionally quantified using OMNIC7.4 (Thermo Fisher Scientific Inc., 1992–2007). Wave numberswere assigned according to Dutta et al. (2007), Pandey and Pitman(2003), Politou et al. (1990) and Lehmann and Solomon (2010):3425 cm�1 to OAH stretch in carboxylic acids, phenols and alco-hols as well as NAH stretch, 2925–2870 cm�1 to aliphatic CAHstretch of CH3 and CH2, 1700 cm�1 to C@O stretch, 1590 cm�1 toaromatic C@C vibrations and stretching, 1424 cm�1 and1460 cm�1 to CAH deformation in lignin and carbohydrates,1374 cm�1 to aliphatic deformation of CH2 or CH3 groups in cellu-lose and hemicellulose, 1048 cm�1 to CAO stretching in celluloseand hemicellulose, and 816 cm�1 to aromatic CAH out of planedeformation. These wavenumbers were chosen because they rep-resent functional groups that were clearly identifiable in mostspectra. Relative proportions of selected species were calculatedfrom signal height after drawing a baseline for each signal position,baseline correction and spectrum normalization. This ‘‘fractionalsignal height’’ was calculated by dividing the signal height for eachspecies by the summed signal heights of all species of interest, thusgiving a measure of its relative contribution to the spectra relativeto the other species of interest.
Baselines drawn were: 3691–3118 for OAH stretch, 3006–2803for aliphatic CH stretch, 1667–1745 for C@O stretch, 1509–1666for C@C vibrations and stretch, 1483–1466 for CAH deformationin lignin and carbohydrates, 1400–1330 for CAH deformation in
cellulose/hemicellulose, 1145–910 for CAO stretching in celluloseand hemicellulose and 895–743 for aromatic CAH deformation.
2.5. Data analysis
Similarities between full FTIR spectra of all PyC and originalfeedstock samples were visualized by constructing a dendrogramusing Ward’s hierarchical clustering method (JMP Pro 9 statisticalprogram). During hierarchical clustering, the two most similarspectra are grouped in a single cluster, which is then repeated stepby step, combining similar clusters until all spectra are orderedhierarchically in a ‘‘tree’’ based on similarity.
Full FTIR spectra were used to predict 3 yr C loss across PyCsamples using partial least squares regression (PLSR). PLSR is a lin-ear regression of one or more responses (here, mean C loss), onto aset of principal component scores derived from a predictor matrix(here, FTIR spectral data), where the covariance between the re-sponse and scores are maximized. The strength of the correlationwas cross-validated using the ‘‘leave-one-out’’ approach, whereeach sample was consecutively withheld while re-running thePLSR and then tested for congruence with the resulting regression,resulting in a set of predicted and measured values for which an R2
value was calculated. The data were analyzed using the pls package(Mevik and Wehrens, 2007) in the statistical computing languageand environment R (R Development Core Team, 2010).
ANOVA was used to analyze C loss data for PyC materials withtemperature (categorical) and feedstock as predictor variables. Aseries of linear regressions was performed, correlating C loss datawith initial parameters, and a multiple regression was performedusing the fractional signal heights for all FTIR wavenumbers as fac-tors (except 3691–3118, which was not assigned to a C bond type).A multiple linear regression was also performed, correlating C debtor credit ratio with the fractional signals at 1590, 1374, 2925, and1460 cm�1 for the PyC materials, and the corresponding fractionalsignals of the original feedstock materials at 2925 and 1700 cm�1.The analyses were performed using JMP 9 statistical software (JMP,Version 9. SAS Institute Inc., Cary, NC, 1989–2009).
3. Results
3.1. PyC characteristics and FTIR functional group chemistry
Increasing production temperature had a similar effect on FTIRspectra from different feedstocks, with the exception of poultrymanure with sawdust (Figs. 2 and 3; Supporting Figs. S1–S5) (spec-tra from pine feedstock and corresponding PyC are shown as anexample in Fig. 2; all other spectra in Supporting information) Thisis clearly shown in the dendrogram (Fig. 3), where the poultry PyCmaterials tend to cluster together, while the other PyC materialscluster by temperature. The FTIR scans of the poultry manuremixed with sawdust were dominated by a strong signal likely fromCaCO3 (Supporting Fig. S1), which obscured signals of interest, par-ticularly in the fingerprint region of the spectrum, where manybond signatures co-occurred. This is consistent with analysis ofthe same set of PyC materials reported in the Supplementary infor-mation of Enders et al. (2012), which showed that there were sub-stantial quantities of inorganic C in the PyC materials from poultrymanure with sawdust, but not in PyC from any of the other feed-stocks investigated here. Briefly, as charring temperature in-creased, the proportion of 1590 cm�1 C@C and 816 cm�1
aromatic CAH groups increased, while the proportions of1700 cm�1 C@O, 2925–2870 cm�1 CH2 and CH3, 3400 cm�1 OAH,1375 cm�1 CH2 and CH3, 1425 cm�1 lignin and carbohydrateCAH, and 1048 cm�1 cellulose and hemicellulose CAO groups de-creased (Supporting Table S1). Correlations between other initial
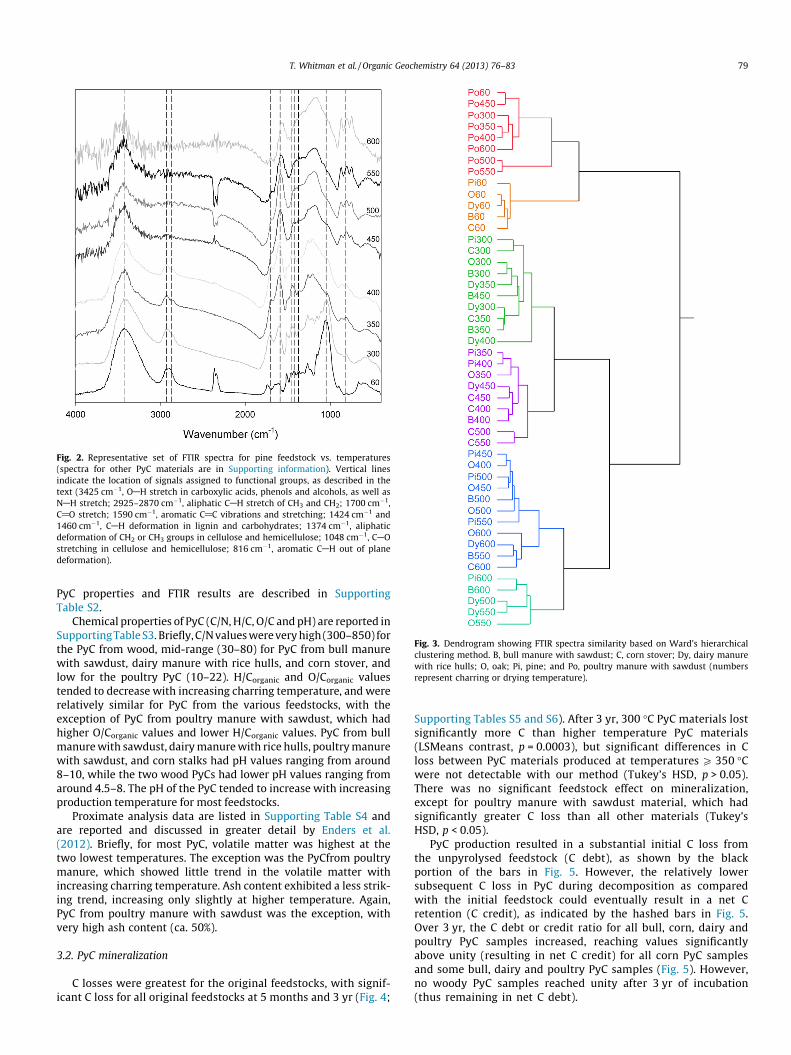
Fig. 3. Dendrogram showing FTIR spectra similarity based on Ward’s hierarchicalclustering method. B, bull manure with sawdust; C, corn stover; Dy, dairy manurewith rice hulls; O, oak; Pi, pine; and Po, poultry manure with sawdust (numbersrepresent charring or drying temperature).
Fig. 2. Representative set of FTIR spectra for pine feedstock vs. temperatures(spectra for other PyC materials are in Supporting information). Vertical linesindicate the location of signals assigned to functional groups, as described in thetext (3425 cm�1, OAH stretch in carboxylic acids, phenols and alcohols, as well asNAH stretch; 2925–2870 cm�1, aliphatic CAH stretch of CH3 and CH2; 1700 cm�1,C@O stretch; 1590 cm�1, aromatic C@C vibrations and stretching; 1424 cm�1 and1460 cm�1, CAH deformation in lignin and carbohydrates; 1374 cm�1, aliphaticdeformation of CH2 or CH3 groups in cellulose and hemicellulose; 1048 cm�1, CAOstretching in cellulose and hemicellulose; 816 cm�1, aromatic CAH out of planedeformation).
T. Whitman et al. / Organic Geochemistry 64 (2013) 76–83 79
PyC properties and FTIR results are described in SupportingTable S2.
Chemical properties of PyC (C/N, H/C, O/C and pH) are reported inSupporting Table S3. Briefly, C/N values were very high (300–850) forthe PyC from wood, mid-range (30–80) for PyC from bull manurewith sawdust, dairy manure with rice hulls, and corn stover, andlow for the poultry PyC (10–22). H/Corganic and O/Corganic valuestended to decrease with increasing charring temperature, and wererelatively similar for PyC from the various feedstocks, with theexception of PyC from poultry manure with sawdust, which hadhigher O/Corganic values and lower H/Corganic values. PyC from bullmanure with sawdust, dairy manure with rice hulls, poultry manurewith sawdust, and corn stalks had pH values ranging from around8–10, while the two wood PyCs had lower pH values ranging fromaround 4.5–8. The pH of the PyC tended to increase with increasingproduction temperature for most feedstocks.
Proximate analysis data are listed in Supporting Table S4 andare reported and discussed in greater detail by Enders et al.(2012). Briefly, for most PyC, volatile matter was highest at thetwo lowest temperatures. The exception was the PyCfrom poultrymanure, which showed little trend in the volatile matter withincreasing charring temperature. Ash content exhibited a less strik-ing trend, increasing only slightly at higher temperature. Again,PyC from poultry manure with sawdust was the exception, withvery high ash content (ca. 50%).
3.2. PyC mineralization
C losses were greatest for the original feedstocks, with signif-icant C loss for all original feedstocks at 5 months and 3 yr (Fig. 4;
Supporting Tables S5 and S6). After 3 yr, 300 �C PyC materials lostsignificantly more C than higher temperature PyC materials(LSMeans contrast, p = 0.0003), but significant differences in Closs between PyC materials produced at temperatures P 350 �Cwere not detectable with our method (Tukey’s HSD, p > 0.05).There was no significant feedstock effect on mineralization,except for poultry manure with sawdust material, which hadsignificantly greater C loss than all other materials (Tukey’sHSD, p < 0.05).
PyC production resulted in a substantial initial C loss fromthe unpyrolysed feedstock (C debt), as shown by the blackportion of the bars in Fig. 5. However, the relatively lowersubsequent C loss in PyC during decomposition as comparedwith the initial feedstock could eventually result in a net Cretention (C credit), as indicated by the hashed bars in Fig. 5.Over 3 yr, the C debt or credit ratio for all bull, corn, dairy andpoultry PyC samples increased, reaching values significantlyabove unity (resulting in net C credit) for all corn PyC samplesand some bull, dairy and poultry PyC samples (Fig. 5). However,no woody PyC samples reached unity after 3 yr of incubation(thus remaining in net C debt).
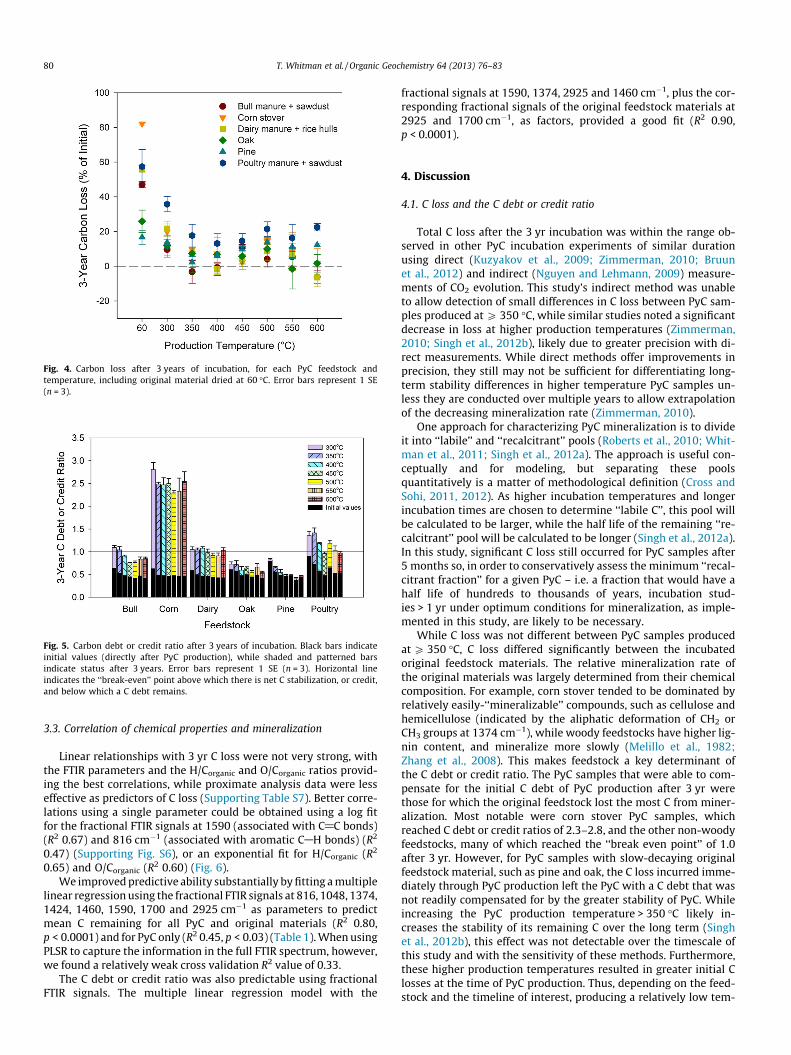
Fig. 4. Carbon loss after 3 years of incubation, for each PyC feedstock andtemperature, including original material dried at 60 �C. Error bars represent 1 SE(n = 3).
Fig. 5. Carbon debt or credit ratio after 3 years of incubation. Black bars indicateinitial values (directly after PyC production), while shaded and patterned barsindicate status after 3 years. Error bars represent 1 SE (n = 3). Horizontal lineindicates the ‘‘break-even’’ point above which there is net C stabilization, or credit,and below which a C debt remains.
80 T. Whitman et al. / Organic Geochemistry 64 (2013) 76–83
3.3. Correlation of chemical properties and mineralization
Linear relationships with 3 yr C loss were not very strong, withthe FTIR parameters and the H/Corganic and O/Corganic ratios provid-ing the best correlations, while proximate analysis data were lesseffective as predictors of C loss (Supporting Table S7). Better corre-lations using a single parameter could be obtained using a log fitfor the fractional FTIR signals at 1590 (associated with C@C bonds)(R2 0.67) and 816 cm�1 (associated with aromatic CAH bonds) (R2
0.47) (Supporting Fig. S6), or an exponential fit for H/Corganic (R2
0.65) and O/Corganic (R2 0.60) (Fig. 6).We improved predictive ability substantially by fitting a multiple
linear regression using the fractional FTIR signals at 816, 1048, 1374,1424, 1460, 1590, 1700 and 2925 cm�1 as parameters to predictmean C remaining for all PyC and original materials (R2 0.80,p < 0.0001) and for PyC only (R2 0.45, p < 0.03) (Table 1). When usingPLSR to capture the information in the full FTIR spectrum, however,we found a relatively weak cross validation R2 value of 0.33.
The C debt or credit ratio was also predictable using fractionalFTIR signals. The multiple linear regression model with the
fractional signals at 1590, 1374, 2925 and 1460 cm�1, plus the cor-responding fractional signals of the original feedstock materials at2925 and 1700 cm�1, as factors, provided a good fit (R2 0.90,p < 0.0001).
4. Discussion
4.1. C loss and the C debt or credit ratio
Total C loss after the 3 yr incubation was within the range ob-served in other PyC incubation experiments of similar durationusing direct (Kuzyakov et al., 2009; Zimmerman, 2010; Bruunet al., 2012) and indirect (Nguyen and Lehmann, 2009) measure-ments of CO2 evolution. This study’s indirect method was unableto allow detection of small differences in C loss between PyC sam-ples produced at P 350 �C, while similar studies noted a significantdecrease in loss at higher production temperatures (Zimmerman,2010; Singh et al., 2012b), likely due to greater precision with di-rect measurements. While direct methods offer improvements inprecision, they still may not be sufficient for differentiating long-term stability differences in higher temperature PyC samples un-less they are conducted over multiple years to allow extrapolationof the decreasing mineralization rate (Zimmerman, 2010).
One approach for characterizing PyC mineralization is to divideit into ‘‘labile’’ and ‘‘recalcitrant’’ pools (Roberts et al., 2010; Whit-man et al., 2011; Singh et al., 2012a). The approach is useful con-ceptually and for modeling, but separating these poolsquantitatively is a matter of methodological definition (Cross andSohi, 2011, 2012). As higher incubation temperatures and longerincubation times are chosen to determine ‘‘labile C’’, this pool willbe calculated to be larger, while the half life of the remaining ‘‘re-calcitrant’’ pool will be calculated to be longer (Singh et al., 2012a).In this study, significant C loss still occurred for PyC samples after5 months so, in order to conservatively assess the minimum ‘‘recal-citrant fraction’’ for a given PyC – i.e. a fraction that would have ahalf life of hundreds to thousands of years, incubation stud-ies > 1 yr under optimum conditions for mineralization, as imple-mented in this study, are likely to be necessary.
While C loss was not different between PyC samples producedat P 350 �C, C loss differed significantly between the incubatedoriginal feedstock materials. The relative mineralization rate ofthe original materials was largely determined from their chemicalcomposition. For example, corn stover tended to be dominated byrelatively easily-‘‘mineralizable’’ compounds, such as cellulose andhemicellulose (indicated by the aliphatic deformation of CH2 orCH3 groups at 1374 cm�1), while woody feedstocks have higher lig-nin content, and mineralize more slowly (Melillo et al., 1982;Zhang et al., 2008). This makes feedstock a key determinant ofthe C debt or credit ratio. The PyC samples that were able to com-pensate for the initial C debt of PyC production after 3 yr werethose for which the original feedstock lost the most C from miner-alization. Most notable were corn stover PyC samples, whichreached C debt or credit ratios of 2.3–2.8, and the other non-woodyfeedstocks, many of which reached the ‘‘break even point’’ of 1.0after 3 yr. However, for PyC samples with slow-decaying originalfeedstock material, such as pine and oak, the C loss incurred imme-diately through PyC production left the PyC with a C debt that wasnot readily compensated for by the greater stability of PyC. Whileincreasing the PyC production temperature > 350 �C likely in-creases the stability of its remaining C over the long term (Singhet al., 2012b), this effect was not detectable over the timescale ofthis study and with the sensitivity of these methods. Furthermore,these higher production temperatures resulted in greater initial Closses at the time of PyC production. Thus, depending on the feed-stock and the timeline of interest, producing a relatively low tem-
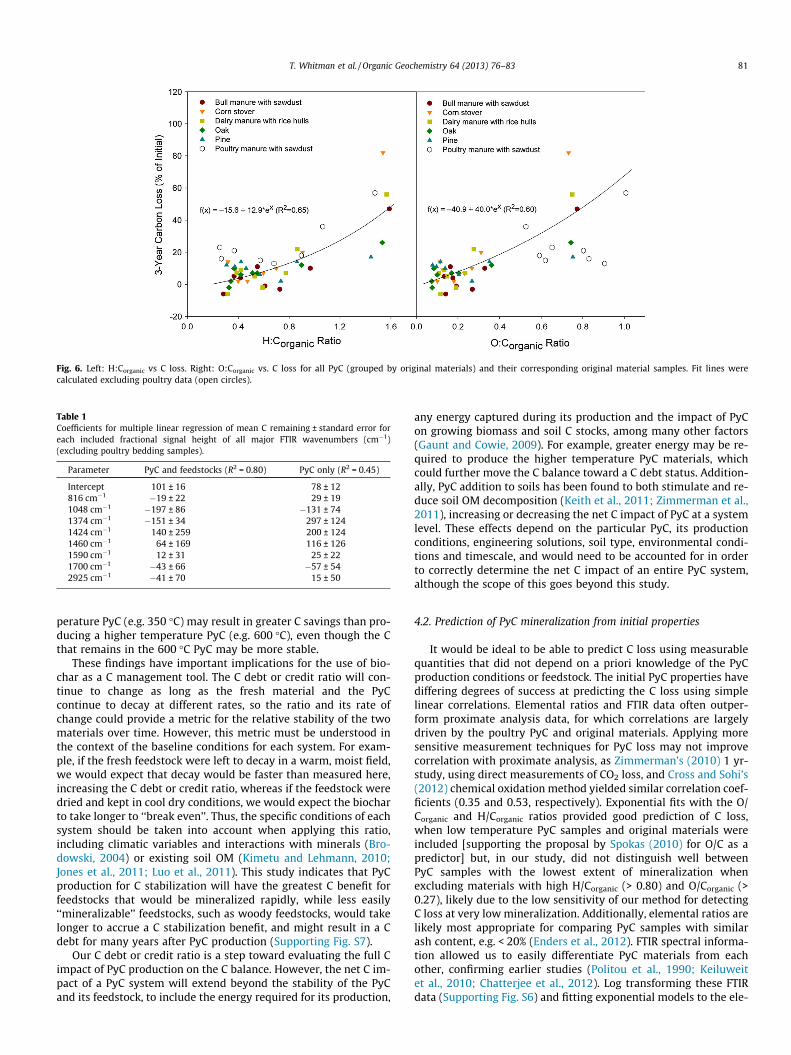
Fig. 6. Left: H:Corganic vs C loss. Right: O:Corganic vs. C loss for all PyC (grouped by original materials) and their corresponding original material samples. Fit lines werecalculated excluding poultry data (open circles).
Table 1Coefficients for multiple linear regression of mean C remaining ± standard error foreach included fractional signal height of all major FTIR wavenumbers (cm�1)(excluding poultry bedding samples).
Parameter PyC and feedstocks (R2 = 0.80) PyC only (R2 = 0.45)
Intercept 101 ± 16 78 ± 12816 cm�1 �19 ± 22 29 ± 191048 cm�1 �197 ± 86 �131 ± 741374 cm�1 �151 ± 34 297 ± 1241424 cm�1 140 ± 259 200 ± 1241460 cm�1 64 ± 169 116 ± 1261590 cm�1 12 ± 31 25 ± 221700 cm�1 �43 ± 66 �57 ± 542925 cm�1 �41 ± 70 15 ± 50
T. Whitman et al. / Organic Geochemistry 64 (2013) 76–83 81
perature PyC (e.g. 350 �C) may result in greater C savings than pro-ducing a higher temperature PyC (e.g. 600 �C), even though the Cthat remains in the 600 �C PyC may be more stable.
These findings have important implications for the use of bio-char as a C management tool. The C debt or credit ratio will con-tinue to change as long as the fresh material and the PyCcontinue to decay at different rates, so the ratio and its rate ofchange could provide a metric for the relative stability of the twomaterials over time. However, this metric must be understood inthe context of the baseline conditions for each system. For exam-ple, if the fresh feedstock were left to decay in a warm, moist field,we would expect that decay would be faster than measured here,increasing the C debt or credit ratio, whereas if the feedstock weredried and kept in cool dry conditions, we would expect the biocharto take longer to ‘‘break even’’. Thus, the specific conditions of eachsystem should be taken into account when applying this ratio,including climatic variables and interactions with minerals (Bro-dowski, 2004) or existing soil OM (Kimetu and Lehmann, 2010;Jones et al., 2011; Luo et al., 2011). This study indicates that PyCproduction for C stabilization will have the greatest C benefit forfeedstocks that would be mineralized rapidly, while less easily‘‘mineralizable’’ feedstocks, such as woody feedstocks, would takelonger to accrue a C stabilization benefit, and might result in a Cdebt for many years after PyC production (Supporting Fig. S7).
Our C debt or credit ratio is a step toward evaluating the full Cimpact of PyC production on the C balance. However, the net C im-pact of a PyC system will extend beyond the stability of the PyCand its feedstock, to include the energy required for its production,
any energy captured during its production and the impact of PyCon growing biomass and soil C stocks, among many other factors(Gaunt and Cowie, 2009). For example, greater energy may be re-quired to produce the higher temperature PyC materials, whichcould further move the C balance toward a C debt status. Addition-ally, PyC addition to soils has been found to both stimulate and re-duce soil OM decomposition (Keith et al., 2011; Zimmerman et al.,2011), increasing or decreasing the net C impact of PyC at a systemlevel. These effects depend on the particular PyC, its productionconditions, engineering solutions, soil type, environmental condi-tions and timescale, and would need to be accounted for in orderto correctly determine the net C impact of an entire PyC system,although the scope of this goes beyond this study.
4.2. Prediction of PyC mineralization from initial properties
It would be ideal to be able to predict C loss using measurablequantities that did not depend on a priori knowledge of the PyCproduction conditions or feedstock. The initial PyC properties havediffering degrees of success at predicting the C loss using simplelinear correlations. Elemental ratios and FTIR data often outper-form proximate analysis data, for which correlations are largelydriven by the poultry PyC and original materials. Applying moresensitive measurement techniques for PyC loss may not improvecorrelation with proximate analysis, as Zimmerman’s (2010) 1 yr-study, using direct measurements of CO2 loss, and Cross and Sohi’s(2012) chemical oxidation method yielded similar correlation coef-ficients (0.35 and 0.53, respectively). Exponential fits with the O/Corganic and H/Corganic ratios provided good prediction of C loss,when low temperature PyC samples and original materials wereincluded [supporting the proposal by Spokas (2010) for O/C as apredictor] but, in our study, did not distinguish well betweenPyC samples with the lowest extent of mineralization whenexcluding materials with high H/Corganic (> 0.80) and O/Corganic (>0.27), likely due to the low sensitivity of our method for detectingC loss at very low mineralization. Additionally, elemental ratios arelikely most appropriate for comparing PyC samples with similarash content, e.g. < 20% (Enders et al., 2012). FTIR spectral informa-tion allowed us to easily differentiate PyC materials from eachother, confirming earlier studies (Politou et al., 1990; Keiluweitet al., 2010; Chatterjee et al., 2012). Log transforming these FTIRdata (Supporting Fig. S6) and fitting exponential models to the ele-
82 T. Whitman et al. / Organic Geochemistry 64 (2013) 76–83
mental ratio data (Fig. 6) further improved their predictive ability.However, none of these models matched the quality of fit achievedby Singh et al. (2012b), using 5 yr incubation data and nonaromaticC or degree of aromatic condensation as determined from 13C CPNMR (R2 0.91 and 0.86, respectively). While our simple correlationsare useful for identifying candidate predictor variables, the FTIRspectra are data-rich, potentially providing greater predictivepower when more information contained in the spectrum is used,unlike an elemental ratio or proximate analysis parameter, whichare limited to a single value.
However, using the entire FTIR spectrum in the PLSR analysiswas not very successful for predicting C loss for the present dataset. This is likely due to the still relatively low number of samplesavailable for PLSR analysis and the difficulty in detecting differ-ences in C remaining across the higher temperature PyC sampleswith our C loss method. In contrast, the strong correlation (R2
0.80) achieved using multiple linear regression of the fractionalsignal height of FTIR functional groups indicates that using a suiteof select signals from FTIR data could be a robust and inexpensiveway of predicting C loss from PyC samples. Additionally, it mayindicate that complex changes during charring beyond simplydeoxygenation and dehydration (Keiluweit et al., 2010) are impor-tant in predicting C loss from PyC. Still, it is important to note thatFTIR as applied here is not quantitative – i.e. if the proportion ofone kind of bond were to double for a PyC upon heating, its asso-ciated signal height might not double. Thus, more data are neededto establish predictions of C loss using the full spectral informationby way of PLSR analysis and calibration of the relationship betweenany FTIR data and PyC loss would likely be necessary if applied toPyC types that were not in the original data set. This is commensu-rate with the use of IR data for prediction of PyC in soils (Janiket al., 2007).
5. Conclusions
The C debt or credit ratio is an essential tool for assessing the Cimpact of PyC production and application for C management. Ourfindings highlight the idea that, regardless of the mineralizationof the PyC produced, if its original feedstock decomposes slowly,PyC production would not likely result in C savings for many years.To determine the net C impact of a PyC system, the C debt or creditratio may be combined with a systems-level accounting of allgreenhouse gas costs and benefits, including energy and impacton non-PyC soil C.
While elemental ratios provided an improvement over proxi-mate analysis for predicting short term C loss in this study, predict-ing C loss from the initial characteristics of PyC was mostsuccessful using a multi-signal, multivariate linear regressionmodel with FTIR data. However, such approaches still require cal-ibration. Using a larger dataset of FTIR spectra and direct C lossmeasurements might improve PLSR-based predictive models. Fu-ture research should aim to refine methods for predicting the frac-tion of easily-‘‘mineralizable’’ PyC from its initial properties and toinvestigate new methods that could accurately assess long termmineralization of the less readily mineralizable fraction of PyC.
Acknowledgements
We thank W. Amelung and three anonymous reviewers forhelpful comments and suggestions. T.W. was supported by anNSERC PGS-M grant. We acknowledge financial support from theNew York State Energy Research and Development Authority (NY-SERDA Agreement 9891), the USDA Hatch grant, partial support bythe National Science Foundation’s Basic Research for Enabling Agri-cultural Development (NSF-BREAD Grant number IOS-0965336)
and the Fondation des Fondateurs. Any opinions, findings and con-clusions or recommendations expressed in this material are thoseof the authors and do not necessarily reflect the views of thedonors.
Appendix A. Supplementary material
Supplementary data associated with this article can be found,in the online version, at http://dx.doi.org/10.1016/j.orggeochem.2013.09.006.
Associate Editor – S. Derenne
References
American Society for Testing and Materials, 2000. Standard Test Method forChemical Analysis of Wood Charcoal. Standard D1762-84(2001). Annual book ofASTM standards. Section 4: Construction. Volume 04.10: Wood, pp. 293–294.
Baldock, J.A., Smernik, R.J., 2002. Chemical composition and bioavailability ofthermally, altered Pinus resinosa (Red Pine) wood. Organic Geochemistry 33,1093–1109.
Bird, M.I., Ascough, P.L., 2012. Isotopes in pyrogenic carbon: a review. OrganicGeochemistry 42, 1529–1639.
Brodowski, S.B., 2004. Origin, Function, and Reactivity of Black Carbon in the ArableSoil Environment. PhD Thesis, University of Bayreuth, Bayreuth, Germany.
Bruun, E.W., Ambus, P., Egsgaard, H., Hauggaard-Nielsen, H., 2012. Effects of slowand fast pyrolysis biochar on soil C and N turnover dynamics. Soil Biology andBiochemistry 46, 73–79.
Chatterjee, S., Santos, F., Abiven, S., Itin, B., Stark, R.E., Bird, J.A., 2012. Elucidating thechemical structure of pyrogenic organic matter by combining magneticresonance, mid-infrared spectroscopy and mass spectrometry. OrganicGeochemistry 51, 35–44.
Cheng, C.H., Lehmann, J., Thies, J.E., Burton, S.D., 2008a. Stability of black carbon insoils across a climatic gradient. Journal of Geophysical Research-Biogeosciences113, G2.
Cheng, C.H., Lehmann, J., Engelhard, M., 2008b. Natural oxidation of black carbon insoils: changes in molecular form and surface charge along a climosequence.Geochimica et Cosmochimica Acta 72, 1598–1610.
Cross, A., Sohi, S.P., 2011. The priming potential of biochar products in relation tolabile carbon contents and soil organic matter status. Soil Biology andBiochemistry 43, 2127–2134.
Cross, A., Sohi, S.P., 2012. A method for screening the relative long-term stability ofbiochar. Global Change Biology Bioenergy. http://dx.doi.org/10.1111/gcbb.12035.
Dutta, S., Brocke, R., Hartkopf-Froder, C., Littke, R., Wilkes, H., Mann, U., 2007. Highlyaromatic character of biogeomacromolecules in Chitinozoa: a spectroscopic andpyrolytic study. Organic Geochemistry 38, 1625–1642.
Enders, A., Hanley, K., Whitman, T., Joseph, S., Lehmann, J., 2012. Characterization ofbiochars to evaluate recalcitrance and agronomic performance. BioresourceTechnology 114, 644–653.
Gaunt, J., Cowie, A., 2009. Biochar, greenhouse gas accounting and emissionstrading. In: Lehmann, J., Joseph, S. (Eds.), Biochar for EnvironmentalManagement: Science and Technology. Earthscan, London, pp. 317–340.
Hilscher, A., Heister, K., Siewert, C., Knicker, H., 2009. Mineralisation and structuralchanges during the initial phase of microbial degradation of pyrogenic plantresidues in soil. Organic Geochemistry 40, 332–342.
Janik, L.J., Skjemstad, J.O., Shepherd, K.D., Spouncer, L.R., 2007. The prediction of soilcarbon fractions using mid-infrared-partial least square analysis. AustralianJournal of Soil Research 45, 73–81.
Jones, D.L., Murphy, D.V., Khalid, M., Ahmad, W., Edwards-Jones, G., DeLuca, T.H.,2011. Short-term biochar-induced increase in soil CO2 release is both bioticallyand abiotically mediated. Soil Biology and Biochemistry 43, 1723–1731.
Keiluweit, M., Nico, P.S., Johnson, M.G., Kleber, M., 2010. Dynamic molecularstructure of plant biomass-derived black carbon (biochar). EnvironmentalScience & Technology 44, 1247–1253.
Keith, A., Singh, B., Singh, B.P., 2011. Interactive priming of biochar and labileorganic matter mineralization in a smectite-rich soil. Environmental Scienceand Technology 45, 9611–9618.
Kimetu, J.M., Lehmann, J., 2010. Stability and stabilisation of biochar and greenmanure in soil with different organic carbon contents. Australian Journal of SoilResearch 48, 577–585.
Kloss, S., Zehetner, F., Dellantonio, A., Hamid, R., Ottner, F., Liedtke, V.,Schwanninger, M., Gerzabek, M.H., Soja, G., 2012. Characterization of slowpyrolysis biochars: effects of feedstocks and pyrolysis temperature on biocharproperties. Journal of Environmental Quality 41, 990–1000.
Krull, E., Lehmann, J., Skjemstad, J., Baldock, J., Spouncer, L., 2008. The global extentof black C in soils: is it everywhere? In: Schröder, H.G. (Ed.), Grasslands:Ecology, Management and Restoration. Nova Science Publishers, Inc., Hauppage,NY, pp. 13–17.
T. Whitman et al. / Organic Geochemistry 64 (2013) 76–83 83
Kuzyakov, Y., Subbotina, I., Chen, H.Q., Bogomolova, I., Xu, X.L., 2009. Black carbondecomposition and incorporation into soil microbial biomass estimated by C-14labeling. Soil Biology and Biochemistry 41, 210–219.
Laird, D.A., 2008. The charcoal vision: a win–win–win scenario for simultaneouslyproducing bioenergy, permanently sequestering carbon, while improving soiland water quality. Agronomy Journal 100, 178–181.
Lehmann, J., Solomon, D., 2010. Organic carbon chemistry in soils observed bysynchrotron-based spectroscopy. In: Singh, B., Gräfe, M. (Eds.), Synchroton-based Techniques in Soils and Sediment. Elsevier, Amsterdam, pp. 289–312.
Lehmann, J., Gaunt, J., Rondon, M., 2006. Bio-char sequestration in terrestrialecosystems – a review. Mitigation and Adaptation Strategies for Global Change11, 403–427.
Luo, Y., Durenkamp, M., De Nobili, M., Lin, Q., Brookes, P.C., 2011. Short term soilpriming effects and the mineralisation of biochar following its incorporation tosoils of different pH. Soil Biology and Biochemistry 43, 2304–2314.
Masiello, C.A., 2004. New directions in black carbon organic geochemistry. MarineChemistry 92, 201–213.
Melillo, J.M., Aber, J.D., Muratore, J.F., 1982. Nitrogen and lignin control of hardwoodleaf litter decomposition dynamics. Ecology 63, 621–626.
Mevik, B.-H., Wehrens, R., 2007. The pls package: principle component and partialleast squares regression in R. Journal of Statistical Software 18, 1–24.
Nguyen, B.T., Lehmann, J., 2009. Black carbon decomposition under varying waterregimes. Organic Geochemistry 40, 846–853.
Nguyen, B.T., Lehmann, J., Kinyangi, J., Smernik, R., Riha, S.J., Engelhard, M., 2008. Long-term black carbon dynamics in cultivated soil. Biogeochemistry 89, 295–308.
Nguyen, B.T., Lehmann, J., Hockaday, W.C., Joseph, S., Masiello, C.A., 2010.Temperature sensitivity of black carbon decomposition and oxidation.Environmental Science and Technology 44, 3324–3331.
Ohlson, M., Dahlberg, B., Økland, T., Brown, K.J., Halvorsen, R., 2009. The charocalcarbon pool in boreal forest soils. Nature Geoscience 2, 692–695.
Pandey, K.K., Pitman, A.J., 2003. FTIR studies of the changes in wood chemistryfollowing decay by brown-rot and white-rot fungi. International Biodeterioration & Biodegradation 52, 151–160.
Pereira, R.C., Kaal, J., Arbestain, M.C., Lorenzo, R.P., Aitkenhead, W., Kedley, M.,Macías, F., Hindmarsh, J., Macía-Agulló, J.A., 2011. Contribution to
characterisation of biochar to estimate the labile fraction of carbon. OrganicGeochemistry 42, 1331–1342.
Politou, A.S., Morterra, C., Low, M.J.D., 1990. Infrared studies of carbons. 12. Theformation of chars from a polycarbonate. Carbon 28, 529–538.
Preston, C.M., Schmidt, M.W.I., 2006. Black (pyrogenic) carbon: a synthesis ofcurrent knowledge and uncertainties with special consideration of borealregions. Biogeosciences 3, 397–420.
Reijnders, L., 2009. Are forestation, bio-char and landfilled biomass adequate offsetsfor the climate impacts of burning fossil fuels? Energy Policy 37, 2839–2841.
Roberts, K.G., Gloy, B.A., Joseph, S., Scott, N.R., Lehmann, J., 2010. Life cycleassessment of biochar systems: estimating the energetic, economic, and climatechange potential. Environmental Science and Technology 44, 827–833.
Singh, N., Abiven, S., Torn, M.S., Schmidt, M.W.I., 2012a. Fire-derived organic carbonin soil turns over on a centennial scale. Biogeosciences 9, 2847–2857.
Singh, B.P., Cowie, A.L., Smernik, R.J., 2012b. Biochar carbon stability in a clayey soilas a function of feedstock and pyrolysis temperature. Environmental Science &Technology 46, 11770–11778.
Spokas, K.A., 2010. Review of the stability of biochar in soils: predictability of O:Cmolar ratios. Carbon Management 1, 289–303.
Whitman, T., Lehmann, J., 2009. Biochar – one way forward for soil carbon in offsetmechanisms in Africa? Environmental Science and Policy 12, 1024–1027.
Whitman, T., Scholz, S., Lehmann, J., 2010. Biochar projects for mitigating climatechange: an investigation of critical methodology issues for carbon accounting.Carbon Management 1, 89–107.
Whitman, T., Nicholson, C.F., Torres, D., Lehmann, J., 2011. Climate change impact ofbiochar cook stoves in western Kenyan farm households: system dynamicsmodel analysis. Environmental Science & Technology 45, 3687–3694.
Zhang, D., Hui, D., Luo, Y., Zhou, G., 2008. Rates of litter decomposition in terrestrialecosystems: global patterns and controlling factors. Journal of Plant Ecology 1,85–93.
Zimmerman, A.R., 2010. Abiotic and microbial oxidation of laboratory-producedblack carbon (biochar). Environmental Science & Technology 44, 1295–1301.
Zimmerman, A.R., Gao, B., Ahn, M.-Y., 2011. Positive and negative carbonmineralization priming effects among a variety of biochar-amended soils. SoilBiology and Biochemistry 43, 1169–1179.