Embed Size (px)
Citation preview
EMISSION FACTOR DOCUMENTATION FOR AP-42 SECTION 11.21 (Formerly 8.18)Phosphate Rock Processing
1. INTRODUCTION
The document Compilation of Air Pollutant Emissions Factors (AP-42) has been published bythe U.S. Environmental Protection Agency (EPA) since 1972. Supplements to AP-42 have beenroutinely published to add new emission source categories and to update existing emission factors.AP-42 is routinely updated by EPA to respond to new emission factor needs of EPA, State and localair pollution control programs, and industry.
An emission factor relates the quantity (weight) of pollutants emitted to a unit of activity ofthe source. The uses for the emission factors reported in AP-42 include:
1. Estimates of areawide emissions;
2. Estimates of emissions for a specific facility; and
3. Evaluation of emissions relative to ambient air quality.
The purpose of this report is to provide background information from test reports and otherinformation to support preparation of AP-42 Section 8.18, Phosphate Rock Processing.
This background report consists of five sections. Section 1 includes the introduction to thereport. Section 2 gives a description of the phosphate rock processing industry. It includes acharacterization of the industry, an overview of the different process types, a description of emissions,and a description of the technology used to control emissions resulting from phosphate rockprocessing. Section 3 is a review of emission data collection and analysis procedures. It describes theliterature search, the screening of emission data reports, and the quality rating system for bothemission data and emission factors. Section 4 details revisions to the existing AP-42 section narrativeand pollutant emission factor development. It includes the review of specific data sets and the resultsof data analysis. Section 5 presents the AP-42 Section 8.18, Phosphate Rock Processing.
1
2. INDUSTRY DESCRIPTION
The separation of phosphate rock from impurities and nonphosphate materials, for use infertilizer manufacture, consists of beneficiation, drying or calcining at some operations, andgrinding stages. Because the primary use of phosphate rock is in the manufacture of phosphaticfertilizer, only those phosphate rock processing operations associated with fertilizer manufacture arediscussed here. Alternative flow diagrams of these operations are shown in Figure 2-1. The StandardIndustrial Classification (SIC) code for phosphate rock processing is 1475. The six-digit SourceClassification Code (SCC) for phosphate rock processing is 3-05-019.
2.1 CHARACTERIZATION OF THE INDUSTRY1,2
There are a total of 35 phosphate rock processing plants in the United States, 23 of whichwere operational in 1990/91. Table 2-1 lists the plants operating in 1990/91, along with the estimatedproduction capacity for each plant. Florida and North Carolina accounted for 94 percent of thedomestic phosphate rock mined and 89 percent of the marketable phosphate rock produced during1989. Other States in which phosphate rock is mined and processed include Idaho, Montana, Utah,and Tennessee.
2.2 PROCESS DESCRIPTION3-6
Phosphate rock from the mines is first sent to beneficiation units to separate sand and clay andto remove impurities. Steps used in beneficiation depend on the type of rock. A typical beneficiationunit for separating phosphate rock mined in Florida begins with wet screening to separate pebble rock,which is larger than 1.43 millimeters (mm) (0.056 inch [in.]), or 14 mesh, and smaller than 6.35 mm(0.25 in.) from the balance of the rock. The pebble rock is shipped as pebble product. The materialthat is larger than 0.85 mm (0.033 in.), or 20 mesh, and smaller than 14 mesh is separated usinghydrocyclones and finer mesh screens and is added to the pebble product. The fraction smaller than20 mesh is treated by two-stage flotation. The flotation process uses hydrophilic or hydrophobicchemical reagents with aeration to separate suspended particles. Phosphate rock mined in NorthCarolina does not contain pebble rock. In processing this type of phosphate, 2-mm (0.078 in.) or10-mesh screens are used. Like Florida rock, the fraction that is less than 10 mesh is treated by two-stage flotation, and the fraction larger than 10 mesh is used for secondary road building.
The two major western phosphate rock ore deposits are located in southeastern Idaho andnortheastern Utah, and the beneficiation processes used on materials from these deposits differ greatly.In general, southeastern Idaho deposits require crushing, grinding, and classification. Furtherprocessing may include filtration and/or drying, depending on the phosphoric acid plant requirements.Primary size reduction generally is accomplished by crushers(impact) and grinding mills. Someclassification of the primary crushed rock may be necessary before secondary grinding (rod milling)takes place. The ground material then passes through hydrocyclones that are oriented in a three-stagecountercurrent arrangement. Further processing in the form of chemical flotation may be required.Most of the processes are wet to facilitate material transport and to reduce dust.
Northeastern Utah deposits are lower grade and harder than the southeastern Idaho depositsand require processing similar to the Florida deposits. Extensive crushing and grinding is necessary toliberate phosphate from the material. The primary product is classified with 150- to 200-mesh screens,and the finer material is disposed of with the tailings. The coarser fraction is processed throughmultiple steps of phosphate flotation and then diluent flotation. Further processing may include
2
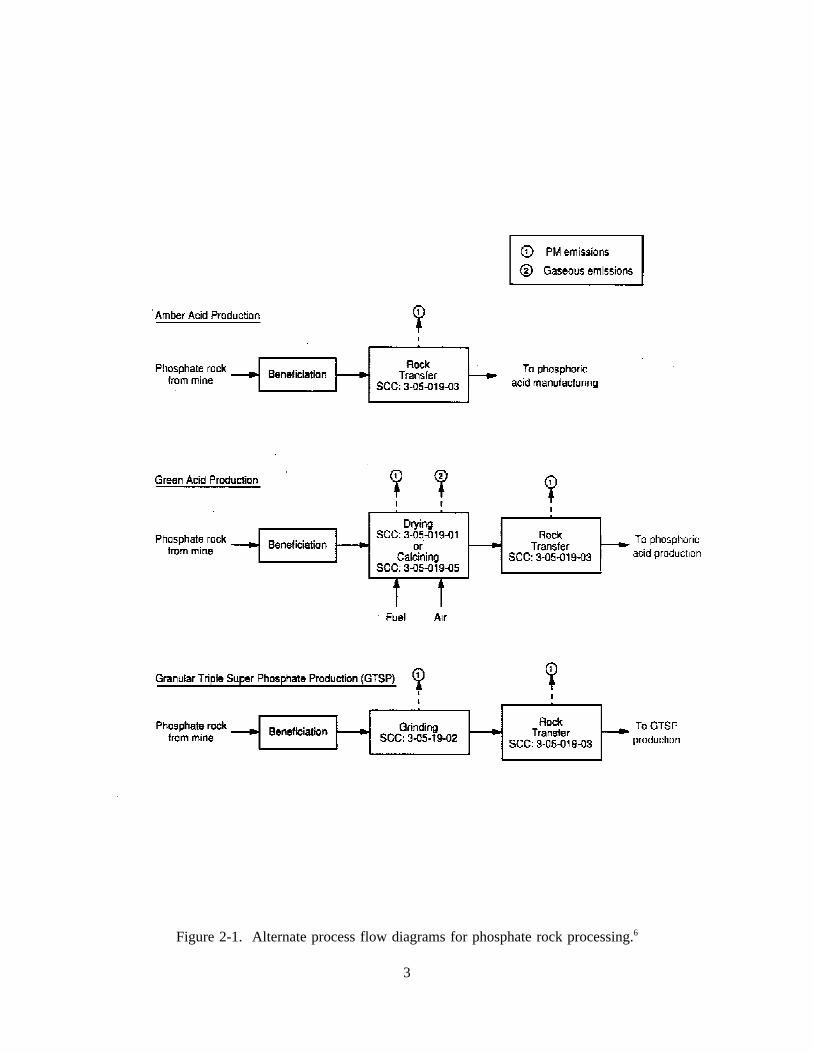
Figure 2-1. Alternate process flow diagrams for phosphate rock processing.6
3
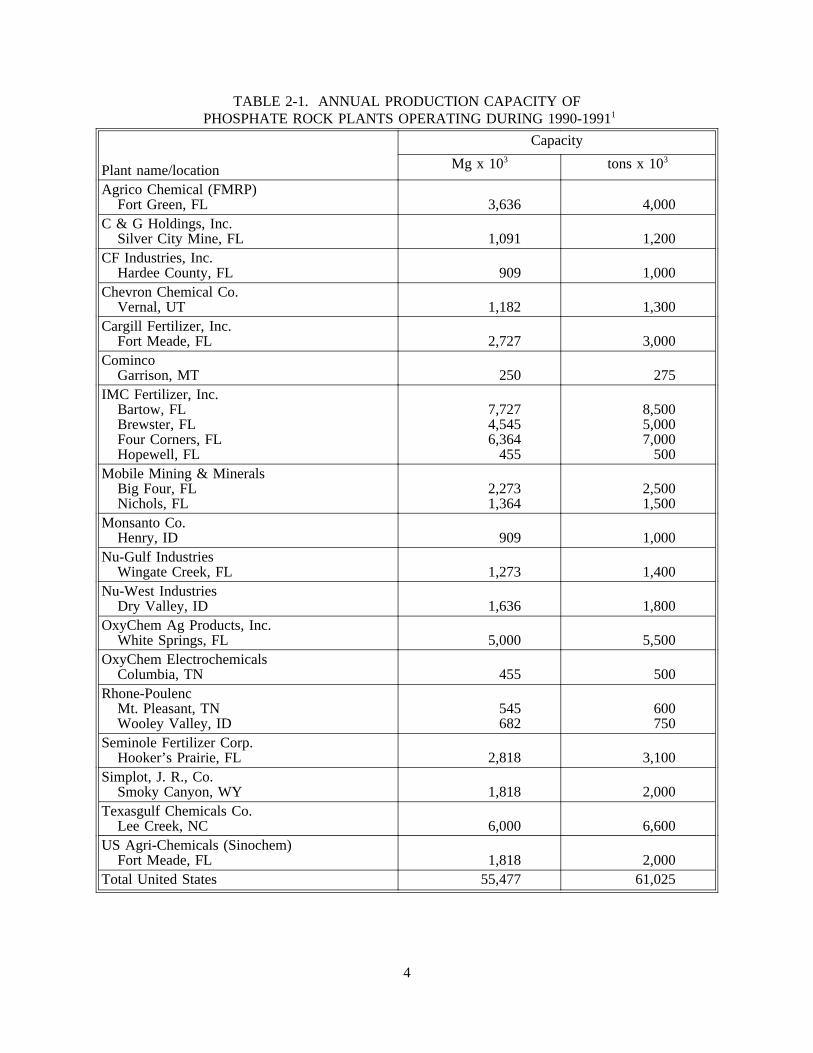
TABLE 2-1. ANNUAL PRODUCTION CAPACITY OFPHOSPHATE ROCK PLANTS OPERATING DURING 1990-19911
Plant name/location
Capacity
Mg x 103 tons x 103
Agrico Chemical (FMRP)Fort Green, FL 3,636 4,000
C & G Holdings, Inc.Silver City Mine, FL 1,091 1,200
CF Industries, Inc.Hardee County, FL 909 1,000
Chevron Chemical Co.Vernal, UT 1,182 1,300
Cargill Fertilizer, Inc.Fort Meade, FL 2,727 3,000
ComincoGarrison, MT 250 275
IMC Fertilizer, Inc.Bartow, FLBrewster, FLFour Corners, FLHopewell, FL
7,7274,5456,364
455
8,5005,0007,000
500Mobile Mining & Minerals
Big Four, FLNichols, FL
2,2731,364
2,5001,500
Monsanto Co.Henry, ID 909 1,000
Nu-Gulf IndustriesWingate Creek, FL 1,273 1,400
Nu-West IndustriesDry Valley, ID 1,636 1,800
OxyChem Ag Products, Inc.White Springs, FL 5,000 5,500
OxyChem ElectrochemicalsColumbia, TN 455 500
Rhone-PoulencMt. Pleasant, TNWooley Valley, ID
545682
600750
Seminole Fertilizer Corp.Hooker’s Prairie, FL 2,818 3,100
Simplot, J. R., Co.Smoky Canyon, WY 1,818 2,000
Texasgulf Chemicals Co.Lee Creek, NC 6,000 6,600
US Agri-Chemicals (Sinochem)Fort Meade, FL 1,818 2,000
Total United States 55,477 61,025
4
filtration and/or drying, depending on the phosphoric acid plant requirements. As is the case forsoutheastern Idaho deposits, most of the processes are wet to facilitate material transport and to reducedust.
The wet beneficiated phosphate rock may be dried or calcined, depending on its organiccontent. Florida rock is relatively free of organics and is for the most part no longer dried or calcined.The rock is maintained at about 10 percent moisture and stored at the mine and/or chemical plant inpiles for future use. The rock is slurried in water and wet-ground in ball mills or rod mills at thechemical plant. There is no significant emission potential from wet grinding. The small amount ofrock that is dried in Florida is dried in direct-fired dryers at about 120°C (250°F); the moisture contentof the rock falls from 10 to 15 percent to 1 to 3 percent. Both rotary and fluidized bed dryers areused, but rotary dryers are more common. Most dryers are fired with natural gas or fuel oil (No. 2 orNo. 6), with many equipped to burn more than one type of fuel.
Unlike Florida rock, phosphate rock mined from other reserves contains organics and must beheated to 760° to 870°C (1400° to 1600°F) to remove them. Fluidized bed calciners are mostcommonly used for this purpose, but rotary calciners are also used. After drying, the rock is usuallyconveyed to storage silos on weather-protected conveyors and, from there, to grinding mills. In NorthCarolina, a portion of the beneficiated rock is calcined at temperatures generally between 800° and825°C (1480° and 1520°F) for use in "green" phosphoric acid production, which is used for producingsuper phosphoric acid and as a raw material for purified phosphoric acid manufacturing. To produce"amber" phosphoric acid, the calcining step is omitted, and the beneficiated rock is transferred directlyto the phosphoric acid production processes. Phosphate rock that is to be used for the production ofgranular triple super phosphate (GTSP) is beneficiated, dried, and ground before being transferred tothe GTSP production processes.
Dried or calcined rock is ground in roll or ball mills to a fine powder, typically specified as60 percent by weight passing a 200-mesh sieve. Rock is fed into the mill by a rotary valve, andground rock is swept from the mill by a circulating air stream. Product size classification is providedby a "revolving whizzer, which is mounted on top of the ball mill" and by an air classifier. Oversizeparticles are recycled to the mill, and product-size particles are separated from the carrying air streamby a cyclone.
2.3 EMISSIONS3-9
The major emission sources for phosphate rock processing are dryers, calciners, and grinders.These sources emit particulate matter (PM) in the form of fine rock dust and sulfur dioxide (SO2).Beneficiation has no significant emission potential because the operations involve slurries of rock andwater. The majority of mining operations in Florida handle only the beneficiation step at the mine; allwet grinding is done at the chemical processing facility.
Emissions from dryers depend on several factors, including fuel types, air flow rates, productmoisture content, speed of rotation, and the type of rock. The pebble portion of Florida rock receivesmuch less washing than the concentrate rock from the flotation processes. It has a higher clay contentand generates more emissions when dried. No significant differences have been noted in gas volumeor emissions from fluid bed or rotary dryers. A typical dryer processing 230 megagrams per hour(Mg/hr) (250 tons per hour [tons/hr]) of rock will discharge between 31 and 45 dry normal cubicmeters per second (dry nm3/sec) (70,000 and 100,000 dry standard cubic feet per minute [dscfm]) ofgas, with a PM loading of 1,100 to 11,000 milligrams per nm3 (mg/nm3) (0.5 to 5 grains per dry
5
standard cubic feet [gr/dscf]). Emissions from calciners consist of PM and SO2 and depend on fueltype (coal or oil), air flow rates, product moisture, and grade of rock.
Phosphate rock contains radionuclides in concentrations that are 10 to 100 times theradionuclide concentration found in most natural material. Most of the radionuclides consist ofuranium and its decay products. Some phosphate rock also contains elevated levels of thorium and itsdaughter products. The specific radionuclides of significance include uranium-238, uranium-234,thorium-230, radium-226, radon-222, lead-210, and polonium-210.
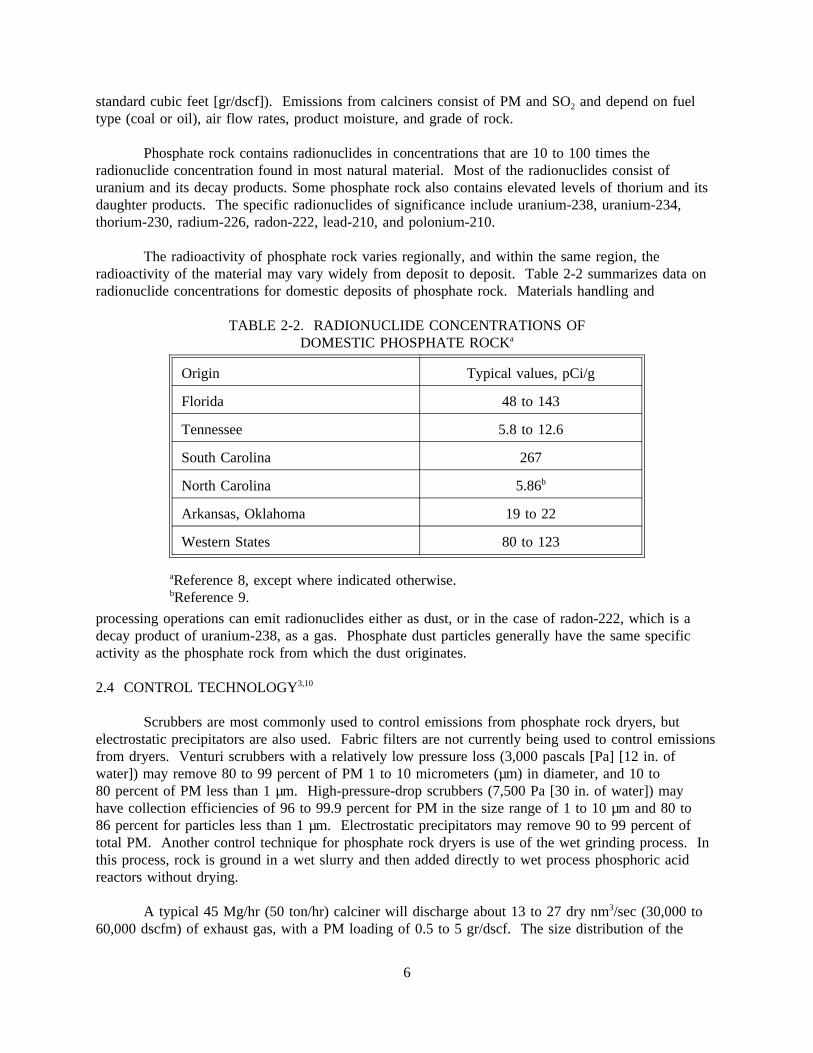
The radioactivity of phosphate rock varies regionally, and within the same region, theradioactivity of the material may vary widely from deposit to deposit. Table 2-2 summarizes data onradionuclide concentrations for domestic deposits of phosphate rock. Materials handling and
TABLE 2-2. RADIONUCLIDE CONCENTRATIONS OFDOMESTIC PHOSPHATE ROCKa
Origin Typical values, pCi/g
Florida 48 to 143
Tennessee 5.8 to 12.6
South Carolina 267
North Carolina 5.86b
Arkansas, Oklahoma 19 to 22
Western States 80 to 123
aReference 8, except where indicated otherwise.bReference 9.
processing operations can emit radionuclides either as dust, or in the case of radon-222, which is adecay product of uranium-238, as a gas. Phosphate dust particles generally have the same specificactivity as the phosphate rock from which the dust originates.
2.4 CONTROL TECHNOLOGY3,10
Scrubbers are most commonly used to control emissions from phosphate rock dryers, butelectrostatic precipitators are also used. Fabric filters are not currently being used to control emissionsfrom dryers. Venturi scrubbers with a relatively low pressure loss (3,000 pascals [Pa] [12 in. ofwater]) may remove 80 to 99 percent of PM 1 to 10 micrometers (µm) in diameter, and 10 to80 percent of PM less than 1 µm. High-pressure-drop scrubbers (7,500 Pa [30 in. of water]) mayhave collection efficiencies of 96 to 99.9 percent for PM in the size range of 1 to 10 µm and 80 to86 percent for particles less than 1 µm. Electrostatic precipitators may remove 90 to 99 percent oftotal PM. Another control technique for phosphate rock dryers is use of the wet grinding process. Inthis process, rock is ground in a wet slurry and then added directly to wet process phosphoric acidreactors without drying.
A typical 45 Mg/hr (50 ton/hr) calciner will discharge about 13 to 27 dry nm3/sec (30,000 to60,000 dscfm) of exhaust gas, with a PM loading of 0.5 to 5 gr/dscf. The size distribution of the
6
uncontrolled calciner emissions is similar to that of the dryer emissions. As with dryers, scrubbers arethe most common control devices used for calciners. At least one operating calciner is equipped witha precipitator. Fabric filters could also be applied.
Oil-fired dryers and calciners have a potential to emit sulfur oxides when high-sulfur residualfuel oils are burned. However, phosphate rock typically contains about 55 percent lime (CaO), whichreacts with the SO2 to form calcium sulfites and sulfates and thus reduces SO2 emissions. Dryers andcalciners also emit fluorides.
A typical grinder of 45 Mg/hr (50 ton/hr) capacity will discharge about 1.6 to 2.5 dry nm3/sec(3,500 to 5,500 dscfm) of air containing 0.5 to 5.0 gr/dscf of PM. The air discharged is "tramp air,"which infiltrates the circulating streams. To avoid fugitive emissions of rock dust, these grindingprocesses are operated at negative pressure. Fabric filters, and sometimes scrubbers, are used tocontrol grinder emissions. Substituting wet grinding for conventional grinding reduces the potentialfor PM emissions.
Emissions from material handling systems are difficult to quantify, because several differentsystems are used to convey rock. Moreover, a large portion of the PM from materials handlingoperations is generated as fugitive emissions. Conveyor belts moving dried rock are usually coveredand sometimes enclosed. Transfer points are sometimes hooded and evacuated. Bucket elevators areusually enclosed and evacuated to a control device, and ground rock is generally conveyed in totallyenclosed systems with well-defined and easily controlled discharge points. Dry rock is normallystored in enclosed bins or silos, which are vented to the atmosphere, with fabric filters frequently usedto control emissions.
The new source performance standard (NSPS) for phosphate rock plants was promulgated inApril 1982 (40 CFR 60 Subpart NN). This standard limits PM emissions and opacity for phosphaterock calciners, dryers, and grinders and limits opacity for handling and transfer operations.
REFERENCES FOR SECTION 2
1. North American Fertilizer Capacity Data, TVA/NFERC-91/14, Circular Z-305, Tennessee ValleyAuthority, Muscle Shoals, AL, December 1991.
2. Minerals Yearbook, Volume I, Metals and Minerals, Bureau of Mines, U.S. Department of theInterior, Washington D.C., 1991.
3. Background Information: Proposed Standards for Phosphate Rock Plants (Draft),EPA-450/3-79-017, U. S. Environmental Protection Agency, Research Triangle Park, NC,September 1979.
4. Written communication from M. S. Batts, Florida Phosphate Council, to R. Myers, EmissionInventory Branch, U. S. Environmental Protection Agency, Research Triangle Park, NC,March 12, 1992.
5. Written communication from K. T. Johnson, The Fertilizer Institute, to R. Myers, EmissionInventory Branch, U. S. Environmental Protection Agency, Research Triangle Park, NC, April 30,1992.
7
6. Written communication from K. T. Johnson, The Fertilizer Institute, to R. Myers, EmissionInventory Branch, U. S. Environmental Protection Agency, Research Triangle Park, NC, February12, 1993.
7. Background Information Document: Proposed Standards for Radionuclides, EPA 520/1-83-001,U. S. Environmental Protection Agency, Office of Radiation Programs, Washington, D.C., March1983.
8. R. T. Stula, et al., Control Technology Alternatives and Costs for Compliance--ElementalPhosphorus Plants, Final Report, EPA Contract No. 68-01-6429, Energy Systems Group, ScienceApplications, Incorporated, La Jolla, CA, December 1, 1983.
9. Telephone communication from B. Peacock, Texasgulf, Incorporated, to R. Marinshaw, MidwestResearch Institute, Cary, NC, April 4, 1993.
10. "Sources of Air Pollution and Their Control," Air Pollution, Volume III, 2nd Ed., Arthur Stern,ed., New York, Academic Press, 1968, pp. 221-222.
8
3. GENERAL DATA REVIEW AND ANALYSIS
3.1 LITERATURE SEARCH AND SCREENING
Data for this investigation were obtained from a number of sources within the Office of AirQuality Planning and Standards (OAQPS) and from outside organizations. The AP-42 BackgroundFiles located in the Emission Inventory Branch (EIB) were reviewed for information on the industry,processes, and emissions. The Crosswalk/Air Toxic Emission Factor Data Base Management System(XATEF) and VOC/PM Speciation Data Base Management System (SPECIATE) data bases weresearched by SCC for identification of the potential pollutants emitted and emission factors for thosepollutants. A general search of the Air CHIEF CD-ROM also was conducted to supplement theinformation from these two data bases.
Information on the industry, including number of plants, plant location, and annualproduction capacities was obtained from the Minerals Yearbook, Census of Minerals, and othersources. The Aerometric Information Retrieval System (AIRS) data base also was searched for dataon the number of plants, plant location, and estimated annual emissions of criteria pollutants.
A number of sources of information were investigated specifically for emission test reports anddata. A search of the Test Method Storage and Retrieval (TSAR) data base was conducted to identifytest reports for sources within the phosphate rock processing industry. Copies of these test reportswere obtained from the files of the Emission Measurement Branch (EMB). The EPA library wassearched for additional test reports. A list of plants that have been tested within the past 5 years wascompiled from the AIRS data base. Using this information and information obtained on plant locationfrom the Minerals Yearbook and Census of Minerals, State and Regional offices were contacted aboutthe availability of test reports. However, the information obtained from these offices was limited.Publications lists from the Office of Research and Development (ORD) and Control TechnologyCenter (CTC) were also searched for reports on emissions from the phosphate rock processingindustry. In addition, representative trade associations, including the American Mining Congress, theFertilizer Institute, the Potash and Phosphate Institute, and the Florida Phosphate Council, werecontacted for assistance in obtaining information about the industry and emissions.
To reduce the amount of literature collected to a final group of references from whichemission factors could be developed, the following general criteria were used:
1. Emission data must be from a primary reference:
a. Source testing must be from a referenced study that does not reiterate information fromprevious studies.
b. The document must constitute the original source of test data. For example, a technicalpaper was not included if the original study was contained in the previous document. If the exactsource of the data could not be determined, the document was eliminated. An exception to thiscriterion was made for background information documents (BID’s) for proposed standards, providedrun-by-run emission and production rate data were included in the document.
2. The referenced study must contain test results based on more than one test run.
9

3. The report must contain sufficient data to evaluate the testing procedures and sourceoperating conditions (e.g., one-page reports were generally rejected).
A final set of reference materials was compiled after a thorough review of the pertinentreports, documents, and information according to these criteria.
3.2 EMISSION DATA QUALITY RATING SYSTEM1
As part of the analysis of the emission data, the quantity and quality of the informationcontained in the final set of reference documents were evaluated. The following data were excludedfrom consideration:
1. Test series averages reported in units that cannot be converted to the selected reportingunits;
2. Test series representing incompatible test methods (i.e., comparison of EPA Method 5 fronthalf with EPA Method 5 front and back half);
3. Test series of controlled emissions for which the control device is not specified;
4. Test series in which the source process is not clearly identified and described; and
5. Test series in which it is not clear whether the emissions were measured before or after thecontrol device.
Test data sets that were not excluded were assigned a quality rating. The rating system usedwas that specified by EIB for preparing AP-42 sections. The data were rated as follows:
A--Multiple tests that were performed on the same source using sound methodology andreported in enough detail for adequate validation. These tests do not necessarily conform to themethodology specified in EPA reference test methods, although these methods were used as a guidefor the methodology actually used.
B--Tests that were performed by a generally sound methodology but lack enough detail foradequate validation.
C--Tests that were based on an untested or new methodology or that lacked a significantamount of background data.
D--Tests that were based on a generally unacceptable method but may provide an order-of-magnitude value for the source.
The following criteria were used to evaluate source test reports for sound methodology andadequate detail:
1. Source operation. The manner in which the source was operated is well documented in thereport. The source was operating within typical parameters during the test.
10
2. Sampling procedures. The sampling procedures conformed to a generally acceptablemethodology. If actual procedures deviated from accepted methods, the deviations are welldocumented. When this occurred, an evaluation was made of the extent to which such alternativeprocedures could influence the test results.
3. Sampling and process data. Adequate sampling and process data are documented in thereport, and any variations in the sampling and process operation are noted. If a large spread betweentest results cannot be explained by information contained in the test report, the data are suspect and aregiven a lower rating.
4. Analysis and calculations. The test reports contain original raw data sheets. Thenomenclature and equations used were compared to those (if any) specified by EPA to establishequivalency. The depth of review of the calculations was dictated by the reviewer’s confidence in theability and conscientiousness of the tester, which in turn was based on factors such as consistency ofresults and completeness of other areas of the test report.
3.3 EMISSION FACTOR QUALITY RATING SYSTEM1
The quality of the emission factors developed from analyzing the test data was rated using thefollowing general criteria:
A--Excellent: Developed only from A-rated test data taken from many randomly chosenfacilities in the industry population. The source category is specific enough so that variability withinthe source category population may be minimized.
B--Above average: Developed only from A-rated test data from a reasonable number offacilities. Although no specific bias is evident, it is not clear if the facilities tested represent a randomsample of the industries. The source category is specific enough so that variability within the sourcecategory population may be minimized.
C--Average: Developed only from A- and B-rated test data from a reasonable number offacilities. Although no specific bias is evident, it is not clear if the facilities tested represent a randomsample of the industry. In addition, the source category is specific enough so that variability withinthe source category population may be minimized.
D--Below average: The emission factor was developed only from A- and B-rated test datafrom a small number of facilities, and there is reason to suspect that these facilities do not represent arandom sample of the industry. There also may be evidence of variability within the source categorypopulation. Limitations on the use of the emission factor are noted in the emission factor table.
E--Poor: The emission factor was developed from C- and D-rated test data, and there isreason to suspect that the facilities tested do not represent a random sample of the industry. Therealso may be evidence of variability within the source category population. Limitations on the use ofthese factors are always noted.
The use of these criteria is somewhat subjective and depends to an extent upon the individualreviewer. Details of the rating of each candidate emission factor are provided in Chapter 4 of thisreport.
11
REFERENCE FOR SECTION 3
1. Technical Procedures for Developing AP-42 Emission Factors and Preparing AP-42 Sections(Draft), Office of Air Quality Planning and Standards, U. S. Environmental Protection Agency,Research Triangle Park, NC, March 6, 1992.
12
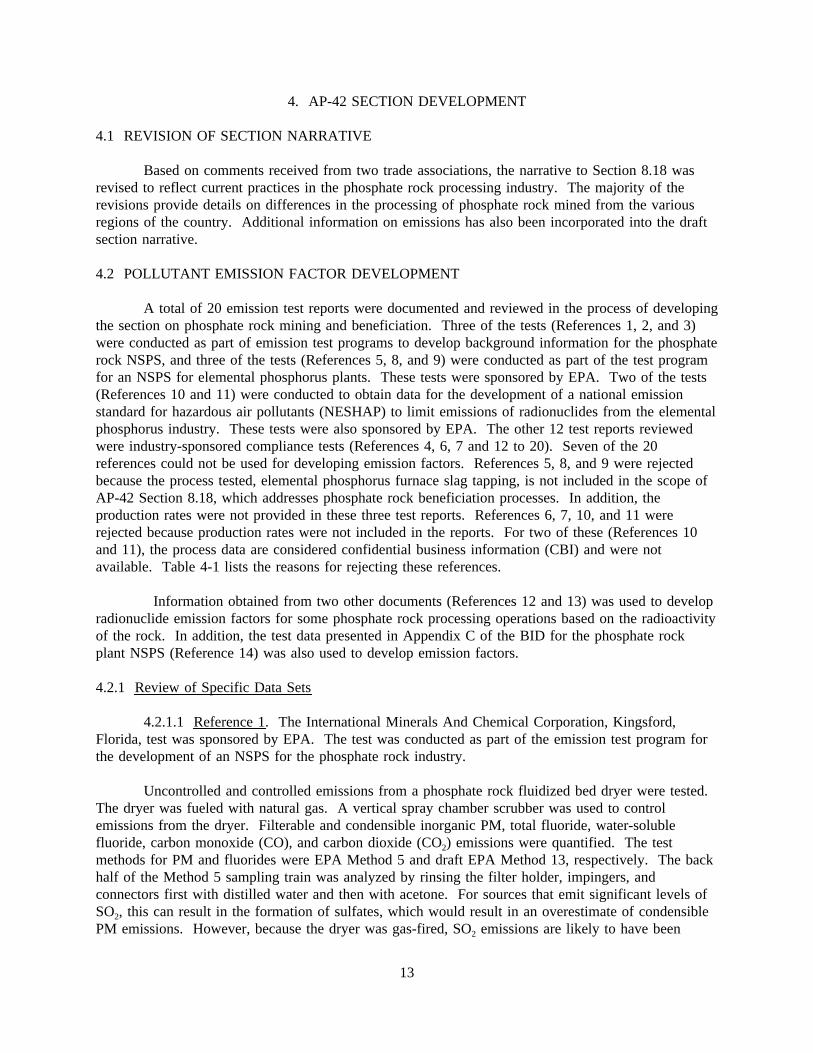
4. AP-42 SECTION DEVELOPMENT
4.1 REVISION OF SECTION NARRATIVE
Based on comments received from two trade associations, the narrative to Section 8.18 wasrevised to reflect current practices in the phosphate rock processing industry. The majority of therevisions provide details on differences in the processing of phosphate rock mined from the variousregions of the country. Additional information on emissions has also been incorporated into the draftsection narrative.
4.2 POLLUTANT EMISSION FACTOR DEVELOPMENT
A total of 20 emission test reports were documented and reviewed in the process of developingthe section on phosphate rock mining and beneficiation. Three of the tests (References 1, 2, and 3)were conducted as part of emission test programs to develop background information for the phosphaterock NSPS, and three of the tests (References 5, 8, and 9) were conducted as part of the test programfor an NSPS for elemental phosphorus plants. These tests were sponsored by EPA. Two of the tests(References 10 and 11) were conducted to obtain data for the development of a national emissionstandard for hazardous air pollutants (NESHAP) to limit emissions of radionuclides from the elementalphosphorus industry. These tests were also sponsored by EPA. The other 12 test reports reviewedwere industry-sponsored compliance tests (References 4, 6, 7 and 12 to 20). Seven of the 20references could not be used for developing emission factors. References 5, 8, and 9 were rejectedbecause the process tested, elemental phosphorus furnace slag tapping, is not included in the scope ofAP-42 Section 8.18, which addresses phosphate rock beneficiation processes. In addition, theproduction rates were not provided in these three test reports. References 6, 7, 10, and 11 wererejected because production rates were not included in the reports. For two of these (References 10and 11), the process data are considered confidential business information (CBI) and were notavailable. Table 4-1 lists the reasons for rejecting these references.
Information obtained from two other documents (References 12 and 13) was used to developradionuclide emission factors for some phosphate rock processing operations based on the radioactivityof the rock. In addition, the test data presented in Appendix C of the BID for the phosphate rockplant NSPS (Reference 14) was also used to develop emission factors.
4.2.1 Review of Specific Data Sets
4.2.1.1 Reference 1. The International Minerals And Chemical Corporation, Kingsford,Florida, test was sponsored by EPA. The test was conducted as part of the emission test program forthe development of an NSPS for the phosphate rock industry.
Uncontrolled and controlled emissions from a phosphate rock fluidized bed dryer were tested.The dryer was fueled with natural gas. A vertical spray chamber scrubber was used to controlemissions from the dryer. Filterable and condensible inorganic PM, total fluoride, water-solublefluoride, carbon monoxide (CO), and carbon dioxide (CO2) emissions were quantified. The testmethods for PM and fluorides were EPA Method 5 and draft EPA Method 13, respectively. The backhalf of the Method 5 sampling train was analyzed by rinsing the filter holder, impingers, andconnectors first with distilled water and then with acetone. For sources that emit significant levels ofSO2, this can result in the formation of sulfates, which would result in an overestimate of condensiblePM emissions. However, because the dryer was gas-fired, SO2 emissions are likely to have been
13
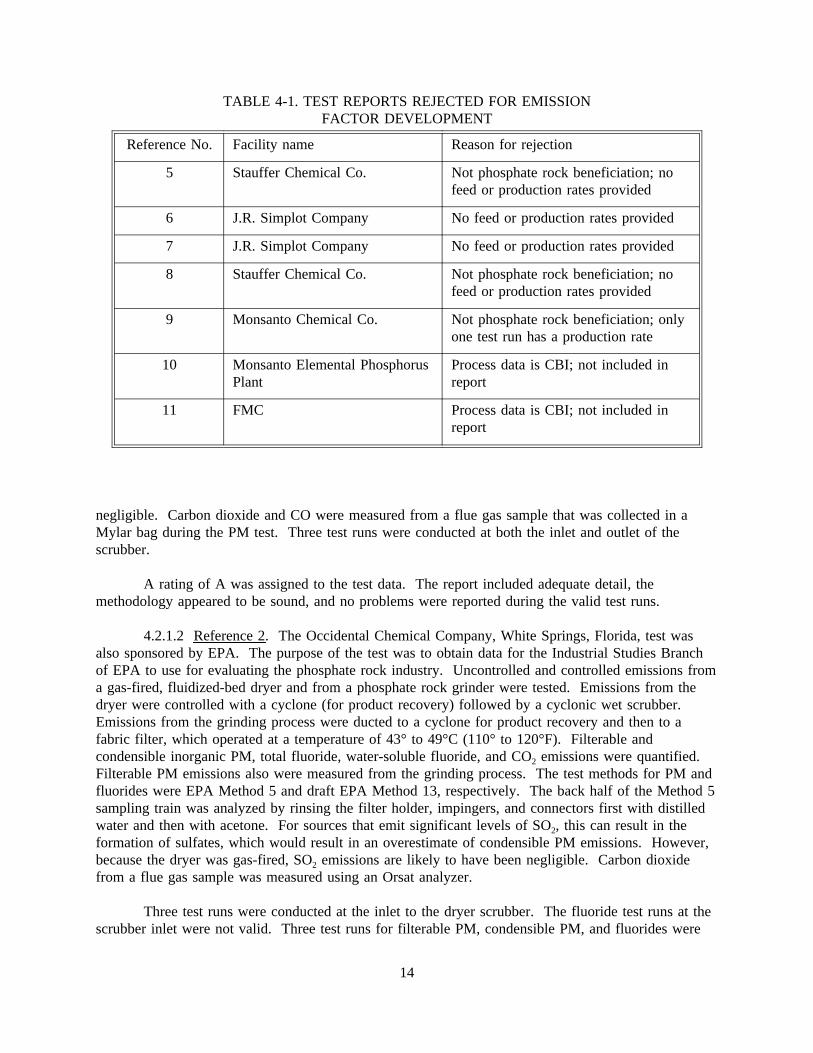
negligible. Carbon dioxide and CO were measured from a flue gas sample that was collected in a
TABLE 4-1. TEST REPORTS REJECTED FOR EMISSIONFACTOR DEVELOPMENT
Reference No. Facility name Reason for rejection
5 Stauffer Chemical Co. Not phosphate rock beneficiation; nofeed or production rates provided
6 J.R. Simplot Company No feed or production rates provided
7 J.R. Simplot Company No feed or production rates provided
8 Stauffer Chemical Co. Not phosphate rock beneficiation; nofeed or production rates provided
9 Monsanto Chemical Co. Not phosphate rock beneficiation; onlyone test run has a production rate
10 Monsanto Elemental PhosphorusPlant
Process data is CBI; not included inreport
11 FMC Process data is CBI; not included inreport
Mylar bag during the PM test. Three test runs were conducted at both the inlet and outlet of thescrubber.
A rating of A was assigned to the test data. The report included adequate detail, themethodology appeared to be sound, and no problems were reported during the valid test runs.
4.2.1.2 Reference 2. The Occidental Chemical Company, White Springs, Florida, test wasalso sponsored by EPA. The purpose of the test was to obtain data for the Industrial Studies Branchof EPA to use for evaluating the phosphate rock industry. Uncontrolled and controlled emissions froma gas-fired, fluidized-bed dryer and from a phosphate rock grinder were tested. Emissions from thedryer were controlled with a cyclone (for product recovery) followed by a cyclonic wet scrubber.Emissions from the grinding process were ducted to a cyclone for product recovery and then to afabric filter, which operated at a temperature of 43° to 49°C (110° to 120°F). Filterable andcondensible inorganic PM, total fluoride, water-soluble fluoride, and CO2 emissions were quantified.Filterable PM emissions also were measured from the grinding process. The test methods for PM andfluorides were EPA Method 5 and draft EPA Method 13, respectively. The back half of the Method 5sampling train was analyzed by rinsing the filter holder, impingers, and connectors first with distilledwater and then with acetone. For sources that emit significant levels of SO2, this can result in theformation of sulfates, which would result in an overestimate of condensible PM emissions. However,because the dryer was gas-fired, SO2 emissions are likely to have been negligible. Carbon dioxidefrom a flue gas sample was measured using an Orsat analyzer.
Three test runs were conducted at the inlet to the dryer scrubber. The fluoride test runs at thescrubber inlet were not valid. Three test runs for filterable PM, condensible PM, and fluorides were
14

conducted at the scrubber outlet. The impinger from the third test run for total PM was broken,leaving two valid data sets from which to calculate condensible PM emission factors. Carbon dioxidesamples were taken during each test run.
Emissions from the grinder were controlled by fabric filters. Three test runs for filterable andcondensible PM were conducted at the inlet and outlet to the grinder fabric filters. The inlet testswere invalid due to isokinetic testing conditions.
A rating of A was assigned to the test data. The report included adequate detail, themethodology appeared to be sound, and no problems were reported during the valid test runs.
4.2.1.3 Reference 3. The International Minerals and Chemical Corporation, Noralyn, Florida,test was sponsored by EPA. The test was conducted as part of the emission test program for thedevelopment of an NSPS for the phosphate rock industry.
Uncontrolled and controlled emissions from a phosphate rock grinder were tested. Emissionsfrom the grinder were controlled with a fabric filter. Filterable and condensible inorganic PMemissions were quantified. The test method for PM was EPA Method 5. The back half of the Method5 sampling train was analyzed by rinsing the filter holder, impingers, and connectors first with distilledwater and then with acetone. For sources that emit significant levels of SO2, this can result in theformation of sulfates, which would result in an overestimate of condensible PM emissions. However,because combustion is required for the grinding process, SO2 emissions are likely to have beennegligible. Three test runs were conducted at both the inlet and outlet of the fabric filter. The secondinlet test run was not valid due to isokinetic testing conditions.
A rating of A was assigned to the test data. The report included adequate detail, themethodology appeared to be sound, and no problems were reported during the valid test runs.
4.2.1.4 References 4 and 12-20. These reports document 10 emission tests on 6 phosphaterock calciners located at the same facility. The calciners are fired with a mixture of coal and coke.The tests included measurements of emissions of filterable PM, condensible inorganic PM, condensibleorganic PM, SO2, and CO2. Table 4-2 lists the tests conducted on each of the calciners. The purposeof the emission tests was to demonstrate compliance with State regulations; the tests were conductedduring 1990, 1991 and 1992. Process rates were provided on a raw material dry feed basis.
Emissions from each calciner are controlled with a separate venturi scrubber. However, detailson the control devices were not provided in the test reports.
Filterable PM emissions were measured using Method 5; condensible PM emissions weremeasured using Method 202; SO2 emissions were measured using Method 6; and CO2 concentrationsin the exhaust streams were measured by Orsat. For each of the tests, three runs were conducted.Emission factors were developed for controlled filterable PM, condensible inorganic PM, condensibleorganic PM, SO2, and CO2 emissions from the calciners.
The emission data are rated B. The test methodologies were sound and no problems werereported, but the report lacked adequate documentation for higher emission data ratings.
4.2.1.5 References 21 and 22. These two documents provided information on theradioactivity of various deposits of phosphate rock and indicated that the specific activity of PM is the
15
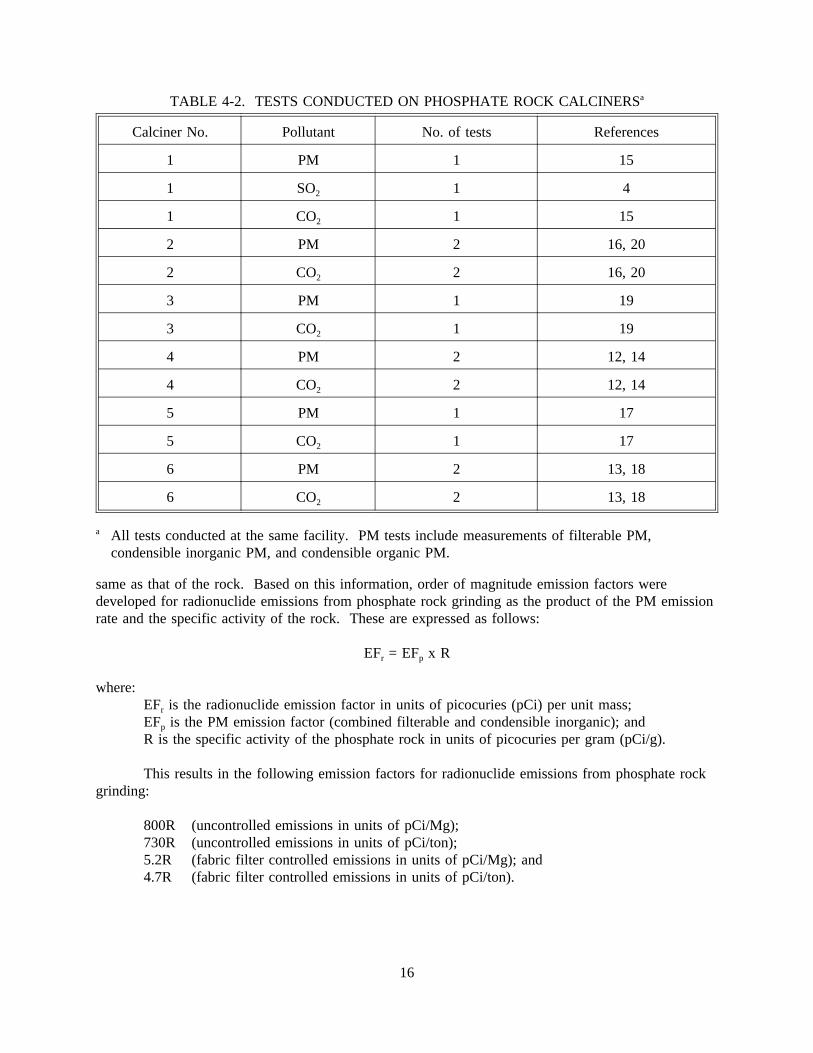
same as that of the rock. Based on this information, order of magnitude emission factors were
TABLE 4-2. TESTS CONDUCTED ON PHOSPHATE ROCK CALCINERSa
Calciner No. Pollutant No. of tests References
1 PM 1 15
1 SO2 1 4
1 CO2 1 15
2 PM 2 16, 20
2 CO2 2 16, 20
3 PM 1 19
3 CO2 1 19
4 PM 2 12, 14
4 CO2 2 12, 14
5 PM 1 17
5 CO2 1 17
6 PM 2 13, 18
6 CO2 2 13, 18
a All tests conducted at the same facility. PM tests include measurements of filterable PM,condensible inorganic PM, and condensible organic PM.
developed for radionuclide emissions from phosphate rock grinding as the product of the PM emissionrate and the specific activity of the rock. These are expressed as follows:
EFr = EFp x R
where:EFr is the radionuclide emission factor in units of picocuries (pCi) per unit mass;EFp is the PM emission factor (combined filterable and condensible inorganic); andR is the specific activity of the phosphate rock in units of picocuries per gram (pCi/g).
This results in the following emission factors for radionuclide emissions from phosphate rockgrinding:
800R (uncontrolled emissions in units of pCi/Mg);730R (uncontrolled emissions in units of pCi/ton);5.2R (fabric filter controlled emissions in units of pCi/Mg); and4.7R (fabric filter controlled emissions in units of pCi/ton).
16

4.2.2 Review of XATEF and SPECIATE Data Base Emission Factors
The SPECIATE data base includes emission factors for a number of speciated inorganic andvolatile organic compounds (VOC’s) from phosphate rock drying, grinding, transfer/storage, openstorage, and calcining. However, the emission factors are all surrogates, which are based on averagesfor the mineral products industry as a whole.
The XATEF data base includes emission factors for radionuclides from phosphate rockprocessing. The reference cited for this information (Background Information Document, ProposedStandards for Radionuclides, EPA 520/1-83-001, Office of Radiation Programs, Washington, D.C.,March 1983), which provides emission factors for five radionuclides, is a secondary reference. Theprimary reference for the emission data (Radiation Dose Estimates Due to Air Particulate EmissionsFrom Selected Phosphate Industry Operations, ORP/EERF-78-1, Office of Radiation Programs,Montgomery, Alabama, 1978), could not be obtained in time for this review. For that reason, thoseemission factors have not been incorporated into the draft revision to the section described here.
4.2.3 Review of Test Data in AP-42 Background File
The current version of Section 8.18 includes uncontrolled PM emission factors for phosphaterock drying, calcining, grinding, transfer and storage, and open storage pile emissions. The emissionfactors for drying, calcining, and grinding are referenced to the BID for proposed standards forphosphate rock plants (Reference 23). This reference includes run-by-run data on tests conducted ateight plants. However, only the controlled emission data are reported. With the exception of twoplants (Plants D and E), the primary references (i.e., the test reports) for these tests could not beobtained. Therefore, only the controlled emissions data, as reported in the background informationdocument, could be used for developing new emission factors. The data for Plants D and E in thephosphate rock BID are accounted for in References 2 and 3, respectively. Because the informationcontained in the BID lacks adequate detail for adequate validation, these data are assigned a ratingof B.
The current version of Section 8.18 also includes average particle size data for phosphate rockdryer and calciner emissions, which are referenced to the phosphate rock NSPS BID. These data aretaken directly from Table 4-2 of the phosphate rock BID; run-by-run data for the tests upon which thedata are based are not provided in Appendix C of the BID. Although not stated explicitly in the BID,it is assumed that these particle size data are for uncontrolled emissions. Because the primaryreferences for these data could not be located for this review, the data could not be verified. Thesedata are rated C.
The emission factor for transfer and storage is referenced to unpublished test data from 1970.The reference is not found in the background file. Because of the lack of documentation and the ageof the test data, the test method and representativeness of the emission data are highly suspect. Forthis reason, the emission factor for transfer and storage has been rated E.
The emission factor for open storage piles is referenced to a document (Control Techniques forFluoride Emissions, Internal Document, Office of Air Quality Planning and Standards, September1970) that provides unreferenced estimates for PM emissions from phosphate rock storage piles.Because of the lack of documentation for the basis of this estimate, which appears to have been basedon engineering judgment, this emission factor has been excluded from the draft section. Instead, the
17
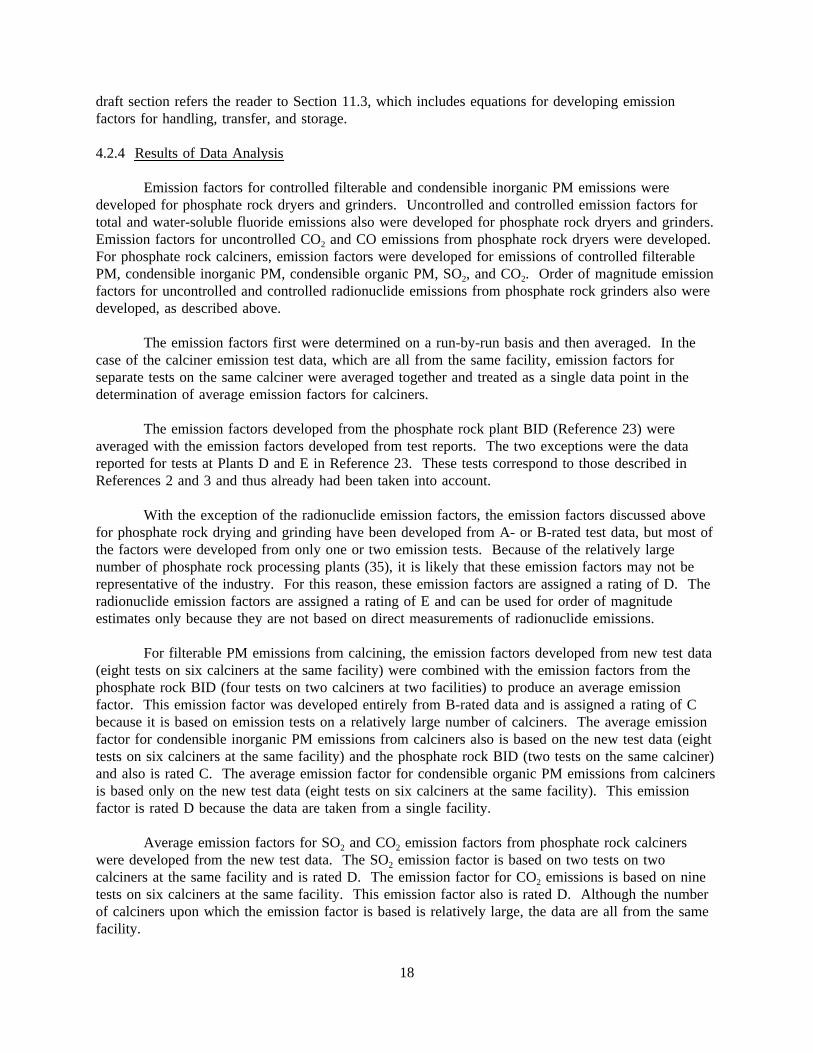
draft section refers the reader to Section 11.3, which includes equations for developing emissionfactors for handling, transfer, and storage.
4.2.4 Results of Data Analysis
Emission factors for controlled filterable and condensible inorganic PM emissions weredeveloped for phosphate rock dryers and grinders. Uncontrolled and controlled emission factors fortotal and water-soluble fluoride emissions also were developed for phosphate rock dryers and grinders.Emission factors for uncontrolled CO2 and CO emissions from phosphate rock dryers were developed.For phosphate rock calciners, emission factors were developed for emissions of controlled filterablePM, condensible inorganic PM, condensible organic PM, SO2, and CO2. Order of magnitude emissionfactors for uncontrolled and controlled radionuclide emissions from phosphate rock grinders also weredeveloped, as described above.
The emission factors first were determined on a run-by-run basis and then averaged. In thecase of the calciner emission test data, which are all from the same facility, emission factors forseparate tests on the same calciner were averaged together and treated as a single data point in thedetermination of average emission factors for calciners.
The emission factors developed from the phosphate rock plant BID (Reference 23) wereaveraged with the emission factors developed from test reports. The two exceptions were the datareported for tests at Plants D and E in Reference 23. These tests correspond to those described inReferences 2 and 3 and thus already had been taken into account.
With the exception of the radionuclide emission factors, the emission factors discussed abovefor phosphate rock drying and grinding have been developed from A- or B-rated test data, but most ofthe factors were developed from only one or two emission tests. Because of the relatively largenumber of phosphate rock processing plants (35), it is likely that these emission factors may not berepresentative of the industry. For this reason, these emission factors are assigned a rating of D. Theradionuclide emission factors are assigned a rating of E and can be used for order of magnitudeestimates only because they are not based on direct measurements of radionuclide emissions.
For filterable PM emissions from calcining, the emission factors developed from new test data(eight tests on six calciners at the same facility) were combined with the emission factors from thephosphate rock BID (four tests on two calciners at two facilities) to produce an average emissionfactor. This emission factor was developed entirely from B-rated data and is assigned a rating of Cbecause it is based on emission tests on a relatively large number of calciners. The average emissionfactor for condensible inorganic PM emissions from calciners also is based on the new test data (eighttests on six calciners at the same facility) and the phosphate rock BID (two tests on the same calciner)and also is rated C. The average emission factor for condensible organic PM emissions from calcinersis based only on the new test data (eight tests on six calciners at the same facility). This emissionfactor is rated D because the data are taken from a single facility.
Average emission factors for SO2 and CO2 emission factors from phosphate rock calcinerswere developed from the new test data. The SO2 emission factor is based on two tests on twocalciners at the same facility and is rated D. The emission factor for CO2 emissions is based on ninetests on six calciners at the same facility. This emission factor also is rated D. Although the numberof calciners upon which the emission factor is based is relatively large, the data are all from the samefacility.
18

The new emission factors for uncontrolled PM emissions from drying, grinding, and calciningthat were developed from References 1, 2, and 3 are comparable to the uncontrolled PM emissionfactors in the current version of AP-42. Because the emission factors presented in the current versionare based on more emission tests than the new factors developed for this review, no changes areproposed to the existing uncontrolled PM emission factors for phosphate rock processing. However,these emission factors are presented as uncontrolled "filterable PM" emission factors, rather than assimply uncontrolled "PM" emission factors in the revised AP-42 Section. Currently, these emissionfactors are rated B. However, because they are based on tests at a small number of plants, theemission factors for drying and calcining (based on two plants) are downrated to D, and the emissionfactors for grinding (based on four plants) are downrated to C in the proposed revision.
The particle size distribution data for dryers and calciners from the current version ofSection 8.18 also have been retained in the revised version of the section. Because the data have beenassigned a rating of C, the particle size distribution presented in the revised section, and size-specificemission factors based on that data, are assigned a rating of E. These data were used developuncontrolled PM-10 emission factors for phosphate rocks dryers and calciners. These PM-10 emissionfactors also are rated E.
Table 4-3 summarizes the emission data for filterable PM, condensible inorganic PM,water-soluble fluoride, total fluoride, CO2, and CO from dryers. Table 4-4 summarizes the emissiondata for filterable and condensible PM from grinders. Table 4-5 summarizes the emission factors forfilterable PM, condensible inorganic PM, condensible organic PM, SO2 and CO2 emissions fromphosphate rock calciners. Table 4-6 provides a summary of the new emission factors developed fromthe phosphate rock plant BID. Table 4-7 provides a summary of emission factors developed forphosphate rock processing. The table includes the number of tests upon which the emission factorsare based, identifies the references for the test data, and indicates the emission factor ratings.Table 4-7 does not include the emission factors for uncontrolled PM emissions from phosphate rockdrying, grinding, calcining, transfer, and storage and particle size distribution, which, with theexception of the emission factor for open storage piles, are retained from the current version ofSection 8.18.
REFERENCES FOR SECTION 4
1. Emission Test Report: International Minerals and Chemical Corporation, Kingsford, Florida, EMBReport 73-ROC-1, U. S. Environmental Protection Agency, Research Triangle Park, NC,February 1973.
2. Emission Test Report: Occidental Chemical Company, White Springs, Florida, EMBReport 73-ROC-3, U. S. Environmental Protection Agency, Research Triangle Park, NC, January1973.
3. Emission Test Report: International Minerals and Chemical Corporation, Noralyn, Florida, EMBReport 73-ROC-2, U. S. Environmental Protection Agency, Research Triangle Park, NC,February 1973.
4. Sulfur Dioxide Emission Rate Test, No. 1 Calciner, Texasgulf Incorporated, Aurora, NorthCarolina, Texasgulf Environmental Section, Aurora, NC, May 1990.
19
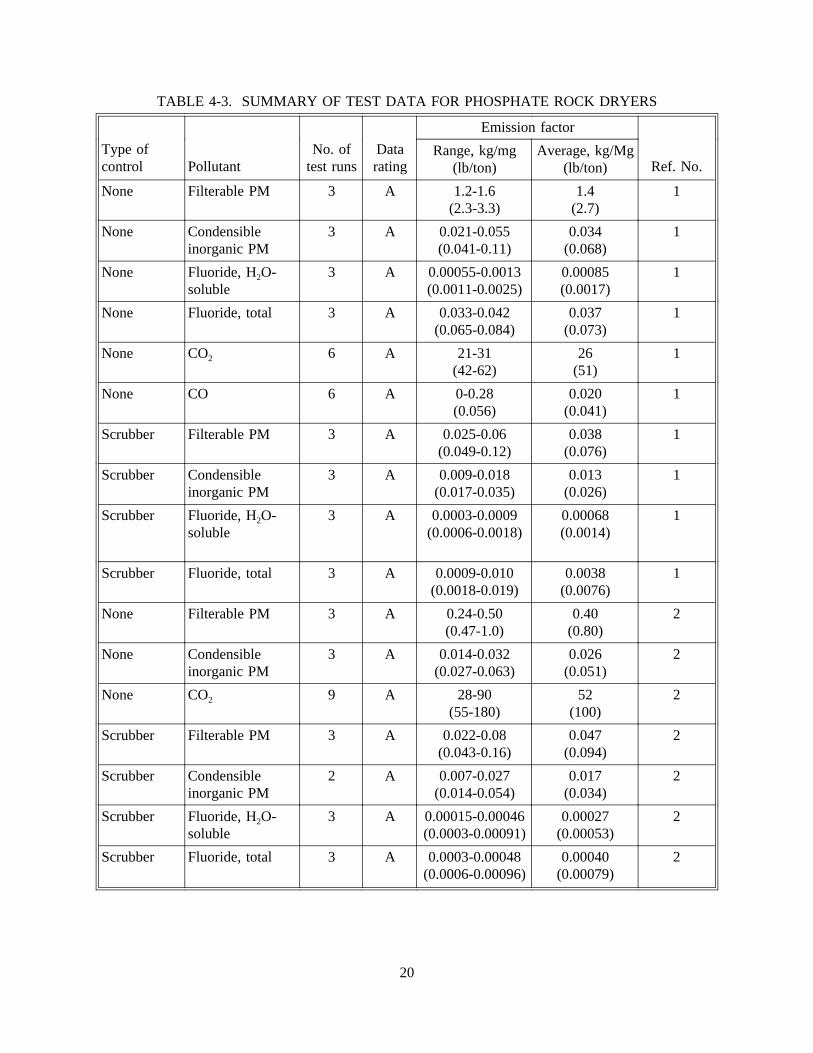
TABLE 4-3. SUMMARY OF TEST DATA FOR PHOSPHATE ROCK DRYERS
Emission factor
Type ofcontrol Pollutant
No. oftest runs
Datarating
Range, kg/mg(lb/ton)
Average, kg/Mg(lb/ton) Ref. No.
None Filterable PM 3 A 1.2-1.6(2.3-3.3)
1.4(2.7)
1
None Condensibleinorganic PM
3 A 0.021-0.055(0.041-0.11)
0.034(0.068)
1
None Fluoride, H2O-soluble
3 A 0.00055-0.0013(0.0011-0.0025)
0.00085(0.0017)
1
None Fluoride, total 3 A 0.033-0.042(0.065-0.084)
0.037(0.073)
1
None CO2 6 A 21-31(42-62)
26(51)
1
None CO 6 A 0-0.28(0.056)
0.020(0.041)
1
Scrubber Filterable PM 3 A 0.025-0.06(0.049-0.12)
0.038(0.076)
1
Scrubber Condensibleinorganic PM
3 A 0.009-0.018(0.017-0.035)
0.013(0.026)
1
Scrubber Fluoride, H2O-soluble
3 A 0.0003-0.0009(0.0006-0.0018)
0.00068(0.0014)
1
Scrubber Fluoride, total 3 A 0.0009-0.010(0.0018-0.019)
0.0038(0.0076)
1
None Filterable PM 3 A 0.24-0.50(0.47-1.0)
0.40(0.80)
2
None Condensibleinorganic PM
3 A 0.014-0.032(0.027-0.063)
0.026(0.051)
2
None CO2 9 A 28-90(55-180)
52(100)
2
Scrubber Filterable PM 3 A 0.022-0.08(0.043-0.16)
0.047(0.094)
2
Scrubber Condensibleinorganic PM
2 A 0.007-0.027(0.014-0.054)
0.017(0.034)
2
Scrubber Fluoride, H2O-soluble
3 A 0.00015-0.00046(0.0003-0.00091)
0.00027(0.00053)
2
Scrubber Fluoride, total 3 A 0.0003-0.00048(0.0006-0.00096)
0.00040(0.00079)
2
20

TABLE 4-4. SUMMARY OF TEST DATA FOR PHOSPHATE ROCK GRINDINGa
Emission factor
Type ofcontrol Pollutant
No. oftest runs
Datarating
Range, kg/mg(lb/ton)
Average,kg/Mg (lb/ton) Ref. No.
None Filterable PM 2 A 1.1-1.3(2.2-2.6)
1.2(2.4)
3
None Condensibleinorganic PM
2 A 0.0026-0.0038(0.0051-0.0076)
0.0032(0.0064)
3
Fabric filter Filterable PM 3 A 0.0036-0.0049(0.0072-0.0097)
0.0044(0.0088)
2
Fabric filter Condensibleinorganic PM
3 A 0.0010-0.0017(0.0020-0.0033)
0.0014(0.0027)
2
Fabric filter Filterable PM 3 A 0.0016-0.0023(0.0031-0.0055)
0.0021(0.0042)
3
Fabric filter Condensibleinorganic PM
3 A 0.0013-0.0036(0.0026-0.0072)
0.0023(0.0046)
3
aDry grinding process only.
21
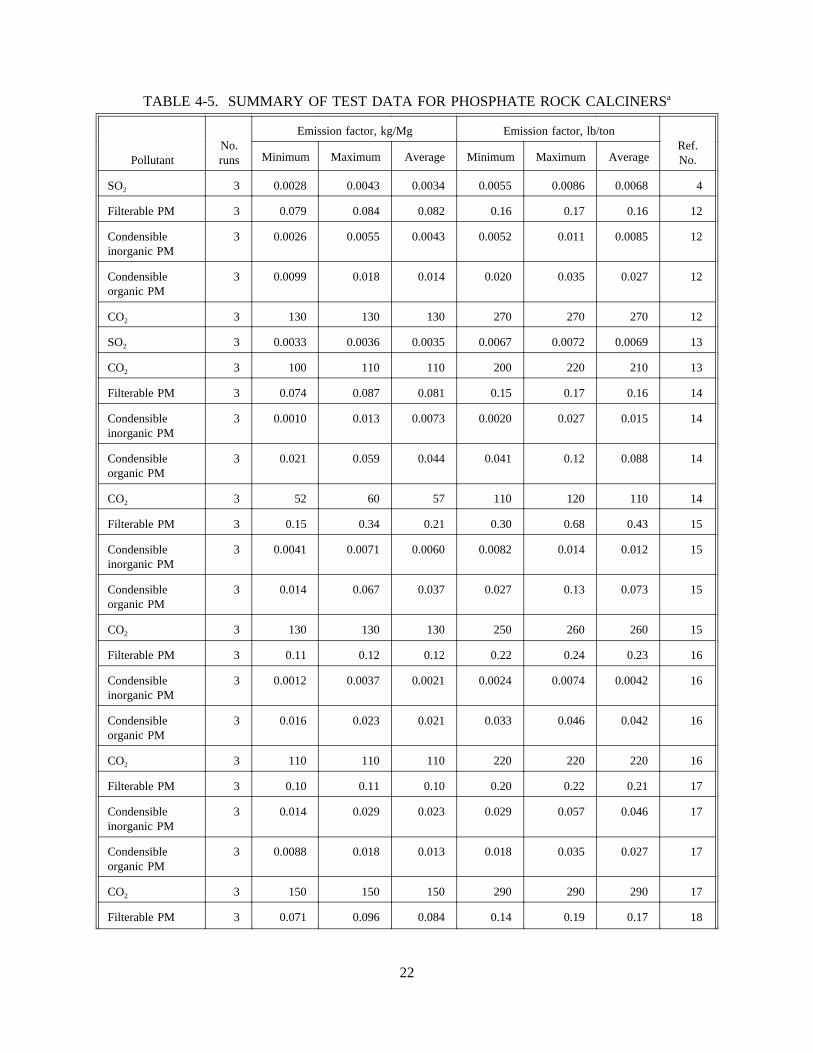
TABLE 4-5. SUMMARY OF TEST DATA FOR PHOSPHATE ROCK CALCINERSa
PollutantNo.runs
Emission factor, kg/Mg Emission factor, lb/tonRef.No.Minimum Maximum Average Minimum Maximum Average
SO2 3 0.0028 0.0043 0.0034 0.0055 0.0086 0.0068 4
Filterable PM 3 0.079 0.084 0.082 0.16 0.17 0.16 12
Condensibleinorganic PM
3 0.0026 0.0055 0.0043 0.0052 0.011 0.0085 12
Condensibleorganic PM
3 0.0099 0.018 0.014 0.020 0.035 0.027 12
CO2 3 130 130 130 270 270 270 12
SO2 3 0.0033 0.0036 0.0035 0.0067 0.0072 0.0069 13
CO2 3 100 110 110 200 220 210 13
Filterable PM 3 0.074 0.087 0.081 0.15 0.17 0.16 14
Condensibleinorganic PM
3 0.0010 0.013 0.0073 0.0020 0.027 0.015 14
Condensibleorganic PM
3 0.021 0.059 0.044 0.041 0.12 0.088 14
CO2 3 52 60 57 110 120 110 14
Filterable PM 3 0.15 0.34 0.21 0.30 0.68 0.43 15
Condensibleinorganic PM
3 0.0041 0.0071 0.0060 0.0082 0.014 0.012 15
Condensibleorganic PM
3 0.014 0.067 0.037 0.027 0.13 0.073 15
CO2 3 130 130 130 250 260 260 15
Filterable PM 3 0.11 0.12 0.12 0.22 0.24 0.23 16
Condensibleinorganic PM
3 0.0012 0.0037 0.0021 0.0024 0.0074 0.0042 16
Condensibleorganic PM
3 0.016 0.023 0.021 0.033 0.046 0.042 16
CO2 3 110 110 110 220 220 220 16
Filterable PM 3 0.10 0.11 0.10 0.20 0.22 0.21 17
Condensibleinorganic PM
3 0.014 0.029 0.023 0.029 0.057 0.046 17
Condensibleorganic PM
3 0.0088 0.018 0.013 0.018 0.035 0.027 17
CO2 3 150 150 150 290 290 290 17
Filterable PM 3 0.071 0.096 0.084 0.14 0.19 0.17 18
22
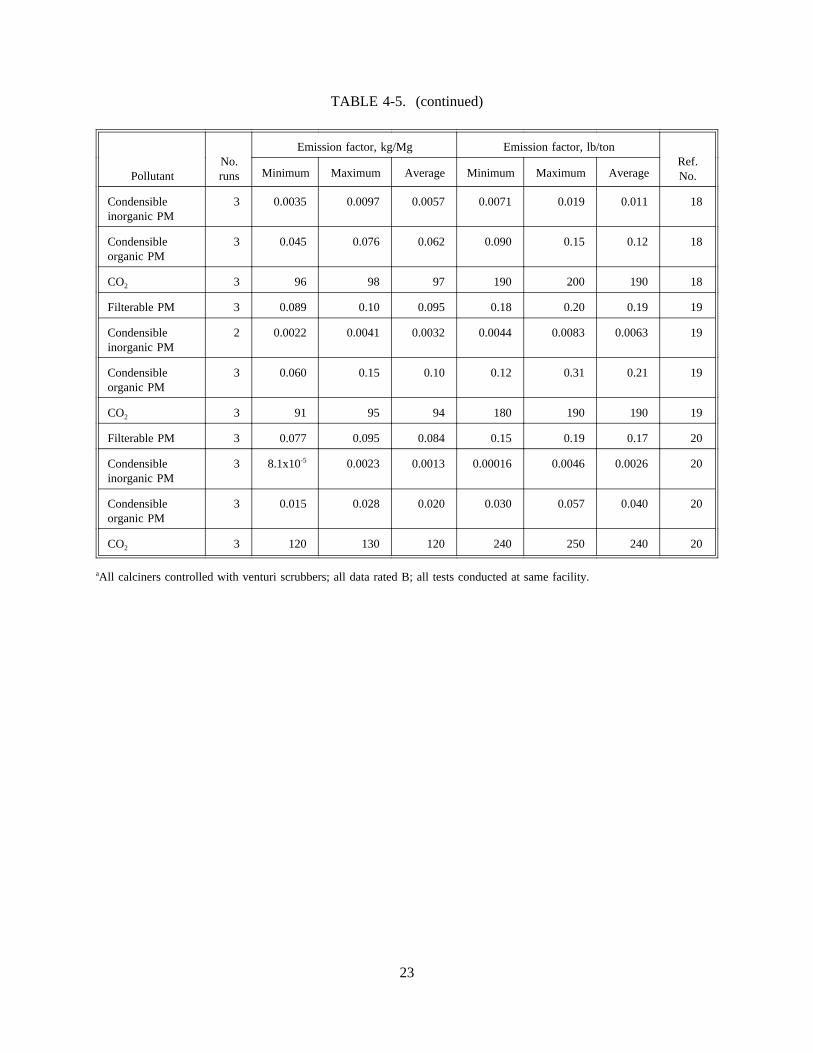
TABLE 4-5. (continued)
PollutantNo.runs
Emission factor, kg/Mg Emission factor, lb/tonRef.No.Minimum Maximum Average Minimum Maximum Average
Condensibleinorganic PM
3 0.0035 0.0097 0.0057 0.0071 0.019 0.011 18
Condensibleorganic PM
3 0.045 0.076 0.062 0.090 0.15 0.12 18
CO2 3 96 98 97 190 200 190 18
Filterable PM 3 0.089 0.10 0.095 0.18 0.20 0.19 19
Condensibleinorganic PM
2 0.0022 0.0041 0.0032 0.0044 0.0083 0.0063 19
Condensibleorganic PM
3 0.060 0.15 0.10 0.12 0.31 0.21 19
CO2 3 91 95 94 180 190 190 19
Filterable PM 3 0.077 0.095 0.084 0.15 0.19 0.17 20
Condensibleinorganic PM
3 8.1x10⁻⁵ 0.0023 0.0013 0.00016 0.0046 0.0026 20
Condensibleorganic PM
3 0.015 0.028 0.020 0.030 0.057 0.040 20
CO2 3 120 130 120 240 250 240 20
aAll calciners controlled with venturi scrubbers; all data rated B; all tests conducted at same facility.
23

TABLE 4-6. SUMMARY OF TEST DATA FOR PHOSPHATE ROCK BID, APPENDIX C23
Emission factor
ProcessType ofcontrol Pollutant
No. oftest runs
Range, kg/mg(lb/ton)
Average, kg/Mg(lb/ton) Plant
Dryer Scrubber Filterable PM 5 0.017-0.024(0.034-0.047)
0.019(0.039)
A
Condensibleinorganic PM
5 0.012-0.055(0.024-0.11)
0.031(0.061)
Dryer ESP Filterable PM 3 0.012-0.019(0.023-0.038)
0.016(0.033)
B
Condensibleinorganic PM
3 0.004-0.005(0.007-0.009)
0.004(0.008)
Calciner Scrubber Filterable PM 11 0.05-0.16(0.10-0.31)
0.085(0.17)
C
Condensibleinorganic PM
6 0.005-0.02(0.01-0.04)
0.01(0.02)
Calciner Scrubber Filterable PM 3 0.041-0.054(0.082-0.107)
0.047(0.095)
K
Calciner Scrubber Fluoride, total 6 0.0003-0.0015(0.0006-0.0030)
0.00081(0.0016)
C
Grinder Fabric filter Filterable PM 3 0.00060-0.00075(0.0012-0.0015)
0.00067(0.0013)
F
Condensibleinorganic PM
3 0.0002-0.0004(0.0003-0.0008)
0.0003(0.0006)
Grinder Fabric filter Filterable PM 6 0.0003-0.0030(0.0006-0.0060)
0.0014(0.0027)
G
Condensibleinorganic PM
3 0.0000-0.0005(0.0000-0.0009)
0.0002(0.0004)
24
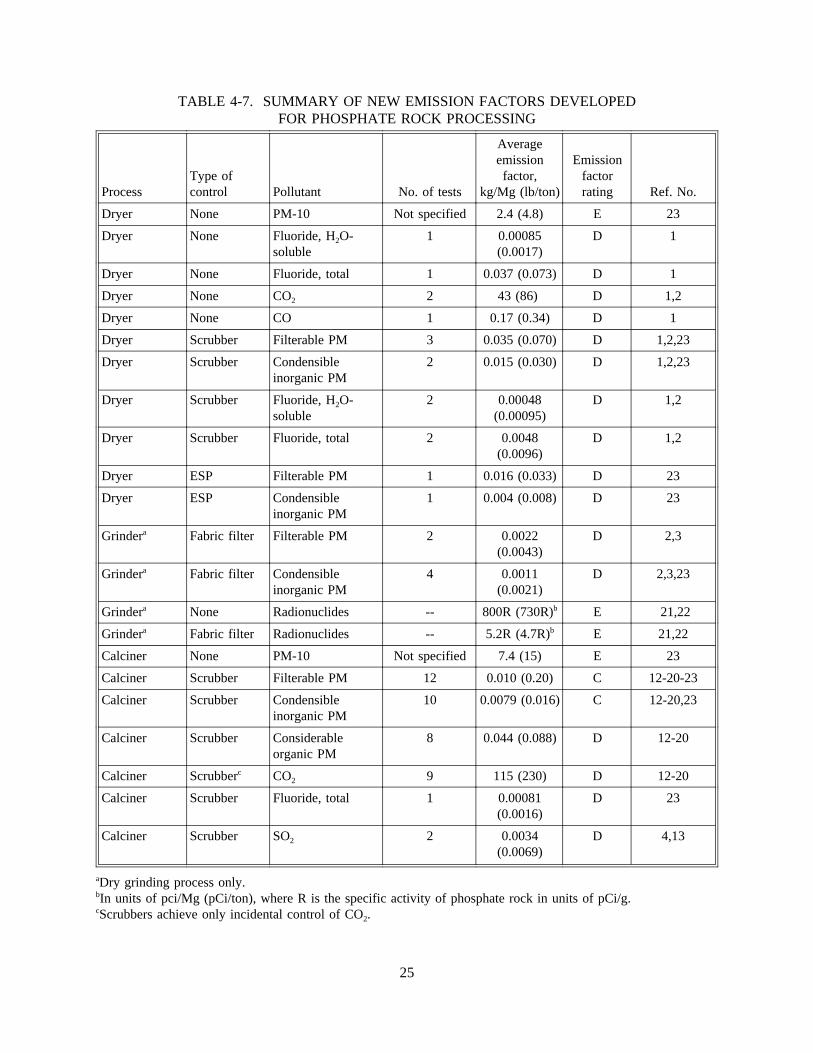
TABLE 4-7. SUMMARY OF NEW EMISSION FACTORS DEVELOPEDFOR PHOSPHATE ROCK PROCESSING
ProcessType ofcontrol Pollutant No. of tests
Averageemissionfactor,
kg/Mg (lb/ton)
Emissionfactorrating Ref. No.
Dryer None PM-10 Not specified 2.4 (4.8) E 23
Dryer None Fluoride, H2O-soluble
1 0.00085(0.0017)
D 1
Dryer None Fluoride, total 1 0.037 (0.073) D 1
Dryer None CO2 2 43 (86) D 1,2
Dryer None CO 1 0.17 (0.34) D 1
Dryer Scrubber Filterable PM 3 0.035 (0.070) D 1,2,23
Dryer Scrubber Condensibleinorganic PM
2 0.015 (0.030) D 1,2,23
Dryer Scrubber Fluoride, H2O-soluble
2 0.00048(0.00095)
D 1,2
Dryer Scrubber Fluoride, total 2 0.0048(0.0096)
D 1,2
Dryer ESP Filterable PM 1 0.016 (0.033) D 23
Dryer ESP Condensibleinorganic PM
1 0.004 (0.008) D 23
Grindera Fabric filter Filterable PM 2 0.0022(0.0043)
D 2,3
Grindera Fabric filter Condensibleinorganic PM
4 0.0011(0.0021)
D 2,3,23
Grindera None Radionuclides -- 800R (730R)b E 21,22
Grindera Fabric filter Radionuclides -- 5.2R (4.7R)b E 21,22
Calciner None PM-10 Not specified 7.4 (15) E 23
Calciner Scrubber Filterable PM 12 0.010 (0.20) C 12-20-23
Calciner Scrubber Condensibleinorganic PM
10 0.0079 (0.016) C 12-20,23
Calciner Scrubber Considerableorganic PM
8 0.044 (0.088) D 12-20
Calciner Scrubberc CO2 9 115 (230) D 12-20
Calciner Scrubber Fluoride, total 1 0.00081(0.0016)
D 23
Calciner Scrubber SO2 2 0.0034(0.0069)
D 4,13
aDry grinding process only.bIn units of pci/Mg (pCi/ton), where R is the specific activity of phosphate rock in units of pCi/g.cScrubbers achieve only incidental control of CO2.
25
5. Emission Test Report: Stauffer Chemical Company, Mt. Pleasant, Tennessee, EMBReport 72-MM-04, U. S. Environmental Protection Agency, Research Triangle Park, NC,June 1972.
6. Stack Test Report, J.R. Simplot Company, Don Plant, No. 2 Mill, Pocatello, Idaho, J.R. SimplotCompany, Pocatello, ID, May 1990.
7. Stack Test Report, J.R. Simplot Company, No. 300 Calciner, Pocatello, Idaho, J.R. SimplotCompany, Pocatello, ID, May 1990.
8. Emission Test Report: Stauffer Chemical Company, Tarpon Springs, Florida, EMBReport 72-MM-05, U. S. Environmental Protection Agency, Research Triangle Park, NC,June 1972.
9. Emission Test Report: Monsanto Chemical Company, Soda Springs, Idaho, EMB Report 72-MM-27, U. S. Environmental Protection Agency, Research Triangle Park, NC, June 1972.
10. Emission Test Report: Monsanto Elemental Phosphorus Plant, Soda Springs, Idaho, EMB Report88-EPP-01, U. S. Environmental Protection Agency, Research Triangle Park, NC, January 1989.
11. Emission Test Report: FMC, Pocatello, Idaho, EMB Report 88-EPP-02, U. S. EnvironmentalProtection Agency, Research Triangle Park, NC, January 1989.
12. Source Performance Test, Calciner Number 4, Texasgulf, Inc., Phosphate Operations, Aurora, NC,August 28, 1991, Texasgulf, Incorporated, Aurora, NC, September 25, 1991.
13. Source Performance Test, Calciner Number 6, Texasgulf, Inc., Phosphate Operations, Aurora, NC,August 5 and 6, 1992, Texasgulf, Incorporated, Aurora, NC, September 17, 1992.
14. Source Performance Test, Calciner Number 4, Texasgulf, Inc., Phosphate Operations, Aurora, NC,June 30, 1992, Texasgulf, Incorporated, Aurora, NC, July 16, 1992.
15. Source Performance Test, Calciner Number 1, Texasgulf, Inc., Phosphate Operations, Aurora, NC,June 10, 1992, Texasgulf, Incorporated, Aurora, NC, July 8, 1992.
16. Source Performance Test, Calciner Number 2, Texasgulf, Inc., Phosphate Operations, Aurora, NC,July 7, 1992, Texasgulf, Incorporated, Aurora, NC, July 16, 1992.
17. Source Performance Test, Calciner Number 5, Texasgulf, Inc., Phosphate Operations, Aurora, NC,June 16, 1992, Texasgulf, Incorporated, Aurora, NC, July 8, 1992.
18. Source Performance Test, Calciner Number 6, Texasgulf, Inc., Phosphate Operations, Aurora, NC,August 4 and 5, 1992, Texasgulf, Incorporated, Aurora, NC, September 21, 1992.
19. Source Performance Test, Calciner Number 3, Texasgulf, Inc., Phosphate Operations, Aurora, NC,August 27, 1992, Texasgulf, Incorporated, Aurora, NC, September 21, 1992.
20. Source Performance Test, Calciner Number 2, Texasgulf, Inc., Phosphate Operations, Aurora, NC,August 21 and 22, 1992, Texasgulf, Incorporated, Aurora, NC, September 20, 1992.
26
21. R. T. Stula et al., Control Technology Alternatives and Costs for Compliance--ElementalPhosphorus Plants, Final Report, EPA Contract No. 68-01-6429, Energy Systems Group, ScienceApplications, Incorporated, La Jolla, CA, December 1, 1983.
22. Background Information Document, Proposed Standards for Radionuclides, EPA 520/1-83-001,U. S. Environmental Protection Agency, Washington, D.C., March 1983.
23. Background Information: Proposed Standards for Phosphate Rock Plants (Draft), EPA 450/3-79-017, U. S. Environmental Protection Agency, Research Triangle Park, NC, September 1979.
27