Embed Size (px)
Citation preview
First published in August 1999
National Pollutant Inventory
Emission EstimationTechnique Manual
for
Cement Manufacturing
Cement Manufacturing i
EMISSION ESTIMATION TECHNIQUESFOR
CEMENT MANUFACTURING
TABLE OF CONTENTS
1.0 INTRODUCTION ................................................................................................... 12.0 PROCESS DESCRIPTION.................................................................................... 2
2.1 Types of Cement Produced............................................................................... 22.2 Portland Cement................................................................................................ 22.3 Production Processes ......................................................................................... 2
3.0 EMISSION SOURCES ........................................................................................... 43.1 Particulate Matter (PM10)................................................................................. 43.2 Oxides of Nitrogen (NOx) .................................................................................. 43.3 Sulfur Dioxide (SO2).......................................................................................... 43.4 Organics.............................................................................................................. 43.5 Metal Compounds.............................................................................................. 53.6 Emissions to Water............................................................................................ 53.7 Emissions to Land.............................................................................................. 5
4.0 EMISSION ESTIMATION TECHNIQUES ........................................................ 64.1 Sampling Data or Direct Measurement........................................................... 84.2 Emission Factors................................................................................................ 114.2.1 Emission Factors for PM10 for Cement Manufacturing ............................. 13
4.2.1.1. Materials Handling .............................................................................................. 144.2.1.2. Materials Storage ................................................................................................. 154.2.1.3. Equipment Traffic.................................................................................................. 164.2.1.4. Fuel Preparation & Drying................................................................................... 174.2.1.5. Cement Manufacturing including: Limestone/Raw Material Crushing, Kiln, Clinker Processing and Finished Cement Grinding ............................................. 17
4.3 Continuous Emission Monitoring System (CEMS) Data............................... 205.0 REFERENCES ........................................................................................................ 23
Cement Manufacturing ii
CEMENT MANUFACTURING
LIST OF FIGURES, TABLES AND EXAMPLES
Figure 1 - Process Flow Diagram ..................................................................................... 3
Table 1 - List of Variables and Symbols........................................................................... 72 - Stack Sample Test Results................................................................................. 93 - Emission Factors for SO2, NOx, and CO for Cement Manufacturing .......... 124 - Emission Factors for Cement Kilns – Inorganics ............................................ 135 - Emission Factors for Cement Kilns – Organics............................................... 146 - Emission Factors for Total Volatile Organic Compounds (Total VOCs) .147 - Emission Reduction Factors for Materials Handling and Storage................ 158 - Overall Control Efficiencies for Dust Suppression on Roads ........................ 179 - Emission Factors for PM10 for Cement Manufacturing ................................. 19
10 - Example CEMS Output for an Hypothetical Kiln Firing Waste Fuel Oil ... 21
Example 1 - Using Stack Sampling Data ........................................................................... 9 2 - Calculating Moisture Percentage ................................................................. 11 3 - Using Emission Factors ................................................................................. 12 4 - Stockpile Emissions........................................................................................ 16 5 - Calculating VKT ............................................................................................ 17 6 - Cement Manufacturing PM10 Generation ................................................... 18 7 - Using CEMS Data .......................................................................................... 22
Cement Manufacturing 1
1.0 Introduction The purpose of all Emission Estimation Technique (EET) manuals in this series is to assist Australian manufacturing, industrial, and service facilities to report emissions of listed substances to the National Pollutant Inventory (NPI). This Manual describes the procedures and recommended approaches for estimating emissions from facilities engaged in cement manufacturing activities. The Manual covers cement (excepting adhesive or refractory cement) manufacturing activities. EET MANUAL : Cement Manufacturing HANDBOOK : Cement & Lime Manufacturing ANZSIC CODE : 2631 (all codes within the 263 ANZSIC code group are required
to report to the NPI). This Manual was drafted by the NPI Unit of the Queensland Department of Environment and Heritage on behalf of the Commonwealth Government. It has been developed through a process of national consultation involving State and Territory environmental authorities and key stakeholders.
Cement Manufacturing 2
2.0 Process Description
Cement is a fine powder consisting predominantly of calcium silicates, aluminates,aluminoferrites and, to a lesser degree, gypsum and limestone. Around five different rawmaterial groups are used in the manufacture of cement in Australia. These materials arechemically combined through pyroprocessing and subjected to subsequent mechanicalprocessing operations.
2.1 Types of Cement ProducedCement manufacturers in Australia produce several types of cement, but Portland cement andblended cement are by far the most common. Portland cement consists primarily of a kiln-fired, fused material known as clinker, that is ground and combined with small amounts ofgypsum or a similar material. Portland cement is produced in several grades designed to lendcertain properties to concrete. The major ingredients of blended cement are Portland cement,flyash, and slag. Smaller amounts of specialty cements are also produced and includemasonry, oilwell, and off-white cements. Off-white cement, which is made from iron-freematerials of exceptional purity (usually limestone, china clay or kaolin, and silica), isprimarily used to manufacture decorative concrete. Masonry cement, produced by addinglimestone and/or other materials to Portland cement, is a hydraulic cement used as acomponent of mortar for masonry construction.
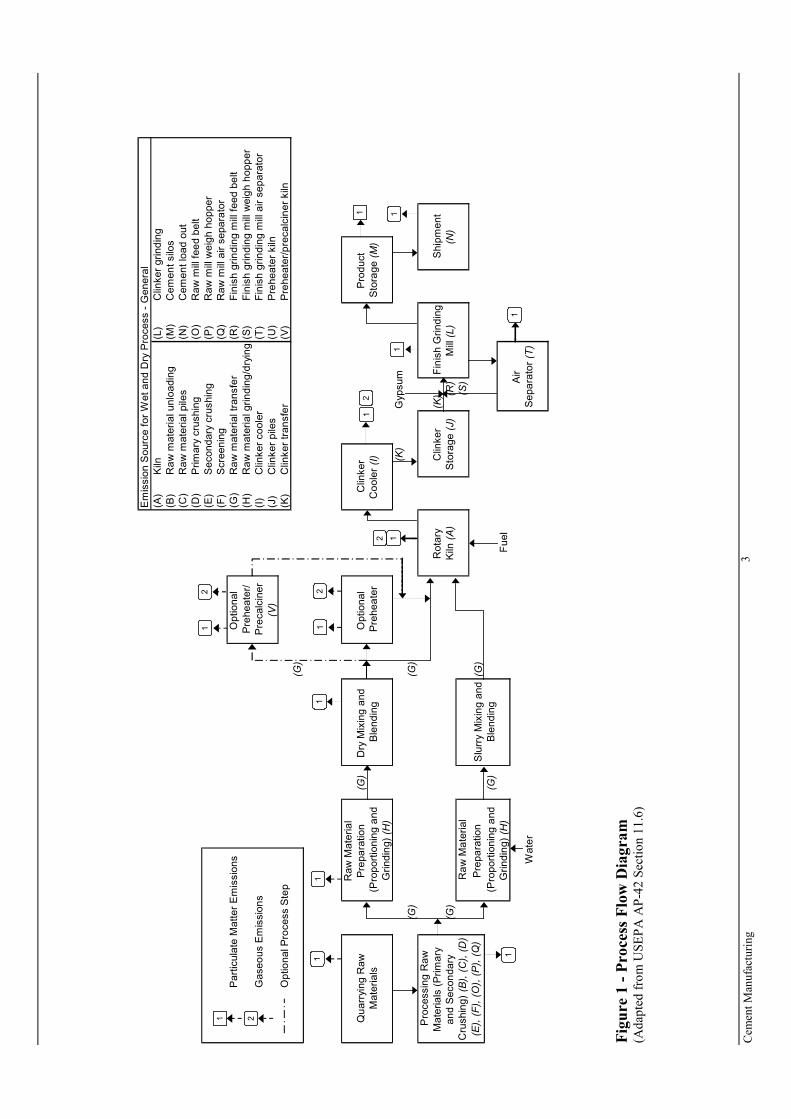
2.2 Portland CementPortland cement, one of the principal components of blended cement and concrete, isgenerally made from calcareous materials (eg. limestone) and argillaceous materials (eg. claysor shales) together with smaller quantities of iron-bearing materials and sand. To makePortland cement, the raw materials are ground, mixed, heated, and fused in a rotary kiln,cooled, and finally reduced to a fine powder. Figure 1 illustrates the typical cementproduction process and shows possible emission points throughout the plant.
2.3 Production ProcessesCement is manufactured in Australia in four kiln types: wet kilns, grate preheater kilns,preheater kilns, and precalciner kilns. Similar raw materials are used in all kiln types.However, the moisture content and processing techniques differ, as do the kiln designs. Fuelsused for firing the kilns include oil, pulverised coal, natural gas, and supplementary wastefuels such as used tyres, spent solvents, and waste fuel oils. In the wet kiln process the rawmaterials are ground with water which is subsequently evaporated. As a result, this process ismore energy-intensive than dry processes. Preheater and precalciner kiln processes use drygrinding technology utilising kiln exhaust gases for drying. All kilns are equipped with grateor planetary type coolers which cool the fused clinker and recuperate energy for firing thekilns or drying raw materials. Over 70% of Australian Portland cement clinker is produced inmodern precalciner or preheater kilns. The most common method of cooling the clinker is areciprocating grate, which is cooled by ambient air. The cooled clinker is transferred tostorage. Clinker, together with four-to-six percent gypsum, is then ground to produce ahomogeneous cement powder, which is generally sent to a bulk storage and then transportedby truck, ship, or rail.
Cem
ent M
anuf
actu
ring
3
Em
issi
on S
ourc
e fo
r Wet
and
Dry
Pro
cess
- G
ener
al(A
) K
iln(L
)C
linke
r grin
ding
(B)
Raw
mat
eria
l unl
oadi
ng(M
)C
emen
t silo
s(C
) R
aw m
ater
ial p
iles
(N)
Cem
ent l
oad
out
(D)
Prim
ary
crus
hing
(O)
Raw
mill
feed
bel
t(E
) S
econ
dary
cru
shin
g(P
)R
aw m
ill w
eigh
hop
per
(F)
Scr
eeni
ng(Q
)R
aw m
ill ai
r sep
arat
orPa
rticu
late
Mat
ter E
mis
sion
sO
ptio
nal
(G)
Raw
mat
eria
l tra
nsfe
r(R
)Fi
nish
grin
ding
mill
feed
bel
tPr
ehea
ter/
(H)
Raw
mat
eria
l grin
ding
/dry
ing
(S)
Fini
sh g
rindi
ng m
ill w
eigh
hop
per
Gas
eous
Em
issi
ons
Prec
alci
ner
(I)C
linke
r coo
ler
(T)
Fini
sh g
rindi
ng m
ill ai
r sep
arat
or(V
)(J
)C
linke
r pile
s(U
)Pr
ehea
ter k
ilnO
ptio
nal P
roce
ss S
tep
(K)
Clin
ker t
rans
fer
(V)
Preh
eate
r/pre
calc
iner
kiln
(G)
Raw
Mat
eria
l Q
uarr
ying
Raw
Prep
arat
ion
(G)
Dry
Mix
ing
and
Opt
iona
l C
linke
rPr
oduc
t M
ater
ials
(Pro
porti
onin
g an
dBl
endi
ngPr
ehea
ter
Coo
ler (
I)St
orag
e(M
)G
rindi
ng) (
H)
(K)
Gyp
sum
(G)
(G)
Pro
cess
ing
Raw
Mat
eria
ls (P
rimar
y R
otar
y C
linke
r (K
)Fi
nish
Grin
ding
Ship
men
tan
d Se
cond
ary
(G)
Kiln
(A)
Stor
age
(J)
(R)
Mill
(L)
(N)
Cru
shin
g) (B
), (C
), (D
)R
aw M
ater
ial
(S)
(E),
(F),
(O),
(P),
(Q)
Prep
arat
ion
Slu
rry
Mix
ing
and
(G)
(Pro
porti
onin
g an
d(G
)Bl
endi
ngG
rindi
ng) (
H)
Fuel
Air
Wat
erSe
para
tor (
T)
1 2
1 1
11
12
12
1
1
1 112
12
Figu
re 1
- Pr
oces
s Flo
w D
iagr
am(A
dapt
ed fr
om U
SEPA
AP-
42 S
ectio
n 11
.6)
Cement Manufacturing 4
3.0 Emission SourcesEmissions from cement manufacturing plants include combustion gases; wastewater; plantmaintenance waste; and research and laboratory wastes. Particulate from kiln stacks is thelargest emission stream from cement plants. It is commonly collected in baghouses orprecipitators and is returned to the process.
Particulate matter (particles with an equivalent aerodynamic diameter of10 micrometres or less ie. ≤10µm), oxides of nitrogen, sulfur dioxide, and carbon monoxideare the most likely listed substances emitted during the production of cement. Trace quantitiesof volatile organic compounds (including benzene and phenol), ammonia, chlorine, somelisted metals, and hydrochloric acid may also be emitted.
3.1 Particulate Matter (PM10)Sources of PM10 emissions at cement plants include:
• quarrying and crushing;• raw material storage;• grinding and blending (in the dry process only);• clinker production;• finish grinding; and• packaging and loading.
The largest single source of PM10 within cement plants is the pyroprocessing system thatincludes the kiln and raw material grinding exhaust stacks. Additional sources of PM10 areraw material storage piles, conveyors, storage silos, and unloading facilities.
The major constituents of PM10 as cement kiln dust are alumina, silica, calcium carbonate, andclay (the primary constituents of cement itself).
3.2 Oxides of Nitrogen (NOx)
NOx are generated during fuel combustion by oxidation of chemically bound nitrogen in thefuel and by thermal fixation of nitrogen in the combustion air. As flame temperatureincreases the amount of thermally generated NOx increases. The amount of NOx generatedfrom fuel increases with the quantity of nitrogen in the fuel. In the cement manufacturingprocess, NOx is generated in both the burning zone of the kiln and the burning zone of theprecalcining vessel. Fuel use affects the quantity and type of NOx generated. For example, inthe kiln, natural gas combustion with a high flame temperature and low fuel nitrogen maygenerate a larger quantity of NOx than does oil or coal, which have higher fuel nitrogen butwhich burn with lower flame temperatures.
3.3 Sulfur Dioxide (SO2)
SO2 emissions may be generated both from the sulfur compounds in the raw materials andfrom the sulfur content of the fuel. The sulfur content of both raw materials and fuels varies,and depends on the facility and the location in Australia. However, the alkaline nature of thecement provides for direct absorption of SO2 into the product, thereby mitigating the quantityof SO2 emissions in the exhaust stream. Depending on the process and the source of thesulfur, SO2 absorption ranges from about 70 to more than 95 percent.
3.4 Organics
Cement plants may emit a wide range of organic compounds in trace quantities. The range of
Cement Manufacturing 5
organic compounds emitted depends on the nature of raw materials and fuels used and thecombustion efficiency of the process, and may include polycyclic aromatic hydrocarbons(PAHs) and polychlorinated dioxins and furans.
3.5 Metal Compounds
Emissions of metal compounds from cement kilns can be grouped into three general classes:volatile metals, eg mercury; semi-volatile metals, including antimony, cadmium, lead,selenium, and zinc; and refractory or non-volatile metals, including chromium, arsenic, nickel,manganese, and copper. Although partitioning of these metal groups is affected by kilnoperating procedures, the refractory metals tend to concentrate in the clinker, while volatilemetals tend to be emitted through the primary exhaust stack, and semi-volatiles are partitionedbetween clinker and the primary exhaust.
3.6 Emissions to Water
The cement manufacturing process also generates wastewater from the cooling of processequipment. The pollutants contained in cooling waters are principally dissolved solids(potassium and sodium hydroxide, chlorides, and sulfates) and suspended solids. The maincontrol and treatment methods for wastewater involve recycling and reusing wastewaterthrough cooling towers or ponds, settling ponds, containment ponds, and clarifiers.Wastewaters may not always contain NPI-listed substances.
If no wastewater monitoring data exists, emissions to process water can be calculated using amass balance calculation, or emission factors. The discharge of listed substances to a sewer ortailings dam does not require you to report to the NPI. However, leakage and other emissions(including dust) from a tailings storage facility are reportable. (See also Section Three of TheNPI Guide.)
3.7 Emissions to Land Emissions of substances to land on-site include solid wastes, slurries, sediments, spills andleaks, storage and distribution of liquids and may contain listed substances. These emissionsources can be broadly categorised as: • surface impoundment of liquids and slurries; and• unintentional leaks and spills.

Cement Manufacturing 6
4.0 Emission Estimation Techniques
Estimates of emissions of NPI-listed substances to air, water and land should be reported foreach substance that triggers a threshold. The reporting list and detailed information onthresholds are contained in The NPI Guide at the front of this Handbook.
In general, there are four types of emission estimation techniques (EETs) that may be used toestimate emissions from your facility. The four types described in the NPI Guide are:
• sampling or direct measurement;• mass balance;• fuel analysis or other engineering calculations; and• emission factors.
Select the EET (or mix of EETs) that is most appropriate for your purposes. For example,you might choose to use a mass balance to best estimate fugitive losses from pumps andvents, direct measurement for stack and pipe emissions, and emission factors when estimatinglosses from storage tanks and stockpiles.
If you estimate your emission by using any of these EETs, your data will be displayed on theNPI database as being of ‘acceptable reliability’. Similarly, if your relevant environmentalauthority has approved the use of emission estimation techniques that are not outlined in thisHandbook, your data will also be displayed as being of ‘acceptable reliability’.
This Manual seeks to provide the most effective emission estimation techniques for the NPIsubstances relevant to this industry. However, the absence of an EET for a substance in thisManual does not necessarily imply that an emission should not be reported to the NPI. Theobligation to report on all relevant emissions remains if reporting thresholds have beenexceeded.
You are able to use emission estimation techniques that are not outlined in thisdocument. You must, however, seek the consent of your relevant environmentalauthority. For example, if your company has developed site-specific emission factors,you may use these if approved by your relevant environmental authority.
In general, direct measurement is the most accurate method for characterising emissions and,where available, such data should be used in preference to other EETs presented in thisManual. However, additional direct measurement is not required under the NPI Measure.Direct monitoring may be undertaken as an element of other EETs.
You should note that the EETs presented in this Manual relate principally to average processemissions. Emissions resulting from non-routine events are rarely discussed in the literature,and there is a general lack of EETs for such events. However, it is important to recognise thatemissions resulting from significant operating excursions and/or accidental situations (eg.spills) will also need to be estimated. Emissions to land, air and water from spills must beestimated and added to process emissions when calculating total emissions for reportingpurposes. The emission resulting from a spill is the net emission, ie. the quantity of the NPIreportable substance spilled, less the quantity recovered or consumed during clean upoperations.
Cement Manufacturing 7
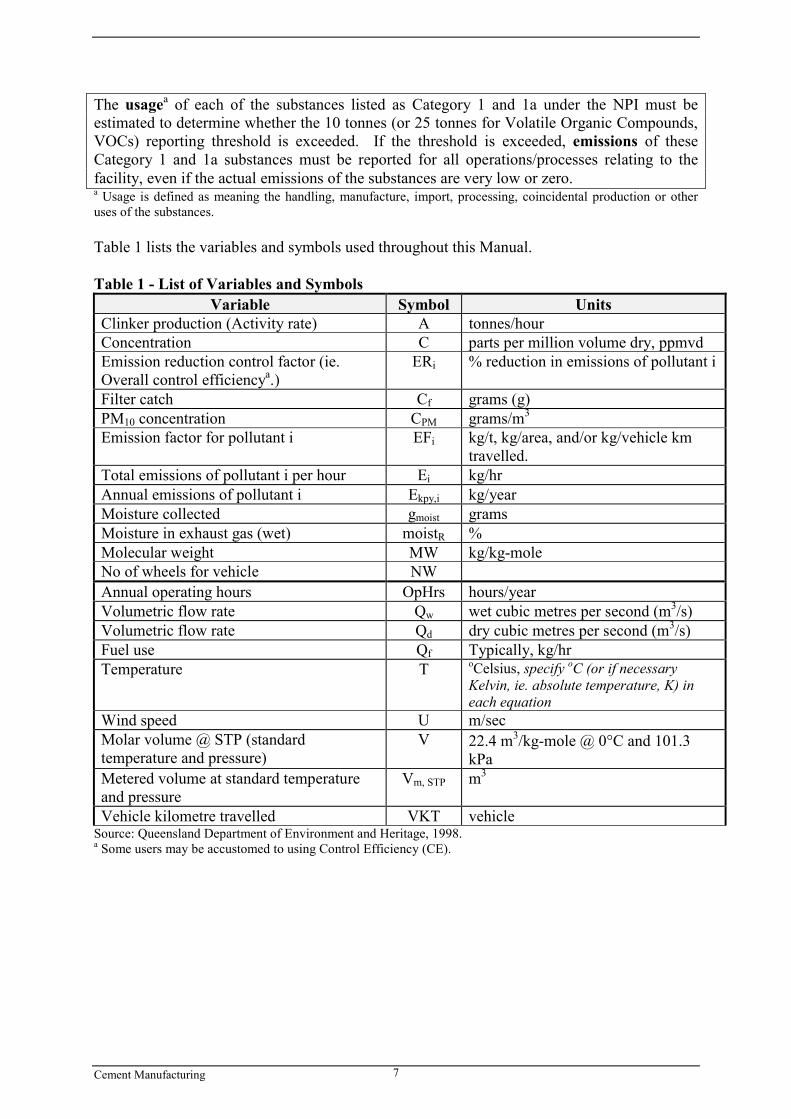
The usagea of each of the substances listed as Category 1 and 1a under the NPI must beestimated to determine whether the 10 tonnes (or 25 tonnes for Volatile Organic Compounds,VOCs) reporting threshold is exceeded. If the threshold is exceeded, emissions of theseCategory 1 and 1a substances must be reported for all operations/processes relating to thefacility, even if the actual emissions of the substances are very low or zero.a Usage is defined as meaning the handling, manufacture, import, processing, coincidental production or otheruses of the substances.
Table 1 lists the variables and symbols used throughout this Manual.
Table 1 - List of Variables and SymbolsVariable Symbol Units
Clinker production (Activity rate) A tonnes/hourConcentration C parts per million volume dry, ppmvdEmission reduction control factor (ie.Overall control efficiencya.)
ERi % reduction in emissions of pollutant i
Filter catch Cf grams (g)PM10 concentration CPM grams/m3
Emission factor for pollutant i EFi kg/t, kg/area, and/or kg/vehicle kmtravelled.
Total emissions of pollutant i per hour Ei kg/hrAnnual emissions of pollutant i Ekpy,i kg/yearMoisture collected gmoist gramsMoisture in exhaust gas (wet) moistR %Molecular weight MW kg/kg-moleNo of wheels for vehicle NWAnnual operating hours OpHrs hours/yearVolumetric flow rate Qw wet cubic metres per second (m3/s)Volumetric flow rate Qd dry cubic metres per second (m3/s)Fuel use Qf Typically, kg/hrTemperature T oCelsius, specify oC (or if necessary
Kelvin, ie. absolute temperature, K) ineach equation
Wind speed U m/secMolar volume @ STP (standardtemperature and pressure)
V 22.4 m3/kg-mole @ 0°C and 101.3kPa
Metered volume at standard temperatureand pressure
Vm, STP m3
Vehicle kilometre travelled VKT vehicleSource: Queensland Department of Environment and Heritage, 1998.a Some users may be accustomed to using Control Efficiency (CE).
Cement Manufacturing 8
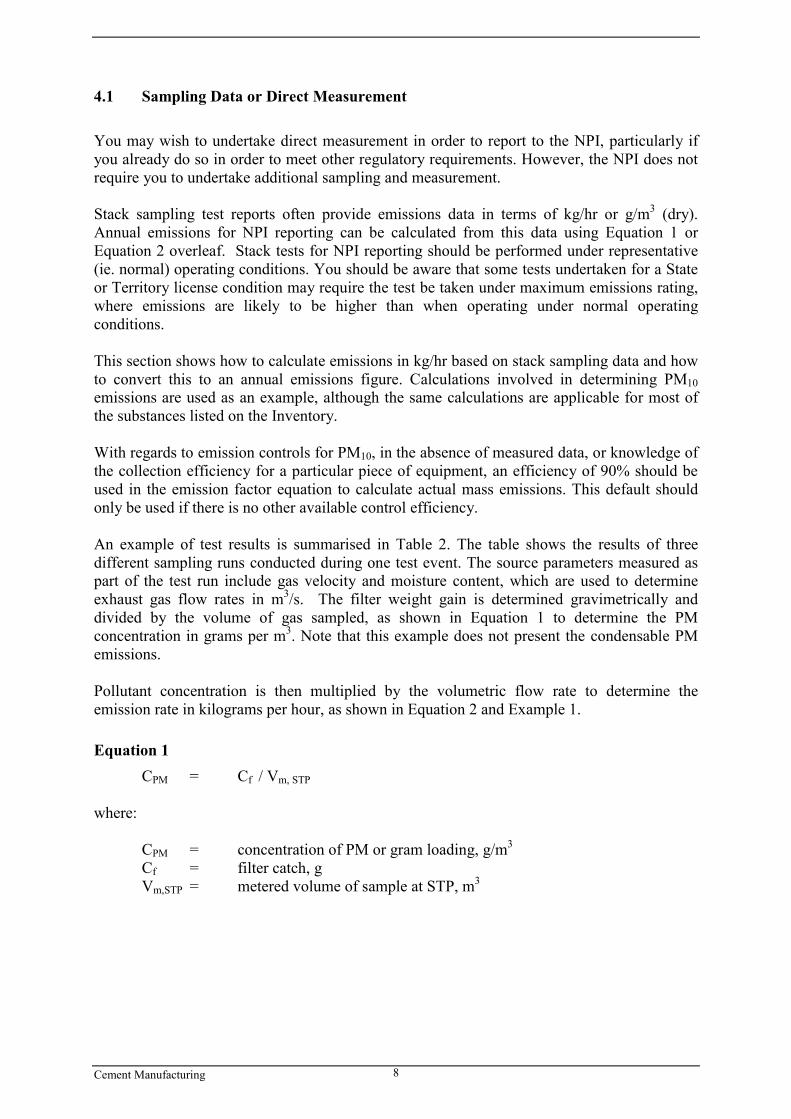
4.1 Sampling Data or Direct Measurement
You may wish to undertake direct measurement in order to report to the NPI, particularly ifyou already do so in order to meet other regulatory requirements. However, the NPI does notrequire you to undertake additional sampling and measurement.
Stack sampling test reports often provide emissions data in terms of kg/hr or g/m3 (dry).Annual emissions for NPI reporting can be calculated from this data using Equation 1 orEquation 2 overleaf. Stack tests for NPI reporting should be performed under representative(ie. normal) operating conditions. You should be aware that some tests undertaken for a Stateor Territory license condition may require the test be taken under maximum emissions rating,where emissions are likely to be higher than when operating under normal operatingconditions.
This section shows how to calculate emissions in kg/hr based on stack sampling data and howto convert this to an annual emissions figure. Calculations involved in determining PM10emissions are used as an example, although the same calculations are applicable for most ofthe substances listed on the Inventory.
With regards to emission controls for PM10, in the absence of measured data, or knowledge ofthe collection efficiency for a particular piece of equipment, an efficiency of 90% should beused in the emission factor equation to calculate actual mass emissions. This default shouldonly be used if there is no other available control efficiency.
An example of test results is summarised in Table 2. The table shows the results of threedifferent sampling runs conducted during one test event. The source parameters measured aspart of the test run include gas velocity and moisture content, which are used to determineexhaust gas flow rates in m3/s. The filter weight gain is determined gravimetrically anddivided by the volume of gas sampled, as shown in Equation 1 to determine the PMconcentration in grams per m3. Note that this example does not present the condensable PMemissions.
Pollutant concentration is then multiplied by the volumetric flow rate to determine theemission rate in kilograms per hour, as shown in Equation 2 and Example 1.
Equation 1CPM = Cf / Vm, STP
where:
CPM = concentration of PM or gram loading, g/m3
Cf = filter catch, gVm,STP = metered volume of sample at STP, m3
Cement Manufacturing 9
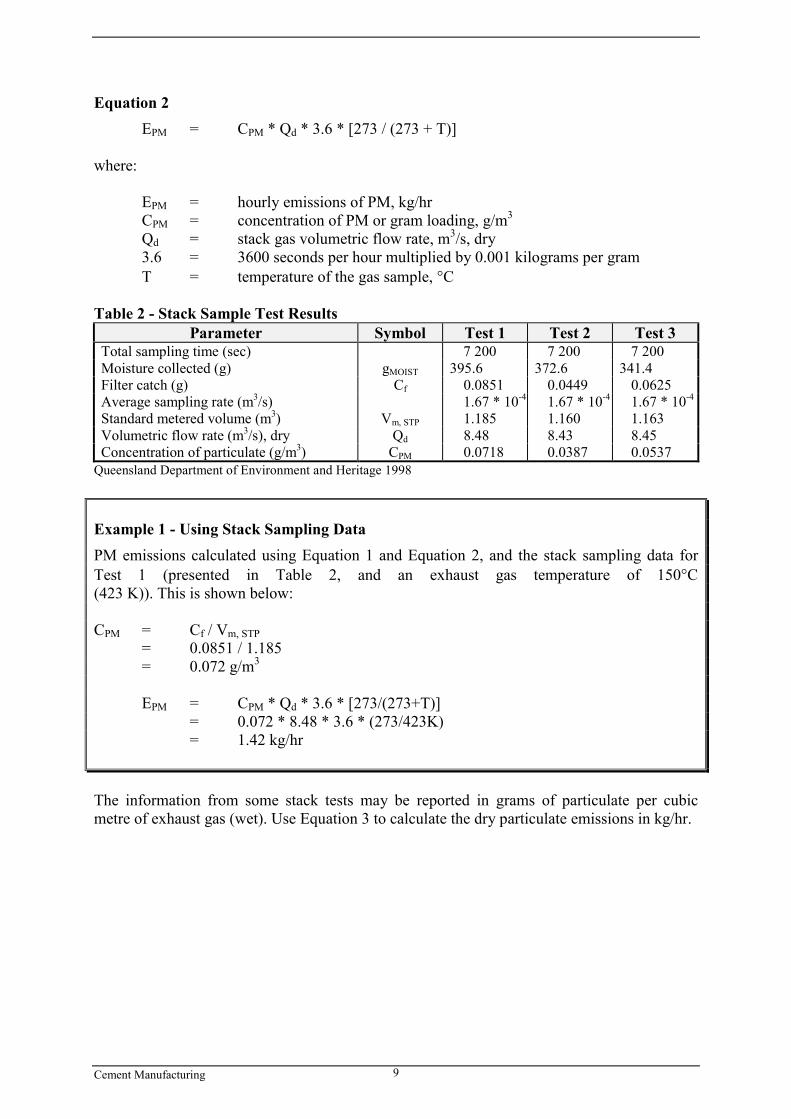
Equation 2EPM = CPM * Qd * 3.6 * [273 / (273 + T)]
where:
EPM = hourly emissions of PM, kg/hrCPM = concentration of PM or gram loading, g/m3
Qd = stack gas volumetric flow rate, m3/s, dry3.6 = 3600 seconds per hour multiplied by 0.001 kilograms per gramT = temperature of the gas sample, °C
Table 2 - Stack Sample Test ResultsParameter Symbol Test 1 Test 2 Test 3
Total sampling time (sec) 7 200 7 200 7 200Moisture collected (g) gMOIST 395.6 372.6 341.4Filter catch (g) Cf 0.0851 0.0449 0.0625Average sampling rate (m3/s) 1.67 * 10-4 1.67 * 10-4 1.67 * 10-4
Standard metered volume (m3) Vm, STP 1.185 1.160 1.163Volumetric flow rate (m3/s), dry Qd 8.48 8.43 8.45Concentration of particulate (g/m3) CPM 0.0718 0.0387 0.0537
Queensland Department of Environment and Heritage 1998
Example 1 - Using Stack Sampling DataPM emissions calculated using Equation 1 and Equation 2, and the stack sampling data forTest 1 (presented in Table 2, and an exhaust gas temperature of 150°C(423 K)). This is shown below:
CPM = Cf / Vm, STP= 0.0851 / 1.185= 0.072 g/m3
EPM = CPM * Qd * 3.6 * [273/(273+T)]= 0.072 * 8.48 * 3.6 * (273/423K)= 1.42 kg/hr
The information from some stack tests may be reported in grams of particulate per cubicmetre of exhaust gas (wet). Use Equation 3 to calculate the dry particulate emissions in kg/hr.
Cement Manufacturing 10
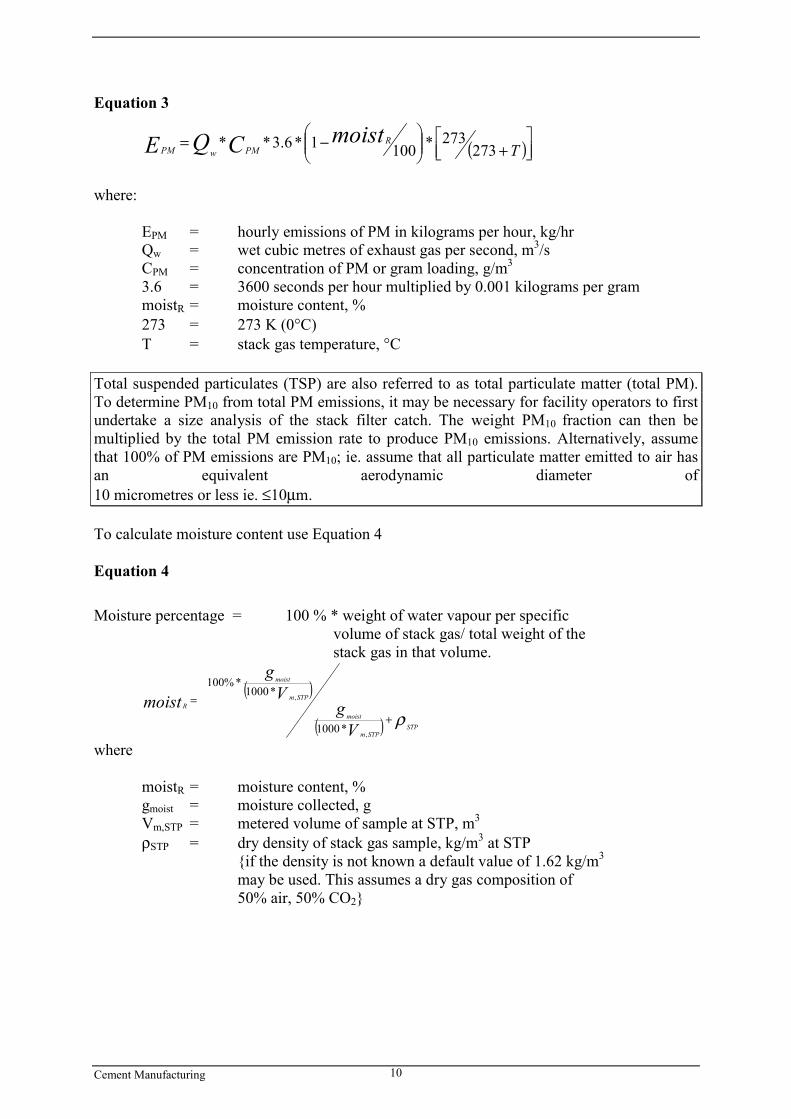
Equation 3
( )���
���
+���
�
� −= TmoistCQE R
PMwPM 273273*1001*6.3**
where:
EPM = hourly emissions of PM in kilograms per hour, kg/hrQw = wet cubic metres of exhaust gas per second, m3/sCPM = concentration of PM or gram loading, g/m3
3.6 = 3600 seconds per hour multiplied by 0.001 kilograms per grammoistR = moisture content, %273 = 273 K (0°C)T = stack gas temperature, °C
Total suspended particulates (TSP) are also referred to as total particulate matter (total PM).To determine PM10 from total PM emissions, it may be necessary for facility operators to firstundertake a size analysis of the stack filter catch. The weight PM10 fraction can then bemultiplied by the total PM emission rate to produce PM10 emissions. Alternatively, assumethat 100% of PM emissions are PM10; ie. assume that all particulate matter emitted to air hasan equivalent aerodynamic diameter of10 micrometres or less ie. ≤10µm.
To calculate moisture content use Equation 4
Equation 4
Moisture percentage = 100 % * weight of water vapour per specificvolume of stack gas/ total weight of thestack gas in that volume.
( )
( ) ρ STPSTPm
moist
STPm
moist
R
Vg
Vg
moist+
=
,
,
*1000
*1000*%100
where
moistR = moisture content, %gmoist = moisture collected, gVm,STP = metered volume of sample at STP, m3
ρSTP = dry density of stack gas sample, kg/m3 at STP{if the density is not known a default value of 1.62 kg/m3
may be used. This assumes a dry gas composition of50% air, 50% CO2}
Cement Manufacturing 11
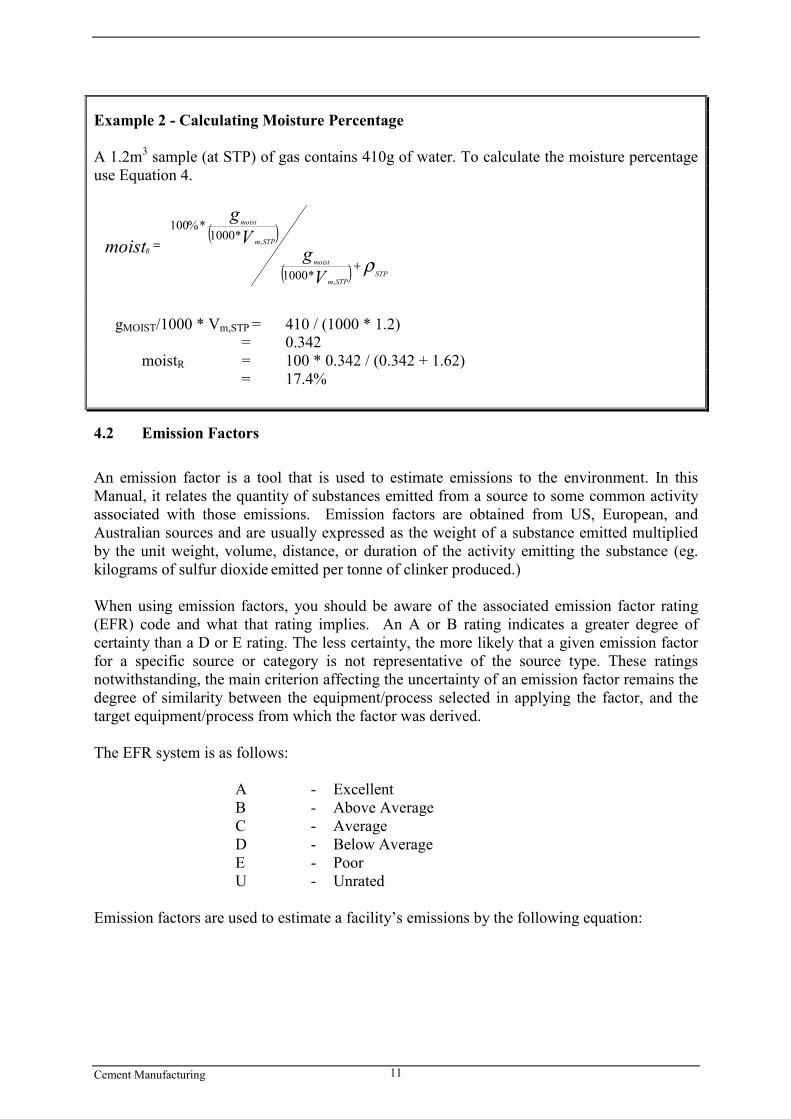
Example 2 - Calculating Moisture Percentage
A 1.2m3 sample (at STP) of gas contains 410g of water. To calculate the moisture percentageuse Equation 4.
( )
( ) ρ STPSTPm
moist
STPm
moist
R
Vg
Vg
moist+
=
,
,
*1000
*1000*%100
gMOIST/1000 * Vm,STP = 410 / (1000 * 1.2) = 0.342
moistR = 100 * 0.342 / (0.342 + 1.62) = 17.4%
4.2 Emission Factors
An emission factor is a tool that is used to estimate emissions to the environment. In thisManual, it relates the quantity of substances emitted from a source to some common activityassociated with those emissions. Emission factors are obtained from US, European, andAustralian sources and are usually expressed as the weight of a substance emitted multipliedby the unit weight, volume, distance, or duration of the activity emitting the substance (eg.kilograms of sulfur dioxide emitted per tonne of clinker produced.)
When using emission factors, you should be aware of the associated emission factor rating(EFR) code and what that rating implies. An A or B rating indicates a greater degree ofcertainty than a D or E rating. The less certainty, the more likely that a given emission factorfor a specific source or category is not representative of the source type. These ratingsnotwithstanding, the main criterion affecting the uncertainty of an emission factor remains thedegree of similarity between the equipment/process selected in applying the factor, and thetarget equipment/process from which the factor was derived.
The EFR system is as follows:
A - ExcellentB - Above AverageC - AverageD - Below AverageE - PoorU - Unrated
Emission factors are used to estimate a facility’s emissions by the following equation:
Cement Manufacturing 12
Equation 5Ekpy,i = [A * OpHrs] * EFi
where :
Ekpy,i = emission rate of pollutant i, kg/yrA = activity rate, t/hrOpHrs = operating hours, hr/yrEFi = uncontrolled emission factor of pollutant i, kg/t
Emission factors developed from measurements for a specific kiln or process may sometimesbe used to estimate emissions at other sites. For example, a company may have several unitsof similar model and size; if emissions were measured from one kiln or belt, an emissionfactor could be developed and applied to similar units. You are required to have the emissionfactor reviewed and approved by State or Territory environment agencies prior to its use forNPI estimations. Table 3 to Table 9 present emission factors for cement manufacturingprocesses.
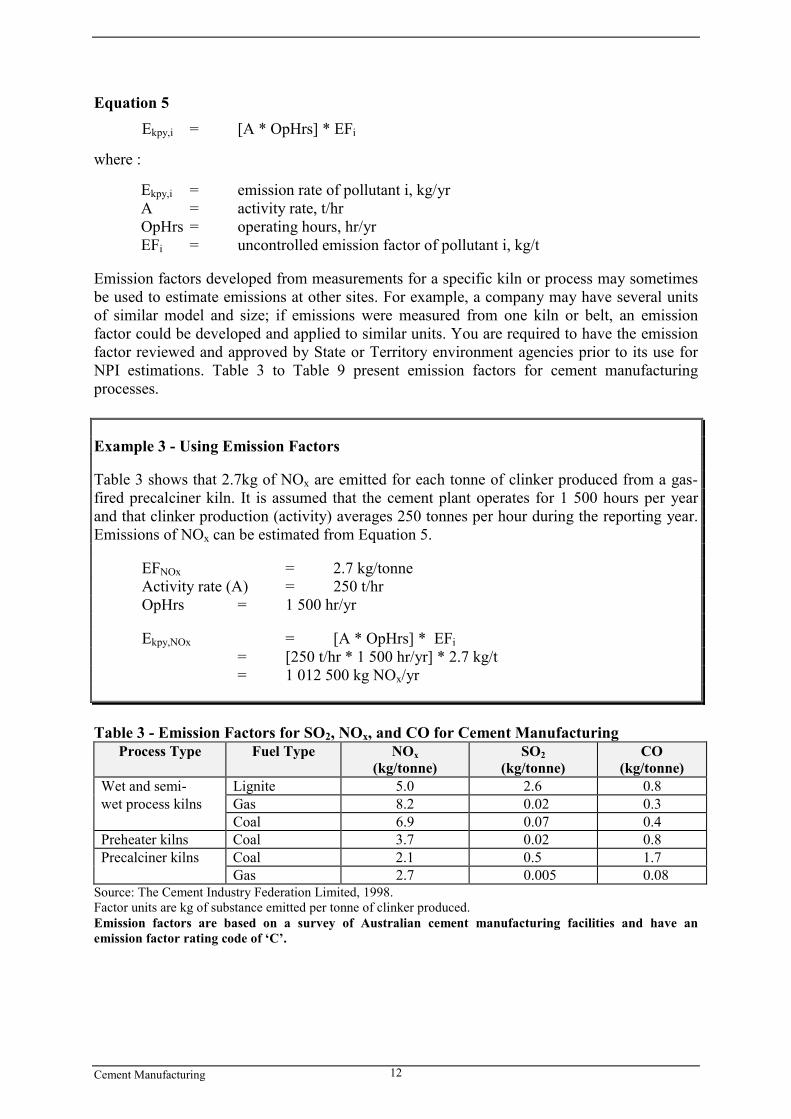
Example 3 - Using Emission Factors
Table 3 shows that 2.7kg of NOx are emitted for each tonne of clinker produced from a gas-fired precalciner kiln. It is assumed that the cement plant operates for 1 500 hours per yearand that clinker production (activity) averages 250 tonnes per hour during the reporting year.Emissions of NOx can be estimated from Equation 5.
EFNOx = 2.7 kg/tonneActivity rate (A) = 250 t/hrOpHrs = 1 500 hr/yr
Ekpy,NOx = [A * OpHrs] * EFi= [250 t/hr * 1 500 hr/yr] * 2.7 kg/t= 1 012 500 kg NOx/yr
Table 3 - Emission Factors for SO2, NOx, and CO for Cement ManufacturingProcess Type Fuel Type NOx
(kg/tonne)SO2
(kg/tonne)CO
(kg/tonne)Wet and semi- Lignite 5.0 2.6 0.8wet process kilns Gas 8.2 0.02 0.3
Coal 6.9 0.07 0.4Preheater kilns Coal 3.7 0.02 0.8Precalciner kilns Coal 2.1 0.5 1.7
Gas 2.7 0.005 0.08Source: The Cement Industry Federation Limited, 1998.Factor units are kg of substance emitted per tonne of clinker produced.Emission factors are based on a survey of Australian cement manufacturing facilities and have anemission factor rating code of ‘C’.
Cement Manufacturing 13
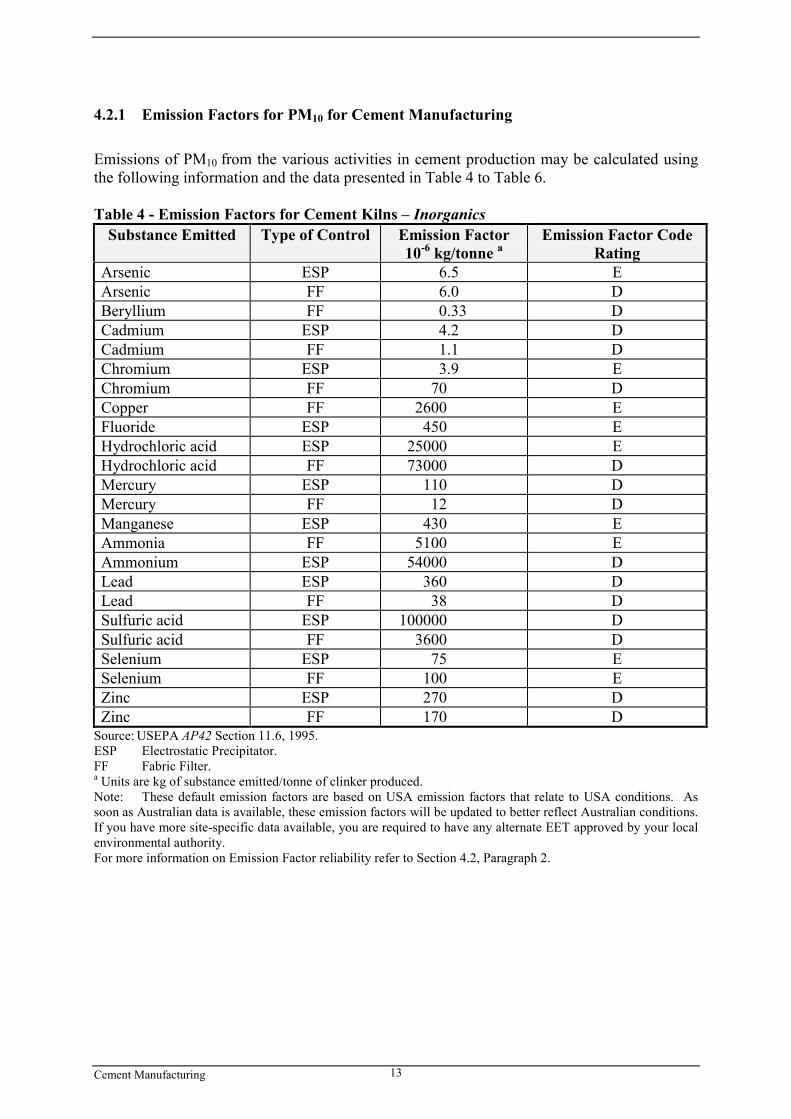
4.2.1 Emission Factors for PM10 for Cement Manufacturing
Emissions of PM10 from the various activities in cement production may be calculated usingthe following information and the data presented in Table 4 to Table 6.
Table 4 - Emission Factors for Cement Kilns – InorganicsSubstance Emitted Type of Control Emission Factor
10-6 kg/tonne aEmission Factor Code
RatingArsenic ESP 6.5 EArsenic FF 6.0 DBeryllium FF 0.33 DCadmium ESP 4.2 DCadmium FF 1.1 DChromium ESP 3.9 EChromium FF 70 DCopper FF 2600 EFluoride ESP 450 EHydrochloric acid ESP 25000 EHydrochloric acid FF 73000 DMercury ESP 110 DMercury FF 12 DManganese ESP 430 EAmmonia FF 5100 EAmmonium ESP 54000 DLead ESP 360 DLead FF 38 DSulfuric acid ESP 100000 DSulfuric acid FF 3600 DSelenium ESP 75 ESelenium FF 100 EZinc ESP 270 DZinc FF 170 D
Source: USEPA AP42 Section 11.6, 1995.ESP Electrostatic Precipitator.FF Fabric Filter.a Units are kg of substance emitted/tonne of clinker produced.Note: These default emission factors are based on USA emission factors that relate to USA conditions. Assoon as Australian data is available, these emission factors will be updated to better reflect Australian conditions.If you have more site-specific data available, you are required to have any alternate EET approved by your localenvironmental authority.For more information on Emission Factor reliability refer to Section 4.2, Paragraph 2.
Cement Manufacturing 14
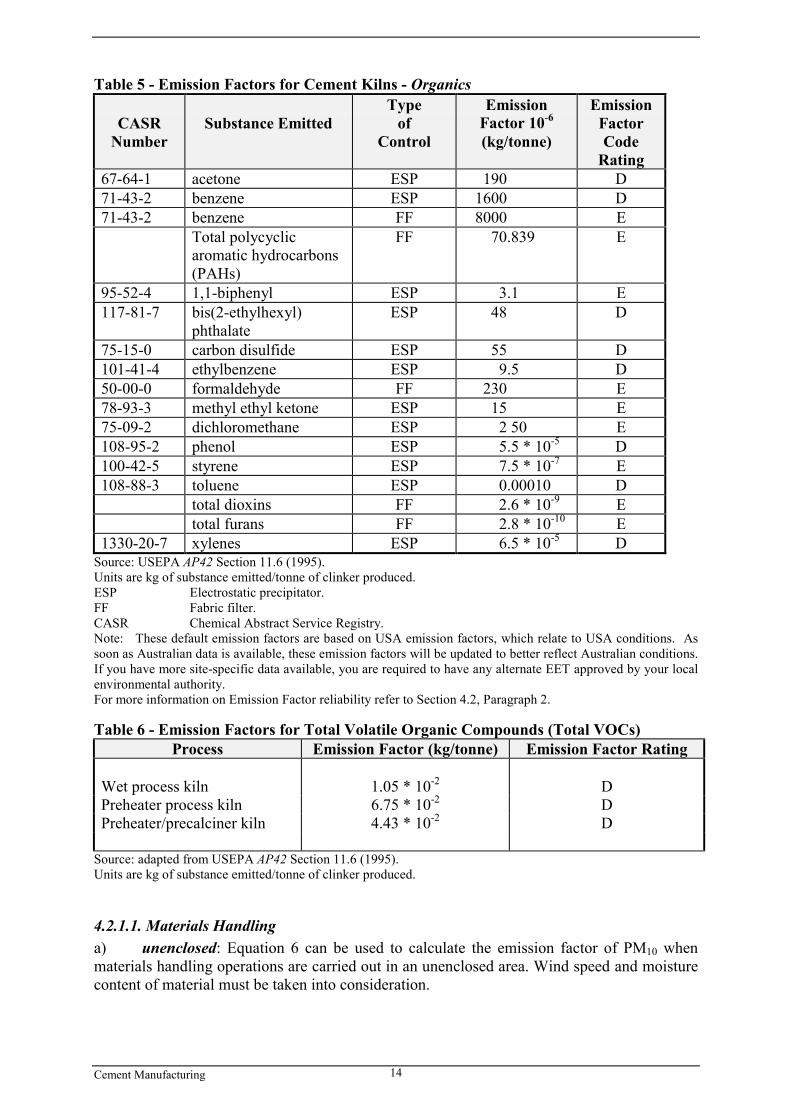
Table 5 - Emission Factors for Cement Kilns - Organics
CASRNumber
Substance EmittedType
ofControl
EmissionFactor 10-6
(kg/tonne)
EmissionFactorCode
Rating67-64-1 acetone ESP 190 D71-43-2 benzene ESP 1600 D71-43-2 benzene FF 8000 E
Total polycyclicaromatic hydrocarbons(PAHs)
FF 70.839 E
95-52-4 1,1-biphenyl ESP 3.1 E117-81-7 bis(2-ethylhexyl)
phthalateESP 48 D
75-15-0 carbon disulfide ESP 55 D101-41-4 ethylbenzene ESP 9.5 D50-00-0 formaldehyde FF 230 E78-93-3 methyl ethyl ketone ESP 15 E75-09-2 dichloromethane ESP 2 50 E108-95-2 phenol ESP 5.5 * 10-5 D100-42-5 styrene ESP 7.5 * 10-7 E108-88-3 toluene ESP 0.00010 D
total dioxins FF 2.6 * 10-9 Etotal furans FF 2.8 * 10-10 E
1330-20-7 xylenes ESP 6.5 * 10-5 DSource: USEPA AP42 Section 11.6 (1995).Units are kg of substance emitted/tonne of clinker produced.ESP Electrostatic precipitator.FF Fabric filter.CASR Chemical Abstract Service Registry.Note: These default emission factors are based on USA emission factors, which relate to USA conditions. Assoon as Australian data is available, these emission factors will be updated to better reflect Australian conditions.If you have more site-specific data available, you are required to have any alternate EET approved by your localenvironmental authority.For more information on Emission Factor reliability refer to Section 4.2, Paragraph 2.
Table 6 - Emission Factors for Total Volatile Organic Compounds (Total VOCs)Process Emission Factor (kg/tonne) Emission Factor Rating
Wet process kiln 1.05 * 10-2 DPreheater process kiln 6.75 * 10-2 DPreheater/precalciner kiln 4.43 * 10-2 D
Source: adapted from USEPA AP42 Section 11.6 (1995).Units are kg of substance emitted/tonne of clinker produced.
4.2.1.1. Materials Handlinga) unenclosed: Equation 6 can be used to calculate the emission factor of PM10 whenmaterials handling operations are carried out in an unenclosed area. Wind speed and moisturecontent of material must be taken into consideration.
Cement Manufacturing 15
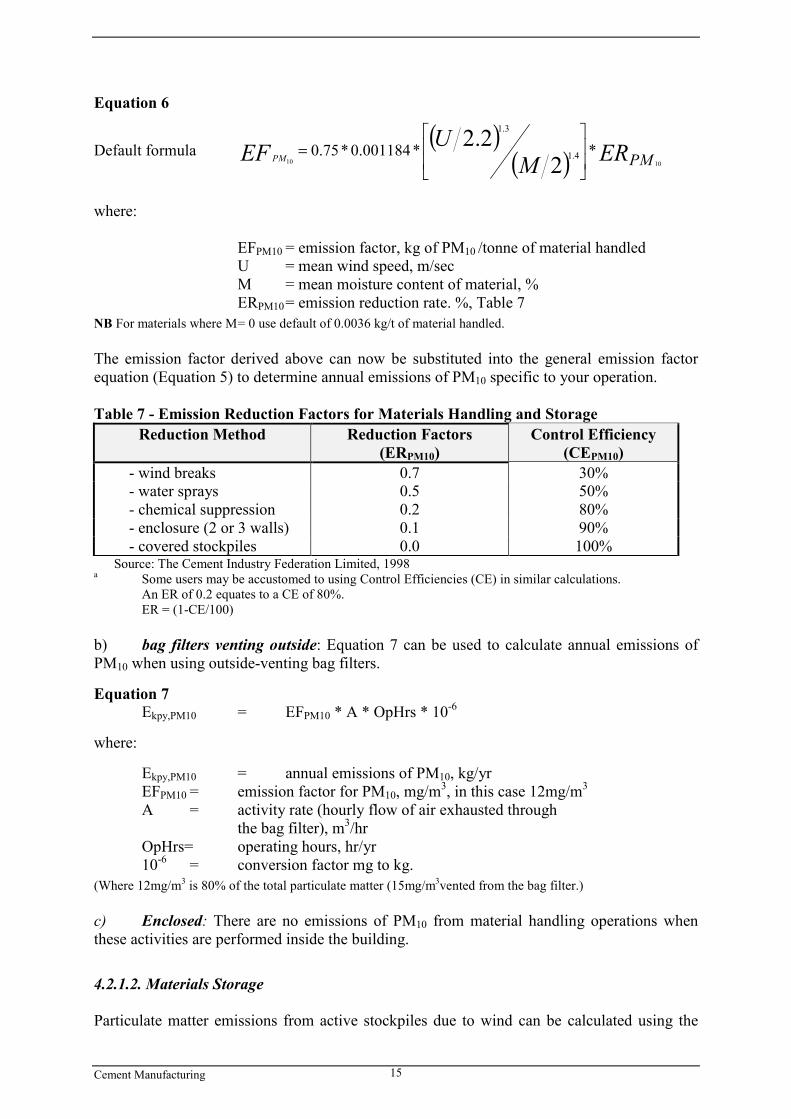
Equation 6
Default formula ( )( ) ERM
UEF PMPM1010
**001184.0*75.02
2.24.1
3.1
��
�
�
��
�
�=
where:
EFPM10 = emission factor, kg of PM10 /tonne of material handledU = mean wind speed, m/secM = mean moisture content of material, %ERPM10= emission reduction rate. %, Table 7
NB For materials where M= 0 use default of 0.0036 kg/t of material handled.
The emission factor derived above can now be substituted into the general emission factorequation (Equation 5) to determine annual emissions of PM10 specific to your operation.
Table 7 - Emission Reduction Factors for Materials Handling and StorageReduction Method Reduction Factors
(ERPM10)Control Efficiency
(CEPM10) - wind breaks 0.7 30% - water sprays 0.5 50% - chemical suppression 0.2 80% - enclosure (2 or 3 walls) 0.1 90% - covered stockpiles 0.0 100%
Source: The Cement Industry Federation Limited, 1998a Some users may be accustomed to using Control Efficiencies (CE) in similar calculations.
An ER of 0.2 equates to a CE of 80%.ER = (1-CE/100)
b) bag filters venting outside: Equation 7 can be used to calculate annual emissions ofPM10 when using outside-venting bag filters.
Equation 7Ekpy,PM10 = EFPM10 * A * OpHrs * 10-6
where:
Ekpy,PM10 = annual emissions of PM10, kg/yrEFPM10 = emission factor for PM10, mg/m3, in this case 12mg/m3
A = activity rate (hourly flow of air exhausted throughthe bag filter), m3/hr
OpHrs= operating hours, hr/yr10-6 = conversion factor mg to kg.
(Where 12mg/m3 is 80% of the total particulate matter (15mg/m3vented from the bag filter.)
c) Enclosed: There are no emissions of PM10 from material handling operations whenthese activities are performed inside the building.
4.2.1.2. Materials Storage
Particulate matter emissions from active stockpiles due to wind can be calculated using the
Cement Manufacturing 16
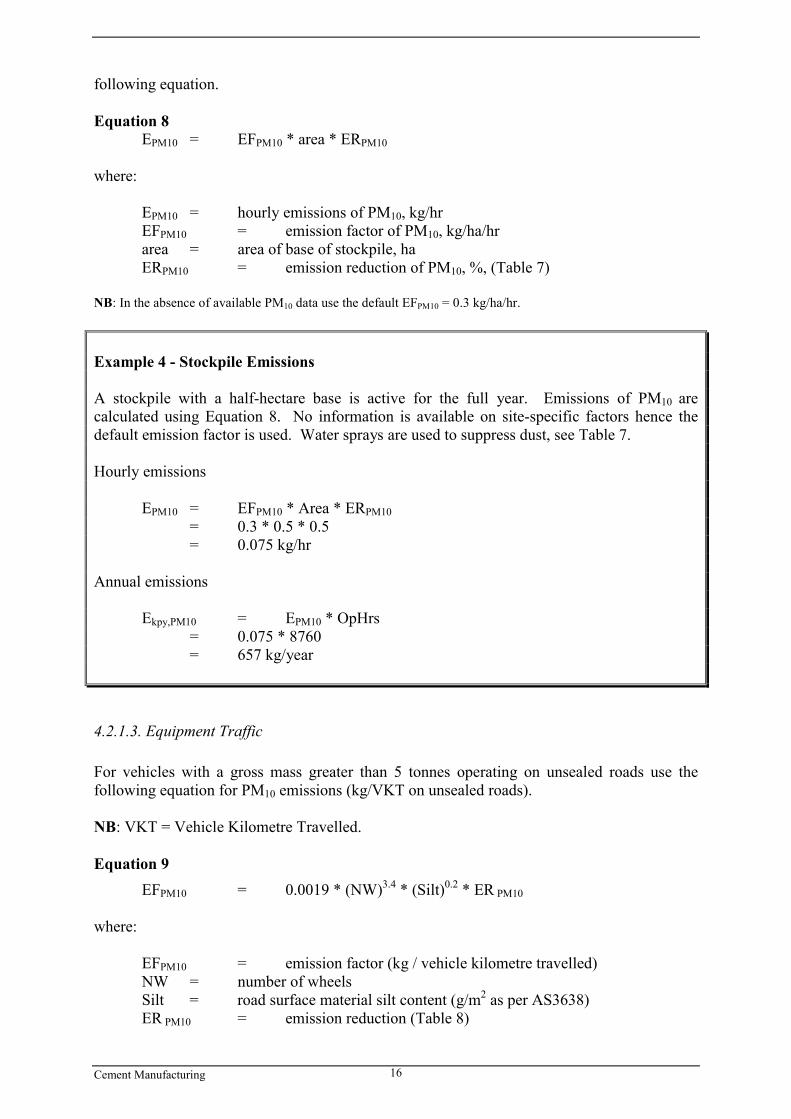
following equation.
Equation 8EPM10 = EFPM10 * area * ERPM10
where:
EPM10 = hourly emissions of PM10, kg/hrEFPM10 = emission factor of PM10, kg/ha/hrarea = area of base of stockpile, haERPM10 = emission reduction of PM10, %, (Table 7)
NB: In the absence of available PM10 data use the default EFPM10 = 0.3 kg/ha/hr.
Example 4 - Stockpile Emissions
A stockpile with a half-hectare base is active for the full year. Emissions of PM10 arecalculated using Equation 8. No information is available on site-specific factors hence thedefault emission factor is used. Water sprays are used to suppress dust, see Table 7.
Hourly emissions
EPM10 = EFPM10 * Area * ERPM10 = 0.3 * 0.5 * 0.5 = 0.075 kg/hr
Annual emissions
Ekpy,PM10 = EPM10 * OpHrs= 0.075 * 8760= 657 kg/year
4.2.1.3. Equipment Traffic
For vehicles with a gross mass greater than 5 tonnes operating on unsealed roads use thefollowing equation for PM10 emissions (kg/VKT on unsealed roads).
NB: VKT = Vehicle Kilometre Travelled.
Equation 9EFPM10 = 0.0019 * (NW)3.4 * (Silt)0.2 * ER PM10
where:
EFPM10 = emission factor (kg / vehicle kilometre travelled)NW = number of wheelsSilt = road surface material silt content (g/m2 as per AS3638)ER PM10 = emission reduction (Table 8)
Cement Manufacturing 17
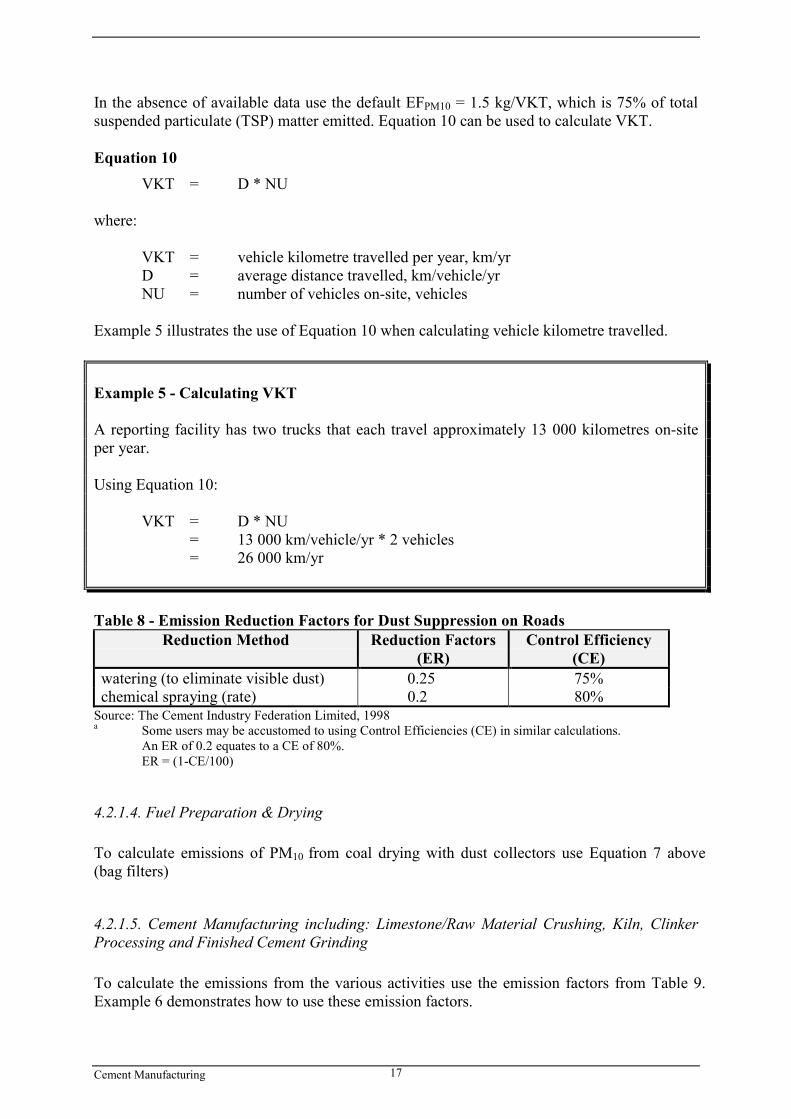
In the absence of available data use the default EFPM10 = 1.5 kg/VKT, which is 75% of totalsuspended particulate (TSP) matter emitted. Equation 10 can be used to calculate VKT.
Equation 10VKT = D * NU
where:
VKT = vehicle kilometre travelled per year, km/yrD = average distance travelled, km/vehicle/yrNU = number of vehicles on-site, vehicles
Example 5 illustrates the use of Equation 10 when calculating vehicle kilometre travelled.
Example 5 - Calculating VKT
A reporting facility has two trucks that each travel approximately 13 000 kilometres on-siteper year.
Using Equation 10:
VKT = D * NU= 13 000 km/vehicle/yr * 2 vehicles= 26 000 km/yr
Table 8 - Emission Reduction Factors for Dust Suppression on RoadsReduction Method Reduction Factors
(ER)Control Efficiency
(CE)watering (to eliminate visible dust) 0.25 75%chemical spraying (rate) 0.2 80%
Source: The Cement Industry Federation Limited, 1998a Some users may be accustomed to using Control Efficiencies (CE) in similar calculations.
An ER of 0.2 equates to a CE of 80%.ER = (1-CE/100)
4.2.1.4. Fuel Preparation & Drying
To calculate emissions of PM10 from coal drying with dust collectors use Equation 7 above(bag filters)
4.2.1.5. Cement Manufacturing including: Limestone/Raw Material Crushing, Kiln, ClinkerProcessing and Finished Cement Grinding
To calculate the emissions from the various activities use the emission factors from Table 9.Example 6 demonstrates how to use these emission factors.
Cement Manufacturing 18
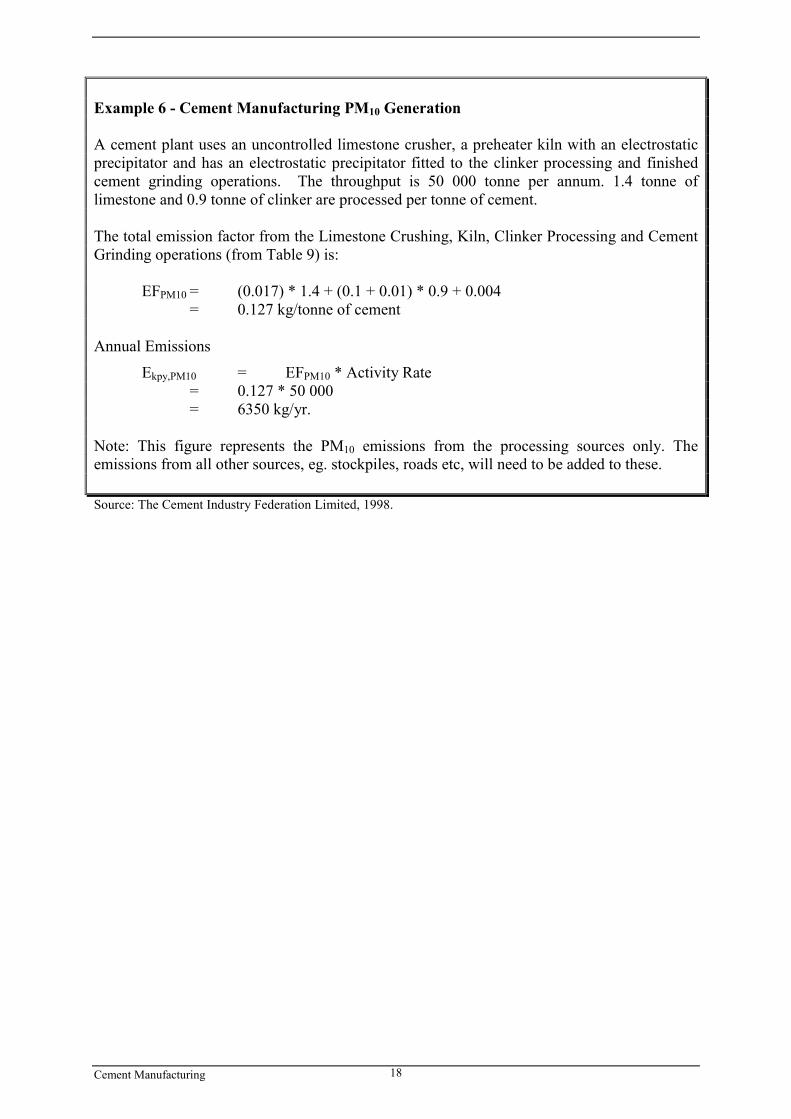
Example 6 - Cement Manufacturing PM10 Generation
A cement plant uses an uncontrolled limestone crusher, a preheater kiln with an electrostaticprecipitator and has an electrostatic precipitator fitted to the clinker processing and finishedcement grinding operations. The throughput is 50 000 tonne per annum. 1.4 tonne oflimestone and 0.9 tonne of clinker are processed per tonne of cement.
The total emission factor from the Limestone Crushing, Kiln, Clinker Processing and CementGrinding operations (from Table 9) is:
EFPM10 = (0.017) * 1.4 + (0.1 + 0.01) * 0.9 + 0.004= 0.127 kg/tonne of cement
Annual Emissions
Ekpy,PM10 = EFPM10 * Activity Rate= 0.127 * 50 000= 6350 kg/yr.
Note: This figure represents the PM10 emissions from the processing sources only. Theemissions from all other sources, eg. stockpiles, roads etc, will need to be added to these.
Source: The Cement Industry Federation Limited, 1998.
Cement Manufacturing 19
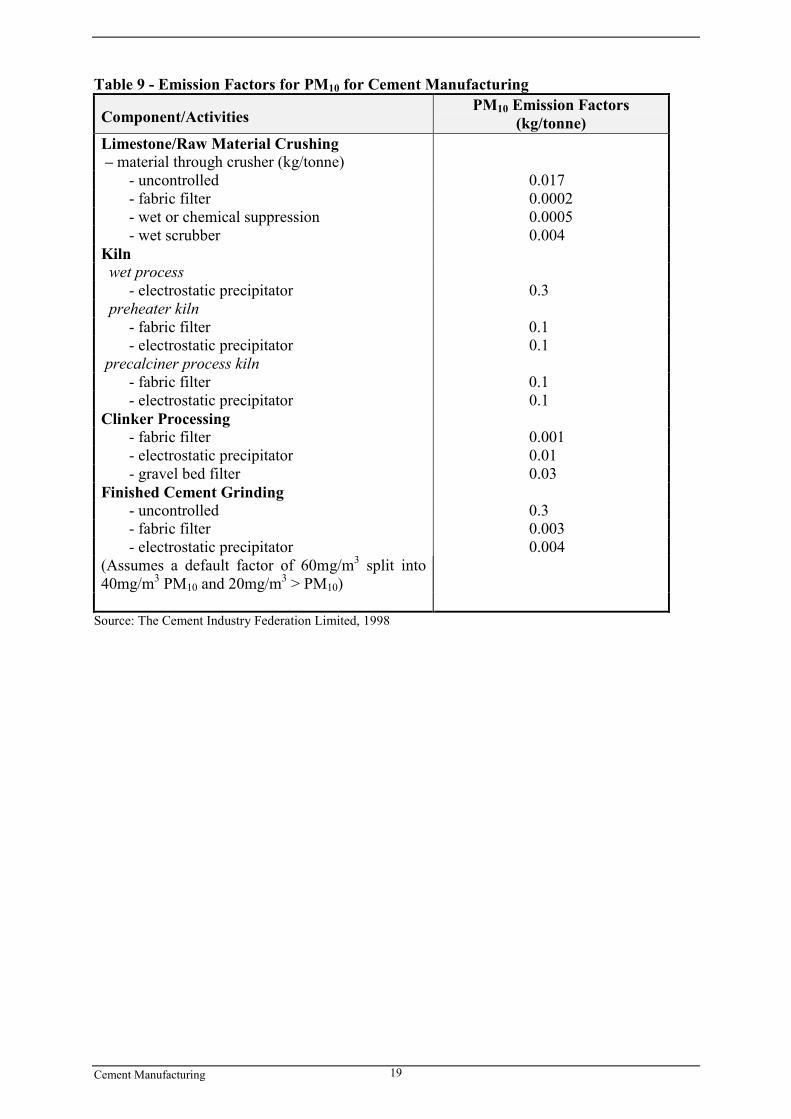
Table 9 - Emission Factors for PM10 for Cement Manufacturing
Component/ActivitiesPM10 Emission Factors
(kg/tonne)Limestone/Raw Material Crushing – material through crusher (kg/tonne) - uncontrolled 0.017 - fabric filter 0.0002 - wet or chemical suppression 0.0005 - wet scrubber 0.004Kiln wet process - electrostatic precipitator 0.3 preheater kiln - fabric filter 0.1 - electrostatic precipitator 0.1 precalciner process kiln - fabric filter 0.1 - electrostatic precipitator 0.1Clinker Processing - fabric filter 0.001 - electrostatic precipitator 0.01 - gravel bed filter 0.03Finished Cement Grinding - uncontrolled 0.3 - fabric filter 0.003 - electrostatic precipitator 0.004(Assumes a default factor of 60mg/m3 split into40mg/m3 PM10 and 20mg/m3 > PM10)
Source: The Cement Industry Federation Limited, 1998
Cement Manufacturing 20
4.3 Continuous Emission Monitoring System (CEMS) Data
A continuous emission monitoring system (CEMS) provides a continuous record of emissionsover time, usually by reporting pollutant concentration. Once the pollutant concentration isknown, emission rates are obtained by multiplying the pollutant concentration by thevolumetric gas or liquid flow rate of that pollutant.
To monitor SO2, NOx, VOC, and CO emissions using a CEMS, you use a pollutantconcentration monitor that measures the concentration in parts per million by volume dry air(ppmvd = volume of pollutant gas/106 volumes of dry air). Flow rates should be measuredusing a volumetric flow rate monitor. Flow rates estimated based on heat input using fuelfactors may be inaccurate because these systems typically run with high excess air to removethe moisture out of the kiln. Emission rates (kg/hr) are then calculated by multiplying thestack gas concentrations by the stack gas flow rates.
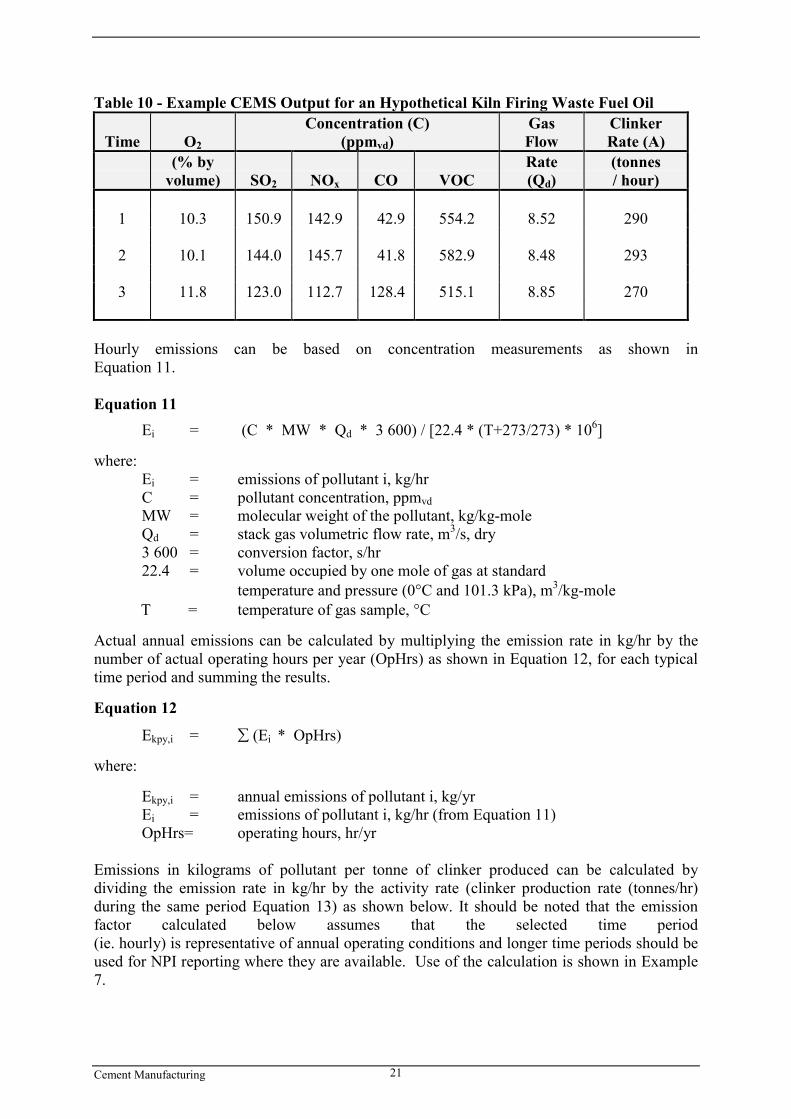
Table 10 presents example CEM data output for three periods for a hypothetical kiln. Theoutput includes pollutant concentrations in parts per million dry basis (ppmvd), diluent (O2 orCO2) concentrations in percent by volume dry basis (%v, d) and gas flow rates; and mayinclude emission rates in kilograms per hour (kg/hr). This data represents a snapshot of ahypothetical kiln operation. While it is possible to determine total emissions of an individualpollutant over a given time period from this data, assuming the CEM operates properly allyear long, an accurate emission estimate can be made by adding the hourly emission estimatesif the CEMS data is representative of typical operating conditions.
Although CEMS can report real-time hourly emissions automatically, it may be necessary toestimate annual emissions from hourly concentration data manually. This Section describeshow to calculate emissions for the NPI from CEMS concentration data. The selected CEMSdata should be representative of operating conditions. When possible, data collected overlonger periods should be used.
It is important to note that prior to using CEMS to estimate emissions, you should develop aprotocol for collecting and averaging the data in order that the estimate satisfies the localenvironmental authority’s requirement for NPI emissions estimations.
Cement Manufacturing 21
Table 10 - Example CEMS Output for an Hypothetical Kiln Firing Waste Fuel Oil
Time O2
Concentration (C)(ppmvd)
GasFlow
ClinkerRate (A)
(% byvolume) SO2 NOx CO VOC
Rate(Qd)
(tonnes/ hour)
1 10.3 150.9 142.9 42.9 554.2 8.52 290
2 10.1 144.0 145.7 41.8 582.9 8.48 293
3 11.8 123.0 112.7 128.4 515.1 8.85 270
Hourly emissions can be based on concentration measurements as shown inEquation 11.
Equation 11Ei = (C * MW * Qd * 3 600) / [22.4 * (T+273/273) * 106]
where:Ei = emissions of pollutant i, kg/hrC = pollutant concentration, ppmvdMW = molecular weight of the pollutant, kg/kg-moleQd = stack gas volumetric flow rate, m3/s, dry3 600 = conversion factor, s/hr22.4 = volume occupied by one mole of gas at standard
temperature and pressure (0°C and 101.3 kPa), m3/kg-moleT = temperature of gas sample, °C
Actual annual emissions can be calculated by multiplying the emission rate in kg/hr by thenumber of actual operating hours per year (OpHrs) as shown in Equation 12, for each typicaltime period and summing the results.
Equation 12
Ekpy,i = � (Ei * OpHrs)
where:
Ekpy,i = annual emissions of pollutant i, kg/yrEi = emissions of pollutant i, kg/hr (from Equation 11)OpHrs= operating hours, hr/yr
Emissions in kilograms of pollutant per tonne of clinker produced can be calculated bydividing the emission rate in kg/hr by the activity rate (clinker production rate (tonnes/hr)during the same period Equation 13) as shown below. It should be noted that the emissionfactor calculated below assumes that the selected time period(ie. hourly) is representative of annual operating conditions and longer time periods should beused for NPI reporting where they are available. Use of the calculation is shown in Example7.
Cement Manufacturing 22
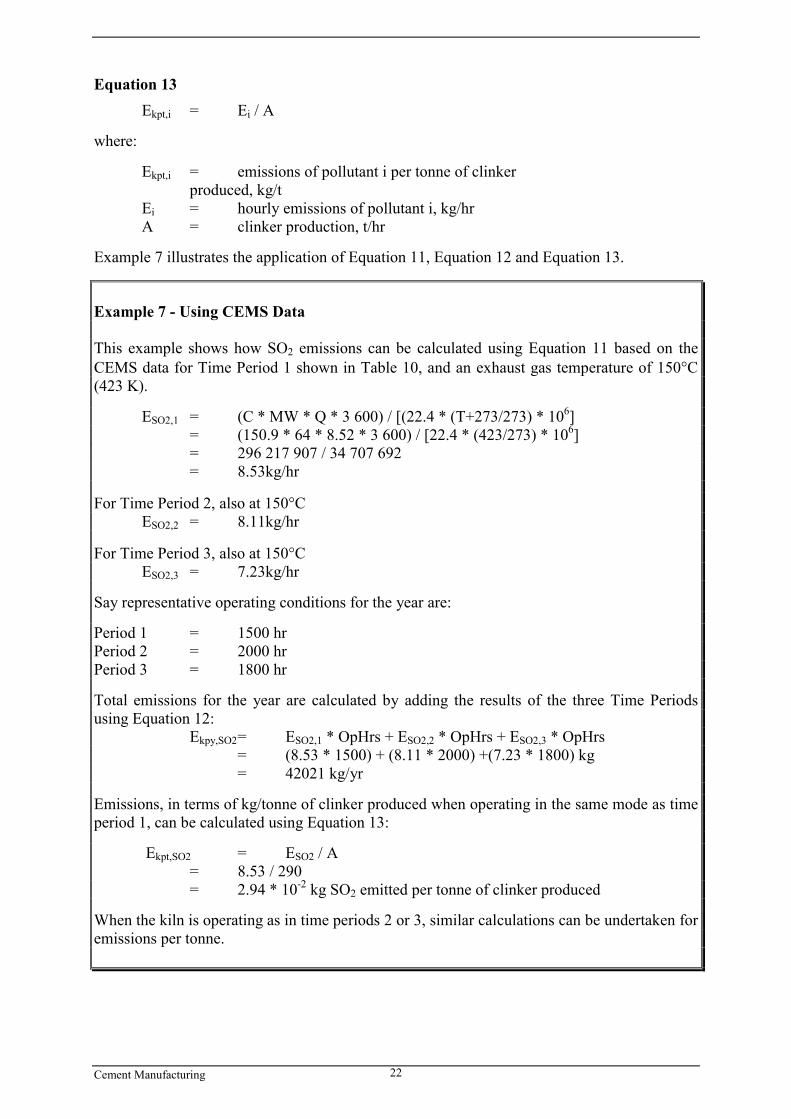
Equation 13Ekpt,i = Ei / A
where:
Ekpt,i = emissions of pollutant i per tonne of clinker produced, kg/t
Ei = hourly emissions of pollutant i, kg/hrA = clinker production, t/hr
Example 7 illustrates the application of Equation 11, Equation 12 and Equation 13.
Example 7 - Using CEMS Data
This example shows how SO2 emissions can be calculated using Equation 11 based on theCEMS data for Time Period 1 shown in Table 10, and an exhaust gas temperature of 150°C(423 K).
ESO2,1 = (C * MW * Q * 3 600) / [(22.4 * (T+273/273) * 106]= (150.9 * 64 * 8.52 * 3 600) / [22.4 * (423/273) * 106]= 296 217 907 / 34 707 692= 8.53kg/hr
For Time Period 2, also at 150°C ESO2,2 = 8.11kg/hr For Time Period 3, also at 150°C ESO2,3 = 7.23kg/hr Say representative operating conditions for the year are: Period 1 = 1500 hr Period 2 = 2000 hr Period 3 = 1800 hr Total emissions for the year are calculated by adding the results of the three Time Periodsusing Equation 12: Ekpy,SO2= ESO2,1 * OpHrs + ESO2,2 * OpHrs + ESO2,3 * OpHrs
= (8.53 * 1500) + (8.11 * 2000) +(7.23 * 1800) kg = 42021 kg/yr Emissions, in terms of kg/tonne of clinker produced when operating in the same mode as timeperiod 1, can be calculated using Equation 13: Ekpt,SO2 = ESO2 / A = 8.53 / 290 = 2.94 * 10-2 kg SO2 emitted per tonne of clinker produced When the kiln is operating as in time periods 2 or 3, similar calculations can be undertaken foremissions per tonne.
Cement Manufacturing 23
5.0 References
The Cement Industry Federation Limited, (1998). Personal communication with the CementIndustry Federation Limited.
Eastern Research Group. July 1997. Introduction to Stationary Point Source EmissionInventory Development Volume II: Chapter 1. Morrisville, NC, USA.
EMEP/CORINAIR. (1996). AIR: Atmospheric Emission Inventory Guidebook. EuropeanEnvironment Agency, Copenhagen, Denmark.
USEPA. September 1995. Compilation of Air Pollutant Emission Factors, Volume 1:Stationary Point and Area Sources, fourth edition, AP-42. Section 11.6 Portland CementManufacturing. United States Environmental Protection Agency, Office of Air QualityPlanning and Standards. Research Triangle Park, NC, USA.http://www.epa.gov/ttn/chief/ap42.html
USEPA. September 1995. Compilation of Air Pollutant Emission Factors, Volume 1:Stationary Point and Area Sources, fourth edition, AP-42. Section 13.2 MiscellaneousSources. United States Environmental Protection Agency, Office of Air Quality Planning andStandards. Research Triangle Park, NC, USA.
USEPA. September 1995. EPA Office of Compliance Sector Notebook Project. Profile of theStone, Clay, Glass, and Concrete Products Industry. United States Environmental ProtectionAgency, Office of Enforcement and Compliance Assurance. Washington, DC, USA.
Written Communication from The Cement Industry Federation Limited, St Leonards, NSW,to the Queensland Environmental Protection Agency, Brisbane, QLD, August 1998.
The following Emission Estimation Technique Manuals are available at the NPI Homepage(http://www.npi.gov.au) and from your local environmental protection agency (see the front ofthe NPI Guide for details):
• Emission Estimation Technique Manual for Combustion Engines; and• Emission Estimation Technique Manual for Lime & Dolomite Manufacturing.