Embed Size (px)
Citation preview
Efficacy of Treating Waterborne Pathogens withthe Antimicrobials Ozone and Trichloromelamine
Item Type text; Electronic Thesis
Authors Niedfeldt, Emily
Publisher The University of Arizona.
Rights Copyright © is held by the author. Digital access to this materialis made possible by the University Libraries, University of Arizona.Further transmission, reproduction or presentation (such aspublic display or performance) of protected items is prohibitedexcept with permission of the author.
Download date 23/05/2018 02:25:16
Link to Item http://hdl.handle.net/10150/325219
EFFICACY OF TREATING WATERBORNE PATHOGENS
WITH THE ANTIMICROBIALS
OZONE AND TRICHLOROMELAMINE
by
Emily Niedfeldt
____________________________
A Thesis Submitted to the Faculty of the
DEPARTMENT OF ANIMAL SCIENCES
In Partial Fulfillment of the Requirements
For the Degree of
MASTER OF SCIENCE
In the Graduate College
THE UNIVERSITY OF ARIZONA
2014
2
STATEMENT BY AUTHOR
This thesis has been submitted in partial fulfillment of requirements for an advanced degree at the University of Arizona and is deposited in the University Library to be made available to borrowers under rules of the Library.
Brief quotations from this thesis are allowable without special permission, provided that an accurate acknowledgement of the source is made. Requests for permission for extended quotation from or reproduction of this manuscript in whole or in part may be granted by the head of the major department or the Dean of the Graduate College when in his or her judgment the proposed use of the material is in the interests of scholarship. In all other instances, however, permission must be obtained from the author.
SIGNED: Emily Niedfeldt
APPROVAL BY THESIS DIRECTOR
This thesis has been approved on the date shown below:
07/17/2014
John A. Marchello Professor of Animal Sciences
3
Acknowledgements
There have been a number of people who have helped and encouraged me along my path
to my Masters, and I wish to thank them all from the bottom of my heart. Specifically I would
like to acknowledge:
- Dr. John Marchello, for being my advisor and pushing me when I needed it.
- Dr. Elaine Marchello, for being a support for me during the hard times.
- Crystal Lopez, for being a great help in figuring out some of the logistics of my studies, for
encouraging me when everything seemed to be going wrong, and for growing into a friend.
- Finally, and most importantly, I wish to acknowledge my mother. Without her I never would
have gotten so far or tried to do so much.
4
Dedication
I wish to dedicate this thesis to my mother, Deborah Niedfeldt. Without her unfailing
support and dedication to me I would have never even started school at the University of Arizona
much less have been so successful during my time here. Thank you, mom, for being there for
me, for encouraging me when I needed to be encouraged, for prodding me on when I got
complacent, and for being the support system I needed in order to learn who I am and what path I
want to take. Without you, I would never have even been able to have done the research, much
less write this. This is for you, mommakins.
5
Table of Contents Abstract ............................................................................................................................................8
Introduction and Significance ..........................................................................................................9 Literature Review ...........................................................................................................................11
Trichloromelamine .............................................................................................................11 Ozone .................................................................................................................................12
Acetic Acid ........................................................................................................................16 Bacterial Pathogens ............................................................................................................17
Materials and Methods ...................................................................................................................18 Water Samples ...................................................................................................................18
Method 1 ............................................................................................................................18 Method 2 ............................................................................................................................21
Method 3 ............................................................................................................................22 Results and Discussion ..................................................................................................................24
Contaminated Water Samples ............................................................................................24 Trichloromelamine .............................................................................................................25
Sample 1 .................................................................................................................25 Sample 2 .................................................................................................................28
Sample 3 .................................................................................................................30 Sample 4 .................................................................................................................31
Ozone .................................................................................................................................32 Sample 1 .................................................................................................................32
Sample 2 .................................................................................................................33 Sample 3 .................................................................................................................34
Acetic Acid ........................................................................................................................35 Vinegar ...............................................................................................................................37
Conclusions ....................................................................................................................................40
Works Cited ...................................................................................................................................42
6
Tables Table 1 ...........................................................................................................................................19
Table 2 ...........................................................................................................................................21 Table 3 ...........................................................................................................................................23
Table 4 ...........................................................................................................................................24 Table 5 ...........................................................................................................................................25
Table 6 ...........................................................................................................................................28 Table 7 ...........................................................................................................................................30
Table 8 ...........................................................................................................................................31 Table 9 ...........................................................................................................................................32
Table 10 .........................................................................................................................................33 Table 11 .........................................................................................................................................26
Table 12 .........................................................................................................................................35 Table 13 .........................................................................................................................................37
7
Figures Figure 1 ..........................................................................................................................................20
Figure 2 ..........................................................................................................................................22 Figure 3 ..........................................................................................................................................25
Figure 4 ..........................................................................................................................................28 Figure 5 ..........................................................................................................................................30
Figure 6 ..........................................................................................................................................32 Figure 7 ..........................................................................................................................................33
Figure 8 ..........................................................................................................................................34 Figure 9 ..........................................................................................................................................35
Figure 10 ........................................................................................................................................37 Figure 11 ........................................................................................................................................38
Figure 12 ........................................................................................................................................39
8
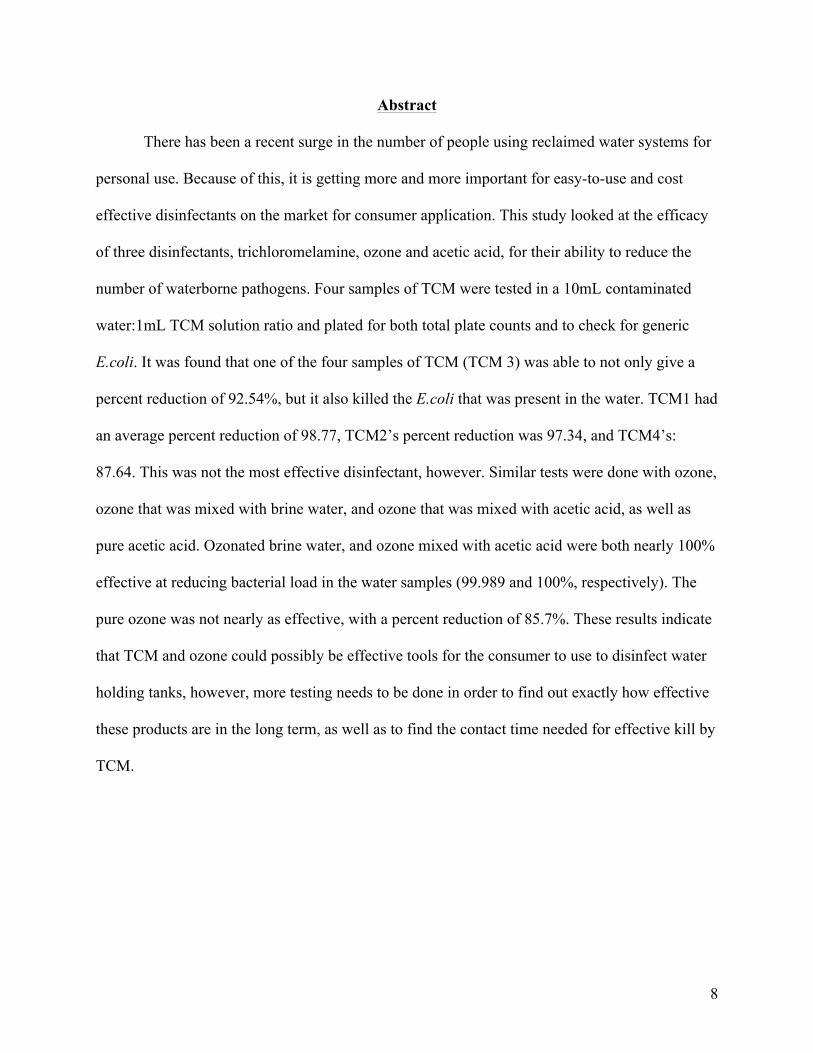
Abstract
There has been a recent surge in the number of people using reclaimed water systems for
personal use. Because of this, it is getting more and more important for easy-to-use and cost
effective disinfectants on the market for consumer application. This study looked at the efficacy
of three disinfectants, trichloromelamine, ozone and acetic acid, for their ability to reduce the
number of waterborne pathogens. Four samples of TCM were tested in a 10mL contaminated
water:1mL TCM solution ratio and plated for both total plate counts and to check for generic
E.coli. It was found that one of the four samples of TCM (TCM 3) was able to not only give a
percent reduction of 92.54%, but it also killed the E.coli that was present in the water. TCM1 had
an average percent reduction of 98.77, TCM2’s percent reduction was 97.34, and TCM4’s:
87.64. This was not the most effective disinfectant, however. Similar tests were done with ozone,
ozone that was mixed with brine water, and ozone that was mixed with acetic acid, as well as
pure acetic acid. Ozonated brine water, and ozone mixed with acetic acid were both nearly 100%
effective at reducing bacterial load in the water samples (99.989 and 100%, respectively). The
pure ozone was not nearly as effective, with a percent reduction of 85.7%. These results indicate
that TCM and ozone could possibly be effective tools for the consumer to use to disinfect water
holding tanks, however, more testing needs to be done in order to find out exactly how effective
these products are in the long term, as well as to find the contact time needed for effective kill by
TCM.
9
Introduction and Significance
Water decontamination, while not a widely talked about endeavor, is one that is a
constant concern for developed nations. Despite the United States’ best efforts to eradicate
waterborne diseases, in the time period from 1991 to 2002 there were 183 cases of disease
stemming from contaminated drinking water (Reynolds et al., 2008). Also, because more and
more people are wanting to be more efficient in their lives, water reclamation and reuse is
becoming more popular, leading to questions about the associated health risks (Toze, 2006).
Many of the outbreaks associated with waterborne disease are caused by noncommunity water
systems, but the outbreaks with the most impact are those stemming from an issue with a
community water system (Reynolds et al., 2008). Even beyond government controlled water
purification systems and their issues is the fact that many people travel using recreational
vehicles, and there is no government oversight or control over the water contained in those
holding tanks.
In 1989 there was an outbreak of gastroenteritis at a caravan park (RV park) in New
South Wales, Australia. While the source of water contamination was found and fixed, it was
still a number of days before the water was clean of contamination, and because of that many
people got sick even after the source of contamination was removed (McAnulty et al., 1993). On
top of the inherent risk that comes from using water from community (or noncommunity) water
systems, there are a good number of people who, while traveling in their RVs or trailers, do not
clean out their tanks often, and run the risk of getting sick because they are using potentially
contaminated water to bathe, or wash their dishes in (Marchello, 2012).
The question now stands, with more people moving towards using recycled or reclaimed
water, how can the public health sector keep personal stores of water as safe and decontaminated
as possible? This is a real concern; about 39% of outbreaks associated with drinking water
10
during 2001-2002 were caused by water systems not regulated by the USEPA (Reynolds et al.,
2008). The intent of this study was to test the efficacy of different consumer-friendly
disinfectants in killing waterborne pathogens, thereby rendering personal water holding and
transportation systems safe and uncontaminated. Trichloromelamine (TCM), acetic acid and
ozone were the disinfectants used, mainly because of their effectiveness in previous trials against
pathogens, their relative safety to consumers, and their potential ease to get from manufacturer to
consumer.
TCM has shown to be consumer friendly and less costly than other chlorinated products,
while maintaining effective killing. Acetic acid is effective as a disinfectant, and is readily
accessible to the consumer, in the form of vinegar. Ozone, while the hardest to get to the
consumer and potentially the most expensive, is the most promising disinfectant, due to its
ability to kill pathogens as well as its short half-life. Results from this study could help point
developers in the right direction for a consumer friendly product to sanitize water reclamation
and storage systems.
11
Literature Review
Trichloromelamine
Trichloromelamine (TCM) is a chemical disinfectant used to clean food and hard surfaces
(Iofina Chemical Inc., 2009). The EPA lists TCM as an algicide, disinfectant, microbiocide,
bactericide and a sanitizer. This means that TCM has the capabilities to disinfect, sanitize, kill
off algae, kill off ‘average’ bacteria, as well as slime-forming bacteria (United States
Environmental Protection Agency, 2005). Normal uses for TCM do not include sanitization of
water storage or distribution systems, but because it has been approved for use as a hard surface
sanitizer by the FDA, the parallels are clear. The EPA performed health hazard tests on TCM,
including determining the amount of TCM needed to generate an acute response (acute risk) and
a chronic response (chronic risk). They found that, when properly prepared, the exposure risks
for children, the group most at risk, were 31.6% of the acute risk dose and 53.7% of the chronic
dose. In order to come up with these numbers, the EPA performed the acute tests on double the
dose of TCM, because the directions state that TCM can be made double strength, bringing it up
from 100 ppm to 200 ppm. This change in concentration (from 100 ppm to 200 ppm) is only
allowed when sterilizing food utensils, however. Even with this double strength dose, the health
hazard tests still both showed that the toxic effect of TCM is well under the EPA’s risk concerns
(United States Environmental Protection Agency, 2005). TCM comes to consumers as a cream-
colored powder that is water-soluble. It is stable for approximately one year after it has been
created (Iofina Chemical Inc., 2009).
12
Ozone
The past few years have seen a marked shift in methods of wastewater disinfection due to
increased public awareness of harmful disinfection byproducts (DBPs) resulting from chlorine
disinfection. Because of these DBPs, some countries, such as Italy, have banned chlorine from
being used as a disinfectant (Liberti et al., 2000) These bans have caused countries to seek an
alternative method of disinfecting wastewater, one of the most popular being the use of ozone.
Ozone, as a molecule, has a very simple structure composed of three oxygen molecules.
This structure imparts part of ozone’s success as a disinfectant. At all times, at least two of the
oxygens have a charge on them, meaning the ozone is a polar molecule, as well as being
unstable. This charge and instability directly relates to the disinfection power of ozone. Due to
the instability, ozone breaks apart into radical species and these radical species act upon
bacterial, protozoan and viral species to inactivate them. In addition to the activity of radical by-
products, ozone is able to directly oxidize and destroy the cell wall of a pathogen, damage the
purines and pyrimidines of the pathogen’s DNA, or even break the C-N bonds of proteins
(United States Environmental Protection Agency, 1999). The variety of effects that ozone has
very well could explain why it is such a successful and wide-ranging disinfectant.
The very fact that ozone creates radical subspecies and byproducts is both an advantage
and a huge downfall. The advantages were previously mentioned and impart much of ozone’s
success. The downfall comes into play when looking at the longevity of ozone in solution. To be
a truly successful disinfectant in the eyes of the industry, the agent must be both effective and
long lasting. Ozone’s instability lends itself well to effectiveness, but not to longevity in solution.
This short half-life poses a major challenge to people hoping to utilize ozone in novel
disinfection scenarios. Most often ozone use is limited to situations where it can be constantly
produced into solution. One of the purposes of this study was to develop a procedure to stabilize
13
ozone in solution to increase its usefulness in novel ways.
In a reaction mixture there are three main types of molecules: the initiator, promotor, and
scavenger. The initiator, as the name implies, initiates the reaction chain that converts O3 to the
radical species OH•. The initiator is normally OH-, though it can be any number of other
molecules. Promoters are the molecular species that converts the radical OH• to the superoxide
radicals O2•- and/or HO2•. These superoxide species act as promoters in other reactions that
result in the deal of the pathogenic species. The final species are called scavengers. These are the
species that react with OH• to form secondary, non-superoxide radicals. These radical species
not only act to keep the reaction sequence going, but they also react with the OH• radicals,
causing them to be unavailable for creating superoxides, thereby earning the name “scavengers”
(Gardoni et al., 2012).
The stability of the radical species increases as the pH of the liquid media decreases as
well as in the presence of a solubilized salt. Theoretically this is because the low pH and
solubilized salt both donate positively charged molecules to the solution, which act as stabilizing
agents to the negatively charged OH• radical, allowing it to not be scavenged and for it to create
more superoxide radicals, thereby promoting more reactions that result in the pathogens being
destroyed (Gardoni et al., 2012).
Penru et al. (2013) conducted a study on how effective ozone is in disinfecting seawater,
and found that even the smallest dosage of ozone was effective in completely disinfecting the
solution. Disinfection was measured by assessing the amount of ATP in solution, both in cellular
forms and free. The idea is that if a cell is dead, it no longer produces ATP. The ATP that is
remaining in the cell will be quickly used up, leaving no detectable ATP in the solution. At all
concentration of ozone, detectable levels of cellular ATP were at 0, indicating a total reduction in
bacterial cellular load in the solution. The lowest dose of O3 used by Penru was 0.38 mg O3/L
14
and the highest was just below 5 mg O3/L (4.89). The oxidation-reduction potential (ORP)
increased from +255mV to the range of +691mV to +789mV, depending on the different doses
of O3 applied. It is also important to note that it took 15 seconds for ozone to completely react
with the molecules in solution and produce unique radical species which create the solution’s
total residual oxidant (TRO) quotient. This TRO is a measure of the oxidizing potential of the
solution, and as O3 doses increase, so does the TRO concentration. There is also evidence that
the TRO resulting from ozonation helps increase long-term disinfection thereby reducing
microbial activity for a longer period of time.
The study on the effectiveness of ozone against cyanobacterial toxins is good for two
reasons. The first is that toxins are particularly virulent and dangerous because they remain in
solution even after the cells that produced them are dead. Furthermore, depending on them being
endotoxins or exotoxins, the actual death and lysing of the cell could release the toxins. The food
safety and water quality industries have a vested interest in finding a disinfectant that is able to
deactivate the toxins. The study conducted by Rositano et al. (1998) showed that, of all the
disinfection systems available for use today, ozone is the most powerful for removing
cyanobacterial toxins. When there is no organic material in solution it takes 4 mg O3/L four
minutes to denature all toxins, but when there is organic matter present it bumps the
requirements up to 1 mg O3/L and 5 minutes to reach complete toxin inactivation. They also
conducted a study on the effectiveness of ozone when solubilized in both basic and acidic
solutions, and showed that a pH of 7.5 or greater, the ozone lost efficiency as a disinfectant. The
lower the pH, the more stabilized ozone is in solution and the more effective it is as a
disinfectant. In the same study by Rositano et al, peroxone, a mixture of ozone and hydrogen
peroxide was used against the same cyanobacterial toxins as the straight ozone. At a
concentration of 1 mg/L of ozone, removal of the toxin was at 27%, however when 0.02 mg/L of
15
ozone was mixed with 0.01 mg/L peroxide, the removal reached 54%, double that of ozone
alone. This finding indicates that even a small amount of peroxide can increase the efficiency of
ozone against toxins (1998).
There are studies that show that ozone is a more effective disinfectant than chlorine based
chemical disinfectants, such as TCM (Kim et al., 1999) Other studies have shown that ozone is
efficient in significantly reducing bacterial load on the hide of a steer before it goes to slaughter.
Thus reducing the amount of contamination that can contaminate a carcass from the dehiding
process (Bosilevac et al., 2005) A different study conducted showed that an exposure time of 30
seconds was sufficient to reduce pathogenic cell counts by over a log of 5 (Bialoszewski et al.,
2010) Additionally, Bioloszewski et al. revealed ozone to be effective against biofilms in
addition to its effectiveness against suspended bacteria (2011) This is a vital type of disinfection
because biofilms are a reservoir of disease and pathogens. The fact that ozone is effective against
biofilms increases the variety of applications in which it can be used and the variety of
applications that industry leaders are hoping it will become useful in. These are two different
issues because the first involves using technology that already exists in novel ways, while the
second involves creating novel methods of application, or new technologies to enhance what
already exists.
16
Acetic Acid
Organic acids have been used in the American food industry as effective disinfectants for
years, even receiving GRAS (generally recognized as safe list) status from the FDA. Organic
acids, a classification that acetic acid falls under, generally function using one of two
mechanisms. It is interesting to note that these two mechanisms are not acid specific, but rather
that different organic acids have different mechanisms of attack when working against different
pathogens (In et al., 2013) Acetic acid has uses as an antimicrobial agent in many fields: in
medicine it is used against two of the main bacterial agents causing nosocomial infections,
treatment against otitis externa, is being tested as being an effective intracanal medical treatment,
and is being widely used in the food safety industry for its antimicrobial properties against
foodborne pathogens (Kany et al., 2012; Rhee et al., 2003) Typically only a 5% solution of acetic
acid is needed to be pathogenic to most bacterial species, but research shows that lower
concentrations work just as well against pathogens (Luttrell, 2012; Kany et al., 2012)
17
Bacterial Pathogens
Bacteria are the most common pathogens found in water (Toze, 2006) They generally do
not live long in the environment, but despite that, they caused the highest percentage of
documented water-associated disease outbreaks from 1991-2002 (Reynolds et al., 2008)
Normally a large number of bacteria are needed in order to cause infection, though there are
some bacterial species that need relatively few cells to get the same effect (Toze, 2006) Some of
the main bacterial pathogens that are associated with waterborne diseases are: Salmonella,
Shigella, Campylobacter, Vibrio cholerae and Escherichia coli. Each of these species are enteric
in nature, meaning they colonize in the human gastrointestinal tract, therefore a common
symptom of these pathogens is diarrhea (Reynolds et al., 2008)
All of the current literature on the antimicrobials selected for this project,
trichloromelamine, ozone, and acetic acid, is lacking on how effective each compound is against
waterborne pathogens. Because of the changing dynamics of water use, finding safe, effective,
and cheap disinfectants for water holding tanks is gaining importance. These three antimicrobials
are good choices because each of them has been shown to be safe for use in systems that humans
are around. They are all user-friendly and not requiring many steps to create and are fairly easy
to apply. In the case of acetic acid, it is also cheap for the consumer to obtain. Both TCM and
ozone are not readily available to the consumer, but with tests showing how effective they are for
multiple uses in and around the house, it is the hope of the FPSL that they become more
accessible in the near future.
18
Materials and Methods
Water Samples:
Water from two different recreational vehicles was obtained and tested for base levels of
contamination and then against the different disinfectants for efficacy. New water samples were
needed, so water was contaminated with either blood or fecal material and then used to test the
efficacy of the disinfectants.
Water sample numbers 1, 2, and 3 were taken at different times from Dr. John
Marchello’s water holding tank in his travel trailer. Water sample 4 was taken from a different
travel trailer. Samples 5 and 6 were both created at the FPSL by placing a few gallons of distilled
water into a bucket. This bucket was brought into the abattoir and the workers were asked to
rinse their knives in the water before sanitization, so that the contamination could be measured
and used in the study. There is a difference in contamination levels of the two samples because
sample 5 was left for the workers to rinse their knives in longer than sample 6. The last three
samples, 7, 8, and 9 were all created by taking 500mL of water and mixing 2g of fecal material
into deionized water.
Method 1:
One disinfectant tested was trichloromelamine (TCM). The TCM samples were obtained
from two companies, LK6 or DBK. LK6 is located at 3136 E. 33rd Pl, Yuma, AZ 85365. DBK
Incorporated is at 10081 N. Christensen Rd, Coolidge, AZ 85128. Two of LK6’s TCM samples
came with instructions stating that 2.36g of TCM would create a 100ppm solution when mixed
with 1 gallon (3600mL) of water. Three of the four samples of LK6 TCM were kept at the Food
Product and Safety Lab (FPSL) and have all been stored for approximately two years, though in
different manners and locations. The first sample, hereafter referred to as TCM1, was stored
inside the lab, in a temperature controlled setting, and is packaged in individual bags containing
19
2.36g, enough to make a 1 gallon solution of TCM. TCM2 was just sent to the lab from LK6,
and while packaged in bags like TCM1, TCM2 comes in packages of 7.06 grams, enough to
make a 3 gallon solution. A barrel full of unpackaged (loose powder) LK6 TCM, TCM3, was
stored in the storage unit outside of the FPSL, a non-climate controlled storage system. TCM4 is
from the second TCM company, DBK.
Preparation Methods:
Each TCM sample was initially created in solutions that followed the directions that LK6
lists on their packaging: 2.36g of powdered TCM for every gallon (3600mL) of distilled water.
Other samples were created by adding 2, 3, 4 or 6 times the recommended amount to a gallon of
water. This was done because it is allowable to increase the amount of TCM so that the ppm of
the solution reaches 200 rather than 100.
Table 1. TCM Concentrations per Sample* Treatment (g TCM)
Sample A B C D E 1 2.36 4.72 7.09 14.18 -- 2 2.3605 4.7210 7.0944 9.4511 -- 3 2.3618 4.7262 7.0923 9.4551 2.36** 4 2.3622 -- -- -- --
*per 1 gallon distilled water **difference between this sample and sample 3A is that 3E was mixed in 100 gallons water
Testing Procedure:
All of the varieties of TCM were mixed with contaminated water in differing
concentrations, the most common of which was a 1mL TCM:10mL H2O mixture. However,
sometimes the ratio was 2mL TCM:10mL H2O. In the case of the last experiment with TCM3,
treatment E differs from treatment A in that treatment E was made as a 100-gallon solution.
20
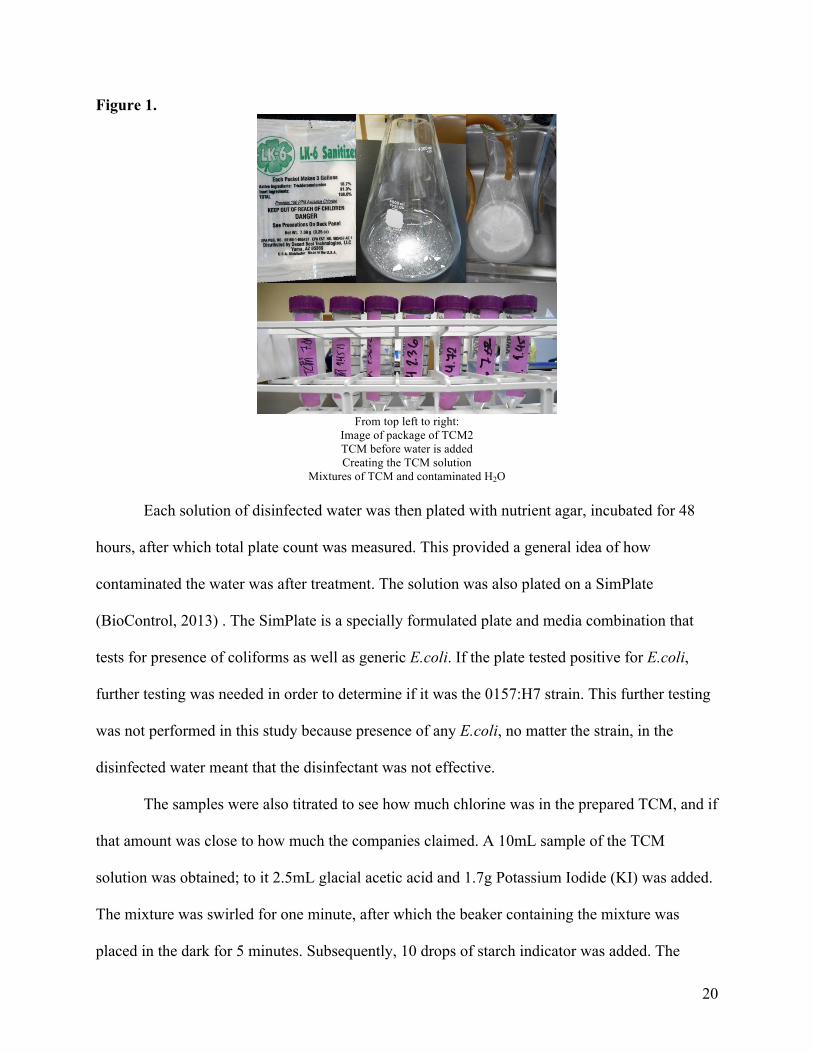
Figure 1.
From top left to right:
Image of package of TCM2 TCM before water is added Creating the TCM solution
Mixtures of TCM and contaminated H2O
Each solution of disinfected water was then plated with nutrient agar, incubated for 48
hours, after which total plate count was measured. This provided a general idea of how
contaminated the water was after treatment. The solution was also plated on a SimPlate
(BioControl, 2013) . The SimPlate is a specially formulated plate and media combination that
tests for presence of coliforms as well as generic E.coli. If the plate tested positive for E.coli,
further testing was needed in order to determine if it was the 0157:H7 strain. This further testing
was not performed in this study because presence of any E.coli, no matter the strain, in the
disinfected water meant that the disinfectant was not effective.
The samples were also titrated to see how much chlorine was in the prepared TCM, and if
that amount was close to how much the companies claimed. A 10mL sample of the TCM
solution was obtained; to it 2.5mL glacial acetic acid and 1.7g Potassium Iodide (KI) was added.
The mixture was swirled for one minute, after which the beaker containing the mixture was
placed in the dark for 5 minutes. Subsequently, 10 drops of starch indicator was added. The
21
mixture was then titrated using a 0.1N solution of Sodium Thiosulfate until the color dissipated
and the solution was clear. The equation to find the percent Cl in the solution is:
[(mL NaThio)(0.1N)(3.5495)] (g TCM)
Method 2:
All ozone used in this experiment was solubilized ozone, created using the ozone
machine that the FPSL owns and uses, a Lotus Pro model number LQFC225K.
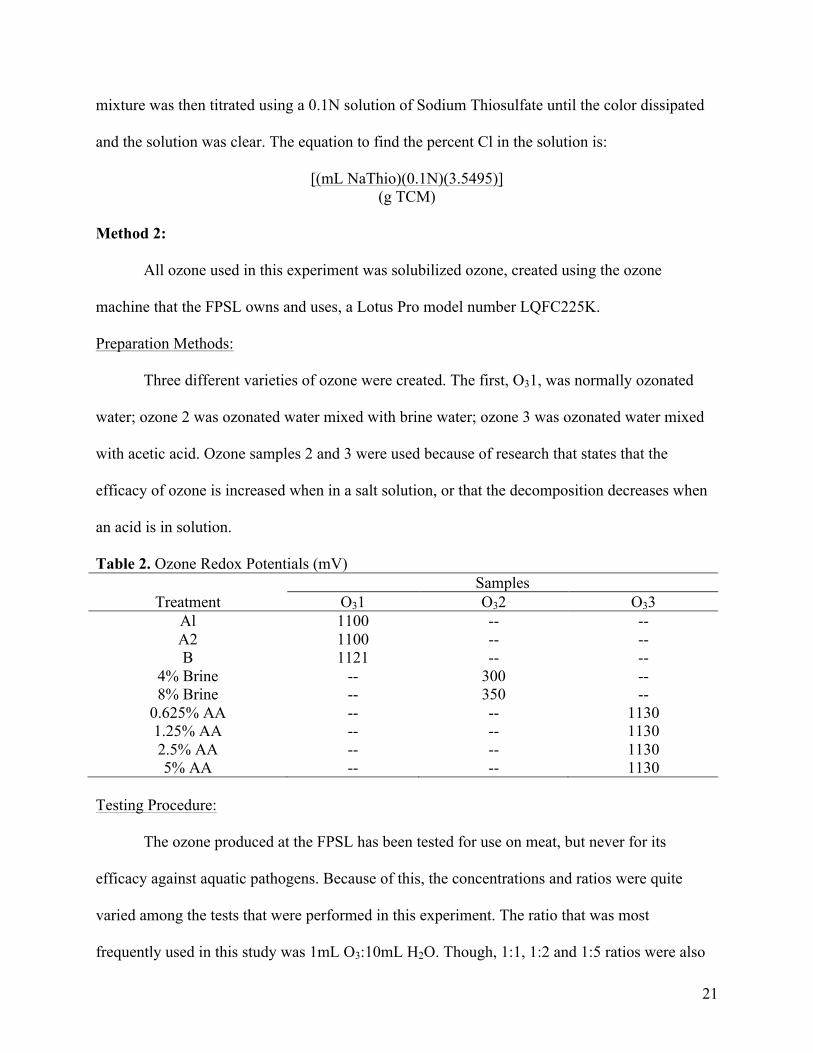
Preparation Methods:
Three different varieties of ozone were created. The first, O31, was normally ozonated
water; ozone 2 was ozonated water mixed with brine water; ozone 3 was ozonated water mixed
with acetic acid. Ozone samples 2 and 3 were used because of research that states that the
efficacy of ozone is increased when in a salt solution, or that the decomposition decreases when
an acid is in solution.
Table 2. Ozone Redox Potentials (mV) Samples
Treatment O31 O32 O33 Al 1100 -- -- A2 1100 -- -- B 1121 -- --
4% Brine -- 300 -- 8% Brine -- 350 --
0.625% AA -- -- 1130 1.25% AA -- -- 1130 2.5% AA -- -- 1130 5% AA -- -- 1130
Testing Procedure:
The ozone produced at the FPSL has been tested for use on meat, but never for its
efficacy against aquatic pathogens. Because of this, the concentrations and ratios were quite
varied among the tests that were performed in this experiment. The ratio that was most
frequently used in this study was 1mL O3:10mL H2O. Though, 1:1, 1:2 and 1:5 ratios were also
22
used to determine the best concentration for total kill.
At the FPSL, ozone concentrations are measured by looking at the oxidation-reduction
(redox) potential of the solution. To determine redox potential of the ozone a pH/ORP meter was
used. The meter can effectively, and accurately, determine the redox potential (ORP) anywhere
from -1999 to 1999 mV (Reed Instruments, 2013) . To determine final efficacy, one of the
plating techniques was used as in Method 1: using the nutrient agar to determine total plate
count.
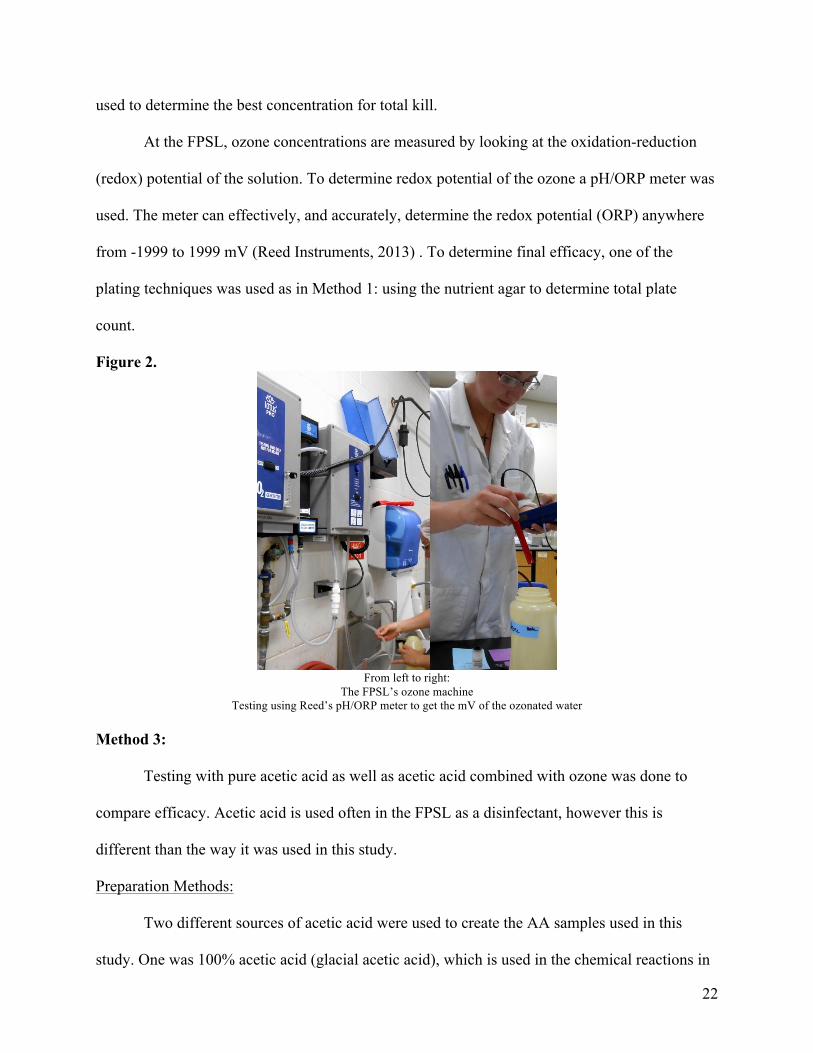
Figure 2.
From left to right:
The FPSL’s ozone machine Testing using Reed’s pH/ORP meter to get the mV of the ozonated water
Method 3:
Testing with pure acetic acid as well as acetic acid combined with ozone was done to
compare efficacy. Acetic acid is used often in the FPSL as a disinfectant, however this is
different than the way it was used in this study.
Preparation Methods:
Two different sources of acetic acid were used to create the AA samples used in this
study. One was 100% acetic acid (glacial acetic acid), which is used in the chemical reactions in
23
the lab, and the other was vinegar, used as a disinfectant.
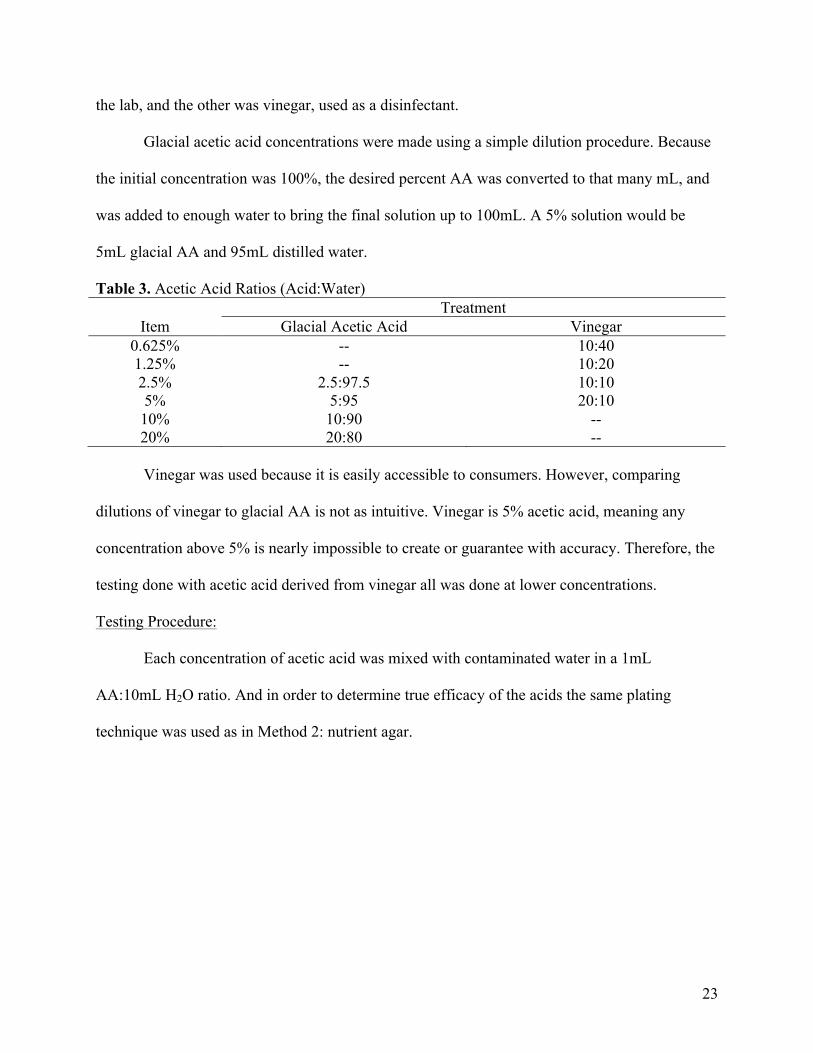
Glacial acetic acid concentrations were made using a simple dilution procedure. Because
the initial concentration was 100%, the desired percent AA was converted to that many mL, and
was added to enough water to bring the final solution up to 100mL. A 5% solution would be
5mL glacial AA and 95mL distilled water.
Table 3. Acetic Acid Ratios (Acid:Water) Treatment
Item Glacial Acetic Acid Vinegar 0.625% -- 10:40 1.25% -- 10:20 2.5% 2.5:97.5 10:10 5% 5:95 20:10 10% 10:90 -- 20% 20:80 --
Vinegar was used because it is easily accessible to consumers. However, comparing
dilutions of vinegar to glacial AA is not as intuitive. Vinegar is 5% acetic acid, meaning any
concentration above 5% is nearly impossible to create or guarantee with accuracy. Therefore, the
testing done with acetic acid derived from vinegar all was done at lower concentrations.
Testing Procedure:
Each concentration of acetic acid was mixed with contaminated water in a 1mL
AA:10mL H2O ratio. And in order to determine true efficacy of the acids the same plating
technique was used as in Method 2: nutrient agar.
24
Results and Discussion
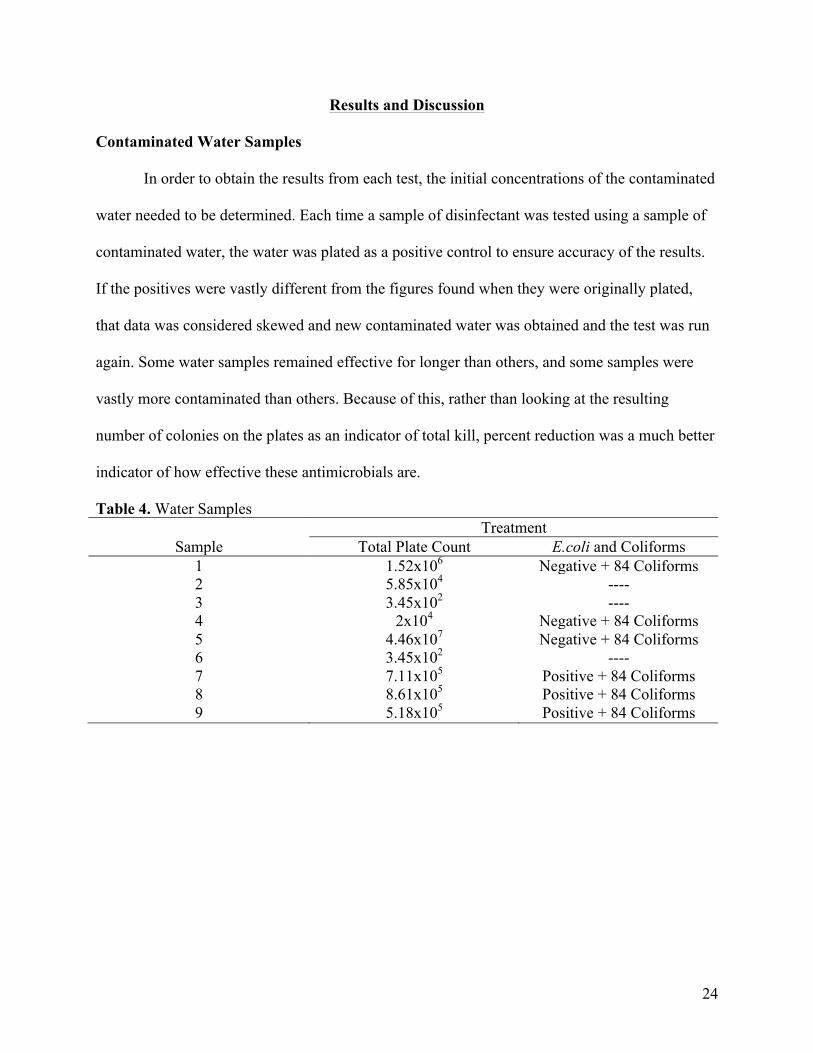
Contaminated Water Samples
In order to obtain the results from each test, the initial concentrations of the contaminated
water needed to be determined. Each time a sample of disinfectant was tested using a sample of
contaminated water, the water was plated as a positive control to ensure accuracy of the results.
If the positives were vastly different from the figures found when they were originally plated,
that data was considered skewed and new contaminated water was obtained and the test was run
again. Some water samples remained effective for longer than others, and some samples were
vastly more contaminated than others. Because of this, rather than looking at the resulting
number of colonies on the plates as an indicator of total kill, percent reduction was a much better
indicator of how effective these antimicrobials are.
Table 4. Water Samples Treatment
Sample Total Plate Count E.coli and Coliforms 1 1.52x10⁶ Negative + 84 Coliforms 2 5.85x10⁴ ---- 3 3.45x10² ---- 4 2x10⁴ Negative + 84 Coliforms 5 4.46x10⁷ Negative + 84 Coliforms 6 3.45x10² ---- 7 7.11x10⁵ Positive + 84 Coliforms 8 8.61x10⁵ Positive + 84 Coliforms 9 5.18x10⁵ Positive + 84 Coliforms
25
Trichloromelamine
Sample 1
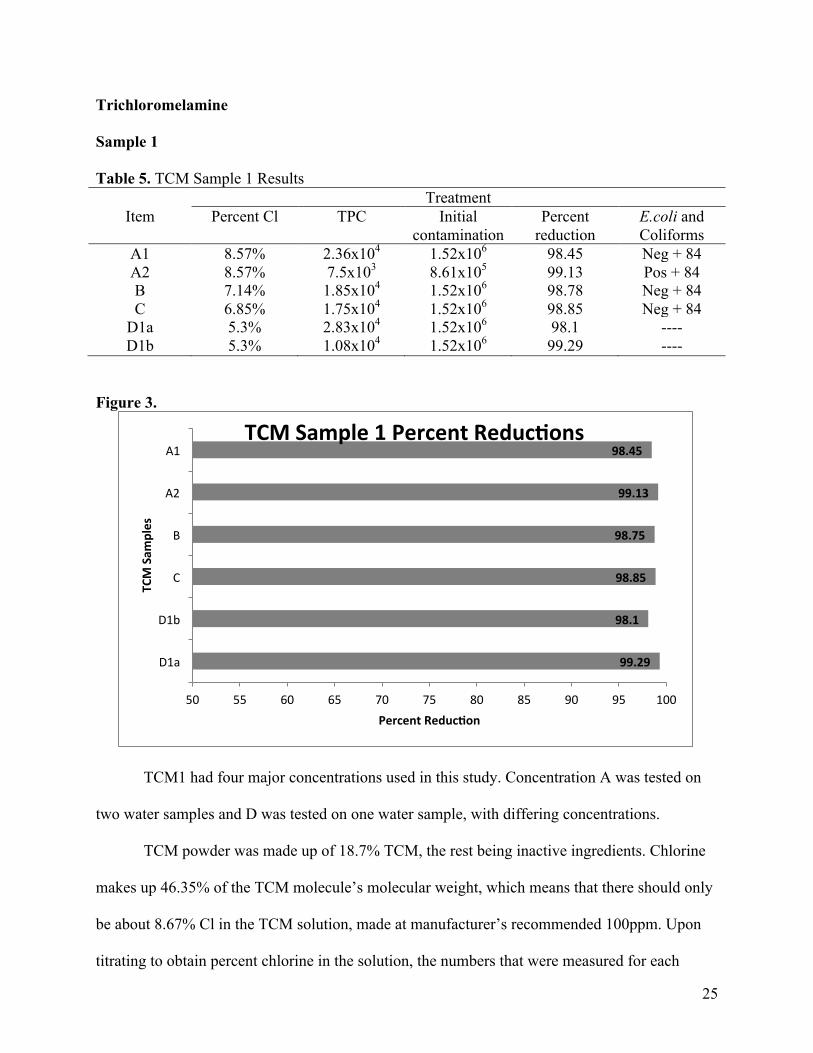
Table 5. TCM Sample 1 Results Treatment
Item Percent Cl TPC Initial contamination
Percent reduction
E.coli and Coliforms
A1 8.57% 2.36x10⁴ 1.52x10⁶ 98.45 Neg + 84 A2 8.57% 7.5x10³ 8.61x10⁵ 99.13 Pos + 84 B 7.14% 1.85x10⁴ 1.52x10⁶ 98.78 Neg + 84 C 6.85% 1.75x10⁴ 1.52x10⁶ 98.85 Neg + 84
D1a 5.3% 2.83x10⁴ 1.52x10⁶ 98.1 ---- D1b 5.3% 1.08x10⁴ 1.52x10⁶ 99.29 ----
Figure 3.
TCM1 had four major concentrations used in this study. Concentration A was tested on
two water samples and D was tested on one water sample, with differing concentrations.
TCM powder was made up of 18.7% TCM, the rest being inactive ingredients. Chlorine
makes up 46.35% of the TCM molecule’s molecular weight, which means that there should only
be about 8.67% Cl in the TCM solution, made at manufacturer’s recommended 100ppm. Upon
titrating to obtain percent chlorine in the solution, the numbers that were measured for each
99.29
98.1
98.85
98.75
99.13
98.45
50 55 60 65 70 75 80 85 90 95 100
D1a
D1b
C
B
A2
A1
Percent Reduc4on
TCM Sam
ples
TCM Sample 1 Percent Reduc4ons
26
individual solution ranged from 2% all the way up to nearly 10%. Since there was very little
consistency with the numbers achieved from one batch of TCM, more titrations were performed.
It was discovered that when the solution was titrated directly after it was made, the percent Cl
was very low. However, it was noted that the percent Cl increased in older solutions, suggesting
that when mixing TCM, the longer the solution sets, the more Cl that solubilizes hence
increasing its effectiveness. So, rather than having all the Cl in solution and available for use all
at once, a small amount of Cl is able to act against the bacteria, and as time goes on and the
bacteria regroup from the initial onslaught of Cl, more Cl is solubilized and is able to be effective
against the bacteria.
TCM1A, made at the EPA recommended strength for effective kill (2.36g in 3800mL
water), had no filtrate upon making of the solution, and was observed to have a percent Cl of
8.57, which was in expected range for a 100ppm solution. Solution B had a percent Cl of 7.14,
C: 6.85 and D: 5.3%. These data are lower than expected for the amount of solubilized TCM.
Solutions B, C and D all had filtrate, meaning that not all of the powder was solubilized in
solution, and this could possibly explain why the percent of Cl in solution was not as high
expected, the reason for which was mentioned before.
The average percent reduction for TCM1 was 98.77%. The best reduction was achieved
with solution D1b, the higher concentration (2mL TCM:10mL H2O), and it was 99.27%. The
lowest was solution D1a (1mL TCM:10mL H2O) at 98.1%. It was the same solution that gave
the highest and lowest percent reduction, the only difference between the two was the ratio of
TCM to water. It is obvious that the more TCM mixed with water, the more effective the TCM
was at killing the waterborne pathogens. Out of all the TCM1 solutions that were tested at the
same ratio (1mL TCM:10mL H2O), the most effective one was TCM1A, with a percent
reduction of 99.13%.
27
TCM1 had a good overall percent reduction as measured by the total plate count, but the
results from the E.coli/coliform test shows that it was unable to completely kill E.coli (as is seen
in TCM1 A2). The holding tanks on recreational vehicles are more than likely to contain fecal
material, a sanitizer that is used to disinfect them must be capable of killing potential pathogens,
the most likely of which would be E.coli. This sample of TCM seems unable to do so. Also, the
presence of coliforms indicates that there are still commonly found bacteria in the tested water.
So, while some of the samples were negative for E.coli that does not mean that the samples were
free from all potentially dangerous bacteria.
28
Sample 2
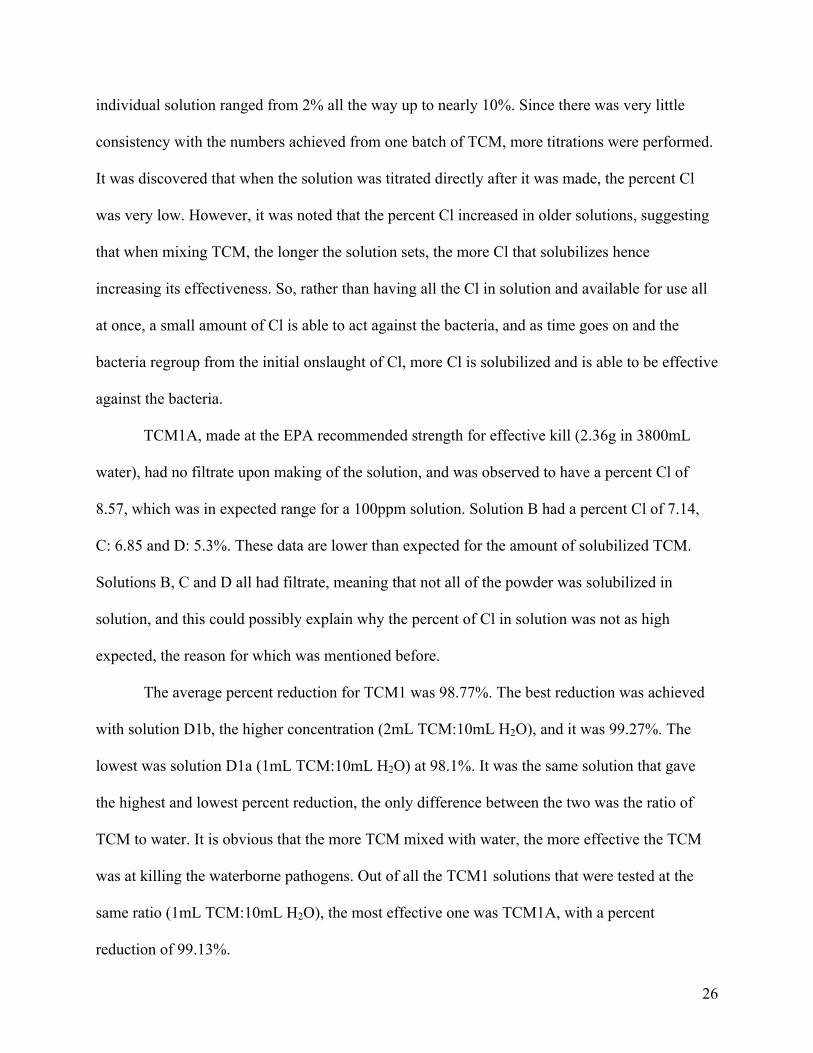
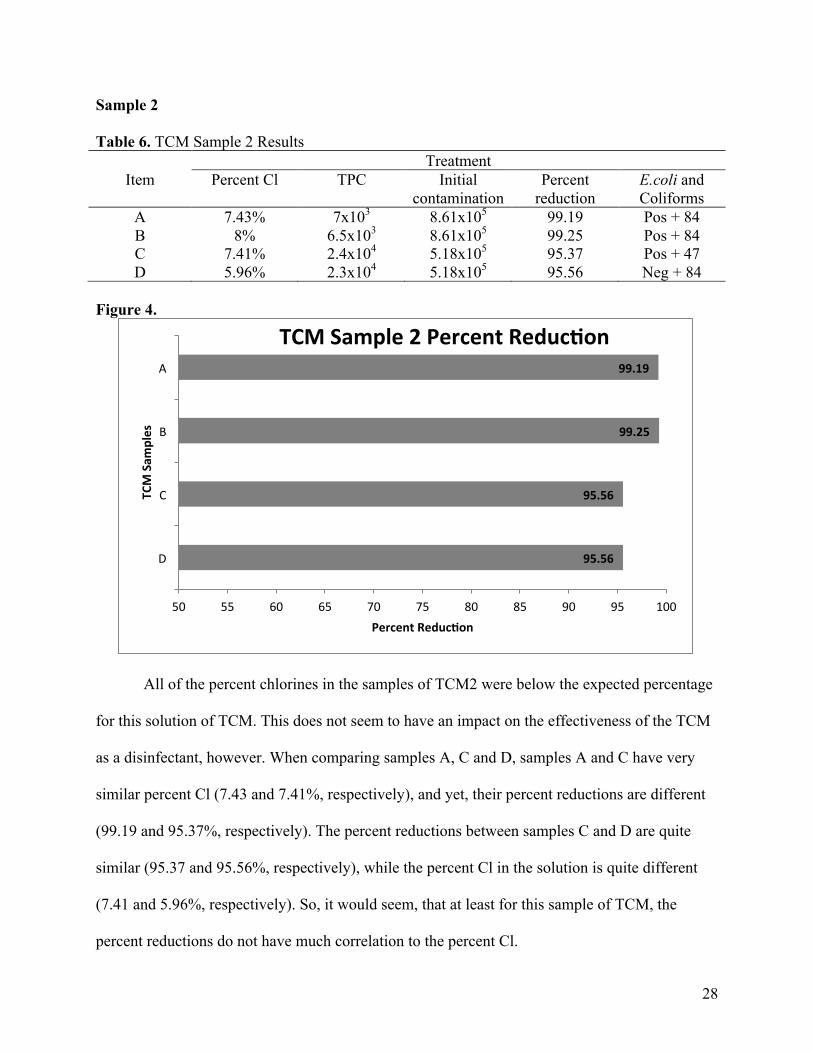
Table 6. TCM Sample 2 Results Treatment
Item Percent Cl TPC Initial contamination
Percent reduction
E.coli and Coliforms
A 7.43% 7x10³ 8.61x10⁵ 99.19 Pos + 84 B 8% 6.5x10³ 8.61x10⁵ 99.25 Pos + 84 C 7.41% 2.4x10⁴ 5.18x10⁵ 95.37 Pos + 47 D 5.96% 2.3x10⁴ 5.18x10⁵ 95.56 Neg + 84
Figure 4.
All of the percent chlorines in the samples of TCM2 were below the expected percentage
for this solution of TCM. This does not seem to have an impact on the effectiveness of the TCM
as a disinfectant, however. When comparing samples A, C and D, samples A and C have very
similar percent Cl (7.43 and 7.41%, respectively), and yet, their percent reductions are different
(99.19 and 95.37%, respectively). The percent reductions between samples C and D are quite
similar (95.37 and 95.56%, respectively), while the percent Cl in the solution is quite different
(7.41 and 5.96%, respectively). So, it would seem, that at least for this sample of TCM, the
percent reductions do not have much correlation to the percent Cl.
95.56
95.56
99.25
99.19
50 55 60 65 70 75 80 85 90 95 100
D
C
B
A
Percent Reduc4on
TCM Sam
ples
TCM Sample 2 Percent Reduc4on
29
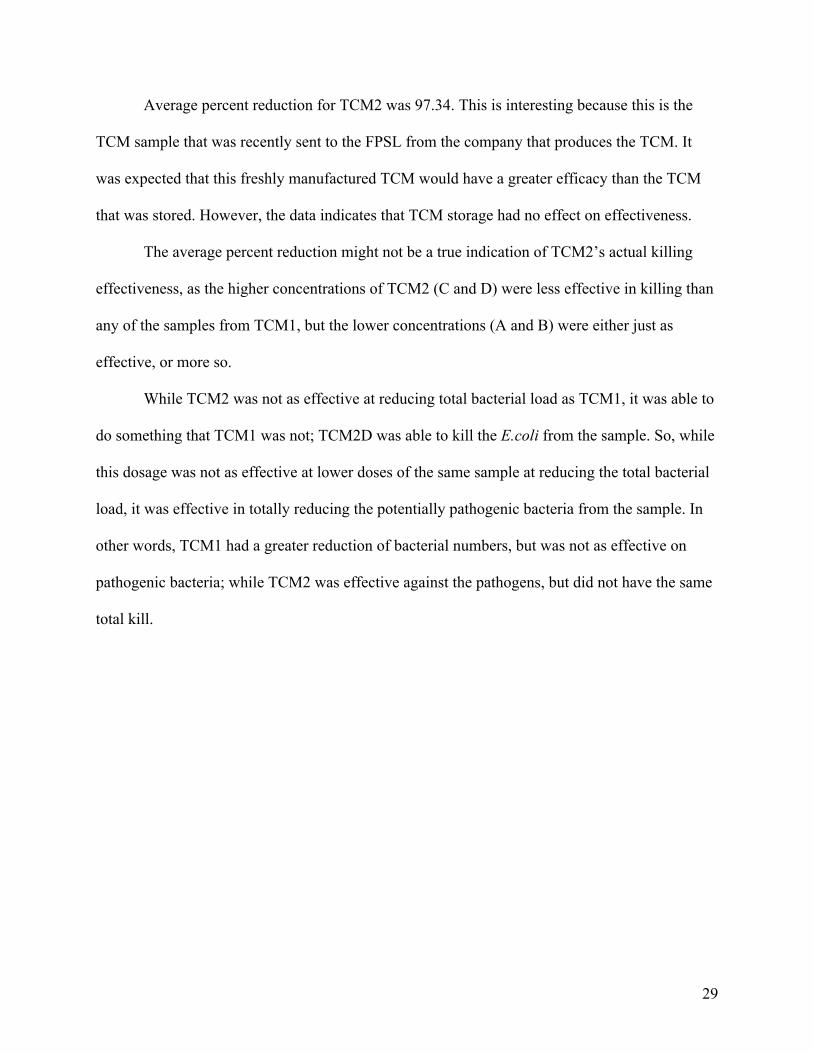
Average percent reduction for TCM2 was 97.34. This is interesting because this is the
TCM sample that was recently sent to the FPSL from the company that produces the TCM. It
was expected that this freshly manufactured TCM would have a greater efficacy than the TCM
that was stored. However, the data indicates that TCM storage had no effect on effectiveness.
The average percent reduction might not be a true indication of TCM2’s actual killing
effectiveness, as the higher concentrations of TCM2 (C and D) were less effective in killing than
any of the samples from TCM1, but the lower concentrations (A and B) were either just as
effective, or more so.
While TCM2 was not as effective at reducing total bacterial load as TCM1, it was able to
do something that TCM1 was not; TCM2D was able to kill the E.coli from the sample. So, while
this dosage was not as effective at lower doses of the same sample at reducing the total bacterial
load, it was effective in totally reducing the potentially pathogenic bacteria from the sample. In
other words, TCM1 had a greater reduction of bacterial numbers, but was not as effective on
pathogenic bacteria; while TCM2 was effective against the pathogens, but did not have the same
total kill.
30
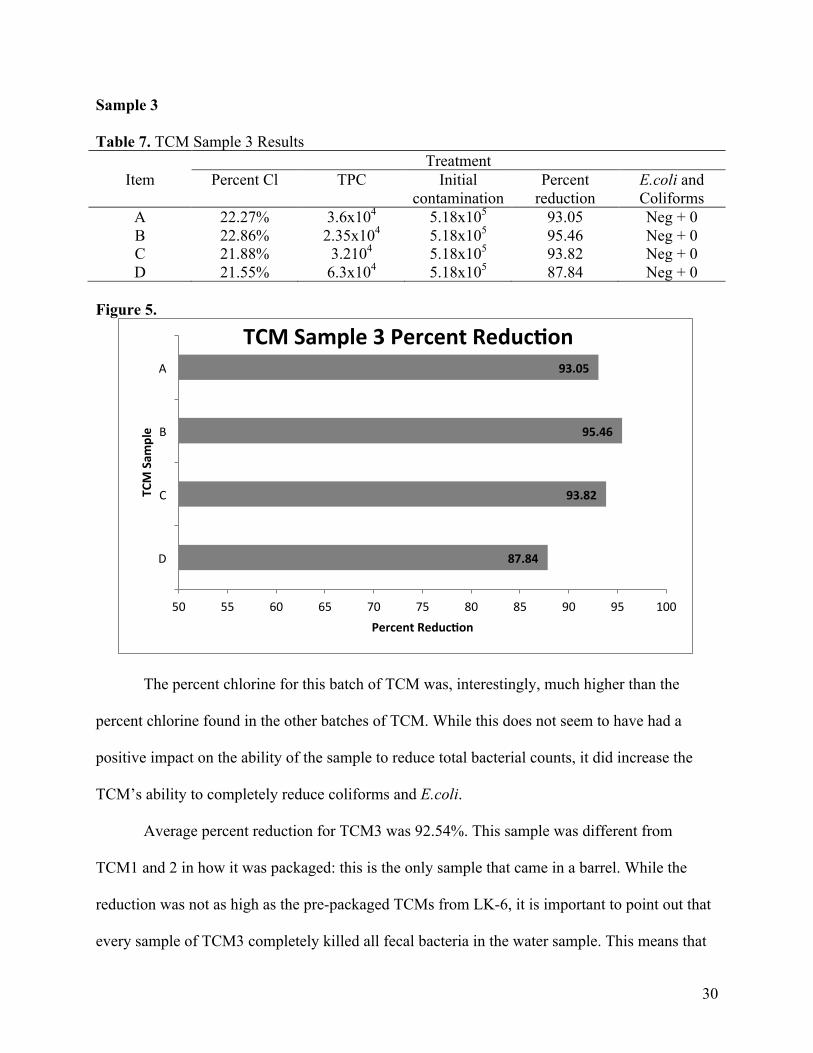
Sample 3
Table 7. TCM Sample 3 Results Treatment
Item Percent Cl TPC Initial contamination
Percent reduction
E.coli and Coliforms
A 22.27% 3.6x10⁴ 5.18x10⁵ 93.05 Neg + 0 B 22.86% 2.35x10⁴ 5.18x10⁵ 95.46 Neg + 0 C 21.88% 3.2104 5.18x10⁵ 93.82 Neg + 0 D 21.55% 6.3x10⁴ 5.18x10⁵ 87.84 Neg + 0
Figure 5.
The percent chlorine for this batch of TCM was, interestingly, much higher than the
percent chlorine found in the other batches of TCM. While this does not seem to have had a
positive impact on the ability of the sample to reduce total bacterial counts, it did increase the
TCM’s ability to completely reduce coliforms and E.coli.
Average percent reduction for TCM3 was 92.54%. This sample was different from
TCM1 and 2 in how it was packaged: this is the only sample that came in a barrel. While the
reduction was not as high as the pre-packaged TCMs from LK-6, it is important to point out that
every sample of TCM3 completely killed all fecal bacteria in the water sample. This means that
87.84
93.82
95.46
93.05
50 55 60 65 70 75 80 85 90 95 100
D
C
B
A
Percent Reduc4on
TCM Sam
ple
TCM Sample 3 Percent Reduc4on
31
while TCM3 was not as effective in killing all the bacteria in the sample, it was more effective in
killing the potentially pathogenic bacteria.
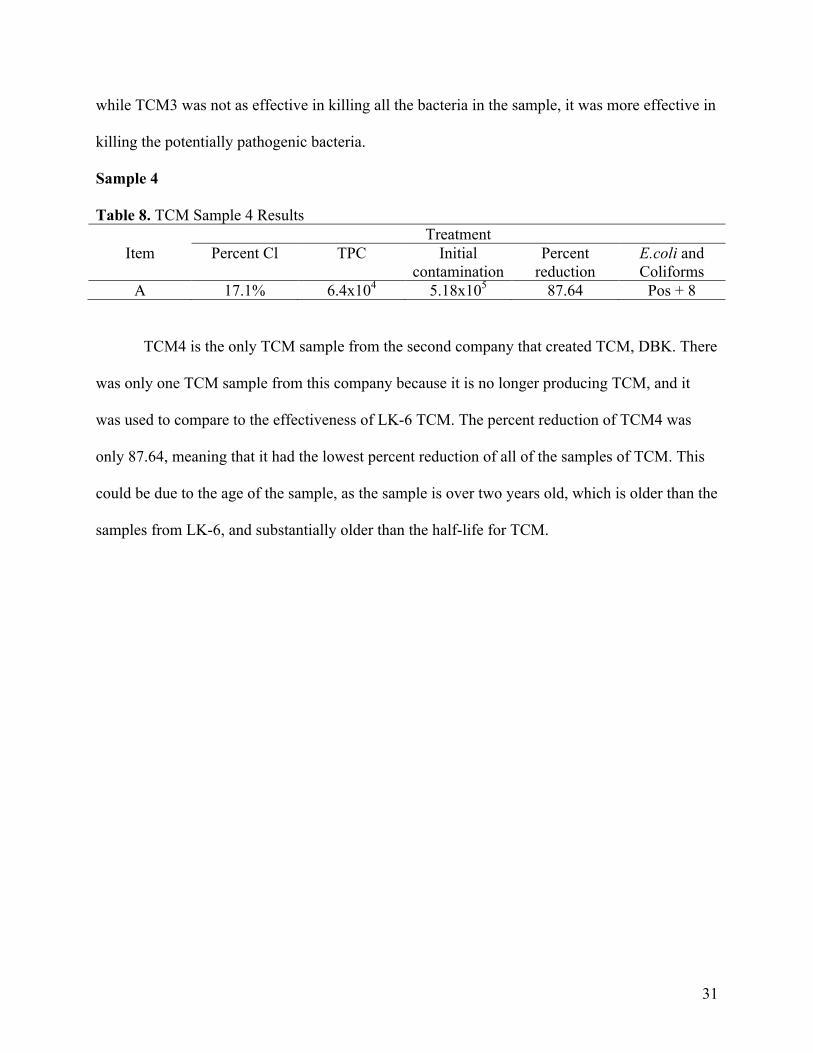
Sample 4
Table 8. TCM Sample 4 Results Treatment
Item Percent Cl TPC Initial contamination
Percent reduction
E.coli and Coliforms
A 17.1% 6.4x10⁴ 5.18x10⁵ 87.64 Pos + 8
TCM4 is the only TCM sample from the second company that created TCM, DBK. There
was only one TCM sample from this company because it is no longer producing TCM, and it
was used to compare to the effectiveness of LK-6 TCM. The percent reduction of TCM4 was
only 87.64, meaning that it had the lowest percent reduction of all of the samples of TCM. This
could be due to the age of the sample, as the sample is over two years old, which is older than the
samples from LK-6, and substantially older than the half-life for TCM.
32
Ozone
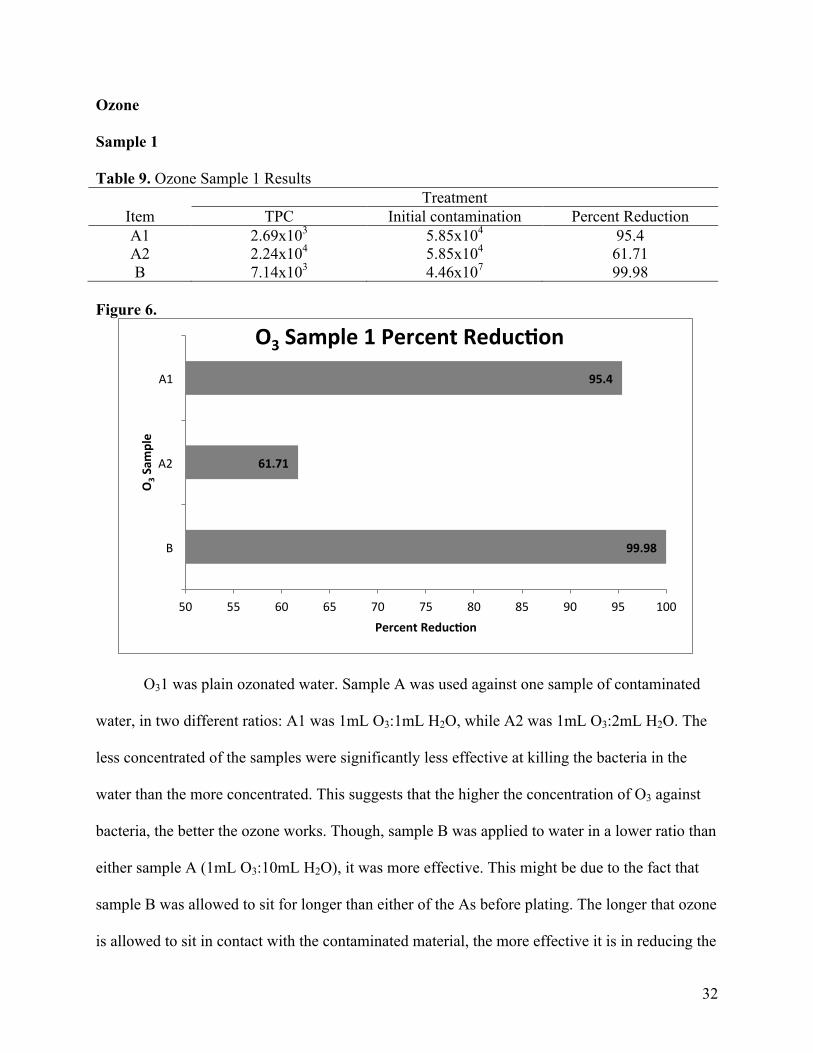
Sample 1
Table 9. Ozone Sample 1 Results Treatment
Item TPC Initial contamination Percent Reduction A1 2.69x10³ 5.85x10⁴ 95.4 A2 2.24x10⁴ 5.85x10⁴ 61.71
B 7.14x10³ 4.46x10⁷ 99.98 Figure 6.
O31 was plain ozonated water. Sample A was used against one sample of contaminated
water, in two different ratios: A1 was 1mL O3:1mL H2O, while A2 was 1mL O3:2mL H2O. The
less concentrated of the samples were significantly less effective at killing the bacteria in the
water than the more concentrated. This suggests that the higher the concentration of O3 against
bacteria, the better the ozone works. Though, sample B was applied to water in a lower ratio than
either sample A (1mL O3:10mL H2O), it was more effective. This might be due to the fact that
sample B was allowed to sit for longer than either of the As before plating. The longer that ozone
is allowed to sit in contact with the contaminated material, the more effective it is in reducing the
99.98
61.71
95.4
50 55 60 65 70 75 80 85 90 95 100
B
A2
A1
Percent Reduc4on
O3 S
ample
O3 Sample 1 Percent Reduc4on
33
bacterial count of the sample.
Sample 2
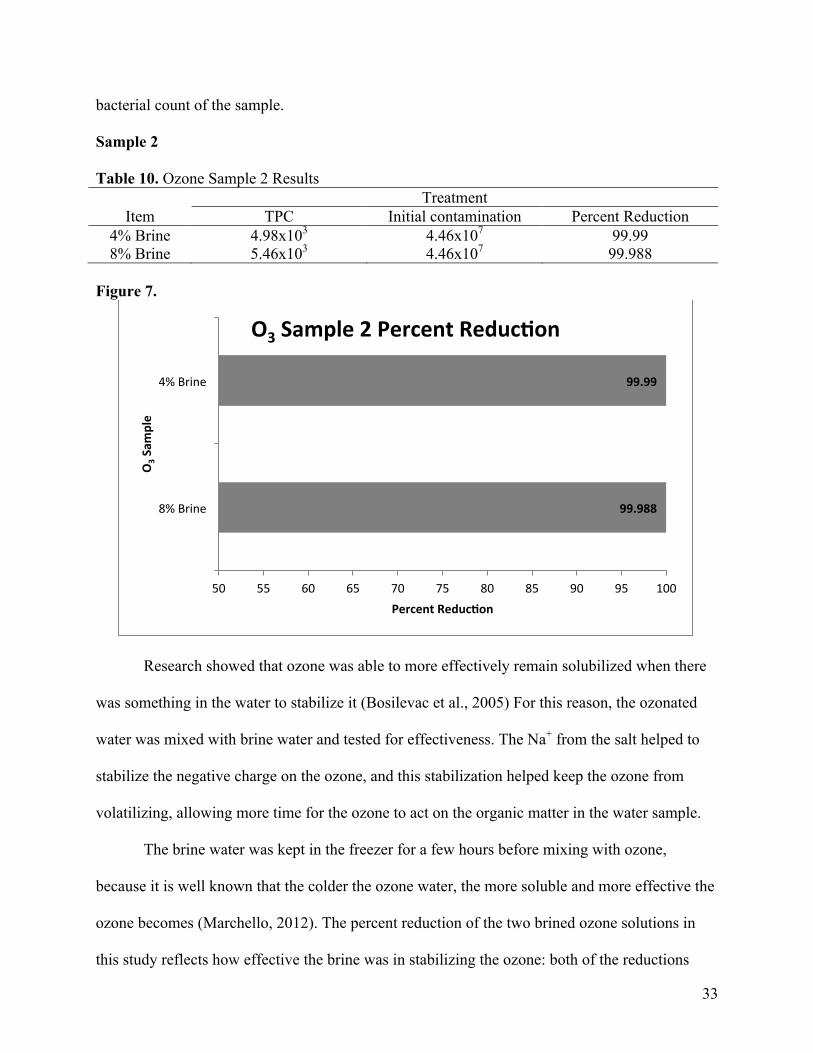
Table 10. Ozone Sample 2 Results Treatment
Item TPC Initial contamination Percent Reduction 4% Brine 4.98x10³ 4.46x10⁷ 99.99 8% Brine 5.46x10³ 4.46x10⁷ 99.988
Figure 7.
Research showed that ozone was able to more effectively remain solubilized when there
was something in the water to stabilize it (Bosilevac et al., 2005) For this reason, the ozonated
water was mixed with brine water and tested for effectiveness. The Na+ from the salt helped to
stabilize the negative charge on the ozone, and this stabilization helped keep the ozone from
volatilizing, allowing more time for the ozone to act on the organic matter in the water sample.
The brine water was kept in the freezer for a few hours before mixing with ozone,
because it is well known that the colder the ozone water, the more soluble and more effective the
ozone becomes (Marchello, 2012). The percent reduction of the two brined ozone solutions in
this study reflects how effective the brine was in stabilizing the ozone: both of the reductions
99.988
99.99
50 55 60 65 70 75 80 85 90 95 100
8% Brine
4% Brine
Percent Reduc4on
O3 S
ample
O3 Sample 2 Percent Reduc4on
34
were over 99.9%.
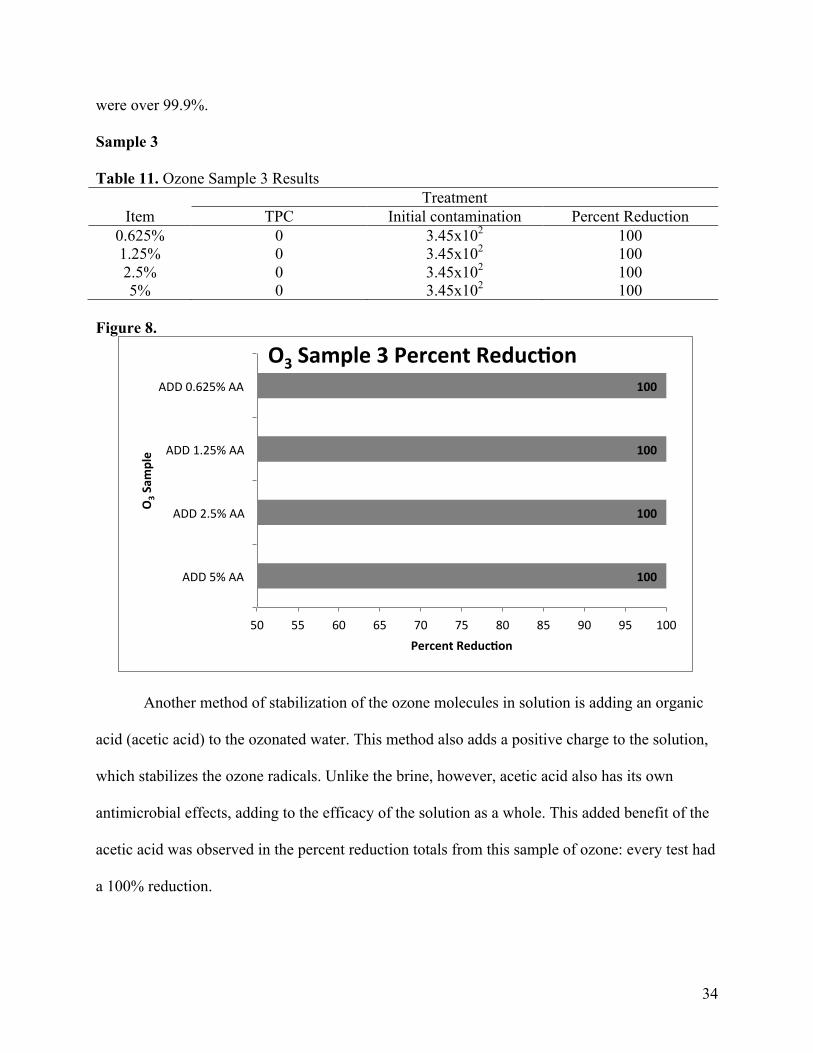
Sample 3 Table 11. Ozone Sample 3 Results
Treatment Item TPC Initial contamination Percent Reduction
0.625% 0 3.45x10² 100 1.25% 0 3.45x10² 100 2.5% 0 3.45x10² 100
5% 0 3.45x10² 100 Figure 8.
Another method of stabilization of the ozone molecules in solution is adding an organic
acid (acetic acid) to the ozonated water. This method also adds a positive charge to the solution,
which stabilizes the ozone radicals. Unlike the brine, however, acetic acid also has its own
antimicrobial effects, adding to the efficacy of the solution as a whole. This added benefit of the
acetic acid was observed in the percent reduction totals from this sample of ozone: every test had
a 100% reduction.
100
100
100
100
50 55 60 65 70 75 80 85 90 95 100
ADD 5% AA
ADD 2.5% AA
ADD 1.25% AA
ADD 0.625% AA
Percent Reduc4on
O3 S
ample
O3 Sample 3 Percent Reduc4on
35
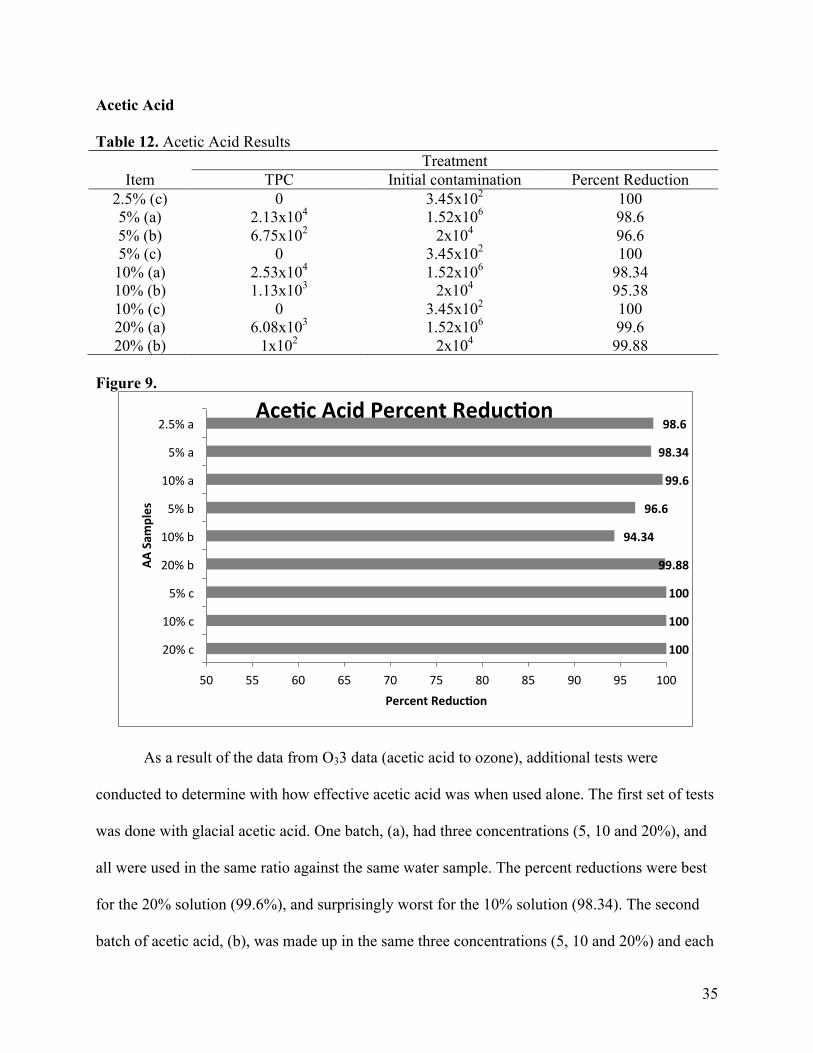
Acetic Acid
Table 12. Acetic Acid Results Treatment
Item TPC Initial contamination Percent Reduction 2.5% (c) 0 3.45x10² 100 5% (a) 2.13x10⁴ 1.52x10⁶ 98.6 5% (b) 6.75x10² 2x10⁴ 96.6 5% (c) 0 3.45x10² 100 10% (a) 2.53x10⁴ 1.52x10⁶ 98.34 10% (b) 1.13x10³ 2x10⁴ 95.38 10% (c) 0 3.45x10² 100 20% (a) 6.08x10³ 1.52x10⁶ 99.6
20% (b) 1x10² 2x10⁴ 99.88 Figure 9.
As a result of the data from O33 data (acetic acid to ozone), additional tests were
conducted to determine with how effective acetic acid was when used alone. The first set of tests
was done with glacial acetic acid. One batch, (a), had three concentrations (5, 10 and 20%), and
all were used in the same ratio against the same water sample. The percent reductions were best
for the 20% solution (99.6%), and surprisingly worst for the 10% solution (98.34). The second
batch of acetic acid, (b), was made up in the same three concentrations (5, 10 and 20%) and each
100
100
100
99.88
94.34
96.6
99.6
98.34
98.6
50 55 60 65 70 75 80 85 90 95 100
20% c
10% c
5% c
20% b
10% b
5% b
10% a
5% a
2.5% a
Percent Reduc4on
AA Sam
ples
Ace4c Acid Percent Reduc4on
36
of these concentrations was used in the same ratio against the same contaminated water sample,
though a different contaminated sample than was used with (a) than used with (b). Sample (b)
had similar results to the first sample, the 20% had the most effective percent reduction
(99.88%), and the 10% had the least effective percent reduction (94.38). The reason that the 10%
solution is less effective at killing the bacteria than the less concentrated 5% is unknown. It
should have been more effective because there was more acid in solution to interact with, and
disrupt, the bacteria. The final batch, (c), was the most effective in reducing the bacterial count:
all three concentrations (2.5, 5 and 10) achieved total kill. This effective reduction was probably
due to the initial contamination of the water, which was quite a bit lower than the other water
samples. This suggests that when initial water contamination levels are lower, lower
concentrations of disinfectants are needed in order to achieve complete percent reduction.
37
Vinegar
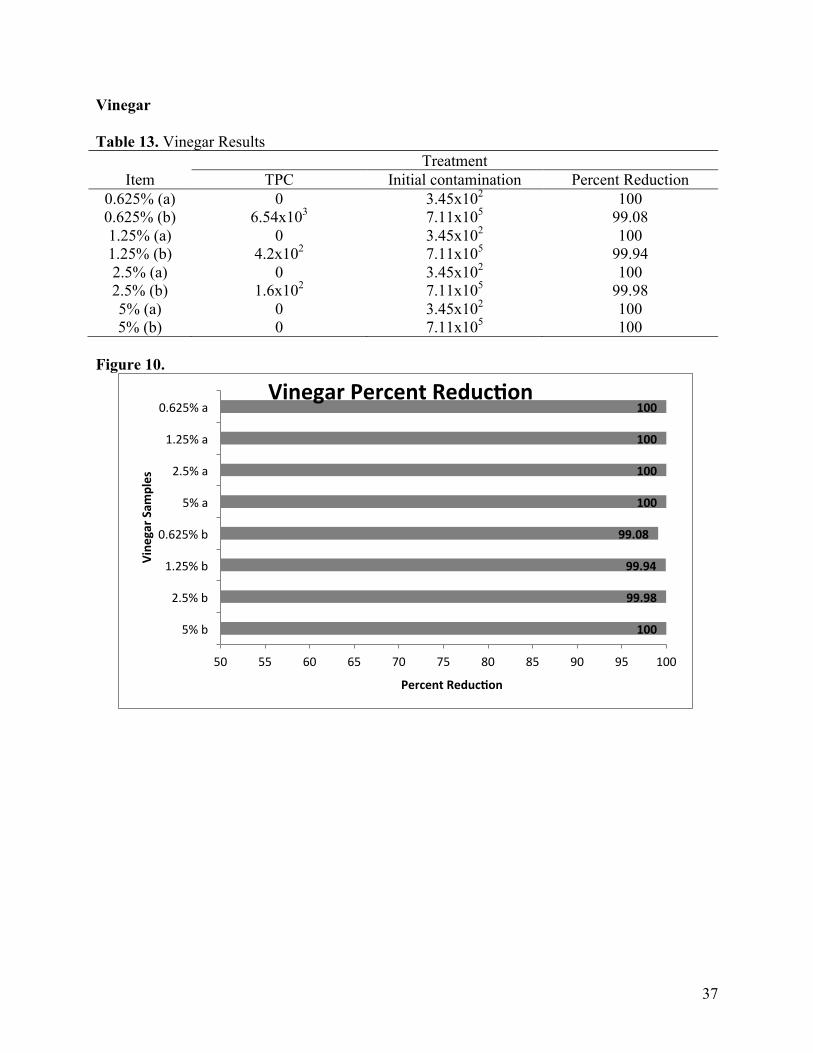
Table 13. Vinegar Results Treatment
Item TPC Initial contamination Percent Reduction 0.625% (a) 0 3.45x10² 100 0.625% (b) 6.54x10³ 7.11x10⁵ 99.08 1.25% (a) 0 3.45x10² 100 1.25% (b) 4.2x10² 7.11x10⁵ 99.94 2.5% (a) 0 3.45x10² 100 2.5% (b) 1.6x10² 7.11x10⁵ 99.98 5% (a) 0 3.45x10² 100
5% (b) 0 7.11x10⁵ 100 Figure 10.
100
99.98
99.94
99.08
100
100
100
100
50 55 60 65 70 75 80 85 90 95 100
5% b
2.5% b
1.25% b
0.625% b
5% a
2.5% a
1.25% a
0.625% a
Percent Reduc4on
Vine
gar S
amples
Vinegar Percent Reduc4on
38
Figure 11.
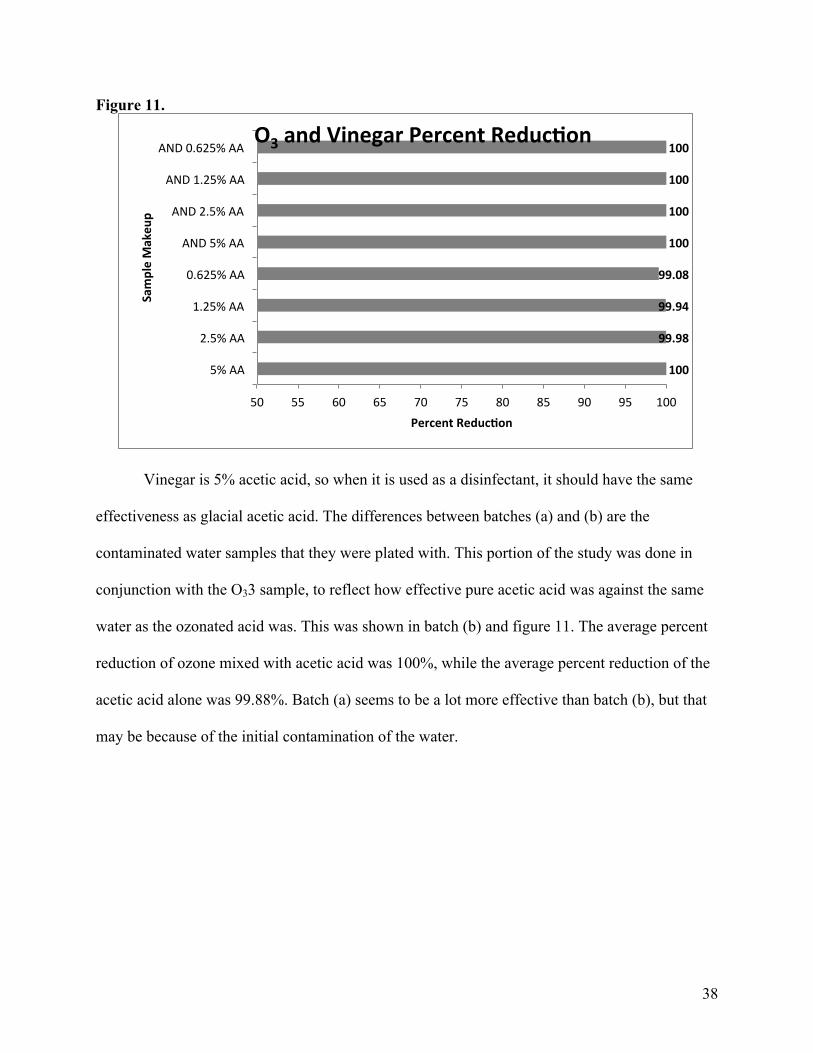
Vinegar is 5% acetic acid, so when it is used as a disinfectant, it should have the same
effectiveness as glacial acetic acid. The differences between batches (a) and (b) are the
contaminated water samples that they were plated with. This portion of the study was done in
conjunction with the O33 sample, to reflect how effective pure acetic acid was against the same
water as the ozonated acid was. This was shown in batch (b) and figure 11. The average percent
reduction of ozone mixed with acetic acid was 100%, while the average percent reduction of the
acetic acid alone was 99.88%. Batch (a) seems to be a lot more effective than batch (b), but that
may be because of the initial contamination of the water.
100
99.98
99.94
99.08
100
100
100
100
50 55 60 65 70 75 80 85 90 95 100
5% AA
2.5% AA
1.25% AA
0.625% AA
AND 5% AA
AND 2.5% AA
AND 1.25% AA
AND 0.625% AA
Percent Reduc4on
Sample Makeu
p O3 and Vinegar Percent Reduc4on
39
Figure 12.
99.88
98.6
100
99.989
85.7
87.64
92.54
97.34
98.77
80 82 84 86 88 90 92 94 96 98 100
Vinegar
Ace;c Acid
O33
O32
O31
TCM4
TCM3
TCM2
TCM1
Percent Reduc4on
Samples
Average Percent Reduc4on
40
Conclusions
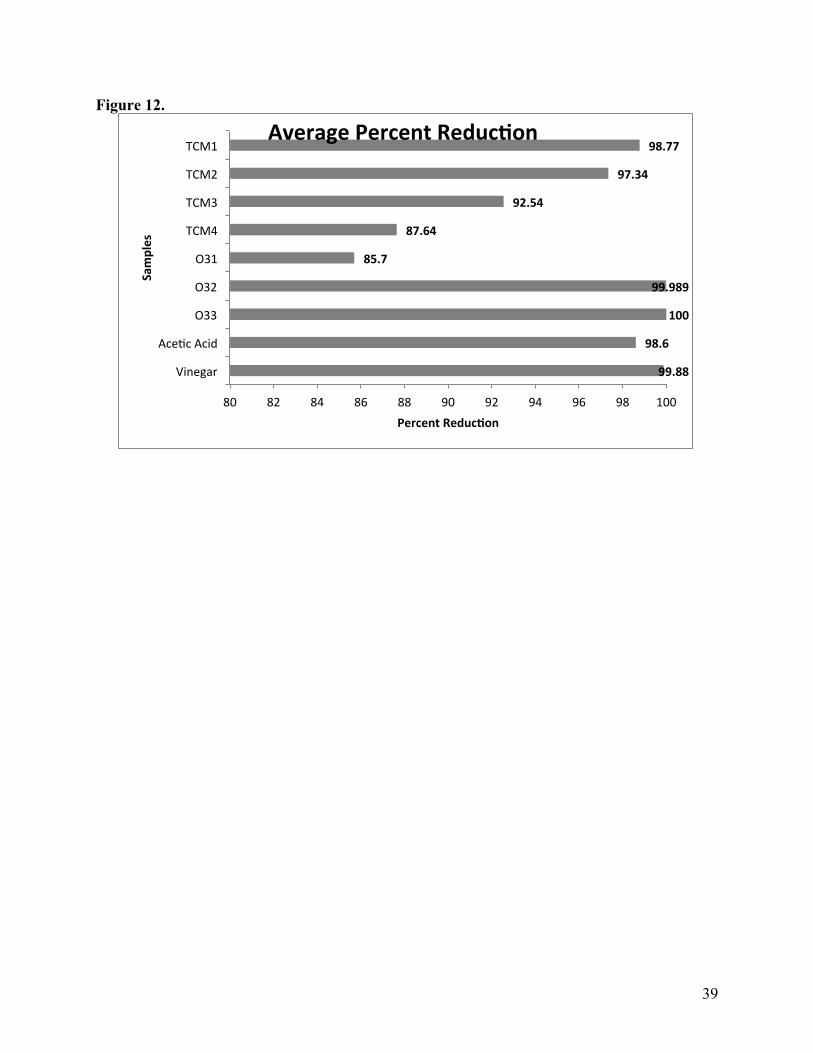
After comparing the average percent reductions of all of the samples tested, the most
effective disinfectant is O33, or the sample of ozone that is mixed with acetic acid. O32, the
ozonated water/brine mixture showed to be the second most effective mixture, barely less
effective than the second ozone mixture. All but one of the TCM samples were less effective
than O32, O33, the glacial acetic acid and the vinegar. However, as was previously mentioned,
the average percent reduction might not be the best indicator of how well these disinfectants
work. First, it does not show how effective the disinfectants were against waterborne pathogens,
and second because it does not show the differences in dosage as well as different variables, such
as exposure time.
Out of all the samples of TCM that were tested, TCM1 had the best average total kill, as
well as the highest individual percent reduction of all the TCM types. However, TCM1 was
unable to kill E.coli, but TCM3 killed E. coli. TCM3 was the only one of the samples that was
able to kill E.coli, suggesting that it actually had the highest efficacy of all the TCM samples. For
the intent of this study, this indicates that TCM3 would be the most valuable to consumers. More
testing needs to be done, however, to see if the bacterial load remaining after disinfection with
TCM3 is within limits for recycled water, and if not, how to best increase the efficacy of the
TCM.
More testing also needs to be done with respect to the percent reduction of each TCM
sample over time, to see if the chlorine is released slowly over time in higher concentrations of
TCM. This would establish a minimum contact time, so that if consumers ever do use this
product, they would have an idea of how long it would take for the product to fully disinfect their
holding tank.
When it comes to ozone, the most effective mixture was the ozone and acetic acid mixed.
41
This is not only due to the fact that the acid stabilized the ozone in solution, allowing it to work
for longer on the bacteria before it is volatilized, but also with the fact that ozone and acid are
both disinfectants. However, the solution that appears to be the most promising out of the ozone
mixtures is the ozonated brine water. The brine water not only stabilizes the ozone but also
increases its efficacy, rather than adding another antimicrobial to the mixture. It is true that salt
has bacteriostatic capabilities, it does not have bactericidal abilities as ozone. This suggests that
more research is needed to see how actually ozonating brine water, rather than mixing ozonated
water with brine water, would impact the ability of the ozone to reduce total contamination.
In the acetic acid trials, it is interesting to note that the vinegar (lower percent acetic acid)
was more effectively able to kill the bacteria than the glacial acetic acid (100% acetic acid). It is
unclear why, but may be considered a good sign for consumers, because vinegar is substantially
cheaper and easier to obtain than glacial acetic acid. It is important to note that the most effective
application of acetic acid was when it was used in conjunction with ozone. The two components
worked synergistically as well as complimentarily in their killing action.
In all of these trials, it is clear that not one antimicrobial works against every type of
bacteria, and much more testing is needed in order to find out how effective both TCM and
ozone are on waterborne pathogens. From the results of this study it may be concluded that both
TCM and ozone are able to reduce the total bacterial load of water samples. Additional research
to answer the following question is recommended: how long the water tanks remain disinfected
for, if the disinfectant lingers on the walls of the tank, and if that is detrimental to the health of
the people using the water from that tank, or is that merely a method the disinfectants use to keep
the tank clean. Also, how long the tank is clean for needs to be addressed, because no matter how
effective of a disinfectant it is, if the tank immediately regains its bacterial load, it is an
ineffective disinfectant.
42
Works Cited
Bialoszewski, D., M. Czajkowska, E. Bocian, B. Bukowska, B. Sokol-Leszczynska, and S.
Tyski. 2010. Antimicrobial activity of ozonated water. Medical Science Monitor. 16(9):
MT71-MT75.
Bialoszewski, D., A. Pietruczuk-Padzik, A. Kalicinska, E. Bocian, M. Czajkowska, B. Bukowska
et al. 2011. Activity of ozonated water and ozone against staphylococcus aureus and
pseudomonas aeruginosa biofilms. Medical Science Monitor. 17(11): 339-344.
BioControl. 2013. SimPlate.2013(January 30): 1.
Bosilevac, J. M., S. D. Shackelford, D. M. Brichta, and M. Koohmaraie. 2005. Efficacy of
ozonated and electrolyzed oxidative waters to decontaminate hides of cattle before
slaughter. Journal of Food Protection. 68(7): 1393-8.
Gardoni, D., A. Vailati, and R. Canziani. 2012. Decay of ozone in water: A review. Ozone:
Science & Engineering. 34(4): 233-242.
In, Y. W., J. J. Kim, S. W. Oh, and H. J. Kim. 2013. Antimicrobial activities of acetic acid, citric
acid and lactic acid against shigella species. Journal of Food Safety. 33(1): 79-85.
Iofina Chemical Inc. 2009. Trichloromelamine (TCM).2012: 1.
Kany, F., E. El-Feky, and D. Alnughaimish. 2012. The antimicrobial effect of commercial acetic
acid against enterococcus faecalis. Journal of Applied Sciences Research. 8(5): 2807-2811.
Kim, J. G., A. E. Yousef, and S. Dave. 1999. Application of ozone for enhancing the
microbiological safety and quality of foods: A review. Journal of Food Protection. 62(9):
1071-87.
Liberti, L., M. Notarnicola, and A. Lopez. 2000. Advanced treatment for municipal wastewater
reuse in agriculture. III - ozone disinfection. Ozone: Science & Engineering. 22(2): 151-166.
Luttrell, W. E. 2012. Acetic acid. Journal of Chemical Health & Safety. 19(6)
43
Marchello, J. 2012. Personal interview.
McAnulty, J. M., G. L. Rubin, C. T. Carvan, E. J. Huntley, G. Grohmann, and R. Hunter. 1993.
An outbreak of norwalk-like gastroenteritis associated with contaminated drinking water at
a caravan park. Australian Journal of Public Health. 17(1): 36-41.
Penru, Y., A. R. Guastalli, S. Esplugas, and S. Baig. 2013. Disinfection of seawater: Application
of UV and ozone. Ozone: Science & Engineering. 35(1): 63-70.
Reed Instruments. 2013. pH/ORP meter and data logger.2013: 4.
Reynolds, K. A., K. D. Mena, and C. P. Gerba. 2008. Risk of waterborne illness via drinking
water in the united states. Reviews of Environmental Contamination and Toxicology. 192:
117-58.
Rhee, M. S., S. Y. Lee, R. H. Dougherty, and D. H. Kang. 2003. Antimicrobial effects of
mustard flour and acetic acid against escherichia coli O157:H7, listeria monocytogenes, and
salmonella enterica serovar typhimurium. Applied and Environmental Microbiology. 69(5):
2959-63.
Rositano, J., B. C. Nicholson, and P. Pieronne. 1998. Destruction of cyanobacterial toxins by
ozone. Ozone: Science & Engineering. 20(3): 223-238.
Toze, S. 2006. Water reuse and health risks — real vs. perceived. DES Desalination. 187(1): 41-
51.
United States Environmental Protection Agency. 2005. Reregistration eligibility decision for
trichloromelamine. 2012: 64.
United States Environmental Protection Agency. 1999. Wastewater technology fact sheet ozone
disinfection.