Embed Size (px)
Citation preview
i
PERCEPTIONS OF INFORMAL LOCAL TRADERS ON THE INFLUENCE OF
EMERGING MARKETS: UMLAZI AND KWA-MASHU TOWNSHIPS
By
Machawe Victor Dlamini
202 522 561
A dissertation submitted in fulfilment of the requirements for the degree of
Master of Commence
Supply Chain Management
College of Law and Management Studies
School of Management, Information Technology and Governance
Supervisor: Dr. T. P. Mbhele
Westville Campus
2015

ii
DECLARATION
I Machawe Victor Dlamini do hereby declare that;
(i) The research reported in this thesis, except where otherwise indicated, it is my original research.
(ii) This thesis has not been submitted for any degree or examination at any other university.
(iii) The thesis does not contain other persons’ data, pictures, graphs or other information, unless
specifically acknowledged as being sourced from other persons.
(iv) This thesis does not contain other persons’ writing, unless specifically acknowledged as being
sourced from other researchers. Where other written sources have been quoted then:
a. Their words have been re-written but the general information attributed to them has been
referenced;
b. Where their exact words have been used, their writing has been placed inside quotation
marks, and referenced.
(v) Where I have reproduced a publication of which I am author, co-author or editor, I have
indicated in detail which part of the publication was actually written by myself alone and have
fully referenced such publications.
(vi) This thesis does not contain text, graphics or tables copied and pasted from the Internet, unless
specifically acknowledged, and the source being detailed in the thesis and in the References
section.
Signed: ....................................................

iii
ACKNOWLEDGEMENTS
To all those who have given me their undivided attention and precious time throughout this
project, I really appreciate your support. To my supervisor, Dr T.P Mbhele, for his
overwhelming support and constructive guidance, I really appreciate your supervision and
attention to detail which went a long way in ensuring the success of this project. To my wife,
Minenhle and the boys Sicalo and Nchubeko, I cannot thank you enough for your support and
most importantly, for allowing me the time I had to spend away from you guys on weekends
and weekday nights. Thank you so much and God bless you all.
To all the retailers who wholeheartedly gave of their time and information, this project could
not have been completed without your involvement; thank you so much and God bless.
iv
ABSTRACT
Mall development in South African townships has increased in recent times as large chains
strive to increase their profitability. The emergence of township malls and suppliers’ expansion
into the townships has the potential to create jobs and improve the quality of goods and
services. However, it is important to note that these developments could negatively affect
informal township traders. While the expansion of mainstream retailers into South African
townships offers business opportunities and more choice to consumers, it also threatens to
displace traditional local informal traders. Informal local traders are individuals who act as
distribution channels that focus on moving products at a small scale, while formal retailers are
large chain stores that provide a wide variety of goods and products in bulk and breaking bulk.
Emerging markets are characterized by an increase in personal disposable income among
previously disadvantaged groups. This study therefore, explored the effects of value-creating
supply chain distribution systems and the perceptions of informal local traders in emerging
markets in the two largest townships in KwaZulu-Natal province, Umlazi and Kwa-Mashu.
Four key objectives underpinned this study: to explore informal township traders’ perceptions
of the effects of value-creation supply chain distribution systems in emerging markets; to assess
the influence of emerging markets on the optimal structured cost of the distribution model and
propensity to improve product availability; to establish the extent of the transformation of
informal retail enterprise development by formalized large scale chains through a configured
supply chain; and, finally to evaluate the extent of the displacement of informal local traders
as a result of the entry of both large scale suppliers and retailers into township markets. The
study employed various univariate, bivariate and multivariate statistical techniques to analyse
the data collected from 291 respondents.
The study found that, while informal local traders appreciate the transformation and
development of the townships brought about by mall development, their businesses have been
somewhat or completely displaced by the emergence of township malls.
Key Words: Emerging markets, informal local traders, displacement effect, supply chain value
creating, distribution systems, cost of distribution,

v
Table of Contents Declaration ................................................................................................................................ II
Acknowledgements .................................................................................................................. III
Abstract .................................................................................................................................... IV
Table Of Contents ..................................................................................................................... V
List of Figures .......................................................................................................................... XI
List of Tables ......................................................................................................................... XII
Bibliography .......................................................................................................................... 104
Appendix A Questionnaire .................................................................................................... 116
Ethical Clearance Letter ......................................................................................................... 119
Editors’ Certificate ................................................................................................................. 120
Appendix D Frequency Distribution Tables .......................................................................... 121
CHAPTER ONE: INTRODUCTION AND OVERVIEW OF STUDY
1.1 Introduction .......................................................................................................................... 1
1.2 Background of Study ........................................................................................................... 1
1.3 Research Problem ................................................................................................................ 2
1.4 Research Questions .............................................................................................................. 3
1.5 Research Objectives ............................................................................................................. 3
1.6 Significance of the Study ..................................................................................................... 3
1.7 The Formal Sector................................................................................................................ 4
1.8 The Informal Sector ............................................................................................................. 4
1.9 Emerging Markets ................................................................................................................ 4
1.10 Supply Chain Distribution Models .................................................................................... 5
1.11 The Five Major Supply Chain Drivers............................................................................... 5
1.12 Distribution Channels ........................................................................................................ 6
1.12.1 Hybrid ............................................................................................................................. 8
1.13 Conceptual framework ....................................................................................................... 8
1.14 Research Methodology ...................................................................................................... 9
1.14.1 Research Approaches ...................................................................................................... 9
1.14.2 Study Site ...................................................................................................................... 10

vi
1.14.3 Target Population .......................................................................................................... 10
1.14.4 The Sample ................................................................................................................... 10
1.14.5 Sampling Method .......................................................................................................... 10
1.14.6 Sample Size ................................................................................................................... 11
1.14.7 Limitations .................................................................................................................... 11
1.14.8 Data Collection Instruments ......................................................................................... 11
1.14.9 Data Analysis ................................................................................................................ 11
1.15 Ethical Considerations ..................................................................................................... 12
1.16 Conclusion ....................................................................................................................... 12
CHAPTER TWO: LITERATURE REVIEW
2.1. Introduction ....................................................................................................................... 13
2.2. Emerging Markets ............................................................................................................. 14
2.2.1 Market Heterogeneity ..................................................................................................... 15
2.2.2 Unbranded Competition .................................................................................................. 15
2.2.3 Chronic Shortage of Resources ....................................................................................... 16
2.2.4 Retail Chain Expansion................................................................................................... 20
2.3 Expansion of Formal Retail Sector into SA Townships .................................................... 21
2.4 The Informal Sector ........................................................................................................... 21
2.4.1 The Size of the Informal Sector ...................................................................................... 25
2.5 Transformation ................................................................................................................... 27
2.5.1 National development in emerging markets’ retail centres ............................................ 27
2.6 Value Creation ................................................................................................................... 31
2.7 Distribution Channels ........................................................................................................ 35
2.7.2 Hybrid ............................................................................................................................. 36
2.7.3 Centralised and De-Centralised Distribution Systems .................................................... 38
2.8 Distribution Networks ........................................................................................................ 38
2.8.1 Re-engineering Traditional Channels ............................................................................. 40
vii
2.8.2 Developing a Triple- A Rated Supply Chain .................................................................. 41
2.9 The Displacement Effect.................................................................................................... 42
2.10 Costs ................................................................................................................................. 44
2.11 Conclusion ....................................................................................................................... 45
CHAPTER THREE: RESEARCH METHODOLOGY
3.1 Introduction ........................................................................................................................ 46
3.2 Objectives .......................................................................................................................... 46
3.3 Research Questions ............................................................................................................ 47
3.4 Research Design................................................................................................................. 47
3.5 Research Approaches ......................................................................................................... 48
3.6 Analytical Method ............................................................................................................. 49
3.6.1 Univariate Data Analysis ................................................................................................ 50
3.6.1.1 Frequency Distribution ................................................................................................ 50
3.6.1.2 Descriptive Statistics .................................................................................................... 50
3.6.1.3 Bivariate Data Analysis ............................................................................................... 51
3.6.1.4 Chi-Square ................................................................................................................... 51
3.6.1.5 Pearson Product-Moment Correlation ......................................................................... 52
3.6.1.6 Wilcoxon Signed Ranks ............................................................................................... 53
3.6.1.7 Cross-Tabulation .......................................................................................................... 53
3.6.2 Multivariate Data Analysis ............................................................................................. 55
3.6.2.1 Regression Analysis ..................................................................................................... 55
3.6.2.2 Multiple Regression ..................................................................................................... 55
3.6.2.3 Kruskal Wallis Test...................................................................................................... 56
3.7 Binomial Test ..................................................................................................................... 57
3.8 Reliability ........................................................................................................................... 57
viii
3.9 Validity .............................................................................................................................. 57
3.10 Study Site ......................................................................................................................... 58
3.11 Target Population ............................................................................................................. 58
3.12 The Sample ...................................................................................................................... 58
3.13 Sampling Method ............................................................................................................. 59
3.14 Sample Size ...................................................................................................................... 59
3.15 Limitations ....................................................................................................................... 59
3.16 Data Collection Instruments ............................................................................................ 60
3.17 Construction of the Instrument ........................................................................................ 60
3.18 Administration of the Questionnaire ................................................................................ 61
3.19 Data Analysis ................................................................................................................... 61
3.20 Ethical Considerations ..................................................................................................... 62
3.21 Conclusion ....................................................................................................................... 62
CHAPTER FOUR: DATA ANALYSIS AND INTERPRETATION
4.1 Introduction ........................................................................................................................ 63
4.2 Frequency Distribution ...................................................................................................... 63
4.2.1 Trader Demographics ...................................................................................................... 63
4.3 Dichotomous Questions ..................................................................................................... 68
4.4 Descriptive Statistics .......................................................................................................... 72
4.5 Bivariate Approach ............................................................................................................ 75
4.5.1 Cross Tabulation ............................................................................................................. 75
4.6 Group Statistics .................................................................................................................. 81
4.6.1 Independent T-test .......................................................................................................... 81
4.6.2 Regression Analysis ........................................................................................................ 83
4.7 Conclusion ......................................................................................................................... 86

ix
CHAPTER FIVE: DISCUSSION OF RESULTS
5.1 Introduction ........................................................................................................................ 87
5.2 Demographics .................................................................................................................... 88
5.3 Discussion Relating to Research Objectives...................................................................... 89
5.3.1 Local Informal Traders’ Perceptions .............................................................................. 89
5.3.2 Value Creating Supply Chains ........................................................................................ 91
5.3.3 Influence of Emerging Markets ...................................................................................... 92
5.3.4 The Displacement Effects ............................................................................................... 94
5.4 Conclusion ......................................................................................................................... 97
CHAPTER SIX: RECOMMENDATIONS AND CONCLUSION
6.1 The Influence of Emerging Markets on Local Traders ...................................................... 98
6.1.1 Benefits of Township Mall Development ....................................................................... 99
6.1.2 Local Development and Value Creation ......................................................................... 99
6.1.3 Disadvantages of Township Mall Development and Displacement Effect .................. 100
6.2 Future Research ............................................................................................................... 103
x
LIST OF FIGURES
Figure 1.1 The Five Major Supply Chain Drivers ..................................................................... 6
Figure 1.2 Various Supply Chain and Distribution Options ...................................................... 7
Figure 1.3 The Conceptual Framework ..................................................................................... 9
Figure 2.1 The Commercial Infrastructure at the bottom of the Pyramid ............................... 17
Figure 2.2 Total number of retail centres by province............................................................. 28
Figure 2.3 Shared Value Creation ............................................................................................ 32
Figure 2.4 Supply Chains and Distribution Channel Options.................................................. 35
Figure 2.5 Today’s Distribution Channels Structure ............................................................... 40
Figure 2.6 Maximised Triple-A developed approach .............................................................. 42
Figure 4.1 Gender, Age and Years Running Business ............................................................. 64
Figure 4.2 Distance from the Mall and Effect of the Mall ....................................................... 64
Figure 4.3 Staff Size, Type of Business, Started Operating and Reason for Business ............ 65
Figure 4.4 Income Before and After ........................................................................................ 66
Figure 4.5 Experiences, Perceptions and Knowledge of Respondents .................................... 67
Figure 4.6 Value Creating Supply Chain Distribution Systems .............................................. 69
Figure 4.7 Value Creation and Local Development ............................................................... 71
Figure 4.8 Descriptive Statistics on Value Creation and Development ................................... 73
xi
LIST OF TABLES
Table 2.1 Characteristics of Emerging Markets ...................................................................... 18
Table 2.2 New Strategies for Bottom of the Pyramid .............................................................. 19
Table 2.3 Informal Sector Business Models ........................................................................... 22
Table 2.4 Characteristics of the informal economy - The new view ....................................... 24
Table 2.5 Methods of measuring and estimating the informal sector ...................................... 26
Table 2.6 Retail Centre Performance 2006 – 2007 .................................................................. 29
Table 2.7 Retailers and Consumer Feedback ........................................................................... 30
Table 2.8 Key Business Performance Indicators ..................................................................... 31
Table 2.9 Key Business Performance Indicators ..................................................................... 31
Table 2.10 Four building blocks of co-creation ....................................................................... 33
Table 2.11 Small Business Sustainability in Soweto, 2007-2008 ........................................... 43
Table 4.1 Descriptive Statistics on Value Creation and Development ................................... 73
Table 4.2 Influence of malls on Informal trader businesses .................................................... 76
Table 4.3 Effects of malls on Informal Trader Businesses ...................................................... 77
Table 4.4 Informal Trader Business and Start of Operation .................................................... 78
Table 4.5 Income before Mall .................................................................................................. 79
Table 4.6 Income after Mall..................................................................................................... 80
Table 4.7 Independent Sample Test ......................................................................................... 82
Table 4.8 Effect of Malls on Infrastructural Development ...................................................... 83
Table 4.9 Variables .................................................................................................................. 85

1
Chapter One
Introduction to the study
1.1 Introduction
This study focused on the challenges associated with township development ranging from
informal local trading, to distribution systems and emerging markets. The distribution systems
that are used to provide goods to township residents via local traders are interlinked with the
main stakeholders, including the supplier, the intermediary, the retailer and the consumer.
Mokgabudi (2011:2) notes that the development of township malls and suppliers’ expansion
into the townships will lead to jobs creation and improving the quality of goods and services.
However, such developments could negatively affect informal township traders. Thus, this
study sought to gain an understanding of informal local traders’ perceptions of the influence of
emerging markets. For the purpose of this study, the terms emerging markets and township
malls are used interchangeably in the context of township development.
1.2 Background of the study
According to Strydom (2011: 164) traditionally, suppliers used intermediaries to distribute
their products. However, in recent times, they have started using distributors who deliver
directly to the consumer. Large chain stores are expanding into newly-developed malls in South
African townships (Strydom, 2011: 164; Hauke and Kossowski, 2011). These markets present
both benefits and challenges to the consumer, retailer and supplier. While chain stores are
tapping into increased consumer disposable income, informal traders have experienced a
shrinking market as a result of their operations (Hauke and Kossowski, 2011). The study
focused on the challenges presented by these emerging markets by examining the shift from
traditional distribution channels to the new value-creation supply chain distribution channels.
Strydom (2011: 168) observes that, the retail trade in South Africa’s townships has been largely
serviced by small informal local traders. However, at the top end of the retail chain, traditional
retail markets are becoming saturated; formal retailers are thus focusing on market expansion
strategies in order to grow their share and remain competitive (Strydom, 2011: 154).

2
The expansion of mainstream retailers into townships could pose challenges. While they offer
business opportunities and more choice for consumers, these retailers also threaten to displace
traditional local informal traders. Retailers’ proximity to the final consumer through innovative
supply chain distribution systems could result in more affordable prices for local consumers,
improved living standards and competition in these emerging markets (Tustin and Strydom,
2006: 49). However, informal local traders could find it difficult to compete with large, formal
suppliers and retailers who benefit from economies of scale, leading to their displacement and
loss of income. This study thus explored the effects of value-creation supply chain distribution
systems and the perceptions of informal local traders in emerging markets in the two largest
townships in KwaZulu-Natal (KZN) province. It focused on Kwa-Mashu with a population of
175 663 spread over 21.47 km2 and three major shopping complexes (Bridge City, K-station
and L-complex), and Umlazi, with a population of 404 811 spread over 47.46 km2 and three
major shopping malls (Mega City, Spar Philani Shopping Complex and Kwa-Mnyandu
Shopping Mall) (Frith, 2014: 44).
1.3 Research problem
The study focussed on the perceived challenges of township development through supply chain
distribution systems and emerging markets. The main stakeholders are the supplier, the
intermediary, the retailer and the consumer. While the emergence of township malls and
suppliers’ expansion into the townships has the possibility of creating jobs and improving the
quality of goods and services, it is equally important to note that these developments could
negatively affect informal township traders. A large number of local informal traders have been
displaced due to the emergence of large chain stores activities in local townships (Strydom,
2011: 155). Informal local traders are individuals who act as distribution channels that move
products at a small scale, while formal retailers are large chain stores that provide a wide variety
of goods and products in bulk and breaking bulk. Emerging markets are characterised by an
increase in personal disposable income among previously disadvantaged groups.

3
1.4 Research questions
The research questions underpinning this study are:
What are local informal traders’ perceptions of township emerging markets and value
creating supply chain distribution systems?
In bringing products and goods closer to local areas, what effect do emerging markets
have on costs to local retailers, intermediaries and consumers?
What challenges do contemporary value-creating supply chain distribution systems
present to local township transformation and informal local enterprises?
What is the magnitude of the displacement effect on informal local traders presented
by formal retail chains expanding into traditional markets?
1.5 Research objectives
To explore informal township traders’ perceptions of the effects of value-creation
supply chain distribution systems in emerging markets.
To assess the influence of emerging markets on the optimal structured cost of the
distribution model and propensity to improve product availability.
To establish the extent of transformation in informal retail enterprise development
brought about by formalised large scale chains through a configured supply chain.
To evaluate the extent of the displacement of informal local traders brought about by
the entry of both large scale suppliers and retailers into township markets.
1.6 Significance of this study
Strydom (2006:48) notes that the retail trade sector in South African emerging markets has
been dominated by small informal trade for quite some time. However, following the political
transition, many African consumers upgraded into the middle-income group, and left township
life for urban residential areas. These changes in economic power/emancipation benefited
formal traders as consumers could now buy in bulk due to increased disposable income.
However, transformation resulted in formal retailers implementing market expansions into new
economies. Mokgabudi (2011:2) observes that many members of the middle class township
dwellers still reside in South African townships, presents an untapped emerging market with
4
new challenges to large chain stores. Large chains eventually became aware of the potential
opportunity to broaden their operations. Township transformation could pose challenges, create
new opportunities, improve choices for consumers, offer more affordable prices to local
consumers and revitalise emerging markets. However, it could also present challenges to
informal local traders, which may lead to loss of income as they find it difficult to compete
with formal, large-scale suppliers who exploit economies of scale (Tustin and Strydom,
2006:48).
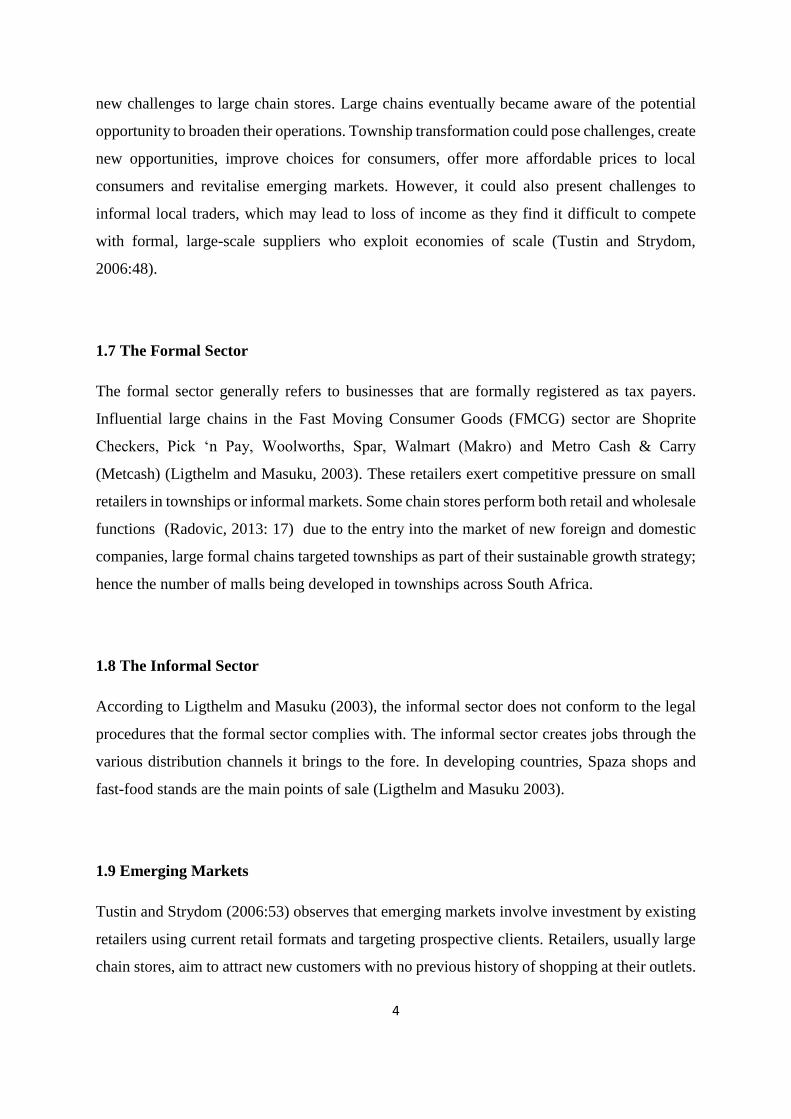
1.7 The Formal Sector
The formal sector generally refers to businesses that are formally registered as tax payers.
Influential large chains in the Fast Moving Consumer Goods (FMCG) sector are Shoprite
Checkers, Pick ‘n Pay, Woolworths, Spar, Walmart (Makro) and Metro Cash & Carry
(Metcash) (Ligthelm and Masuku, 2003). These retailers exert competitive pressure on small
retailers in townships or informal markets. Some chain stores perform both retail and wholesale
functions (Radovic, 2013: 17) due to the entry into the market of new foreign and domestic
companies, large formal chains targeted townships as part of their sustainable growth strategy;
hence the number of malls being developed in townships across South Africa.
1.8 The Informal Sector
According to Ligthelm and Masuku (2003), the informal sector does not conform to the legal
procedures that the formal sector complies with. The informal sector creates jobs through the
various distribution channels it brings to the fore. In developing countries, Spaza shops and
fast-food stands are the main points of sale (Ligthelm and Masuku 2003).
1.9 Emerging Markets
Tustin and Strydom (2006:53) observes that emerging markets involve investment by existing
retailers using current retail formats and targeting prospective clients. Retailers, usually large
chain stores, aim to attract new customers with no previous history of shopping at their outlets.

5
According to Benjamin and Mbaye (2012: 6) a second format would be to drive existing
consumers to frequent stores more often by catering for their needs. Typical approaches include
attracting new customers by opening more stores, staying open for longer and the strategic
display of products to increase impulse buying Benjamin and Mbaye (2012: 9). Expansion
strategies involve expanding the existing retail format to emerging markets. In other words,
retailers enter a new geographical market using their current retail strategy (Jackson, 2012: 55).
1.10 Supply chain distribution models
According to Hugos (2011: 5), supply chain management is founded on fundamentals of
simultaneous improvements in customer services and efficiencies in operations within the
supply chain. It calls for stakeholders to consistently exceed order-fulfilment rates, improve
timely deliveries while achieving a low rate of product returns. The efficiency of organisations
within the supply chain dictates that these organisations achieve a higher rate of return on their
investment and implement processes to reduce their running costs. Hugos (2011: 5) and
Callaghan (2014: 333) add that the major difference between old and new supply chains is that
old supply chains were slow-moving, industrial markets, whereas new supply chains are
fragmented, fast-moving markets. In the modern business environment, companies tend to
specialise in their core business and outsource other functions to enable them to become more
flexible and responsive (Callaghan, 2014: 333).
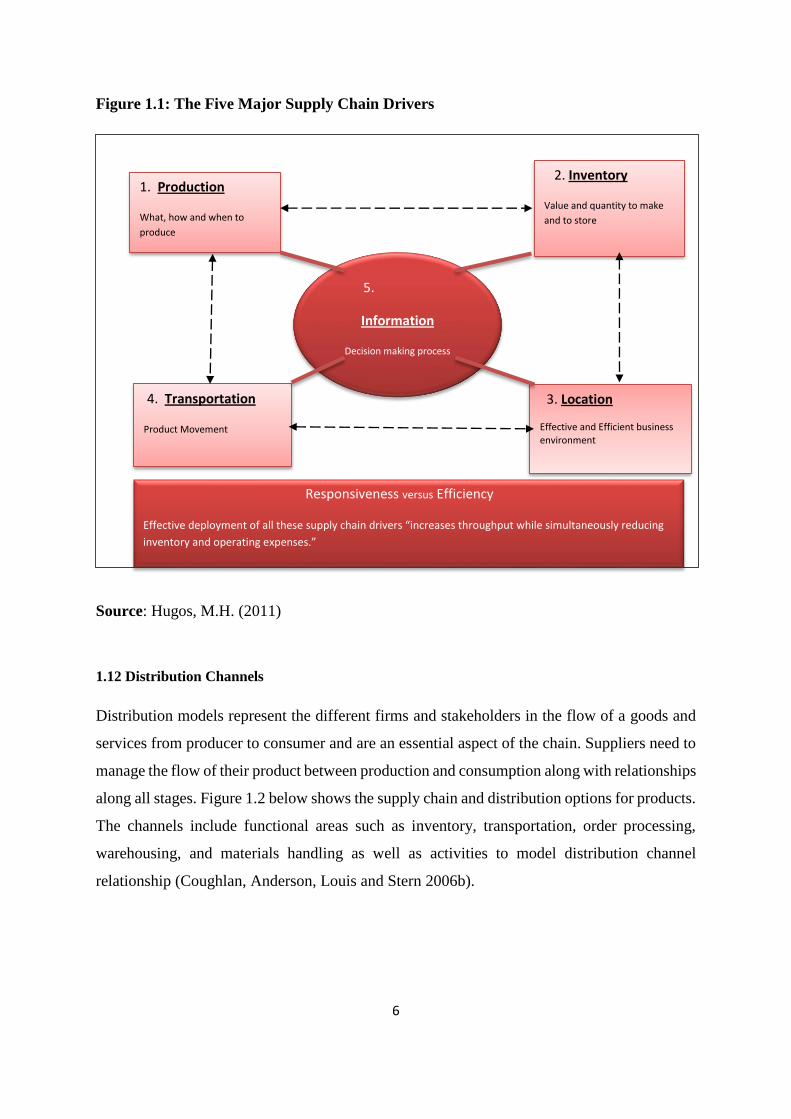
1.11 The Five Major Supply Chain Drivers
Information flow is critical for an effective supply chain model; it is the basis for decisions
regarding the other drivers, which are Production, Inventory, Location and Transportation
(Hugos, 2011).
6
Figure 1.1: The Five Major Supply Chain Drivers
Source: Hugos, M.H. (2011)
1.12 Distribution Channels
Distribution models represent the different firms and stakeholders in the flow of a goods and
services from producer to consumer and are an essential aspect of the chain. Suppliers need to
manage the flow of their product between production and consumption along with relationships
along all stages. Figure 1.2 below shows the supply chain and distribution options for products.
The channels include functional areas such as inventory, transportation, order processing,
warehousing, and materials handling as well as activities to model distribution channel
relationship (Coughlan, Anderson, Louis and Stern 2006b).
1. Production
What, how and when to
produce
2. Inventory
Value and quantity to make
and to store
5.
Information
Decision making process
4. Transportation
Product Movement
3. Location
Effective and Efficient business environment
Responsiveness versus Efficiency
Effective deployment of all these supply chain drivers “increases throughput while simultaneously reducing
inventory and operating expenses.”
7
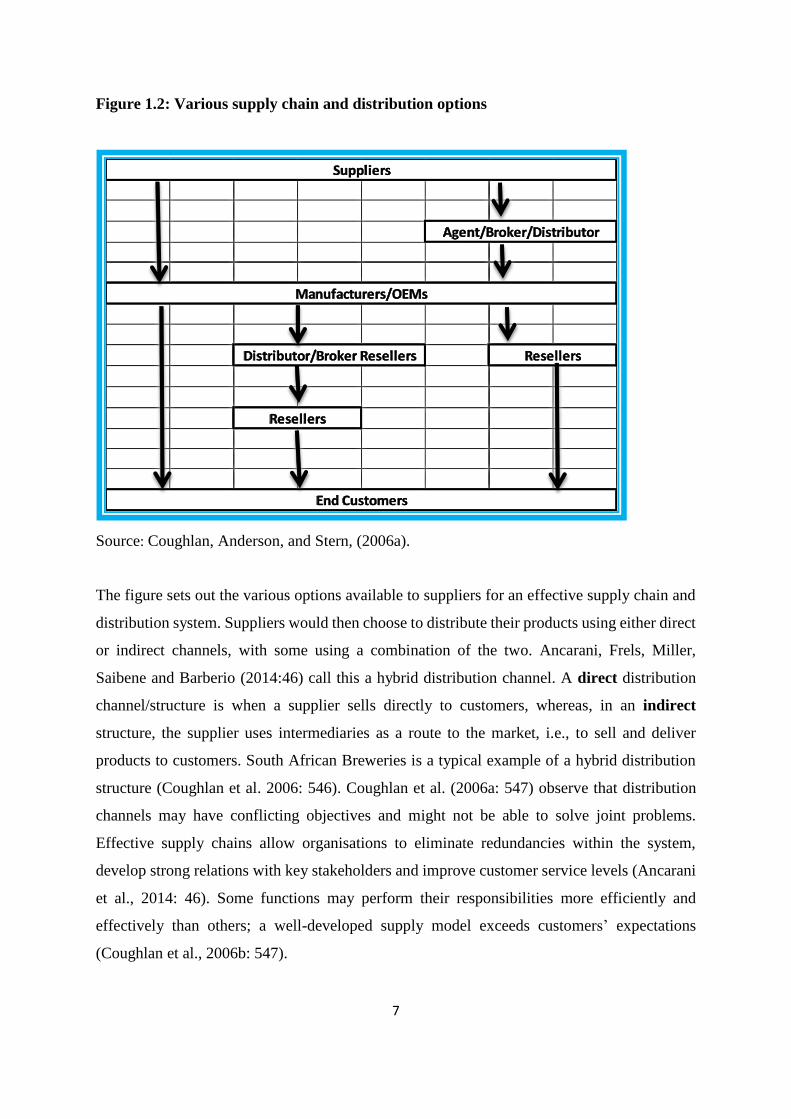
Figure 1.2: Various supply chain and distribution options
Source: Coughlan, Anderson, and Stern, (2006a).
The figure sets out the various options available to suppliers for an effective supply chain and
distribution system. Suppliers would then choose to distribute their products using either direct
or indirect channels, with some using a combination of the two. Ancarani, Frels, Miller,
Saibene and Barberio (2014:46) call this a hybrid distribution channel. A direct distribution
channel/structure is when a supplier sells directly to customers, whereas, in an indirect
structure, the supplier uses intermediaries as a route to the market, i.e., to sell and deliver
products to customers. South African Breweries is a typical example of a hybrid distribution
structure (Coughlan et al. 2006: 546). Coughlan et al. (2006a: 547) observe that distribution
channels may have conflicting objectives and might not be able to solve joint problems.
Effective supply chains allow organisations to eliminate redundancies within the system,
develop strong relations with key stakeholders and improve customer service levels (Ancarani
et al., 2014: 46). Some functions may perform their responsibilities more efficiently and
effectively than others; a well-developed supply model exceeds customers’ expectations
(Coughlan et al., 2006b: 547).
Suppliers
Agent/Broker/Distributor
Manufacturers/OEMs
Resellers
Resellers
End Customers
Distributor/Broker Resellers
8
1.12.2 Hybrid
Farahani, Rezopour, Denzner and Fallah (2014: 3) note that some activities in both direct and
indirect channels are mutually exclusive; however, most diverse suppliers and stores, such as
department stores and major production companies are hybrids, meaning that they produce but
also own and sell their products. Research has shown that most firms use both direct and indirect
channels to reach the final consumer, thus, no single distribution system is recommended;
suppliers employ the one that is most applicable and cost-effective for their operations
(Farahani et al. 2014: 3). The hybrid system is popular in the South African market mainly due
to the terrain and the distances that must be traversed to access the majority of South African
consumers (Farahani et al., 2014: 3).
1.13 Conceptual Framework
Prahalad and Ramaswamy (2013:3) observe that the new value creation space is competitive
and underpinned by the personalised co-creation of experiences through interaction between
the consumer and the retailer. Through these interactions new opportunities are created. To
achieve sustainable value creation, retailers need to remain relevant by establishing strong
relations with consumers (Prahalad and Ramaswamy, 2013:3). This study examined value
creation by informal local traders in emerging markets in order to stay competitive. Jackson
(2012: 2) argues that the informal sector eventually loses ground due to multinationals’
expansion into new economies. There are both winners and losers in new markets. This study
sought to measure the magnitude of the costs suffered by local informal traders due to emerging
markets in the South African context.
Wedan (2006: 3) notes that, in order to leverage opportunities in emerging markets, retailers
must transition from serving a limited number of customers to catering for a broader market in
an efficient and responsive manner that reduces the cost of sourcing goods and services. There
are benefits associated with the transformation of businesses’ logistical strategy. The study thus
sought to understand the transformation of informal retail enterprise development by
formalised large scale chains through a configured supply chain. Toomey (1998: 13) observes
that growth supported by labour savings and technology may lead to increased inequality and
discourage fair competition in the market. This study evaluated the magnitude of the
displacement of informal local traders as a result of the entry of both large scale suppliers and
retailers into township markets (Toomey, 1998:13).

9
Figure 1.3: The Conceptual Framework
Source: Created by researcher from the conceptual framework of this study
1.14 Research Methodology
1.14.1 Research Approaches
There are three broad research methodologies; namely quantitative, mixed methods and
qualitative. Patton (2005: 2) notes that quantitative research provides numerical analysis,
percentages and trends. It helps the researcher to answer questions such as how many, how
often, and so forth. This study used a quantitative research methodology to achieve the research
objectives through the completion of questionnaires. This method was appropriate due to its
rigorous approach to understanding, describing and producing detailed explanations of a
phenomenon. Sekaran and Bougie (2010: 385) note that, triangulation is often linked to
reliability and validity in qualitative research.
Influence of emerging markets on
Informal Local Traders
Value
Creation
Costs Transformation
The
Displacement
Effect

10
1.14.2 Study Site
The study site was the Durban region with a focus on Umlazi Township and Kwa-Mashu
Township which are part of the greater Durban and Ethekwini Metropolitan Municipality
(Frith, 2014:12). Kwa-Mashu and Umlazi are the two biggest townships in the region. Kwa-
Mashu is home to 175 663 people spread over 21.47 km2 while Umlazi has a population of 404
811 spread over 47.46 km2 (Frith, 2014:12).
1.14.3 Target Population
Charmaz (2011: 359) defines the target population as the total population of respondents in a
survey. The target population should be defined in terms of geographical and time lines
(Sekaran and Bougie, 2010: 267). The target population for this study was informal market
participants in Umlazi and Kwa-Mashu Townships. A study conducted by the eThekwini
Economic Development and Investment Promotion Unit in September 2012 found that there
were 750 informal local traders in Umlazi Township and 420 in Kwa-Mashu Township
(Abrahams and Pogue, 2012: 62).
1.14.4 The Sample
The sample is a subset or subgroup of the population (Sekaran and Bougie, 2010: 444).
Adopting Sekeran and Bougie’s (2010: 276) sampling method, of the total 1 170 multiple outlet
owners in Umlazi and Kwa-Mashu Townships, questionnaires were distributed to 291 informal
traders.
1.14.5 Sampling Method
Sampling is defined as the selection of items from a population study in order to generalise the
characteristics of the population being studied. Convenience sampling was used as it is quick,
convenient and less expensive and targets easily accessible members of the population under
study. Sekaran and Bougie (2010: 276) describe convenience sampling as the collection of
information from members of the population who are conveniently available to provide the
information, while Charmaz (2011: 362) describes this type of sampling as the researcher
studying members of the population who are easily available. Sekaran and Bougie (2010: 276)
note that, in purposive sampling, information is obtained from specific target groups who can
provide the required information, or conform to parameters set by the researcher.

11
1.14.6 Sample Size
Sampling is a process that involves selecting a small portion of the population to represent the
entire target population, whereas the sample size is the total number of units or people selected
to participate in the study (Yin, 2013: 98). For the purpose of this research study, the units were
informal business owners (1 170 outlets), population size. The sample size was the 291 multiple
outlet owners in Umlazi and Kwa-Mashu Townships.
1.14.7 Limitations
The limitation of this study was that it was conducted in one region, the Durban region;
however, the researcher addressed this limitation by targeting high activity informal business
geographical locations, the two main townships of Umlazi and Kwa-Mashu.
1.14.8 Data Collection Instruments
Data is the information collected in the process of a research study using tools while data
collection instruments refer to the actual devices used to collect data (Rubin and Chisnell, 2008:
43). The researcher used questionnaires to collect quantitative data. Qualitative data is
described by Sekaran and Bougie (2010: 444) as data that are not immediately quantifiable,
unless they are categorised in some way, whereas quantitative data is generally gathered
through structured questions. A questionnaire is a form of written communication in which the
researcher communicates with the respondent. Questionnaires are a widely accepted tool for
gathering information (Bird, 2009: 07).
1.14.9 Data Analysis
The data was analysed using quantitative approaches. Charmaz (2011: 367) describes data
analysis as the process of examining something in order to determine what it is and how it
works. Analysis involves a process where a researcher interprets events. Univariate techniques
were used to test frequency distribution for this research study; Sekaran and Bougie (2010:
338) describes univariate techniques as testing a hypothesis on a single mean. The Anova
analysis technique was used to test the differences between the multiple outlet owners’
responses. Inferential statistics were used to test correlation and cross-tabulation among the
responses. Manova is described by Sekaran and Bougie (2010: 358) as a technique that tests

12
mean differences among groups across several dependent variables simultaneously, by using
sums of squares and cross-product matrices. This study examined the difference or relationship
between supply chain distribution methods. Sekaran and Bougie (2010: 161) describe factor
analysis as a multivariate technique that confirms the dimensions of the concept that have been
operationally defined, also indicating which of the items are most appropriate for each
dimension.
1.15 Ethical considerations
According to Olsen, Wilson, Michel, Gibberd, Vincent, El-Assaday, Rasslan, Qsous, Macharia
and Sahel (2012: 87) the ethical clearance process normally starts with the researcher or
examiner noting which parts of the ethical clearance guidelines apply to a specific research
study. Ethical approval was obtained from the University of KwaZulu-Natal’s Ethics
Committee and a gatekeeper’s letter was obtained from the Office of the Registrar at the
University. To protect human dignity, respondents were required to provide informed consent.
They were provided with adequate information about the study in order for them to decide
whether or not to participate. Confidentiality and privacy were upheld by informing the
respondents of their right to withhold certain personal information (Olsen et al., 2012: 87).
1.16 Conclusion
This research study sought to assess the influence of emerging markets on the optimal
structured cost of the distribution model and propensity to improve product availability in order
for informal local traders to remain competitive. The emergence of township malls and chain
stores is likely to create increased competition while improving the sustainable development
of local infrastructure. The study sought to understand the transformation of informal retail
enterprise development by formalised large-scale chains through a configured supply chain
while also measuring the magnitude of the displacement effect on informal local traders as a
result of the entry of both large scale suppliers and retailers into township markets.
13
Chapter Two
Literature Review
2.1 Introduction
According to Mokgabudi (2011: 8) from a global perspective, emerging markets are developing
countries that offer an opportunity for global investors to improve infrastructure and create job
opportunities in populations largely dominated by communities at the lower levels of the
income pyramid. Mokgabudi (2011:8) notes that some previously disadvantaged South
Africans now have more disposable income that they are willing to spend on products that are
perceived to add value. This suggests that township consumers constitute a profitable market
for large chain stores. Indeed, these stores have developed shopping complexes and township
malls in order to increase profitability. This study investigated the impact of township malls on
local informal traders.
The main purpose of this study was to gather data to analyse the possible effects and influences
township malls have on local informal traders in South African townships. The terms township
malls and emerging markets are used interchangeably in this study. Prahalad and Ramaswamy
(2013:3) note that the value creation environment is highly competitive and underpinned by
tailor-made co-creation of customer experiences through interaction between the relevant
stakeholders. To achieve sustainable value creation, retailers have to remain relevant by
establishing strong relations with consumers. Verick (2004: 2) argues that the informal sector
eventually loses out due to multinationals’ expansion into new economies. Research shows that
increased competition could lead to some market players exiting the market or re-designing
their business model (Wedan, 2006:3). The researcher sought to determine local traders’
perceptions of how the emergence of township malls has influenced the way in which business
is now conducted in South African townships. The study also sought to evaluate the magnitude
of the displacement of informal local traders as a result of the entry of both large scale suppliers
and retailers into township markets.
Over the years, South African townships have been penetrated by national retailers and
companies as part of their growth strategies as these townships are regarded as new markets
(Mokgabudi, 2011:4). This resulted in the development of township malls across South Africa.

14
Perceived challenges confronting township development through supply chain distribution
systems and emerging markets may become a reality during this process (Toomey, 1998:13).
These systems of getting goods to the township via local traders were analysed by examining
the extended supply chain partners and the structural costs of distribution in these contemporary
markets. Mokgabudi (2011:2) notes that, while the emergence of township malls and suppliers’
expansion into the townships has the possibility of creating jobs and improve the quality of
goods and services, it is equally important to note that these developments could negatively
affect informal township traders. Strydom and Klerk (2006:48) observes that the retail sector
in South African emerging markets has been dominated by small informal trade for quite some
time.
2.2 Emerging Markets
Hull and McGroarty (2014: 35) describe emerging markets as investment by existing retailers
using current retail formats and targeting prospective clients. Retailers, usually large chain
stores, aim to attract new customers with no previous history of shopping at their outlets. A
second format would be to drive existing consumers to frequent stores more often by catering
for their needs. Typical approaches include attracting new customers by opening more stores,
staying open for longer and the strategic display of products to increase impulse buying.
The notion that expansion strategies involve the existing retail format in emerging markets is
consistent with Hull and McGroarty (2014: 56) and Strydom and de Klerk (2006: 27) argument
that a retailer enters a new geographical market using its current retail strategy. Growth strategy
is largely influenced by saturation in the market and changes in consumer disposable income
trends that offer chains stores opportunities to adopt a long-term strategic view that devotes
more time and resources to non-traditional township markets. For the purpose of this research,
the discussion of centres on retail business operations, mainly food, clothing and other fast
moving consumer goods. This is because the majority of informal traders in local townships
mainly trade in food, clothing and other fast moving consumer goods of minimum to low value
((Strydom and de Klerk, 2006: 28); (Qian and Soopramanien, 2014: 112)).
These products are similar to those that national retailers and chain stores offer in township
malls. The emergence of these national retailers in the township business sphere will definitely
result in increased competition. The biggest challenge confronting local informal traders is that

15
they will have to compete with established national retailers who exploit economies of scale
and assert their dominance in the formal sector (Strydom and de Klerk, 2006: 28). Sheth (2011:
168) identifies five key dimensions that distinguish emerging markets from developed or
formalised markets.
2.2.1 Market Heterogeneity
Sheth (2011:168) argues that emerging markets are characterised by very large variance across
most products and services, which is consistent with Fernie and Sparks (2014: 116) assertion
that emerging markets are local markets that are fragmented, low-scale and largely served by
local informal owners. Sheth (2011:168) notes that emerging markets have yet to be
industrialised and reflect the same characteristics of market heterogeneity as an agricultural
economic system. Furthermore, emerging markets serve the 4th Tier of consumers, who live
below the official poverty level. Tsai and Yang (2013: 1288) notes that Tier 4 consumers have
no access to electricity, clean, running water, financial institutions, or a modern and reliable
transport system. Until recently, consumers in this segment had no access to
telecommunications or television. The majority still lack formal education and qualifications,
implying high levels of illiteracy. Sheth (2011:168) adds that, more importantly, the
heterogeneity of emerging markets is not driven by local consumers’ diverse needs and wants,
but primarily by scarce resources. Such a market is characterised by inequalities in income
distribution. On the other hand, urban markets are characterised by diversity and a wide range
of products and services (Fernie and Sparks, 2014: 168).
2.2.2 Unbranded Competition
According to Tsai and Yang (2013:122) and Sheth (2011:169), most products and services
consumed in emerging markets are unbranded. In the first place, this is largely due to
accessibility challenges and a lack of established routes to market branded products. A product
needs time to establish itself in a new market. A second and probably more important reason
is that consumers not only play a consumption role but also act as a production unit. The value
add in such markets is only realised by retailers who produce locally using local raw materials
and employing local consumers. Tsai and Yang (2013:121) notes that such a system will create
a fluid supply and demand market. In an unbranded market, used products tend to become
direct competition for any retailer investing in the market as products tend to have a prolonged

16
life cycle that goes beyond ownership. Duplication and black market products are far more
prevalent in an emerging market due to lack of regulation, compliance and law enforcement.
Barter becomes an important means of trade as consumers are less exposed to financial power
and independence (Tsai and Yang, 2013: 1279).
2.2.3 Chronic Shortage of Resources
Qian (2014: 698) notes that emerging markets lack mineral resources, production capabilities,
and exchange and consumption. Power shortages and a lack of competitively priced raw
materials and productive, skilled labour affect production, resulting in inconsistency and low
productivity. With low productivity levels, economies of scale are more difficult to achieve.
Furthermore, the lack of sound financial institutions increases the cost of local products and
subsequently the cost of living. Tsai and Yang (2013:1294) observes that consumption tends
to be constrained in relation to time and location due to the lack of a power supply, running
water and land. Resource improvisation may be part of the solution for product development
and innovation, physical distribution and product utilisation. Therefore, current market
strategies may need to be supplemented by resource improvisation advantages, that is,
introducing cost effective, affordable products and services that are also user friendly and
manageable in alternating access and exchange ((Qian, 2014: 1226); (Tsai and Yang, 2013:
1286); and (Vanderstraeten and Matthyssens, 2012: 108)). It is therefore of the utmost
importance that retailers conduct extensive research and development before investing heavily
in a new product in a completely new market.

17
Figure 2.1: The Commercial Infrastructure at the bottom of the Pyramid
Source: Prahalad and Hammond. (2002).
Figure 2.1 illustrates a model, which demonstrates a commercial infrastructure approach
designed to address the lack of infrastructure and inequalities in emerging markets (Prahalad
and Hammond, 2002: 53). The majority of consumers survive below the poverty line on a day
to day basis (Agnihotri, 2012: 26). A power supply, clean running water, technological
developments and trading hubs are huge opportunities in emerging markets, government
institutions, financial institutions and non-governmental institutions, creating purchasing
power, shaping future aspirations in the community and offering endless opportunities. Each
of these models requires accelerated technological innovation (De Silva and McComb, 2012).
Strydom (2006:55) and Giamporcaro (2011: 126) state that market leaders need to invest in
leadership that is willing to experiment, collaborate with local small business owners, invest in
and empower local community members, and establish business models that encourage
competitive advantage wealth creation. Distribution channels and technological developments
Creating Buying Power
Availability of credit
Redistribution of Income
Shaping Aspirations Consumer Know how
Development
Improving Access Distribution systems
Communications links
Tailoring Local Solutions Product development
Innovation
18
are costly and require extensive research; in emerging markets, very few local business owners
have the ability to create and sustain such infrastructure (Giamporcaro (2011: 128).
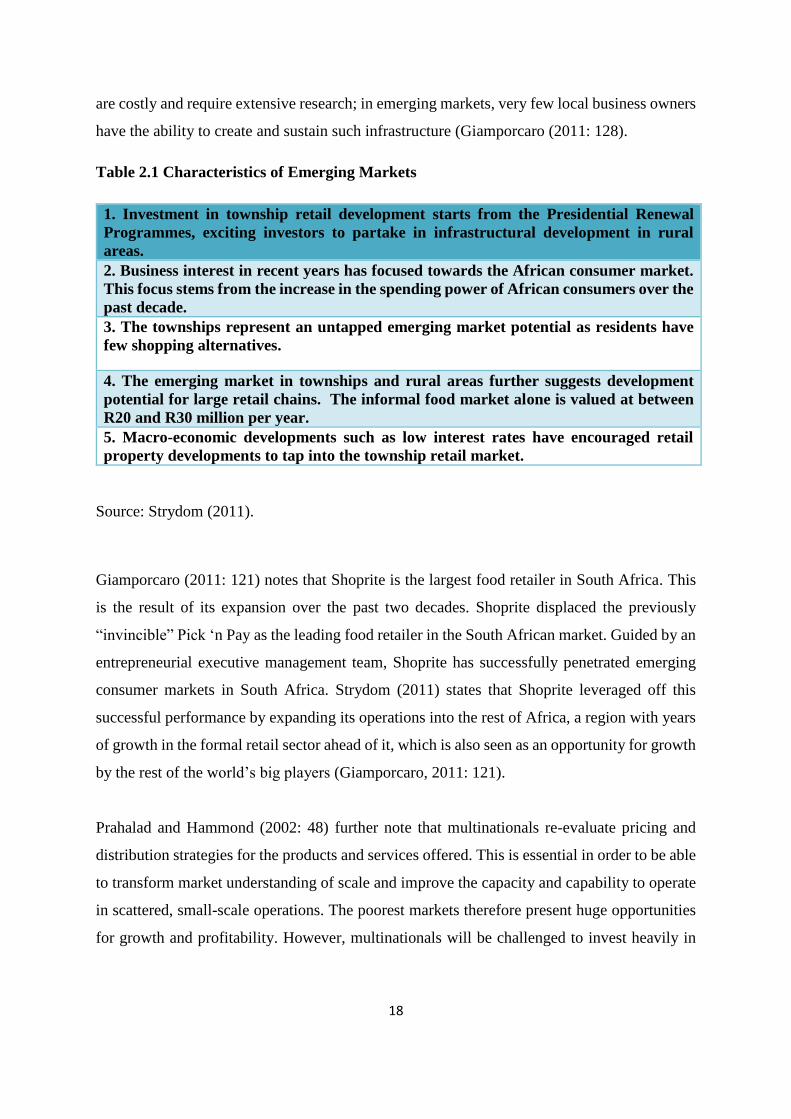
Table 2.1 Characteristics of Emerging Markets
1. Investment in township retail development starts from the Presidential Renewal
Programmes, exciting investors to partake in infrastructural development in rural
areas.
2. Business interest in recent years has focused towards the African consumer market.
This focus stems from the increase in the spending power of African consumers over the
past decade.
3. The townships represent an untapped emerging market potential as residents have
few shopping alternatives.
4. The emerging market in townships and rural areas further suggests development
potential for large retail chains. The informal food market alone is valued at between
R20 and R30 million per year.
5. Macro-economic developments such as low interest rates have encouraged retail
property developments to tap into the township retail market.
Source: Strydom (2011).
Giamporcaro (2011: 121) notes that Shoprite is the largest food retailer in South Africa. This
is the result of its expansion over the past two decades. Shoprite displaced the previously
“invincible” Pick ‘n Pay as the leading food retailer in the South African market. Guided by an
entrepreneurial executive management team, Shoprite has successfully penetrated emerging
consumer markets in South Africa. Strydom (2011) states that Shoprite leveraged off this
successful performance by expanding its operations into the rest of Africa, a region with years
of growth in the formal retail sector ahead of it, which is also seen as an opportunity for growth
by the rest of the world’s big players (Giamporcaro, 2011: 121).
Prahalad and Hammond (2002: 48) further note that multinationals re-evaluate pricing and
distribution strategies for the products and services offered. This is essential in order to be able
to transform market understanding of scale and improve the capacity and capability to operate
in scattered, small-scale operations. The poorest markets therefore present huge opportunities
for growth and profitability. However, multinationals will be challenged to invest heavily in

19
new management that is fit and capable of selling to the poor and distributing products and
services in culturally sensitive markets (Schwartz and Hornych, 2010: 488).
Table 2.2: New Strategies for Bottom of the Pyramid
New Strategies for Bottom of the Pyramid
Price Performance Views of Quality
1. Product development
2. Manufacturing
3. Distribution
1. New delivery formats
2. Creation of robust products for harsh conditions (heat,
dust, etc.)
Sustainability Profitability
1.Reduction in resource intensity
2. Recyclability
3. Renewable energy
1. Investment intensity
2. Margins
3. Volume
Source: Prahalad and Ramswamy (2013).
Mainstream retailers’ expansion into townships poses new challenges to township
development. While, on the one hand, it offers business opportunities and more choice for
consumers, it also threatens to displace traditional traders. Retailers’ proximity to the final
consumer through innovative supply chain distribution systems could result in more affordable
prices for local consumers, improved living standards and fair competition in these emerging
markets (Tustin and Strydom, 2006:49). However, informal local traders could find it difficult
to compete with large, formal suppliers and retailers who benefit from economies of scale,
leading to their displacement and loss of income. This study explored the effects of value-
creation supply chain distribution systems and the perceptions of informal local traders in
emerging markets in the two largest townships in KZN (Tustin and Strydom, 2006:49).
Ligthelm and Masuku (2003: 3) describe informal local traders as individuals who act as
distribution channels that are focused on all the functions used to move products at a small
scale, while formal retailers are large chain stores that provide a wide variety of goods and
products in bulk and breaking bulk. These township business participants are explored in the
context of supply chain distribution systems in emerging markets.

20
Tustin and Strydom (2006: 51) note that emerging markets are characterised by an increase in
personal disposable income among previously disadvantaged groups. In examining the new
value-adding supply chain distribution systems, this study focused on KZN’s two largest
townships which will provide substance to the research study.
2.2.4 Retail Chain Expansion; Suppliers and Emerging Markets
Beneke, Curran, Forsyth and Lamb (2011: 94) and Williams and Nadin (2012: 897) observe
that large chain stores have recognised the growth opportunities that exist in South African
townships. However, informal local traders could suffer loss of income as they may find it
difficult to compete with formal large-scale suppliers who exploit economies of scale. The
emergence of township malls and suppliers’ expansion into township operations has the
potential to create jobs and improve the quality of goods and services offered; however, it is
equally important to observe that it could negatively affect informal township traders. Williams
and Nadin (2012: 903) observe that even though new economic activities in undeveloped areas
may create wealth and employment, they can also result in job losses and consequently social
injustice. In the event that the effect of job losses substantially exceeds the local economy’s
capacity to offer new employment, unrest and disruptions are likely ((Beneke et al., 2011: 96)
and (Chaffey, Ellis-Chadwick, Mayer and Johnston., 2009:44)) .
A study by Chaffey et al. (2009: 44) found that the expansion of large chain stores to new
economies adversely affects local informal traders. Lower-income consumers prefer the
benefits offered by large chains despite the convenience offered by township corner stores.
Ligthelm (2006: 33) notes that the development of township malls heightened competition,
with the risk of informal local businesses losing consumer spending to large chains in the new
malls.
2.3.1 Expansion of Formal Retail Chains into South African Townships
According to Tustin and Strydom (2006:53), the South African retail trade sector is dominated
by the food retail industry with the big players being SPAR, Pick ‘n Pay and Shoprite Checkers.
The majority of large mall developments in South African townships are driven and controlled
by national grocery retailers that offer perishables and fresh produce combined with
convenience food items, traditionally sold to high and middle-income consumers. These
21
products and items are similar to the products sold by small, local, informal retailers in the
townships. The emergence of supermarkets in South African townships will definitely cause
increased competition in the food retail sector for local informal traders. The biggest question
is if these small local informal traders will survive the intensified competition brought by large
organisations who exploit economies of scale and are supported by huge investment in human
capital and technology (Kenny, 2011: 22).
Tustin and Strydom (2006:54) note that, taken together, Pick ‘n Pay, Shoprite Checkers and
SPAR control more than 90% of the fast moving consumer goods and foods retail market in
South African market. This demonstrates the dominance of these retail giants that also have
outlets across the country. Ouma, Mwangi, and Oduk (2013: 33) “Shoprite Holdings Ltd,
through its OK franchise division, also serves emerging markets through its Sentra and Value
stores, as well as its 8 ‘Till late outlets. In particular, the franchise system allows for rapid
expansion and adds the marketing advantage of local families undertaking the entrepreneurship
of expansion”. Ouma et al. (2013: 33) notes that the competitive nature of the food retail
industry is underlined by major supermarket chains’ expansion into Africa. Shoprite has
supermarkets in Namibia, Lesotho, Swaziland, Zimbabwe, Botswana, Zambia and
Mozambique. Pick ‘n Pay is profiled as one of Africa’s largest and most successful food
retailers. “Apart from expanding into mainly urban areas of Africa, small supermarkets have
also started to operate in poor township areas of South Africa. Pick ‘n Pay, SPAR and Checkers
are at the forefront of such expansions” (Tustin and Strydom, 2006:54).
2.4 The Informal Sector
Cantens (2012: 3) notes that the term “informal sector” is defined in different ways, but is
generally used based on a quantitative concept associated with small scale: limited finances,
minimal-volume, low-value trade, limited financial sources and minimal human resources.
This is due to the fact that the targeted consumers are generally poor and are on Tier 4 of the
income pyramid, or there are restrictions and/or lack of variety to choose from. Hart (1973: 66)
argues that because local traders cannot access formal structures, they are left with no choice
but to find informal strategies to boost their revenue and growth. Cantens (2012: 2) observes
that the difference between informal and formal is no longer that clear due to the fact that
economic policies tend to push to formalise the informal trade zone and this seems to have
been successful. Cantens (2012: 3) adds that individuals who have been retrenched from formal

22
jobs or cannot break into the formal sector due to high unemployment rates resort to joining
the informal economy. According to Lighthelm and Masuku (2003:43), the informal sector
does not conform to the legal procedures that the formal sector complies with. The informal
sector creates jobs through the various distribution channels it brings to the fore. In developing
countries, Spaza shops and fast-food stands are the main points of sale. The informal sector in
South Africa comprises of the following small business models:
Table 2.3: Informal Sector Business Models
Township General
Dealers
Flea Markets Local Shebeens and
Liquor Stores
Spaza Shops
* Stand-alone
businesses. Usually
permanent structures
built with bricks in
business zoned areas
* Convenient to local
residents offering a
wider variety of goods
than a Spaza shop
would offer
* Offer handmade
arts and crafts
* Operate in high
traffic centres like
taxi ranks
* Mainly in structures
traditionally used for
residential purposes
* Specialise in selling
alcoholic beverages
* Small businesses
operating in
residential sections
* Mainly in
structures
traditionally used for
residential purposes
Source: Ligthem and Masuku. (2003).
While recent data on the informal economy is hard to come by, Abrahams and Pogue (2012:
62) notes that research conducted by the eThekwini Economic Development and Investment
Promotion Unit in September 2012 found that informal businesses generated approximately
R36 629 500 in monthly revenue. Ninety eight per cent of these retailers employed between
one and three employees and 49% sold food items, while 46% sold non-food items. Ninety
three per cent did not belong to a business association, mainly because they were not aware of
such associations. Services offered ranged from personal to building, entertainment and
transportation services (Abrahams and Pogue, 2012: 12).
Penetrating township markets and understanding the local shopper are challenges that are high
on the agenda of most retailers and suppliers in the FMCG sector. Retailers need to conduct
thorough research in order to formulate a winning business strategy in such areas (Gonzalez
and Waley, 2013: 966). Using formal retail and wholesale tactics to penetrate emerging markets
does not necessarily guarantee success. The majority of consumers in these townships are on
23
Tier 4 of the income pyramid and earn less than R5 000 per month. Public transport is the most
common mode of transportation and the close proximity of retail hubs is an important aspect
of decision making. Thus, retailers should establish a route to market which is in proximity to
informal retail businesses (Kenny, 2011:56). Organisations that have successfully penetrated
the emerging market have used route to market as an important aspect of their expansion
strategy, SAB, Brand-house, Unilever and P&G are examples (Gonzalez and Waley, 2013:
973). These organisations did not bypass established local wholesalers but made them an
important aspect of their strategy (Ouma, 2013:51).
Tustin and Strydom (2006:61) acknowledge that the local informal township trading landscape
is dynamic and changes over time mainly due to the fact that many businesses are owned by
foreigners who have substantial business knowledge. The majority of local Spaza shops are
well-managed with sound record keeping and technological devices such as credit card
facilities for consumers and stay open for longer hours seven days a week. These foreign
business owners buy in groups and shop around for deals to benefit from bulk buying discounts
which enable them to adopt a competitive strategy. Retailers that seek to expand into the
townships could form long-term relationships with local owners and make them an important
aspect of their route to market or distribution strategy (Humphrey, 2007: 52).
Cantens (2012: 3) notes that globalisation and migration have led to increased informal trade
such as that witnessed in northern and southern Africa. Goods are exchanged between relatives
in different countries and commuters carry large quantities of goods and products for resale.
Networks of money exchangers and authorised exporters have been established. Verick (2004:
2) observes that contrary to the expectations of early development practitioners and researchers,
the informal sector has grown in developing countries, with Africa showing substantial growth
in this sector chiefly because it dominates most economies in terms of both output and job
creation. This growth has occurred side by side with the increase in globalisation and emerging
markets. Empirical evidence suggests that this produces winners and losers in all economies
(Cantens, 2012: 3). The ultimate objective of all African governments is sustainable job
creation and poverty alleviation, and this can be achieved by stimulating the economy through
encouraging an entrepreneurial culture among locals in townships and rural markets and also
by encouraging fair competitive trade (Cantens, 2012: 3).

24
Radovic (2013: 17) describes the informal sector as all economic activities that are not
regulated by law and are not taxed but do contribute to the government’s productivity levels,
unlike the formal sector. However, the informal sector differs from economy to economy and
can be defined in different terms depending on the particular economy. Ouma et al. (2013: 78)
further notes that there are huge differences between economies or countries in terms of
profiling and categorising what constitutes their informal sector. The table below shows the
characteristics of the informal economy that have been broadly applied in recent times.
Table 2.4 Characteristics of the informal economy – The new view
Characteristics of the informal economy – The new view
“The informal economy is ‘here to stay’ and expanding with modern, industrial
growth.
It is a major provider of employment, goods and services for lower-income groups.
It contributes a significant share of GDP.
It is linked to the formal economy — it produces for, trades with, distributes for and
provides services to the formal economy.
Much of the recent rise in informal employment is due to the decline in formal
employment or to the informalisation of previously formal employment relationships.
It is made up of a wide range of informal occupations — both ‘resilient old forms’ such
as casual day labour in construction and agriculture as well as ‘emerging new ones’
such as temporary and part-time jobs as well as homework for high tech industries.
It is made up of non-standard wage workers as well as entrepreneurs and self-employed
persons producing legal goods and services, albeit through irregular or unregulated
means. Most entrepreneurs and the self-employed are amenable to, and would
welcome, efforts to reduce barriers to registration and related transaction costs and to
increase the benefits of regulation; and most informal wage workers would welcome
more stable jobs and rights.
Informal enterprises include not only survival activities but stable enterprises and
dynamic, growing businesses; and informal employment includes not only self-
employment but wage employment. All forms of informal employment are affected by
most (if not all) economic policies”.
Source: Markovic MR. (2009).
Callaghan (2014: 333) notes that the informal sector is made up of two different groups. The
first is influenced by coping behaviours due to scarce resources or limited earning opportunities
in their environment, while the second makes a deliberate, informed decision to become
25
entrepreneurs or desires to move away from structures that are state regulated (Markovic, 2009:
18).
2.4.1 The Size of the Informal Sector
The official estimates by the World Bank are that the informal economy in developing
countries generates 40% of Gross Domestic Product (GDP) (Beneke et al., 2011: 92). Small
informal local traders are a core source of income and means of survival in developing
countries. South Africa is no exception in this regard and informal retail activities are common.
Woodward et al. (2011: 37) observe that multiple methods are used to measure and estimate
the extent of the informal sector; these can be divided into direct and indirect approaches. It is
worth noting that it is a challenge to measure the informal economy due to its nature and the
difficulty of monitoring and regulating it through formal structures. However, there is general
consensus that the informal economy contributes immensely to economies due to its substantial
scale. It is also believed that the informal economy will continue to grow in years to come as
witnessed in both developing and developed countries.
Woodward, Rolfe, Ligthelm and Guimaraes (2011: 37) note that the direct approach has been
utilised in quite a number of countries, often for micro-oriented purposes because they cover
very small areas. The disadvantages of the direct approach include the fact that it only operates
at micro scale and that respondents may be unwilling to participate or supply information. The
advantages are that the informal sector can be accessed directly and the fact that this method
provides more specific details in terms of the dynamics, nature and composition of the informal
sector (Woodward et al., 2011: 37).
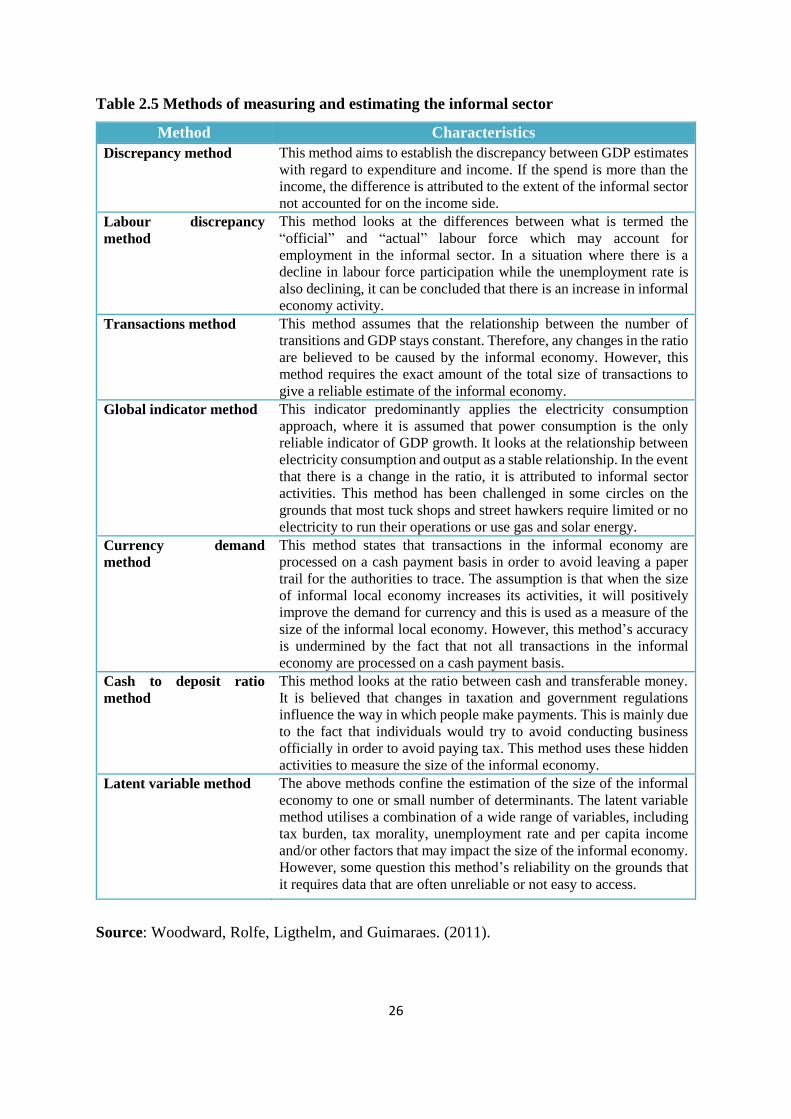
26
Table 2.5 Methods of measuring and estimating the informal sector
Method Characteristics
Discrepancy method This method aims to establish the discrepancy between GDP estimates
with regard to expenditure and income. If the spend is more than the
income, the difference is attributed to the extent of the informal sector
not accounted for on the income side.
Labour discrepancy
method
This method looks at the differences between what is termed the
“official” and “actual” labour force which may account for
employment in the informal sector. In a situation where there is a
decline in labour force participation while the unemployment rate is
also declining, it can be concluded that there is an increase in informal
economy activity.
Transactions method This method assumes that the relationship between the number of
transitions and GDP stays constant. Therefore, any changes in the ratio
are believed to be caused by the informal economy. However, this
method requires the exact amount of the total size of transactions to
give a reliable estimate of the informal economy.
Global indicator method This indicator predominantly applies the electricity consumption
approach, where it is assumed that power consumption is the only
reliable indicator of GDP growth. It looks at the relationship between
electricity consumption and output as a stable relationship. In the event
that there is a change in the ratio, it is attributed to informal sector
activities. This method has been challenged in some circles on the
grounds that most tuck shops and street hawkers require limited or no
electricity to run their operations or use gas and solar energy.
Currency demand
method
This method states that transactions in the informal economy are
processed on a cash payment basis in order to avoid leaving a paper
trail for the authorities to trace. The assumption is that when the size
of informal local economy increases its activities, it will positively
improve the demand for currency and this is used as a measure of the
size of the informal local economy. However, this method’s accuracy
is undermined by the fact that not all transactions in the informal
economy are processed on a cash payment basis.
Cash to deposit ratio
method
This method looks at the ratio between cash and transferable money.
It is believed that changes in taxation and government regulations
influence the way in which people make payments. This is mainly due
to the fact that individuals would try to avoid conducting business
officially in order to avoid paying tax. This method uses these hidden
activities to measure the size of the informal economy.
Latent variable method The above methods confine the estimation of the size of the informal
economy to one or small number of determinants. The latent variable
method utilises a combination of a wide range of variables, including
tax burden, tax morality, unemployment rate and per capita income
and/or other factors that may impact the size of the informal economy.
However, some question this method’s reliability on the grounds that
it requires data that are often unreliable or not easy to access.
Source: Woodward, Rolfe, Ligthelm, and Guimaraes. (2011).
27
Beneke et al. (2011: 96) notes that the dual nature of the informal economy in South Africa –
as survivalist businesses or operations which are established to escape poverty or due to un-
employment in the formal sector, as well as business operations established to avoid tax and
compliance with government regulations – renders the use of direct approaches appropriate in
estimating the size of this sector.
2.5 Transformation
McGaffin, Napier and Gavera (2014: 376) note that there has been a significant increase in
township mall developments in emerging markets in South Africa. In South Africa’s biggest
township, Soweto, a minimum of six malls have opened their doors since 2005, including,
among others, Maponya Mall, Jabulani Mall and the Bara Mall (McGaffin et al., 2014: 376).
In Cape Town townships, local residents are able to shop at malls. In Durban, malls have been
developed in Umlazi (Mega City and KwaMnyandu Mall) while the Bridge City Mall was
constructed in Kwa-Mashu. These malls have changed the face of retail trading for township
consumers and local informal retailers who for many years provided township residents’ needs
(Beneke et al. (2011: 94).
Township malls are seen as creating development and growth in previously disadvantaged
areas. However, they have sparked mixed reactions. Supported arguments among others are
that these developments have an adverse effect on local informal business as they displace
informal traders due to increased competition. Others are of the opinion that the malls widen
the range of goods and services to local consumers at competitive prices, and reduce travel
costs as well as substantially decrease the total cost of ownership of goods (Klemz, Boshoff,
& Mazibuko, 2006: 593). Some commentators regard the development of township malls as
the positive transformation of trading activities in township areas that encourages further
investment and improves the standard of living in townships. It is clear that township malls
are an ever-growing reality that is part of the market changes in South African emerging
markets (Klemz et al., 2006: 593).
2.5.1 National development in emerging markets’ retail centres
Figure 2.2 below shows the total number of retail centres by province, with Gauteng having
the largest number, closely followed by KZN. The first retail centre was developed in KZN in
1962, followed by the Western Cape in 1978 and Gauteng in 1984. An increase in the average
size of a retail centre is believed to be an indication of increased demand among local
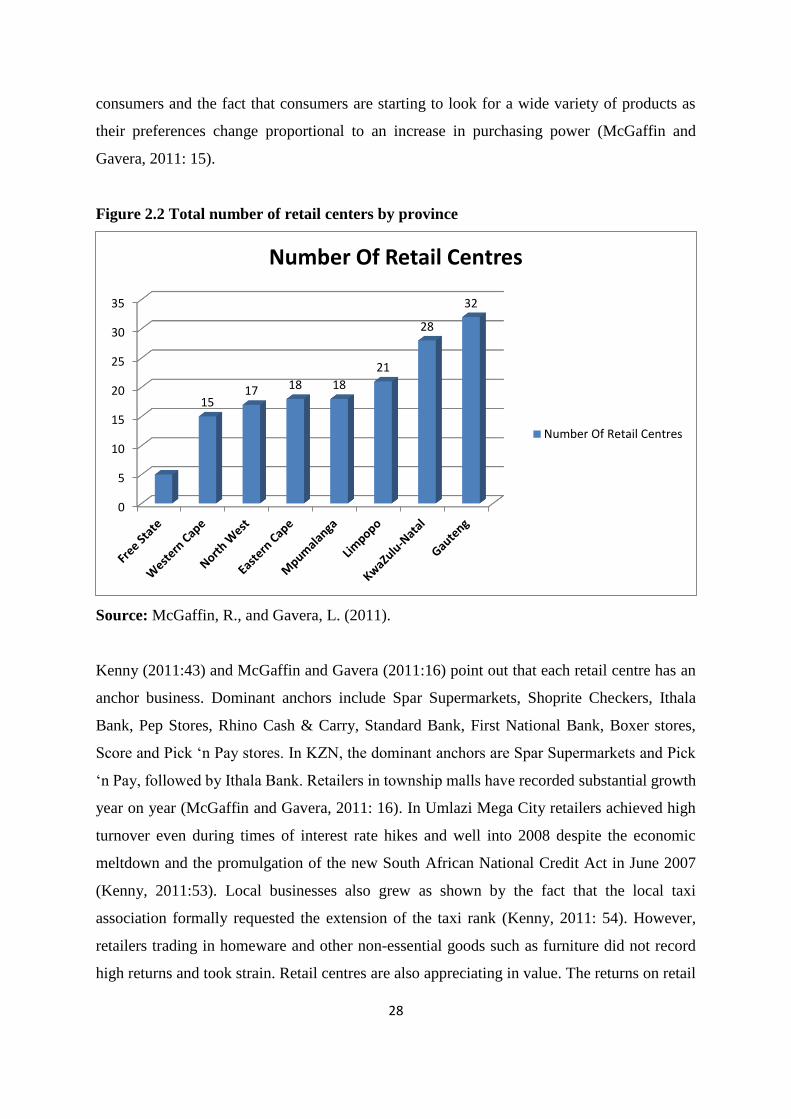
28
consumers and the fact that consumers are starting to look for a wide variety of products as
their preferences change proportional to an increase in purchasing power (McGaffin and
Gavera, 2011: 15).
Figure 2.2 Total number of retail centers by province
Source: McGaffin, R., and Gavera, L. (2011).
Kenny (2011:43) and McGaffin and Gavera (2011:16) point out that each retail centre has an
anchor business. Dominant anchors include Spar Supermarkets, Shoprite Checkers, Ithala
Bank, Pep Stores, Rhino Cash & Carry, Standard Bank, First National Bank, Boxer stores,
Score and Pick ‘n Pay stores. In KZN, the dominant anchors are Spar Supermarkets and Pick
‘n Pay, followed by Ithala Bank. Retailers in township malls have recorded substantial growth
year on year (McGaffin and Gavera, 2011: 16). In Umlazi Mega City retailers achieved high
turnover even during times of interest rate hikes and well into 2008 despite the economic
meltdown and the promulgation of the new South African National Credit Act in June 2007
(Kenny, 2011:53). Local businesses also grew as shown by the fact that the local taxi
association formally requested the extension of the taxi rank (Kenny, 2011: 54). However,
retailers trading in homeware and other non-essential goods such as furniture did not record
high returns and took strain. Retail centres are also appreciating in value. The returns on retail
0
5
10
15
20
25
30
35
1517 18 18
21
28
32
Number Of Retail Centres
Number Of Retail Centres
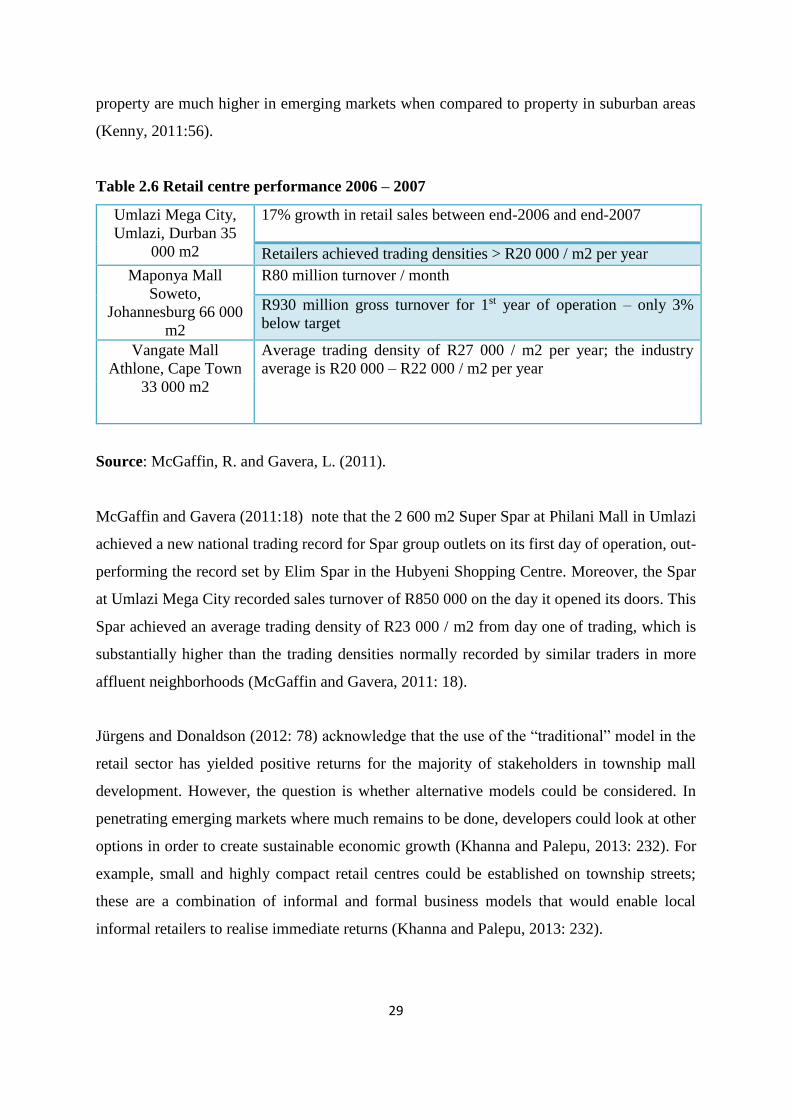
29
property are much higher in emerging markets when compared to property in suburban areas
(Kenny, 2011:56).
Table 2.6 Retail centre performance 2006 – 2007
Umlazi Mega City,
Umlazi, Durban 35
000 m2
17% growth in retail sales between end-2006 and end-2007
Retailers achieved trading densities > R20 000 / m2 per year
Maponya Mall
Soweto,
Johannesburg 66 000
m2
R80 million turnover / month
R930 million gross turnover for 1st year of operation – only 3%
below target
Vangate Mall
Athlone, Cape Town
33 000 m2
Average trading density of R27 000 / m2 per year; the industry
average is R20 000 – R22 000 / m2 per year
Source: McGaffin, R. and Gavera, L. (2011).
McGaffin and Gavera (2011:18) note that the 2 600 m2 Super Spar at Philani Mall in Umlazi
achieved a new national trading record for Spar group outlets on its first day of operation, out-
performing the record set by Elim Spar in the Hubyeni Shopping Centre. Moreover, the Spar
at Umlazi Mega City recorded sales turnover of R850 000 on the day it opened its doors. This
Spar achieved an average trading density of R23 000 / m2 from day one of trading, which is
substantially higher than the trading densities normally recorded by similar traders in more
affluent neighborhoods (McGaffin and Gavera, 2011: 18).
Jürgens and Donaldson (2012: 78) acknowledge that the use of the “traditional” model in the
retail sector has yielded positive returns for the majority of stakeholders in township mall
development. However, the question is whether alternative models could be considered. In
penetrating emerging markets where much remains to be done, developers could look at other
options in order to create sustainable economic growth (Khanna and Palepu, 2013: 232). For
example, small and highly compact retail centres could be established on township streets;
these are a combination of informal and formal business models that would enable local
informal retailers to realise immediate returns (Khanna and Palepu, 2013: 232).
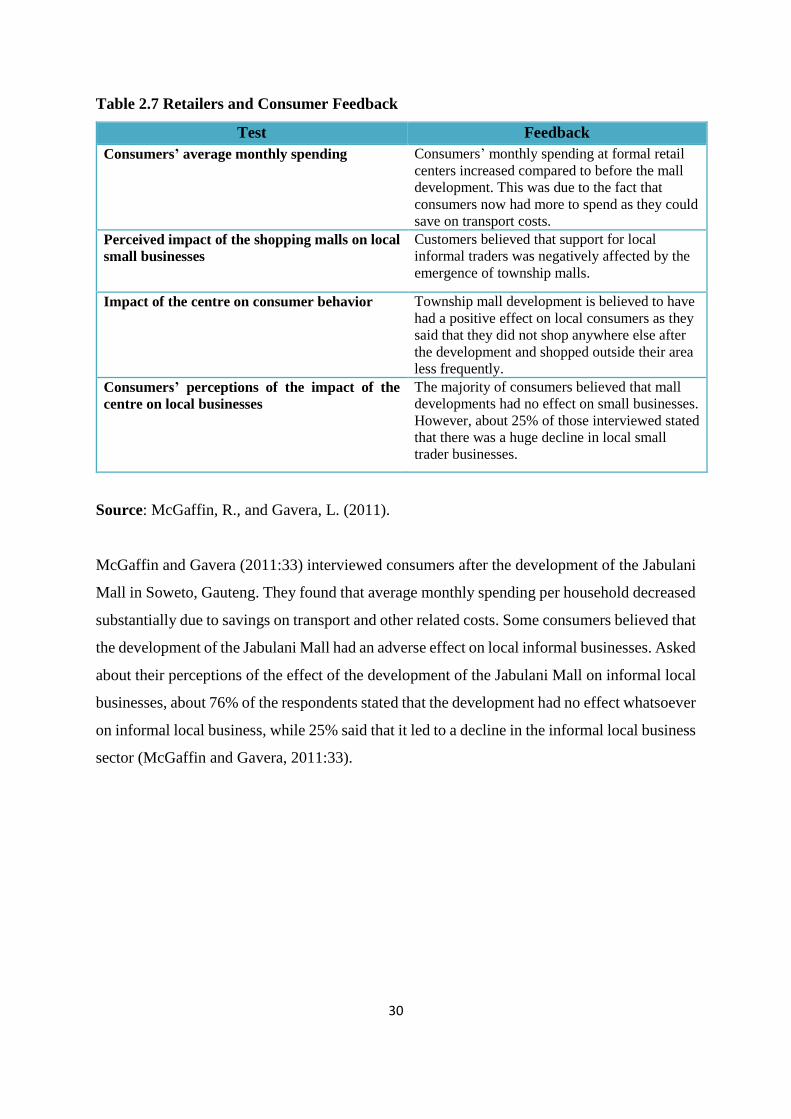
30
Table 2.7 Retailers and Consumer Feedback
Test Feedback
Consumers’ average monthly spending Consumers’ monthly spending at formal retail
centers increased compared to before the mall
development. This was due to the fact that
consumers now had more to spend as they could
save on transport costs.
Perceived impact of the shopping malls on local
small businesses
Customers believed that support for local
informal traders was negatively affected by the
emergence of township malls.
Impact of the centre on consumer behavior Township mall development is believed to have
had a positive effect on local consumers as they
said that they did not shop anywhere else after
the development and shopped outside their area
less frequently.
Consumers’ perceptions of the impact of the
centre on local businesses
The majority of consumers believed that mall
developments had no effect on small businesses.
However, about 25% of those interviewed stated
that there was a huge decline in local small
trader businesses.
Source: McGaffin, R., and Gavera, L. (2011).
McGaffin and Gavera (2011:33) interviewed consumers after the development of the Jabulani
Mall in Soweto, Gauteng. They found that average monthly spending per household decreased
substantially due to savings on transport and other related costs. Some consumers believed that
the development of the Jabulani Mall had an adverse effect on local informal businesses. Asked
about their perceptions of the effect of the development of the Jabulani Mall on informal local
businesses, about 76% of the respondents stated that the development had no effect whatsoever
on informal local business, while 25% said that it led to a decline in the informal local business
sector (McGaffin and Gavera, 2011:33).
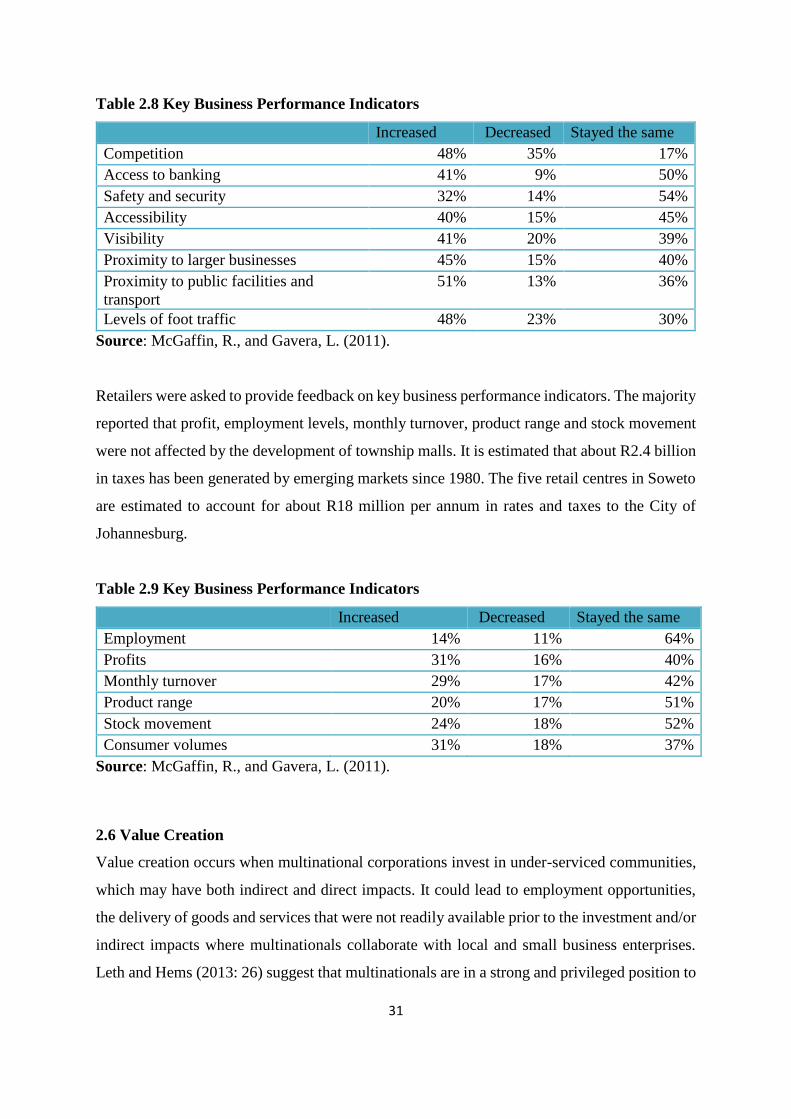
31
Table 2.8 Key Business Performance Indicators
Increased Decreased Stayed the same
Competition 48% 35% 17%
Access to banking 41% 9% 50%
Safety and security 32% 14% 54%
Accessibility 40% 15% 45%
Visibility 41% 20% 39%
Proximity to larger businesses 45% 15% 40%
Proximity to public facilities and
transport
51% 13% 36%
Levels of foot traffic 48% 23% 30%
Source: McGaffin, R., and Gavera, L. (2011).
Retailers were asked to provide feedback on key business performance indicators. The majority
reported that profit, employment levels, monthly turnover, product range and stock movement
were not affected by the development of township malls. It is estimated that about R2.4 billion
in taxes has been generated by emerging markets since 1980. The five retail centres in Soweto
are estimated to account for about R18 million per annum in rates and taxes to the City of
Johannesburg.
Table 2.9 Key Business Performance Indicators
Increased Decreased Stayed the same
Employment 14% 11% 64%
Profits 31% 16% 40%
Monthly turnover 29% 17% 42%
Product range 20% 17% 51%
Stock movement 24% 18% 52%
Consumer volumes 31% 18% 37%
Source: McGaffin, R., and Gavera, L. (2011).
2.6 Value Creation
Value creation occurs when multinational corporations invest in under-serviced communities,
which may have both indirect and direct impacts. It could lead to employment opportunities,
the delivery of goods and services that were not readily available prior to the investment and/or
indirect impacts where multinationals collaborate with local and small business enterprises.
Leth and Hems (2013: 26) suggest that multinationals are in a strong and privileged position to
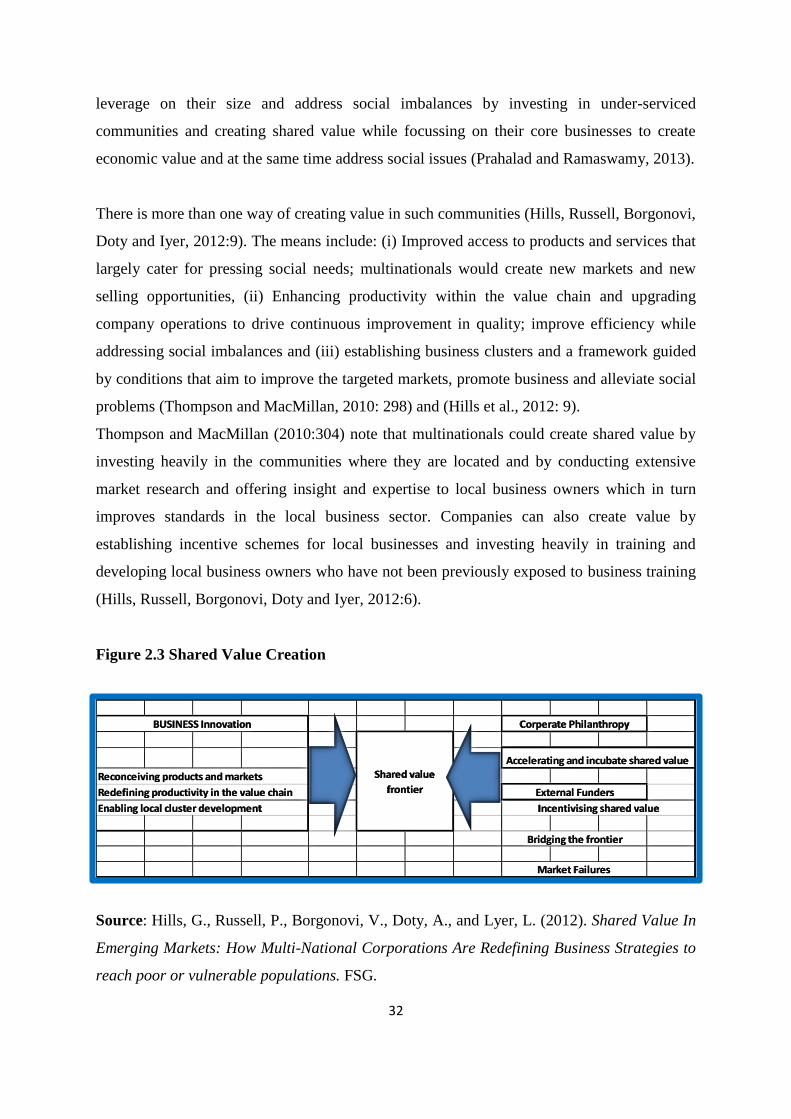
32
leverage on their size and address social imbalances by investing in under-serviced
communities and creating shared value while focussing on their core businesses to create
economic value and at the same time address social issues (Prahalad and Ramaswamy, 2013).
There is more than one way of creating value in such communities (Hills, Russell, Borgonovi,
Doty and Iyer, 2012:9). The means include: (i) Improved access to products and services that
largely cater for pressing social needs; multinationals would create new markets and new
selling opportunities, (ii) Enhancing productivity within the value chain and upgrading
company operations to drive continuous improvement in quality; improve efficiency while
addressing social imbalances and (iii) establishing business clusters and a framework guided
by conditions that aim to improve the targeted markets, promote business and alleviate social
problems (Thompson and MacMillan, 2010: 298) and (Hills et al., 2012: 9).
Thompson and MacMillan (2010:304) note that multinationals could create shared value by
investing heavily in the communities where they are located and by conducting extensive
market research and offering insight and expertise to local business owners which in turn
improves standards in the local business sector. Companies can also create value by
establishing incentive schemes for local businesses and investing heavily in training and
developing local business owners who have not been previously exposed to business training
(Hills, Russell, Borgonovi, Doty and Iyer, 2012:6).
Figure 2.3 Shared Value Creation
Source: Hills, G., Russell, P., Borgonovi, V., Doty, A., and Lyer, L. (2012). Shared Value In
Emerging Markets: How Multi-National Corporations Are Redefining Business Strategies to
reach poor or vulnerable populations. FSG.
Market Failures
BUSINESS Innovation
Reconceiving products and markets
Redefining productivity in the value chain
Enabling local cluster development
Shared value
frontier
Corperate Philanthropy
Accelerating and incubate shared value
External Funders
Incentivising shared value
Bridging the frontier
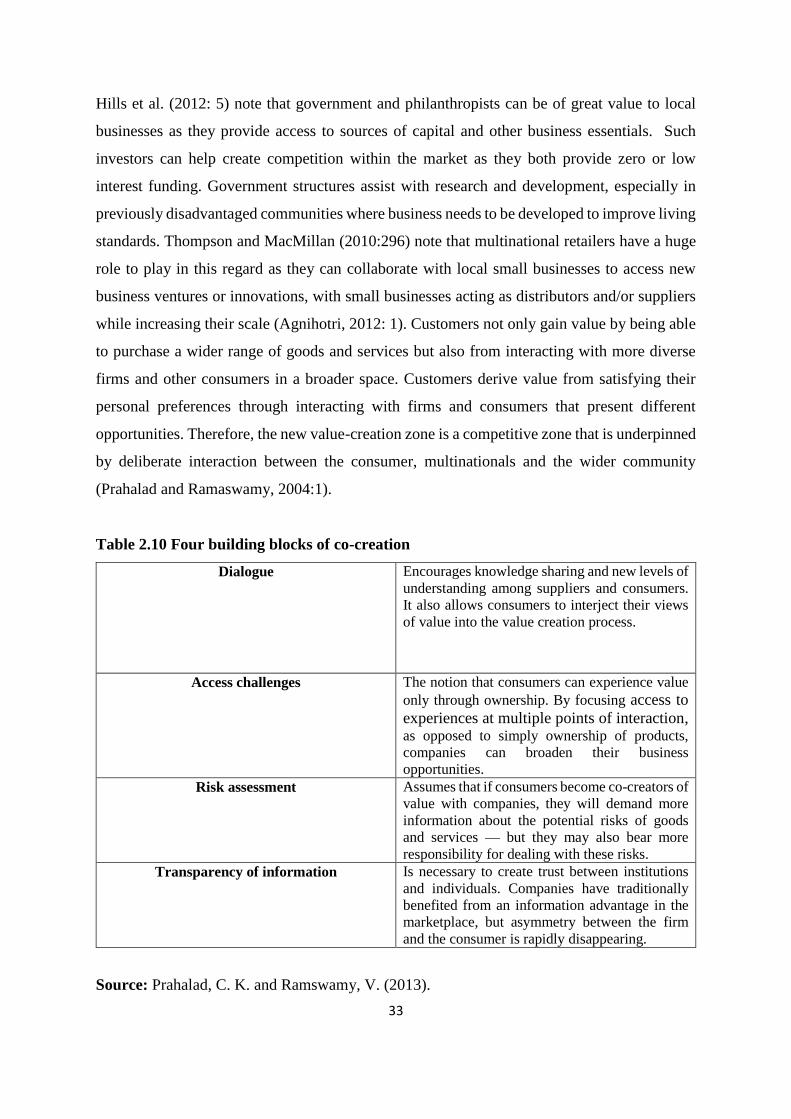
33
Hills et al. (2012: 5) note that government and philanthropists can be of great value to local
businesses as they provide access to sources of capital and other business essentials. Such
investors can help create competition within the market as they both provide zero or low
interest funding. Government structures assist with research and development, especially in
previously disadvantaged communities where business needs to be developed to improve living
standards. Thompson and MacMillan (2010:296) note that multinational retailers have a huge
role to play in this regard as they can collaborate with local small businesses to access new
business ventures or innovations, with small businesses acting as distributors and/or suppliers
while increasing their scale (Agnihotri, 2012: 1). Customers not only gain value by being able
to purchase a wider range of goods and services but also from interacting with more diverse
firms and other consumers in a broader space. Customers derive value from satisfying their
personal preferences through interacting with firms and consumers that present different
opportunities. Therefore, the new value-creation zone is a competitive zone that is underpinned
by deliberate interaction between the consumer, multinationals and the wider community
(Prahalad and Ramaswamy, 2004:1).
Table 2.10 Four building blocks of co-creation
Dialogue Encourages knowledge sharing and new levels of
understanding among suppliers and consumers.
It also allows consumers to interject their views
of value into the value creation process.
Access challenges The notion that consumers can experience value
only through ownership. By focusing access to
experiences at multiple points of interaction, as opposed to simply ownership of products,
companies can broaden their business
opportunities.
Risk assessment Assumes that if consumers become co-creators of
value with companies, they will demand more
information about the potential risks of goods
and services — but they may also bear more
responsibility for dealing with these risks.
Transparency of information Is necessary to create trust between institutions
and individuals. Companies have traditionally
benefited from an information advantage in the
marketplace, but asymmetry between the firm
and the consumer is rapidly disappearing.
Source: Prahalad, C. K. and Ramswamy, V. (2013).

34
Crush and Frayne (2011: 785) and Moingeon and Lehmann-Ortega (2010: 309) observe that
the biggest challenge in multinationals’ expansion to South African townships is to manage the
relationship between formal and informal activities in a way that ensures win-win interaction.
One way to do this is for multinationals to act as a consumer pull for local small businesses,
which can result in their growth and sustainability. The second most important result of a win-
win interaction between formal and informal activities is that investors would be attracted to
invest heavily and by so doing create value that is not only enjoyed by local businesses but by
consumers and the community at large (McGaffin and Gavera, 2011: 5). Local government
will most likely invest in nodal developments and neighborhood infrastructure development.
Value creation can be achieved in South African townships when the local municipality is able
to collect and generate revenue which enables it to apply for loans and funding. Flexibility in
expenditure can be achieved and the municipality could qualify for government subsidies for
developmental purposes (McGaffin and Gavera, 2011: 6). The biggest opportunities for value
creation in townships lie in the effective management of formal and informal interaction
(Thompson and MacMillan, 2010:293).
Khanna and Palepu (2000: 271) note that increased competition may add value to local
consumers as it may result in competitive pricing strategies and a wide range of quality goods
and services as well as improved service. To take Chile as an example, in 1981 there was no
active regulation of the market and it was open to global companies. The economy collapsed
and the state adopted intervention measures from 1981-1983. As part of the recovery strategy,
the government privatised most companies and firms and there was strict regulation. As time
went by, there was less regulation of primary markets in order to attract investment in less
developed markets (Yunus, Moingeon and Lehmann, 2010: 311).
2.7 Distribution Channels/Models
Coughlan et al. (2006a: 56) and Ancarani et al. (2014: 32) argue that, distribution models are
important part of the chain of firms and stakeholders in the flow of a product from producer to
consumer. Firms that have succeeded in emerging markets applied innovative and
unconventional distribution approaches that are sufficiently flexible to achieve success
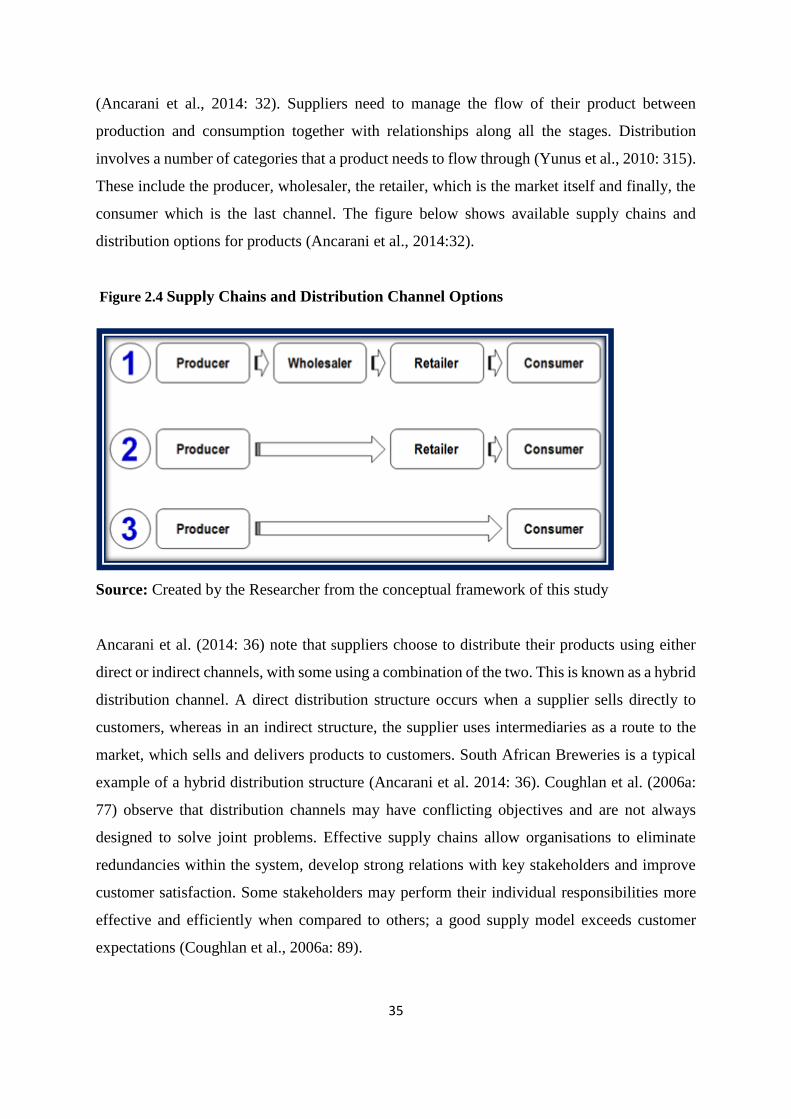
35
(Ancarani et al., 2014: 32). Suppliers need to manage the flow of their product between
production and consumption together with relationships along all the stages. Distribution
involves a number of categories that a product needs to flow through (Yunus et al., 2010: 315).
These include the producer, wholesaler, the retailer, which is the market itself and finally, the
consumer which is the last channel. The figure below shows available supply chains and
distribution options for products (Ancarani et al., 2014:32).
Figure 2.4 Supply Chains and Distribution Channel Options
Source: Created by the Researcher from the conceptual framework of this study
Ancarani et al. (2014: 36) note that suppliers choose to distribute their products using either
direct or indirect channels, with some using a combination of the two. This is known as a hybrid
distribution channel. A direct distribution structure occurs when a supplier sells directly to
customers, whereas in an indirect structure, the supplier uses intermediaries as a route to the
market, which sells and delivers products to customers. South African Breweries is a typical
example of a hybrid distribution structure (Ancarani et al. 2014: 36). Coughlan et al. (2006a:
77) observe that distribution channels may have conflicting objectives and are not always
designed to solve joint problems. Effective supply chains allow organisations to eliminate
redundancies within the system, develop strong relations with key stakeholders and improve
customer satisfaction. Some stakeholders may perform their individual responsibilities more
effective and efficiently when compared to others; a good supply model exceeds customer
expectations (Coughlan et al., 2006a: 89).

36
2.7.2 Hybrid
Wedan (2006:3) highlights that some activities in both direct and indirect channels are mutually
exclusive; however, most diverse suppliers and stores, such as department stores and major
production companies are hybrids, meaning that they produce but also own and sell their
products. Research has shown that most firms utilise direct and indirect channels to reach the
final consumer. Wedan (2006:3) notes that to leverage opportunities in emerging markets,
retailers must transition from operating with a limited number of customers to catering for a
wider market in an efficient and responsive manner that lowers the cost of sourcing goods and
services. Coughlan et al. (2006a: 65) note that there are benefits associated with the
transformation of businesses’ logistical strategy. Recent studies have shown that distribution
channels evolve over time and change as role players seek to take advantage of constant change
by creating value for their consumers. Small businesses in South African townships present an
added channel in the distribution of products. Although they came into being to provide
supplies for identified demand, small businesses soon discover that the channel or services
rendered have long been provided (Mukherjee, Cuthbertson and Banerjee, 2013: 86).
The role of the middle-man is described by Wedan (2006:3) as a series of activities involving
searching out buyers and sellers and persuading buyers to buy a preferred product through
personal selling and promotional activities. A middle-man also monitors the process of
distribution where required while providing quality feedback to the supplier in the form of
market intelligence and what the market thinks of the suppliers’ goods and/or products
(Mukherjee et al., 2013: 87).
However, some supplies prefer to by-pass the middleman (Ancarani et al., 2014:44; Mukherjee
et al. (2013: 55) in order to control and maintain consumer prices. At times, there are too many
middle-men between the supplier and consumer and each adds their own mark-up which
increases prices, causing the supplier to lose their edge over competitors or substitute goods. If
a supplier has established an effective supply chain for product flow, eliminating the middle-
man would be ideal as middle-men often cause unnecessary delays in the supply chain.
Mukherjee et al. (2013: 131) observe that eliminating the middle-man results in an un-
interrupted and time effective flow of products. The role of the wholesaler is to buy in bulk
from the supplier and break bulk into smaller quantities for the retailer. The wholesaler also
plays a forecasting role for retailers in buying and distributing the correct quantities. Storage,

37
packing, sales promotions, financing and risk-taking are some of the functions and activities a
wholesaler offers to the supplier (Coughlan et al., 2006a: 56). When a supplier is choosing a
distribution channel, the nature and type of the product has a huge influence in deciding which
channel to consider. The nature and size of the market to be served also influences the choice
of channel.
Mukherjee et al. (2013: 99); Gorczynski and Kooijman (2015: 7) note that one of the primary
aims of an effective distribution channel is to reduce inventory levels in order to implement a
smooth product flow that reaches the final consumer as fast as possible. It involves the
reduction of turn-around-times and more frequent delivery of smaller order quantities both
internally and externally. In South Africa, most suppliers have employed the hybrid system of
product distribution, which involves both primary and secondary distribution. Wedan
(2006:75) notes that the supply chain has become demand driven; the customer has more power
and influence on how retailers and suppliers conduct their business. Suppliers implement
distribution channels that reduce unnecessary inventory and focus on their core capabilities
while outsourcing non-core activities.
Porter and Kramer (2011: 65) state that reaching markets far and wide requires the
implementation and optimisation of dynamic distribution channels. Due to fragmentation,
access to some outlets in emerging markets may prove to be one of the biggest challenges for
any organisation. The cost of distribution may be high in emerging markets; this hinders
companies from supplying affordable, available and appealing products and services.
Therefore, for companies to reach outlets far and wide they need to implement an extensive
distribution network system (Saksena, Saksena, Jain and Parveen, 2013:279). The role of the
wholesaler and the distributor is to provide value added services that are aligned with the
product’s mission and the direction taken by the brand principal. Distributors need to be
assisted during the planning phase in terms of the delivery routes strategy, inventory
management, frequency of calling plans and stock management principles at warehouse level
to manage product quality (Rogerson, 2013: 135).
2.7.3 Centralised and De-Centralised Distribution Systems
Some national retail chains own their own outbound warehouses in order to achieve operational
excellence. This enables them to exploit economies of scale through bulk discount benefits,
which can be re-invested in the business. It also offers companies the opportunity to control

38
the entire supply chain in support of the company’s key objectives (Fernie and Sparks, 2014:
121). This approach reduces the total cost of ownership of goods and services to the final
consumer. Emerging markets are quite price sensitive, especially on price elastic goods and a
solid pricing strategy is essential for a company to succeed in emerging markets (Mbhele, 2012:
142). Distribution centers are a link between retailers and suppliers that ensures that the correct
orders are received and dispatched on time and in full without any defects. Fast moving
distribution centers are a true reflection of a company’s customer service strategy and
demonstrate how a company values its customers from a customer service strategy point of
view. Implementing Just-in-time systems in warehouse optimization processes goes a long way
in reducing distribution costs which boosts the company’s financial position (Saksena et al.,
2013: 285).
2.8 Distribution Networks
Neuwirth (2012: 6) observes that when a company decides to penetrate emerging markets, one
of the key decisions is the design of a feasible distribution network. A poorly researched
distribution network will negatively affect the company’s net earnings. In order to succeed in
emerging markets, companies should bear three main considerations in mind: (i) the
distribution model needs to be appropriate for the distribution of the company’s goods and
services, (ii) the company needs distribution centers where all demand driven inventory is
stored as a central point in order to minimize transportation and inventory handling costs and
(iii) The company needs to collaborate and form partnerships with local enterprises who have
the ability and expertise to access remote areas (Neuwirth, 2012:6).
Perks, Dr Phani, Chikweche and Fletcher (2014:410) note that fast response times are important
for consumers in the FMCG industry. When a consumer wants to buy lunch, it is important
that the company is ready to provide the required quantities in a short time. Implementing a
new distribution network does not come cheap and easy; time and significant financial
investment are required to implement an effective network. Newirth (2012:7) suggests that one
other method companies can adopt is to partner with a company that has an established
distribution network. Companies need to clearly understand consumers’ buying patterns and
income variations in order to introduce products or goods that are relevant to local needs and
imbalances. Breaking bulk and re-designing products into smaller and cheaper packs may assist
(Perks et al., 2014: 414).
39
Sodhi and Tang (2014: 1490) further note that retail becomes a key touch point where a basic
transaction needs to be converted into the availability of products that are visible to the
consumer and that engage the consumer such that the company’s products prevail over
competitor brands. The South African retail landscape can be split into five (5) categories,
namely, Key Accounts, General Trade, Informal Trade, Cash & Carry and Wholesale.
Therefore, for companies to reach outlets far and wide they need to implement an extensive
distribution network system. A lack of roads, poor maintenance of roads and generally poor
infrastructure over long distances hamper such efforts (Rogerson, 2013: 133). Companies
entering new and emerging markets are also likely to confront challenges such as a lack of
education, which may hinder or distort information sharing. Companies should gather
information from consumers on their level of understanding of their brands and design tailor-
made education initiatives to assist consumers to know the brands or products better. They
could also consider partnering with local community organizations in order to spread product
awareness and knowledge.
Sodhi and Tang (2014:1489) and Newirth (2012:24) suggest that local community
organizations are essential partners as they are able to gather large groups of people together
in one area and brand trust is easier to achieve when presented by local and credible
organizations. The objective is always to bring the market what it wants; in the form it wants
it through convenient outlets at a sustainable cost. One approach that has been deployed by
most FMCG companies is to apply two different distribution channels; one that focuses on
existing and established key accounts and the other focusing on informal and fragmented
outlets. For this to be a success requires consistent support for sales and a market relevant
product mix at the point of sale as well as a dynamic supply chain system (Geldard, Wilding,
Waller, Rossi, Mayhew, Cigolini, and Metcalfe, 2010: 8).
To achieve mass reach in emerging markets, companies need to address three critical areas: 1)
Future-proofing distribution models, 2) Re-engineering traditional channels and 3) Building a
triple-A rated supply chain (Geldard et al., 2010: 8).

40
Figure 2.5 Today’s Distribution Channels Structure
Distribution Flow Returns and Funds Flow
Source: Geldard, Waller, Mayhew, Cigolini, and Metcalfe. (2010).
2.8.1 Re-engineering Traditional Channels
Stock, Boyer and Harmon (2010: 144) suggest that, in order to achieve optimal performance
of the channel, the approach to sales implementation needs to be re-engineered by investing in
improved sales-force efficiency and product replenishment. A re-engineered supply channel
will focus on a number of key performance indicators which are monitored and measured on
an on-going basis in order drive high performance standards. The company will therefore focus
on implementing a relevant product mix that caters for the needs of consumers in that particular
emerging market (Stock et al., 2010: 144).
2.8.2 Developing a Triple-A Rated Supply Chain
Geldard (2013:11) notes that in order to implement an effective supply chain that is reliable,
and delivers products on time that are available at all times at an affordable price and that are
appealing to the consumer there are specific pre-requisites for success. A demand driven
Sales to distribution Sales to tradeSales to
consumer
Brand
Principal
Distributor
Wholesaler
Mass Market
Retail Trade
Organised Retail
Key Accounts
Consumer

41
customer service plan that caters for the needs and requirements of a consumer in emerging
markets needs to be developed and implemented in order to drive product growth and
profitability. This not only involves establishing effective distribution channels but partnering
with local and small business enterprises that have been working in the tough and dynamic
conditions of the emerging market (Saab, Correa and Bowers, 2008:125).
Saab Jr et al. (2008: 127) in FMCG companies, profitability is not achieved through driving
sales volumes; by implementing an effective supply channel system companies can reduce
distribution costs and prices due to improved economies of scale. Sodhi and Tang (2014:1485)
note that collaborations and strategic partnerships with distributors and suppliers improve a
company’s efficiency and reduce wastage. A fundamental change in supply approach may
include changing the package size of a product or product range, adopting a merchandising
plan that reflects local consumer needs and a complete change in logistical approach (Hao, Bo
Li, Zeng, and Tang, 2014: 48)
Figure 2.6 below shows a maximised triple-A approach that is aimed at maximizing both
distribution networks and supply channels in emerging markets; it illustrates a supply chain
approach that closes the loop, demonstrating inbound and outbound flows within the supply
chain process. Anderson and Billou (2007: 16) observe that change is constant in emerging
markets and companies need to drive and enhance continuous improvement in order to achieve
excellence and leverage opportunities (Hao et al., 2014: 85).

42
Figure 2.6 Maximised Triple-A approach
Source: Geldard, Waller, Mayhew, Cigolini, and Metcalfe. (2010).
2.9 The Displacement Effect
Strydom (2006:48) observes that African consumers upgraded into the middle-income group,
and left township life for urban residential areas. These changes in economic
power/emancipation benefited formal trade. However, transformation in retail markets resulted
in formal retailers expanding into new economies. Mokgabudi (2011: 2) observes that many
members of the previously disadvantaged middle class still reside in townships, presenting
untapped markets with their own dynamics to formal traders. Large chains have recognized the
potential to broaden their operations.
Verick (2004: 2) argues that the informal sector eventually loses due to the expansion of new
economies. There are both winners and losers in new markets. Donaldson and Du Plessis
ppeal ffordable/Profitable vailable
Customer/Consumer
Need
Trade Channels Economics
(Margins & Commercials)
End to End Cost to Serv
Operational Capabilities
Supply Chain as a strategic lever for faster profitable growth
Commercial & Operational excellence as an enabler for sales growth and profit generation
Challenge for market & supply organisations
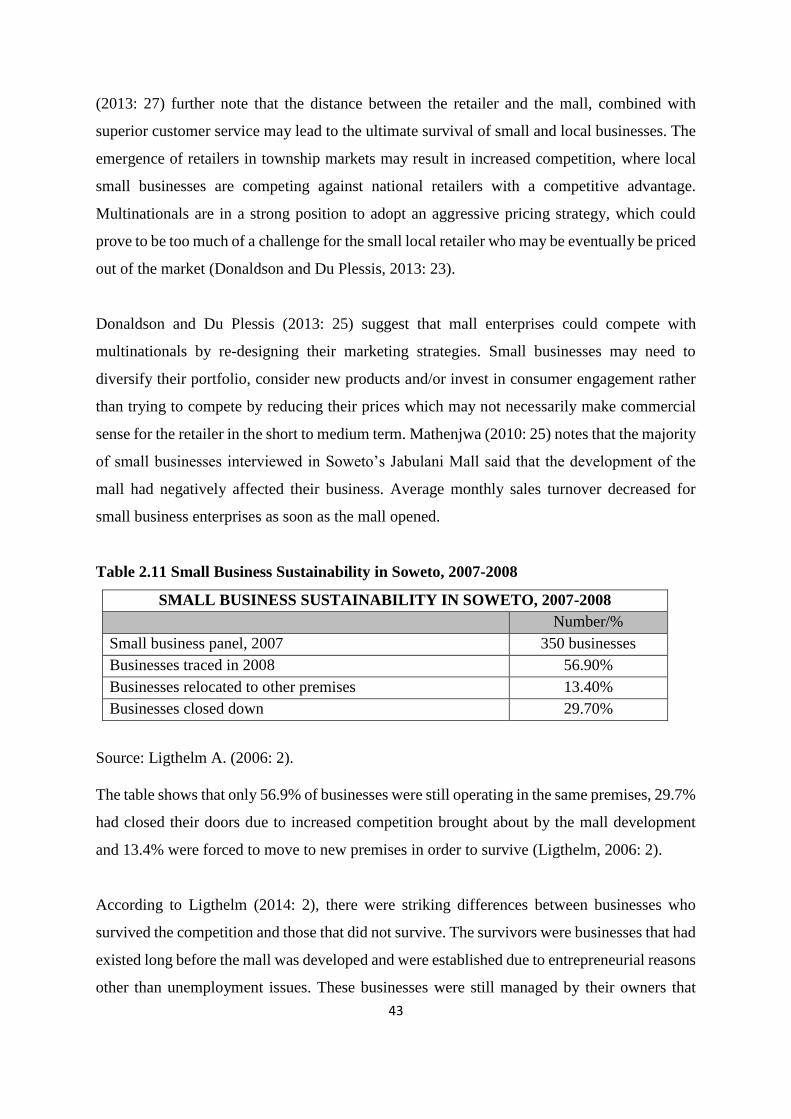
43
(2013: 27) further note that the distance between the retailer and the mall, combined with
superior customer service may lead to the ultimate survival of small and local businesses. The
emergence of retailers in township markets may result in increased competition, where local
small businesses are competing against national retailers with a competitive advantage.
Multinationals are in a strong position to adopt an aggressive pricing strategy, which could
prove to be too much of a challenge for the small local retailer who may be eventually be priced
out of the market (Donaldson and Du Plessis, 2013: 23).
Donaldson and Du Plessis (2013: 25) suggest that mall enterprises could compete with
multinationals by re-designing their marketing strategies. Small businesses may need to
diversify their portfolio, consider new products and/or invest in consumer engagement rather
than trying to compete by reducing their prices which may not necessarily make commercial
sense for the retailer in the short to medium term. Mathenjwa (2010: 25) notes that the majority
of small businesses interviewed in Soweto’s Jabulani Mall said that the development of the
mall had negatively affected their business. Average monthly sales turnover decreased for
small business enterprises as soon as the mall opened.
Table 2.11 Small Business Sustainability in Soweto, 2007-2008
SMALL BUSINESS SUSTAINABILITY IN SOWETO, 2007-2008
Number/%
Small business panel, 2007 350 businesses
Businesses traced in 2008 56.90%
Businesses relocated to other premises 13.40%
Businesses closed down 29.70%
Source: Ligthelm A. (2006: 2).
The table shows that only 56.9% of businesses were still operating in the same premises, 29.7%
had closed their doors due to increased competition brought about by the mall development
and 13.4% were forced to move to new premises in order to survive (Ligthelm, 2006: 2).
According to Ligthelm (2014: 2), there were striking differences between businesses who
survived the competition and those that did not survive. The survivors were businesses that had
existed long before the mall was developed and were established due to entrepreneurial reasons
other than unemployment issues. These businesses were still managed by their owners that

44
were fully involved in all business operations on a permanent basis. Harrison and Todes (2010:
26) argues that a number of factors other than the development of a new mall determine
business success or failure. Economic conditions and business skills are the key factors which
may lead to a business being successful or not and only small businesses within a 5km radius
from the mall can be considered (Harrison and Todes, 2010: 26).
Recent research has shown that the influence of new mall developments in emerging markets
cannot only be attributed to increased competition due to its complex nature. A survey
conducted by Harrison and Todes (2010: 28) produced a mixed bag of perceptions among small
enterprises on the emergence of township malls. Retailers who were located between 0 and 2
kilometres from the mall were largely happy and benefitted positively from the development
as it created increased foot traffic and easy access to financial institutions that were previously
not available in township areas. During the initial stages of the development of the mall, some
local retailers were incorporated and established partnerships in order to establish a win-win
situation. This exposed the development to knowledge on how local community needs could
be incorporated into the new development.
2.10 Costs
According to Blanco (2009: 2), a company requires five key supply chain capabilities to
effectively service emerging markets while achieving profitability. Emerging markets are
characterised by poor infrastructure, poor visibility of stock, political instability, and high
population density with minimum spending power, corruption, cultural diversity, congestion
and fragmented markets. Therefore, it is critical that companies that intend to penetrate
emerging markets have a solid customer service plan that encompasses market segmentation,
a supply chain distribution plan, tailored service packages, and products that are designed to
be fit and cater for specific market needs (Anderson and Billou, 2007: 16). To exploit
opportunities in emerging markets, retailers must transition from operating with a limited
number of customers to catering for a wider market in an efficient and responsive manner that
lowers the cost of sourcing goods and services. Wedan (2006:3) identifies the benefits
associated with the transformation of businesses’ logistical strategy. Catering for a broader
market requires substantial investment in human capacity and development, as well as
investment in processes that place the company in a strong position to meet demand. However,

45
Anderson and Billou (2007: 19) argue that substantial investment should not result in the final
product costing more as the masses in emerging markets have limited disposable income.
2.11 Conclusion
The detailed discussion in this chapter offered insight into the effects of township mall
developments and the critical factors responsible for the growth or decline of informal local
traders in townships. Mokgabudi (2011:2) observes that the emergence of township malls will
definitely result in increased competition which improves service levels and the quality of
goods offered. However, it is important to note that local informal traders would have to re-
arrange their strategy in order to remain relevant or suffer the consequence of being displaced.
This is because the majority of local informal traders in townships mainly trade in food,
clothing and/or other accessories with minimum to low value costs (Strydom, 2006:28; Qian
and Soopramanien, 2014:112). Emerging markets present opportunities for growth to
multinationals and also serve as a transformation vehicle for the local community. Fan (2008:
354) notes that multinationals expand their operations into townships for a number of internal
and external reasons, the most common being market saturation in the formal market.
The informal market thus presents opportunities for growth in market share and profits.
However, Strydom (2006:34) suggests that multinationals should expand into townships in
order to improve the standard of living through transformation and infrastructure development
in conjunction with local business stakeholders.
The following chapter discusses the research methodology employed to address the study’s
research objectives and questions.

46
Chapter Three
Research Methodology
3.1 Introduction
This chapter outlines the research design used for this study. It details the research
methodology, the different research techniques and their advantages and disadvantages. It also
discusses the research methods adopted for this study and the reasons for selecting them. The
study setting is described, and the sample selection and size, data collection and analysis, and
validity and reliability of the collected data are highlighted. Having presented the literature
review, this chapter focuses on the research methodology employed to address the problem
statement: To explore and analyse the perceived challenges confronting township development
through supply chain distribution systems and emerging markets. These systems of getting
goods to the township via local traders were analysed by examining the extended supply chain
partners and the structural costs of distribution in these contemporary markets. While the
emergence of township malls and suppliers’ expansion into the townships has the potential to
create jobs and improve the quality of goods and services, it is important to note that these
developments could negatively affect informal township traders.
3.2 Objectives of the study
1. To explore local informal township traders’ perceptions of the effects of value-creating
supply chain distribution systems in emerging markets.
2. To evaluate the extent to which emerging markets optimize the costs of the distribution
system and their propensity to improve product availability.
3. To examine the extent of transformation and development of townships and their effect
on local informal traders within formalised large scale supply chain configurations.
4. To assess the effects of the displacement of informal local traders as the emerging
township economy creates entry for both large scale suppliers and retailers into
township markets.
47
3.3 Research Questions
The research questions underpinning this study are:
1. What are local informal traders’ perceptions of the effects of value creating supply
chain distribution systems in emerging markets?
2. In optimising the costs of distribution systems and the propensity to improve product
availability, what effect do emerging markets have on costs to local informal traders,
intermediaries and consumers?
3. What effects do infrastructural development, township transformation and value
creating supply chain systems have on local informal traders?
4. What is the magnitude of the displacement effect on informal local traders presented
by the entry of both large scale suppliers and retailers into township markets?
3.4 Research Design
The research design is a strategic framework for action that serves as a link between the
research questions and the execution of the research (Patton, 2005: 6). In developing a research
design for this study, the researcher took the following into account: the objectives of the study,
the theoretical framework guiding the study, the context within which the study was carried
out, and the research methods to be used to collect and analyse the data (Sekaran and Bougie,
2010: 385). The objectives of this study reflect the types of conclusions the researcher intended
to draw. This study adopted a cross-sectional time horizon. Wooldridge (2012: 17) defines a
cross-sectional time horizon as data sets involving a time dimension such as time series and
panel data which requires special treatment because of the correlation across time. Other issues
such as trends and seasonality arise in the analysis of the series data. In most cases, hypotheses
in the social sciences are ceteris paribus in nature and all other relevant factors must remain
fixed when studying the relationships between two variables (Wooldridge, 2012: 17).
There are three broad research approaches, namely, quantitative, qualitative and mixed method.
Patton (2005: 2) notes that quantitative research provides numerical analysis, percentages and
trends. It helps the researcher to answer questions such as how many and how often. On the
other hand, qualitative research is an investigative method that uses naturalistic or participant
observer research (Denzin and Lincoln, 2011: 1). Qualitative research looks at variables in their
natural setting (Sekaran and Bougie, 2010: 385). Mixed methods are defined as the use of both

48
qualitative and quantitative approaches. Researchers draw liberally on both quantitative and
qualitative assumptions in order to provide the best understanding of a research problem
(Hesse-Biber, 2010: 3). This study employed quantitative research methods to achieve its
objectives through the completion of questionnaires. This method was appropriate due to its
rigorous approach to understanding, describing and producing detailed explanations of a
phenomenon (Creswell, 2013: 155) . This assisted in understanding and unpacking in detail the
impact of emerging township economic development on informal local traders and the
displacement effects.
This study employed quantitative research methods to achieve the objectives set in two parts;
the first part was a detailed literature review used as an instrument to design a guide for data
collection. The second part was data collection from local informal traders in Umlazi and Kwa-
Mashu Townships through completion of questionnaires. The analysis explored a number of
substantial issues in relation to the impact of township mall development on local informal
traders.
3.5 Research Approaches
Research approaches are divided into quantitative, qualitative and mixed approaches
(Venkatesh, Brown and Bala, 2013: 21). A quantitative research design can be categorized as
experiments, surveys and content analysis. This can be further broken down into three spheres,
experimental, quasi-experimental and non-experimental research (Venkatesh et al., 2013: 21).
The approach that was relevant to this study is a non-experimental research design, which
makes use of correlation design, criterion-group design, and cross-sectional designs, which
involve measures at a single time (Welman, Kruger and Mitchell, 2005: 64).
Qualitative research examines variables in their natural setting (Welman et al., 2005: 66).
Charmaz (2011: 368) further notes that the qualitative research method enables the researcher
to implement the system that is most suited for the study using a case study, participant
observation, focus groups and/or in-depth interviews.
Nykiel (2007: 60) notes that, in quantitative research, the researcher is more objective in
relation to the findings of the study since the relationship between the variables is studied in
detail. In contrast, a qualitative approach allows the researcher to produce more in-depth,

49
comprehensive information or visual evidence such as photographs. Quantitative research
allows the researcher to measure and analyse data; hence, the results are statistically reliable,
while qualitative research uses subjective information and participant observation to describe
the context or natural setting (Charmaz (2011: 372).
Venkatesh et al. (2013: 21) note that the results of a quantitative study are projectable to the
population and can be used to test a hypothesis in experiments due to the ability to measure
data using statistics. A qualitative approach does not need a strictly designed plan from the
outset (Maxwell, 2012: 29).
Creswell (2013: 15) notes that the disadvantages of quantitative research are that it does not
study things in a natural setting, it ignores the context of the study completely and it also
involves studying a large population sample in order to produce reliable results. The
disadvantages of the qualitative research approach are that the inquiry is subjective, which
leads to difficulties in establishing the reliability of the information, and in-depth and
comprehensive data collection limits the scope and also makes it difficult to prevent induced
bias by the researcher since the researcher interprets data according to their own view (Bernard
and Bernard, 2012: 392).
3.6 Analytical Method
This study used the statistical techniques available in the Statistical Package for the Social
Sciences (SPSS) to explore the relationships among variables as discussed in detail and listed
below. The techniques are based on correlation, which is often used by researchers in non-
experimental research designs. These techniques are used to explore the relationships between
variables and to predict scores on one variable from scores on another variable (bivariate
regression). Furthermore, they are used to predict scores on dependent variables from the scores
of a number of independent variables (multiple regression). Moreover, the structure underlying
a group of related variables can be identified (factor analysis). All these techniques are used
to assess the reliability and validity of scales in analysing and interpreting the findings (Green
and Salkind, 2010: 27).

50
3.6.1 Univariate Data Analysis
There are two types of univariate analysis which involves observing one variable at a time by
comparing the variance between different groups with the variability within each of the groups
(Gnanadesikan, 2011: 20). In this study, univariate analysis comprised frequency tables
displaying the number of informal traders and the percentage relevant to each variable in
question, which allowed for ease of understanding of whether there are significant differences
in the mean scores on the dependent variables across the data analysed.
3.6.1.1 Frequency Distribution
Benjamin and Cornell (2014: 695) define frequency distribution as the useful graphical
presentation of data by calculating the successive partial sums of frequencies up to each
interval. Diagrams such as bar charts, tables and/or graphs were used to present the quantitative
data for ease of interpretation (Cooper, Schindler and Sun, 2006: 444).
3.6.1.2 Descriptive Statistics
Descriptive statistics quantify the attributes of the data in terms of its distribution. Where
applicable, means and standard deviations are applied to analyse and interpret data (Dytham,
2011: 5). It is important to note that distribution is the description of how frequently individual
values occur. Cooper et al. (2006: 457) note that the distribution of variables can be described
in terms of its relative symmetry and skewness, a useful way of summarising cross-sectional
data represented using a frequency histogram. Vogt and Johnson (2011: 226) describe the
mean as the central tendency that has the desirable mathematical property of minimizing the
variance; the median is the value found in the middle of the sample when all sample values are
arranged in ascending or descending order and the mode is the most common or frequent value
in a sample. All three measures help to provide an indication of the skewness of the distribution
when compared. The standard deviation shows the variability of responses; it is a measure of
the average number of responses in a distribution that deviate from the mean. When the
standard deviation is large, it implies that the responses are widely spread out (Vogt and
Johnson, 2011: 375).

51
Descriptive statistics techniques were used to evaluate the variables in section A of the
questionnaire, which examined customer responses. The results were evaluated against the
bivariate and multivariate data analysis techniques to confirm the results using other forms of
analysing and evaluating data.
3.6.1.3 Bivariate Data Analysis
Bivariate data analysis is analysis using just two variables which seeks to identify the
association between them (Vogt and Johnson, 2011: 32). These techniques can be performed
in both qualitative and quantitative data analysis. To identify the association, relationships and
correlation between variables the following tools are applied: The Pearson correlation, simple
regression, Chi-square and Wilcoxon Signed Ranks, among others (Jobson, 2012: 12).
3.6.1.4 Chi-square
There are two types of chi-square tests, both involving categorical data. The chi-square
goodness-of-fit-test explores the proportion of cases that fall into the various categories of a
single variable. The chi-square test for independence is used to determine whether two
categorical variables are related (Rosner, 2010: 401). It compares the frequency of the cases
found in the various categories of one variable across the different categories of another
variable (Satorra and Bentler, 2010: 243).
The chi-square goodness-of-fit-test is a bivariate test used on a categorical variable to test
whether any of the response options are selected significantly more or less often than the others.
Among other tests, it was used to test if informal traders are benefiting from township mall
development or not (Satorra and Bentler, 2010: 245). Under the null hypothesis, it is assumed
that all responses are equally selected. Descriptive statistics quantify the attributes of the data
in terms of its distribution and central tendency, testing how frequently a particular value
occurs.
Correlation is used when one wants to describe the strength and direction of a relationship
between two variables or when one of the variables is dichotomous and the statistics obtained
is Pearson’s product-moment correlation (Cohen, West, Aiken and Leona, 2013: 1). The chi-

52
square goodness-of-fit test was applied to determine whether any of the response options were
selected significantly more often than others while the paired test was applied to establish
whether informal business traders’ income before the development of township malls was
significantly different from the income generated after the development of the malls.
3.6.1.5 Pearson Product-Moment Correlation
Pearson Product-Moment Correlation was formulated by Karl Pearson whose thinking is the
foundation of many mathematical and statistical methods commonly employed in quantitative
fields, one being the Pearson Product-Moment Correlation Coefficient and its relationship with
linear regression (Hauke and Kossowski, 2011: 88).
Pearson Product-Moment Correlation Coefficient is designed for interval level variables and is
also used if there is one continuous variable and one dichotomous variable. The Pearson
correlation coefficient (r) can only take on values from -1 to +1 (Hauke and Kossowski, 2011:
89). The sign in the front indicates whether there is a positive correlation (as one variable
increases, so too does the other), or a negative correlation (as one variable increases, the other
decreases). The size of the absolute value provides an indication of the strength of the
relationship. A perfect correlation of 1 or -1 indicates that the value of one variable can be
determined exactly by knowing the value of the other variable (Mukaka, 2012: 69).
(Mukaka, 2012: 70) further notes, that a number of issues are associated with the use of
correlation. These include the effect of the non-linear relationship, outliers, restrictions of
range, correlation versus casualty and statistical versus practical significance. Hence, when
using Pearson r the cause and effect relationship cannot be determined but one can infer that
the two variables are associated with each other which is why the results are presented with
both the strength and the direction of the relationship (Cohen et al., 2013: 350).
The Pearson correlation omnibus test of model co-efficient was applied to variables in order to
test the effects of township mall development on local informal traders.

53
3.6.1.6 Wilcoxon Signed Ranks
Wilcoxon Signed Ranks test is a non-parametric test used in this study to test whether the
average value is significantly different from the value of 3, the central score (Natrella, 2013:
16). In this study, it was applied to Likert scale questions to determine value creation by
township mall development and to compare the distribution of two variables (Natrella, 2013:
16).
Interpretation of the output from Wilcoxon Signed Ranks test is focussed on two main values,
the Z value and the associated significance levels, presented as Asymp. Sig. (2-tailed). If the
significance level is equal to or less than .05, one can conclude that the difference between the
two scores is statistically significant. In this study for example, the Wilcoxon Signed Ranks
Test tested for changes or no changes in informal local traders’ income before and after the
township mall was developed. Together with the Wilcoxon Signed Ranks Test, cross-
tabulation is another method used for data analysis (Pratt and Gibbons, 2012: 147).
3.6.1.7 Cross-Tabulation
Cross-tabulation is used to compare categorical data from demographic variables and the
study’s target variables using tables with rows and columns (Anselin and Getis, 2010: 16). This
is done to establish the relationship between the two variables presented in two-dimensional
frequency tables. In the event that the variables give different output values and cannot be
meaningfully cross-tabulated, graphs and summary statistics are used to describe the extent of
the relationship between the compared variables. For example, in this study the relationship
was cross-tabulated between the effects on local informal traders’ income based on the number
of years in business before and after the development of the mall. The binomial test used on a
dichotomous variable to test whether the proportion of a response is significantly different from
0.5. Chi-square test of independence is used on cross-tabulation to establish whether a
significant relationship exists between the two variables represented in the cross-tabulation.
When conditions are not met, Fisher’s exact test is used (Anselin and Getis, 2010: 16).
When some of the variables in the questionnaire were cross-tabulated, they provided relative
outputs for the following:

54
a) Township traders’ perceptions of the effects of value-creating supply chain
distribution systems in emerging markets.
b) The influence of emerging markets on the optimal structured cost of the distribution
model and proximity to improve product availability.
c) The transformation of informal retail enterprise development by formalised large-
scale chains through a configured supply chain.
d) The magnitude of the displacement of informal local traders as a result of the entry
of both large-scale suppliers and retailers into township markets.
In conjunction with cross-tabulation, regression analysis is a common method of data analysis
(Hair, 2010: 75).
Hypothesis
H1: There is a relationship between the type of business and distance from the mall
H1A: There is no relationship between the type of business and distance from the mall
H2: There is a relationship between the performance of traders’ businesses and the existence of
the mall
H2A: There is no relationship between the performance of traders’ businesses and the existence
of the mall
H3: There is a relationship between the type of business and start time of operation
H3A: There is no relationship between the type of business and start time of operation
H4: There is a relationship between the type of business and income generated before the mall
opened
H4A: There is no relationship between the type of business and income generated before the
mall opened
H5: There is a relationship between the type of business and income generated after the mall
opened
H5A: There is no relationship between the type of business and income generated after the mall
opened
H6: There is a relationship between the existence of the mall and township infrastructural
development
H6A: There is no relationship between the existence of the mall and township infrastructural
development

55
3.6.2 Multivariate Data Analysis
There are several methods to examine three or more variables at the same time, usually two or
more independent variables and one dependent variable. Multivariate analysis allows
researchers to examine the relationship between two variables while simultaneously controlling
for other variables (Vogt and Johnson, 2011: 245). Examples include factor analysis, multiple
regression analysis, Kruskal Wallis Test, correlations and discriminant analysis. Variables are
seen as dependent or independent in this technique. A dependent variable is what is being
affected and measured in the study while an independent variable cannot be controlled or
affected; the independent variable influences the dependent variable (Vogt and Johnson, 2011:
103). Although it is possible to examine the relationship between two variables at a time, there
are serious disadvantages to restricting oneself to a single approach (Bryman and Cramer,
2002: 197).
3.6.2.1 Regression analysis
Regression analysis uses the presence of an association between two variables to predict the
values of the dependent variable from the independent variable (Kinnear and Gray, 1993: 145).
In regression, the purpose is to estimate or predict some characteristics from a knowledge of
others by constructing a regression equation (Bryman and Cramer, 2002: 202). A logistic
regression was performed to ascertain the effects of township mall development on the
likelihood that business would be negatively affected (Kinnear and Gray, 1993: 145).
3.6.2.2 Multiple Regression
According to Pallant (2013: 114), multiple regression enables the prediction of a single
dependent continuous variable from a group of independent variables and assesses the relative
contribution of each individual variable. On the other hand, logistic regression is used when
the dependant variable is categorical. Logistic regression tests the predictive power of a set of
variables and assesses the relative contribution of each individual variable. Regression
analysis: Linear regression estimates the coefficients of the linear equation, involving one or
more independent variables that best predicts the value of the dependent variable. Multi-
collinearity occurs when there is a correlation between three or more variables (Hair, 2010:
78). When multiple-collinearity exists in the model, the value for the estimated regression co-
56
efficient can fluctuate drastically, making it difficult to interpret the coefficients as an indicator
of the importance of the predictor variables (Cooper and Schindler, 2006: 549).
Correlation provides an indication that there is a relationship between two variables; it does
not, however, indicate that one variable causes the other. The correlation between variables A
and B could be that A causes B or B causes A, and/or there could be a third variable C that
causes A and B. The possibility of a third variable that influences both observed variables
should always be considered. This third possible variable could influence the study (Cooper et
al., 2006: 549). A logistic regression was performed to ascertain the effect of the emergence of
township malls on local informal traders’ businesses, with the likelihood that these businesses
were negatively affected.
The main difference between logistic regression analysis and multiple regression analysis is
the natural form of the dependent variable. The dependent variable is consistent in multiple
regression, while in logistic regression the dependent variable is categorical. Logistic
regression allows the researcher to predict the outcomes of two or more categories (Bryman
and Cramer, 2002: 203).
3.6.2.3 Kruskal Wallis Test
The Kruskal Wallis Test is the non-parametric equivalent of ANOVA (McKight and Najab,
2010: 24). It allows a researcher to compare several independent samples that compare two or
more groups of cases in one variable. It is similar in nature to the Mann Whitney U Test, the
non-parametric equivalent of the independent samples t-test (Nordstokke et al., 2011: 7).
Scores are converted into ranks and the mean rank for each group is compared. For example,
in the group analysis, different outlet owners had to be in each of the different groups of outlet
owners. A logistic regression was performed to test the likelihood of informal traders’
businesses being influenced by the emergence of township malls (McKight and Najab, 2010:
24).
57
3.7 Binomial Test
The binomial test is used to compare the frequency of cases found in the two categories of
dichotomous variables with those which are expected on some basis (Agresti and Kateri, 2011:
2). In this study, there were frequency tables for all questions and a binomial test was applied
to each question to determine whether the proportion of YES responses was equal to the
proportion of NO responses. Under the null hypothesis, we assume that the proportion of YES
= prop of NO = 0.5 (Agresti and Kateri, 2011: 2). As shown in the following chapter, a binomial
test was used to test whether a significantly larger proportion of the informal traders responded
YES when compared against the frequencies of relevant variables.
3.8 Reliability
Bryman and Cramer (2002: 62) state that the reliability of a measure refers to its consistency.
There are two separate aspects of reliability, external and internal reliability (Meeker and
Escobar, 2014: 8). External reliability is the more commonly used and refers to the degree of
consistency of a measure over time. External reliability is administered by running a test on
two occasions on the same group of subjects, test-retest reliability. The disadvantage of re-
running such tests is that the outcome might be inconsistent. However, test-retest is one of the
many ways to test external reliability (Meeker and Escobar, 2014: 8).
Internal reliability is particularly important in connection with multiple variable scales as it
measures whether each variable scale measures a single idea and hence, whether the items that
make up the scale are internally consistent (Gelman, Carlin, Stern and Rubin, 2014: 22).
Consistency of outcomes was used as a measure of reliability in this study and chi-square
goodness-of-fit-test was used to test whether any of the response options were selected
significantly more or less often than others (Gelman et al., 2014: 22).
3.9 Validity
According to Jobson (2012: 160), validity measures the extent to which a measure measures
the concept it purports to measure. This basically refers to the set of questions posed in order
to understand a concept. Validity is categorised into two main categories, construct validity

58
and face validity. Construct validity measures the degree to which the scale measures the
underlying theme it intends to measure. In this study, the correlation tools of data analysis
techniques were used to achieve data validity (Jobson, 2012: 163).
3.10 Study Site
The study site was the Durban region with a focus on Umlazi Township and Kwa-Mashu
Township which are part of the greater Durban and Ethekwini Metropolitan Municipality
(Frith, 2014: 12). Kwa-Mashu and Umlazi are the two biggest townships in the region. Kwa-
Mashu is home to 175 663 people spread over 21.47 km2 while Umlazi has a population of 404
811 spread over 47.46 km2 (Frith, 2011:12). These two townships were chosen because they
are the biggest in KZN and they were among the first townships to be targeted for township
mall development.
3.11 Target Population
Charmaz (2011: 372) defines the target population as the total population of respondents in a
survey. The target population should be defined along geographical and time lines (Sekaran
and Bougie, 2010: 267). The target population for this study was informal market participants
in Umlazi and Kwa-Mashu Townships. A study conducted by the eThekwini Economic
Development and Investment Promotion Unit in September 2012 found that there were 750
informal local traders in Umlazi Township and 420 in Kwa-Mashu Township.
3.12 The Sample
Data was collected from the target group of individuals in their geographic locations.
Inferences and conclusions were made based on the responses collected by means of
questionnaires. The sample is a subset or subgroup of the population (Sekaran and Bougie,
2010: 444). Adopting Sekeran and Bougie’s (2010: 276) sampling method, the researcher
looked at a population of 1 170 multiple outlet owners in Umlazi and Kwa-Mashu Townships,
and drew a sample study group of 291 informal outlets owners to whom questionnaires were
distributed.

59
3.13 Sampling Method
Sampling is the process of selecting items from the population so that the sample characteristics
can be generalized to the population. Convenience sampling was used as it is quick, convenient
and less expensive and targets easily accessible members of the population under study.
Sekaran and Bougie (2010:276) describe convenience sampling as the collection of information
from members of the population who are conveniently available to provide it, while Charmaz
(2011: 375) describes this type of sampling as the time when the researcher studies members
of the population who are easily available. Sekaran and Bougie (2010:276) note that, in
purposive sampling, information is obtained from specific target groups who can provide the
required information, or conform to parameters set by the researcher. It is important that the
sample is representative of the population. Thus, the results can be generalized to the larger
population through inferential statistics (Levy and Lemeshow, 2013: 43).
3.14 Sample Size
Sampling is a process that involves selecting a small portion of the population to represent the
entire target population, whereas the sample size is the total number of units or people selected
to participate in the study (Yin, 2013: 98). For the purpose of this research study, the population
size were informal business owners (1 170 outlets), population size. The sample size for this
study was therefore the 291 multiple outlet owners in Umlazi and Kwa-Mashu Townships.
3.15 Limitations
The limitation of this study was that it was conducted in one region, the Durban region.
However, the researcher addressed this limitation by targeting high activity informal business
locations, which were the two main townships in this region, Umlazi and Kwa-Mashu.

60
3.16 Data Collection Instruments
Data is information collected during the course of the research study using tools while data
collection instruments refer to the actual devices used to collect data (Rubin and Chisnell, 2008:
43). The researcher used questionnaires to collect quantitative data. Qualitative data is
described by Sekaran and Bougie (2010:444) as data that are not immediately quantifiable,
unless they are categorised in some way, whereas quantitative data is generally gathered
through structured questions (Levy and Lemeshow, 2013: 108). A questionnaire is a form of
written communication in which the researcher communicates with the respondent.
Questionnaires are a widely accepted tool for gathering information (Bird, 2009: 07).
3.17 Construction of the Instrument
The instrument was designed to address the quantitative aspects of the research on informal
township traders’ perceptions of the effects of value-creation supply chain distribution systems
in emerging markets. Perceptions influence whether people reap benefits from the emergence
of township malls or are discouraged from trading. Therefore, a good measure of perception
would be the number of retailers that continued trading because they saw an opportunity and
the number that were displaced from trading due to increased competition. The questionnaire
construction was done in such a way as to enable the study to achieve the objectives outlined
earlier.
The questionnaire is divided into four (4) different dimensions;
Part one covered biographical data and organizational profile to profile respondents
according to gender, age; size of the business and the model of business trading; this
was captured in questions 1 to 11. Questions 9 and 10 specifically tested the financial
impact of the township malls on each local trader, which was then used to categorize
respondents who benefitted or suffered losses due to the emergence of township malls.
Part two posed dichotomous questions that required a “yes” or “no” answer based on
respondents’ experience, perceptions and knowledge with regard to the perceived
impact of township malls on them as individual local traders; this was captured in
questions 12 to 30. The aim was to distinguish winners and losers in terms of the impact
of township mall development.

61
Part three covered value creating supply chain distribution systems. It sought to obtain
information on the various supply chain distribution systems used to transport goods to
retailers. This was captured in questions 31 to 38 with “yes” or “no” answers.
Part four dealt with value creation and development in townships. It tapped into the
study’s objective to investigate value creation and township development due to the
emergence of township malls. All answers were on a five-point Likert scale that ranged
from 1 to 5 with 1 being strongly disagree and 5 being strongly agree. This section was
covered by questions 39 to 47.
3.18 Administration of the Questionnaire
The self-administered questionnaire was distributed to township retailers in both Umlazi and
Kwa-Mashu who voluntarily completed the questionnaire, based on their knowledge,
experience and perceptions with the guidance of the researcher or nominated research assistant.
This was done in a space of two months between December 2014 and January 2015.
3.19 Data Analysis
The data was analysed using the SPSS. The responses were converted from categorical data to
nominal data in order to enable the data to be partitioned into mutually exclusive and
collectively exhaustive categories. The data was then captured into the SPSS data editor
window to enable analysis. All the data was hand captured into a pre-formulated excel
worksheet aligned to the questionnaire.
The analysis involved the use of quantitative approaches. Carver and Nash (2011: 14) describe
data analysis as the process of examining something in order to determine what it is and how
it works. Analysis involves a process where a researcher interprets events. Univariate
techniques were used to test frequency distribution. Sekaran and Bougie (2010:338) describe
univariate techniques as testing a hypothesis on a single mean. The Anova analysis technique
was used to test the differences between the multiple outlet owners’ responses. Inferential
statistics were employed to test correlation and cross tabulation among the responses. This
study examined the difference or relationship between supply chain distribution methods.
Carver and Nash (2011: 27) describe factor analysis as a multivariate technique that confirms
62
the dimensions of the concept that has been operationally defined, also indicating which of the
items are most appropriate for each dimension.
3.20 Ethical considerations
According to Olsen, Wilson, Michel, Gibberd, Vincent, El-Assady, Rasslan, Qsous and
Macharia, (2012: 832) the ethical clearance process normally starts with the researcher or
examiner noting which parts of the ethical clearance guidelines apply to a specific research
study. Ethical approval was obtained from the University of KwaZulu-Natal’s Ethics
Committee. To uphold human dignity, the researcher provided adequate information on the
study in order for respondents to make a decision on whether or not to participate. All
respondents signed informed consent forms. The respondents’ confidentiality and privacy were
protected by informing them of their right to withhold certain personal information (Olsen et
al., 2012: 832).
3.21 Conclusion
This chapter presented the research methodology used in this study. It included an in-depth
discussion of qualitative and quantitative research methods and their advantages and
disadvantages. The researcher chose a quantitative research design for this study so as to
provide a reliable and verified analysis of the data collected from respondents. The study setting
was Umlazi and Kwa-Mashu Townships and convenience sampling was used. Data collection
was conducted using questionnaires, which were distributed to 301 respondents. After the
questionnaires were completed and collected, the data were analysed using the various
techniques discussed in this chapter to test the differences between the multiple outlet owners’
responses. Inferential statistics were used to test correlation and cross-tabulation among the
responses. The reliability and validity of the research instrument and the study’s limitations
were also highlighted.
The following chapter presents the study’s findings.
63
Chapter Four
Data Analysis and Interpretation
4.1 Introduction
This chapter reports on the results of the study by analysing the responses to the survey. The
responses to the questionnaires were analysed using the SPSS. Section A responses were
analysed using frequency distribution tables in order to determine the pattern of distribution of
the responses. Data analysis and interpretation transformed the data into information that was
used to analyse and describe the relationships between variables. Three methods of data
analysis were used to analyse the data: univariate, bivariate and multivariate analysis. The
analysis in this chapter deals with quantitative data relevant to the research objectives. The
objectives of the study were built into the questions that were subject to analysis. Together with
the secondary data accumulated through the distribution of the questionnaire, this chapter forms
a basis for the discussion that follows in chapter five where the results are discussed further.
4.2 Frequency Distribution
The frequency distribution tables define frequency distribution from questions 1 to 11. The
main aim was to analyse the pattern of responses collected from respondents between variables.
The variables were interpreted against each other to test the relationships between two or more
variables.
4.2.1 Trader Demographics
This section deals with the biographical data and organizational profile of all respondents
according to gender, age; size of the business and the business model.

64
Figure 4.1: Gender, Age and Years Running Business
Figure 4.1 shows the distribution of gender and age of all the respondents as well as years in
business. Of the 301 respondents, 62.1% were male and 37.9% were female with a large
percentage, 67.8%, between the ages of 31and 50. The mean average years in business was 4
to 6 years followed by 26.2% of the respondents who had been in business for between 1 and
3 years. A small percentage (15%) had been in business for more than 10 years.
Figure 4.2: Distance from Mall and Effect of Mall
Figure 4.2 indicates that a large percentage, 60.8% of the respondents are located more than
5km from the mall. In terms of the effect of the mall’s existence on local traders, an
10
20
30
40
50
60
70
MALE FEMALE 18 - 30 31 - 50 51+ <1 YEAR 1 - 3 YEARS
4 - 6 YEARS
7 - 10 YEARS
>10 YEARS
GENDER AGE YEARS RUNNING BUSINESS
62%
38%
27%
68%
5%
12%
26%
45%
15%
2%
Pe
rce
nta
ge
10
20
30
40
50
60
70
0-2 KM 2.1-5 KM >5 KM POSITIVE NEGATIVE
DISTANCE FROM MALL EFFECT OF MALL
12%
27%
61%
34%
66%
Pe
rce
nta
ge

65
overwhelming majority of the respondents (66.45%) stated that they were negatively affected,
with only 33.6% realizing positive effects due to the existence of the malls. Outlets situated
5km or more from the mall, which made up the biggest percentage of the sample, might be less
affected by the existence of the mall than the 27% of the respondents who are located between
2.1 and 5km from the mall and are more likely to experience its effects, as well as the 12% of
respondents who are between 0 and 2km from the mall.
Figure 4.3: Staff Size, Type of Business, Started Operating and Reason for Operating
Business
Figure 4.3 shows that a significant number of businesses are small with between 2 and 5
employees. Thirty nine per cent of the respondents are running a grocery shop, closely followed
by tuck-shops (32%). The figure shows that 81% of the businesses started operating before the
malls opened and lack of employment was the reason why 62% of the respondents started their
own business. Thus, the results generated in this study are mainly applicable to local informal
traders who largely rely on income generated from their businesses to meet their financial
needs.
10
20
30
40
50
60
70
80
90
SMA
LL (
2 -
5)
MED
IUM
(5
-8
)
LAR
GE
(>8
)
LIQ
UO
R O
UTL
ET
GR
OC
ERY
SH
OP
HA
WK
ER
CA
SH &
CA
RR
Y
TUC
KSH
OP
BEF
OR
E M
ALL
OP
ENED
AFT
ER M
ALL
OP
ENED
LAC
K O
F EM
PLO
YM
ENT
NO
T Q
UA
LIFI
ED
INH
ERIT
ED F
RO
M P
AR
ENTS
BU
SIN
ESS
OP
PO
RTU
NIT
Y
STAFF SIZE TYPE OF BUSINESS COMMENCEMENT REASON BUSINESS
83%
16%
1%
14%
39%
14%
1%
32%
81%
19%
62%
8% 10%
20%Pe
rce
nta
ge

66
Figure 4.4 Income Before and After
Figure 4.4 shows the financial impact of township malls on local traders in the form of income
before and after the malls opened. It reveals that the mean income ‘before’ is significantly
higher than the mean income ‘after’. The overwhelming majority of the respondents generated
between R10 000 and R20 000 before the mall opened and this decreased to between R5 000
and R10 000 after the opening of the mall.
10
20
30
40
50
60
70
<R5000 R5000 -R10000
R10000 -R20000
>R20000 <R5000 R5000 -R10000
R10000 -R20000
>R20000
INCOME BEFORE INCOME AFTER
35%
24%
38%
3%
27%
61%
12%
1%
Pe
rce
nta
ge
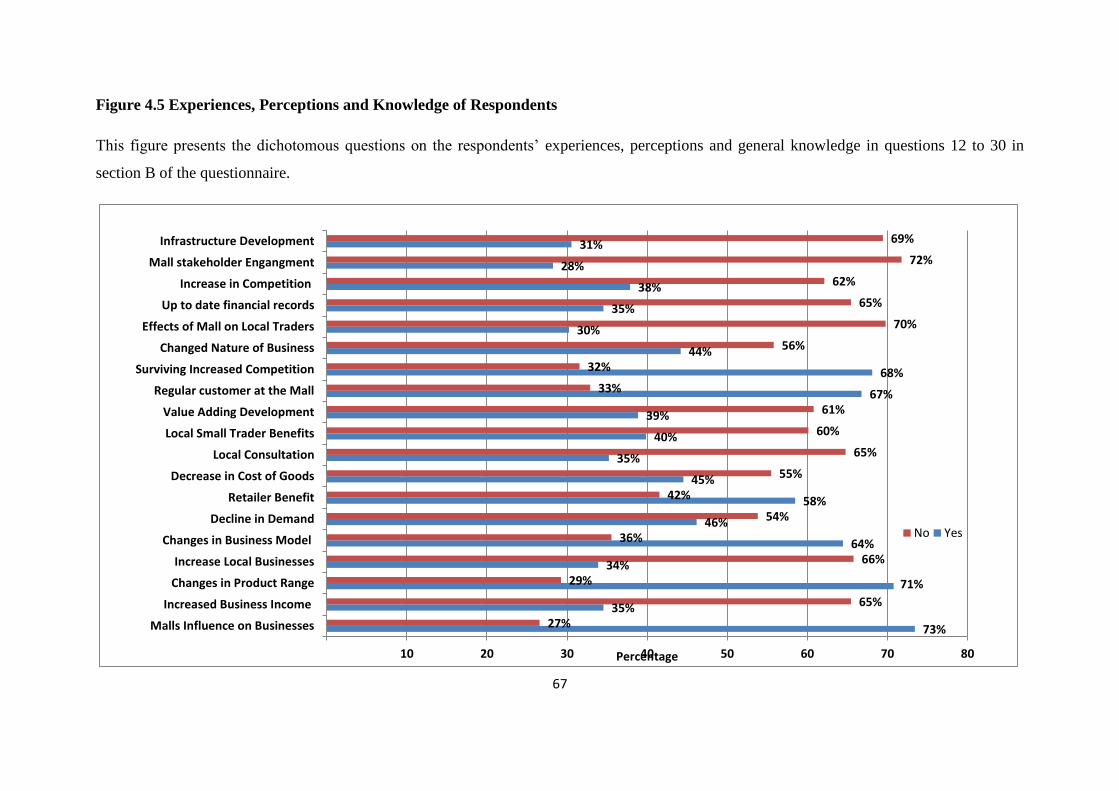
67
Figure 4.5 Experiences, Perceptions and Knowledge of Respondents
This figure presents the dichotomous questions on the respondents’ experiences, perceptions and general knowledge in questions 12 to 30 in
section B of the questionnaire.
73%
35%
71%
34%
64%
46%
58%
45%
35%
40%
39%
67%
68%
44%
30%
35%
38%
28%
31%
27%
65%
29%
66%
36%
54%
42%
55%
65%
60%
61%
33%
32%
56%
70%
65%
62%
72%
69%
10 20 30 40 50 60 70 80
Malls Influence on Businesses
Increased Business Income
Changes in Product Range
Increase Local Businesses
Changes in Business Model
Decline in Demand
Retailer Benefit
Decrease in Cost of Goods
Local Consultation
Local Small Trader Benefits
Value Adding Development
Regular customer at the Mall
Surviving Increased Competition
Changed Nature of Business
Effects of Mall on Local Traders
Up to date financial records
Increase in Competition
Mall stakeholder Engangment
Infrastructure Development
Percentage
No Yes
68
4.3 Dichotomous Questions
The dichotomous questions required a Yes or No answer based on the respondents’ experience,
perceptions and knowledge with regard to the impact of township malls on local traders. The
aim was to show a clear distinction between winners and losers due to the impact of township
mall development as demonstrated in figure 4.5. The figure shows that a significantly larger
proportion of the sample responded Yes (73%) when asked about the influence township malls
have on local traders’ businesses, while a significantly larger proportion responded No (65%)
when asked if they had generated more monthly income after the mall opened.
Furthermore, the figure shows that a significantly larger proportion (71%) of the sample
responded positively (Yes) when asked if their product range changed due to the existence of
the mall, while a significantly larger proportion (66%) responded negatively (No) when asked
if there was an increase in the number of stores around the mall after it opened.
Figure 4.5 also shows that 65% of the informal township traders had to change their business
model in order to remain competitive. Fairly evenly distributed responses were received when
the respondents were asked if demand for some products declined after the mall started
operating; 46% responded Yes and 53.8% No.
Similarly, Figure 4.5 shows that there is a generally mixed response from the respondents on
the question of whether there was a retail benefit from the malls opening in local townships,
with 58% responding Yes and 42% No. Asked if the cost of buying goods decreased after the
malls opened, 45% of the respondents answered in the affirmative and 55% in the negative.
In terms of whether local traders were consulted and involved before the mall opened, a
significantly larger proportion of respondents responded No (65%). Similarly, a larger
proportion (60%) of the respondents responded in the negative when asked if local small traders
benefit from the development of malls in townships.
A larger proportion of the respondents (61%) felt that the development of the mall did not add
any value to their individual businesses while 67% said that they were regular customers at the
mall for purchasing purposes. Figure 4.5 indicates that a significantly larger proportion of the
sample (68%) responded Yes when asked if some local traders stopped operating after the mall
opened, as they could not survive the increased competition. The majority of the respondents
(56%) noted that the nature of their business had to change due to the emergence of the mall.

69
Moreover, the binomial test showed that a significantly larger proportion of the respondents
(70%) felt that the construction of the mall had no effect on their individual businesses and the
majority (65%) indicated a lack of financial competency in keeping up to date financial records
in managing their businesses. A significantly larger proportion (70%) of respondents felt that
the mall had no effect on their businesses and that competition had not increased (62%) since
the mall opened.
Finally, 69% of the respondents strongly believed that there was no improvement in local
infrastructure in the form of water and electricity supply and better roads as a result of the
development of township malls with 70% responding in the negative. Seventy two per cent of
the respondents felt that investors and mall management teams did not constantly engage local
retailers in decision making and did not incorporate traders into the mall.
Figure 4.6 Value Creating Supply Chain Distribution Systems
75
78
73
74
42
40
45
30
25
22
27
26
57
60
55
70
20 40 60 80 100
Direct Store Delivery
Own Transport
Cost of Goods Decreased
Supplier RepresentativesDelivery
Cost of Goods Cheaper fromSupplier than Mall
Out of Stocks After the Mall
Out of Stocks Before theMall
Supplier InteractionImproved
PercentageNo Yes
70
This section offers insight on value creating supply chain distribution systems for local retailers
and local communities. Based on figure 4.6, the Binomial test shows that a larger proportion
of the sample (75%) agreed that local retailers received their products on delivery from
suppliers with 25% stating that they did not get direct store delivery from suppliers. Seventy
eight per cent of the respondents used their own transport to fetch goods for resale while 22%
did not.
A significantly larger proportion of the sample (73%) agreed that the cost of obtaining goods
had decreased since the malls opened, while 27% felt that this was not the case. Similarly a
significantly larger proportion of the respondents (74%) stated that they received goods for
resale from supplier representatives, while only 26% did not.
Furthermore, figure 4.6 shows that a fairly large proportion of the sample (58%) agreed that
the cost of goods was cheaper from the supplier than in chain stores at the mall, while 42% felt
that this was not the case. Sixty per cent of the respondents said that they did not run out of
stock even after the mall opened, while 40% did run out of stock even after the mall opened.
In contrast, 55% of the respondents did not run out of stock prior to the mall opening while
45% did experience stock out prior to the mall opening. Finally, 70% of the respondents felt
that suppler interaction did not improve after the mall opened with 30% experiencing
improvement in supplier interaction after the opening of the malls.
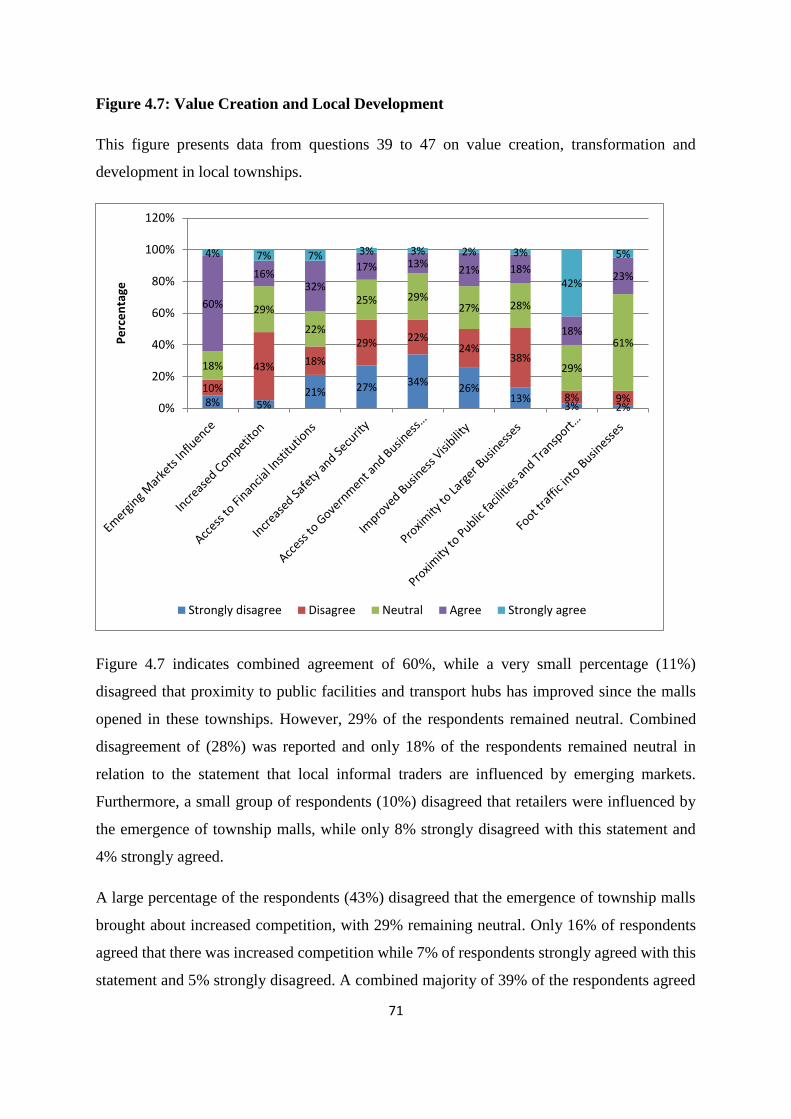
71
Figure 4.7: Value Creation and Local Development
This figure presents data from questions 39 to 47 on value creation, transformation and
development in local townships.
Figure 4.7 indicates combined agreement of 60%, while a very small percentage (11%)
disagreed that proximity to public facilities and transport hubs has improved since the malls
opened in these townships. However, 29% of the respondents remained neutral. Combined
disagreement of (28%) was reported and only 18% of the respondents remained neutral in
relation to the statement that local informal traders are influenced by emerging markets.
Furthermore, a small group of respondents (10%) disagreed that retailers were influenced by
the emergence of township malls, while only 8% strongly disagreed with this statement and
4% strongly agreed.
A large percentage of the respondents (43%) disagreed that the emergence of township malls
brought about increased competition, with 29% remaining neutral. Only 16% of respondents
agreed that there was increased competition while 7% of respondents strongly agreed with this
statement and 5% strongly disagreed. A combined majority of 39% of the respondents agreed
8% 5%21% 27% 34%
26%13%
3% 2%
10%
43% 18%
29% 22%24%
38%
8% 9%
18%
29%
22%
25% 29%27% 28%
29%
61%
60%
16%32%
17% 13%21% 18%
18%
23%
4% 7% 7% 3% 3% 2% 3%
42%
5%
0%
20%
40%
60%
80%
100%
120%
Pe
rce
nta
ge
Strongly disagree Disagree Neutral Agree Strongly agree
72
that access to financial institutions improved with the construction of township malls while a
combined 39% also disagreed with this statement and 22% were neutral.
A combined 56% of respondents disagreed that safety and security increased after the malls
opened while 20% agreed and 25% were neutral. According to 56% of the respondents, there
was no improved access to government and business institutions; however, 29% of the
respondents were neutral. Only 16% agreed that there was improved access to government and
business institutions after the malls opened. There was combined disagreement of 50% that
there was improved visibility of traders’ businesses due to the emergence of township malls
and only 23% of the respondents felt that their businesses became more visible due to the
emergence of malls while 27% were neutral.
A combined 51% of the respondents disagreed that that mall development resulted in proximity
to larger businesses while 28% remained neutral and only 21% agreed with this statement.
Finally, a large proportion (61%) of the respondents remained neutral on the question of
whether mall development had led to an increase in foot traffic into their individual businesses
while 11% disagreed and 28% agreed.
4.4 Descriptive Statistics
Descriptive statistics are used to illustrate the essential attributes of the data in this study,
largely relating to value creation and development in local townships brought about by
emerging markets. All answers are in a five-point Likert scale that ranges from 1 to 5 with 1
being strongly disagree and 5 being strongly agree (Vogt and Johnson, 2011: 226).
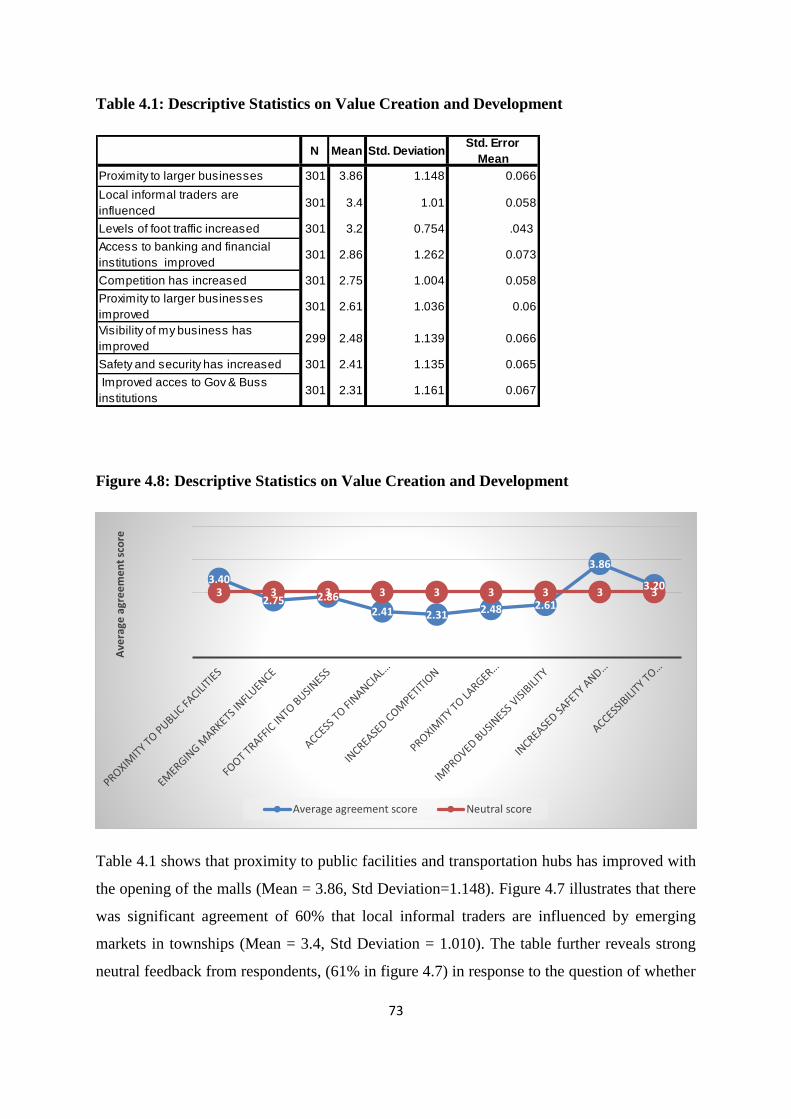
73
Table 4.1: Descriptive Statistics on Value Creation and Development
Figure 4.8: Descriptive Statistics on Value Creation and Development
Table 4.1 shows that proximity to public facilities and transportation hubs has improved with
the opening of the malls (Mean = 3.86, Std Deviation=1.148). Figure 4.7 illustrates that there
was significant agreement of 60% that local informal traders are influenced by emerging
markets in townships (Mean = 3.4, Std Deviation = 1.010). The table further reveals strong
neutral feedback from respondents, (61% in figure 4.7) in response to the question of whether
N Mean Std. DeviationStd. Error
Mean
Proximity to larger businesses 301 3.86 1.148 0.066
Local informal traders are
influenced 301 3.4 1.01 0.058
Levels of foot traffic increased 301 3.2 0.754 .043
Access to banking and financial
institutions improved 301 2.86 1.262 0.073
Competition has increased 301 2.75 1.004 0.058
Proximity to larger businesses
improved 301 2.61 1.036 0.06
Visibility of my business has
improved 299 2.48 1.139 0.066
Safety and security has increased 301 2.41 1.135 0.065
Improved acces to Gov & Buss
institutions 301 2.31 1.161 0.067
3.40
2.75 2.862.41 2.31 2.48 2.61
3.86
3.203 3 3 3 3 3 3 3 3
Ave
rage
agr
ee
me
nt
sco
re
Average agreement score Neutral score
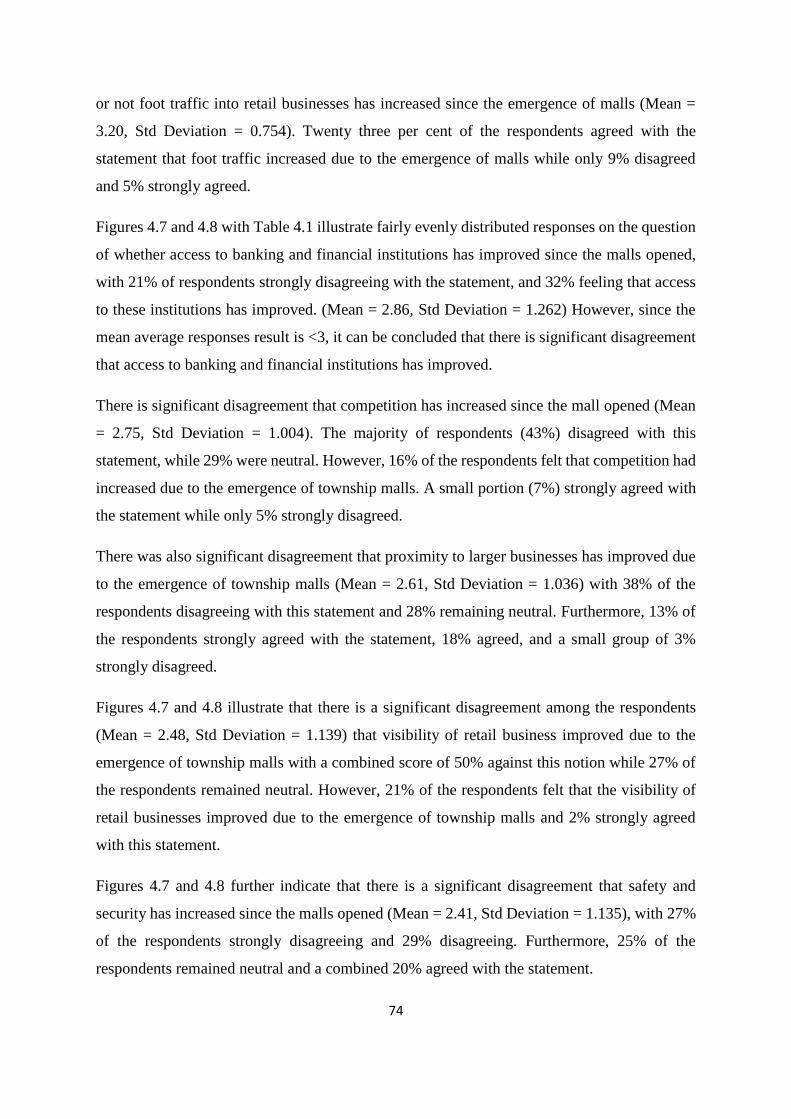
74
or not foot traffic into retail businesses has increased since the emergence of malls (Mean =
3.20, Std Deviation = 0.754). Twenty three per cent of the respondents agreed with the
statement that foot traffic increased due to the emergence of malls while only 9% disagreed
and 5% strongly agreed.
Figures 4.7 and 4.8 with Table 4.1 illustrate fairly evenly distributed responses on the question
of whether access to banking and financial institutions has improved since the malls opened,
with 21% of respondents strongly disagreeing with the statement, and 32% feeling that access
to these institutions has improved. (Mean = 2.86, Std Deviation = 1.262) However, since the
mean average responses result is <3, it can be concluded that there is significant disagreement
that access to banking and financial institutions has improved.
There is significant disagreement that competition has increased since the mall opened (Mean
= 2.75, Std Deviation = 1.004). The majority of respondents (43%) disagreed with this
statement, while 29% were neutral. However, 16% of the respondents felt that competition had
increased due to the emergence of township malls. A small portion (7%) strongly agreed with
the statement while only 5% strongly disagreed.
There was also significant disagreement that proximity to larger businesses has improved due
to the emergence of township malls (Mean = 2.61, Std Deviation = 1.036) with 38% of the
respondents disagreeing with this statement and 28% remaining neutral. Furthermore, 13% of
the respondents strongly agreed with the statement, 18% agreed, and a small group of 3%
strongly disagreed.
Figures 4.7 and 4.8 illustrate that there is a significant disagreement among the respondents
(Mean = 2.48, Std Deviation = 1.139) that visibility of retail business improved due to the
emergence of township malls with a combined score of 50% against this notion while 27% of
the respondents remained neutral. However, 21% of the respondents felt that the visibility of
retail businesses improved due to the emergence of township malls and 2% strongly agreed
with this statement.
Figures 4.7 and 4.8 further indicate that there is a significant disagreement that safety and
security has increased since the malls opened (Mean = 2.41, Std Deviation = 1.135), with 27%
of the respondents strongly disagreeing and 29% disagreeing. Furthermore, 25% of the
respondents remained neutral and a combined 20% agreed with the statement.
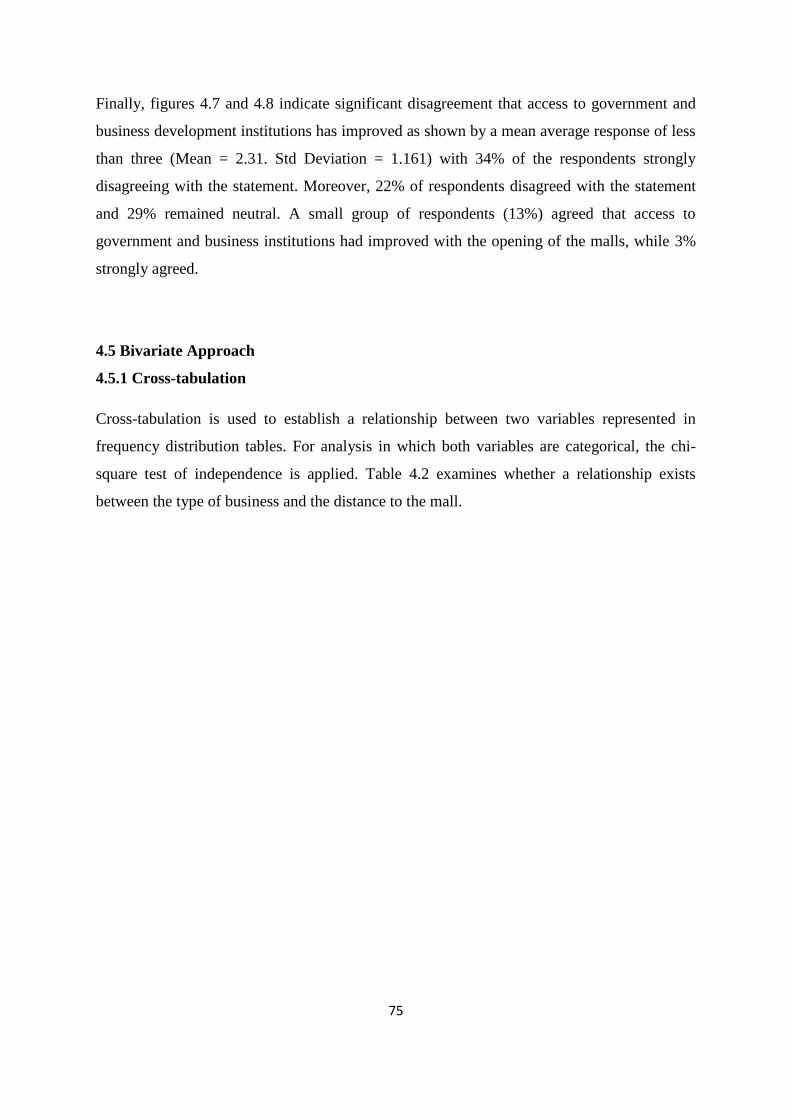
75
Finally, figures 4.7 and 4.8 indicate significant disagreement that access to government and
business development institutions has improved as shown by a mean average response of less
than three (Mean = 2.31. Std Deviation = 1.161) with 34% of the respondents strongly
disagreeing with the statement. Moreover, 22% of respondents disagreed with the statement
and 29% remained neutral. A small group of respondents (13%) agreed that access to
government and business institutions had improved with the opening of the malls, while 3%
strongly agreed.
4.5 Bivariate Approach
4.5.1 Cross-tabulation
Cross-tabulation is used to establish a relationship between two variables represented in
frequency distribution tables. For analysis in which both variables are categorical, the chi-
square test of independence is applied. Table 4.2 examines whether a relationship exists
between the type of business and the distance to the mall.
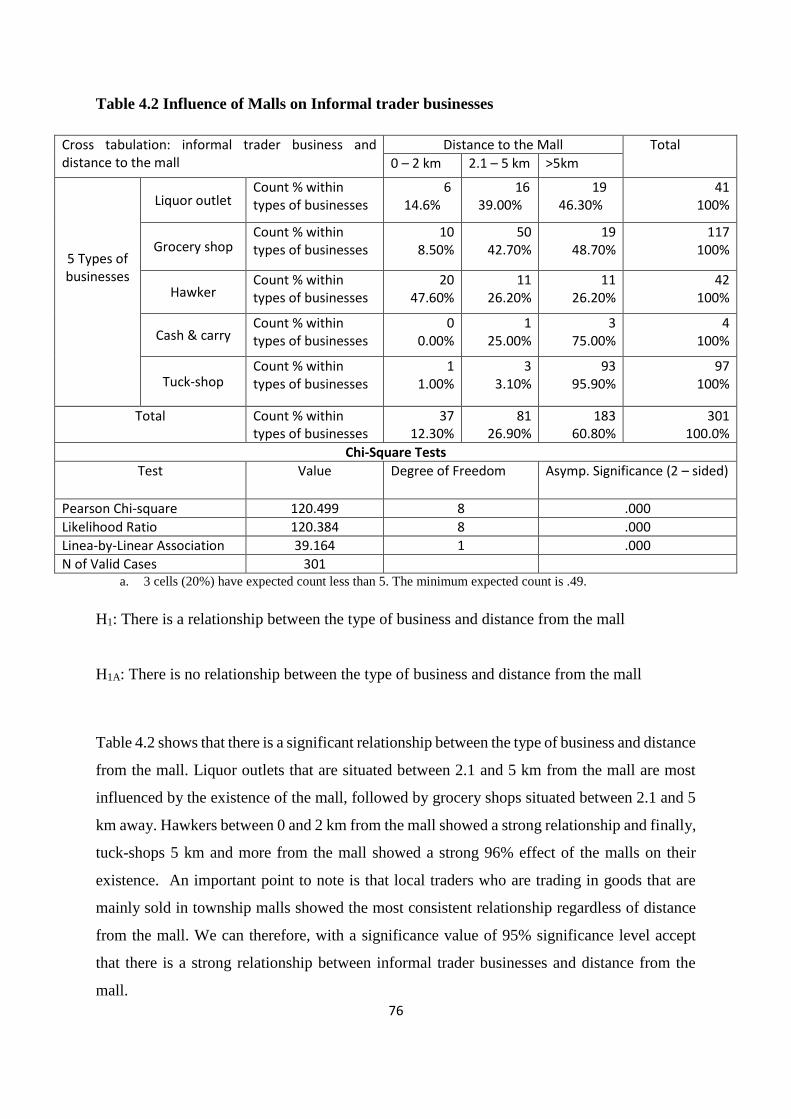
76
Table 4.2 Influence of Malls on Informal trader businesses
Cross tabulation: informal trader business and distance to the mall
Distance to the Mall Total
0 – 2 km 2.1 – 5 km >5km
5 Types of businesses
Liquor outlet Count % within types of businesses
6 14.6%
16 39.00%
19 46.30%
41 100%
Grocery shop Count % within types of businesses
10 8.50%
50 42.70%
19 48.70%
117 100%
Hawker Count % within types of businesses
20 47.60%
11 26.20%
11 26.20%
42 100%
Cash & carry Count % within types of businesses
0 0.00%
1 25.00%
3 75.00%
4 100%
Tuck-shop Count % within types of businesses
1 1.00%
3 3.10%
93 95.90%
97 100%
Total Count % within types of businesses
37 12.30%
81 26.90%
183 60.80%
301 100.0%
Chi-Square Tests
Test Value Degree of Freedom Asymp. Significance (2 – sided)
Pearson Chi-square 120.499 8 .000
Likelihood Ratio 120.384 8 .000
Linea-by-Linear Association 39.164 1 .000
N of Valid Cases 301 a. 3 cells (20%) have expected count less than 5. The minimum expected count is .49.
H1: There is a relationship between the type of business and distance from the mall
H1A: There is no relationship between the type of business and distance from the mall
Table 4.2 shows that there is a significant relationship between the type of business and distance
from the mall. Liquor outlets that are situated between 2.1 and 5 km from the mall are most
influenced by the existence of the mall, followed by grocery shops situated between 2.1 and 5
km away. Hawkers between 0 and 2 km from the mall showed a strong relationship and finally,
tuck-shops 5 km and more from the mall showed a strong 96% effect of the malls on their
existence. An important point to note is that local traders who are trading in goods that are
mainly sold in township malls showed the most consistent relationship regardless of distance
from the mall. We can therefore, with a significance value of 95% significance level accept
that there is a strong relationship between informal trader businesses and distance from the
mall.
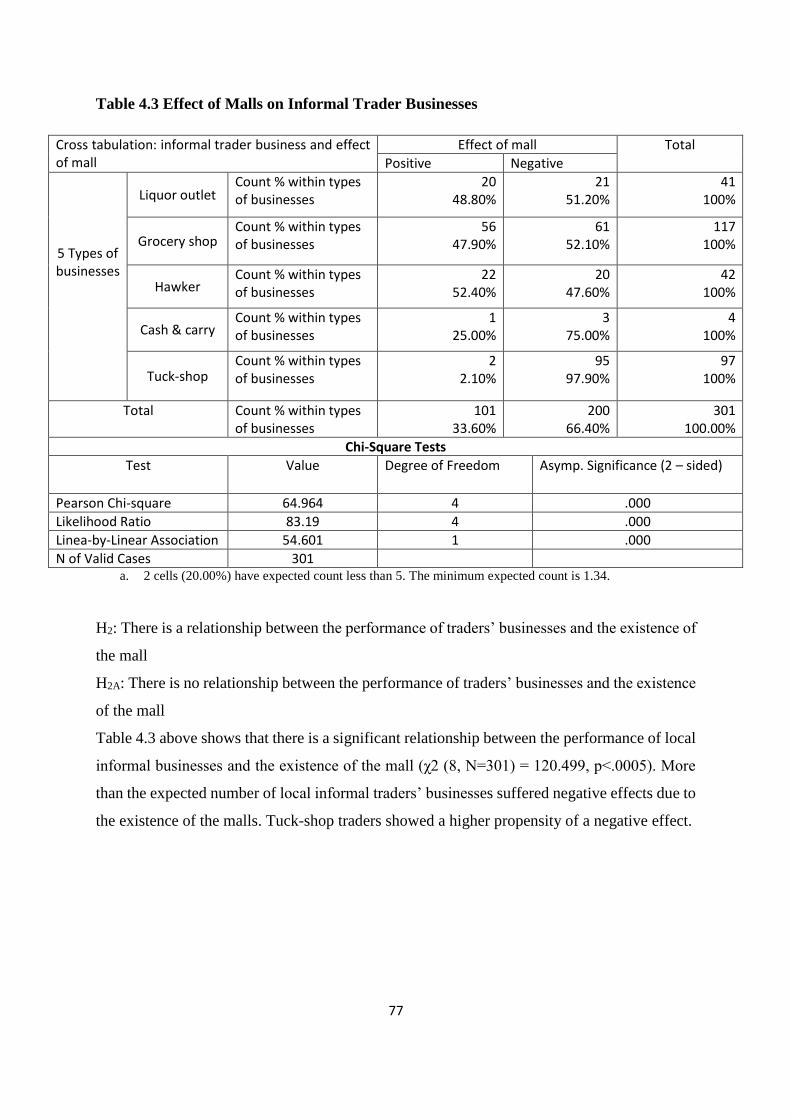
77
Table 4.3 Effect of Malls on Informal Trader Businesses
Cross tabulation: informal trader business and effect of mall
Effect of mall Total
Positive Negative
5 Types of businesses
Liquor outlet Count % within types of businesses
20 48.80%
21 51.20%
41 100%
Grocery shop Count % within types of businesses
56 47.90%
61 52.10%
117 100%
Hawker Count % within types of businesses
22 52.40%
20 47.60%
42 100%
Cash & carry Count % within types of businesses
1 25.00%
3 75.00%
4 100%
Tuck-shop Count % within types of businesses
2 2.10%
95 97.90%
97 100%
Total Count % within types of businesses
101 33.60%
200 66.40%
301 100.00%
Chi-Square Tests
Test Value Degree of Freedom Asymp. Significance (2 – sided)
Pearson Chi-square 64.964 4 .000
Likelihood Ratio 83.19 4 .000
Linea-by-Linear Association 54.601 1 .000
N of Valid Cases 301 a. 2 cells (20.00%) have expected count less than 5. The minimum expected count is 1.34.
H2: There is a relationship between the performance of traders’ businesses and the existence of
the mall
H2A: There is no relationship between the performance of traders’ businesses and the existence
of the mall
Table 4.3 above shows that there is a significant relationship between the performance of local
informal businesses and the existence of the mall (χ2 (8, N=301) = 120.499, p<.0005). More
than the expected number of local informal traders’ businesses suffered negative effects due to
the existence of the malls. Tuck-shop traders showed a higher propensity of a negative effect.

78
Table 4.4 Informal Trader Business and Start-up of Operation
Cross tabulation: informal trader business and Start-up of operation
Operating Total
Before Mall Opened After Mall Opened
5 Types of businesses
Liquor outlet Count % within types of businesses
32 78.00%
9 22.00%
41 100%
Grocery shop Count % within types of businesses
84 71.80%
33 28.20%
117 100%
Hawker Count % within types of businesses
34 81.00%
8 19.00%
42 100%
Cash & carry Count % within types of businesses
4 100.00%
0 0.00%
4 100%
Tuck-shop Count % within types of businesses
91 93.80%
6 6.20%
97 100%
Total Count % within types of businesses
245 81.40%
56 18.60%
301 100.00%
Chi-Square Tests
Test Value Degree of Freedom Asymp. Significance (2 – sided)
Pearson Chi-square 18.223 4 .001
Likelihood Ratio 20.95 4 .000
Linea-by-Linear Association 14.733 1 .000
N of Valid Cases 301 a. 2 cells (20.00%) have expected count less than 5. The minimum expected count is .74.
H3: There is a relationship between the type of business and start time of operation
H3A: There is no relationship between the type of business and start time of operation
Table 4.4 examines the potential relationship between the type of business and whether it
started operating before or after the mall opened. It shows that there is not a significantly strong
relationship between the types of businesses that started operating before the mall opened and
those that started afterwards. Generally, there is no clear indication that a large number of
businesses opened after the malls opened (χ2 (4, N=301) = 18.223, p<.0005). The majority of
all business types started operating long before the malls were developed. We can therefore,
with a significance value of 95% significance level reject that there is a relationship between
the existence of township malls and the start-up time of local informal retailers.

79
Table 4.5 Income before Mall
Cross tabulation: informal trader business and income before mall opened
Income Before Mall Total < R5000 R5000 -
R10000 R10000 – R20000
>R20000
5 Types of businesses
Liquor outlet
Count % within types of businesses
14 34.10%
19 46.30%
2 4.90%
6 14.60%
41 100%
Grocery shop
Count % within types of businesses
49 41.90%
42 35.90%
23 19.70%
3 2.60%
117 100%
Hawker Count % within types of businesses
38 90.50%
2 4.80%
2 4.80%
0 0.00%
42 100%
Cash & carry
Count % within types of businesses
3 75.00%
1 25.00%
0 0.00%
0 0.00%
4 100%
Tuck-shop
Count % within types of businesses
2 2.10%
7 7.20%
88 90.70%
0 0.00%
97 100%
Total
Count % within types of businesses
106 35.20%
71 23.60%
115 38.20%
9 3.00%
301 100.00%
Chi-Square Tests
Test Value Degree of Freedom Asymp. Significance (2 – sided)
Pearson Chi-square 233.070 12 .000
Likelihood Ratio 242.299 12 .000
Linea-by-Linear Association 62.607 1 .000
N of Valid Cases 301 a. 10 cells (50.00%) have expected count less than 5. The minimum expected count is .04.
H4: There is a relationship between the type of business and income generated before the mall
opened
H4A: There is no relationship between the type of business and income generated before the
mall opened

80
Table 4.6 Income after Mall
Cross tabulation: informal trader business and income after mall opened
Income After Mall Total < R5000 R5000 -
R10000 R10000 – R20000
>R20000
5 Types of businesses
Liquor outlet
Count % within types of businesses
4 9.80%
28 68.30%
6 14.60%
3 7.30%
41 100%
Grocery shop
Count % within types of businesses
36 30.80%
65 55.60%
16 13.70%
0 0.00%
117 100%
Hawker Count % within types of businesses
36 85.70%
4 9.50%
2 4.80%
0 0.00%
42 100%
Cash & carry
Count % within types of businesses
3 75.00%
1 25.00%
0 0.00%
0 0.00%
4 100%
Tuck-shop
Count % within types of businesses
1 1.00%
85 87.60%
11 11.30%
0 0.00%
97 100%
Total
Count % within types of businesses
80 26.60%
183 60.80%
35 11.60%
3 1.00%
301 100.00%
Chi-Square Tests
Test Value Degree of Freedom Asymp. Significance (2 – sided)
Pearson Chi-square 141.088 12 .000
Likelihood Ratio 142.674 12 .000
Linea-by-Linear Association 1.592 1 .207
N of Valid Cases 301
a. 10 cells (50.00%) have expected count less than 5. The minimum expected count is .04.
Hypothesis 5
H5: There is a relationship between informal trader businesses and income generated after the
mall opened
H5A: There is no relationship between informal trader businesses and income generated after
the mall opened
Tables 4.5 and 4.6 examine the potential relationship between income generated by business
types before and after the malls opened. They show that there is a significant relationship
between the Rand value income generated by local traders before the existence of the mall and
the Rand value income generated after the malls opened. It is clear that the majority of local
trader businesses suffered a decrease in monthly income after the malls opened. The total effect
is that the income of outlets that made on average less than R5 000 a month before the malls
81
started operating decreased from 35% to 27% after the mall started operating, while those that
made on average between R5 000 and R10 000 before the mall opened increased their income
from 24% to 61% after it opened. Furthermore, the income of owners who made on average
between R10 000 and R20 000 per month decreased from 38% to 12% after the malls started
operating. Finally, the income of business owners who made on average more than R20 000 a
month before the mall started operating decreased from 3% to 1%.
Therefore, we can accept that there is a strong relationship between the income generated by
local informal trader businesses before and/or after the township malls were developed with a
significance value of 95%.
Since all five hypotheses have a significance value of 95% confidence level, it is concluded
that each assumption is statistically significant. Therefore, the researcher can accept the initial
hypothesis and conclude that there is a relationship between the variables of hypotheses 1, 2,
4, and 5. However, we can conclude that there is no relationship between the existence of
township malls and when local informal businesses started operating; therefore, this hypothesis
is conclusively rejected.
4.6 Group Statistics
4.6.1 Independent t-test
The independent t-test tests whether the mean agreement is the same for the categories tested
and/or if a significant difference exists.

82
Table 4.7 Independent Sample Test
Independent Samples Test
Levene’s Test for Equality of
Variances
T –Test for Equality of Means
95% Confidence Interval of the Difference
F Sig. t df Sig. (2taile
d)
Mean Difference
Std. Error Difference
Lower Upper
Levels of foot
traffic increased after the
mall opened
Equal variances assumed
0.639 0.425 -2.44
-2.3
299
176.9
0.015
0.023
-0.221
-0.221
0.091
0.096
-0.4
-0.412
-0.043
-0.031 Equal variances not assumed
Monthly Income Increased after the
mall opened
N
Mean
Std Deviation
Std. Error Mean
YES Levels of foot traffic increased after the mall opened NO
104 197
3.06 3.28
0.846 0.691
0.083 0.049
Table 4.7 above tests whether the mean agreement is the same for both categories of increase
in foot traffic into retailer businesses due to the emergence of township malls and any changes
in monthly income generated before and after the malls opened. Monthly income and levels of
foot traffic are dependent variables while the emergence of the malls is the independent
variable. The Levene’s test for equality of variance was carried out to test whether there is a
mean agreement in that both income generated after the malls opened and foot traffic into retail
businesses increased. The test shows that the average agreement for those local informal
retailers whose income did NOT increase (M = 3.28, SD = .691) is higher than for those who
did experience an increase in income (M = 3.06, SD = .846), t(299) = -2.443, p=.015.
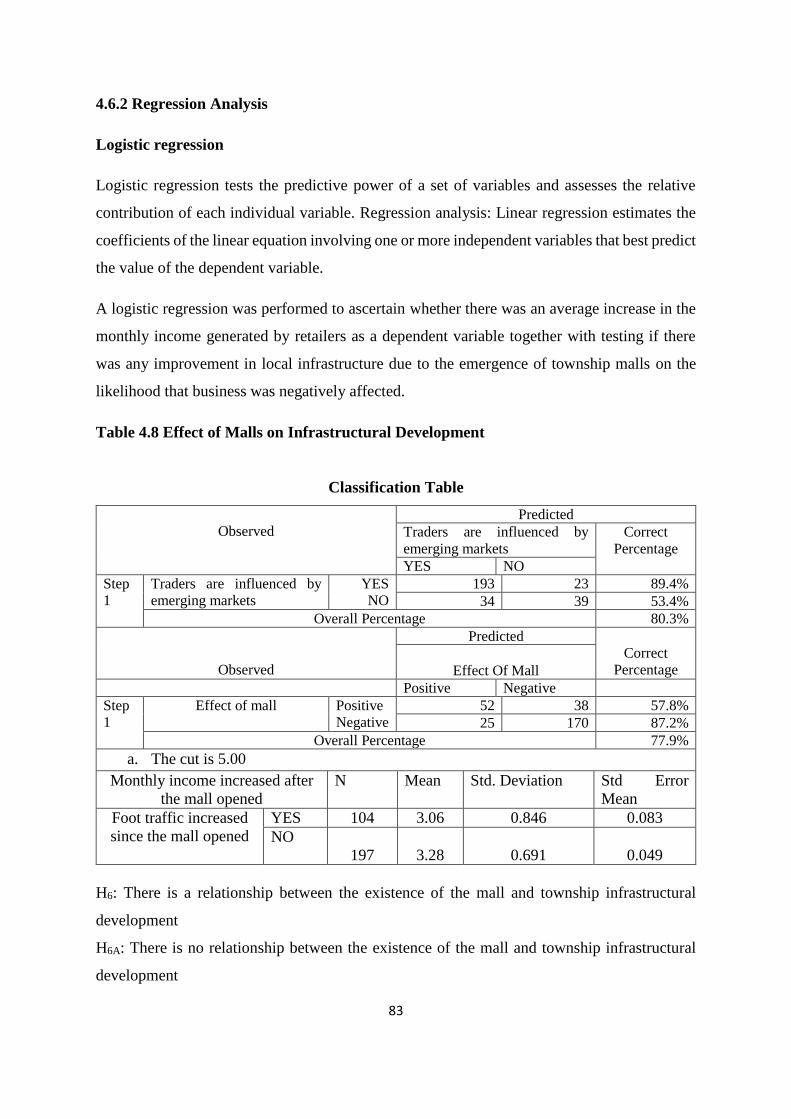
83
4.6.2 Regression Analysis
Logistic regression
Logistic regression tests the predictive power of a set of variables and assesses the relative
contribution of each individual variable. Regression analysis: Linear regression estimates the
coefficients of the linear equation involving one or more independent variables that best predict
the value of the dependent variable.
A logistic regression was performed to ascertain whether there was an average increase in the
monthly income generated by retailers as a dependent variable together with testing if there
was any improvement in local infrastructure due to the emergence of township malls on the
likelihood that business was negatively affected.
Table 4.8 Effect of Malls on Infrastructural Development
Classification Table
Observed
Predicted
Traders are influenced by
emerging markets
Correct
Percentage
YES NO
Step
1
Traders are influenced by
emerging markets
YES
NO
193 23 89.4%
34 39 53.4%
Overall Percentage 80.3%
Observed
Predicted
Correct
Percentage
Effect Of Mall
Positive Negative
Step
1
Effect of mall Positive
Negative
52 38 57.8%
25 170 87.2%
Overall Percentage 77.9%
a. The cut is 5.00
Monthly income increased after
the mall opened
N Mean Std. Deviation Std Error
Mean
Foot traffic increased
since the mall opened
YES 104 3.06 0.846 0.083
NO
197
3.28
0.691
0.049
H6: There is a relationship between the existence of the mall and township infrastructural
development
H6A: There is no relationship between the existence of the mall and township infrastructural
development

84
The logistic regression model presented in Table 4.8 above shows a statistically significant
relationship between the effects of township malls on retailer income generated on a monthly
basis together with changes in foot traffic (Mean = 3.06, Std Deviation = 0.846), χ2(18) =
120.474, p < .0005. The model explained 48.4% (Nagelkerke R2) of the variance in effect on
business and correctly classified 77.9% of cases. Those who responded ‘yes’ to an increase in
monthly income after the mall opened, those respondents who had to change their business
model in order to survive competition and those who changed their business completely were
less likely to experience a negative effect on their businesses. However, respondents who
experienced a decline in demand for some of their products realised some benefits due to the
emergence of township malls and those who had to stop trading after the malls operating were
more likely to experience a negative effect. The proportion of traders that experienced a
positive effect from the mall was lower than those who had a negative experience (78% of the
respondents).
The dependant variable, infrastructural development was influenced by the dependent variable,
existence of township malls. We can therefore accept the hypothesis in that there is a
significantly strong relationship between the existence of township malls and infrastructural
development such as roads and water supply.

85
Table 4.9 Variables in Equation
Variables in the Equation
B S.E. Wald Df Sig. Exp(B)
Step 1a q13(1) -1.699 .458 13.771 1 .000 .183
q14(1) -1.622 .421 14.857 1 .000 .198
q15(1) 1.287 .427 9.095 1 .003 3.620
q16(1) -.579 .379 2.337 1 .126 .560
q17(1) -.471 .395 1.424 1 .233 .624
q18(1) -2.230 .441 25.578 1 .000 .108
q19(1) 1.258 .387 10.577 1 .001 3.519
q20(1) .254 .445 .324 1 .569 1.289
q21(1) -.115 .462 .062 1 .803 .891
q22(1) .217 .394 .303 1 .582 1.242
q23(1) -.891 .391 5.186 1 .023 .410
q24(1) .137 .399 .118 1 .731 1.147
q25(1) -.603 .422 2.044 1 .153 .547
q26(1) .056 .430 .017 1 .897 1.057
q27(1) .250 .447 .312 1 .576 1.284
q28(1) -.367 .466 .621 1 .431 .693
q29(1) .593 .492 1.455 1 .228 1.809
q30(1) .823 .435 3.577 1 .059 2.277
Constant 1.081 .603 3.208 1 .073 2.947
a. Variable(s) entered on step 1: q13, q14, q15, q16, q17, q18, q19, q20, q21, q22, q23, q24, q25,
q26, q27, q28, q29, q30.
A logistic regression was performed to ascertain the effects on Q13 to Q30 as dependent
variables on the likelihood that local traders are influenced by emerging markets and shopping
malls as the independent variable. The logistic regression model was statistically significant,
χ2(18) = 119.532, p < .0005. The model explained 50% (Nagelkerke R2) of the variance in the
effect on local traders and correctly classified 80.3% of cases. Those who responded ‘yes’ to
the questions on an increase in business income after the mall, a change in the business product

86
range after the mall opened, that some benefits were realised due to the mall’s existence and
that local retailers are regular customers at the mall were less likely to respond ‘no’ to local
businesses are negatively influenced by township malls.
4.4 Conclusion
This chapter analysed the study’s results using the research techniques presented in chapter
three. The four research questions were presented and answered based on the data collected.
Significantly strong relationships were analysed and established between six key hypotheses.
The main aim of the study was achieved by answering all four research questions. The structure
and process of analysis was guided by the theoretical framework presented in chapter two.
Chapter four forms the basis for the discussion in relation to the theoretical framework.
The following chapter discusses the results presented in this chapter.
87
Chapter Five
Discussion of Results
5.1 Introduction
This chapter discusses the results analysed in chapter four. The study’s objectives guide the
discussion and presentation of conclusions. The main goal is to provide detailed answers to the
research questions presented in chapter one, which are:
1. What are local informal traders’ perceptions of the effects of value creating supply
chain distribution systems in emerging markets?
2. In optimising the costs of distribution systems and the propensity to improve product
availability, what effect do emerging markets have on costs to local informal traders,
intermediaries and consumers?
3. What effects do infrastructural development, township transformation and value
creating supply chain systems have on local informal traders?
4. What is the magnitude of the displacement effect on informal local traders presented
by the entry of both large scale suppliers and retailers into township markets?
The discussion begins by addressing the biographical results, followed by the first two
objectives which explored informal township traders’ perceptions of the effects of value-
creation supply chain distribution systems in emerging markets and the influence of emerging
markets on the optimal structured cost of distribution models to improve product availability.
Objectives three and four were set to establish the extent of transformation of informal retail
enterprise development brought about by formalised, large scale chains and to evaluate the
extent of the displacement of informal traders as a result of the entry of large scale retailers and
suppliers into township markets. The last two objectives are discussed by comparing the
responses to different questions through testing for any significant relationship between
dependent and independent variables. The conceptual framework presented in chapter two is
the basis of the discussion, supported by the literature review in the same chapter.

88
5.2 Section A – Demographics
Of the 301 respondents, 62% were male and 38% female. From an age perspective, 68% of the
respondents were between the ages of 31 and 50 while 27% were aged 18 to 30 and only 5%
of the respondents were over the age of 51. The mean average years of being in business was
4 to 6 years (45%) followed closely by those who had been in business for between 1 and 3
years (26%). There were more business owners with little experience; only 15% of the
respondents had been in business for between 7 and 10 years and only 2% had owned their
businesses for more than 10 years.
Business location is one of the factors to consider when one starts a business and may go a long
way in determining its success or failure. Sixty one per cent of the respondents were located 5
km or more from a township mall while (27%) were located between 2.1 and 5 km from the
mall and only 12% were between 0 and 2 km from the mall.
The data collected on staff size, type of business, when the business start operating and the
main reason for starting the business provided the researcher with in-depth understanding to
achieve the four set objectives. An overwhelming majority of the respondents’ businesses
(83%) were small, with a staff complement of between 2 and 5 employees. Medium size
businesses were the next largest category, with 16% of respondents having a staff complement
of between 5 and 8 employees. Finally, only 1% of the businesses were classified as large
businesses with a staff complement of more than 8 employees at any given time.
Respondents were also asked to state the type of business they were running, and grocery shops
had the highest share (39%), followed closely by tuck-shops (32%), while liquor stores and
hawkers were at 14% and cash & carry businesses at only 1%.
It was also important to establish whether the business started operating before or after the mall
opened and the main reason for the respondents deciding to run a business. Township
businesses existed long before the emergence of township malls. Eighty one per cent of the
respondents started operating before township malls opened, with only 19% having started
their businesses after the mall opened.
89
There were four main reasons why respondents decided to run their own business. Sixty two
per cent stated that they did so due to a lack of employment, while 20% identified an
opportunity to provide a service in their respective areas and 10% inherited their businesses
from their parents. Only 8% started their own business due to not being qualified or illiteracy.
The above analysis shows that the majority of informal retailers largely rely on income
generated by their businesses to meet their financial needs. Informal businesses are regarded
as job creators that stimulate the economy as non-employable individuals have the opportunity
to become financially independent in order to survive and improve their position in life.
5.3 Discussion Relating to Research Objectives
5.3.1 To explore local informal township traders’ perceptions of the effects of value-
creating supply chain distribution systems in emerging markets.
According to Leth and Hems (2013: 26), value creation occurs when large chains invest in
under-serviced communities which may result in both direct and indirect impacts. Positive
impacts could include job creation, improved delivery of goods and services, local
development and business enterprise development. On the other hand, negative impacts could
occur when improved supply chain distribution systems are implemented. Previously un-
accessible goods and services could become easily accessible, taking business opportunities
away from local informal traders.
The effects experienced by the different respondents would differ based on the distance from
the malls, the type of business and the owners’ skills and ability. Based on the demographic
data analysis, 66% of the respondents indicated that they were negatively affected by the
existence of the mall. The effects could include, among other things, a loss or decline in return
on sales, increased competition and/or being displaced. Business opportunities could be lost to
large chain stores that enter the township market through the development of township malls.
Only 34% of the respondents indicated that they enjoyed positive effects from the existence of
township malls. These could include, among other factors, increased income, increase foot
traffic which leads to business awareness, and being closer to transport hubs, and government
and financial institutions. Township development and improved infrastructure such as roads

90
and water supply could also result, as well as improved safety and security and closer proximity
to public facilities.
The above analysis is largely based on business owners’ perceptions and experiences of how
the emerging markets have affected local retail businesses.
Sixty five per cent of the respondents stated that their monthly income did not increase after
the malls opened, suggesting that their income decreased, while 35% indicated that their
monthly income increased.
Local informal traders largely trade in breaking bulk, keeping stock which enable consumers
to purchase as and when they require goods. They offer an assortment of products based on
local demand and largely informed by convenience for the local township consumer. Township
malls include large chain stores such as the SPAR group, Pick’ n Pay, Woolworths and Shoprite
Checkers, among others that sell products similar to those stocked by local informal traders
((Soopramanien and Qian, 2014) and (Strydom and de Klerk, 2006)). This will definitely lead
to increased competition. These large chains have already asserted themselves in grocery
trading and are supported by strong financial muscle. These findings are supported by
McGaffin and Gavera (2011); Leth and Hems (2013) and Agnihotri (2012). Sixty nine per cent
of the respondents agreed that the emergence of township malls resulted in increased
competition for local informal traders, with only 31% disagreeing with this statement.
Therefore, informal local traders’ overall perception of the emergence of township malls is a
negative one. Sixty six per cent of the respondents noted that some local informal traders had
to close their doors/stop trading after the malls opened as they could not survive the competition
and those that survived had to change their business model (64%).
Furthermore, 60% of the respondents felt that local traders did not benefit from the opening of
township malls. Seventy two per cent felt that, at the very least, the mall owners and authorities
should engage with local traders in order to establish relationships that will benefit the
community at large. Similarly, 65% of the respondents did not agree with the statement that
local informal traders were consulted before the development of township malls. Consultation
could enable the broader community to participate meaningfully in local development.
91
An overwhelming majority (69%) of the respondents strongly believed that no infrastructural
improvement was brought about by the development of township malls. While it could be
assumed that mall development would deliver improved road infrastructure, water supply and
a better transportation system, the study respondents did not believe that this was the case.
The descriptive statistics confirm the generally negative impact of township mall development
on local informal traders; 70% of the respondents stated that their businesses did not benefit
from the development of the malls, and only 30% felt that there were some benefits. The reason
could be a decrease in monthly income, increased competition, a decrease in the number of
informal traders in and around the malls, changes in product range, a decrease in foot traffic
for local traders and an overall decrease in demand.
5.3.2 Value Creating Supply Chains
The emergence of township malls could be expected to reduce the cost of goods and services,
minimise or eradicate out of stocks at retail level, improve supplier interactions in the form of
supplier representatives being more accessible and improve direct store delivery from
suppliers.
A large proportion of the respondents (75%) agreed that local informal retailers’ goods were
delivered directly by suppliers, while only 25% disagreed. Direct store delivery implies that
improved supply chain distribution systems are in place, enhancing convenience and reducing
prices and order lead times for local informal retailers. Hills, Russell, Borgonovi, Doty and
Iyer (2012) concur that value creating supply chains improve access to products and services
that largely cater for social needs.
Value creating distribution supply chains further address and alleviate social imbalances
through job creation, crime reduction and improved standards of living among township
communities. Established multinationals create value through becoming involved with the
communities where they operate.
Improved supply chain distribution systems create value for local retailers. Seventy three per
cent of the respondents agreed that the cost of goods decreased after the mall opened, with only
27% disagreeing. Reduced costs could be achieved due to the fact that some suppliers could

92
set up camp within the township malls, thus reducing travelling time and delivery costs. If local
informal retailers are able to purchase goods and services at cheaper rates, they are better able
to compete with large chain stores.
Figure 4.6 shows that 73% of the respondents agreed that the cost of sourcing goods decreased
after the malls opened. However, 70% did not agree that interaction with suppliers improved
when the malls opened, with only 30% agreeing with this statement. Crush and Frayne (2011)
note that improved interaction between formal and informal businesses could lead to value
creation as large chains act as a consumer pull for informal retailers and attract investors such
as government institutions.
Furthermore, 58% of the respondents agreed it was cheaper to source goods from a supplier
than from chain stores at the mall and 42% felt that suppliers did not necessarily offer cheaper
goods than the chain stores at the malls. It was also noted that 60% of the respondents did not
run out of stock even after the mall opened, while 40% did.
Inventory management is key in supply chain distribution value creating systems; therefore,
this can be seen as a value add, that was improved by the emergence of township malls.
Effective supply chain distribution systems enable retailers to purchase once in a cycle and
reduce the number of delivery trips without running out of stock. This is supported by Geldard
et al. (2010).
Figure 4.8 presents interesting results, showing greater significance and the highest means that
are above the neutral score for proximity to public facilities such as taxi ranks and financial
institutions, increased safety and security and improved access to government and business
institutions since the malls opened. These findings suggest that the emergence of township
malls has improved the economy at township level.
5.3.3 To evaluate the influence of emerging markets on the costs of the distribution system
and propensity to improve product availability. To examine the extent of the
transformation and development of townships and their effects on local informal traders
within formalised, large scale supply chain configurations.

93
The second and third objectives were set to determine the influence of emerging markets on
the costs of distribution systems and the propensity to improve product availability, as well as
to examine the transformation and development of townships and the effects on local informal
traders.
The study found that emerging markets improved proximity to public facilities and
transportation hubs; as discussed in the literature review, this notion is supported by Prahalad
and Ramswamy (2013). Sixty per cent of the respondents agreed with this statement, with 29%
remaining neutral and 11% disagreeing.
Tustin and Strydom (2011) and De Silva and McComb (2012) observe that, while emerging
markets offer business opportunities and improved choices for consumers, they also threaten
to displace local informal traders. Informal traders could find it hard to compete with
established large chain stores. Sixty per cent of the respondents confirmed that local informal
trader businesses are influenced by emerging markets.
Furthermore, Mokgabudi (2011) notes that emerging markets offer an opportunity for investors
to improve infrastructure and create job opportunities in communities largely dominated by
populations in the lower segment of the income pyramid.
The study further found that 61% of the respondents remained neutral when asked if there had
been increased foot traffic into retail businesses since the mall opened. Only 28% agreed that
foot traffic had increased and 9% disagreed with this statement. Therefore, local informal
retailers’ overall perception of township mall development was that no value was added to their
individual businesses in terms of creating awareness.
There has been a significant increase in the number of township mall developments in emerging
markets which has led to growth and transformation in previously disadvantaged areas (Beneke
et al., 2011). Safety and security is expected to improve with the emergence of these malls.
However, 27% of the respondents strongly disagreed that this was not the case and 20%
concurred with this statement.
It could be expected that, with the emergence of township malls, informal retailers in and
around these malls would realise immediate benefits in terms of increased foot traffic and

94
improved sales. However, the cross-tabulation test conducted to measure the performance of
informal traders after the mall opened revealed a significant relationship between the
performance of local informal businesses and the existence of the mall. Table 4.2 shows that
the majority of the respondents’ businesses suffered due to the construction of township malls.
Table 4.2 presents a significant negative total effect of 66.4% when cross-tabulating the
relationship between the effects of township mall development and local informal traders.
Tuck-shops and cash & carries were the most affected with a negative response of 98% and
75%, respectively.
5.3.4 To assess the effects of the displacement of informal local traders as the emerging
township economy creates entry for both large scale suppliers and retailers into township
markets.
The final objective was to assess the effects of the displacement of informal local traders as the
emerging township economy creates entry for both large scale suppliers and retailers into
township markets. It was expected that township malls would provide stiff competition for
local informal traders as large chains can source goods and services at lower cost than these
traders. Mokgabudi (2011) and Donaldson and Du Plessis (2013) note that township mall
development could lead to challenges for informal traders.
Tables 4.4 and 4.5 show that the Rand value income generated by local traders prior to the
existence of the mall decreased drastically when after the malls opened. On average, the outlets
that made between R5 000 and R10 000 per month before the mall opened increased their
income from 24% to 61%. However, those that made a monthly income of between R10 000
and R20 000 decreased their income from 38% to 12%, a huge drop. Furthermore, the income
of outlets that previously made more than R20 000 per month decreased from 3% to 1% after
the mall opened.
Liquors stores suffered a loss of income from more than R20 000 and between R10 000 and
R20 000 per month to between R5 000 and R10 000. Tuck-shops, grocery shops and hawkers
showed a similar trend with cash & carries retaining the same level of income. This suggests
that some local informal traders were displaced completely due to the loss of income caused
by the emergence of township malls.

95
Figure 4.4 shows the Rand value income generated before and after the malls opened. The
number of traders making between R10 000 and R20 000 per month decreased from 38% to
12% after the malls opened.
The decrease in monthly income is the result of increased competition; this is supported by
Strydom (2011), Ligthelm (2006) and Mathenjwa (2010) findings. Township mall
development will undoubtedly lead to increased competition in the fast consumer goods
market. In order to grow their monthly turnover and remain competitive, informal retailers will
have to change their business model and even consider reconfiguring the range of goods they
offer.
Table 4.1 also shows that local informal traders who experienced a decrease in monthly income
did not witness an increase in foot traffic into their respective businesses due to the emergence
of township malls.
Cost effective means of sourcing goods and services will have to be adopted in order to save
costs to gain margins and ensure a competitive pricing strategy. The changes in monthly
income were relative to or in correlation with the changes in foot traffic into informal retailers.
The regression analysis shows that a decrease in foot traffic into informal retail businesses
accompanied the decrease in monthly income.
The results also indicate a strong relationship between the type of business owned by local
informal traders and distance from the mall. The majority of township malls include large chain
stores such as Shoprite Checkers, OK stores, SPAR supermarkets, and Pick ‘n Pay and
Woolworths' stores that largely deal in breaking bulk of groceries and beverages.
The results show that liquor outlets that are situated between 2.1and 5 km from the malls were
largely negatively influenced by the malls (51.2%), closely followed by grocery shops situated
between 2.1 and 5 km from the malls (52%). Tuck-shops that are more than 5 km from the mall
were the most negatively affected (98%). Some outlets experienced no effects or change to
their businesses. The mixed positive and negative effects on local retailers imply that township
96
mall development can have a relatively positive impact on local trader businesses based on the
data collected.
Moreover, there was no significant evidence that more businesses or outlets started trading
after the malls opened. It could be assumed that due to township mall development,
entrepreneurs would seize the opportunity to open new stores in order to cater for the influx of
consumers visiting the mall. In contrast, this study found that some owners closed up shop as
they could not survive the increased completion.
Leth and Hems (2013) note that township mall development is intended to create value through
investing in under-serviced communities which may result in both indirect and direct impacts.
Investors are expected to collaborate with local and small business enterprises. However, when
the respondents were asked whether there was consultation and involvement of local retailers
before the mall was constructed 65% said that they were not consulted, while only 35%
confirmed that they were engaged by investors before the construction of the malls.
The development of township malls did not result in infrastructural improvements in local
townships; 69% of the respondents stated that there was no improvement or transformation in
local infrastructure. Only 31% cited such benefits. Furthermore, it is expected that the
development of township malls would alleviate and address social imbalances through social
cooperate investment and community inclusive programs. Tsai and Yang (2013) adds that
increased competition could lead to some market players exiting the market or re-designing
their business model. The market is based on the survival of the fittest and local informal traders
would likely find it costly and demanding to compete with large chains that exploit economies
of scale and are supported by a highly qualified management team.
Markovic (2009) characterises the informal market as one that is made up of non-standard wage
workers as well as entrepreneurs and self-employed individuals in an unregulated environment.
It engages in survival activities by managing and operating growing businesses. Therefore,
economic policies that seek to grow informal economies affect the growth and existence of the
informal market. Hence, the majority (66%) of the respondents stated that they were negatively
affected by the development of township malls in more ways than one, with only 34% realising
positive benefits.
97
5.4 Conclusion
Emerging markets have resulted in substantial growth in retail infrastructure and facilities in
townships, expanding the distribution and availability of goods and services to the immediate
consumer. This has also resulted in the cheaper provision of quality goods and services for the
final consumer. In the process, retail infrastructural development in township markets has
improved the standard of living by creating job opportunities. However, on the other hand,
transformation and development in South African townships results in increased competition
and the displacement of local informal traders. Informal retail businesses experience a decline
in sales as a result of large chains entering the townships, followed by cyclical economic
patterns that pose a risk to sales growth for local informal traders who compete with stores with
superior financial muscle.
This study has shown that if a win-win situation is created, local informal traders will not be
displaced. Local traders offer convenience shopping and tailor made products for their specific
market; therefore, strong collaboration between the formal and informal sectors will create and
maintain a process that is beneficial not only to the large chains and their investors, but the
entire community. The government will be required to manage and guide this process by
providing technical and financial support to local informal traders.
98
Chapter Six
Recommendations and Conclusions
This study aimed to unpack the perceived challenges associated with the effects of township
mall development on local informal traders. The results discussed in the previous chapter were
critically compared with the research literature in the field of supply chain management.
Township mall development in South African townships has mushroomed in an alarming rate
as discussed in previouse chapters of this study. More often than not, township mall
development will be received positively for the benefits of improved choice for consumers,
affordable quality services and infrastructural development. However, less attention has been
paid to the effects township mall development has on local informal businesses. Small
businesses are seen as a vehicle to stimulate growth in South African economic landscape,
therefore, township mall development in essence represent a threat in displacing local informal
trader businesses. This chapter presents the study’s recommendations and conclusions.
6.1 The Influence of Emerging Markets on Informal Local Traders
In the past few years there has been an incease in township mall development, which has
completely changed the township retail landscape. Traditionally, informal local traders
dominated township retailing, providing convenient shopping for consumers. After the change
in the political dispensation in South Africa in 1994, many township residents’ disposable
income had increased, leading to increased spending power. Thus, South African townships
emerged as an opportunity for large chain stores to increase their profitability through township
mall development. The development of township malls has decreased the cost of goods and
services for local consumers whilst also offering a wider variety of better quality goods and
services. Amongst other positive aspects, township infrastructural development has occurred
due to township mall development. Consequently, the economic trading landscape in South
African townships had to change and meant that it cannot be business as usual for local informal
traders due to the emergence of township malls. The influence of township mall development
has produced a mixed bag of results for local informal traders. Some have been comppletely
displaced by the emergence of township malls while orther informal traders have realised
improved benefits in the process. The desired outcome however remains to be able to create

99
and etsablish a strong beneficial balance between local consumer benefits and local informal
trader benefits.
The current South African governement has made it a key strategic thrust to stimulate small
business participation in order to achieve economic growth more espcially in previously
disadvantaged communities like townships (Ligthelm, 2014:59). The study has shown that a
majority of respondents experienced a decrease in income generated due to the emergence of
township malls. The study found that some of the local informal traders were displaced
completely from trading while those who survived the increased competition have had to
rearrange their processes and product portfolio.
6.1.1 Benefits of Township Mall Developments
The emergence of township mall development has resulted to a number of benefits for local
communities amongst others being: improved wider choice of better quality goods and
services, decreased the cost of goods and services, local infrastructural development, improved
supply chains and logistical systems. The presence of large chain stores resulted in increased
competition for all businesses which would result in lower prices, improved quality of service
by local informal traders in order to survive the increased competition. The emergence of
township malls meant that a larger proportion of township expenditure by locals was now
circulating within local community businesses while stimulating the local economy. Prior to
township mall development local residents spent their earnings in the main city shopping malls
which involved a lot of costly travelling. Further, township malls provide a safe and convinient
shopping environment for the local community which also allows ease of socialising.
6.1.2 Local Development and Value Creation
The emergence of township malls has resulted in improved infrastructural development and
has raised the standard of living in communities through job creation. However, this study
found that safety and security did not increase due to the development of township malls;
ideally, the opposite would have been expected. However, there was a significantly positive
response to improved proximity to public facilities and transport hubs which were developed
due to the existance of the malls.
100
The development of the malls also presents an opportunity for local informal retailers to
become partners in the development as well as become tenants in the mall. Informal local
retailers can also open new premeses closer to the mall to capitalize on increased consumer
traffic. Some traders have had to operate longer hours in order to generate extra income.
Due to the emergence of township malls, the cost of sourcing goods decreased for local
informal traders. This could be due to a number of reasons, including increased competition
which meant that local retailers had a wider variety of suppliers who themselves compete by
offering the best price. Secondly, the emergence of township malls improved local
infrastructural development such as transportation facilities and public enterprises. Finally,
suppliers started to deliver directly to townships due to improved road infrastructure and
improvements in safety and security. The financial savings realised from the decrease in the
cost of purchases could be re-invested into the business which enable local retailers to become
more competitive.
Furthermore, supplier representatives started to visit local informal retailers more often for
delivery and business development purposes. Suppliers started investing heavily in managing
their individual brands’ presence and distribution by outlet, and in price management,
merchandising outlets to improve the look and feel of retailers’ businesses and most
importantly, running local promotions to create excitement around their brands which would
lead to improved profitability for local informal traders.
6.1.3 Disadvantages of Township Mall Developments and Displacement Effects
However, the development of township malls has not been entirely beneficial for local informal
traders. Due to increased price competition and the wider variety of goods and services offered
by large chain stores, local retailers have experienced decreased income. Indeed, some have
been entirely displaced and those that survived have had to implement improved customer
service processes and re-arrange their product mix.
Many factors influence the success or failure of a business such as current economic conditions,
business managennt skills and the nature of the business. Therefore, it cannot be concluded that
the decline in local informal traders’ business is solely due to the emergence of township malls.
Further research is required on this issue. As discussed in the previous chapter, some local

101
retailers who survived the increased competition had to change their product range in order to
remain relevant and competitive. Therefore, the effect of the township malls will be contextual,
in that it is largely influenced by the capacity and capability of local retailers to adapt to and
survive new competition. Even though township malls may lead to increased local expenditure
by local residents, the benefits of such is unlikely to benefit local communities directly as the
monetary benfits are transferred directly to owners of large chain stores. While it is clear and
well documented that township mall development has resulted in reducing the cost of goods
and services while increasing competition, it is important to note that local informal businesses
have been negatively affected in some sectors. The effects have also affected entreprenures
who are survivalists while in the process leading to negative effects on the South African
economic growth and employment.
The emergence of township malls to some extent resulted into a decline in employment within
local informal traders. This was attributed to the increased competiton and cheaper goods and
services by large chain stores. Further, local informal traders could not compete with wage
offers and benefits offered by the large chains to their best employees who were taken over.
However, local communities realised new job opportunities due to the emergence of township
malls. Unemployment rate was given a shot in the arm by the job opportunities created by the
mall tenants.
It is thus concluded that the effects of township mall development on local informal retailers
cannot be solely attributed to the increased competiton brought about by large chain stores. The
development of such malls also reduces transport costs for local traders, while improving their
access to financial and government institutions.
The key findings of this study are that, while the emergence of township malls benefits local
consumers by reducing the cost of goods and offers a wider variety of quality goods and
services, increased competition resulted in decreased profits for local informal traders, with
some being completely displaced.
In order for township malls to offer social, economic and environmental benefits to all
stakeholders, a number of sectors need to fully support the development and to be fully engaged
at all stages, from as early as planning. This will require government to take the lead and act

102
as a co-ordinator. A number of stakeholders have a key role to play in ensuring that local
informal retailers benefit from the development of township malls. Local government bodies,
local societies, taxi operators and social groups from the local community need to work with
the large chains and investors to create a win-win situation. Investors and chain stores would
need to invest heavily in research and consultation with local communities and make it their
priority to involve the community at all stages. This will not only benefit communities, but
investors as well.
The government should facilitate a process where investors consult local business
organizations and social groups in order for them to be part of the process. Local informal
retailers need to be given the opportunity to rent space in the new malls. As part of the lease
agreement, large chains could invest in corporate social investment projects to benefit and
uplift the communities they serve.
In order to ensure that township malls are fully functional over an extended period of time,
investors need to ensure that the mall and surrounding infrastructure are maintained at all times.
The local municipality needs to ensure that services such as water and electricity are provided
in order to attract consumers whose spending will boost profits.
As part of coperate social investment, investors in township malls should support local
businesses and launch initiatives to uplift the local community. Buy-in from local community
members will result in support for the malls. This can be achived by investing in initiatives
such as basic business training for local informal traders and supporting sports and social
initiatives, especially at grass-roots level.
Therefore, based on the findings of this study and analysis, it is highly advisable that policies
and processes be implemented in order to protect local informal traders in South African
townships from negative influences brought about by the emergence of township malls. The
policies need to establish the opportunity cost of displacing local informal businesses realised
from the reduction of consumer costs. The option of local cooperatives ownership of township
malls remains a huge opportunity in redressing the imbalances that have been created by the
emergence of township malls who are dominated by large chains and outside investors. This
103
will encourage local expenditure of income realised from the township malls, stimulate the
economy while reducing the high un-employment rate in South Africa.
6.2 Future Research
This research study focussed on local informal traders’ perceptions of the development of
township malls. Future research could examine consumers and the large chains’ perceptions of
this phenomenon. It would be interesting to examine how the development of township malls
has affected large chain stores’ participation in the chain. It would also be interesting to gain
insight into how the emergence of township malls has affected consumer behaviour in deciding
whether to buy from an informal local trader or a large chain store at the mall.
104
Bibliography
Abrahams, L. and Pogue, TE. (2012) South Africa’s national system of innovation and
knowledge economy evolution: thinking about ‘less favoured regions’. International
Journal of Technological Learning, Innovation and Development 5: 58-82.
Agnihotri, A. (2012) Revisiting the Debate over the Bottom of the Pyramid Market. Journal of
Macromarketing 32: 417-423.
Agresti, A. and Kateri, M. (2011) Categorical data analysis: Springer.
Ancarani, F., Frels, J., Miller, J., Saibene. C., and Barberio, M. (2014) Winning in Rural
Emerging Markets. California Management Review 56: 31-52.
Anderson, J. and Billou, N. (2007) Serving the world's poor: innovation at the base of the
economic pyramid. Journal of Business Strategy 28: 14-21.
Anselin, L. and Getis, A. (2010) Spatial statistical analysis and geographic information
systems. Perspectives on spatial data analysis. Springer, 35-47.
Beneke, J., Curran, M., Forsyth, G., and Lamb, S. (2011) Towards an understanding of retailing
practices in the second economy: an exploratory study of Western & Eastern Cape
township retailers in South Africa. African Journal of Business and Economic Research
6: 92-108.
Benjamin, JR. and Cornell, CA. (2014) Probability, statistics, and decision for civil engineers:
Courier Corporation.
Benjamin, NC. and Mbaye, AA. (2012) The Informal Sector, Productivity, and Enforcement
in West Africa: A Firm‐level Analysis. Review of Development Economics 16: 664-
680.
105
Bernard, HR. and Bernard, HR. (2012) Social research methods: Qualitative and quantitative
approaches: Sage.
Bird, DK. (2009) The use of questionnaires for acquiring information on public perception of
natural hazards and risk mitigation–a review of current knowledge and practice.
Natural Hazards and Earth System Sciences 9: 1307-1325.
Blanco, E. (2009) Winning in emerging markets: Five key supply chain capabilities. Supply
Chain Strategy.
Bryman, A. and Cramer, D. (2002) Quantitative data analysis with SPSS release 10 for
Windows: a guide for social scientists: Routledge.
Callaghan, CW. (2014) Changes in the structure of earnings of informal street traders. Acta
Commercii 14: 13 pages.
Cantens, T. (2012) Informal trade practices. WCO Research Paper Series 22.
Carver, R. and Nash, J. (2011) Doing Data Analysis with SPSS: Version 18.0: Cengage
Learning.
Chaffey, D., Ellis-Chadwick, F., Mayer. R., and Johnston, K. (2009) Internet marketing:
strategy, implementation and practice: Pearson Education.
Charmaz, K. (2011) Grounded theory methods in social justice research. The Sage handbook
of qualitative research 4: 359-380.
Cohen. J., Cohen, P., West, SG., and Aiken, LS. (2013) Applied multiple regression/correlation
analysis for the behavioral sciences: Routledge.
Cooper, DR., Schindler, PS. and Sun, J. (2006) Business research methods: McGraw-hill New
York.
106
Coughlan, AT., Anderson, E., and Stern, LW. (2006a) Marketing channels: Prentice Hall.
Coughlan, AT., Anderson. E., Stern, LW., and Adel, I. (2006b) El-Ansary. Marketing
Channels. Upper Saddle River, NJ: Prentice Hall.
Creswell, JW. (2013) Research design: Qualitative, quantitative, and mixed methods
approaches: Sage publications.
Crush, J. and Frayne, B. (2011) Supermarket expansion and the informal food economy in
Southern African cities: implications for urban food security. Journal of Southern
African Studies 37: 781-807.
De Silva, DG. and McComb, R. (2012) Research Universities And Regional High‐Tech Firm
Start‐Up And Exit. Economic Inquiry 50: 112-130.
Denzin, NK. and Lincoln, YS. (2011) The SAGE handbook of qualitative research: Sage.
Donaldson, R. and Du Plessis, D. (2013) The urban renewal programme as an area-based
approach to renew townships: The experience from Khayelitsha's Central Business
District, Cape Town. Habitat International 39: 295-301.
Dytham, C. (2011) Choosing and using statistics: a biologist's guide: John Wiley & Sons.
Fan, Y. (2008) The rise of emerging market multinationals and the impact on marketing.
Marketing Intelligence & Planning 26: 353-358.
Farahani, RZ., Rezapour. S., Drezner, T., and Fallah, S. (2014) Competitive supply chain
network design: An overview of classifications, models, solution techniques and
applications. Omega 45: 92-118.
Fernie, J. and Sparks, L. (2014) 1 Retail logistics: changes and challenges. Logistics and Retail
Management: Emerging Issues and New Challenges in the Retail Supply Chain: 1.
107
Frith, A. (2014) Census 2011. URL: http://census2011. adrianfrith. com/place/199018 (visited
on 12/12/2012).
Geldard, C., Wilding, RD., Waller, A., Rossi, S., Mayhew, S., Cigolini, R., and Metcalfe, C.
(2010) Supply chain strategy in the board room.
Cohen. J., Cohen, P., West, SG., and Aiken, LS.
Giamporcaro, S. (2011) Sustainable and responsible investment in emerging markets:
Integrating environmental risks in the South African investment industry. Journal of
Sustainable Finance & Investment 1: 121-137.
Gnanadesikan, R. (2011) Methods for statistical data analysis of multivariate observations:
John Wiley & Sons.
Gonzalez, S. and Waley, P. (2013) Traditional retail markets: The new gentrification frontier?
Antipode 45: 965-983.
Gorczynski, T. and Kooijman, D. (2015) The real estate effects of e-commerce for
supermarkets in the Netherlands. The International Review of Retail, Distribution and
Consumer Research: 1-28.
Green, SB. and Salkind, NJ. (2010) Using SPSS for Windows and Macintosh: Analyzing and
understanding data: Prentice Hall Press.
Hair, JF. (2010) Multivariate data analysis. A Global Perspective. 7th Edition. Kennesaw State
University. Prentice Hall.
Hao, P., Wang, B., Li, G., Mang, Z., Tian, K. and Tang, X. (2014) Hybrid optimization of
hierarchical stiffened shells based on smeared stiffener method and finite element
method. Thin-Walled Structures 82: 46-54.
Harrison, P. and Todes, A. (2010) SPATIAL CONSIDERATIONS IN THE DEVELOPMENT
OF URBAN POLICY IN SOUTH AFRICA: A RESEARCH PAPER AS INPUT INTO
108
THE PREPARATION OF THE INTEGRATED URBAN DEVELOPMENT
FRAMEWORK (IUDF).
Hart, K. (1973) Informal income opportunities and urban employment in Ghana. The journal
of modern African studies 11: 61-89.
Hauke, J. and Kossowski, T. (2011) Comparison of values of Pearson's and Spearman's
correlation coefficients on the same sets of data. Quaestiones Geographicae 30: 87-93.
Hesse-Biber, SN. (2010) Mixed methods research: Merging theory with practice: Guilford
Press.
Hills, G., Russell, P., Borgonovi, V., Doty, A., and Lyer, L. (2012) Shared Value in Emerging
Markets. How Multinational Corporations Are Redefining Business Strategies to Reach
Poor or Vulnerable Populations.FSG.(Retrieved:
http://sharedvalue.org/sites/default/files/resourcefiles/Shared_Value_in_Emerging_Markets.
pdf).
Hugos, MH. (2011) Essentials of supply chain management: John Wiley & Sons.
Hull, M. and McGroarty, F. (2014) Do emerging markets become more efficient as they
develop? Long memory persistence in equity indices. Emerging Markets Review 18:
45-61.
Humphrey, J. (2007) The supermarket revolution in developing countries: tidal wave or tough
competitive struggle? Journal of Economic Geography.
Jackson, T. (2012) Cross-cultural management and the informal economy in sub-Saharan
Africa: Implications for organization, employment and skills development. The
International Journal of Human Resource Management 23: 2901-2916.
Jobson, J. (2012) Applied multivariate data analysis: volume II: Categorical and Multivariate
Methods: Springer Science & Business Media.

109
Jürgens, U. and Donaldson, R. (2012) A review of literature on transformation processes in
South African townships. Urban Forum. Springer, 153-163.
Kenny, B. (2011) Reconstructing the Political: Mall Committees and South African Precarious
Retail Workers. TRAVAIL, capital et société 44.
Khanna, T. and Palepu, K. (2000) The future of business groups in emerging markets: Long-
run evidence from Chile. Academy of Management journal 43: 268-285.
Khanna, T. and Palepu, K. (2013) Winning in emerging markets: A road map for strategy and
execution: Harvard Business Press.
Kinnear, PR. and Gray, CD. (1993) SPSS/PC Plus Made Simple: Lawrence Erlbaum
Associates.
Klemz, BR., Boshoff, C. and Mazibuko, N-E. (2006) Emerging markets in black South African
townships: Small local independently owned versus large national retailers. European
Journal of Marketing 40: 590-610.
Leth, M. and Hems, L. (2013) The Potential for Creating Shared Value in Australia How
Australian companies co-create long-term commercial and social value Draft Insights
for a Green Paper. Presented at the Creating Shared Value Forum.
Levy, PS. and Lemeshow, S. (2013) Sampling of populations: methods and applications: John
Wiley & Sons.
Ligthelm, A. (2006) Size estimate of the informal sector in South Africa. Southern African
Business Review 10: 32-52.
Ligthelm, A. (2014) Confusion about entrepreneurship? Formal versus informal small
businesses. Southern African Business Review 17: 57-75.

110
Ligthelm, A. and Masuku, T. (2003) Size, structure and profile of the informal retail sector in
South Africa: Bureau of Market Research, University of South Africa.
Markovic, MR. (2009) Globalization and gender participation in the informal sector in
developing and transitional countries. E+ M Ekonomie a Management: 17.
Mathenjwa, A. (2010) The impact of Jabulani shopping mall on small township businesses and
their response.
Maxwell, JA. (2012) Qualitative research design: An interactive approach: An interactive
approach: Sage.
Mbhele, TP. (2012) CENTRAL SUPPLY CHAIN DISTRIBUTION SYSTEM DIFFUSION
IN THE SELECTED RETAIL GROCERY INDUSTRY. International Journal of
Information Technology and Business Management. Volume 14 - No.1.
McGaffin, R. and Gavera, L. (2011) Taking Stock: The development of retail centres in
emerging economy areas. Pretoria: Urban Land-Mark. Available online at www.
urbanlandmark. org. za/research/x51. php.
McGaffin, R., Napier, M., and Gavera, L. (2014) Value Capture in South Africa—Conditions
for their Successful Use in the Current Legal Context. Urban Forum. Springer, 375-
387.
McKight, PE. and Najab, J. (2010) Kruskal‐Wallis Test. Corsini Encyclopedia of Psychology.
Meeker, WQ. and Escobar, LA. (2014) Statistical methods for reliability data: John Wiley &
Sons.
Moingeon, B. and Lehmann-Ortega, L. (2010) Creation and implementation of a new business
model: a disarming case study. Management 13: 266.
Mokgabudi, L. (2011) The impact of shopping mall developments on consumer behaviour in
township areas. Masters Dissertation, Unpublished. Pretoria: University of Pretoria.

111
Mukaka, M. (2012) A guide to appropriate use of Correlation coefficient in medical research.
Malawi Medical Journal 24: 69-71.
Mukherjee, M., Cuthbertson, R., and Banerjee, M. (2013) Capturing the uncertainties of retail
development: The case of emerging markets.
Natrella, MG. (2013) Experimental statistics: Courier Corporation.
Neuwirth, R. (2012) The Power of the Informal Economy. Ted Talk. June.
Nordstokke, DW., Zumbo, BD., Cairns, SL., and Saklofske, DH. (2011) The operating
characteristics of the nonparametric Levene test for equal variances with assessment
and evaluation data. Practical Assessment, Research & Evaluation 16: 1-8.
Nykiel, RA. (2007) Handbook of marketing research methodologies for hospitality and
tourism: Routledge.
Olsen, S., Wilson, R., Michel, P., Gibberd, RW., Vincent, C., El-Assaday, RR., Qsous, S.,
Macharia, WM., and Sahel, A. (2012) Patient safety in developing countries:
retrospective estimation of scale and nature of harm to patients in hospital. Bmj 344:
e832.
Ouma, D., Mwangi, T., and Oduk, PM. (2013) Modeling Agility in Kenyan Supermarkets
Chain Expansion. International Journal of Business and Commerce 2: 21-36.
Pallant, J. (2013) SPSS survival manual: McGraw-Hill Education (UK).
Patton, MQ. (2005) Qualitative research: Wiley Online Library.
Perks, K., Dr Phani, Tej., Adidam, D., Chikweche, T., and Fletcher, R. (2014) Marketing to
the “middle of the pyramid” in emerging markets using a social network perspective:
Evidence from Africa. International Journal of Emerging Markets 9: 400-423.

112
Porter, ME. and Kramer, MR. (2011) Creating shared value. Harvard business review 89: 62-
77.
Prahalad, CK. and Hammond, A. (2002) Serving the world's poor, profitably. Harvard business
review 80: 48-59.
Prahalad, CK. and Ramaswamy, V. (2013) The future of competition: Co-creating unique value
with customers: Harvard Business Press.
Pratt, JW. and Gibbons, JD. (2012) Concepts of nonparametric theory: Springer Science &
Business Media.
Qian, L. (2014) Market-based supplier selection with price, delivery time, and service level
dependent demand. International Journal of Production Economics 147: 697-706.
Qian, L. and Soopramanien, D. (2014) Using diffusion models to forecast market size in
emerging markets with applications to the Chinese car market. Journal of Business
Research 67: 1226-1232.
Radovic, MM. (2013) An evaluation of sme development in Serbia. Актуальні проблеми
економіки: 422-431.
Rogerson, CM. (2013) Improving market access opportunities for urban small, medium and
micro-enterprises in South Africa. Urbani izziv: 133-143.
Rosner, B. (2010) Fundamentals of biostatistics: Cengage Learning.
Rubin, J. and Chisnell, D. (2008) Handbook of usability testing: how to plan, design and
conduct effective tests: John Wiley & Sons.
Saab Jr, JY., Correa, HL. and Bowers, MR. (2008) Optimising performance with distributor
managed inventory in a FMCG supply chain. International Journal of Business
Excellence 1: 121-140.

113
Saksena, HJ., Saksena, A., Jain, K., and Parveen, CM. (2013) Logistics Network Simulation
Design. Proceedings of the World Congress on Engineering.
Satorra, A. and Bentler, PM. (2010) Ensuring positiveness of the scaled difference chi-square
test statistic. Psychometrika 75: 243-248.
Schwartz, M. and Hornych, C. (2010) Cooperation patterns of incubator firms and the impact
of incubator specialization: Empirical evidence from Germany. Technovation 30: 485-
495.
Sekaran, U. and Bougie, R. (2010) Research methods for business: A skill building approach.
Wiley. London.
Sheth, JN. (2011) Impact of emerging markets on marketing: Rethinking existing perspectives
and practices. Journal of Marketing 75: 166-182.
Sodhi, MS. and Tang, CS. (2014) Supply‐Chain Research Opportunities with the Poor as
Suppliers or Distributors in Developing Countries. Production and Operations
Management 23: 1483-1494.
Soopramanien, D. and Qian, L. (2014) Using diffusion models to forecast market size in
emerging markets with applications to the Chinese car market. Journal of Business
Research 67: 1226-1232.
Stock, JR., Boyer, SL., and Harmon, T. (2010) Research opportunities in supply chain
management. Journal of the Academy of Marketing Science 38: 32-41.
Strydom, J. (2011) Retailing in disadvantaged communities: the outshopping phenomenon
revisited. Journal of Contemporary Management 8: 150-172.
Strydom, M. and de Klerk, HM. (2006) The South African clothing industry: problems
experienced with body measurements. Journal of Family Ecology and Consumer
Sciences/Tydskrif vir Gesinsekologie en Verbruikerswetenskappe 34.

114
Thompson, JD. and MacMillan, IC. (2010) Business models: Creating new markets and
societal wealth. Long Range Planning 43: 291-307.
Toomey, DC. (1998) South African small business growth through interfirm linkages:
publisher not identified.
Tsai, K-H. and Yang, S-Y. (2013) Firm innovativeness and business performance: The joint
moderating effects of market turbulence and competition. Industrial Marketing
Management 42: 1279-1294.
Tustin, D. and Strydom, J. (2006) The potential impact of formal retail chains' expansion
strategies on retail township development in South Africa. Southern African Business
Review 10: 48-66.
Vanderstraeten, J. and Matthyssens, P. (2012) Service-based differentiation strategies for
business incubators: Exploring external and internal alignment. Technovation 32: 656-
670.
Venkatesh, V., Brown, SA., and Bala, H. (2013) Bridging the qualitative-quantitative divide:
Guidelines for conducting mixed methods research in information systems. MIS
quarterly 37: 21-54.
Verick, S. (2004) Threshold Effects of Dismissal protection legislation in Germany.
Vogt, WP. and Johnson, RB. (2011) Dictionary of statistics & methodology: A nontechnical
guide for the social sciences: Sage.
Wedan, Q. (2006) Transforming global logistics for strategic advantage in emerging markets.
IBM Global Business Services,” Whiten Paper.
Welman, C., Kruger, F., and Mitchell, B. (2005) Research methodology: Oxford University
Press.
115
Williams, CC. and Nadin, S. (2012) Tackling the hidden enterprise culture: government
policies to support the formalization of informal entrepreneurship. Entrepreneurship &
Regional Development 24: 895-915.
Woodward, D., Rolfe, R., Ligthelm, A., and Guimaraes, P. (2011) The viability of informal
microenterprise in South Africa. Journal of Developmental Entrepreneurship 16: 65-
86.
Wooldridge, J. (2012) Introductory econometrics: A modern approach: Cengage Learning.
Yin, RK. (2013) Case study research: Design and methods: Sage publications.
Yunus, M., Moingeon, B., and Lehmann-Ortega, L. (2010) Building social business models:
lessons from the Grameen experience. Long Range Planning 43: 308-325.

116
Appendix A
Questionnaire
Section A: Biographical Data and Organisational Profile
This section relates to the biographical details of the respondent and the company. All
answers you provide are based on your experience, perceptions and knowledge. Please tick
(√) or circle the appropriate box.
1. Gender
2. What
is your current age?
18 - 30 years old 31 - 50 years old 51+ years old
3. How many years have you been running the business?
Less than 1 1-3 4-6 7-10 Over 10
4. What is the size of the staff complement?
Small (2-5 employees) Medium (5 – 8 employees) Large (more than 8
employees)
5. What type of business are you running?
Liquor Outlet Grocery Shop Hawker Cash & Carry Distributor
Other, please specify --------------------------------------------------------
6. What is the distance from the shopping mall or complex to your business?
7. How has the existence of the mall affected your business?
8. I started my business
Before the mall opened After the mall opened
9. Indicate your average monthly income before the mall opened
Less than R5 000 R5 000 - R10 000 R10 000 - R20 000 R20 000 and above
Male
Female
0 - 2 Km 2.1 - 5 Km 5+ Km
Positively Negatively

117
10. Indicate your average monthly income since the mall opened
11. The business was opened because of:
Lack of employment Not qualified Inherited from parents Business opportunity
Section B: Dichotomous Questions
This section relates to the objectives of the study. The questions require a “Yes” or “No” answer on the perceived impact of township
malls/emerging markets on local traders. All answers you provide are based on your experience, perceptions and knowledge. Please tick
(√) or circle the appropriate box.
Impact of township malls/ emerging markets on local traders
12 Township local informal traders are influenced by emerging markets and shopping malls Yes No
13 My business’ monthly income increased after the mall opened Yes No
14 My business’ product range changed after the mall opened Yes No
15 The number of stores around the mall have increased since the mall opened Yes No
16 My business model changed in order to compete with stores in the mall Yes No
17 There has been a decline in demand for some products since the mall opened Yes No
18 Retailers have benefitted from the mall opening in the township Yes No
19 The cost of goods has decreased since the mall opened Yes No
20 Local retailers were consulted before the mall was constructed Yes No
21 Local small traders do benefit from the development of the mall Yes No
22 The development of the mall has added value to my business Yes No
23 Local retailers are regular customers at the mall Yes No
24 Some local traders stopped trading after the mall opened as they could not survive the competition Yes No
25 The nature of my business had to change after the mall opened Yes No
26 The mall had no effect on my business Yes No
27 My business keeps up-to-date financial records Yes No
28 Competition has increased since the mall opened Yes No
29 The investors and mall management team constantly engage local retailers in order to support growth Yes No
30 Local roads, and the water and electricity supply has improved since the development of the mall Yes No
Less than R5 000 R5 000 - R10 000 R10 000 - R20 000 R20 000 and above

118
Section C: This section relates to value creating supply chain distribution systems. It aims to obtain information on the various supply
chain distribution systems used to transport goods to the retailers. All the answers you provide are based on your experience, perceptions
and knowledge. Please tick (√) or circle the appropriate box.
Value creating supply chain distribution systems
31 Do you receive your products on delivery from the supplier? Yes No
32 Do you use your own transport to fetch goods to sell? Yes No
33 The cost of obtaining goods has decreased since the mall opened Yes No
34 Do you receive goods for reselling from supplier representatives? Yes No
35 The cost price of goods is cheaper from the supplier than in a chain store Yes No
36 Have you run out of stock since the mall opened? Yes No
37 Did you run out of stock before the mall opened? Yes No
38 Supplier interaction has improved since the mall opened Yes No
Section D: This section relates to value creation and development. It taps into the study’s objectives. All the answers you provide are
based on your experience, perceptions and knowledge. Please tick (√) or circle the appropriate box.
Select the number you find most appropriate relative to the question
5 = strongly agree; 4 = agree; 3 = neutral; 2 = disagree; 1 = strongly disagree
Value creation and development
39 Local informal traders are influenced by emerging markets in townships 5 4 3 2 1
40 Competition has increased since the mall opened 5 4 3 2 1
41 Access to banking and financial institutions has improved since the mall opened 5 4 3 2 1
42 Safety and security has increased since the mall opened 5 4 3 2 1
43 Accessibility to government and business development institutions has improved 5 4 3 2 1
44 The visibility of my business has improved since the mall opened 5 4 3 2 1
45 Proximity to larger businesses has improved since the mall opened 5 4 3 2 1
46 Proximity to public facilities and transport hubs has improved since the mall opened 5 4 3 2 1
47 Levels of foot traffic into my business have increased since the mall opened 5 4 3 2 1
End of the Questionnaire
Thank you for taking the time to complete the questionnaire.

119
Appendix B: Ethical Clearance Letter

120
Appendix C: Editor’s Certificate
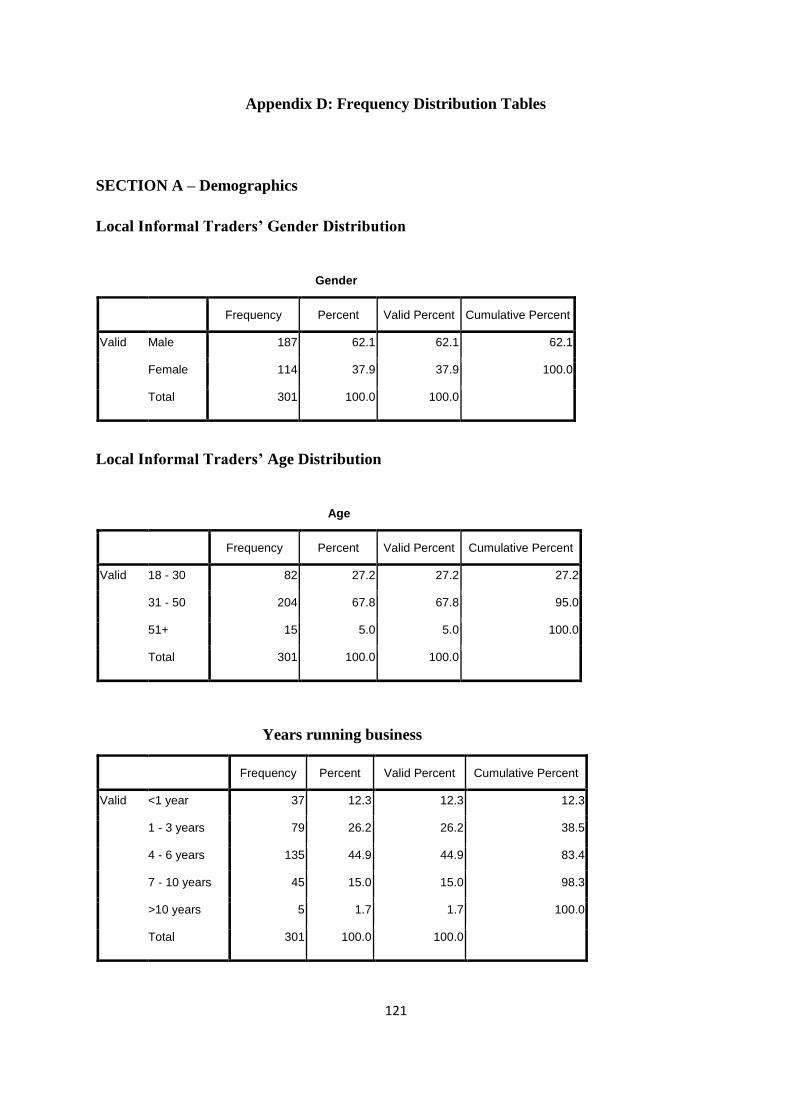
121
Appendix D: Frequency Distribution Tables
SECTION A – Demographics
Local Informal Traders’ Gender Distribution
Gender
Frequency Percent Valid Percent Cumulative Percent
Valid Male 187 62.1 62.1 62.1
Female 114 37.9 37.9 100.0
Total 301 100.0 100.0
Local Informal Traders’ Age Distribution
Age
Frequency Percent Valid Percent Cumulative Percent
Valid 18 - 30 82 27.2 27.2 27.2
31 - 50 204 67.8 67.8 95.0
51+ 15 5.0 5.0 100.0
Total 301 100.0 100.0
Years running business
Frequency Percent Valid Percent Cumulative Percent
Valid <1 year 37 12.3 12.3 12.3
1 - 3 years 79 26.2 26.2 38.5
4 - 6 years 135 44.9 44.9 83.4
7 - 10 years 45 15.0 15.0 98.3
>10 years 5 1.7 1.7 100.0
Total 301 100.0 100.0
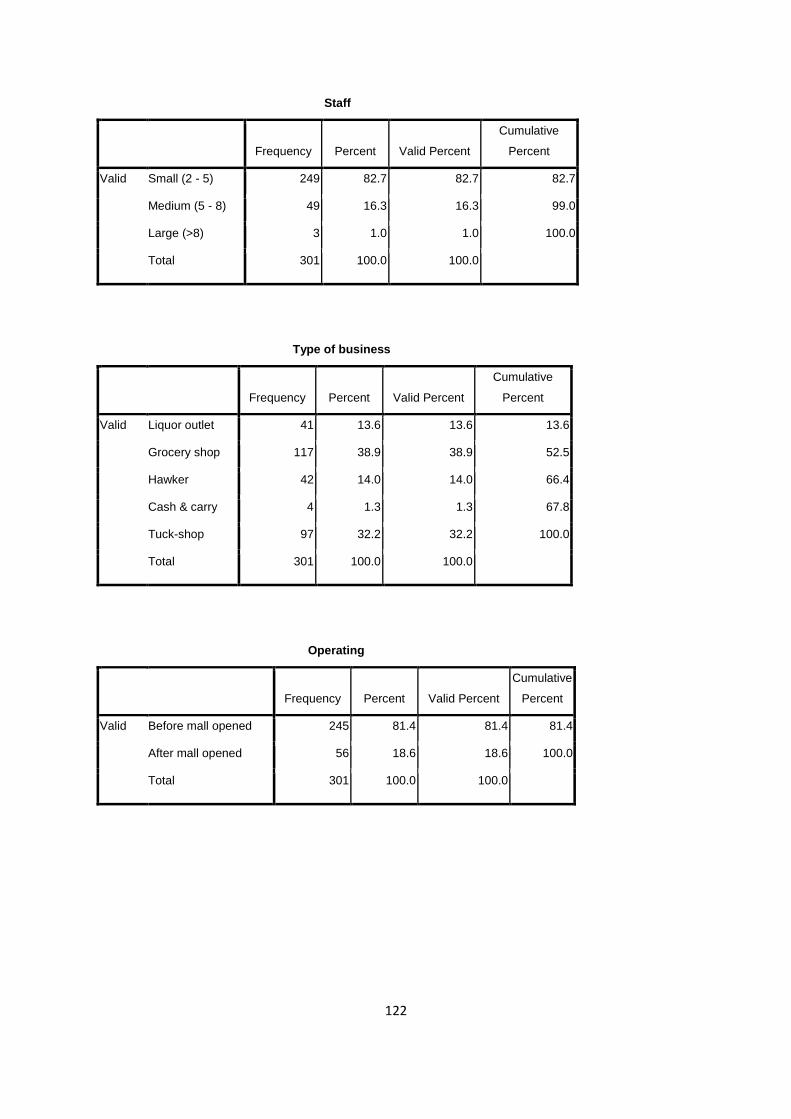
122
Staff
Frequency Percent Valid Percent
Cumulative
Percent
Valid Small (2 - 5) 249 82.7 82.7 82.7
Medium (5 - 8) 49 16.3 16.3 99.0
Large (>8) 3 1.0 1.0 100.0
Total 301 100.0 100.0
Type of business
Frequency Percent Valid Percent
Cumulative
Percent
Valid Liquor outlet 41 13.6 13.6 13.6
Grocery shop 117 38.9 38.9 52.5
Hawker 42 14.0 14.0 66.4
Cash & carry 4 1.3 1.3 67.8
Tuck-shop 97 32.2 32.2 100.0
Total 301 100.0 100.0
Operating
Frequency Percent Valid Percent
Cumulative
Percent
Valid Before mall opened 245 81.4 81.4 81.4
After mall opened 56 18.6 18.6 100.0
Total 301 100.0 100.0
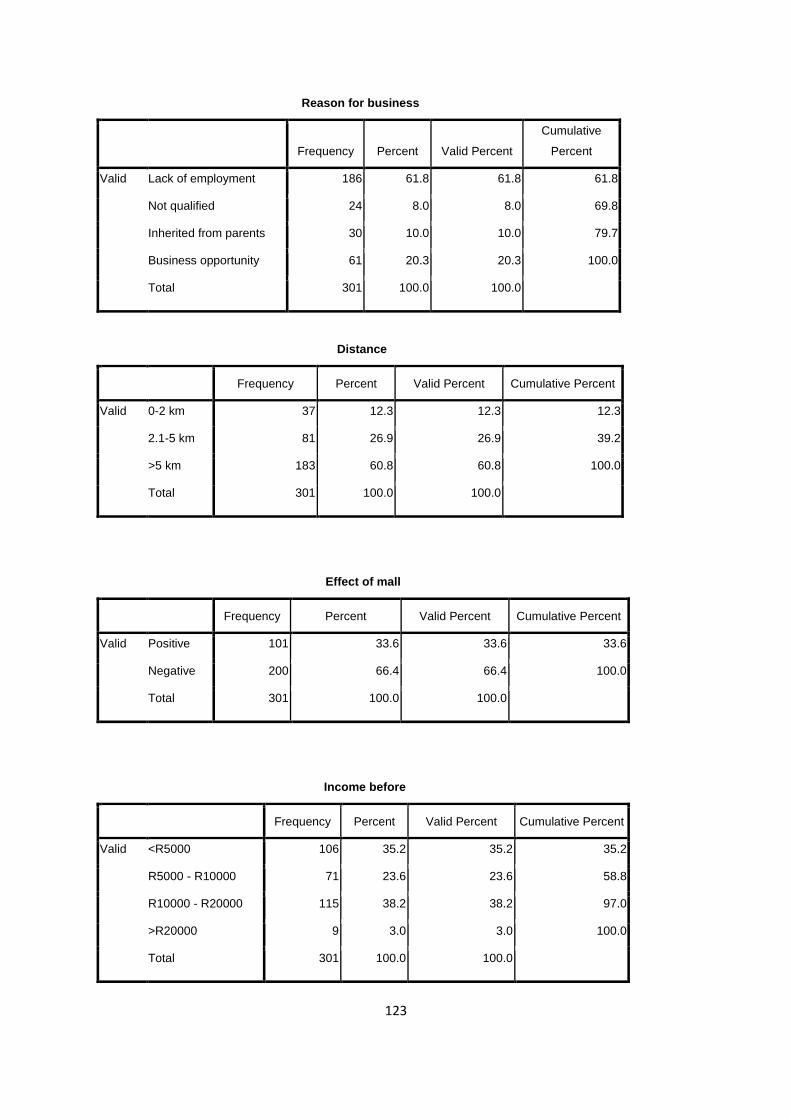
123
Reason for business
Frequency Percent Valid Percent
Cumulative
Percent
Valid Lack of employment 186 61.8 61.8 61.8
Not qualified 24 8.0 8.0 69.8
Inherited from parents 30 10.0 10.0 79.7
Business opportunity 61 20.3 20.3 100.0
Total 301 100.0 100.0
Distance
Frequency Percent Valid Percent Cumulative Percent
Valid 0-2 km 37 12.3 12.3 12.3
2.1-5 km 81 26.9 26.9 39.2
>5 km 183 60.8 60.8 100.0
Total 301 100.0 100.0
Effect of mall
Frequency Percent Valid Percent Cumulative Percent
Valid Positive 101 33.6 33.6 33.6
Negative 200 66.4 66.4 100.0
Total 301 100.0 100.0
Income before
Frequency Percent Valid Percent Cumulative Percent
Valid <R5000 106 35.2 35.2 35.2
R5000 - R10000 71 23.6 23.6 58.8
R10000 - R20000 115 38.2 38.2 97.0
>R20000 9 3.0 3.0 100.0
Total 301 100.0 100.0

124
Income after
Frequency Percent Valid Percent Cumulative Percent
Valid <R5000 80 26.6 26.6 26.6
R5000 - R10000 183 60.8 60.8 87.4
R10000 - R20000 35 11.6 11.6 99.0
>R20000 3 1.0 1.0 100.0
Total 301 100.0 100.0
Chi-Square Goodness-of-fit test
Staff
Observed N Expected N Residual
Small (2 - 5) 249 100.3 148.7
Medium (5 - 8) 49 100.3 -51.3
Large (>8) 3 100.3 -97.3
Total 301
Type of business
Observed N Expected N Residual
Liquor outlet 41 60.2 -19.2
Grocery shop 117 60.2 56.8
Hawker 42 60.2 -18.2
Cash & carry 4 60.2 -56.2
Tuck-shop 97 60.2 36.8
Total 301

125
Distance
Observed N Expected N Residual
0-2 km 37 100.3 -63.3
2.1-5 km 81 100.3 -19.3
>5 km 183 100.3 82.7
Total 301
Effect of mall
Observed N Expected N Residual
Positive 101 150.5 -49.5
Negative 200 150.5 49.5
Total 301
Operating
Observed N Expected N Residual
Before mall opened 245 150.5 94.5
After mall opened 56 150.5 -94.5
Total 301
Income before
Observed N Expected N Residual
<R5000 106 75.3 30.8
R5000 - R10000 71 75.3 -4.3
R10000 - R20000 115 75.3 39.8
>R20000 9 75.3 -66.3
Total 301
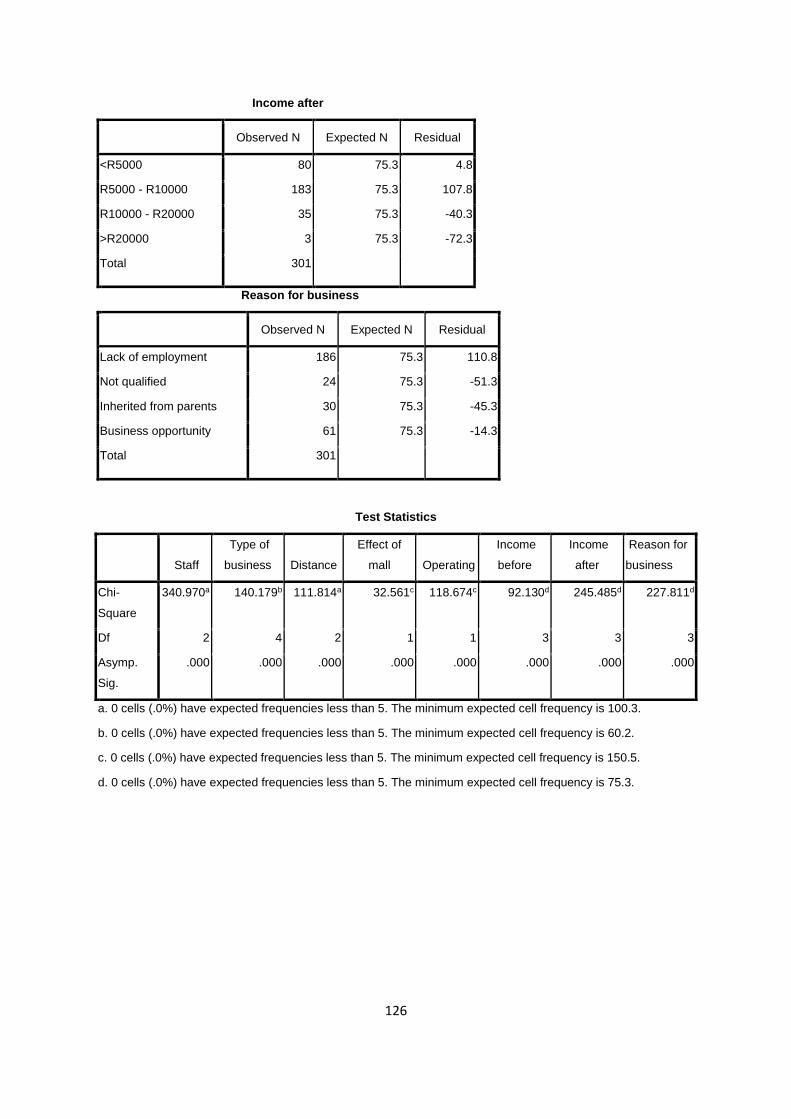
126
Income after
Observed N Expected N Residual
<R5000 80 75.3 4.8
R5000 - R10000 183 75.3 107.8
R10000 - R20000 35 75.3 -40.3
>R20000 3 75.3 -72.3
Total 301
Reason for business
Observed N Expected N Residual
Lack of employment 186 75.3 110.8
Not qualified 24 75.3 -51.3
Inherited from parents 30 75.3 -45.3
Business opportunity 61 75.3 -14.3
Total 301
Test Statistics
Staff
Type of
business Distance
Effect of
mall Operating
Income
before
Income
after
Reason for
business
Chi-
Square
340.970a 140.179b 111.814a 32.561c 118.674c 92.130d 245.485d 227.811d
Df 2 4 2 1 1 3 3 3
Asymp.
Sig.
.000 .000 .000 .000 .000 .000 .000 .000
a. 0 cells (.0%) have expected frequencies less than 5. The minimum expected cell frequency is 100.3.
b. 0 cells (.0%) have expected frequencies less than 5. The minimum expected cell frequency is 60.2.
c. 0 cells (.0%) have expected frequencies less than 5. The minimum expected cell frequency is 150.5.
d. 0 cells (.0%) have expected frequencies less than 5. The minimum expected cell frequency is 75.3.
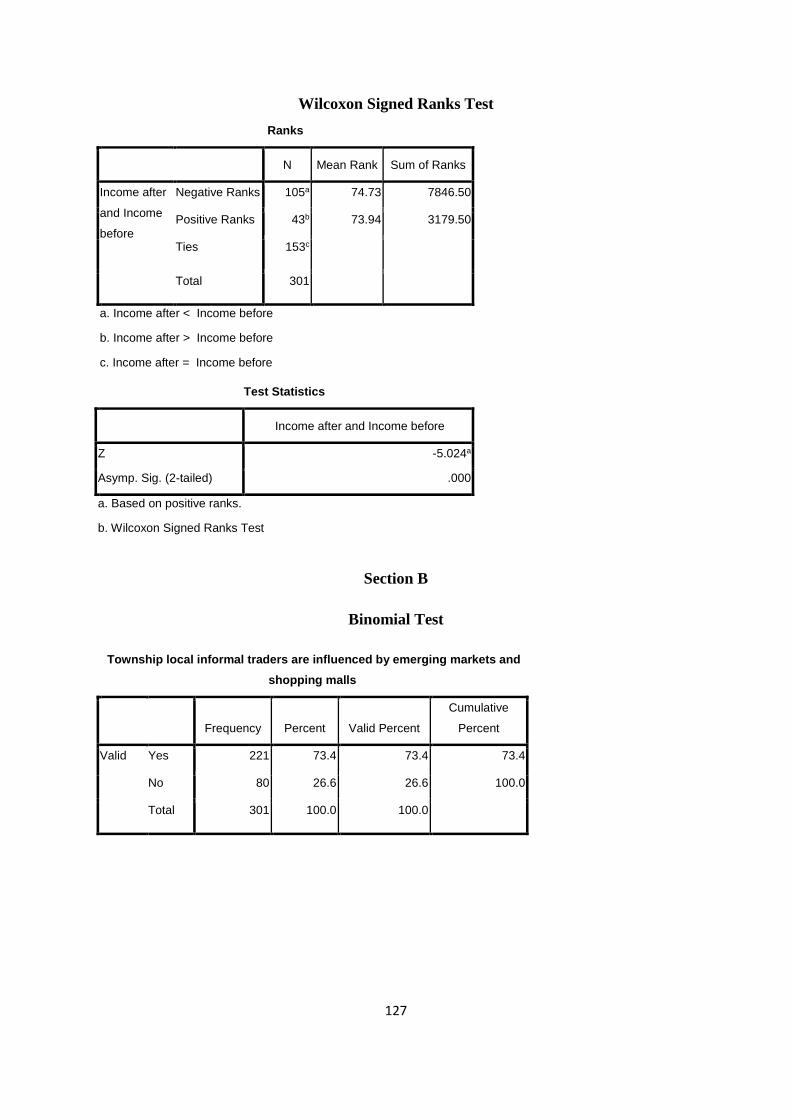
127
Wilcoxon Signed Ranks Test
Ranks
N Mean Rank Sum of Ranks
Income after
and Income
before
Negative Ranks 105a 74.73 7846.50
Positive Ranks 43b 73.94 3179.50
Ties 153c
Total 301
a. Income after < Income before
b. Income after > Income before
c. Income after = Income before
Section B
Binomial Test
Township local informal traders are influenced by emerging markets and
shopping malls
Frequency Percent Valid Percent
Cumulative
Percent
Valid Yes 221 73.4 73.4 73.4
No 80 26.6 26.6 100.0
Total 301 100.0 100.0
Test Statistics
Income after and Income before
Z -5.024a
Asymp. Sig. (2-tailed) .000
a. Based on positive ranks.
b. Wilcoxon Signed Ranks Test
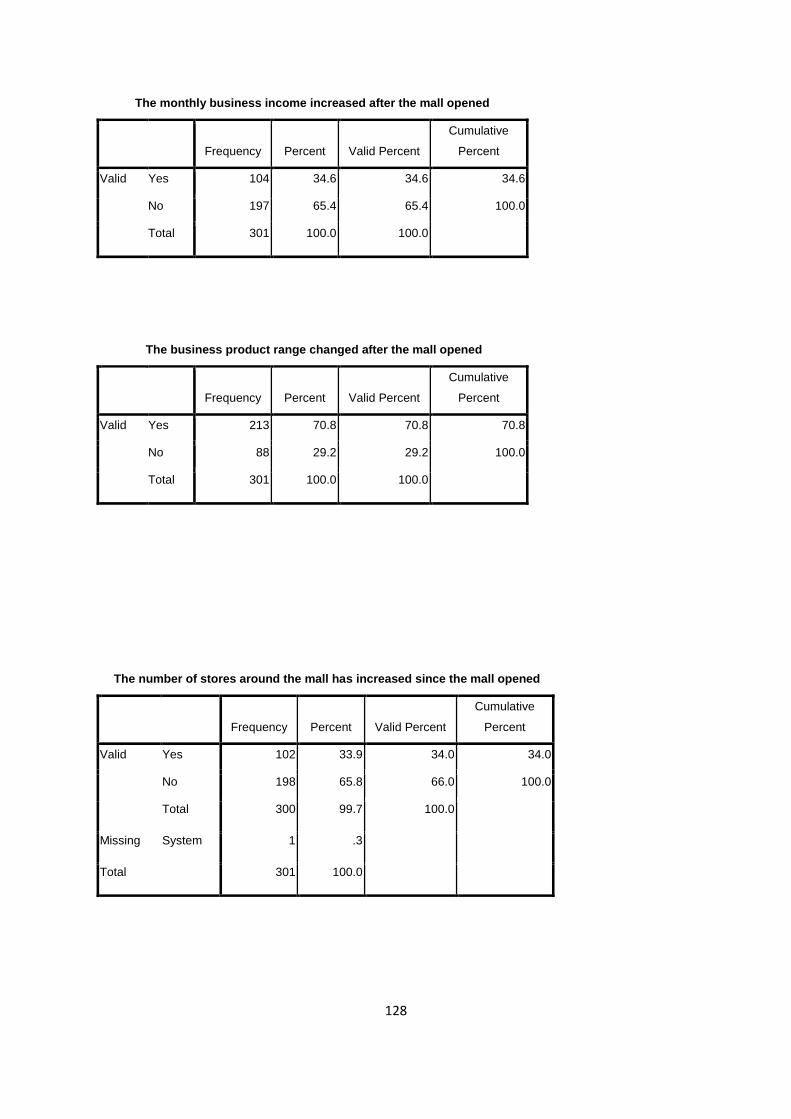
128
The monthly business income increased after the mall opened
Frequency Percent Valid Percent
Cumulative
Percent
Valid Yes 104 34.6 34.6 34.6
No 197 65.4 65.4 100.0
Total 301 100.0 100.0
The business product range changed after the mall opened
Frequency Percent Valid Percent
Cumulative
Percent
Valid Yes 213 70.8 70.8 70.8
No 88 29.2 29.2 100.0
Total 301 100.0 100.0
The number of stores around the mall has increased since the mall opened
Frequency Percent Valid Percent
Cumulative
Percent
Valid Yes 102 33.9 34.0 34.0
No 198 65.8 66.0 100.0
Total 300 99.7 100.0
Missing System 1 .3
Total 301 100.0
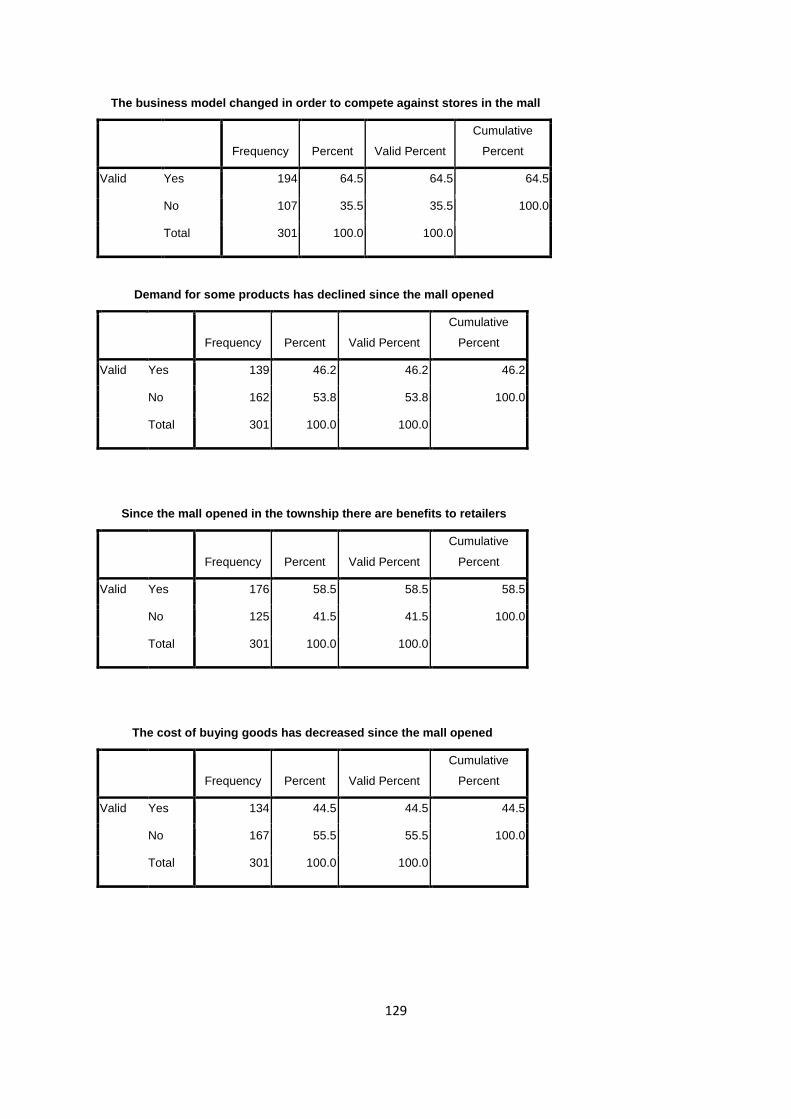
129
The business model changed in order to compete against stores in the mall
Frequency Percent Valid Percent
Cumulative
Percent
Valid Yes 194 64.5 64.5 64.5
No 107 35.5 35.5 100.0
Total 301 100.0 100.0
Demand for some products has declined since the mall opened
Frequency Percent Valid Percent
Cumulative
Percent
Valid Yes 139 46.2 46.2 46.2
No 162 53.8 53.8 100.0
Total 301 100.0 100.0
Since the mall opened in the township there are benefits to retailers
Frequency Percent Valid Percent
Cumulative
Percent
Valid Yes 176 58.5 58.5 58.5
No 125 41.5 41.5 100.0
Total 301 100.0 100.0
The cost of buying goods has decreased since the mall opened
Frequency Percent Valid Percent
Cumulative
Percent
Valid Yes 134 44.5 44.5 44.5
No 167 55.5 55.5 100.0
Total 301 100.0 100.0
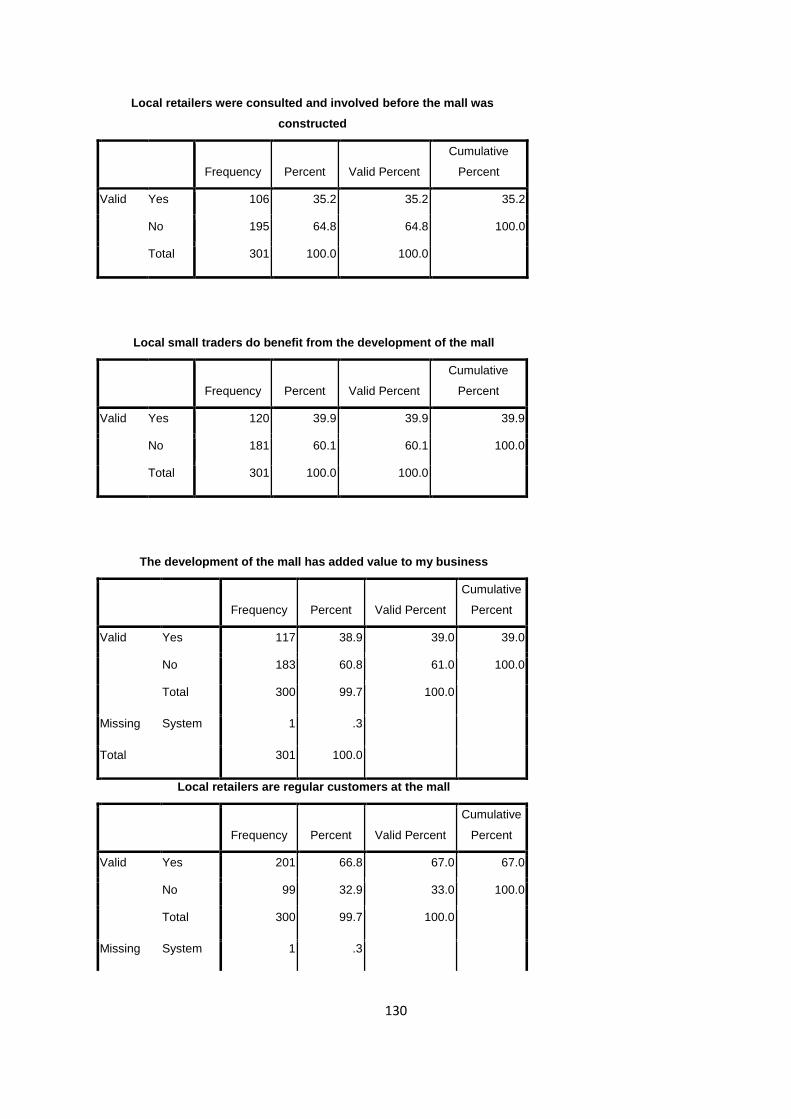
130
Local retailers were consulted and involved before the mall was
constructed
Frequency Percent Valid Percent
Cumulative
Percent
Valid Yes 106 35.2 35.2 35.2
No 195 64.8 64.8 100.0
Total 301 100.0 100.0
Local small traders do benefit from the development of the mall
Frequency Percent Valid Percent
Cumulative
Percent
Valid Yes 120 39.9 39.9 39.9
No 181 60.1 60.1 100.0
Total 301 100.0 100.0
The development of the mall has added value to my business
Frequency Percent Valid Percent
Cumulative
Percent
Valid Yes 117 38.9 39.0 39.0
No 183 60.8 61.0 100.0
Total 300 99.7 100.0
Missing System 1 .3
Total 301 100.0
Local retailers are regular customers at the mall
Frequency Percent Valid Percent
Cumulative
Percent
Valid Yes 201 66.8 67.0 67.0
No 99 32.9 33.0 100.0
Total 300 99.7 100.0
Missing System 1 .3

131
The development of the mall has added value to my business
Frequency Percent Valid Percent
Cumulative
Percent
Valid Yes 117 38.9 39.0 39.0
No 183 60.8 61.0 100.0
Total 300 99.7 100.0
Missing System 1 .3
Total 301 100.0
Some local traders stopped trading after the mall opened as they could not
survive the competition
Frequency Percent Valid Percent
Cumulative
Percent
Valid Yes 205 68.1 68.3 68.3
No 95 31.6 31.7 100.0
Total 300 99.7 100.0
Missing System 1 .3
Total 301 100.0
The nature of my business had to change after the mall opened
Frequency Percent Valid Percent
Cumulative
Percent
Valid Yes 133 44.2 44.2 44.2
No 168 55.8 55.8 100.0
Total 301 100.0 100.0

132
The mall had no effect on my business
Frequency Percent Valid Percent Cumulative Percent
Valid Yes 91 30.2 30.2 30.2
No 210 69.8 69.8 100.0
Total 301 100.0 100.0
Up to date financial records are kept for the business
Frequency Percent Valid Percent Cumulative Percent
Valid Yes 104 34.6 34.6 34.6
No 197 65.4 65.4 100.0
Total 301 100.0 100.0

133
Competition has increased since the mall opened
Frequency Percent Valid Percent Cumulative Percent
Valid Yes 114 37.9 37.9 37.9
No 187 62.1 62.1 100.0
Total 301 100.0 100.0
Local roads, water and electricity supply have improved since the development
of the mall
Frequency Percent Valid Percent Cumulative Percent
Valid Yes 92 30.6 30.6 30.6
No 209 69.4 69.4 100.0
Total 301 100.0 100.0
The investors and mall management team constantly engage local retailers in
order to support growth
Frequency Percent Valid Percent Cumulative Percent
Valid Yes 85 28.2 28.2 28.2
No 216 71.8 71.8 100.0
Total 301 100.0 100.0

134
Binomial Test Results
Category N Observed Prop. Test Prop.
Asymp. Sig. (2-
tailed)
Township local informal
traders are influenced by
emerging markets and
shopping malls
Group 1 Yes 221 .73 .50 .000a
Group 2 No 80 .27
Total 301 1.00
The monthly business
income increased after the
mall opened
Group 1 No 197 .65 .50 .000a
Group 2 Yes 104 .35
Total 301 1.00
The business product range
changed after the mall
opened
Group 1 Yes 213 .71 .50 .000a
Group 2 No 88 .29
Total 301 1.00
The number of stores around
the mall has increased since
the mall opened
Group 1 No 198 .66 .50 .000a
Group 2 Yes 102 .34
Total 300 1.00
The business model changed
in order to compete against
stores in the mall
Group 1 Yes 194 .64 .50 .000a
Group 2 No 107 .36
Total 301 1.00
Demand for some products
has declined since the mall
opened
Group 1 Yes 139 .46 .50 .205a
Group 2 No 162 .54
Total 301 1.00
Since the mall opened in the
township there have been
benefits to retailers
Group 1 No 125 .42 .50 .004a
Group 2 Yes 176 .58
Total 301 1.00
The cost of buying goods has
decreased since the mall
opened
Group 1 Yes 134 .45 .50 .065a
Group 2 No 167 .55
Total 301 1.00
Local retailers were
consulted and involved
before the mall was
constructed
Group 1 No 195 .65 .50 .000a
Group 2 Yes 106 .35
Total 301 1.00
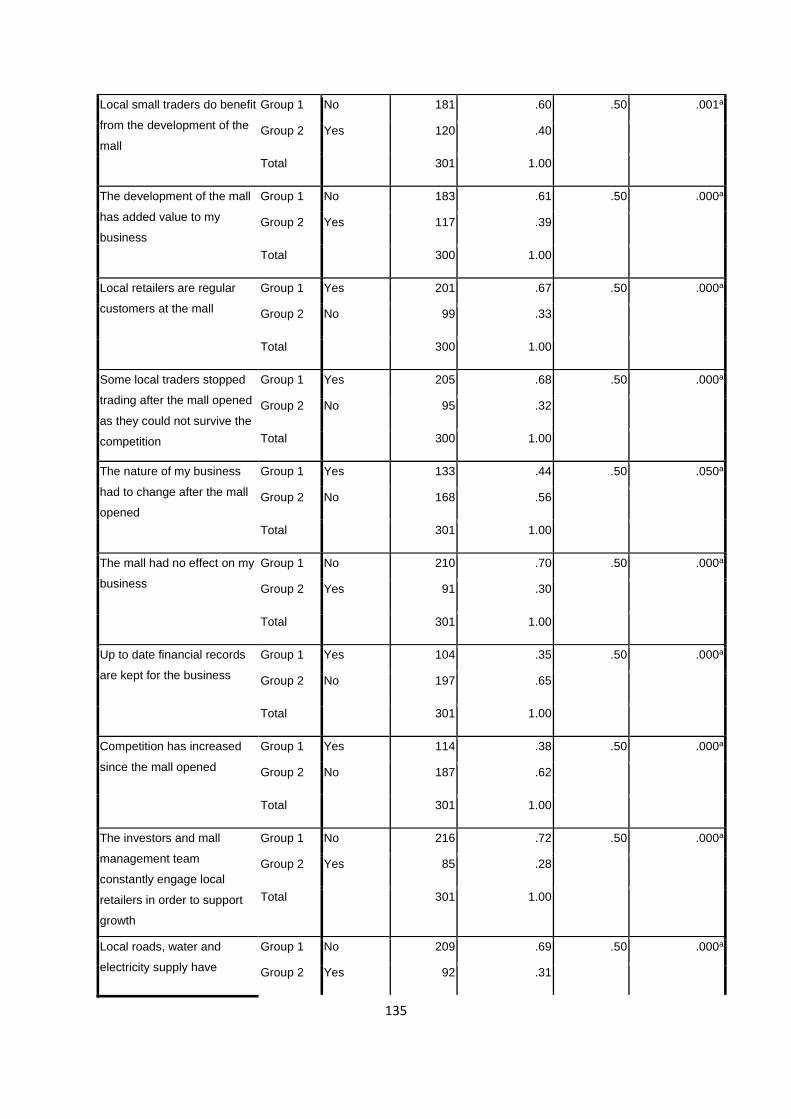
135
Local small traders do benefit
from the development of the
mall
Group 1 No 181 .60 .50 .001a
Group 2 Yes 120 .40
Total 301 1.00
The development of the mall
has added value to my
business
Group 1 No 183 .61 .50 .000a
Group 2 Yes 117 .39
Total 300 1.00
Local retailers are regular
customers at the mall
Group 1 Yes 201 .67 .50 .000a
Group 2 No 99 .33
Total 300 1.00
Some local traders stopped
trading after the mall opened
as they could not survive the
competition
Group 1 Yes 205 .68 .50 .000a
Group 2 No 95 .32
Total 300 1.00
The nature of my business
had to change after the mall
opened
Group 1 Yes 133 .44 .50 .050a
Group 2 No 168 .56
Total 301 1.00
The mall had no effect on my
business
Group 1 No 210 .70 .50 .000a
Group 2 Yes 91 .30
Total 301 1.00
Up to date financial records
are kept for the business
Group 1 Yes 104 .35 .50 .000a
Group 2 No 197 .65
Total 301 1.00
Competition has increased
since the mall opened
Group 1 Yes 114 .38 .50 .000a
Group 2 No 187 .62
Total 301 1.00
The investors and mall
management team
constantly engage local
retailers in order to support
growth
Group 1 No 216 .72 .50 .000a
Group 2 Yes 85 .28
Total
301 1.00
Local roads, water and
electricity supply have
Group 1 No 209 .69 .50 .000a
Group 2 Yes 92 .31

136
improved since the
development of the mall
Total
301 1.00
a. Based on Z Approximation.
Section C
Do you receive your products on delivery from the supplier?
Frequency Percent Valid Percent
Cumulative
Percent
Valid Yes 225 74.8 74.8 74.8
No 76 25.2 25.2 100.0
Total 301 100.0 100.0
Do you use your own transport to fetch goods for selling?
Frequency Percent Valid Percent
Cumulative
Percent
Valid Yes 234 77.7 77.7 77.7
No 67 22.3 22.3 100.0
Total 301 100.0 100.0
The cost of obtaining goods decreased since the mall opened
Frequency Percent Valid Percent
Cumulative
Percent
Valid Yes 220 73.1 73.1 73.1
No 81 26.9 26.9 100.0
Total 301 100.0 100.0

137
Do you receive goods for reselling from supplier representatives?
Frequency Percent Valid Percent
Cumulative
Percent
Valid Yes 222 73.8 73.8 73.8
No 79 26.2 26.2 100.0
Total 301 100.0 100.0
The cost price of goods is cheaper from the supplier than in a chain store
Frequency Percent Valid Percent
Cumulative
Percent
Valid Yes 127 42.2 42.3 42.3
No 173 57.5 57.7 100.0
Total 300 99.7 100.0
Missing System 1 .3
Total 301 100.0
Do you run out of stock since the mall opened?
Frequency Percent Valid Percent
Cumulative
Percent
Valid Yes 121 40.2 40.2 40.2
No 180 59.8 59.8 100.0
Total 301 100.0 100.0
Did you run out of stock before the mall opened?
Frequency Percent Valid Percent
Cumulative
Percent
Valid Yes 135 44.9 44.9 44.9
No 166 55.1 55.1 100.0
Total 301 100.0 100.0

138
Supplier interaction has improved since the mall opened
Frequency Percent Valid Percent
Cumulative
Percent
Valid Yes 91 30.2 30.2 30.2
No 210 69.8 69.8 100.0
Total 301 100.0 100.0
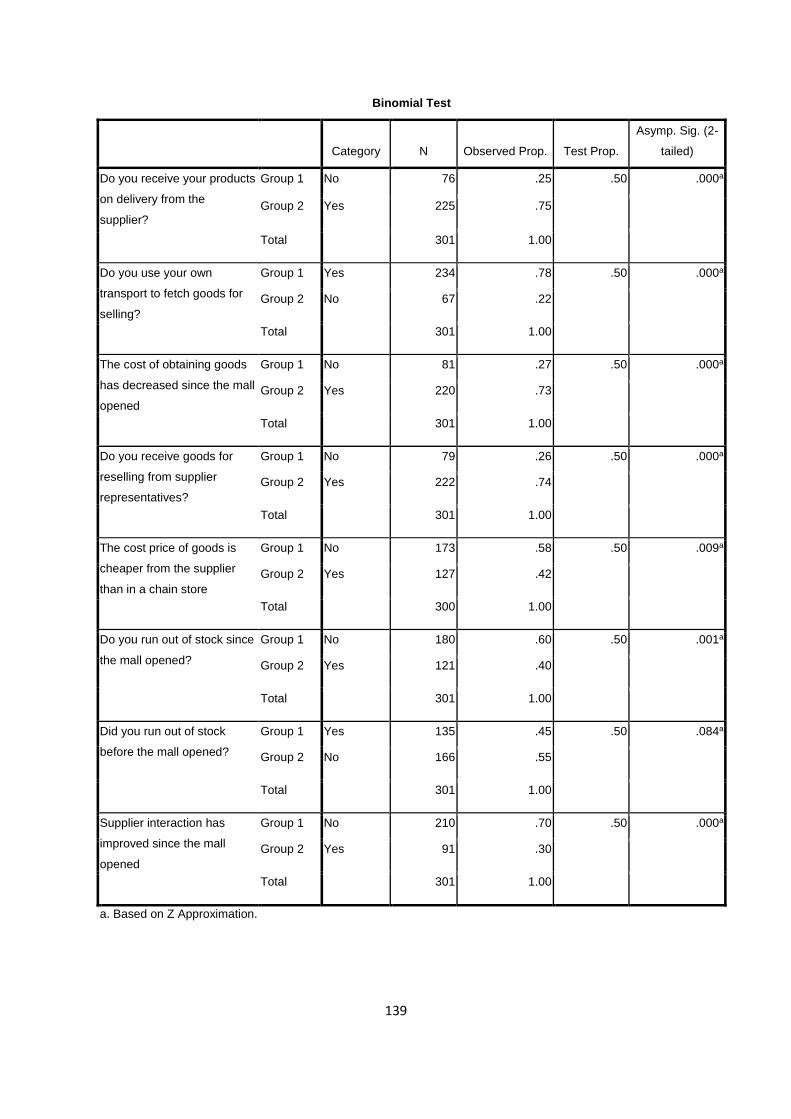
139
Binomial Test
Category N Observed Prop. Test Prop.
Asymp. Sig. (2-
tailed)
Do you receive your products
on delivery from the
supplier?
Group 1 No 76 .25 .50 .000a
Group 2 Yes 225 .75
Total 301 1.00
Do you use your own
transport to fetch goods for
selling?
Group 1 Yes 234 .78 .50 .000a
Group 2 No 67 .22
Total 301 1.00
The cost of obtaining goods
has decreased since the mall
opened
Group 1 No 81 .27 .50 .000a
Group 2 Yes 220 .73
Total 301 1.00
Do you receive goods for
reselling from supplier
representatives?
Group 1 No 79 .26 .50 .000a
Group 2 Yes 222 .74
Total 301 1.00
The cost price of goods is
cheaper from the supplier
than in a chain store
Group 1 No 173 .58 .50 .009a
Group 2 Yes 127 .42
Total 300 1.00
Do you run out of stock since
the mall opened?
Group 1 No 180 .60 .50 .001a
Group 2 Yes 121 .40
Total 301 1.00
Did you run out of stock
before the mall opened?
Group 1 Yes 135 .45 .50 .084a
Group 2 No 166 .55
Total 301 1.00
Supplier interaction has
improved since the mall
opened
Group 1 No 210 .70 .50 .000a
Group 2 Yes 91 .30
Total 301 1.00
a. Based on Z Approximation.
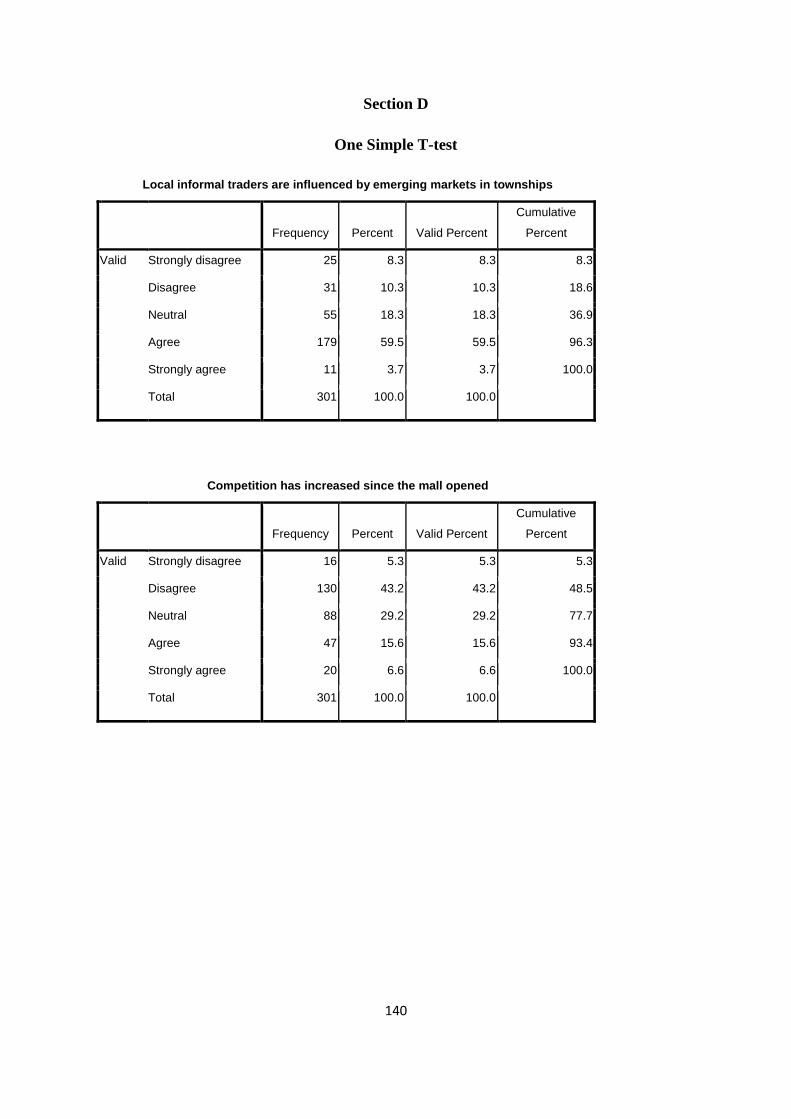
140
Section D
One Simple T-test
Local informal traders are influenced by emerging markets in townships
Frequency Percent Valid Percent
Cumulative
Percent
Valid Strongly disagree 25 8.3 8.3 8.3
Disagree 31 10.3 10.3 18.6
Neutral 55 18.3 18.3 36.9
Agree 179 59.5 59.5 96.3
Strongly agree 11 3.7 3.7 100.0
Total 301 100.0 100.0
Competition has increased since the mall opened
Frequency Percent Valid Percent
Cumulative
Percent
Valid Strongly disagree 16 5.3 5.3 5.3
Disagree 130 43.2 43.2 48.5
Neutral 88 29.2 29.2 77.7
Agree 47 15.6 15.6 93.4
Strongly agree 20 6.6 6.6 100.0
Total 301 100.0 100.0

141
Access to banking and financial institutions has improved since the mall opened
Frequency Percent Valid Percent
Cumulative
Percent
Valid Strongly disagree 62 20.6 20.6 20.6
Disagree 55 18.3 18.3 38.9
Neutral 67 22.3 22.3 61.1
Agree 96 31.9 31.9 93.0
Strongly agree 21 7.0 7.0 100.0
Total 301 100.0 100.0
Safety and security has increased since the mall opened
Frequency Percent Valid Percent
Cumulative
Percent
Valid Strongly disagree 80 26.6 26.6 26.6
Disagree 86 28.6 28.6 55.1
Neutral 76 25.2 25.2 80.4
Agree 50 16.6 16.6 97.0
Strongly agree 9 3.0 3.0 100.0
Total 301 100.0 100.0
Access to government and business development institutions has improved
Frequency Percent Valid Percent
Cumulative
Percent
Valid Strongly disagree 101 33.6 33.6 33.6
Disagree 65 21.6 21.6 55.1
Neutral 86 28.6 28.6 83.7
Agree 39 13.0 13.0 96.7
Strongly agree 10 3.3 3.3 100.0
Total 301 100.0 100.0
Visibility of my business has improved since the mall opened
Frequency Percent Valid Percent
Cumulative
Percent
Valid Strongly disagree 78 25.9 26.1 26.1
Disagree 72 23.9 24.1 50.2

142
Neutral 81 26.9 27.1 77.3
Agree 63 20.9 21.1 98.3
Strongly agree 5 1.7 1.7 100.0
Total 299 99.3 100.0
Missing System 2 .7
Total 301 100.0
Proximity to larger businesses has improved since the mall opened
Frequency Percent Valid Percent
Cumulative
Percent
Valid Strongly disagree 40 13.3 13.3 13.3
Disagree 113 37.5 37.5 50.8
Neutral 83 27.6 27.6 78.4
Agree 55 18.3 18.3 96.7
Strongly agree 10 3.3 3.3 100.0
Total 301 100.0 100.0
Proximity to public facilities and transport hubs has improved since the mall opened
Frequency Percent Valid Percent
Cumulative
Percent
Valid Strongly disagree 10 3.3 3.3 3.3
Disagree 25 8.3 8.3 11.6
Neutral 86 28.6 28.6 40.2
Agree 55 18.3 18.3 58.5
Strongly agree 125 41.5 41.5 100.0
Total 301 100.0 100.0
Foot traffic into my business has increased since the mall opened
Frequency Percent Valid Percent
Cumulative
Percent
Valid Strongly disagree 6 2.0 2.0 2.0
Disagree 27 9.0 9.0 11.0
Neutral 184 61.1 61.1 72.1
Agree 68 22.6 22.6 94.7
Strongly agree 16 5.3 5.3 100.0
Total 301 100.0 100.0
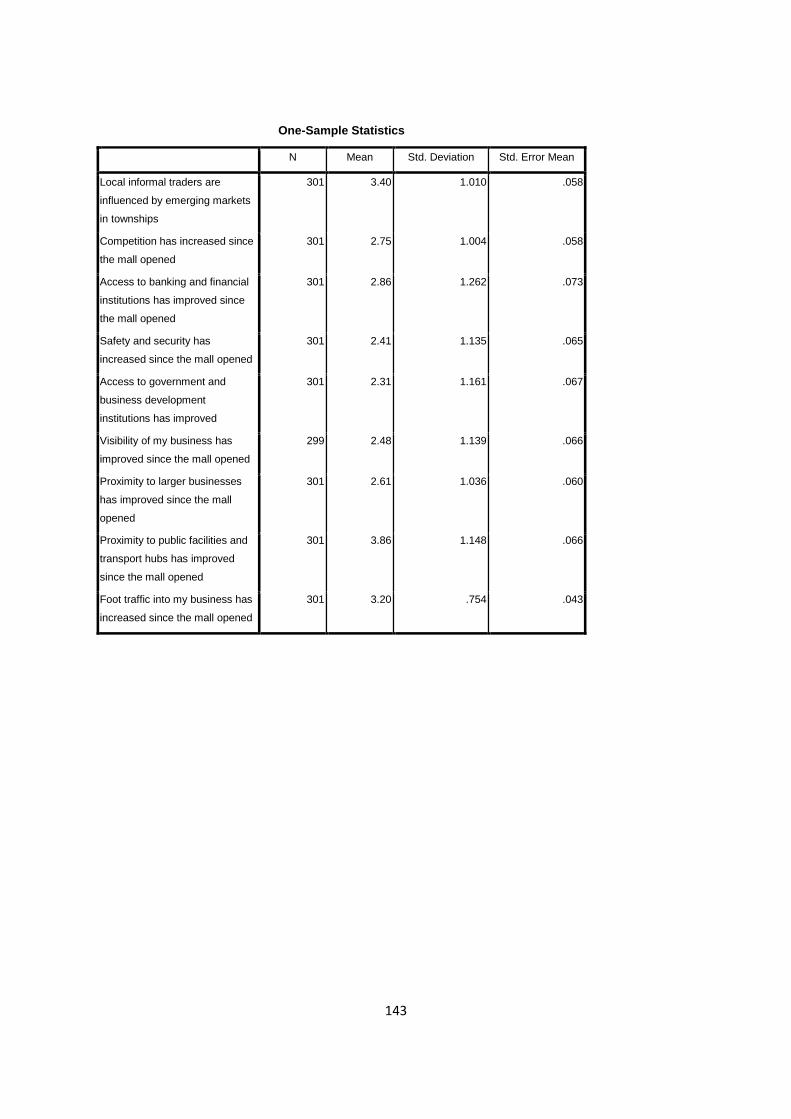
143
One-Sample Statistics
N Mean Std. Deviation Std. Error Mean
Local informal traders are
influenced by emerging markets
in townships
301 3.40 1.010 .058
Competition has increased since
the mall opened
301 2.75 1.004 .058
Access to banking and financial
institutions has improved since
the mall opened
301 2.86 1.262 .073
Safety and security has
increased since the mall opened
301 2.41 1.135 .065
Access to government and
business development
institutions has improved
301 2.31 1.161 .067
Visibility of my business has
improved since the mall opened
299 2.48 1.139 .066
Proximity to larger businesses
has improved since the mall
opened
301 2.61 1.036 .060
Proximity to public facilities and
transport hubs has improved
since the mall opened
301 3.86 1.148 .066
Foot traffic into my business has
increased since the mall opened
301 3.20 .754 .043
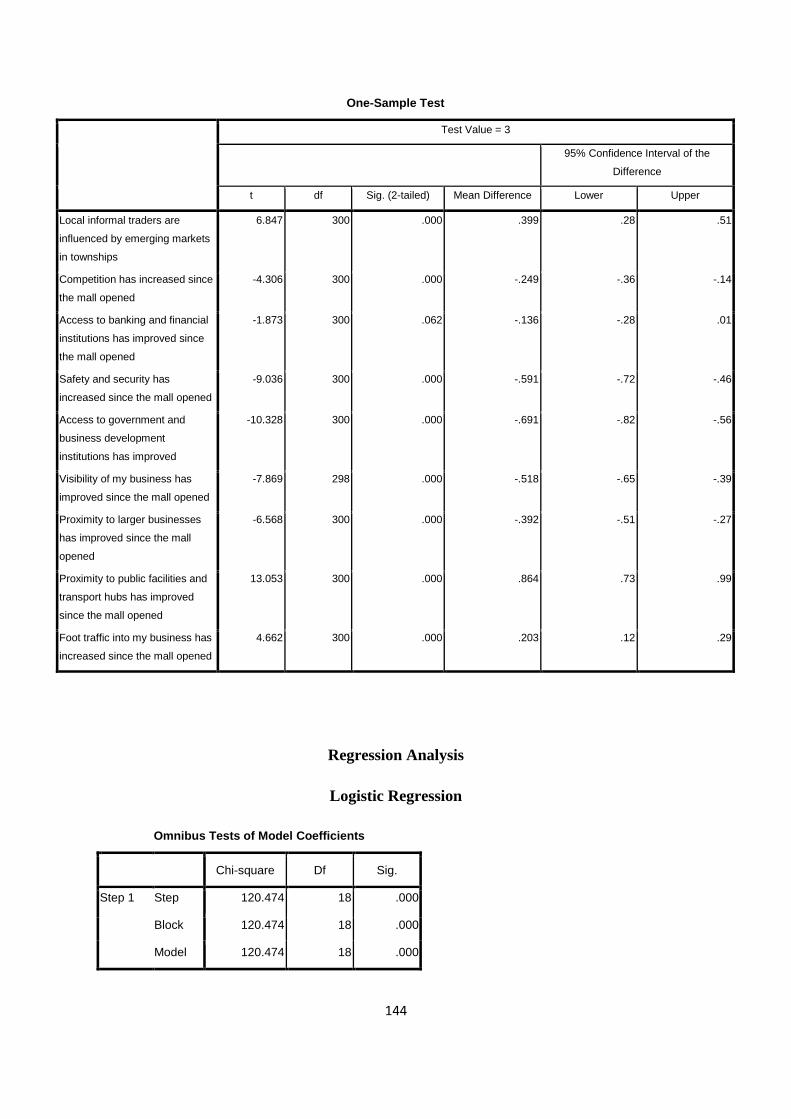
144
One-Sample Test
Test Value = 3
95% Confidence Interval of the
Difference
t df Sig. (2-tailed) Mean Difference Lower Upper
Local informal traders are
influenced by emerging markets
in townships
6.847 300 .000 .399 .28 .51
Competition has increased since
the mall opened
-4.306 300 .000 -.249 -.36 -.14
Access to banking and financial
institutions has improved since
the mall opened
-1.873 300 .062 -.136 -.28 .01
Safety and security has
increased since the mall opened
-9.036 300 .000 -.591 -.72 -.46
Access to government and
business development
institutions has improved
-10.328 300 .000 -.691 -.82 -.56
Visibility of my business has
improved since the mall opened
-7.869 298 .000 -.518 -.65 -.39
Proximity to larger businesses
has improved since the mall
opened
-6.568 300 .000 -.392 -.51 -.27
Proximity to public facilities and
transport hubs has improved
since the mall opened
13.053 300 .000 .864 .73 .99
Foot traffic into my business has
increased since the mall opened
4.662 300 .000 .203 .12 .29
Regression Analysis
Logistic Regression
Omnibus Tests of Model Coefficients
Chi-square Df Sig.
Step 1 Step 120.474 18 .000
Block 120.474 18 .000
Model 120.474 18 .000

145
Model Summary
Step -2 Log likelihood Cox & Snell R Square Nagelkerke R Square
1 235.009a .345 .484
a. Estimation terminated at iteration number 6 because parameter estimates changed by less
than .001.
Classification Tablea
Observed
Predicted
Effect of mall Percentage
Correct Positive Negative
Step 1 Effect of mall Positive 52 38 57.8
Negative 25 170 87.2
Overall Percentage 77.9
a. The cut value is .500
Model Summary
Step -2 Log likelihood Cox & Snell R Square Nagelkerke R Square
1 207.135a .339 .500
a. Estimation terminated at iteration number 6 because parameter estimates changed by less than .001.
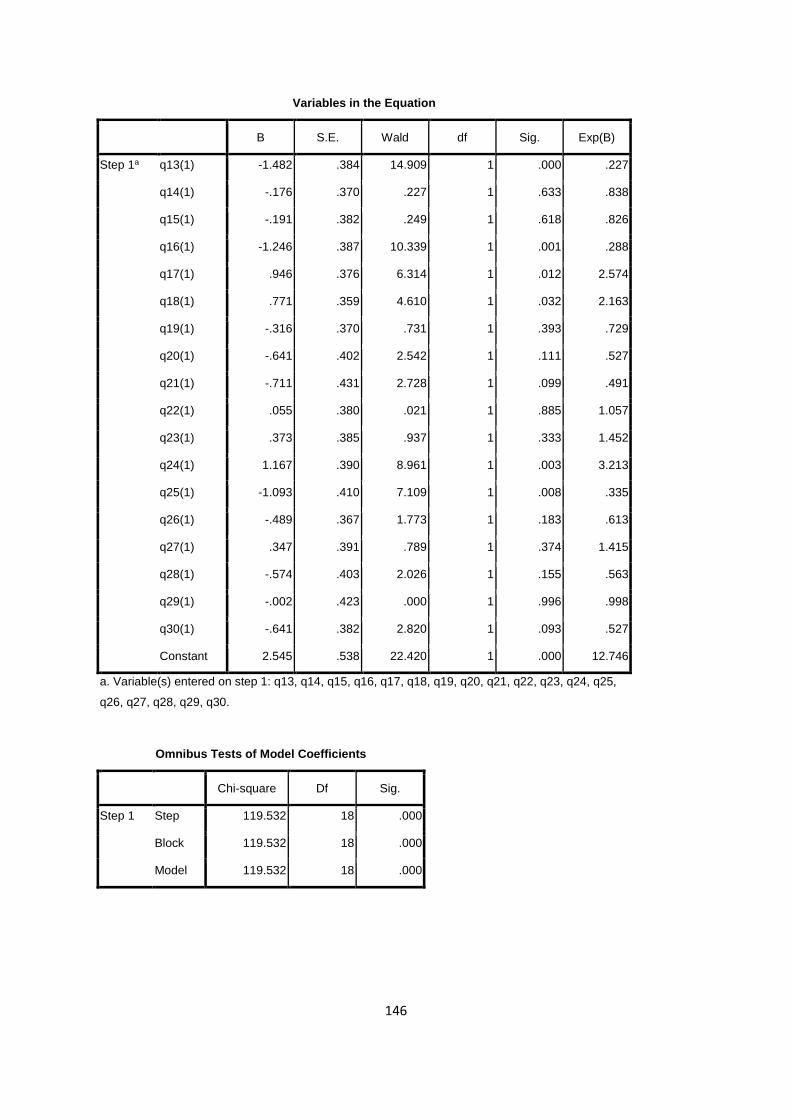
146
Variables in the Equation
B S.E. Wald df Sig. Exp(B)
Step 1a q13(1) -1.482 .384 14.909 1 .000 .227
q14(1) -.176 .370 .227 1 .633 .838
q15(1) -.191 .382 .249 1 .618 .826
q16(1) -1.246 .387 10.339 1 .001 .288
q17(1) .946 .376 6.314 1 .012 2.574
q18(1) .771 .359 4.610 1 .032 2.163
q19(1) -.316 .370 .731 1 .393 .729
q20(1) -.641 .402 2.542 1 .111 .527
q21(1) -.711 .431 2.728 1 .099 .491
q22(1) .055 .380 .021 1 .885 1.057
q23(1) .373 .385 .937 1 .333 1.452
q24(1) 1.167 .390 8.961 1 .003 3.213
q25(1) -1.093 .410 7.109 1 .008 .335
q26(1) -.489 .367 1.773 1 .183 .613
q27(1) .347 .391 .789 1 .374 1.415
q28(1) -.574 .403 2.026 1 .155 .563
q29(1) -.002 .423 .000 1 .996 .998
q30(1) -.641 .382 2.820 1 .093 .527
Constant 2.545 .538 22.420 1 .000 12.746
a. Variable(s) entered on step 1: q13, q14, q15, q16, q17, q18, q19, q20, q21, q22, q23, q24, q25,
q26, q27, q28, q29, q30.
Omnibus Tests of Model Coefficients
Chi-square Df Sig.
Step 1 Step 119.532 18 .000
Block 119.532 18 .000
Model 119.532 18 .000
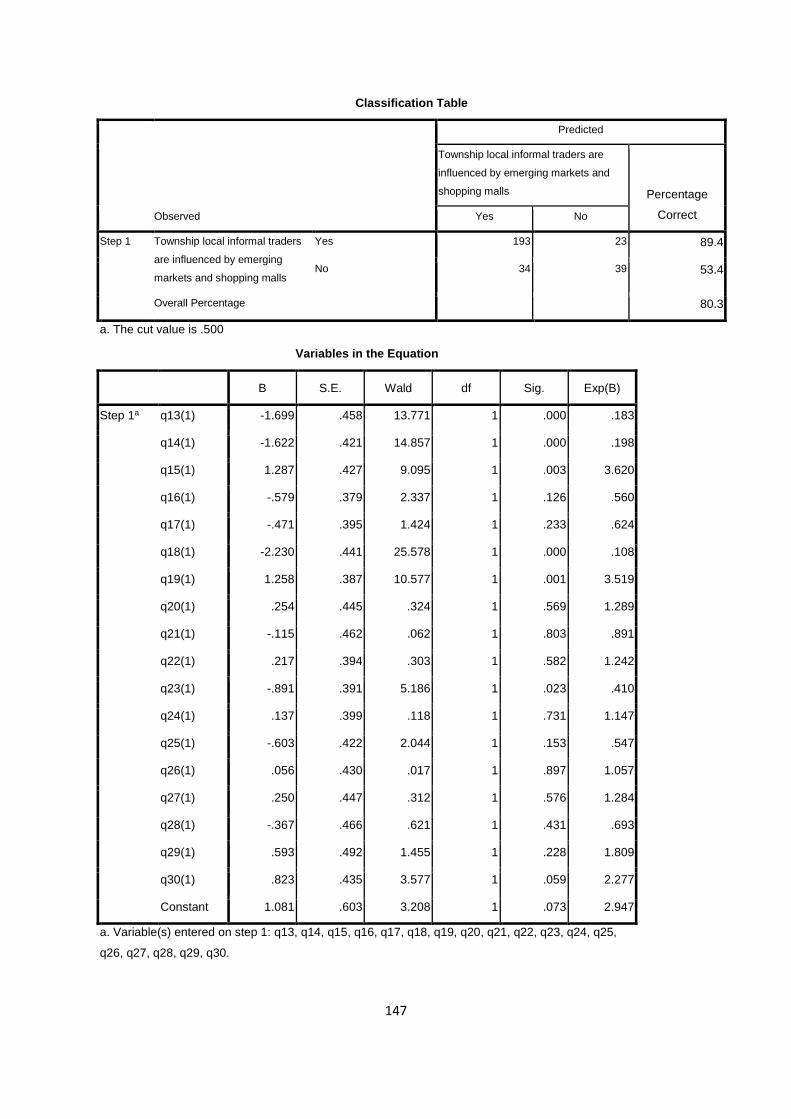
147
Classification Table
Observed
Predicted
Township local informal traders are
influenced by emerging markets and
shopping malls Percentage
Correct Yes No
Step 1 Township local informal traders
are influenced by emerging
markets and shopping malls
Yes 193 23 89.4
No 34 39 53.4
Overall Percentage 80.3
a. The cut value is .500
Variables in the Equation
B S.E. Wald df Sig. Exp(B)
Step 1a q13(1) -1.699 .458 13.771 1 .000 .183
q14(1) -1.622 .421 14.857 1 .000 .198
q15(1) 1.287 .427 9.095 1 .003 3.620
q16(1) -.579 .379 2.337 1 .126 .560
q17(1) -.471 .395 1.424 1 .233 .624
q18(1) -2.230 .441 25.578 1 .000 .108
q19(1) 1.258 .387 10.577 1 .001 3.519
q20(1) .254 .445 .324 1 .569 1.289
q21(1) -.115 .462 .062 1 .803 .891
q22(1) .217 .394 .303 1 .582 1.242
q23(1) -.891 .391 5.186 1 .023 .410
q24(1) .137 .399 .118 1 .731 1.147
q25(1) -.603 .422 2.044 1 .153 .547
q26(1) .056 .430 .017 1 .897 1.057
q27(1) .250 .447 .312 1 .576 1.284
q28(1) -.367 .466 .621 1 .431 .693
q29(1) .593 .492 1.455 1 .228 1.809
q30(1) .823 .435 3.577 1 .059 2.277
Constant 1.081 .603 3.208 1 .073 2.947
a. Variable(s) entered on step 1: q13, q14, q15, q16, q17, q18, q19, q20, q21, q22, q23, q24, q25,
q26, q27, q28, q29, q30.


![Dlamini v S (362/11) [2012] ZASCA 26 (27 March 2012)](https://img.pdfslide.us/doc/110x75/54405e78b1af9ff97a8b4721/dlamini-v-s-36211-2012-zasca-26-27-march-2012.jpg)