Embed Size (px)
Citation preview
June 2
014
SD
N 1
4/0
6
14/0
614/X
X
I M F S T A F F D I S C U S S I O N N O T E
EMERGING MARKETS IN TRANSITION:
GROWTH PROSPECTS AND CHALLENGES
Luis Cubeddu, Alex Culiuc, Ghada Fayad, Yuan Gao,
Kalpana Kochhar, Annette Kyobe, Ceyda Oner, Roberto Perrelli,
Sarah Sanya, Evridiki Tsounta, and Zhongxia Zhang
INTERNATIONAL MONETARY FUND
Strategy, Policy, and Review Department
EMERGING MARKETS IN TRANSITION:
GROWTH PROSPECTS AND CHALLENGES
Prepared by Luis Cubeddu, Alex Culiuc, Ghada Fayad, Yuan Gao, Kalpana Kochhar,
Annette Kyobe, Ceyda Oner, Roberto Perrelli, Sarah Sanya, Evridiki Tsounta, and Zhongxia Zhang
Authorized for distribution by Siddharth Tiwari
June 2014
JEL Classification Numbers: E32, F43, O11, O47
Keywords:
emerging markets, growth, potential growth,
convergence, heterogeneity, structural reform,
productivity
Contact Authors’ E-mail
Addresses: [email protected], [email protected]
DISCLAIMER: This Staff Discussion Note represents the views of the authors
and does not necessarily represent IMF views or IMF policy. The views
expressed herein should be attributed to the authors and not to the IMF, its
Executive Board, or its management. Staff Discussion Notes are published to
elicit comments and to further debate.
2 INTERNATIONAL MONETARY FUND
CONTENTS
Executive Summary ................................................................................................................................................................. 3
Why Was Emerging Market Growth High in the Last Decade? ............................................................................. 4
Why Are Emerging Markets Slowing Down? ................................................................................................................ 9
A. External and Domestic Demand Factors ............................................................................................................ 10
B. Cyclical and Structural Factors ................................................................................................................................ 11
Medium-Term Prospects for Emerging Markets ....................................................................................................... 12
Policy Priorities Going Forward ........................................................................................................................................ 15
A. Macroeconomic Policy Priorities ........................................................................................................................... 15
B. Rebalancing Growth ................................................................................................................................................... 16
C. Improving Growth Prospects through Structural Reforms ......................................................................... 17
Conclusion ................................................................................................................................................................................ 19
Annex 1. Organizing the Emerging Market Universe: The Role of External Linkages ................................. 21
Annex 2. Structural Reforms: Lessons from Four Case Studies ............................................................................ 24
Annex 3. Prospects for the “Next” Emerging Markets? ........................................................................................... 27
Analytical Appendix .............................................................................................................................................................. 29
A. Supply-Side Decomposition of Growth and Estimating Potential Growth………………………………...29
B. Impact of External Factors on Emerging Market Growth…………………………………………………………...30
C. Domestic and External Factors Explaining the Current Slowdown…………………………………………..…32
References ......................................................................................................................................................................... ....333

INTERNATIONAL MONETARY FUND 3
EXECUTIVE SUMMARY1
After decades of stalled and even regressed convergence, emerging markets (EMs) started closing
the income gap with advanced economies in the last decade. This “return to convergence” was
facilitated by supportive external conditions, improved policy frameworks, and growth-enhancing
reforms of the previous decade in many EMs. It was also a widespread phenomenon, with nearly half
of all EMs growing at higher rates in the 2000s compared to the 1990s.
However, EMs are now entering a period of slower growth. After swiftly rebounding from the global
financial crisis, their growth rates in the last few years have fallen not only below the post-crisis peak
of 2010-11, but also below the levels seen in the decade before the crisis. The external conditions
that supported their convergence over the last decade—namely, buoyant global trade, high
commodity prices, and easy financing conditions—are not expected to prevail in the coming years.
And more recently some large EMs have come under market pressure as their growth outlook
relative to advanced economies started to look less rosy, advanced economies began to normalize
their monetary policy, and external financial conditions started to tighten.
This Staff Discussion Note delves deeper into the factors behind EMs’ strong growth performance
over the last decade and the more recent slowdown to shed further light on their growth prospects.
It complements the analysis in the IMF’s April 2014 World Economic Outlook (and the forthcoming
Spillover Report), exploring the role of supply-side factors, external conditions, and macroeconomic
policies on growth for a larger sample of EMs. We find that higher growth rates during the 2000s
reflected increased productivity in most countries. On the demand side, a confluence of favorable
external conditions added to EM growth, though the effect of these conditions varied across EMs
depending on their external linkages and policies. To better understand these differences,
throughout our analysis we assess the role of (i) trade and financial openness; (ii) advanced markets
versus emerging markets as trading partners; and (iii) commodity dependence and changes in terms
of trade. Annex 1 attempts to organize the highly heterogeneous EM universe.
What do these findings tell us about the medium-term growth prospects for EMs? Since part of the
recent slowdown in EMs reflected cyclical factors, including weaker demand from trading partners,
we anticipate a recovery in EM growth as demand from advanced economies strengthens. Beyond
the cyclical recovery, attaining the high growth rates of the last decade over the medium term will
require concerted policy effort. Tighter external financing conditions are likely to increase
1 This paper was presented at the IMF/World Bank Annual Meetings Conference on October 8, 2013 entitled
“Emerging Markets: Where Are They, Where Are they Headed?” Under the guidance of Kalpana Kochhar, the paper
was prepared by a staff team led by Luis Cubeddu and Ceyda Oner and including Alex Culiuc, Ghada Fayad, Yuan
Gao, Annette Kyobe, Roberto Perrelli, Sarah Sanya, Evridiki Tsounta, and Zhongxia Zhang. The paper has benefited
from comments by the conference participants, in particular, Tim Adams, Anders Åslund, Luis Miguel Castilla, Ricardo
Hausmann, Sri Mulyani Indrawati, David Lipton, Manuel Ramos-Francia, and Nouriel Roubini.
EMERGING MARKETS IN TRANSITION
4 INTERNATIONAL MONETARY FUND
-6
-4
-2
0
2
4
6
8
10
1960 1965 1970 1975 1980 1985 1990 1995 2000 2005 2010
Perc
ent
Figure 1. Real GDP Growth 1/
AMs EMs
Source: WEO and IMF staff calculations.
1/ Dash lines represent decade average growth.
62-66
67-71
72-76
77-8182-86
87-91
92-96
97-01
02-0607-11
0
1
2
3
4
5
6
7
15% 20% 25%
Figure 2. EM Convergence
Source: Penn Table 7.1, WEO and IMF staff calculations
GD
P p
er
cap
ita g
row
th
(weig
hte
d a
vera
ge)
EM GDP Per Capita Relative to the U.S. (PPP, 5Y avg)
investment costs and debt service burdens, and less supportive commodity prices may dampen
investment in commodity-exporting EMs. Supply-side constraints and weaker employment
expansion could hold back growth where binding. Finally, in countries where external and financial
imbalances were allowed to build, growth in the coming years will slow as economies address risks
to their balance sheets.
How should policies respond to this prognosis? With the prospect of a less-supportive external
environment, EMs’ growth engines of the last decade will need to be reoriented to sustainable
domestic sources and revitalized through structural policies to improve factor allocation and boost
productivity. And while policies should be tailored to country-specific circumstances, we highlight
the general contours of macroeconomic and structural policies necessary to mitigate the effects of
changing external conditions so that EMs can sustain or restore growth.
WHY WAS EMERGING MARKET GROWTH HIGH IN
THE LAST DECADE?
The last decade provided strong external tailwinds that, when combined with broadly improved
fundamentals, helped EMs grow robustly. The surge in productivity enabled EMs to restart closing the
income gap relative to advanced economies. However, the overall strong EM performance masks
important heterogeneity across countries, reflecting differences in external linkages and also policies.
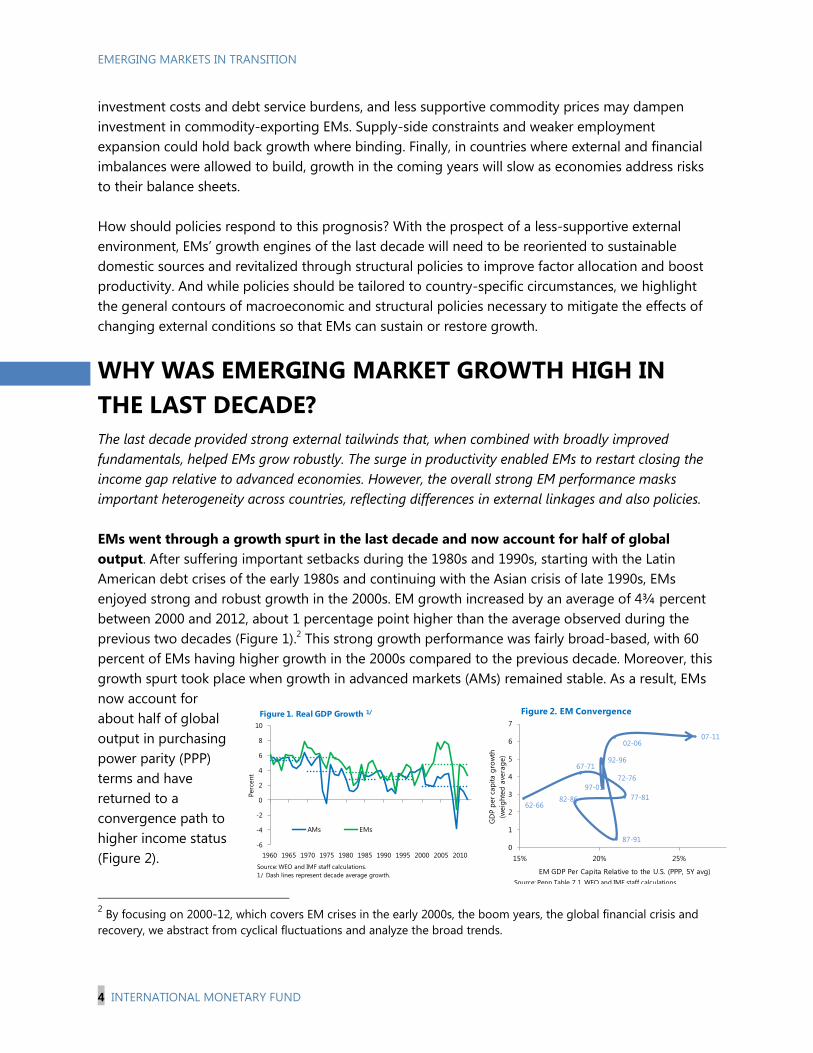
EMs went through a growth spurt in the last decade and now account for half of global
output. After suffering important setbacks during the 1980s and 1990s, starting with the Latin
American debt crises of the early 1980s and continuing with the Asian crisis of late 1990s, EMs
enjoyed strong and robust growth in the 2000s. EM growth increased by an average of 4¾ percent
between 2000 and 2012, about 1 percentage point higher than the average observed during the
previous two decades (Figure 1).2 This strong growth performance was fairly broad-based, with 60
percent of EMs having higher growth in the 2000s compared to the previous decade. Moreover, this
growth spurt took place when growth in advanced markets (AMs) remained stable. As a result, EMs
now account for
about half of global
output in purchasing
power parity (PPP)
terms and have
returned to a
convergence path to
higher income status
(Figure 2).
2 By focusing on 2000-12, which covers EM crises in the early 2000s, the boom years, the global financial crisis and
recovery, we abstract from cyclical fluctuations and analyze the broad trends.
INTERNATIONAL MONETARY FUND 5
0
100
200
300
400
500
600
700
800
2000 2012
EMBI Spreads
(Basis points)
0
1
2
3
4
5
6
2000 2012
FX Regime: average degree of
exchange rate flexibility 1/
32
34
36
38
40
42
44
46
2000 2012
External Debt
(In percent of GDP)
Figure 4: EM Fundamentals
Source: AREAER database, Bloomberg, WEO and IMF staff calculations.
1/ FX regime index is from 1 to 10. No separate legal tender=1, Free floating=10 .
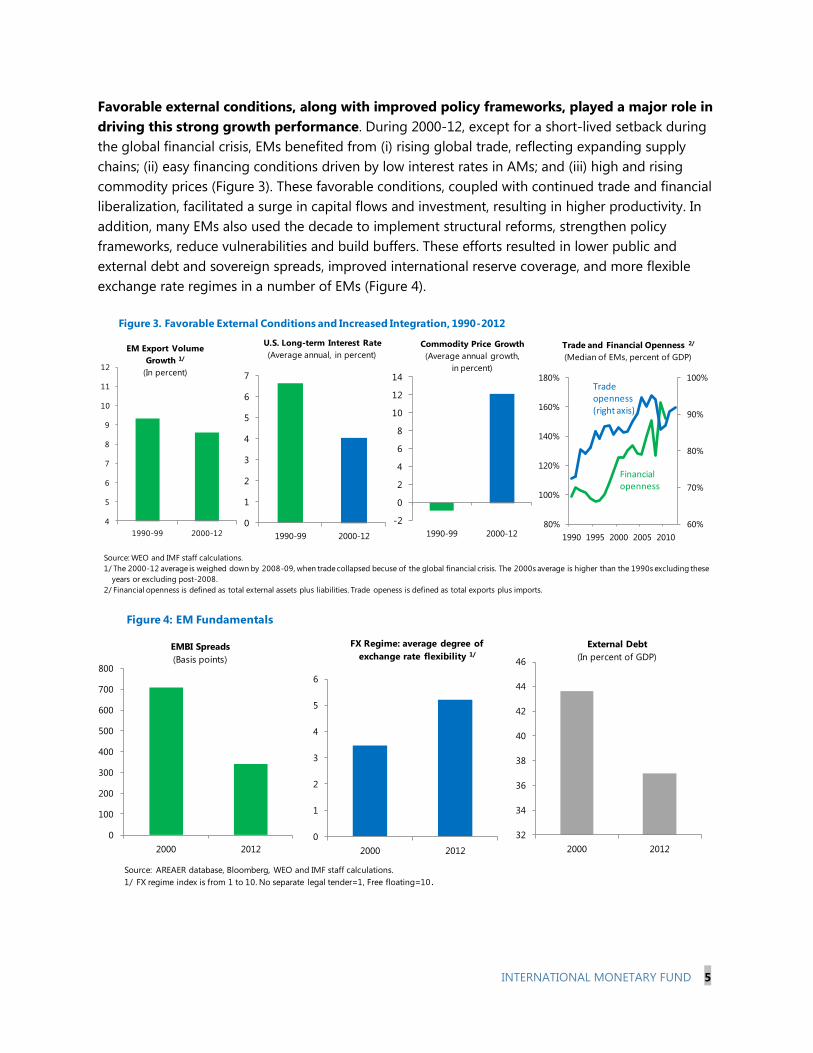
Favorable external conditions, along with improved policy frameworks, played a major role in
driving this strong growth performance. During 2000-12, except for a short-lived setback during
the global financial crisis, EMs benefited from (i) rising global trade, reflecting expanding supply
chains; (ii) easy financing conditions driven by low interest rates in AMs; and (iii) high and rising
commodity prices (Figure 3). These favorable conditions, coupled with continued trade and financial
liberalization, facilitated a surge in capital flows and investment, resulting in higher productivity. In
addition, many EMs also used the decade to implement structural reforms, strengthen policy
frameworks, reduce vulnerabilities and build buffers. These efforts resulted in lower public and
external debt and sovereign spreads, improved international reserve coverage, and more flexible
exchange rate regimes in a number of EMs (Figure 4).
-2
0
2
4
6
8
10
12
14
1990-99 2000-12
Commodity Price Growth
(Average annual growth,
in percent)
0
1
2
3
4
5
6
7
1990-99 2000-12
U.S. Long-term Interest Rate
(Average annual, in percent)
60%
70%
80%
90%
100%
80%
100%
120%
140%
160%
180%
1990 1995 2000 2005 2010
Trade and Financial Openness 2/
(Median of EMs, percent of GDP)
Figure 3. Favorable External Conditions and Increased Integration, 1990-2012
Source: WEO and IMF staff calculations.
1/ The 2000-12 average is weighed down by 2008-09, when trade collapsed becuse of the global financial crisis. The 2000s average is higher than the 1990s excluding these
years or excluding post-2008.
2/ Financial openness is defined as total external assets plus liabilities. Trade openess is defined as total exports plus imports.
Financial openness
Tradeopenness(right axis)
4
5
6
7
8
9
10
11
12
1990-99 2000-12
EM Export Volume
Growth 1/
(In percent)
EMERGING MARKETS IN TRANSITION
6 INTERNATIONAL MONETARY FUND
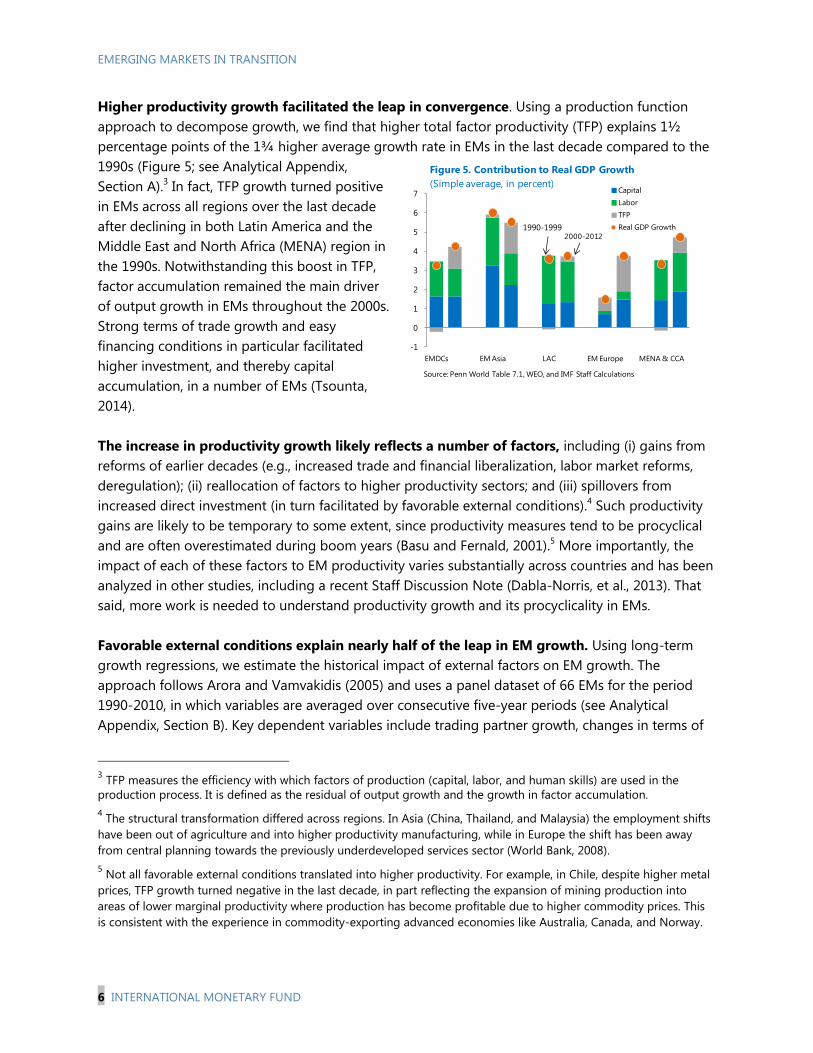
Higher productivity growth facilitated the leap in convergence. Using a production function
approach to decompose growth, we find that higher total factor productivity (TFP) explains 1½
percentage points of the 1¾ higher average growth rate in EMs in the last decade compared to the
1990s (Figure 5; see Analytical Appendix,
Section A).3 In fact, TFP growth turned positive
in EMs across all regions over the last decade
after declining in both Latin America and the
Middle East and North Africa (MENA) region in
the 1990s. Notwithstanding this boost in TFP,
factor accumulation remained the main driver
of output growth in EMs throughout the 2000s.
Strong terms of trade growth and easy
financing conditions in particular facilitated
higher investment, and thereby capital
accumulation, in a number of EMs (Tsounta,
2014).
The increase in productivity growth likely reflects a number of factors, including (i) gains from
reforms of earlier decades (e.g., increased trade and financial liberalization, labor market reforms,
deregulation); (ii) reallocation of factors to higher productivity sectors; and (iii) spillovers from
increased direct investment (in turn facilitated by favorable external conditions).4 Such productivity
gains are likely to be temporary to some extent, since productivity measures tend to be procyclical
and are often overestimated during boom years (Basu and Fernald, 2001).5 More importantly, the
impact of each of these factors to EM productivity varies substantially across countries and has been
analyzed in other studies, including a recent Staff Discussion Note (Dabla-Norris, et al., 2013). That
said, more work is needed to understand productivity growth and its procyclicality in EMs.
Favorable external conditions explain nearly half of the leap in EM growth. Using long-term
growth regressions, we estimate the historical impact of external factors on EM growth. The
approach follows Arora and Vamvakidis (2005) and uses a panel dataset of 66 EMs for the period
1990-2010, in which variables are averaged over consecutive five-year periods (see Analytical
Appendix, Section B). Key dependent variables include trading partner growth, changes in terms of
3 TFP measures the efficiency with which factors of production (capital, labor, and human skills) are used in the
production process. It is defined as the residual of output growth and the growth in factor accumulation.
4 The structural transformation differed across regions. In Asia (China, Thailand, and Malaysia) the employment shifts
have been out of agriculture and into higher productivity manufacturing, while in Europe the shift has been away
from central planning towards the previously underdeveloped services sector (World Bank, 2008).
5 Not all favorable external conditions translated into higher productivity. For example, in Chile, despite higher metal
prices, TFP growth turned negative in the last decade, in part reflecting the expansion of mining production into
areas of lower marginal productivity where production has become profitable due to higher commodity prices. This
is consistent with the experience in commodity-exporting advanced economies like Australia, Canada, and Norway.
-1
0
1
2
3
4
5
6
7
EMDCs EM Asia LAC EM Europe MENA & CCA
Figure 5. Contribution to Real GDP Growth
(Simple average, in percent)Capital
Labor
TFP
Real GDP Growth1990-1999 2000-2012
Source: Penn World Table 7.1, WEO, and IMF Staff Calculations
INTERNATIONAL MONETARY FUND 7
trade and in long-term U.S. interest rates, country-specific fundamentals like the degree of
commodity dependence, trade and financial openness, and public and external balance sheets.
Focusing on five-year averages allows us to analyze longer-term relations and avoid endogeneity
issues.6 Broadly speaking, we find that external demand (facilitated by rising liberalization), lower
global interest rates, and higher commodity prices accounted for about half of the increase in
growth across EMs in the 2000s relative to the 1990s. We differentiate our results by economic
fundamentals below.
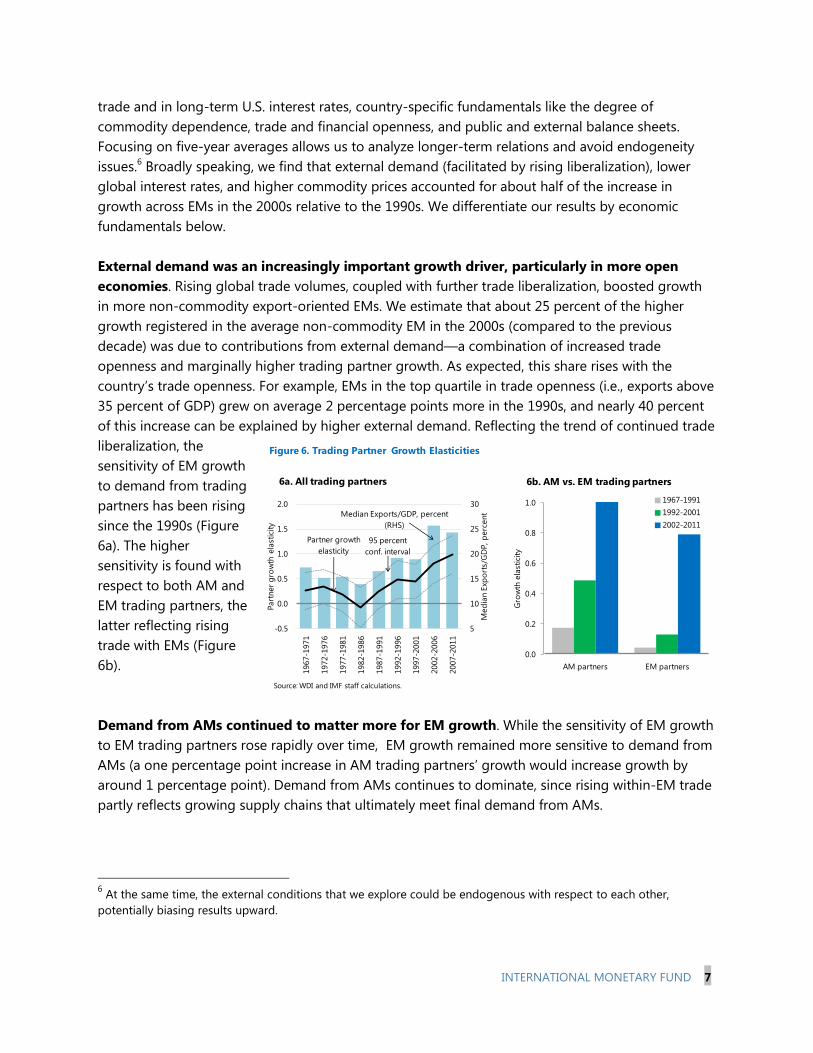
External demand was an increasingly important growth driver, particularly in more open
economies. Rising global trade volumes, coupled with further trade liberalization, boosted growth
in more non-commodity export-oriented EMs. We estimate that about 25 percent of the higher
growth registered in the average non-commodity EM in the 2000s (compared to the previous
decade) was due to contributions from external demand—a combination of increased trade
openness and marginally higher trading partner growth. As expected, this share rises with the
country’s trade openness. For example, EMs in the top quartile in trade openness (i.e., exports above
35 percent of GDP) grew on average 2 percentage points more in the 1990s, and nearly 40 percent
of this increase can be explained by higher external demand. Reflecting the trend of continued trade
liberalization, the
sensitivity of EM growth
to demand from trading
partners has been rising
since the 1990s (Figure
6a). The higher
sensitivity is found with
respect to both AM and
EM trading partners, the
latter reflecting rising
trade with EMs (Figure
6b).
Demand from AMs continued to matter more for EM growth. While the sensitivity of EM growth
to EM trading partners rose rapidly over time, EM growth remained more sensitive to demand from
AMs (a one percentage point increase in AM trading partners’ growth would increase growth by
around 1 percentage point). Demand from AMs continues to dominate, since rising within-EM trade
partly reflects growing supply chains that ultimately meet final demand from AMs.
6 At the same time, the external conditions that we explore could be endogenous with respect to each other,
potentially biasing results upward.
0.0
0.2
0.4
0.6
0.8
1.0
AM partners EM partners
Gro
wth
ela
stic
ity
1967-1991
1992-2001
2002-2011
6b. AM vs. EM trading partners
5
10
15
20
25
30
-0.5
0.0
0.5
1.0
1.5
2.0
1967-1
971
1972-1
976
1977-1
981
1982-1
986
1987-1
991
1992-1
996
1997-2
001
2002-2
006
2007-2
011
Med
ian E
xpo
rts/
GD
P, p
erc
ent
Part
ner
gro
wth
ela
stic
ity
Median Exports/GDP, percent
(RHS)
Partner growth
elasticity
95 percent
conf. interval
6a. All trading partners
Source: WDI and IMF staff calculations.
Figure 6. Trading Partner Growth Elasticities
EMERGING MARKETS IN TRANSITION
8 INTERNATIONAL MONETARY FUND
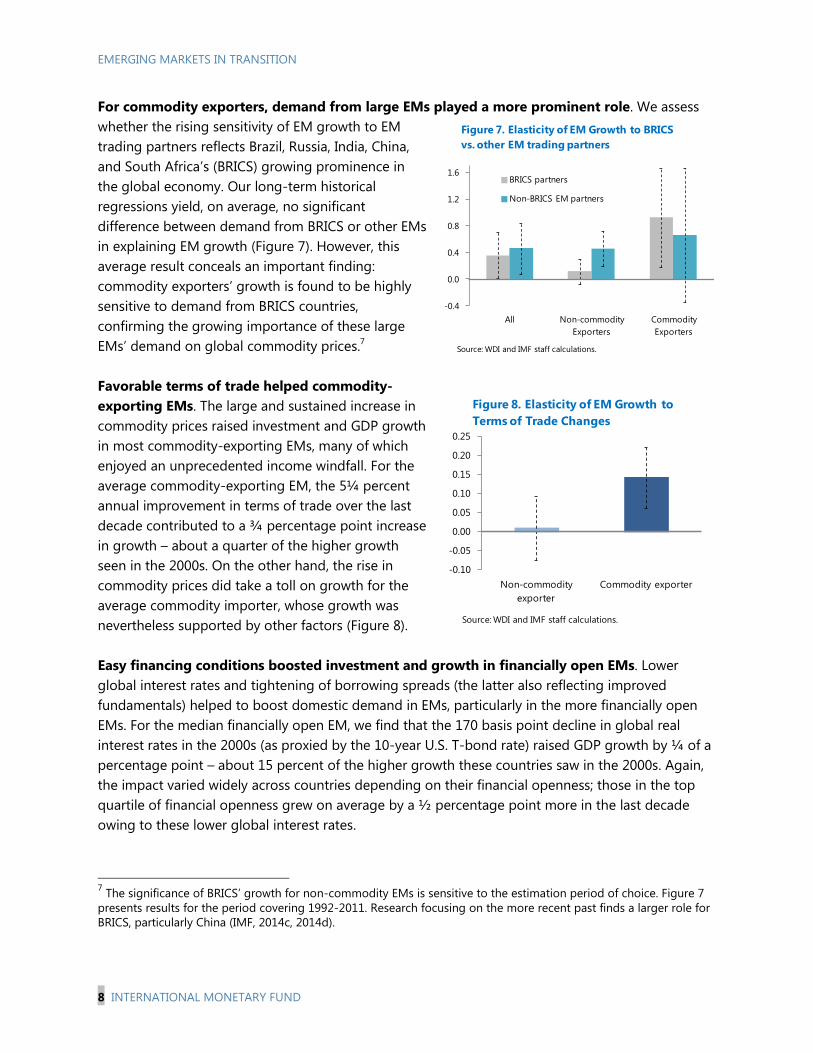
For commodity exporters, demand from large EMs played a more prominent role. We assess
whether the rising sensitivity of EM growth to EM
trading partners reflects Brazil, Russia, India, China,
and South Africa’s (BRICS) growing prominence in
the global economy. Our long-term historical
regressions yield, on average, no significant
difference between demand from BRICS or other EMs
in explaining EM growth (Figure 7). However, this
average result conceals an important finding:
commodity exporters’ growth is found to be highly
sensitive to demand from BRICS countries,
confirming the growing importance of these large
EMs’ demand on global commodity prices.7
Favorable terms of trade helped commodity-
exporting EMs. The large and sustained increase in
commodity prices raised investment and GDP growth
in most commodity-exporting EMs, many of which
enjoyed an unprecedented income windfall. For the
average commodity-exporting EM, the 5¼ percent
annual improvement in terms of trade over the last
decade contributed to a ¾ percentage point increase
in growth – about a quarter of the higher growth
seen in the 2000s. On the other hand, the rise in
commodity prices did take a toll on growth for the
average commodity importer, whose growth was
nevertheless supported by other factors (Figure 8).
Easy financing conditions boosted investment and growth in financially open EMs. Lower
global interest rates and tightening of borrowing spreads (the latter also reflecting improved
fundamentals) helped to boost domestic demand in EMs, particularly in the more financially open
EMs. For the median financially open EM, we find that the 170 basis point decline in global real
interest rates in the 2000s (as proxied by the 10-year U.S. T-bond rate) raised GDP growth by ¼ of a
percentage point – about 15 percent of the higher growth these countries saw in the 2000s. Again,
the impact varied widely across countries depending on their financial openness; those in the top
quartile of financial openness grew on average by a ½ percentage point more in the last decade
owing to these lower global interest rates.
7 The significance of BRICS’ growth for non-commodity EMs is sensitive to the estimation period of choice. Figure 7
presents results for the period covering 1992-2011. Research focusing on the more recent past finds a larger role for
BRICS, particularly China (IMF, 2014c, 2014d).
-0.4
0.0
0.4
0.8
1.2
1.6
All Non-commodity
Exporters
Commodity
Exporters
BRICS partners
Non-BRICS EM partners
Figure 7. Elasticity of EM Growth to BRICS
vs. other EM trading partners
Source: WDI and IMF staff calculations.
-0.10
-0.05
0.00
0.05
0.10
0.15
0.20
0.25
Non-commodity
exporter
Commodity exporter
Figure 8. Elasticity of EM Growth to
Terms of Trade Changes
Source: WDI and IMF staff calculations.
INTERNATIONAL MONETARY FUND 9
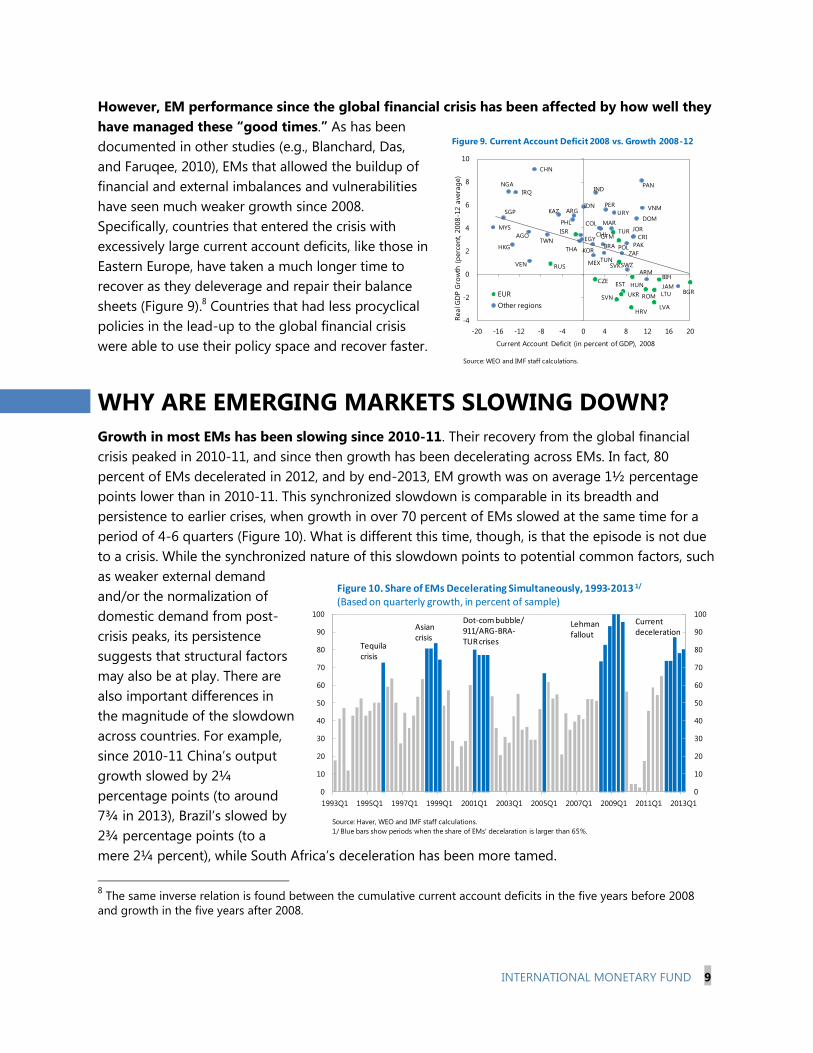
However, EM performance since the global financial crisis has been affected by how well they
have managed these “good times.” As has been
documented in other studies (e.g., Blanchard, Das,
and Faruqee, 2010), EMs that allowed the buildup of
financial and external imbalances and vulnerabilities
have seen much weaker growth since 2008.
Specifically, countries that entered the crisis with
excessively large current account deficits, like those in
Eastern Europe, have taken a much longer time to
recover as they deleverage and repair their balance
sheets (Figure 9).8 Countries that had less procyclical
policies in the lead-up to the global financial crisis
were able to use their policy space and recover faster.
WHY ARE EMERGING MARKETS SLOWING DOWN?
Growth in most EMs has been slowing since 2010-11. Their recovery from the global financial
crisis peaked in 2010-11, and since then growth has been decelerating across EMs. In fact, 80
percent of EMs decelerated in 2012, and by end-2013, EM growth was on average 1½ percentage
points lower than in 2010-11. This synchronized slowdown is comparable in its breadth and
persistence to earlier crises, when growth in over 70 percent of EMs slowed at the same time for a
period of 4-6 quarters (Figure 10). What is different this time, though, is that the episode is not due
to a crisis. While the synchronized nature of this slowdown points to potential common factors, such
as weaker external demand
and/or the normalization of
domestic demand from post-
crisis peaks, its persistence
suggests that structural factors
may also be at play. There are
also important differences in
the magnitude of the slowdown
across countries. For example,
since 2010-11 China’s output
growth slowed by 2¼
percentage points (to around
7¾ in 2013), Brazil’s slowed by
2¾ percentage points (to a
mere 2¼ percent), while South Africa’s deceleration has been more tamed.
8 The same inverse relation is found between the cumulative current account deficits in the five years before 2008
and growth in the five years after 2008.
TUR
HUN
POL
RUS
BGRROMUKR
BIH
HRV
CZEEST
ISR
LVA
LTU
SVK
SVN
ZAF
AGO
NGA
SWZ
IND
IDN
CHN
PHLMYS
THAHKGKOR
SGP
TWN
VNMKAZ
ARM
EGY
IRQ
JORMAR
PAK
TUN
BRA
MEX
CHL
COL
PERARG
CRI
DOM
GTM
JAM
PAN
URY
VEN
-4
-2
0
2
4
6
8
10
-20 -16 -12 -8 -4 0 4 8 12 16 20
Real G
DP G
row
th (
perc
ent, 2
008
-12 a
vera
ge)
Current Account Deficit (in percent of GDP), 2008
EUR
Other regions
Figure 9. Current Account Deficit 2008 vs. Growth 2008-12
Source: WEO and IMF staff calculations.
0
10
20
30
40
50
60
70
80
90
100
0
10
20
30
40
50
60
70
80
90
100
1993Q1 1995Q1 1997Q1 1999Q1 2001Q1 2003Q1 2005Q1 2007Q1 2009Q1 2011Q1 2013Q1
Figure 10. Share of EMs Decelerating Simultaneously, 1993-2013 1/
(Based on quarterly growth, in percent of sample)
Asian crisis
Dot-com bubble/ 911/ARG-BRA-TUR crises
Lehman fallout
Current deceleration
Tequila crisis
Source: Haver, WEO and IMF staff calculations.
1/ Blue bars show periods when the share of EMs' decelaration is larger than 65%.
EMERGING MARKETS IN TRANSITION
10 INTERNATIONAL MONETARY FUND
A. External and Domestic Demand Factors
What role did external and domestic factors play in explaining the recent slowdown? To
answer this question, we estimate a pooled panel ordinary least square (OLS) regression for a
sample of 24 EMs for the period 2010-13 (see Analytical Appendix, Section C).9 We study how the
size of the slowdown is explained by external and domestic factors. External conditions are proxied
by a trading partner’s real import demand, the change in terms of trade, the U.S. 10-year bond yield,
global risk aversion (measured by the VIX index), and capital flows (measured by the ratio of the
financial account balance to GDP). Domestic conditions are proxied by the fiscal policy stance
(measured by the change in the cyclically adjusted primary balance to potential GDP), the monetary
policy rate, and the exchange rate regime. Initial conditions (in 2010) include each country’s
exchange rate deviation from fundamentals, the output gap, and the degree of financial openness
(measured ratio of external assets and liabilities to GDP). Controlling for initial conditions also allows
us to analyze the slowdown in growth beyond what would be implied, if any, by the natural
convergence process.
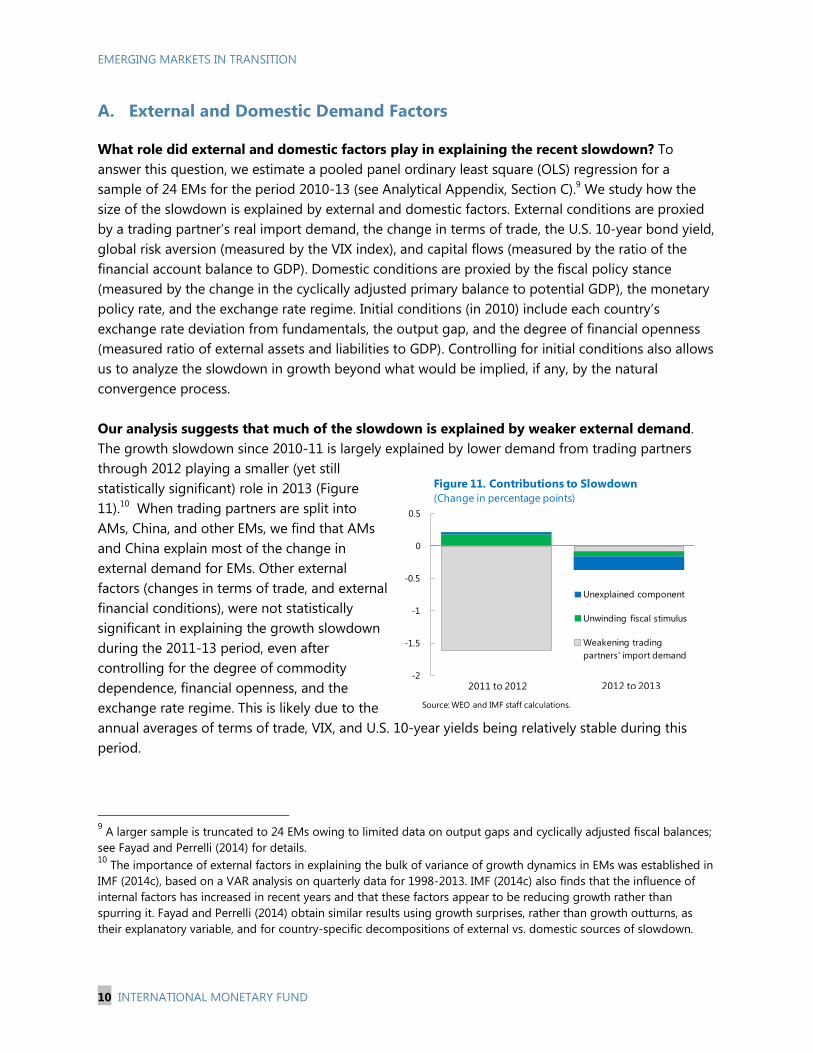
Our analysis suggests that much of the slowdown is explained by weaker external demand.
The growth slowdown since 2010-11 is largely explained by lower demand from trading partners
through 2012 playing a smaller (yet still
statistically significant) role in 2013 (Figure
11).10
When trading partners are split into
AMs, China, and other EMs, we find that AMs
and China explain most of the change in
external demand for EMs. Other external
factors (changes in terms of trade, and external
financial conditions), were not statistically
significant in explaining the growth slowdown
during the 2011-13 period, even after
controlling for the degree of commodity
dependence, financial openness, and the
exchange rate regime. This is likely due to the
annual averages of terms of trade, VIX, and U.S. 10-year yields being relatively stable during this
period.
9 A larger sample is truncated to 24 EMs owing to limited data on output gaps and cyclically adjusted fiscal balances;
see Fayad and Perrelli (2014) for details. 10
The importance of external factors in explaining the bulk of variance of growth dynamics in EMs was established in
IMF (2014c), based on a VAR analysis on quarterly data for 1998-2013. IMF (2014c) also finds that the influence of
internal factors has increased in recent years and that these factors appear to be reducing growth rather than
spurring it. Fayad and Perrelli (2014) obtain similar results using growth surprises, rather than growth outturns, as
their explanatory variable, and for country-specific decompositions of external vs. domestic sources of slowdown.
-2
-1.5
-1
-0.5
0
0.5
Unexplained component
Unwinding fiscal stimulus
Weakening trading
partners' import demand
Figure 11. Contributions to Slowdown
(Change in percentage points)
2011 to 2012 2012 to 2013
Source: WEO and IMF staff calculations.
INTERNATIONAL MONETARY FUND 11
Domestic factors also played a role in explaining the recent slowdown, although their
contributions varied across time and countries. The role of fiscal policy in particular changed over
these years; policy stance turned contractionary in 2013 in many countries, reflecting the unwinding
of stimulus enacted in response to the global financial crisis. After controlling for initial conditions in
2010, EMs that were overheating prior to the slowdown (proxied by positive output gaps and
overvalued exchange rates) were also found to experience sharper growth slowdowns. Other
idiosyncratic factors not found significant in the regression (the unexplained component in Figure
11), such as the monetary policy stance, were important for a group of EMs, especially in 2013.
B. Cyclical and Structural Factors
The persistence of the slowdown would depend on whether it is driven by cyclical or
structural factors. A slowdown driven by structural factors (i.e., a decline in the economy’s potential
growth rate) would be harder to reverse, and thus more persistent, while a cyclical downturn would
be more temporary. However, discerning the extent of structural and cyclical factors is a complex
exercise and subject to much uncertainty. It requires estimating an economy’s potential growth rate,
which is unobservable and time varying. Potential growth tends to be procyclical, rising during good
times as investment and capital accumulation rises and TFP also improves, and similarly declining in
bad economic times.
Notwithstanding limitations, we attempt to decompose the current slowdown into cyclical
versus structural components (see Analytical Appendix, Section A and Tsounta, 2014). We estimate
potential growth rates for 70 EMs individually over 1980-2018 based on standard (Solow-style)
growth accounting methodologies (Sosa, Tsounta, and Kim, 2013). First, we decompose the sources
of actual output growth into accumulation of factors of production (capital and quality-adjusted
labor, that is, human capital) and TFP and make assumptions for the path of factors or production
and TFP based on historical trends and demographic projections for the period 2013-18. To obtain
potential growth estimates for each year, we then use a battery of commonly used filtering
techniques to measure the trend of the subcomponents of output (namely, capital, labor, and TFP),
smoothing out cyclical fluctuations. The structural component of the slowdown is estimated as the
change in the potential growth rate from a historical average (e.g., 2000-12 versus 2013-18). The
cyclical part of the slowdown is the residual from the change in actual growth rates (between 2010-
11 and 2012-13) and the structural change.11
11
We use the average for 2010-11 as a starting point since most EMs experienced a slowdown from their cyclical
peak, either in 2010 or 2011.
EMERGING MARKETS IN TRANSITION
12 INTERNATIONAL MONETARY FUND
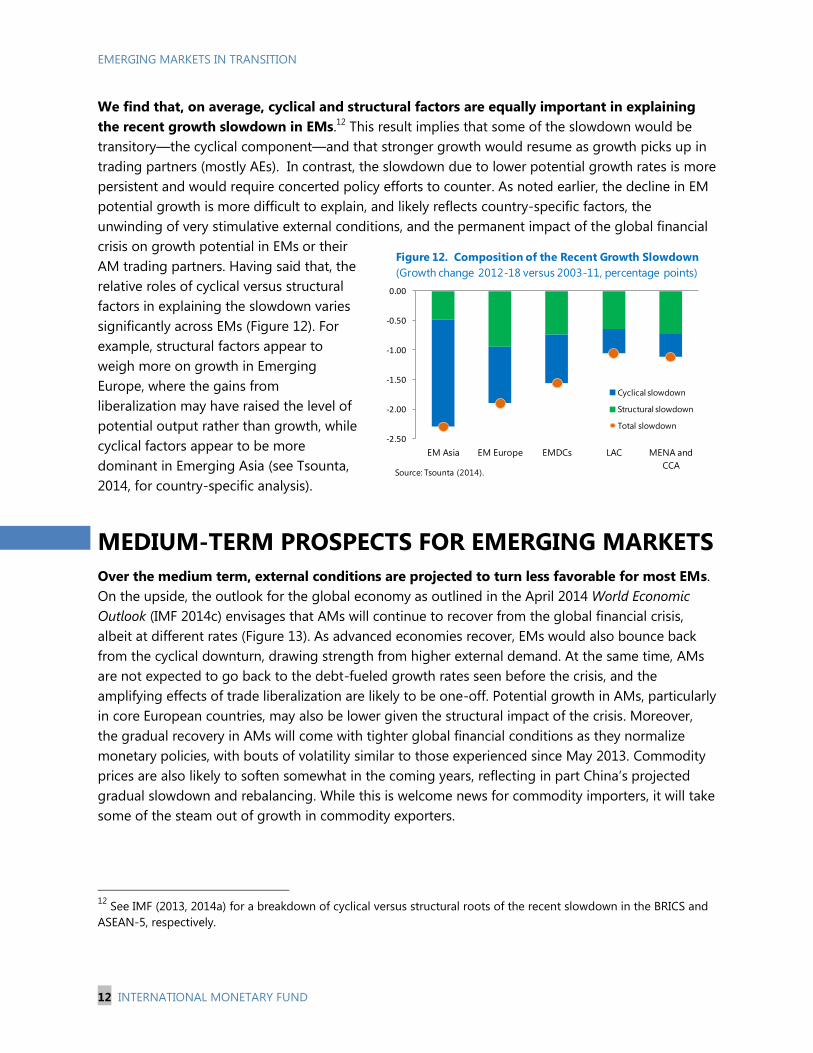
We find that, on average, cyclical and structural factors are equally important in explaining
the recent growth slowdown in EMs.12
This result implies that some of the slowdown would be
transitory—the cyclical component—and that stronger growth would resume as growth picks up in
trading partners (mostly AEs). In contrast, the slowdown due to lower potential growth rates is more
persistent and would require concerted policy efforts to counter. As noted earlier, the decline in EM
potential growth is more difficult to explain, and likely reflects country-specific factors, the
unwinding of very stimulative external conditions, and the permanent impact of the global financial
crisis on growth potential in EMs or their
AM trading partners. Having said that, the
relative roles of cyclical versus structural
factors in explaining the slowdown varies
significantly across EMs (Figure 12). For
example, structural factors appear to
weigh more on growth in Emerging
Europe, where the gains from
liberalization may have raised the level of
potential output rather than growth, while
cyclical factors appear to be more
dominant in Emerging Asia (see Tsounta,
2014, for country-specific analysis).
MEDIUM-TERM PROSPECTS FOR EMERGING MARKETS
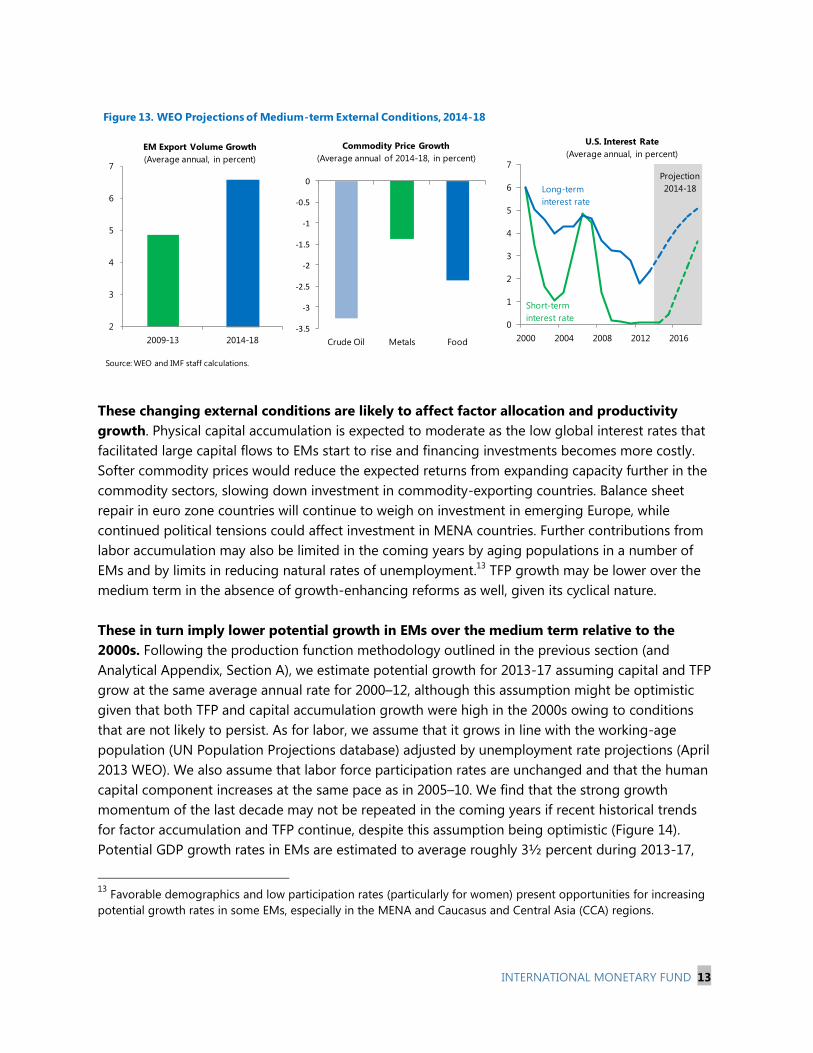
Over the medium term, external conditions are projected to turn less favorable for most EMs.
On the upside, the outlook for the global economy as outlined in the April 2014 World Economic
Outlook (IMF 2014c) envisages that AMs will continue to recover from the global financial crisis,
albeit at different rates (Figure 13). As advanced economies recover, EMs would also bounce back
from the cyclical downturn, drawing strength from higher external demand. At the same time, AMs
are not expected to go back to the debt-fueled growth rates seen before the crisis, and the
amplifying effects of trade liberalization are likely to be one-off. Potential growth in AMs, particularly
in core European countries, may also be lower given the structural impact of the crisis. Moreover,
the gradual recovery in AMs will come with tighter global financial conditions as they normalize
monetary policies, with bouts of volatility similar to those experienced since May 2013. Commodity
prices are also likely to soften somewhat in the coming years, reflecting in part China’s projected
gradual slowdown and rebalancing. While this is welcome news for commodity importers, it will take
some of the steam out of growth in commodity exporters.
12
See IMF (2013, 2014a) for a breakdown of cyclical versus structural roots of the recent slowdown in the BRICS and
ASEAN-5, respectively.
-2.50
-2.00
-1.50
-1.00
-0.50
0.00
EM Asia EM Europe EMDCs LAC MENA and
CCA
Cyclical slowdown
Structural slowdown
Total slowdown
Figure 12. Composition of the Recent Growth Slowdown
(Growth change 2012-18 versus 2003-11, percentage points)
Source: Tsounta (2014).
INTERNATIONAL MONETARY FUND 13
These changing external conditions are likely to affect factor allocation and productivity
growth. Physical capital accumulation is expected to moderate as the low global interest rates that
facilitated large capital flows to EMs start to rise and financing investments becomes more costly.
Softer commodity prices would reduce the expected returns from expanding capacity further in the
commodity sectors, slowing down investment in commodity-exporting countries. Balance sheet
repair in euro zone countries will continue to weigh on investment in emerging Europe, while
continued political tensions could affect investment in MENA countries. Further contributions from
labor accumulation may also be limited in the coming years by aging populations in a number of
EMs and by limits in reducing natural rates of unemployment.13
TFP growth may be lower over the
medium term in the absence of growth-enhancing reforms as well, given its cyclical nature.
These in turn imply lower potential growth in EMs over the medium term relative to the
2000s. Following the production function methodology outlined in the previous section (and
Analytical Appendix, Section A), we estimate potential growth for 2013-17 assuming capital and TFP
grow at the same average annual rate for 2000–12, although this assumption might be optimistic
given that both TFP and capital accumulation growth were high in the 2000s owing to conditions
that are not likely to persist. As for labor, we assume that it grows in line with the working-age
population (UN Population Projections database) adjusted by unemployment rate projections (April
2013 WEO). We also assume that labor force participation rates are unchanged and that the human
capital component increases at the same pace as in 2005–10. We find that the strong growth
momentum of the last decade may not be repeated in the coming years if recent historical trends
for factor accumulation and TFP continue, despite this assumption being optimistic (Figure 14).
Potential GDP growth rates in EMs are estimated to average roughly 3½ percent during 2013-17,
13
Favorable demographics and low participation rates (particularly for women) present opportunities for increasing
potential growth rates in some EMs, especially in the MENA and Caucasus and Central Asia (CCA) regions.
-3.5
-3
-2.5
-2
-1.5
-1
-0.5
0
Crude Oil Metals Food
Commodity Price Growth
(Average annual of 2014-18, in percent)
0
1
2
3
4
5
6
7
2000 2004 2008 2012 2016
U.S. Interest Rate
(Average annual, in percent)
Short-term
interest rate
Long-term
interest rate
Projection
2014-18
Figure 13. WEO Projections of Medium-term External Conditions, 2014-18
Source: WEO and IMF staff calculations.
2
3
4
5
6
7
2009-13 2014-18
EM Export Volume Growth
(Average annual, in percent)
EMERGING MARKETS IN TRANSITION
14 INTERNATIONAL MONETARY FUND
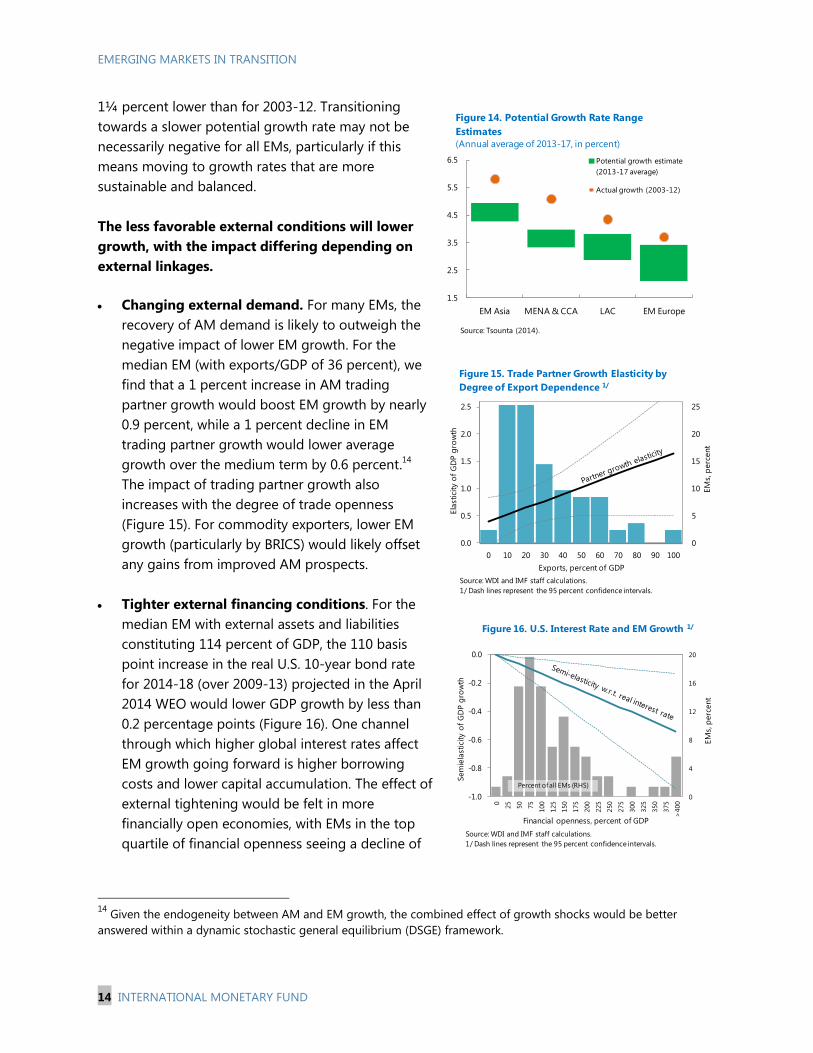
1¼ percent lower than for 2003-12. Transitioning
towards a slower potential growth rate may not be
necessarily negative for all EMs, particularly if this
means moving to growth rates that are more
sustainable and balanced.
The less favorable external conditions will lower
growth, with the impact differing depending on
external linkages.
Changing external demand. For many EMs, the
recovery of AM demand is likely to outweigh the
negative impact of lower EM growth. For the
median EM (with exports/GDP of 36 percent), we
find that a 1 percent increase in AM trading
partner growth would boost EM growth by nearly
0.9 percent, while a 1 percent decline in EM
trading partner growth would lower average
growth over the medium term by 0.6 percent.14
The impact of trading partner growth also
increases with the degree of trade openness
(Figure 15). For commodity exporters, lower EM
growth (particularly by BRICS) would likely offset
any gains from improved AM prospects.
Tighter external financing conditions. For the
median EM with external assets and liabilities
constituting 114 percent of GDP, the 110 basis
point increase in the real U.S. 10-year bond rate
for 2014-18 (over 2009-13) projected in the April
2014 WEO would lower GDP growth by less than
0.2 percentage points (Figure 16). One channel
through which higher global interest rates affect
EM growth going forward is higher borrowing
costs and lower capital accumulation. The effect of
external tightening would be felt in more
financially open economies, with EMs in the top
quartile of financial openness seeing a decline of
14
Given the endogeneity between AM and EM growth, the combined effect of growth shocks would be better
answered within a dynamic stochastic general equilibrium (DSGE) framework.
0
5
10
15
20
25
0.0
0.5
1.0
1.5
2.0
2.5
0 10 20 30 40 50 60 70 80 90 100
EM
s, p
erc
ent
Ela
stic
ity
of
GD
P g
row
th
Exports, percent of GDP
Figure 15. Trade Partner Growth Elasticity by
Degree of Export Dependence 1/
Source: WDI and IMF staff calculations.
1/ Dash lines represent the 95 percent confidence intervals.
0
4
8
12
16
20
-1.0
-0.8
-0.6
-0.4
-0.2
0.0
0
25
50
75
100
125
150
175
200
225
250
275
300
325
350
375
>400
EM
s, p
erc
ent
Sem
iela
stic
ity
of
GD
P g
row
th
Financial openness, percent of GDP
Percent of all EMs (RHS)
Figure 16. U.S. Interest Rate and EM Growth 1/
Source: WDI and IMF staff calculations.
1/ Dash lines represent the 95 percent confidence intervals.
1.5
2.5
3.5
4.5
5.5
6.5
EM Asia MENA & CCA LAC EM Europe
Potential growth estimate
(2013-17 average)
Actual growth (2003-12)
Source: Tsounta (2014).
Figure 14. Potential Growth Rate Range
Estimates
(Annual average of 2013-17, in percent)
INTERNATIONAL MONETARY FUND 15
about 0.4 percentage points over a five-year horizon. The impact is partial, however, since real
rates would rise only when AM growth picks up, which would concurrently support EM growth.15
Softer or flat commodity prices. Drawing on the elasticity estimates presented earlier, the 3
percent decline in the terms of trade for the median commodity exporting EM projected in the
April 2014 WEO would reduce growth over the medium term on average by about ½ percent,
whereas the impact is estimated to be negligible for non-commodity exporters. The impact on
the large commodity exporters could be larger; IMF (2014b) estimates that even with
commodity prices remaining at their current levels, commodity exporters in Latin America could
see growth lower by 1¼ percentage points relative to the boom years (2003-11).
POLICY PRIORITIES GOING FORWARD
Going forward, as global conditions turn less supportive, countries will need to rely both on sound
macroeconomic policies aimed at addressing imbalances, and on structural reforms to sustain or
restore growth potential. While reform priorities depend on each country’s circumstances, some key
policy contours are highlighted.
A. Macroeconomic Policy Priorities
Recent market turmoil once again underscored the need to maintain sound macroeconomic
policies and buffers. Starting in May 2013, changing expectations about monetary policy
normalization in AMs in the context of slowing growth in key EMs led to a sharp re-pricing of EM
risks. While the sell was initially broad-based, markets quickly began to differentiate according to
economic fundamentals and policy credibility. The immediate challenge for EM policymakers is to
strengthen macroeconomic frameworks. In some cases tighter monetary policy will be needed to
contain inflation and strengthen confidence. Fiscal policies may also need to be tightened where the
fiscal stance is procyclical or adds to funding pressures and where current account deficits are too
high. Exchange rate flexibility should serve to buffer shocks, although foreign exchange intervention
could be used to reduce excessive volatility where reserves are adequate.
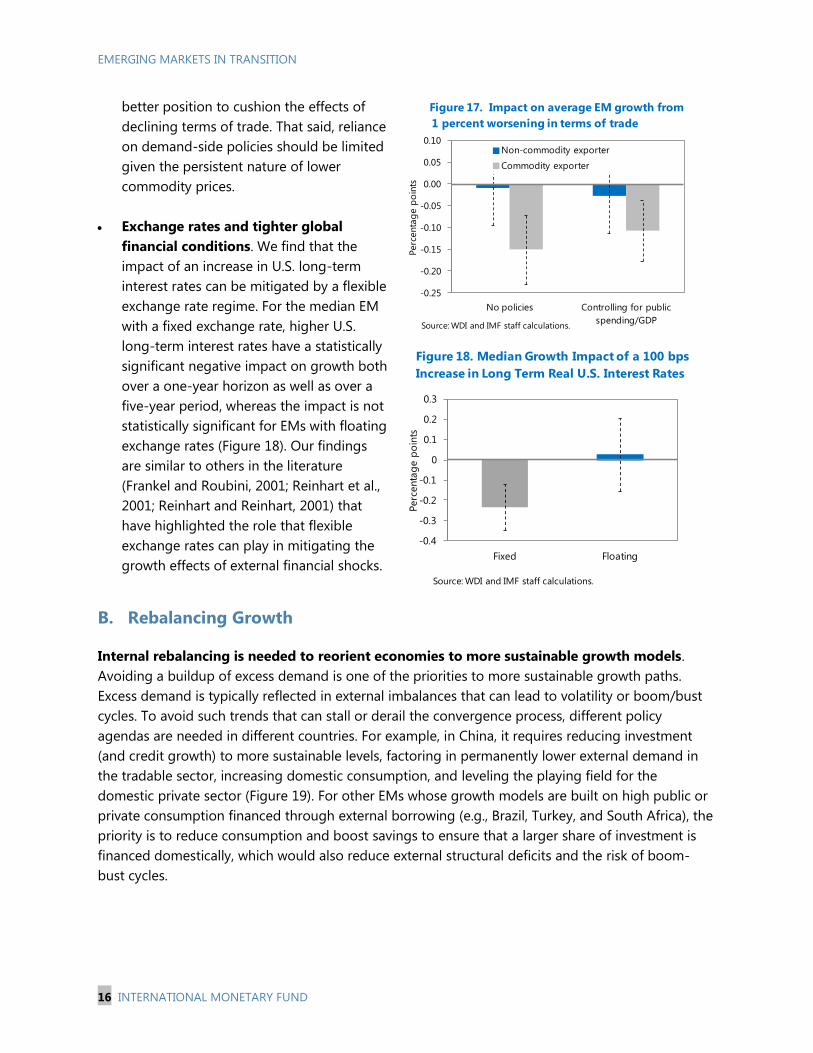
Policies can play a role in mitigating the impact of changes in external conditions on growth:
Fiscal policy and commodity price shocks. Our estimates suggest that the sensitivity of
commodity exporters’ growth to a decline in terms of trade can be reduced by 30 percent for
countries able to implement countercyclical policies (Figure 17). This implies that countries that
have saved a greater share of their commodity windfall over the previous decade will be in a
15
Studies that estimate the combined effect of higher growth in the United States coupled with higher interest rates
find that EM growth would be affected positively in net terms (IMF, 2014c).
EMERGING MARKETS IN TRANSITION
16 INTERNATIONAL MONETARY FUND
better position to cushion the effects of
declining terms of trade. That said, reliance
on demand-side policies should be limited
given the persistent nature of lower
commodity prices.
Exchange rates and tighter global
financial conditions. We find that the
impact of an increase in U.S. long-term
interest rates can be mitigated by a flexible
exchange rate regime. For the median EM
with a fixed exchange rate, higher U.S.
long-term interest rates have a statistically
significant negative impact on growth both
over a one-year horizon as well as over a
five-year period, whereas the impact is not
statistically significant for EMs with floating
exchange rates (Figure 18). Our findings
are similar to others in the literature
(Frankel and Roubini, 2001; Reinhart et al.,
2001; Reinhart and Reinhart, 2001) that
have highlighted the role that flexible
exchange rates can play in mitigating the
growth effects of external financial shocks.
B. Rebalancing Growth
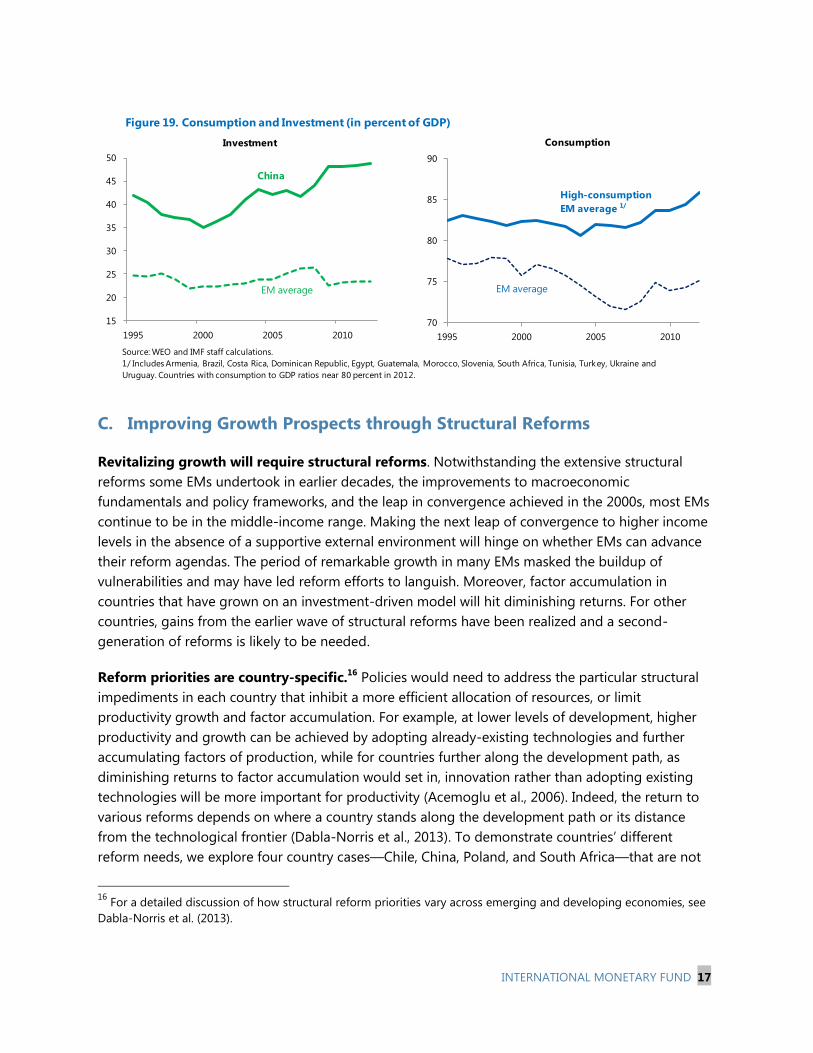
Internal rebalancing is needed to reorient economies to more sustainable growth models.
Avoiding a buildup of excess demand is one of the priorities to more sustainable growth paths.
Excess demand is typically reflected in external imbalances that can lead to volatility or boom/bust
cycles. To avoid such trends that can stall or derail the convergence process, different policy
agendas are needed in different countries. For example, in China, it requires reducing investment
(and credit growth) to more sustainable levels, factoring in permanently lower external demand in
the tradable sector, increasing domestic consumption, and leveling the playing field for the
domestic private sector (Figure 19). For other EMs whose growth models are built on high public or
private consumption financed through external borrowing (e.g., Brazil, Turkey, and South Africa), the
priority is to reduce consumption and boost savings to ensure that a larger share of investment is
financed domestically, which would also reduce external structural deficits and the risk of boom-
bust cycles.
-0.25
-0.20
-0.15
-0.10
-0.05
0.00
0.05
0.10
No policies Controlling for public
spending/GDP
Perc
enta
ge p
oin
ts
Non-commodity exporter
Commodity exporter
Figure 17. Impact on average EM growth from
1 percent worsening in terms of trade
Source: WDI and IMF staff calculations.
-0.4
-0.3
-0.2
-0.1
0
0.1
0.2
0.3
Fixed Floating
Perc
enta
ge p
oin
ts
Figure 18. Median Growth Impact of a 100 bps
Increase in Long Term Real U.S. Interest Rates
Source: WDI and IMF staff calculations.
INTERNATIONAL MONETARY FUND 17
C. Improving Growth Prospects through Structural Reforms
Revitalizing growth will require structural reforms. Notwithstanding the extensive structural
reforms some EMs undertook in earlier decades, the improvements to macroeconomic
fundamentals and policy frameworks, and the leap in convergence achieved in the 2000s, most EMs
continue to be in the middle-income range. Making the next leap of convergence to higher income
levels in the absence of a supportive external environment will hinge on whether EMs can advance
their reform agendas. The period of remarkable growth in many EMs masked the buildup of
vulnerabilities and may have led reform efforts to languish. Moreover, factor accumulation in
countries that have grown on an investment-driven model will hit diminishing returns. For other
countries, gains from the earlier wave of structural reforms have been realized and a second-
generation of reforms is likely to be needed.
Reform priorities are country-specific.16
Policies would need to address the particular structural
impediments in each country that inhibit a more efficient allocation of resources, or limit
productivity growth and factor accumulation. For example, at lower levels of development, higher
productivity and growth can be achieved by adopting already-existing technologies and further
accumulating factors of production, while for countries further along the development path, as
diminishing returns to factor accumulation would set in, innovation rather than adopting existing
technologies will be more important for productivity (Acemoglu et al., 2006). Indeed, the return to
various reforms depends on where a country stands along the development path or its distance
from the technological frontier (Dabla-Norris et al., 2013). To demonstrate countries’ different
reform needs, we explore four country cases—Chile, China, Poland, and South Africa—that are not
16
For a detailed discussion of how structural reform priorities vary across emerging and developing economies, see
Dabla-Norris et al. (2013).
15
20
25
30
35
40
45
50
1995 2000 2005 2010
China
EM average
Investment
70
75
80
85
90
1995 2000 2005 2010
EM average
High-consumption
EM average 1/
Consumption
Source: WEO and IMF staff calculations.
1/ Includes Armenia, Brazil, Costa Rica, Dominican Republic, Egypt, Guatemala, Morocco, Slovenia, South Africa, Tunisia, Turkey, Ukraine and
Uruguay. Countries with consumption to GDP ratios near 80 percent in 2012.
Figure 19. Consumption and Investment (in percent of GDP)
EMERGING MARKETS IN TRANSITION
18 INTERNATIONAL MONETARY FUND
just at different income levels, but have also experienced different productivity growth and
convergence patterns over the decades (see Annex 2 for details). Drawing on the relevant literature
and these countries’ experiences, reform priorities can be set along the following key objectives:
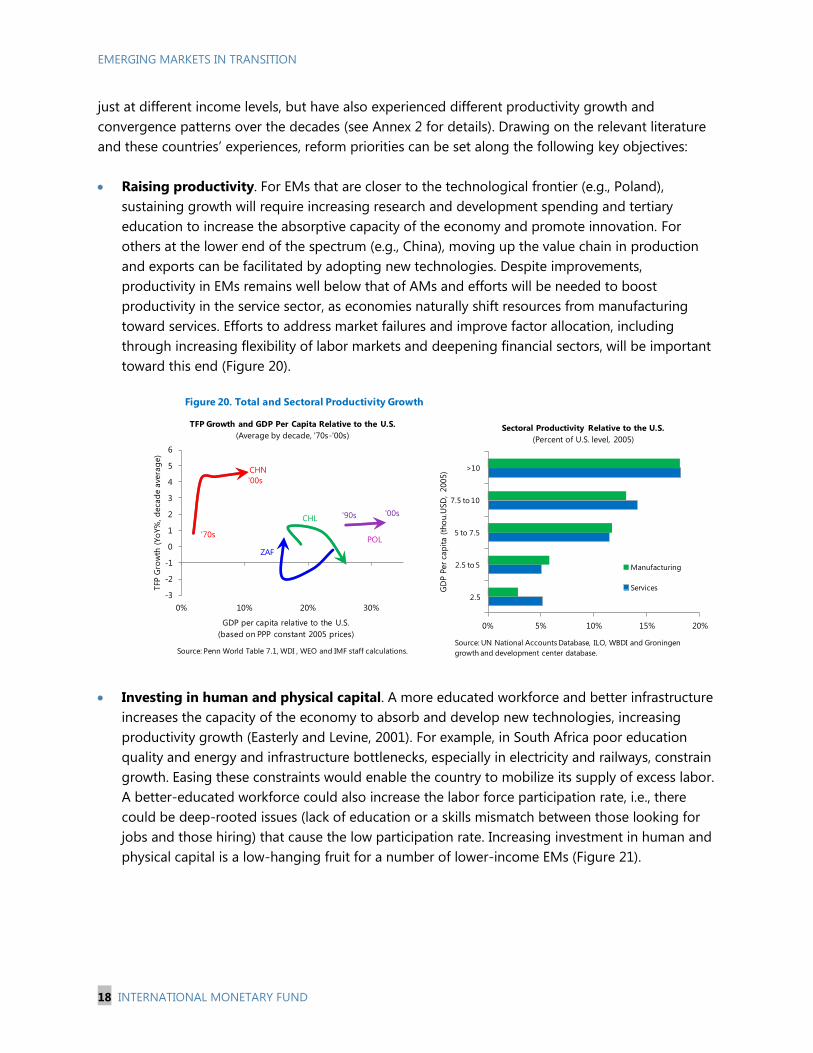
Raising productivity. For EMs that are closer to the technological frontier (e.g., Poland),
sustaining growth will require increasing research and development spending and tertiary
education to increase the absorptive capacity of the economy and promote innovation. For
others at the lower end of the spectrum (e.g., China), moving up the value chain in production
and exports can be facilitated by adopting new technologies. Despite improvements,
productivity in EMs remains well below that of AMs and efforts will be needed to boost
productivity in the service sector, as economies naturally shift resources from manufacturing
toward services. Efforts to address market failures and improve factor allocation, including
through increasing flexibility of labor markets and deepening financial sectors, will be important
toward this end (Figure 20).
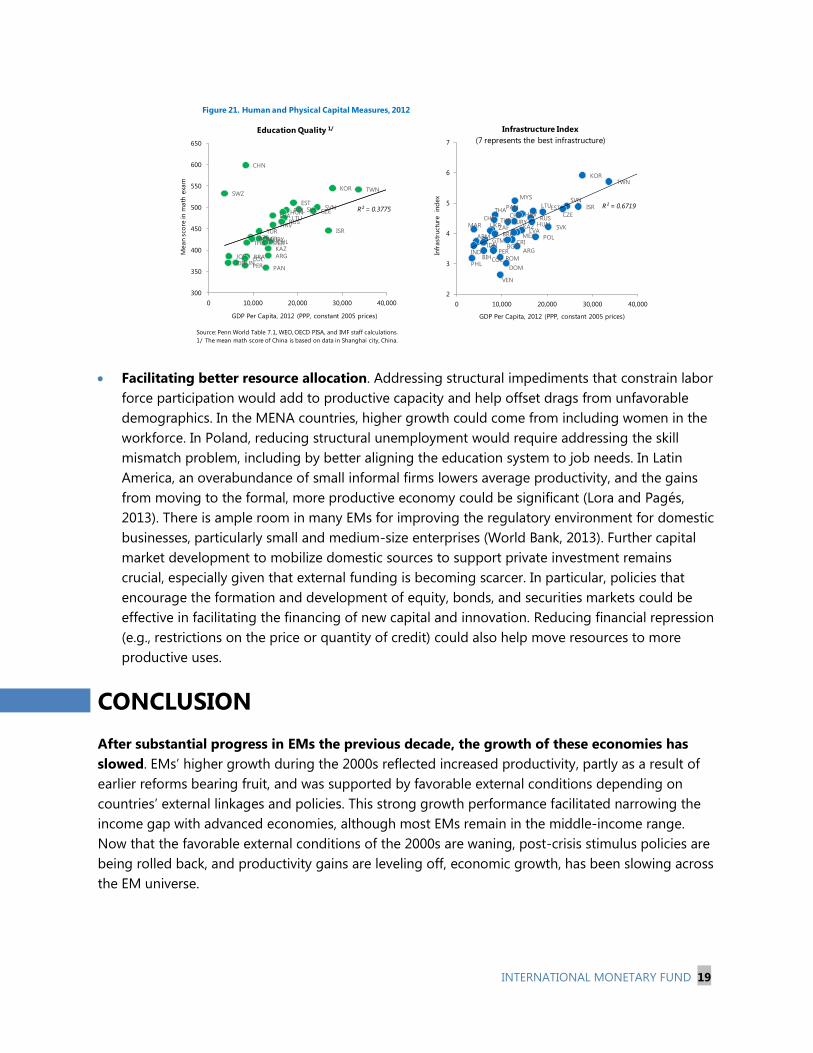
Investing in human and physical capital. A more educated workforce and better infrastructure
increases the capacity of the economy to absorb and develop new technologies, increasing
productivity growth (Easterly and Levine, 2001). For example, in South Africa poor education
quality and energy and infrastructure bottlenecks, especially in electricity and railways, constrain
growth. Easing these constraints would enable the country to mobilize its supply of excess labor.
A better-educated workforce could also increase the labor force participation rate, i.e., there
could be deep-rooted issues (lack of education or a skills mismatch between those looking for
jobs and those hiring) that cause the low participation rate. Increasing investment in human and
physical capital is a low-hanging fruit for a number of lower-income EMs (Figure 21).
'70s
'00s
'90s '00s
-3
-2
-1
0
1
2
3
4
5
6
0% 10% 20% 30%
TFP
Gro
wth
(Yo
Y%
, d
eca
de a
vera
ge)
GDP per capita relative to the U.S.
(based on PPP constant 2005 prices)
TFP Growth and GDP Per Capita Relative to the U.S.
(Average by decade, '70s-'00s)
CHN
ZAF
CHL
POL
0% 5% 10% 15% 20%
2.5
2.5 to 5
5 to 7.5
7.5 to 10
>10
Manufacturing
Services
Sectoral Productivity Relative to the U.S.
(Percent of U.S. level, 2005)G
DP P
er
cap
ita (
tho
u.U
SD
, 2005)
Source: Penn World Table 7.1, WDI , WEO and IMF staff calculations.
Figure 20. Total and Sectoral Productivity Growth
Source: UN National Accounts Database, ILO, WBDI and Groningen
growth and development center database.
INTERNATIONAL MONETARY FUND 19
Facilitating better resource allocation. Addressing structural impediments that constrain labor
force participation would add to productive capacity and help offset drags from unfavorable
demographics. In the MENA countries, higher growth could come from including women in the
workforce. In Poland, reducing structural unemployment would require addressing the skill
mismatch problem, including by better aligning the education system to job needs. In Latin
America, an overabundance of small informal firms lowers average productivity, and the gains
from moving to the formal, more productive economy could be significant (Lora and Pagés,
2013). There is ample room in many EMs for improving the regulatory environment for domestic
businesses, particularly small and medium-size enterprises (World Bank, 2013). Further capital
market development to mobilize domestic sources to support private investment remains
crucial, especially given that external funding is becoming scarcer. In particular, policies that
encourage the formation and development of equity, bonds, and securities markets could be
effective in facilitating the financing of new capital and innovation. Reducing financial repression
(e.g., restrictions on the price or quantity of credit) could also help move resources to more
productive uses.
CONCLUSION
After substantial progress in EMs the previous decade, the growth of these economies has
slowed. EMs’ higher growth during the 2000s reflected increased productivity, partly as a result of
earlier reforms bearing fruit, and was supported by favorable external conditions depending on
countries’ external linkages and policies. This strong growth performance facilitated narrowing the
income gap with advanced economies, although most EMs remain in the middle-income range.
Now that the favorable external conditions of the 2000s are waning, post-crisis stimulus policies are
being rolled back, and productivity gains are leveling off, economic growth, has been slowing across
the EM universe.
KORTWN
MYS SVNISRPAN
CZE
LTUESTHRVCHL
THA
RUSCHNURY HUN
TURSVKMAR ZAF
LVAUKR KAZ
MEXBRAPOL
CRIGTMBGRIDN
ARM
IND ARGPER
COLBIH ROMPHL
DOM
VEN
R² = 0.6719
2
3
4
5
6
7
0 10,000 20,000 30,000 40,000
Infr
ast
ruct
ure
in
dex
GDP Per Capita, 2012 (PPP, constant 2005 prices)
Infrastructure Index
(7 represents the best infrastructure)
CHN
KOR TWNSWZ
ESTSVNSVKPOL CZEHUN
LVA LTURUS
HRVISRTUR
AZEBGRROMURYCHLTHA MEXKAZARGJOR BRACOL
TUNIDN PER PAN
R² = 0.3775
300
350
400
450
500
550
600
650
0 10,000 20,000 30,000 40,000
Mean s
core
in m
ath
exa
m
GDP Per Capita, 2012 (PPP, constant 2005 prices)
Education Quality 1/
Source: Penn World Table 7.1, WEO, OECD PISA, and IMF staff calculations.
1/ The mean math score of China is based on data in Shanghai city, China.
Figure 21. Human and Physical Capital Measures, 2012

EMERGING MARKETS IN TRANSITION
20 INTERNATIONAL MONETARY FUND
Going forward, continuing income convergence will be more challenging. The global financial
crisis and its aftermath brought to light how policies in good times determined performance in
difficult times. Now, once again, we see markets differentiating among EMs by how well
policymakers are managing the transition to an era of less-favorable external conditions. Given the
risks of facing a prolonged period of volatility in financial markets, policymakers will need to
strengthen their macroeconomic policies and address their vulnerabilities.
Sustaining strong growth will require renewed emphasis on structural reforms. Reform
priorities will depend on country-specific circumstances. Policymakers will need to identify reform
priorities to remove supply bottlenecks, boost productivity, and move their economies up in the
value chain of economic activities. For countries at lower income levels, including frontier economies
(see Annex 3), the largest gains would come from reforms that prepare the economy to move up the
value chain and develop new sectors, whereas at higher income levels, the gains would come from
more innovation and technological development. Reforms are also required to reorient the sources
of growth away from consumption in some cases (Brazil and Turkey) and away from investment in
other cases (China).
Challenges from opposition to reforms and implementation constraints cannot be
underestimated. The costs of reform are often incurred up front and concentrated on specific
groups, whereas the benefits materialize later and are both more diffuse and less predictably
allocated. A key challenge, then, is to create the political consensus to break powerful vested
interests and the intertemporal problem (short-term pain for long-term gain). Moreover, even if
reforms are approved, weak capacity and governance can hinder their implementation. While these
issues are outside the scope of this paper, they deserve greater attention going forward.
There is a need for decisive and timely policy action. Given the time to reach consensus and
implement structural reforms, as well as lags for those reforms to have real effects, rebounding from
the current slowdown and reclaiming the higher growth of the last decade will not be quick, easy, or
uniform across countries. Early and decisive commitment to tailored reforms will have significant
benefits over the longer term.
INTERNATIONAL MONETARY FUND 21
Annex 1. Organizing the Emerging Market Universe: The Role of External
Linkages17
We use cluster analysis to develop a taxonomy to organize the highly heterogeneous EM universe
along different economic and financial dimensions. These clusters are used in our empirical work to
differentiate results across different types of EM groups.
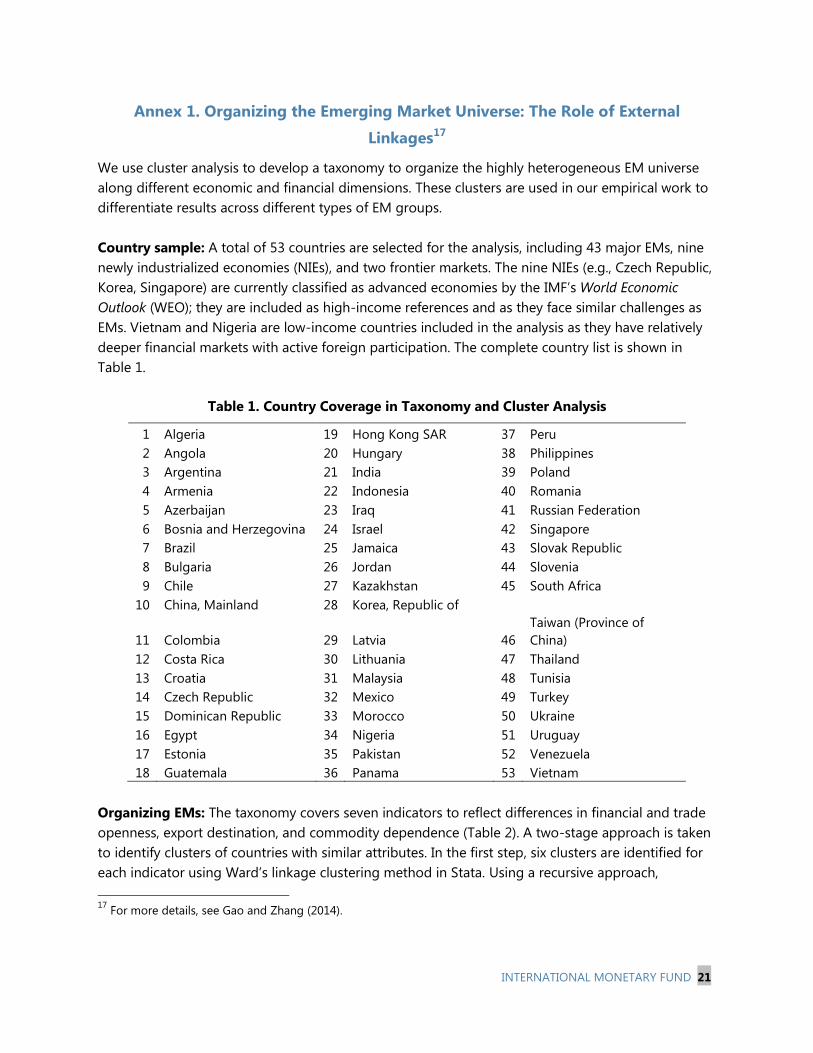
Country sample: A total of 53 countries are selected for the analysis, including 43 major EMs, nine
newly industrialized economies (NIEs), and two frontier markets. The nine NIEs (e.g., Czech Republic,
Korea, Singapore) are currently classified as advanced economies by the IMF’s World Economic
Outlook (WEO); they are included as high-income references and as they face similar challenges as
EMs. Vietnam and Nigeria are low-income countries included in the analysis as they have relatively
deeper financial markets with active foreign participation. The complete country list is shown in
Table 1.
Table 1. Country Coverage in Taxonomy and Cluster Analysis
1 Algeria 19 Hong Kong SAR 37 Peru
2 Angola 20 Hungary 38 Philippines
3 Argentina 21 India 39 Poland
4 Armenia 22 Indonesia 40 Romania
5 Azerbaijan 23 Iraq 41 Russian Federation
6 Bosnia and Herzegovina 24 Israel 42 Singapore
7 Brazil 25 Jamaica 43 Slovak Republic
8 Bulgaria 26 Jordan 44 Slovenia
9 Chile 27 Kazakhstan 45 South Africa
10 China, Mainland 28 Korea, Republic of
11 Colombia 29 Latvia 46
Taiwan (Province of
China)
12 Costa Rica 30 Lithuania 47 Thailand
13 Croatia 31 Malaysia 48 Tunisia
14 Czech Republic 32 Mexico 49 Turkey
15 Dominican Republic 33 Morocco 50 Ukraine
16 Egypt 34 Nigeria 51 Uruguay
17 Estonia 35 Pakistan 52 Venezuela
18 Guatemala 36 Panama 53 Vietnam
Organizing EMs: The taxonomy covers seven indicators to reflect differences in financial and trade
openness, export destination, and commodity dependence (Table 2). A two-stage approach is taken
to identify clusters of countries with similar attributes. In the first step, six clusters are identified for
each indicator using Ward’s linkage clustering method in Stata. Using a recursive approach,
17
For more details, see Gao and Zhang (2014).
EMERGING MARKETS IN TRANSITION
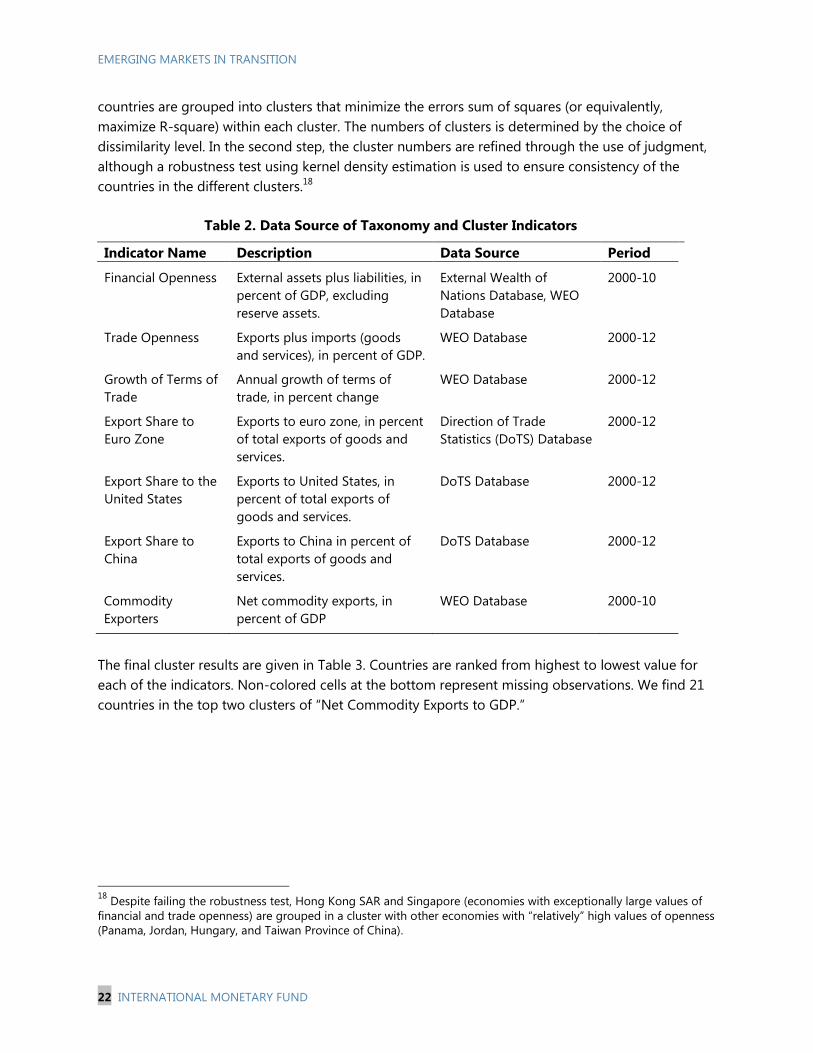
22 INTERNATIONAL MONETARY FUND
countries are grouped into clusters that minimize the errors sum of squares (or equivalently,
maximize R-square) within each cluster. The numbers of clusters is determined by the choice of
dissimilarity level. In the second step, the cluster numbers are refined through the use of judgment,
although a robustness test using kernel density estimation is used to ensure consistency of the
countries in the different clusters.18
Table 2. Data Source of Taxonomy and Cluster Indicators
Indicator Name Description Data Source Period
Financial Openness External assets plus liabilities, in
percent of GDP, excluding
reserve assets.
External Wealth of
Nations Database, WEO
Database
2000-10
Trade Openness Exports plus imports (goods
and services), in percent of GDP.
WEO Database 2000-12
Growth of Terms of
Trade
Annual growth of terms of
trade, in percent change
WEO Database 2000-12
Export Share to
Euro Zone
Exports to euro zone, in percent
of total exports of goods and
services.
Direction of Trade
Statistics (DoTS) Database
2000-12
Export Share to the
United States
Exports to United States, in
percent of total exports of
goods and services.
DoTS Database 2000-12
Export Share to
China
Exports to China in percent of
total exports of goods and
services.
DoTS Database 2000-12
Commodity
Exporters
Net commodity exports, in
percent of GDP
WEO Database 2000-10
The final cluster results are given in Table 3. Countries are ranked from highest to lowest value for
each of the indicators. Non-colored cells at the bottom represent missing observations. We find 21
countries in the top two clusters of “Net Commodity Exports to GDP.”
18
Despite failing the robustness test, Hong Kong SAR and Singapore (economies with exceptionally large values of
financial and trade openness) are grouped in a cluster with other economies with “relatively” high values of openness
(Panama, Jordan, Hungary, and Taiwan Province of China).
INTERNATIONAL MONETARY FUND 23
Table 3. Final Cluster Output
Financial Openness 1
(External A+L/GDP)
Trade Openness
(TX+TM)/GDP
Growth of Terms
of Trade
Export Share to
Euro Zone
Export Share
to U.S.
Export Share to
China, Mainland
Net Commodity
Export to GDP
Hong Kong SAR Singapore Venezuela Tunisia Mexico Hong Kong SAR Angola
Singapore Hong Kong SAR Azerbaijan Czech Rep Dominican Rep Angola Iraq
Panama Malaysia Angola Bosnia and HerzegovinaVenezuela Korea, Rep of Nigeria
Jordan Swaziland Algeria Hungary Guatemala Chile Kazakhstan
Hungary Estonia Russian Federation Morocco Costa Rica Kazakhstan Algeria
Taiwan Province of ChinaSlovak Rep Chile Poland Colombia Peru Azerbaijan
Estonia Hungary Colombia Romania Panama Vietnam Venezuela
Latvia Vietnam Argentina Croatia Nigeria Brazil Russia
Israel Thailand Indonesia Slovenia Iraq Thailand Chile
Malaysia Czech Rep Peru Algeria Jamaica Malaysia Vietnam
Jamaica Angola Romania Slovak Rep Israel Singapore Argentina
Chile Slovenia Ukraine Azerbaijan Angola Philippines Indonesia
Uruguay Jordan South Africa Bulgaria Peru Indonesia Peru
Bulgaria Bulgaria Brazil Turkey Algeria Uruguay Malaysia
Argentina Lithuania Kazakhstan Russia Pakistan Argentina Colombia
Slovenia Taiwan Province of ChinaArmenia Estonia China South Africa Uruguay
Iraq Ukraine Croatia Armenia Philippines Russia Costa Rica
Swaziland Latvia Estonia Latvia Jordan India Ukraine
Angola Tunisia Lithuania Lithuania Brazil Iraq South Africa
Croatia Bosnia and HerzegovinaBosnia and HerzegovinaKazakhstan Vietnam Pakistan Brazil
Slovak Rep Azerbaijan Latvia Egypt Malaysia Costa Rica Guatemala
Czech Rep Costa Rica Malaysia Nigeria Hong Kong SAR Jamaica Latvia
Kazakhstan Kazakhstan Poland Israel India Venezuela Mexico
Russia Jamaica Singapore Iraq Thailand Ukraine Bosnia and Herzegovina
South Africa Korea, Rep of Uruguay South Africa Korea, Rep of Panama Korea, Rep of
Tunisia Croatia Mexico Brazil Chile Israel Panama
Thailand Iraq Panama Chile Indonesia Colombia Dominican Rep
Azerbaijan Philippines Morocco Pakistan Singapore Egypt Egypt
Ukraine Poland Vietnam Ukraine South Africa Jordan Tunisia
Venezuela Israel Czech Republic Panama Armenia Dominican Rep Taiwan Province of China
Philippines Romania Slovenia Uruguay Uruguay Armenia Jamaica
Lithuania Morocco Hong Kong SAR India Argentina Algeria Estonia
Bosnia and HerzegovinaDominican Rep Hungary Peru Egypt Turkey Romania
Peru Armenia Slovak Republic Argentina Turkey Bosnia and HerzegovinaPoland
Morocco Chile Bulgaria Angola Azerbaijan Nigeria Slovenia
Korea, Rep of Panama China Philippines Russia Romania Pakistan
Vietnam Algeria Egypt Jamaica Lithuania Hungary Philippines
Armenia Guatemala Thailand Vietnam Morocco Morocco China
Costa Rica South Africa Dominican Republic Costa Rica Estonia Bulgaria Bulgaria
Poland Indonesia Israel China Bulgaria Mexico Turkey
Egypt Mexico Costa Rica Colombia Hungary Estonia Armenia
Algeria China Guatemala Korea, Rep of Ukraine Poland Croatia
Romania Russia Philippines Indonesia Croatia Azerbaijan Hungary
China Egypt Pakistan Thailand Romania Czech Rep Israel
Indonesia Uruguay Korea, Republic of Malaysia Czech Rep Slovak Rep Czech Rep
Turkey Turkey Tunisia Hong Kong SAR Latvia Tunisia India
Brazil Venezuela India Singapore Slovenia Guatemala Morocco
Colombia Peru Turkey Dominican Rep Slovak Rep Slovenia Hong Kong SAR
Dominican Rep India Taiwan Province of ChinaVenezuela Poland Latvia Thailand
Mexico Argentina Jordan Guatemala Tunisia Croatia Lithuania
Guatemala Pakistan Jamaica Mexico Kazakhstan Lithuania Jordan
Pakistan Colombia Swaziland Jordan Bosnia and HerzegovinaChina Singapore
India Brazil Iraq Swaziland Swaziland Swaziland Iraq
Nigeria Nigeria Nigeria Taiwan Province of ChinaTaiwan Province of ChinaTaiwan Province of ChinaNigeria
EMERGING MARKETS IN TRANSITION
24 INTERNATIONAL MONETARY FUND
Annex 2. Structural Reforms: Lessons from Four Case Studies19
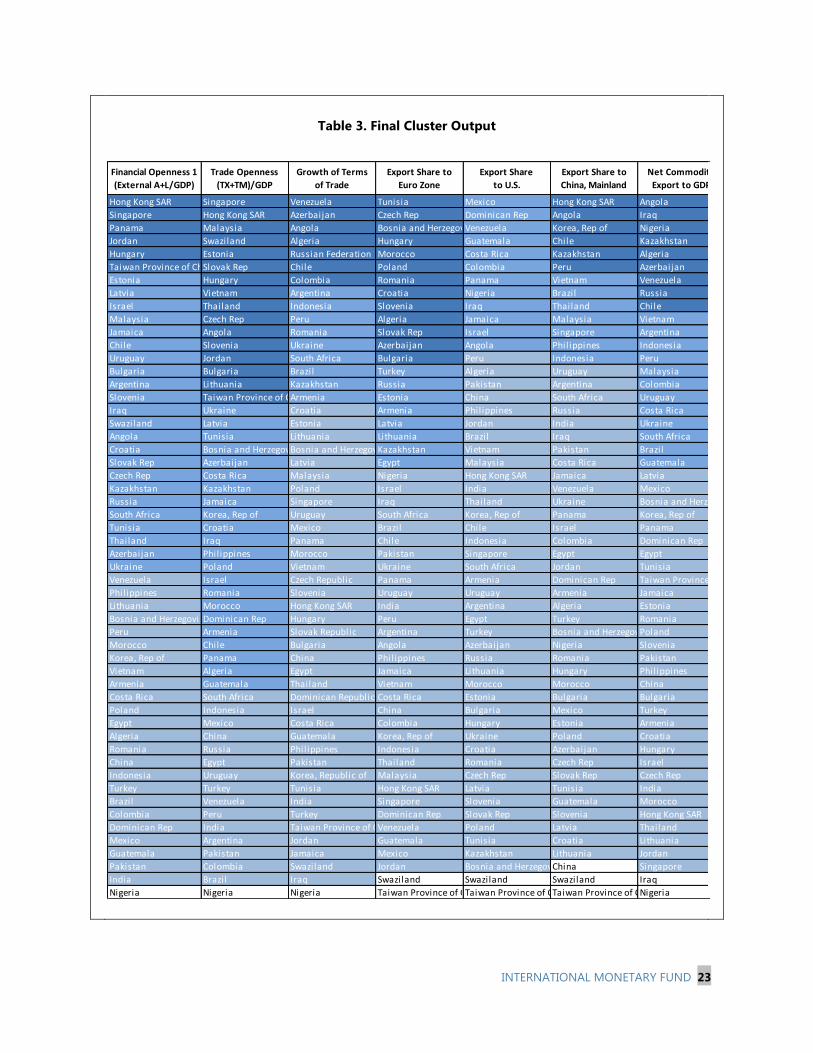
CHILE
Background: The contribution of factor accumulation
to growth has been broadly stable since the early
1990s, aided by increased labor force participation,
especially among women. Total factor productivity
(TFP), on the other hand, fell from an annual rate of
roughly 2½ percent in 1991-2000 to about ½ percent
in 2001-12, in part reflecting the aging of mining
operations, and despite strong terms of trade. Going
forward, growth will be constrained by subdued
copper prices and weaker working-age population
growth.
Reform priorities: Sustaining strong medium-term
potential growth will depend on efforts to boost TFP
and foster private investment. Education and labor
market reforms could yield simultaneously higher
productivity and wider distribution of growth benefits.
This will require improving access to high-quality
education and training and enhancing labor market
flexibility. Strengthening Chile’s energy generation and
infrastructure will also be crucial for improving
competitiveness and the enforcement of contracts.
CHINA
Background: China’s growth model has relied on
extensive factor accumulation and relocation of labor
from the countryside to factories. In recent years,
growth has moderated, even as investment has risen
and reliance on credit has increased, pointing to
diminishing returns on capital (the return on
investment fell from 25 percent in the early 1990s to
around 16 percent in recent years). Demographic
trends point to declining labor force growth, which
could hamper profitability in the private sector, leading to financial losses and deleveraging, which
would in turn generate an adverse feedback loop that hampers employment and growth.
19
Based on inputs by country teams, including Christian Ebeke, Jose D. Rodriguez and Yinqiu Lu.
0
1
2
3
4
5
6
7
0
1
2
3
4
5
6
7
1991-2000 2001-2012
TFP Labor Capital
Chile: Change in Growth Engines(average contribution to GDP growth rate; percentage points)
Sources: Central Bank of Chile, Ministry of Finance (Dipres) and Fund staff estimates
0.5
1
1.5
2
2.5
3
0
1
2
3
4
5
6
2002 2004 2006 2008 2010 2012 2014 2016 2018
Working-age population growth (in percent; RHS)
Copper (US dollars per pound)
US 10-year bond yield (in percent)
Chile: Growth Headwinds
Sources: National Statistical Institute (INE), World Economic Outlook (IMF), and Fund staff estimates.
4.0
2.43.3
5.8
6.2
2.7
-1
1
3
5
7
9
11
-1
1
3
5
7
9
11
2001-2008 2009-2012 2013-30
Human capital
Physical capital accumulation
TFP
GDP growth
China: Contribution to Growth by Input(In percentage points)
Source: IMF staff estimates.
INTERNATIONAL MONETARY FUND 25
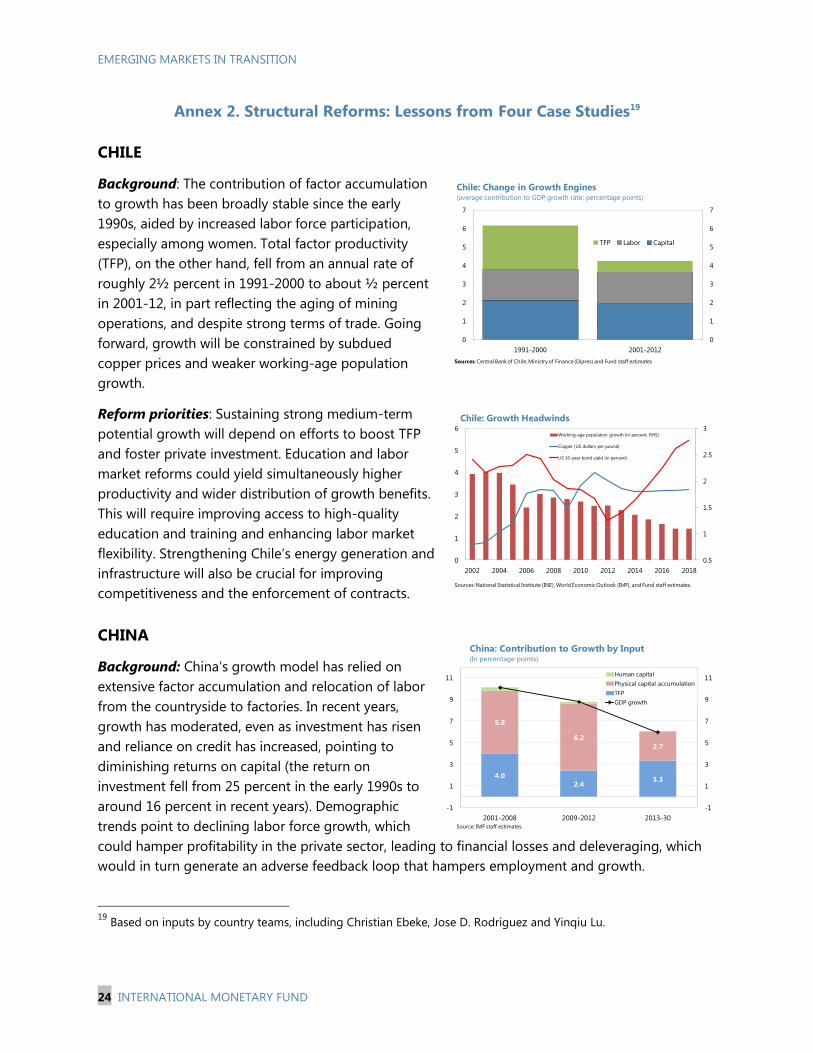
Reform priorities: Reforms are necessary to
rebalance China’s growth away from credit-led
investment and into consumption, while becoming
more reliant on TFP. This requires reforms in the
financial sector to contain the buildup of
vulnerabilities and excesses. Service sector reform
(deregulation and increasing the share of labor
employed in services) is necessary to lift
productivity growth. Hukou reform could support
the urbanization process and boost productivity
by enabling knowledge spillovers and specialization.
POLAND
Background: Economic liberalization and prudent
policies since 1989 paved the way for Poland’s
accession to the European Union in 2004. Thereafter,
Poland benefited significantly from the inflows of EU
structural funds, while continuing to expand financial
and trade linkages with the rest of the EU, including
successful integration into the German supply chain.
Despite Poland’s resilience following the global
financial crisis, potential growth is estimated to have
declined by ½–1 percent over 2009–12, reflecting a structurally lower capital accumulation (resulting
from reduced EU structural transfers) and structurally lower labor force contributions (resulting from
an increase in structural unemployment).
Reform priorities: Reforms should aim to boost
investment and employment, while preserving
productivity gains. Further capital market development
is necessary to support private investment, and should
be complemented by increased infrastructure
investment and privatization. There is room to boost
labor participation rates (especially among women)
and to improve education to address skill mismatches.
Reforms to better align special occupational pension
schemes (notably for miners and farmers) with the
regular pension system should help increase labor participation. Given Poland’s proximity to the
technological frontier, pure cost-competitiveness gains cannot last indefinitely—moving up the
value chain will require raising R&D spending, which is low relative to the country’s peers.
0.0
0.2
0.4
0.6
0.8
1.0
1.2
0.0
0.2
0.4
0.6
0.8
1.0
1.2
Service Sector Contestability Hukou Reform
Source: IMF staff estimates.1 Reforms envisage moving the national average of service sector employment share, contestability, and
nonagricultural hukou share of population to the level of Shanghai in 2010.
China Reform Payoffs: Potential Increase in Average TFP Growth1
(In percentage points)
-3
-2
-1
0
1
2
3
4
5
6
7
2000Q1 2001Q3 2003Q1 2004Q3 2006Q1 2007Q3 2009Q1 2010Q3 2012Q1
Total factor productivity (A*) Labor (L*)
Capital (K*) Potential real GDP growth
Poland: Contribution to potential growth(Year-on-Year percentage changes)
Sources: Polish authorities; and IMF Staff estimates
0
1
2
3
4
Japan US EU-27 Czech Hungary Poland Slovakia
Higher education
sector
Government
sector
Business enterprise sector
Gross domestic expenditure on R&D by sector*(as percentage of GDP)
Sources: Eurostat. (*) Data as of 2010.
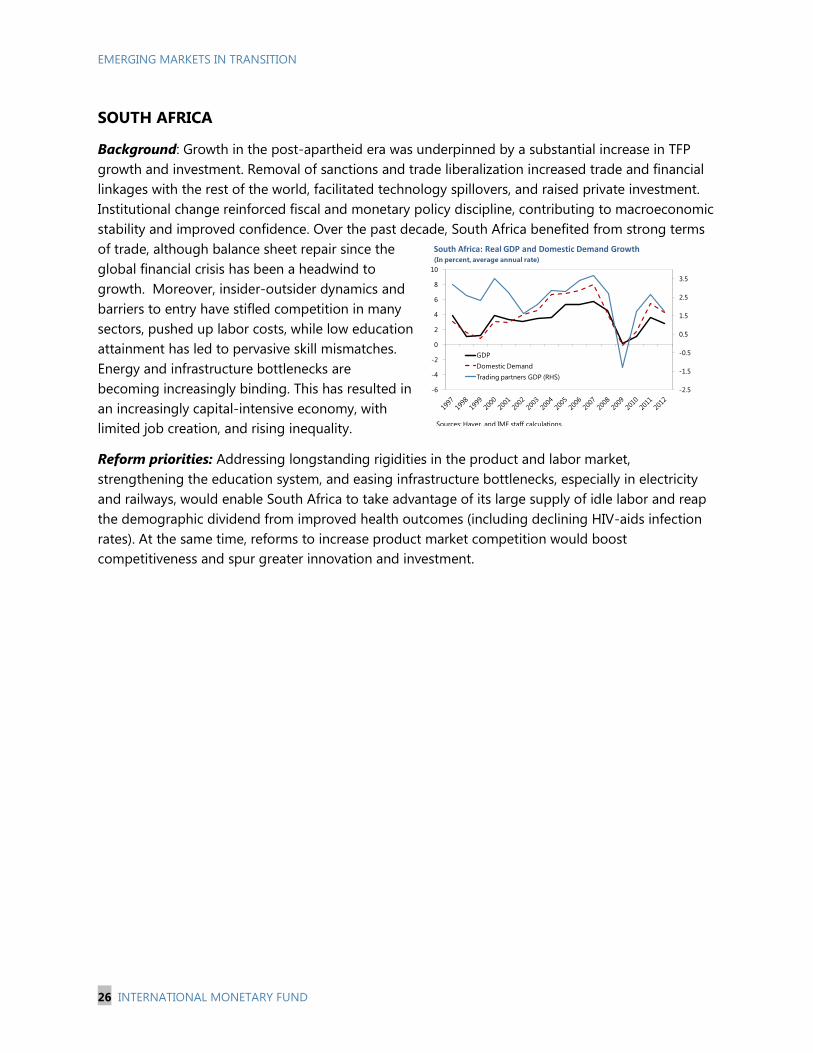
EMERGING MARKETS IN TRANSITION
26 INTERNATIONAL MONETARY FUND
SOUTH AFRICA
Background: Growth in the post-apartheid era was underpinned by a substantial increase in TFP
growth and investment. Removal of sanctions and trade liberalization increased trade and financial
linkages with the rest of the world, facilitated technology spillovers, and raised private investment.
Institutional change reinforced fiscal and monetary policy discipline, contributing to macroeconomic
stability and improved confidence. Over the past decade, South Africa benefited from strong terms
of trade, although balance sheet repair since the
global financial crisis has been a headwind to
growth. Moreover, insider-outsider dynamics and
barriers to entry have stifled competition in many
sectors, pushed up labor costs, while low education
attainment has led to pervasive skill mismatches.
Energy and infrastructure bottlenecks are
becoming increasingly binding. This has resulted in
an increasingly capital-intensive economy, with
limited job creation, and rising inequality.
Reform priorities: Addressing longstanding rigidities in the product and labor market,
strengthening the education system, and easing infrastructure bottlenecks, especially in electricity
and railways, would enable South Africa to take advantage of its large supply of idle labor and reap
the demographic dividend from improved health outcomes (including declining HIV-aids infection
rates). At the same time, reforms to increase product market competition would boost
competitiveness and spur greater innovation and investment.
-2.5
-1.5
-0.5
0.5
1.5
2.5
3.5
-6
-4
-2
0
2
4
6
8
10
South Africa: Real GDP and Domestic Demand Growth(In percent, average annual rate)
GDP
Domestic Demand
Trading partners GDP (RHS)
Sources: Haver, and IMF staff calculations.
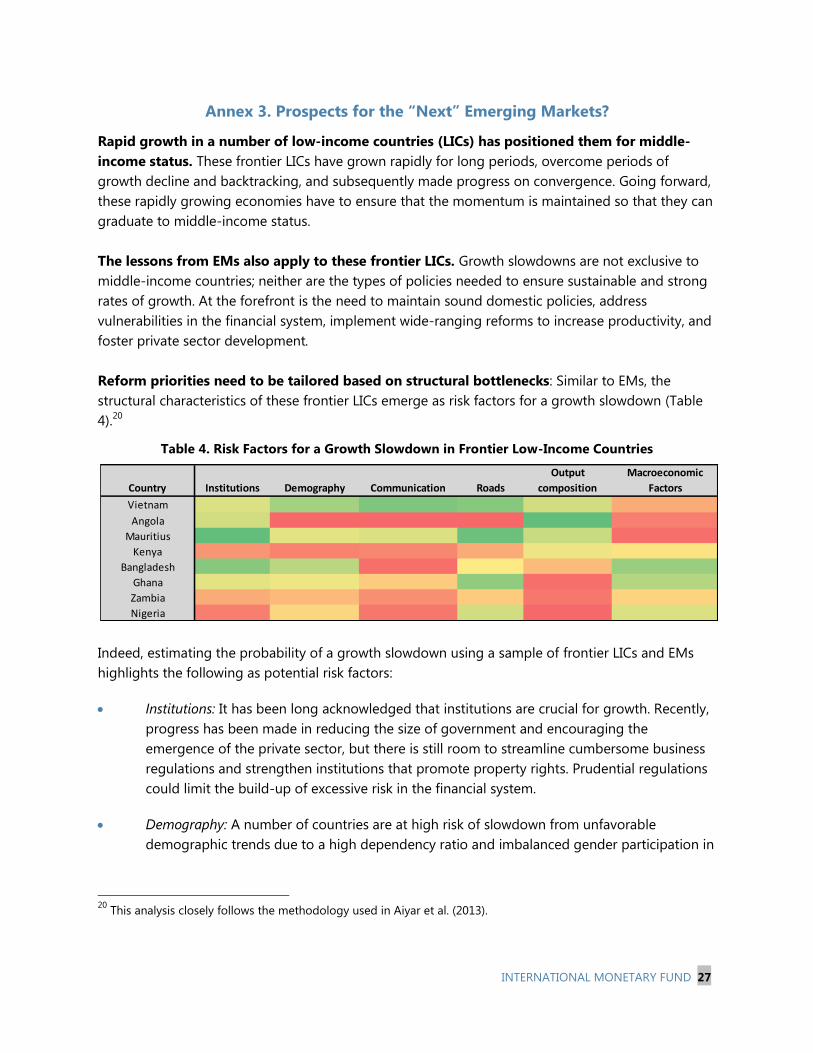
INTERNATIONAL MONETARY FUND 27
Annex 3. Prospects for the “Next” Emerging Markets?
Rapid growth in a number of low-income countries (LICs) has positioned them for middle-
income status. These frontier LICs have grown rapidly for long periods, overcome periods of
growth decline and backtracking, and subsequently made progress on convergence. Going forward,
these rapidly growing economies have to ensure that the momentum is maintained so that they can
graduate to middle-income status.
The lessons from EMs also apply to these frontier LICs. Growth slowdowns are not exclusive to
middle-income countries; neither are the types of policies needed to ensure sustainable and strong
rates of growth. At the forefront is the need to maintain sound domestic policies, address
vulnerabilities in the financial system, implement wide-ranging reforms to increase productivity, and
foster private sector development.
Reform priorities need to be tailored based on structural bottlenecks: Similar to EMs, the
structural characteristics of these frontier LICs emerge as risk factors for a growth slowdown (Table
4).20
Table 4. Risk Factors for a Growth Slowdown in Frontier Low-Income Countries
Indeed, estimating the probability of a growth slowdown using a sample of frontier LICs and EMs
highlights the following as potential risk factors:
Institutions: It has been long acknowledged that institutions are crucial for growth. Recently,
progress has been made in reducing the size of government and encouraging the
emergence of the private sector, but there is still room to streamline cumbersome business
regulations and strengthen institutions that promote property rights. Prudential regulations
could limit the build-up of excessive risk in the financial system.
Demography: A number of countries are at high risk of slowdown from unfavorable
demographic trends due to a high dependency ratio and imbalanced gender participation in
20
This analysis closely follows the methodology used in Aiyar et al. (2013).
Country Institutions Demography Communication Roads
Output
composition
Macroeconomic
Factors
Vietnam
Angola
Mauritius
Kenya
Bangladesh
Ghana
Zambia
Nigeria
EMERGING MARKETS IN TRANSITION
28 INTERNATIONAL MONETARY FUND
the work force. To address this, policy priorities would be combating gender discrimination
and pursuing inclusive education and labor market reforms.
Infrastructure (communications and roads): The positive impact of infrastructure on growth,
especially when countries are moving toward middle-income status, is well established. That
said, most frontier LICs stand a higher risk of a growth slowdown arising from lack of
infrastructure including communications, transport, and a range of other needs, including
energy generation.
Structural transformation (output composition): As an economy develops, it undergoes a
structural transformation as labor moves from the initially dominant agricultural sector to
manufacturing and services. This exposes the economy to a concomitant risk of slowdown.
Managing this risk would involve reforms that enhance productivity, particularly in the
nonagricultural sector
Macroeconomic factors: A large variety of macroeconomic factors are associated with
economic growth, although this analysis focuses on the risks from financial openness and
overinvestment. Countries that have benefited from strong capital inflows need to be
mindful of the risk of sudden stops that may also lower potential output levels permanently.
(Cerra and Saxena, 2008). Also, overinvestment in certain sectors driven in part by high
capital flows and commodity price gains will need to be scaled back and redirected to
increase productivity in other sectors.
The lessons from EMs apply to these frontier LICs. These economies need to address vulnerabilities
and maintain good domestic policies so that they can ensure sustainable growth and manage the
transition to middle-income status while the global economy is going through transitions.
INTERNATIONAL MONETARY FUND 29
ANALYTICAL APPENDIX
A. Supply-Side Decomposition of Growth and Estimating Potential Growth21
Potential growth rates are derived following a growth accounting exercise based on the standard
Cobb-Douglas production function:
(1)
where represents domestic output in period t, the physical capital stock, the employed labor
force, human capital per worker, and total factor productivity (TFP).22
Using equation (1), we can decompose GDP growth as follows (denoting by the growth rate of a
variable x):
(2)
We use annual data from Penn World Table 7.1 (PWT) for the period from 1980 until 2010 and other
sources—mainly the IMF’s World Economic Outlook (WEO) database—for the subsequent years.
Specifically, data on output, measured by real GDP, are obtained from PWT until 2010 and extended
using WEO data for 2011–12. The capital stock series is constructed with investment data from the
PWT using the perpetual inventory method until 2010, and investment data from WEO for 2011–12.
Our labor input series (measured by employment) refers to inputs effectively used in the production
process. The employment series is obtained using the labor force series from PWT and the
employment rate (one minus unemployment rate) from WEO. For 2011–12, we assume that the
labor force rises in line with the UN Population Projection database (constant fertility scenario) for
individuals age 15 and above. To get quality-adjusted labor, we follow Bils and Klenow (2000) and
Ferreira, Pessoa, and Veloso (2013) to model human capital as a function of the average years of
schooling, using data from Barro and Lee (2010).23
The structural slowdown is represented by the change in the potential growth rate from a historical
average, e.g., 2000-12, and 2013-18. The cyclical part of the slowdown is the residual from the
change in actual growth rates and the structural change between 2012-13 and 2010-11.
21
For more details, see Tsounta (2014).
22 We assume a capital share of output, α of 0.40 (in line with Gollin, 2002). Our main findings, however, are robust to
a range of reasonable values for this parameter.
23 When investment data for 2011-12 are not available from the WEO, we use nominal growth rates in investment
and deflate by CPI. When education data are not available we use those of a similar country.
EMERGING MARKETS IN TRANSITION
30 INTERNATIONAL MONETARY FUND
To estimate potential growth rates, we first estimate TFP using equation (1). We then obtain trend
series for capital, labor, human capital, and TFP (KT, L
T, h
T, A
T) for the period 1980–2017 using the
Hodrick-Prescott (for both λ = 6.25 and λ = 100), Baxter and King (1999), and Christiano and
Fitzgerald (2013) filters.24
The following assumptions about the behavior of K, L, h, and A in 2013–17
are made: (i) we assume that both capital and TFP will grow by the average annual rate observed in
2000–12; and (ii) to project labor input, we use projected unemployment rates from the WEO and
we assume that the labor force grows in line with the working-age population from the UN
Population Projection database and labor force participation rates remain constant at their latest
observation. Finally, our measure of human capital increases at the 2005–10 average annual growth
rate. Potential output growth ( is then computed as follows:
B. Impact of External Factors on Emerging Market Growth25
The empirical approach uses a standard setup for analyzing determinants of growth: fixed effects
growth regressions using macroeconomic panel data averaged over consecutive five-year periods.26
Time fixed effects (dummies for each five-year period) are introduced to control for changes in
global conditions not captured by the model. The regressions take the following general form:
where:
: First difference in the log of the real per capita GDP, i.e., per capita GDP growth
: Variables measuring external conditions. We focus on three:
External demand, measured by trading partner growth (the two terms are used
interchangeably)
International financing conditions interacted with the degree of financial openness,
measured by changes in the real interest rate on the 10-year U.S. T-bond.
Change in the log of terms of trade
: standard growth regressors (initial level of income, population growth, investment ratio, etc.)
and other controls.
: country fixed effect
: time fixed effect
24
We include projections through 2019 to avoid the end-of-sample bias.
25 For more details, see Culiuc (2014).
26 The trade section builds and expands on Arora and Vamvakidis (2005), who analyze the growth impact of trading
partner growth. Recent studies building on the same approach include Drummond and Ramirez (2009) and Dabla-
Norris et al. (2013).
INTERNATIONAL MONETARY FUND 31
The panel covers the period 1962-2011, and regressions are restricted to countries with a population
of at least 2 million people, which includes 129 countries: 66 EMs, 21 AMs, and 42 LICs.27
Following Arora and Vamvakidis (2005), partner growth is computed as the weighted average
growth rate using as weights each partner’s share in the reporting country’s export basket. Export
weights are computed as five-year averages from the IMF’s Direction of Trade Statistics (DoTS)
database for 1960-2011. Therefore, export partner growth for country in year is computed as
follows:
In addition, we recover export weights – and therefore partner growths – for countries that started
reporting to DoTS relatively recently (e.g., China since 1978, Bulgaria since 1981) by using partners’
import data. AM partner growth rates are computed analogously. However, EM partner growth is
computed in two stages. First, an index is computed in a manner analogous to the one for AM
partners. Second, the common component of AM and EM partner growths is excluded by running a
simple OLS regression of EM partner growth on AM partner growth and only using residuals for
subsequent analysis.
Other variables in the model (and sources from which they are derived) include:
GDP growth series and commodity dependence come from the World Bank’s World
Development Indicators. A country is identified as a commodity exporter if net commodity
exports (as measured by fuels and metals exports) averaged over 10 percent of GDP in the years
2002-11.
The IMF’s International Financial Statistics is the source for select macro variables (current
account balance/GDP, investment/GDP, terms of trade), as well as the real interest rate on the
10-year U.S. T-bond, which is used to measure the international cost of capital.
Trade data come from the DoTS.
Financial integration is computed from the updated and extended version of the dataset
constructed by Lane and Milesi-Ferretti (2007) as the sum of total external assets and total
external liabilities net of international reserves.
The exchange rate regime classification comes from IMF’s AREAER Database.
The PRIO Armed Conflict Dataset is used to identify episodes of war.
27
The 2 million population threshold is used in order to eliminate small states, which are much more susceptible to
show large output variation in response to events that are hard to capture in a growth regression framework (e.g.,
the bankruptcy of a single company, natural disasters). The population threshold is close to the one used in the 2013
IMF board paper on macroeconomic issues in small states (1.5 million people).
EMERGING MARKETS IN TRANSITION
32 INTERNATIONAL MONETARY FUND
C. Domestic and External Factors Explaining the Current Slowdown28
Data sources and sample: The analysis is based on staff calculations using data from the October
2013 WEO, the GEE and AREAER databases, and from the vulnerability exercise. Additionally, public
sources (Bloomberg, IFS, and HAVER) are used. The sample uses annual data for 2011, 2012 and
2013 as well as initial conditions for 2010.
Regression analysis and variables: The EM slowdown regressions are simple pooled panel OLS.
Country fixed effects were not included to allow for country-specific time-invariant initial conditions.
Year fixed effects were also excluded due to the short time span of the sample, but changes in
global factors/conditions are captured through the change in VIX index variable. The specification is
as below (see Fayad and Perrelli (2014) for results):
The dependent variable is yearly real GDP growth rate. Domestic factors include policy variables
and fundamentals, namely fiscal policy measured by the change in the cyclically adjusted primary
balance to potential GDP and the exchange rate regime.29
Initial conditions, all measured in 2010,
include REER overvaluation, the output gap and a measure for financial openness. We interact
initial conditions (FO) with fundamentals (peg). External factors include a trading partner’s real
import demand.30
Global conditions or global risk aversion are measured by the change in the VIX
index. Other factors that were controlled for and that did not pass the significance test include (i)
whether or not a country is a commodity exporter; (ii) monetary policy measured by a change in the
policy rate; and (iii) additional external measures (such as terms of trade and the current account
balance to GDP, as well we the interaction of terms of trade with net commodity exports to GDP).
28
For more details, see Fayad and Perrelli (2014).
29 We use a peg dummy equal to one when the exchange rate classification is below or equal to 8 (i.e., for all
classifications except floats and free floats).
30 Given the increased importance of EM-EM trade, we check the robustness of our results to potential circularity
between the dependent variable (EM growth) and our measure of external demand (which includes all trading
partners). For this purpose, we separate import demand from advanced economies and that from EMs, and include
them separately in the regression. Our measure for EM import demand is the part of EM import demand that is not
explained by AMs’ import demand. Results, not reported here, show the robustness of our findings to this
disaggregation.
tittii
itititi
conditionsGlobalfactorsDomesticconditionsInitial
conditionsInitialconditionsExternalfactorsDomesticY
,,2010,
2010,,,,
***
***
INTERNATIONAL MONETARY FUND 33
REFERENCES
Acemoglu, D., P. Aghion, and F. Zilibotti, 2006, “Distance to Frontier, Selection, and Economic
Growth.” Journal of the European Economic Association, Vol. 4, No. 1, pp. 37-74.
Aiyar, S., R. Duval, D. Puy, Y. Wu, and L. Zhang, 2013, “Growth Slowdowns and the Middle-income
Trap,” IMF Working Paper WP/13/71. (Washington)
Arnold, J., G. Nicoletti, and S. Scarpetta. 2011, “Does Anti-competitive Regulation Matter for
Productivity? Evidence from European Firms,” Discussion Paper 551, Institute for the Study of
Labor (IZA), Bonn.
Arora, V., and A. Vamvakidis, 2005, “How Much Do Trading Partners Matter for Economic Growth?”
IMF Staff Papers, Vol. 52, No. 1, pp. 24-40.
Basu, S., and J. Fernald, 2001, “Why Is Productivity Procyclical? Why Do We Care?” In New
Developments in Productivity Analysis, ed. by Charles R. Hulten, Edwin R. Dean, and Michael J.
Harper (Cambridge, Massachusetts: National Bureau of Economic Research).
Barnes, S., R. Bouis, P. Briard, S. Dougherty, and M. Eris, 2011, “The GDP Impact of Reform: A Simple
Simulation Framework,” OECD Economics Department Working Paper No. 834 (Paris: OECD
Publishing).
Barro, R., and J. Lee, 2010, “A New Data Set of Educational Attainment,“ NBER Working Paper No.
15902 (Cambridge, Massachusetts: National Bureau of Economic Research).
Baxter, M., and R. G. King, 1999, “Measuring Business Cycles: Approximate Band-Pass Filters for
Economic Time Series,” The Review of Economics and Statistics, Vol. 81, No. 4, pp. 575–93.
Berg, A., J. Ostry, and J. Zettelmeyer, 2012, “What Makes Growth Sustained?” Journal of Development
Economics, Vol. 98, No. 2, pp. 149–66.
Bils, M., and P. J. Klenow, 2000, “Does Schooling Cause Growth?” American Economic Review, Vol. 90,
No. 5, pp. 1160–183.
Blanchard, O. J., M. Das, and H. Faruqee, 2010, “The Initial Impact of the Crisis on Emerging Market
Countries,” Brookings Papers on Economic Activity, Spring, pp. 263-307.
Christiano, L. J., and T. J. Fitzgerald, 2003, “The Band Pass Filter,” International Economic Review, Vol.
44, No. 2, pp. 435–65.
Culiuc, A., 2014, “External Factors and Medium-term Economic Growth,” IMF Working Paper
(forthcoming).
EMERGING MARKETS IN TRANSITION
34 INTERNATIONAL MONETARY FUND
Dabla-Norris, M. E., G. Ho, K. Kochhar, A. Kyobe, and R. Tchaidze, 2013, “Anchoring Growth: The
Importance of Productivity-Enhancing Reforms in Emerging Market and Developing Economies,”
Staff Discussion Note 13/8 (Washington).
Di Giovanni, J., and J. Shambaugh, 2006. “The Impact of Foreign Interest Rates on the Economy: The
Role of the Exchange Rate Regime” IMF Working Paper 06/37 (Washington).
Drummond, P., and G. Ramirez, 2009. “Spillovers From the Rest of the World into Sub-Saharan
African Countries” IMF Working Paper 09/155 (Washington).
Easterly, W., and R. Levine, 2001, “What Have We Learned from a Eecade of Empirical Research on
Growth? It's Not Factor Accumulation: Stylized Facts and Growth Models,” World Bank Economic
Review, Vol. 15, No. 2, pp. 177-219.
Fayad, G., and R. Perrelli, 2014, “Growth Surprises and Synchronized Slowdown in Emerging
Markets—An Empirical Investigation” IMF Working Paper (forthcoming).
Ferreira, P., S. De Abreu Pessoa, and F. A. Veloso, 2013, “On the Evolution of Total Factor Productivity
in Latin America,” Economic Inquiry, Vol. 51, No. 1, pp. 16–30.
Frankel, J., and N. Roubini, 2001, “The Role of Industrial Country Policies in Emerging Market Crises,”
NBER Working Paper 8634 (Cambridge, Massachusetts: National Bureau of Economic Research).
Gao, Y. and Z. Zhang, 2014, “The State of Emerging Markets: A New Perspective on Clusters and
Taxonomies,” IMF Working Paper (forthcoming).
Gollin, D., 2002, “Getting Income Shares Right,” Journal of Political Economy, Vol. 110, No. 2, pp.
458–74.
Heston, A., R. Summers, and B. Aten, 2012, Penn World Table Version 7.1, Center for International
Comparisons of Production, Income and Prices at the University of Pennsylvania, July.
Hsieh, C., and P. J. Klenow. “Misallocation and Manufacturing TFP in China and India,” The Quarterly
Journal of Economics, Vol. 124, No. 4, pp. 1403-448.
Inter-American Development Bank (IDB), 2013 “Rethinking Reforms: How Latin America and the
Caribbean Can Escape Suppressed World Growth” (Washington: IDB).
International Monetary Fund (IMF), 2006, “Asia Rising: Patterns of Economic Development and
Growth,” in World Economic Outlook, September (Washington).
———, 2008, “Structural Reforms and Economic Performance in Advanced and Developing
Countries,” IMF Research Department (Washington).
———, 2013, World Economic Outlook, April. (Washington).
INTERNATIONAL MONETARY FUND 35
———, 2014a, Regional Economic Outlook: Asia and Pacific, April (Washington).
———, 2014b, Regional Economic Outlook: Western Hemisphere, April (Washington).
———, 2014c, World Economic Outlook, April (Washington).
———, 2014d, Spillover Report, forthcoming.
Lora, E., and C. Pagés. 2011, “Face-to-Face with Productivity,” Finance and Development, Vol. 48, No.
1.
Reinhart, C., and V. Reinhart, 2001, “What Hurts Most? G-3 Exchange Rate or Interest Rate Volatility,”
NBER Working Paper 8535 (Cambridge, Massachusetts: National Bureau of Economic Research).
Reinhart, C., G. Calvo, E. Fernández-Arias, and E. Talvi, 2001, “The Growth-Interest Rate Cycle in the
United States and its Consequences for Emerging Markets,” Research Department Publication
4279 (Washington: Inter-American Development Bank).
Sosa, S., E. Tsounta, and H.S. Kim, 2013, “Is the Growth Momentum in Latin America Sustainable?”
IMF Working Paper No. 13/109 (Washington).
Tompson, W., and T. Dang, 2010, “Advancing Structural Reforms in OECD Countries: Lessons from
Twenty Case Studies,” ECO/WKP 13, Organization for Economic Cooperation and Development.
Tsangarides, C. G., 2012, “Crisis and Recovery: Role of the Exchange Rate Regime in Emerging
Market Economies,” Journal of Macroeconomics, Vol. 34, pp. 470–88.
Tsounta, E., 2014, “Slowdown in Emerging Markets: A Sign of a Bumpy Road Ahead?” IMF Working
Paper (forthcoming).
World Bank, 2008, Unleashing Prosperity: Productivity Growth in Eastern Europe and the Former
Soviet Union (Washington: World Bank).
———, 2013, Doing Business 2014: Understanding Regulations for Small and Medium-Size Enterprises
(Washington: World Bank).


![Emerging Prospects of Bio-Digital City As an Innovative Urban …Slide]Seongju Chang.pdf · 2018-10-26 · Emerging Prospects of Bio-Digital City As an Innovative Urban Paradigm Oct](https://img.pdfslide.us/doc/110x75/5ee3705cad6a402d666d4e2c/emerging-prospects-of-bio-digital-city-as-an-innovative-urban-slideseongju-changpdf.jpg)