Embed Size (px)
Citation preview
11
Emerging Markets in FocusFIDELITY QUARTERLY INTERNATIONAL UPDATE
Presented byMatt GodfreyVice President, Investment Product
Jake WeinsteinSenior Analyst, Asset Allocation Research
Heather KnightRegional Brokerage Consultant, Personal Investing
September 2016
22
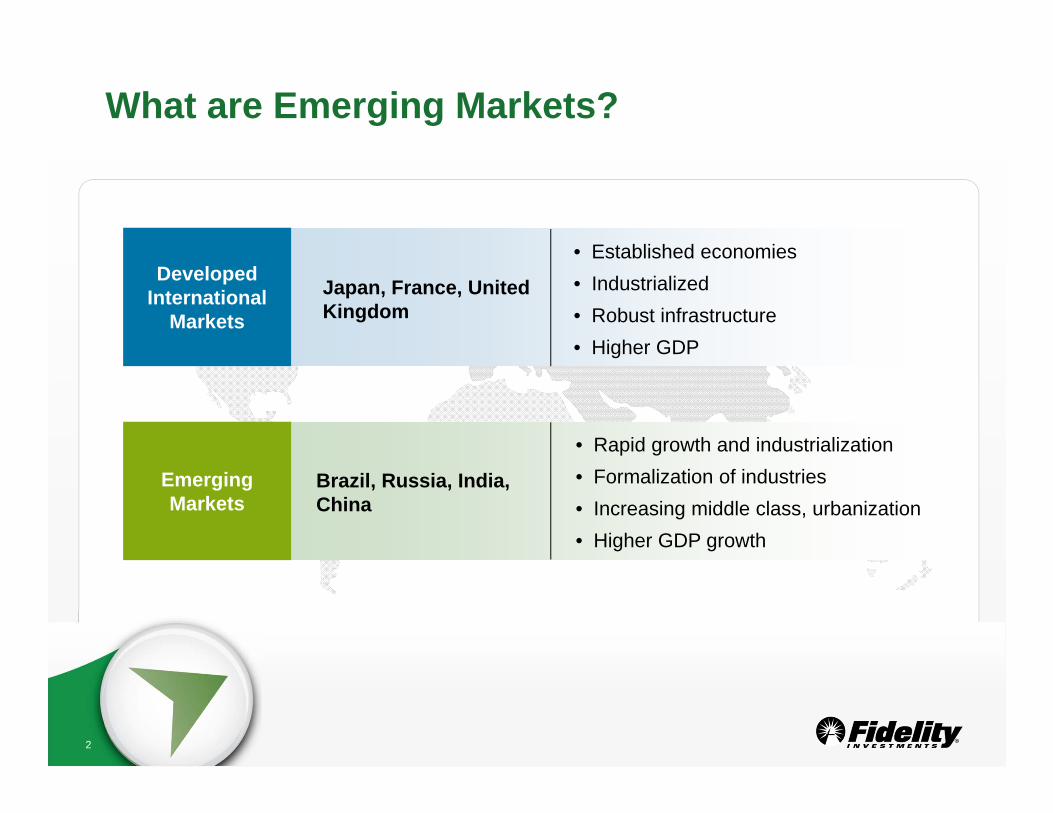
What are Emerging Markets?
Japan, France, United Kingdom
• Established economies• Industrialized• Robust infrastructure• Higher GDP
Developed International
Markets
Brazil, Russia, India, China
• Rapid growth and industrialization• Formalization of industries• Increasing middle class, urbanization• Higher GDP growth
Emerging Markets
33
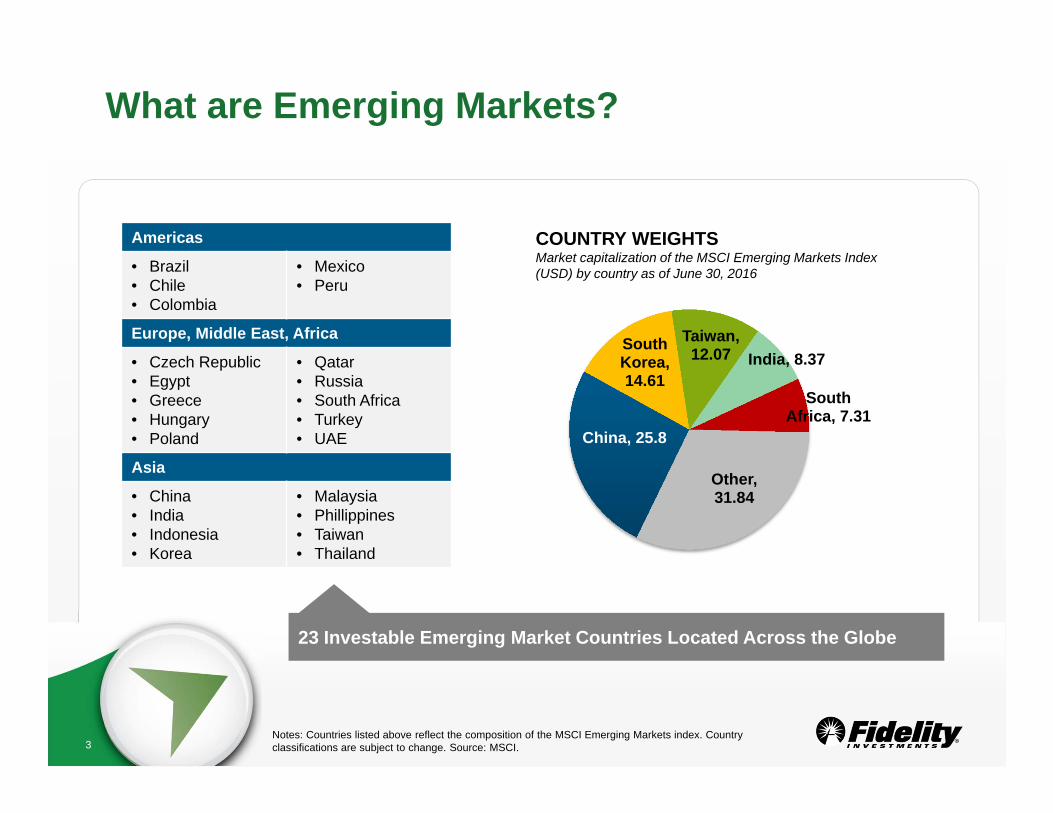
What are Emerging Markets?
China, 25.8
South Korea, 14.61
Taiwan, 12.07 India, 8.37
South Africa, 7.31
Other, 31.84
Americas
• Brazil• Chile• Colombia
• Mexico• Peru
Europe, Middle East, Africa
• Czech Republic• Egypt• Greece• Hungary• Poland
• Qatar• Russia• South Africa• Turkey• UAE
Asia
• China• India• Indonesia• Korea
• Malaysia• Phillippines• Taiwan• Thailand
COUNTRY WEIGHTSMarket capitalization of the MSCI Emerging Markets Index (USD) by country as of June 30, 2016
Notes: Countries listed above reflect the composition of the MSCI Emerging Markets index. Country classifications are subject to change. Source: MSCI.
23 Investable Emerging Market Countries Located Across the Globe
44
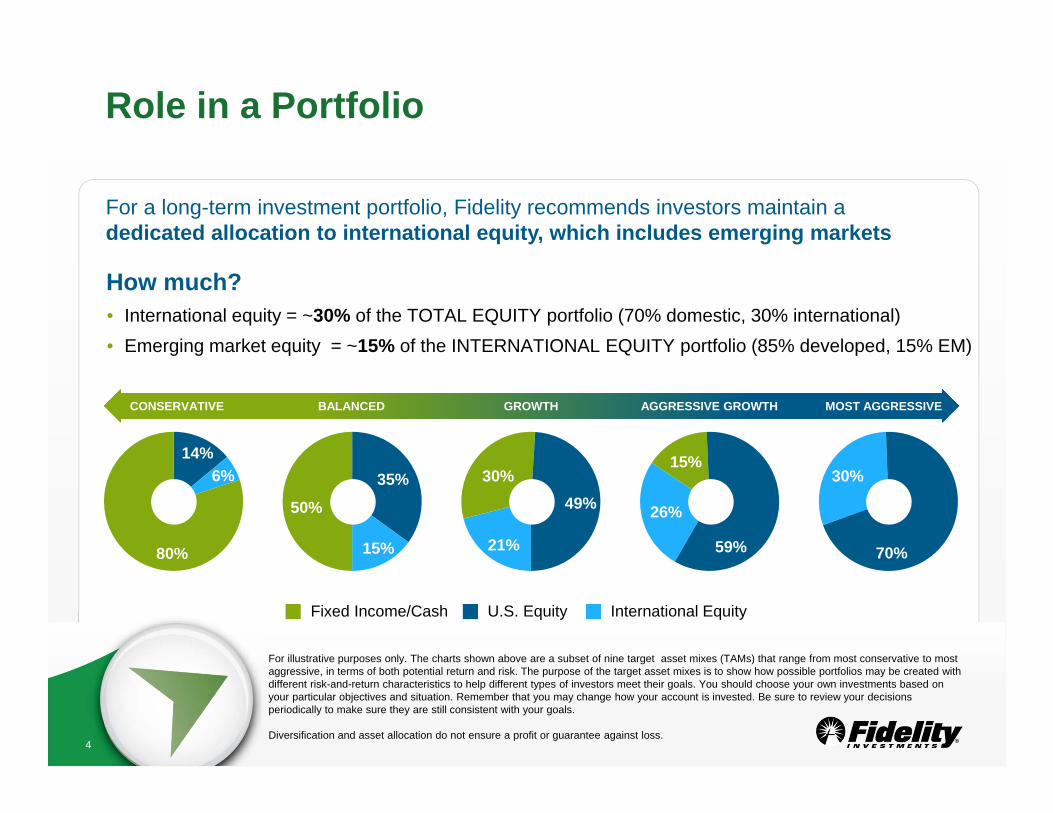
Role in a Portfolio
For illustrative purposes only. The charts shown above are a subset of nine target asset mixes (TAMs) that range from most conservative to most aggressive, in terms of both potential return and risk. The purpose of the target asset mixes is to show how possible portfolios may be created with different risk-and-return characteristics to help different types of investors meet their goals. You should choose your own investments based on your particular objectives and situation. Remember that you may change how your account is invested. Be sure to review your decisions periodically to make sure they are still consistent with your goals.
Diversification and asset allocation do not ensure a profit or guarantee against loss.
For a long-term investment portfolio, Fidelity recommends investors maintain a dedicated allocation to international equity, which includes emerging markets
How much? • International equity = ~30% of the TOTAL EQUITY portfolio (70% domestic, 30% international)• Emerging market equity = ~15% of the INTERNATIONAL EQUITY portfolio (85% developed, 15% EM)
U.S. Equity International Equity
35%
15%
50%
21%
30%49% 26%
15%
59%
30%
70%
14%6%
80%
CONSERVATIVE BALANCED GROWTH AGGRESSIVE GROWTH MOST AGGRESSIVE
Fixed Income/Cash
55
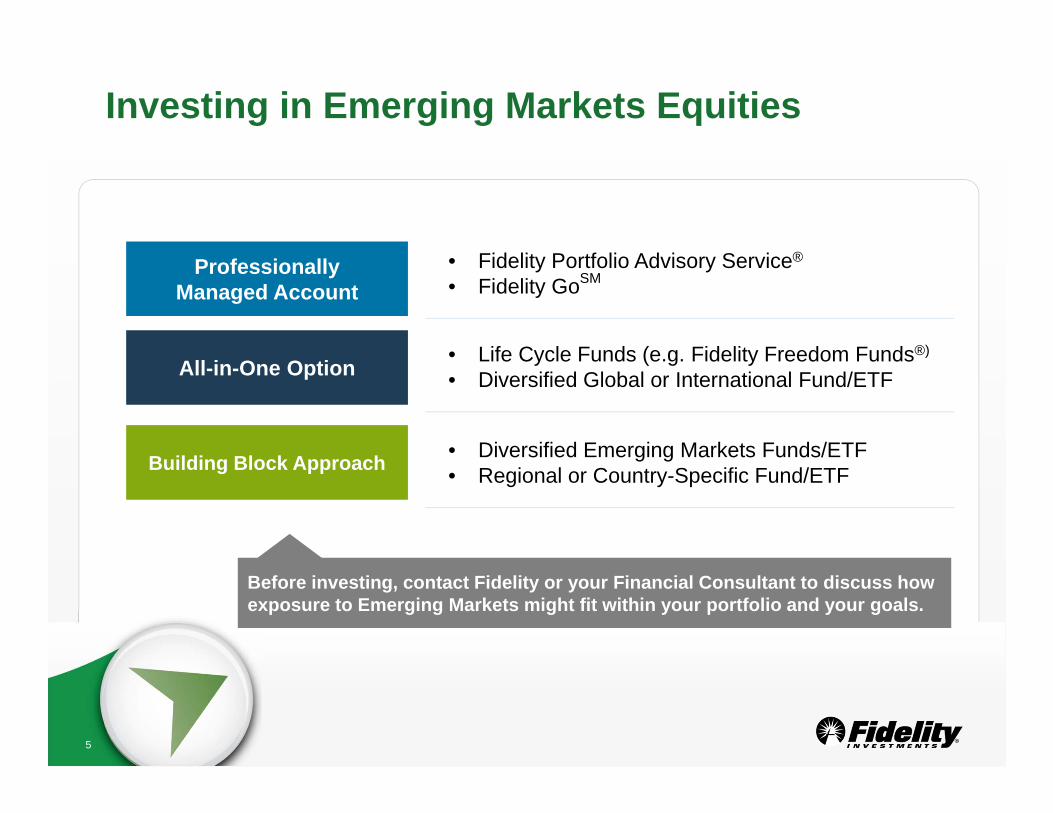
Investing in Emerging Markets Equities
• Fidelity Portfolio Advisory Service®
• Fidelity GoSMProfessionally Managed Account
Before investing, contact Fidelity or your Financial Consultant to discuss how exposure to Emerging Markets might fit within your portfolio and your goals.
• Life Cycle Funds (e.g. Fidelity Freedom Funds®)
• Diversified Global or International Fund/ETFAll-in-One Option
• Diversified Emerging Markets Funds/ETF• Regional or Country-Specific Fund/ETFBuilding Block Approach
66
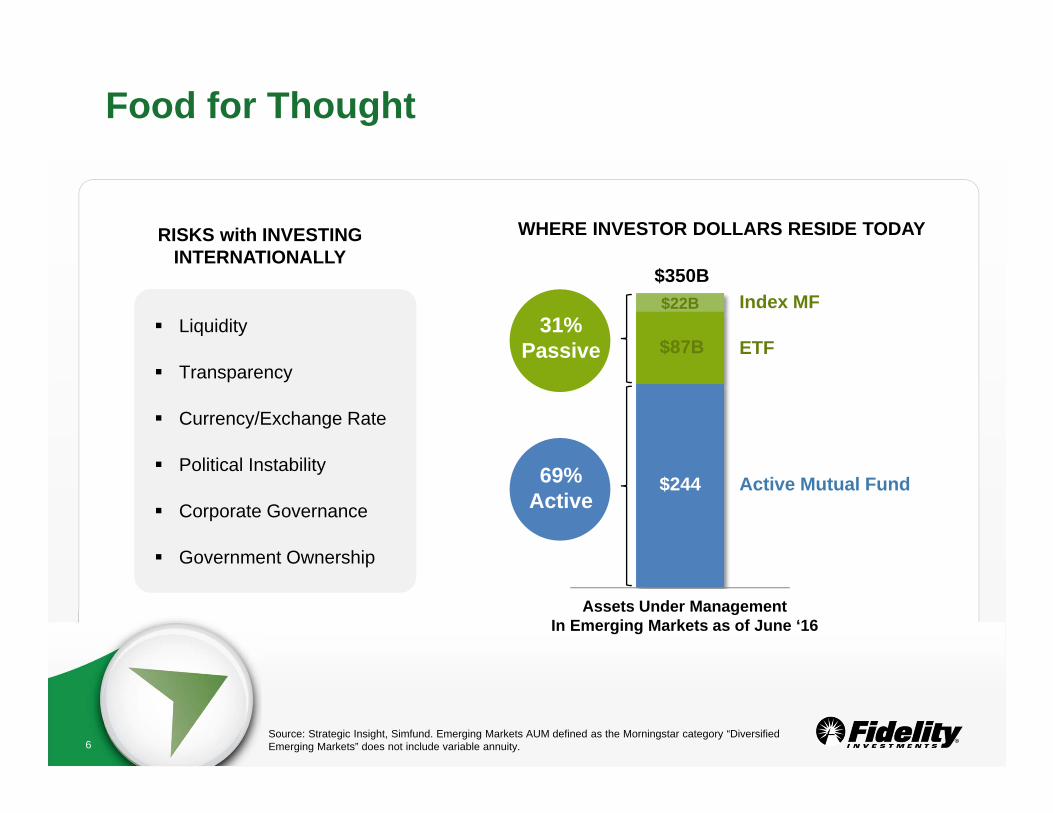
Food for Thought
Liquidity
Transparency
Currency/Exchange Rate
Political Instability
Corporate Governance
Government Ownership
Liquidity
Transparency
Currency/Exchange Rate
Political Instability
Corporate Governance
Government Ownership
RISKS with INVESTING INTERNATIONALLY
WHERE INVESTOR DOLLARS RESIDE TODAY
Assets Under ManagementIn Emerging Markets as of June ‘16
$350BIndex MF
31% Passive ETF
Active Mutual Fund69% Active
Source: Strategic Insight, Simfund. Emerging Markets AUM defined as the Morningstar category “Diversified Emerging Markets” does not include variable annuity.
$87B
$22B
$244
7
Emerging Markets: Improved Cyclical Trends After a Long Dry SpellJake WeinsteinSenior Analyst, Asset Allocation Research
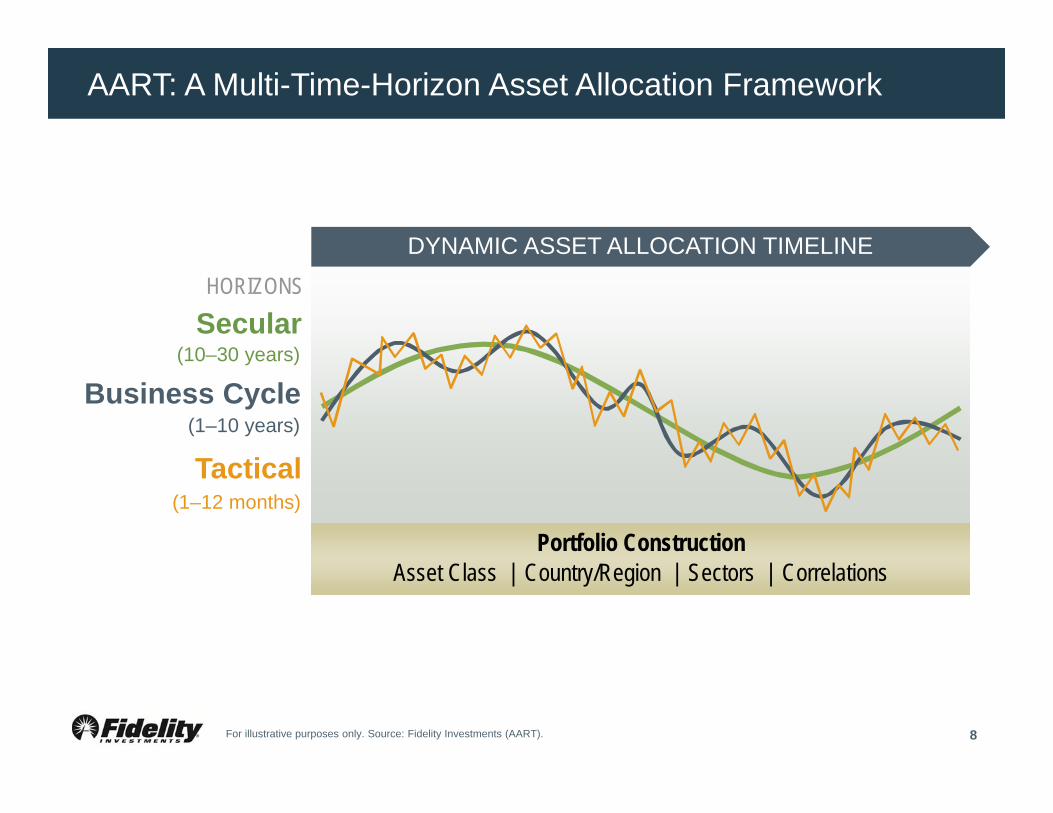
AART: A Multi-Time-Horizon Asset Allocation Framework
8
DYNAMIC ASSET ALLOCATION TIMELINE
Business Cycle(10–30 years)
SecularHORIZONS
(1–10 years)
Tactical(1–12 months)
Portfolio ConstructionAsset Class | Country/Region | Sectors | Correlations
For illustrative purposes only. Source: Fidelity Investments (AART).
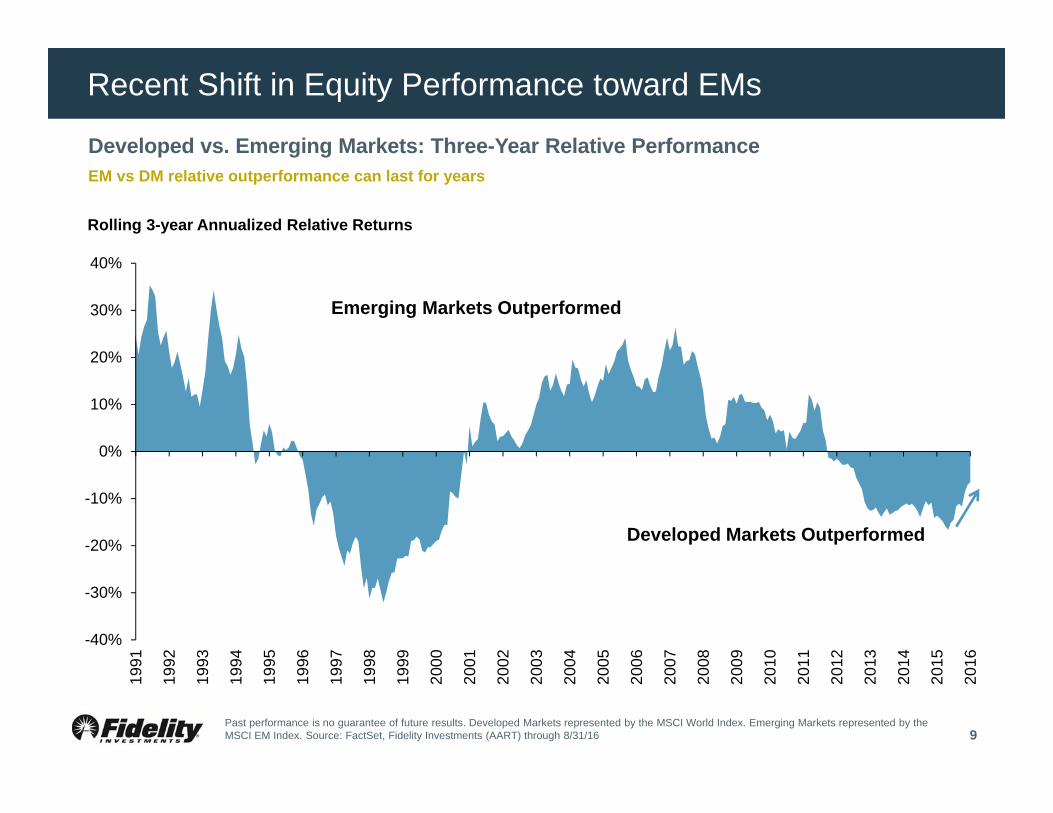
Recent Shift in Equity Performance toward EMs
9
-40%
-30%
-20%
-10%
0%
10%
20%
30%
40%
1991
1992
1993
1994
1995
1996
1997
1998
1999
2000
2001
2002
2003
2004
2005
2006
2007
2008
2009
2010
2011
2012
2013
2014
2015
2016
Developed Markets Outperformed
Emerging Markets Outperformed
Developed vs. Emerging Markets: Three-Year Relative Performance
Rolling 3-year Annualized Relative Returns
Past performance is no guarantee of future results. Developed Markets represented by the MSCI World Index. Emerging Markets represented by the MSCI EM Index. Source: FactSet, Fidelity Investments (AART) through 8/31/16
EM vs DM relative outperformance can last for years
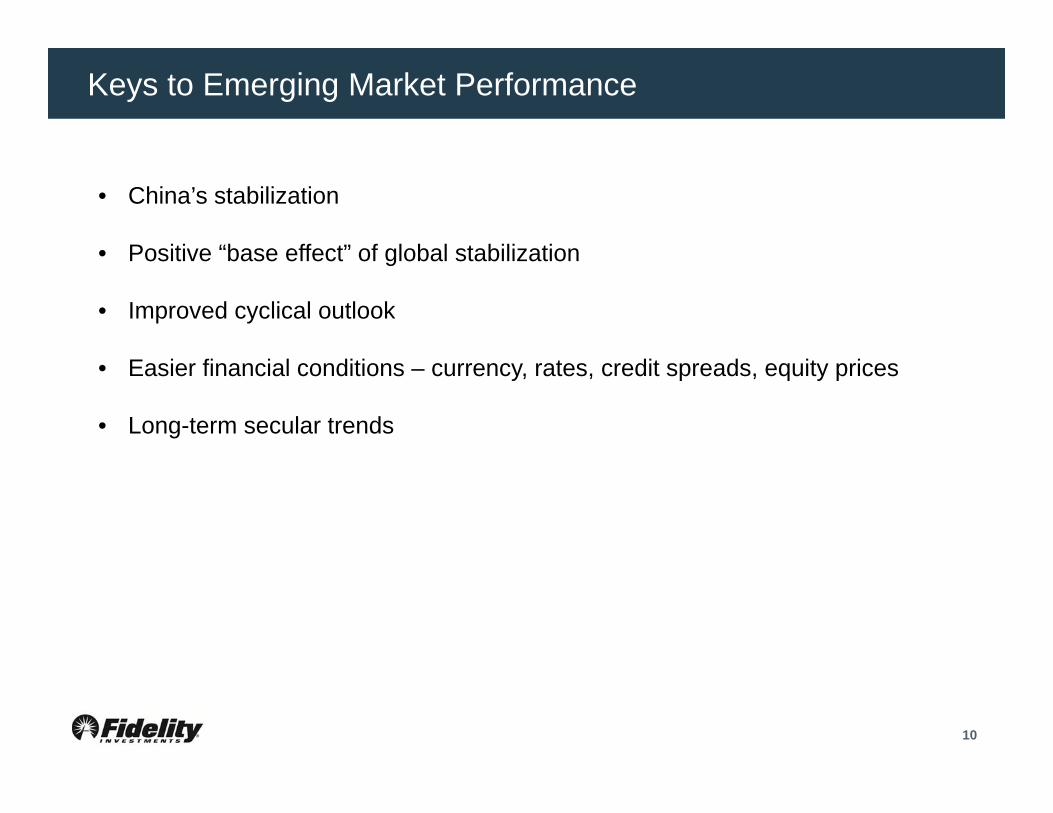
Keys to Emerging Market Performance
10
• China’s stabilization
• Positive “base effect” of global stabilization
• Improved cyclical outlook
• Easier financial conditions – currency, rates, credit spreads, equity prices
• Long-term secular trends
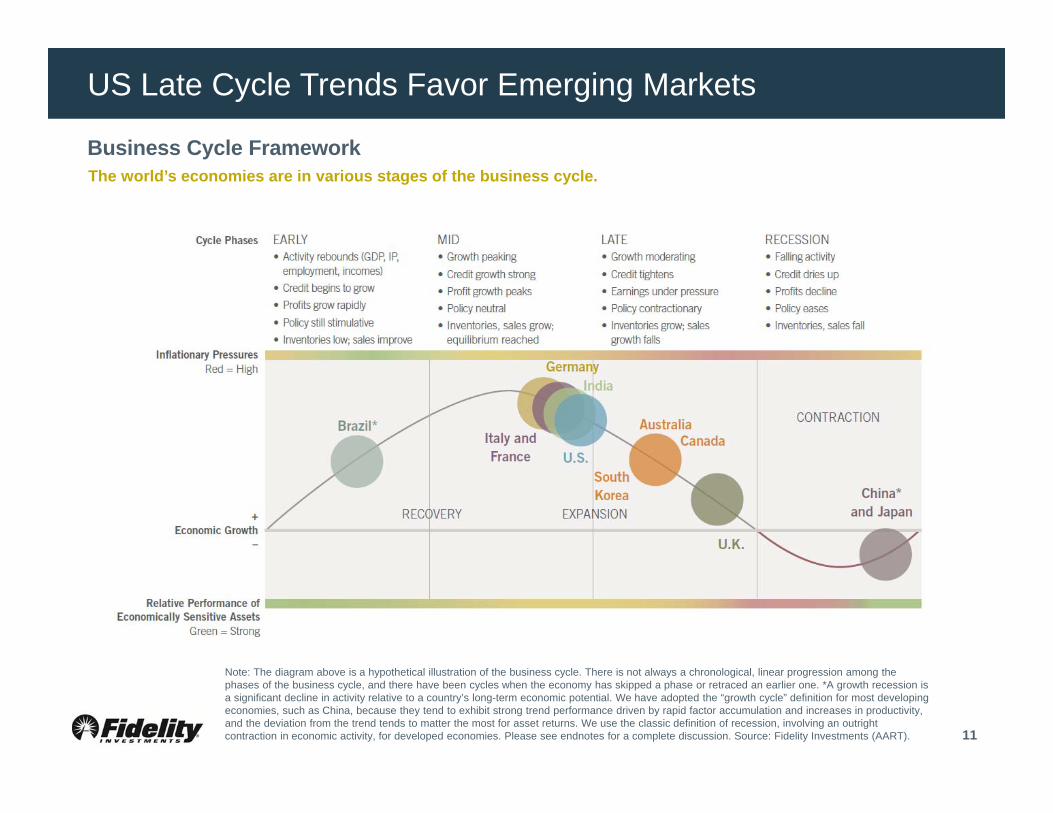
US Late Cycle Trends Favor Emerging Markets
11
Business Cycle FrameworkThe world’s economies are in various stages of the business cycle.
Note: The diagram above is a hypothetical illustration of the business cycle. There is not always a chronological, linear progression among the phases of the business cycle, and there have been cycles when the economy has skipped a phase or retraced an earlier one. *A growth recession is a significant decline in activity relative to a country’s long-term economic potential. We have adopted the “growth cycle” definition for most developing economies, such as China, because they tend to exhibit strong trend performance driven by rapid factor accumulation and increases in productivity, and the deviation from the trend tends to matter the most for asset returns. We use the classic definition of recession, involving an outright contraction in economic activity, for developed economies. Please see endnotes for a complete discussion. Source: Fidelity Investments (AART).
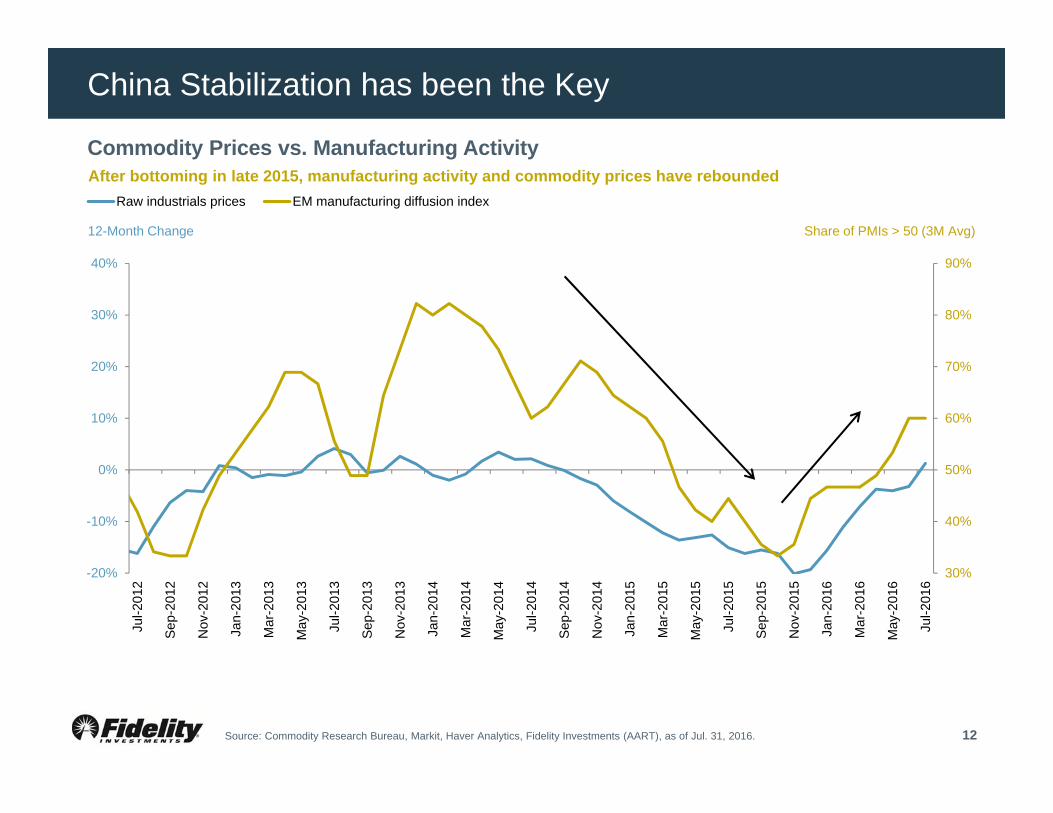
China Stabilization has been the Key
12
Commodity Prices vs. Manufacturing Activity
Source: Commodity Research Bureau, Markit, Haver Analytics, Fidelity Investments (AART), as of Jul. 31, 2016.
After bottoming in late 2015, manufacturing activity and commodity prices have rebounded
12-Month Change Share of PMIs > 50 (3M Avg)
30%
40%
50%
60%
70%
80%
90%
-20%
-10%
0%
10%
20%
30%
40%
Jul-2
012
Sep
-201
2
Nov
-201
2
Jan-
2013
Mar
-201
3
May
-201
3
Jul-2
013
Sep
-201
3
Nov
-201
3
Jan-
2014
Mar
-201
4
May
-201
4
Jul-2
014
Sep
-201
4
Nov
-201
4
Jan-
2015
Mar
-201
5
May
-201
5
Jul-2
015
Sep
-201
5
Nov
-201
5
Jan-
2016
Mar
-201
6
May
-201
6
Jul-2
016
Raw industrials prices EM manufacturing diffusion index
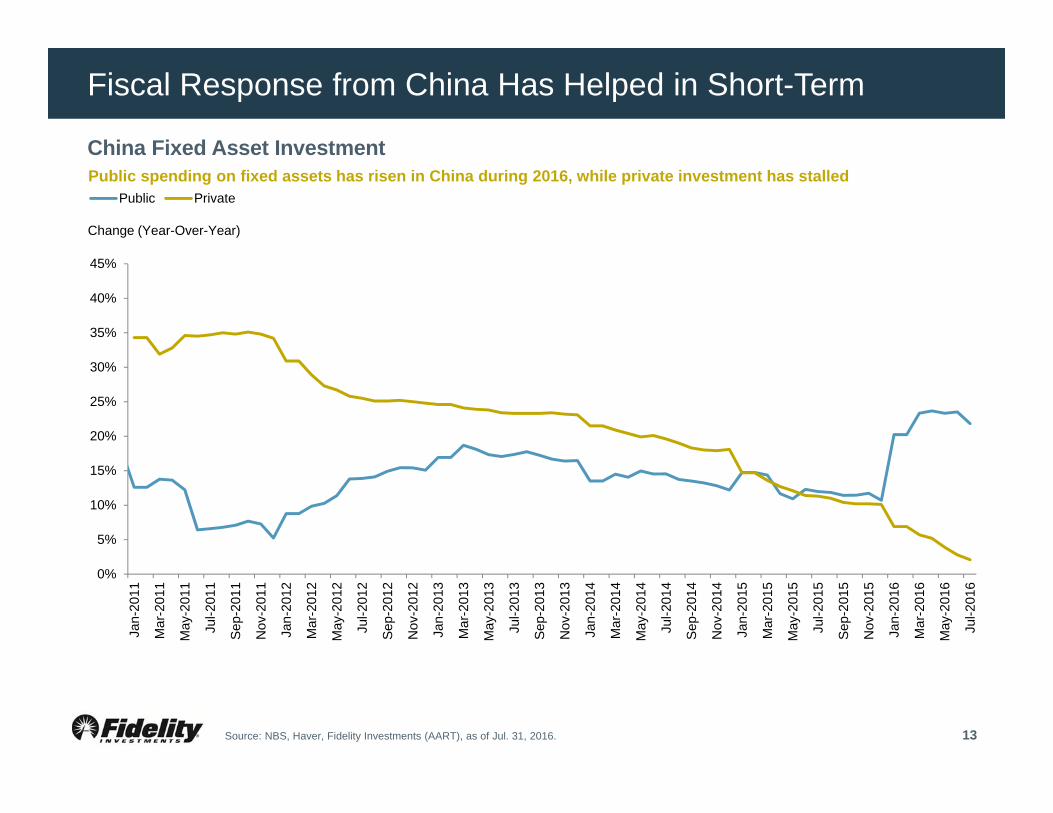
Fiscal Response from China Has Helped in Short-Term
13
China Fixed Asset Investment
Source: NBS, Haver, Fidelity Investments (AART), as of Jul. 31, 2016.
Public spending on fixed assets has risen in China during 2016, while private investment has stalled
Change (Year-Over-Year)
0%
5%
10%
15%
20%
25%
30%
35%
40%
45%
Jan-
2011
Mar
-201
1
May
-201
1
Jul-2
011
Sep
-201
1
Nov
-201
1
Jan-
2012
Mar
-201
2
May
-201
2
Jul-2
012
Sep
-201
2
Nov
-201
2
Jan-
2013
Mar
-201
3
May
-201
3
Jul-2
013
Sep
-201
3
Nov
-201
3
Jan-
2014
Mar
-201
4
May
-201
4
Jul-2
014
Sep
-201
4
Nov
-201
4
Jan-
2015
Mar
-201
5
May
-201
5
Jul-2
015
Sep
-201
5
Nov
-201
5
Jan-
2016
Mar
-201
6
May
-201
6
Jul-2
016
Public Private
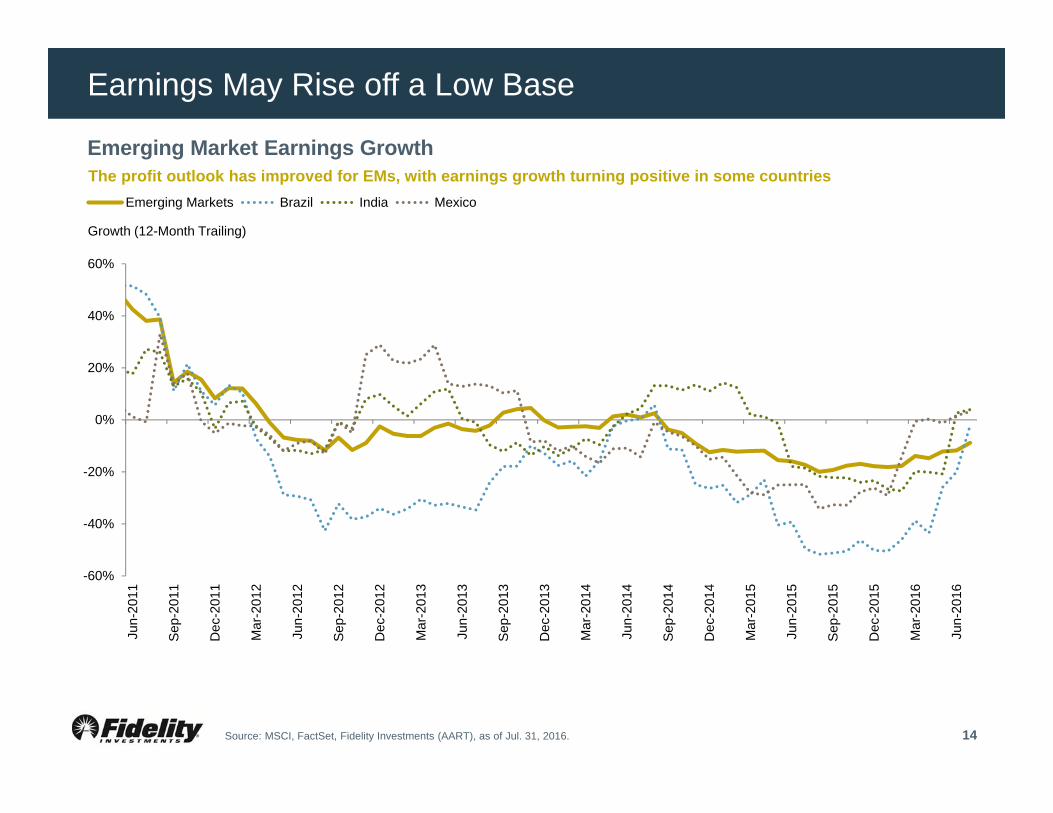
Earnings May Rise off a Low Base
14
Emerging Market Earnings Growth
Source: MSCI, FactSet, Fidelity Investments (AART), as of Jul. 31, 2016.
The profit outlook has improved for EMs, with earnings growth turning positive in some countries
Growth (12-Month Trailing)
-60%
-40%
-20%
0%
20%
40%
60%
Jun-
2011
Sep
-201
1
Dec
-201
1
Mar
-201
2
Jun-
2012
Sep
-201
2
Dec
-201
2
Mar
-201
3
Jun-
2013
Sep
-201
3
Dec
-201
3
Mar
-201
4
Jun-
2014
Sep
-201
4
Dec
-201
4
Mar
-201
5
Jun-
2015
Sep
-201
5
Dec
-201
5
Mar
-201
6
Jun-
2016
Emerging Markets Brazil India Mexico
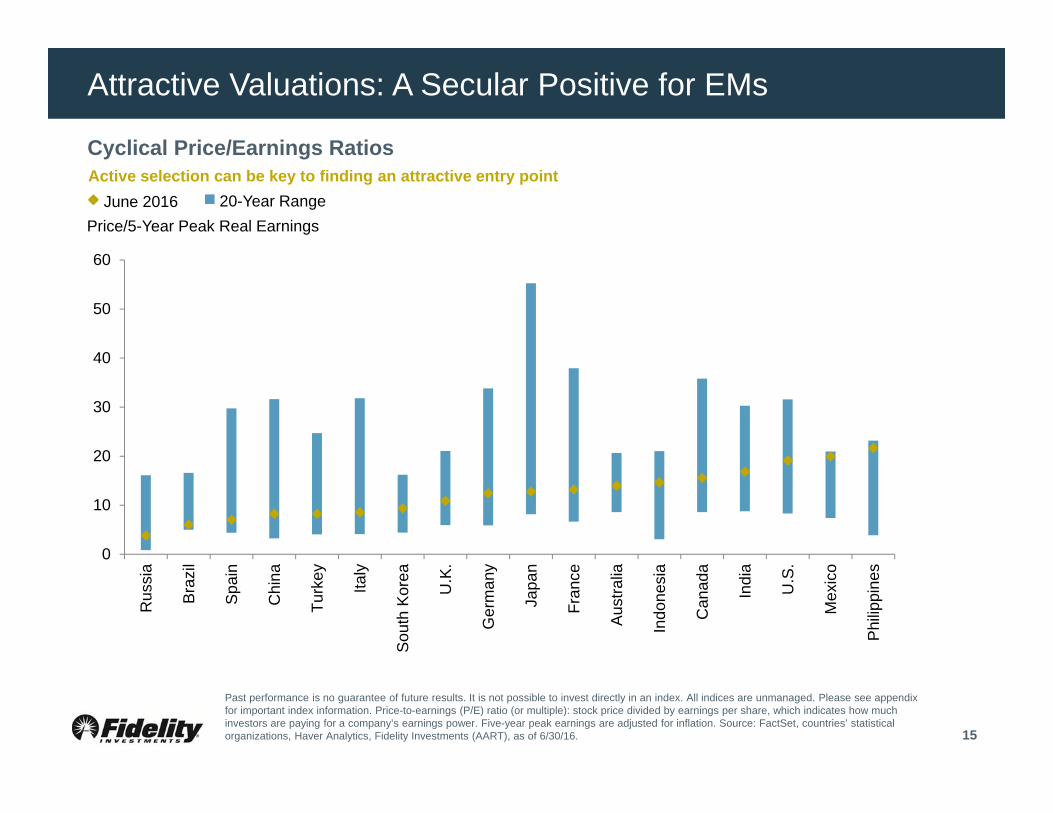
Attractive Valuations: A Secular Positive for EMs
15
0
10
20
30
40
50
60
Rus
sia
Bra
zil
Spai
n
Chi
na
Turk
ey
Italy
Sou
th K
orea
U.K
.
Ger
man
y
Japa
n
Fran
ce
Aus
tralia
Indo
nesi
a
Can
ada
Indi
a
U.S
.
Mex
ico
Phi
lippi
nes
Cyclical Price/Earnings Ratios
Price/5-Year Peak Real EarningsJune 2016 20-Year Range
Past performance is no guarantee of future results. It is not possible to invest directly in an index. All indices are unmanaged. Please see appendix for important index information. Price-to-earnings (P/E) ratio (or multiple): stock price divided by earnings per share, which indicates how much investors are paying for a company’s earnings power. Five-year peak earnings are adjusted for inflation. Source: FactSet, countries’ statistical organizations, Haver Analytics, Fidelity Investments (AART), as of 6/30/16.
Active selection can be key to finding an attractive entry point
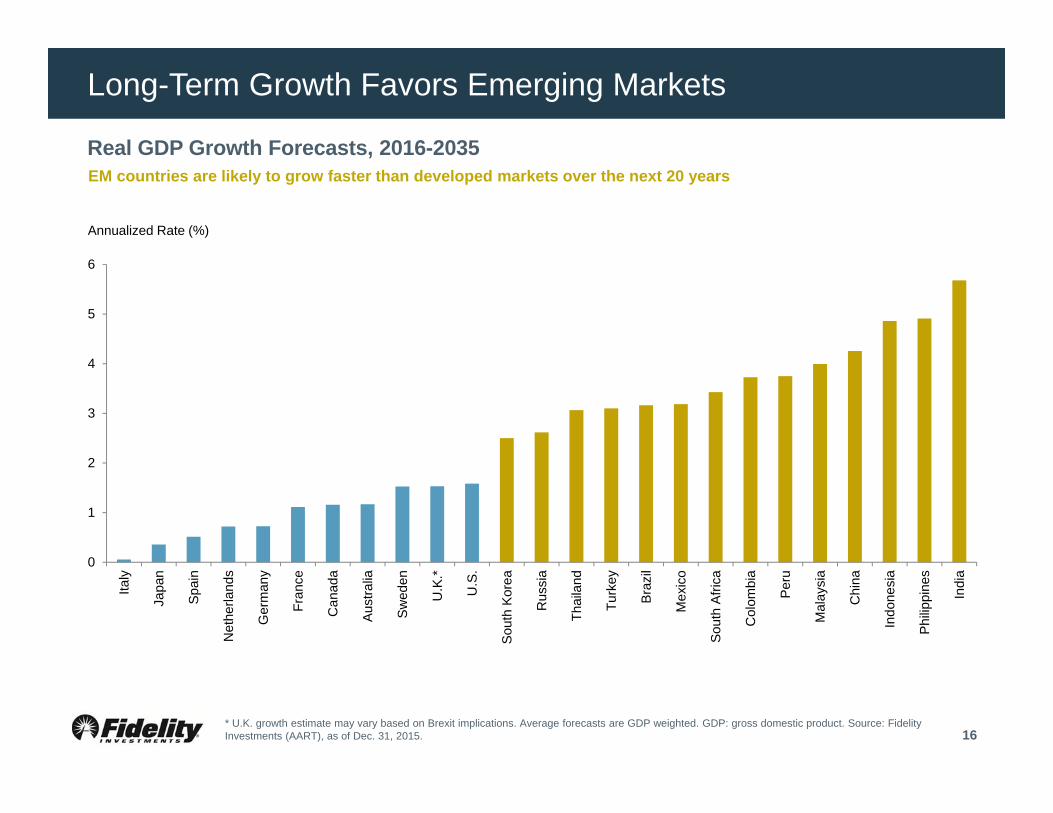
Long-Term Growth Favors Emerging Markets
16
Real GDP Growth Forecasts, 2016-2035
* U.K. growth estimate may vary based on Brexit implications. Average forecasts are GDP weighted. GDP: gross domestic product. Source: FidelityInvestments (AART), as of Dec. 31, 2015.
EM countries are likely to grow faster than developed markets over the next 20 years
Annualized Rate (%)
0
1
2
3
4
5
6
Italy
Japa
n
Spa
in
Net
herla
nds
Ger
man
y
Fran
ce
Can
ada
Aus
tralia
Sw
eden
U.K
.*
U.S
.
Sou
th K
orea
Rus
sia
Thai
land
Turk
ey
Braz
il
Mex
ico
Sou
th A
frica
Col
ombi
a
Peru
Mal
aysi
a
Chi
na
Indo
nesi
a
Phi
lippi
nes
Indi
a
Key Points: Not Everything Needs to Align for EM to Work
17
• The base effect…things have been so bad, they just need to stop getting worse
• China is key…policymakers need to maintain focus on near-term stabilization
• Financial conditions are less fragile…the Fed is less of an issue
• Case for active management strong in EM…cyclical outlooks and valuations differ
• Long-term secular trends favor EM…Valuations and long-term growth prospects

18
Fidelity Tools & ResourcesHeather KnightRegional Brokerage Consultant, Personal Investing

1919
Q&AQ&A
20 20
Diversification does not ensure a profit or guarantee against loss.
Stock markets, especially foreign markets, are volatile and can decline significantly in response to adverse issuer, political, regulatory, market, or economic developments. Foreign securities are subject to interest rate, currency exchange rate, economic, and political risks, all of which are magnified in emerging markets. The risks are particularly significant for funds that focus on a single country or region. Foreign investments, especially those in emerging markets, involve greater risk and may offer greater potential returns than U.S. investments. This risk includes political and economic uncertainties of foreign countries, as well as the risk of currency fluctuation. Investments in smaller companies may involve greater risks than those in larger, more well known companies.
Before investing in any mutual fund or exchange-traded fund, you should consider its investment objectives, risks, charges, and expenses. Contact Fidelity for a prospectus, offering circular, or, if available, a summary prospectus containing this information.Read it carefully.
Fidelity Brokerage Services LLC, Member NYSE, SIPC, 900 Salem Street, Smithfield, RI 02917
© 2016 FMR LLC. All rights reserved.
774276.1.0
Important Information