Embed Size (px)
Citation preview

Lars-Erik CedermanCenter for Comparative and International Studies (CIS)
ETH Zurichhttp://www.icr.ethz.ch
Presentation prepared for lecture series “Complexity in the Social Sciences”Stockholm, September 28. 2007
Emergent Behavior in the International Political Systems

2
Method: Agent-based modeling
• ABM is a computational methodology that allows the researcher to create, analyze, and experiment with, artificial worlds populated by agents that interact in non-trivial ways
• Bottom-up• Computational• Builds on CAs and DAI

3Disaggregated modeling
Organizations of agents
Animate agents
Data
Artificial world
Observer
Inanimate agents
If <cond> then
<action1>else
<action2>
If <cond> then
<action1>else
<action2>
4
A view from the Berlin television tower

5
Neighborhood segregation
Thomas C. SchellingMicromotives and
Macrobehavior
< 1/3
Micro-level rules of the game
Stay if at least a third of neighbors are “kin”
Move to random location otherwise

6Sample run 1
• Schelling's Segregation Model

7
Emergent results from Schelling’s segregation model
Time
Happiness
Time
Number ofneighborhoods

8Europe in 1500

9Europe in 1900

10
“States made war and war made the state” Charles Tilly

11Geosim
• Geosim uses Repast, a Java toolkit
• States are hierarchical, bounded actors interacting in a dynamic network imposed on a grid
• Emergent Actors in World Politics (PUP 1997)

12Sample Run 2
• Geosim Base Model

13Emergent results from the run
Time
Proportion ofsecure areas
Time
Number ofstates

14Possible outcomes
15-statemultipolarity(sample run)
bipolarity unipolarity
7-statemultipolarity

15Microeconomics ABM
Analytical Synthetic approachEquilibrium Non-equilibrium theoryNomothetic Generative methodVariable-based Configurative ontology

16
Analytical Synthetic approach
• Hope to solve problems through strategy of “divide and conquer”
• Need to make ceteris paribusassumption
• But in complex systems this assumption breaks down
• Herbert Simon: Complex systems are composed of large numbers of parts that interact in a non-linear fashion
• Need to study interactions explicitly

17
Equilibrium Non-equilibrium theory
• Standard assumption in the social sciences: “efficient” history
• But contingency and positive feedback undermine this perspective
• Complexity theory and non-equilibrium physics
• Statistical regularities at the macro level despite micro-level contingency
Example: Avalanches in rice pile
18
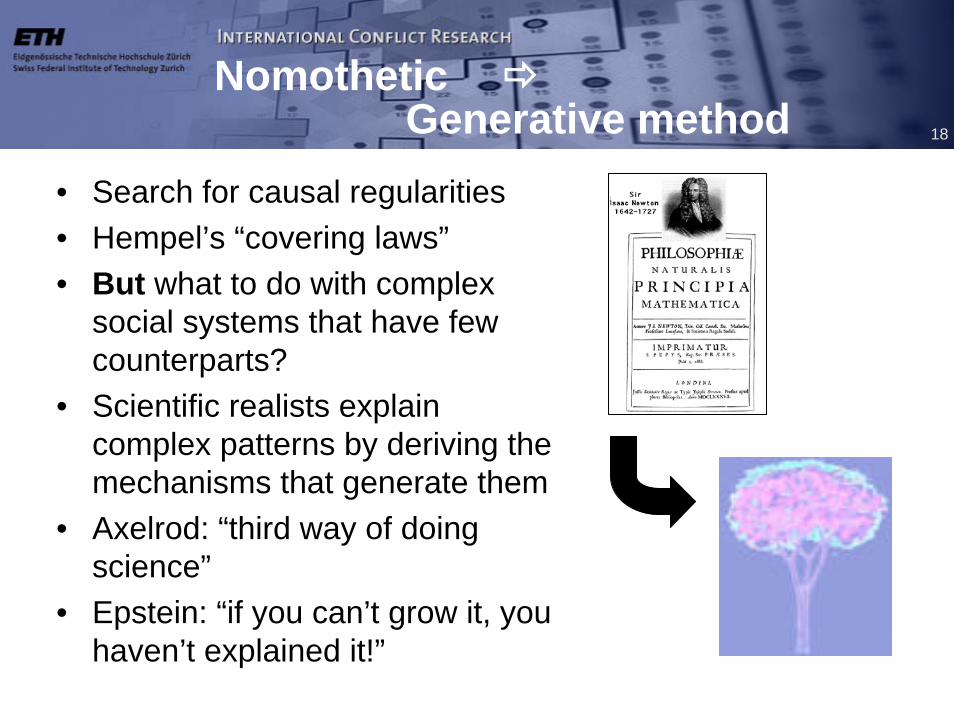
NomotheticGenerative method
• Search for causal regularities• Hempel’s “covering laws”• But what to do with complex
social systems that have few counterparts?
• Scientific realists explain complex patterns by deriving the mechanisms that generate them
• Axelrod: “third way of doing science”
• Epstein: “if you can’t grow it, you haven’t explained it!”

19
Variable-based Configurative ontology
• Conventional models are variable-based
• Social entities are assumed implicitly
• But variables say little about social forms
• A social form is a configuration of social interactions and actors together with the structures in which they are embedded
• ABM good at endogenizinginteractions and actors
• Object-orientation is well suited to capture agents

20
Applying Geosim to world politics
Configurations Processes
Qualitativeproperties
Example 3. Democratic peace
Example 4. Emergence of the territorial state
Distributionalproperties
Example 2.State-size distributions
Example 1. War-size distributions

21
Cumulative war-size plot, 1820-1997
Data Source:Correlatesof WarProject (COW)
1.0
0.1
0.01
log P(S>s) = 1.27 – 0.41 log s
2 3 4 5 6 7 810 10 10 10 10 10 10
WWI
WWII
2R = 0.985 N = 97
log P(S>s) (cumulative frequency)
log s (severity)

22
• Slowly driven systems that fluctuate around state of marginal stability while generating non-linear output according to a power law.
• Examples: sandpiles, semi-conductors, earthquakes, extinction of species, forest fires, epidemics, traffic jams, city populations, stock market fluctuations, firm size
Theory: Self-organized criticality
Input Output
Complex System
log f
log s
f
s
s-α

23Self-organized criticality
Per Bak’s sand pile Power-law distributedavalanches in a rice pile

24War clusters in Geosim
t = 3,326 t = 10,000

25
Simulated cumulative war-size plot
2 73 4 5 6
log P(S > s)(cumulativefrequency)
log s(severity)
log P(S > s) = 1.68 – 0.64 log sN = 218 R2 = 0.991
See “Modeling the Size of Wars” American Political Science Review Feb. 2003

26
Applying Geosim to world politics
Configurations Processes
Qualitativeproperties
Example 3. Democratic peace
Example 4. Emergence of the territorial state
Distributionalproperties
Example 2.State-size distributions
Example 1. War-size distributions

27
2. Modeling state sizes: Empirical data
log s(state size)
log Pr (S > s)(cumulative frequency)
1998Data: Lake et al.
log S ~ N(5.31, 0.79)MAE = 0.028
28
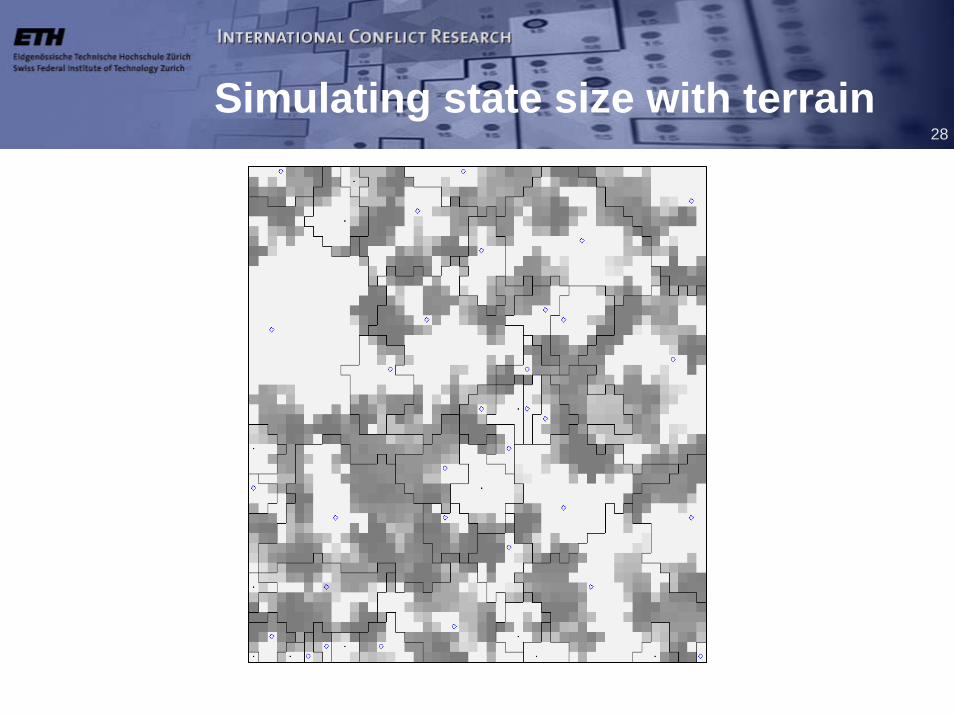
Simulating state size with terrain

29Simulated state-size distribution
log s(state size)
log Pr (S > s)(cumulative frequency)
log S ~ N(1.47, 0.53)MAE = 0.050

30
Applying Geosim to world politics
Configurations Processes
Qualitativeproperties
Example 3. Democratic peace
Example 4. Emergence of the territorial state
Distributionalproperties
Example 2.State-size distributions
Example 1. War-size distributions

31
Simulating global democratization
Source:Cederman &Gleditsch 2004
Year
Pro
porti
on o
f dem
ocra
cies
1850 1900 1950 2000
0.0
0.1
0.2
0.3
0.4
0.5
0.0
0.1
0.2
0.3
0.4
0.5
Proportion of democraciesProportion at war

32A simulated democratic outcome
t = 0 t = 10,000
33
0 1e+042e+03 4e+03 6e+03 8e+030 1e+042e+03 4e+03 6e+03 8e+03
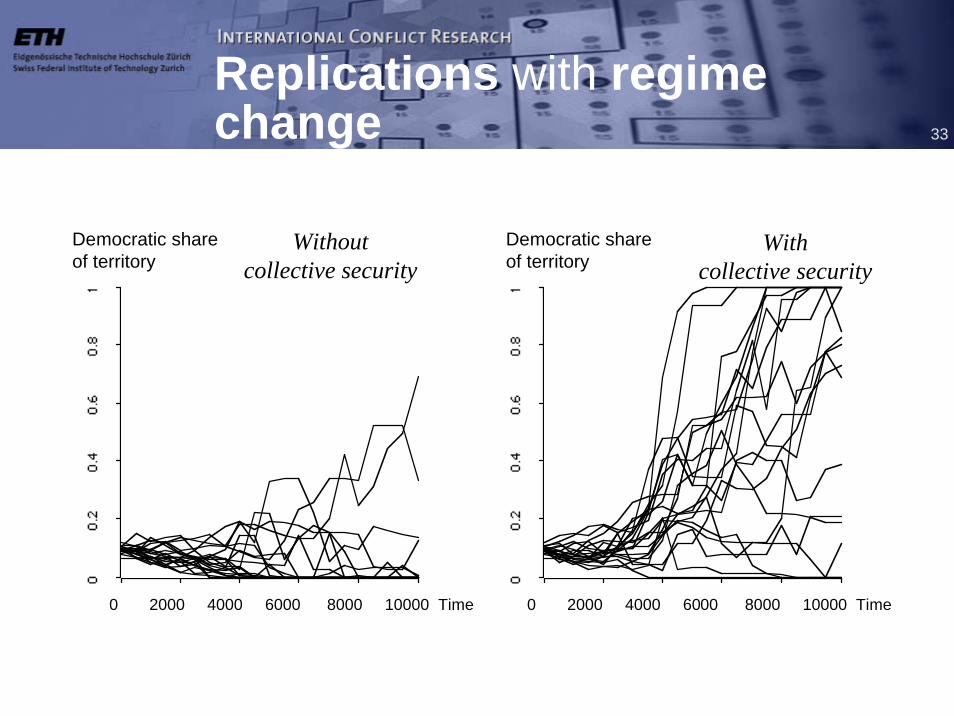
Replications with regime change
Democratic shareof territory
Democratic shareof territory
0 2000 4000 6000 8000 10000 Time 0 2000 4000 6000 8000 10000 Time
Withcollective security
Withoutcollective security

34
Applying Geosim to world politics
Configurations Processes
Qualitativeproperties
Example 3. Democratic peace
Example 4. Emergence of the territorial state
Distributionalproperties
Example 2.State-size distributions
Example 1. War-size distributions
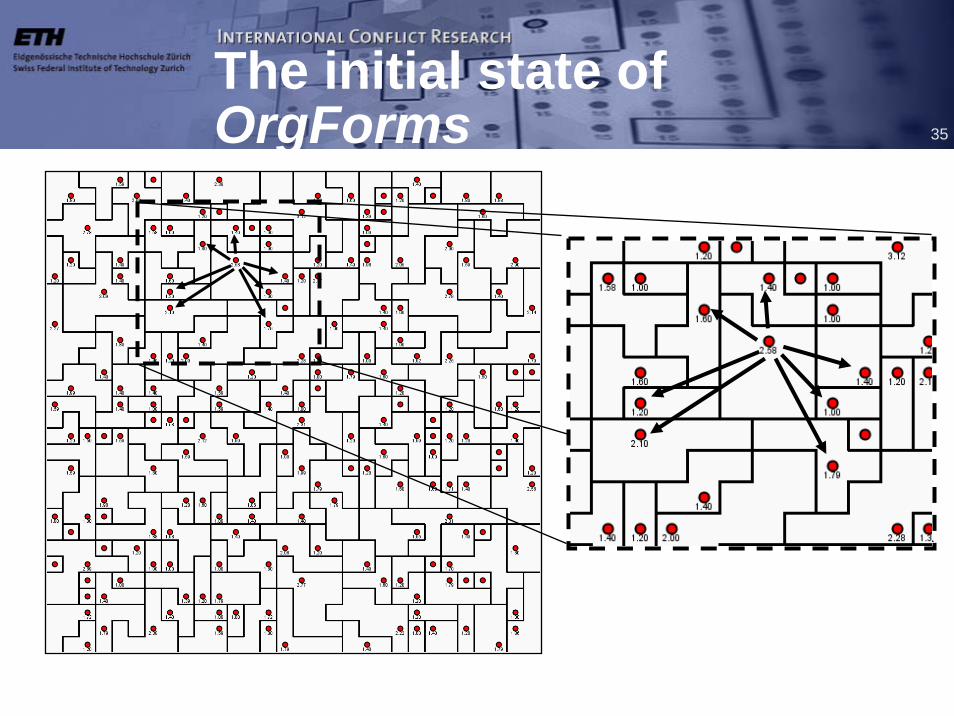
35
The initial state of OrgForms

36Taxation in a linear state
0.6 0.6
0.4
.576
.4
0.4
0.6
1.224
Tax: k= .5
Discount: δ = .8
1 2 3 4 5
1.576

37
Modeling technological change
0.2
.4.6
.81
Dis
cout
ing
0 5 10 15 20Distance
t = 0 t = 500t = 1000

38
OrgForms: A dynamic network model
TechnologicalProgress
Conquest
OrganizationalBypass
SystemsChange

39
Indirect rule in the “Middle Ages”

40
Direct rule in the modern system
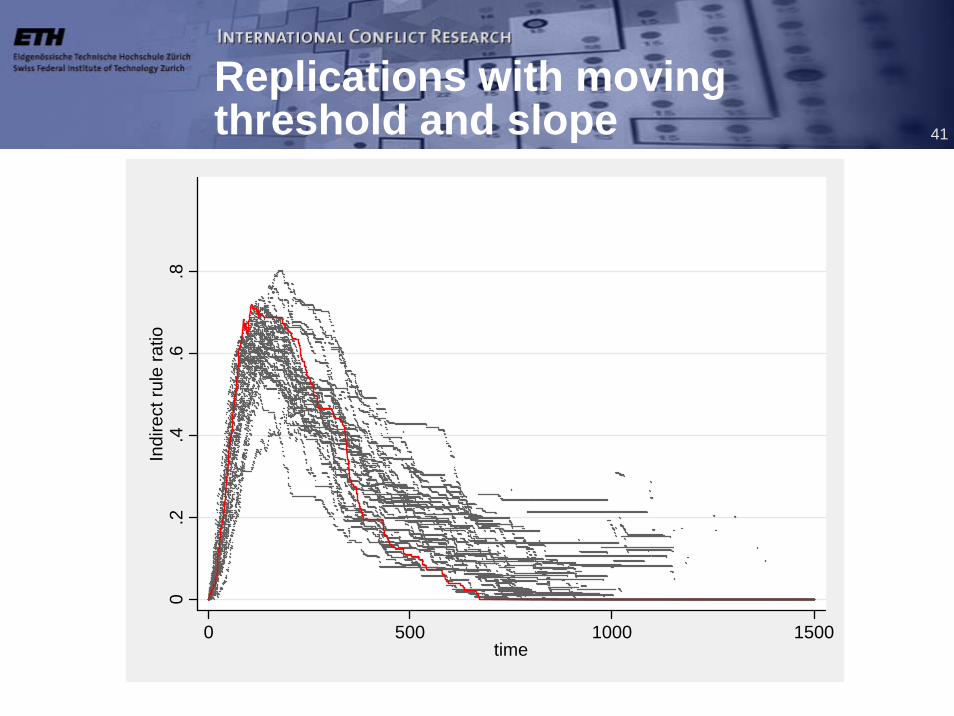
41
Replications with moving threshold and slope
0.2
.4.6
.8In
dire
ct ru
le ra
tio
0 500 1000 1500time
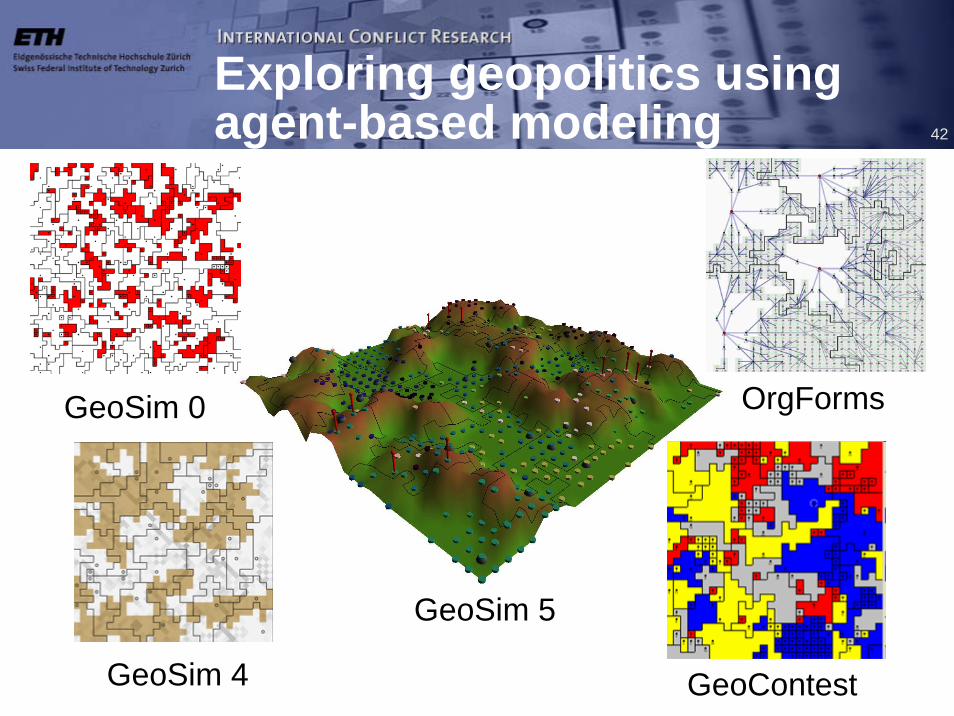
42
GeoSim 5
Exploring geopolitics using agent-based modeling
OrgFormsGeoSim 0
GeoContestGeoSim 4

43
Toward more realistic models of civil wars
• Our strategy:– Step I: extending Geosim framework– Step II: conducting empirical research– Step III: back to computational modeling
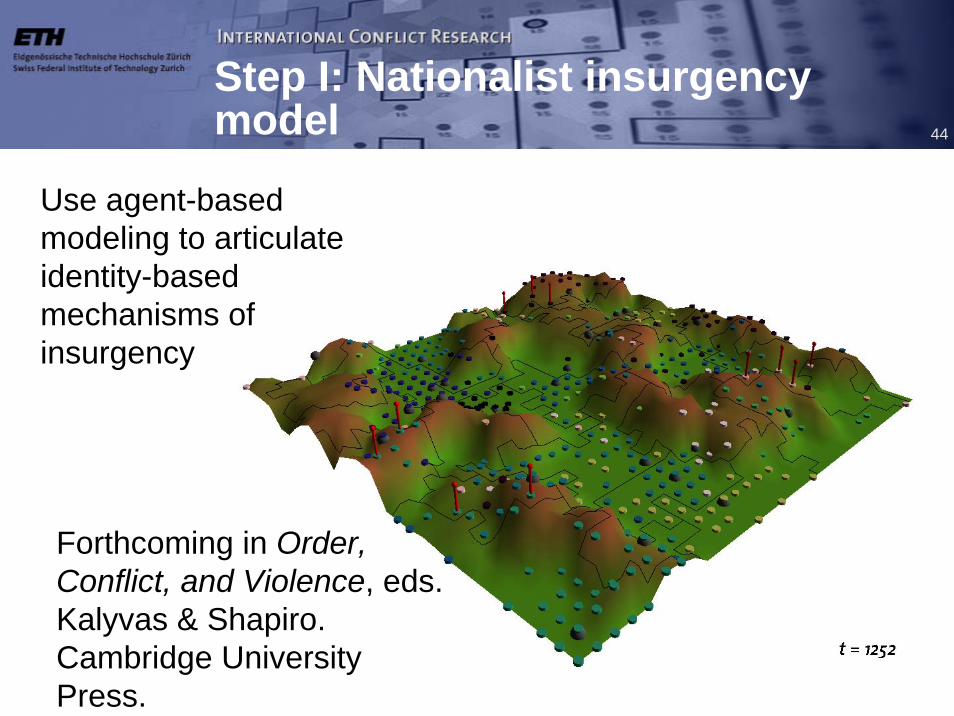
44
Step I: Nationalist insurgency model
Use agent-based modeling to articulate identity-based mechanisms of insurgency
Forthcoming in Order, Conflict, and Violence, eds. Kalyvas & Shapiro. Cambridge University Press.

45Step II: Empirical research
• Beyond fractionalization, EGIP, N*(Cederman & Girardin, APSR 2007)
• GREG: Geo-Referencing of Ethnic Groups (Cederman, Rød & Weidmann completed)
• ESEG: Expert Survey of Ethnic Groups (Cederman, Wimmer, Girardin & Min, in progress)
• GREG-II (Cederman, Weidmann & Rød)

46
Step II: GREGGeo-Referencing of Ethnic Groups
• Scanning and geo-coding ethnic groups
• Polygon representation
• Based on Atlas Narodov Mira(1964)
!̂
!̂
!̂
6
4
6
3
4
5
5
5,6
4,5
5
5
4,6
4
5
4
5
4
46
4
4,6
5
4
4,19
4
6
4,6
5
5
5
6
4
5,6
4
5
4,17
4,65,6
5,6
4,6
6
5
4
44
4
5
4,17
5,6
5
1
5
6
55,64
5
1
6
5
5,6
1
17
19
LjubljanaLjubljana
ZagrebZagreb
SarajevoSarajevo
SloveniaSlovenia
HungHunga
CroatiaCroatia
Bosnia & HerzegovinaBosnia & Herzegovina
HUHU
BABA
HRHR

47GREG: First results
0.0
2.0
4.0
6.0
8P
r(con
flict
)
0 .2 .4 .6 .8r
Median dyad Distant Distant and mountainous

48
Step II: ESEGExpert Survey of Ethnic Groups
Collaboration with Andreas Wimmer and Brian Min (UCLA)
Web-based interface in order to expand coding of politically relevant ethnic groups and their power access to the rest of the world with the help of area experts

4949Step III: GROWLab
• Technical approach– Follow same tradition as other toolkits, but higher level of
abstraction– Tailored to geopolitical modeling, but might be useful to others– Java based; targeted at programming literates
• Main features– Support for agent hierarchies– Support for complex spatial relationships (e.g. borders)– Support for GIS data (raster with geodetic distance computation)
• Discrete spaces• Integrated GUI• Comes with several example models• Batch runs (cluster support in development)

50
The architecture of GROWLab
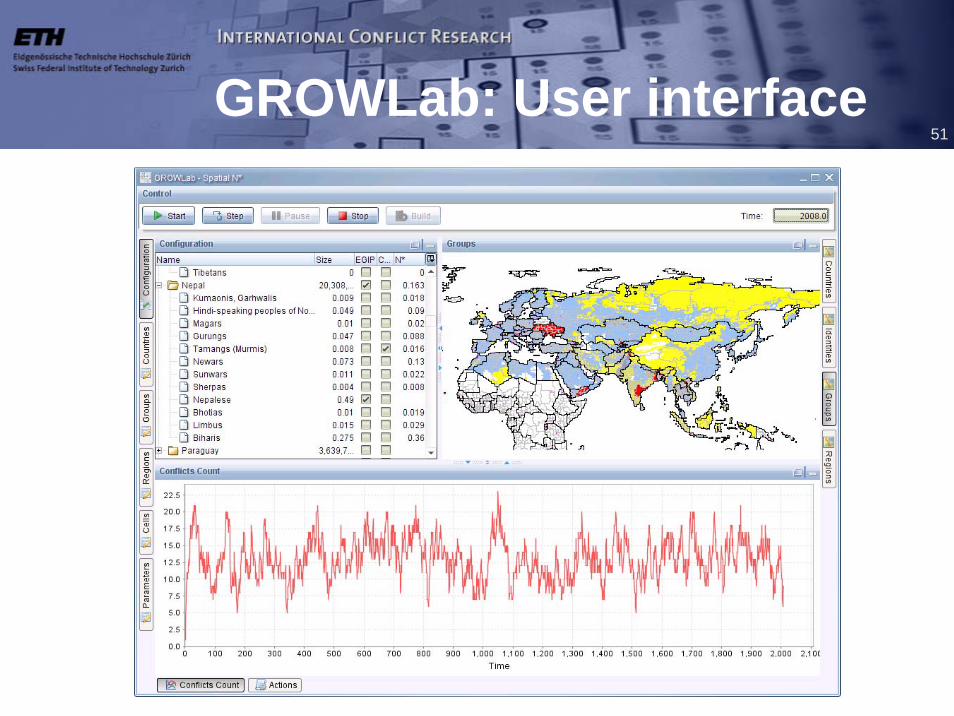
51GROWLab: User interface
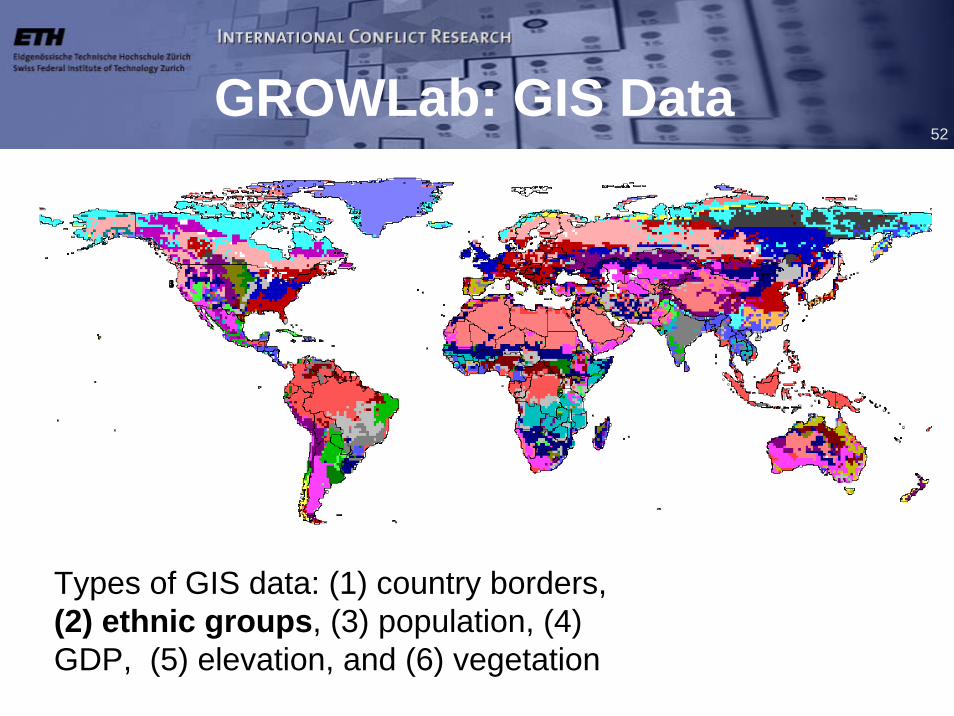
52GROWLab: GIS Data
123456
Types of GIS data: (1) country borders, (2) ethnic groups, (3) population, (4) GDP, (5) elevation, and (6) vegetation
53
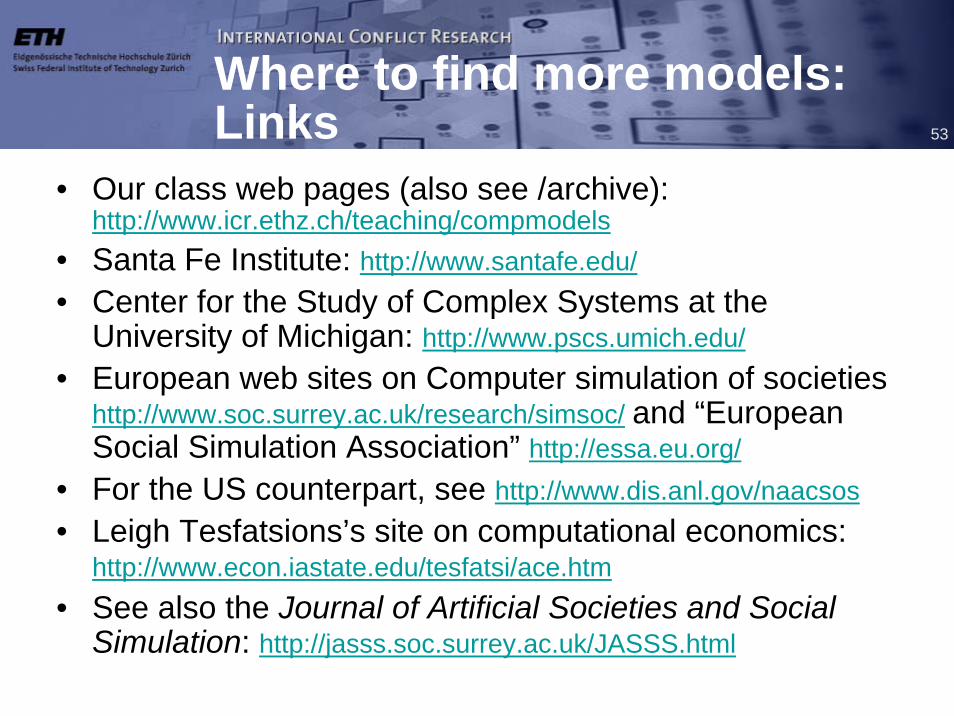
Where to find more models: Links
• Our class web pages (also see /archive): http://www.icr.ethz.ch/teaching/compmodels
• Santa Fe Institute: http://www.santafe.edu/• Center for the Study of Complex Systems at the
University of Michigan: http://www.pscs.umich.edu/• European web sites on Computer simulation of societies
http://www.soc.surrey.ac.uk/research/simsoc/ and “European Social Simulation Association” http://essa.eu.org/
• For the US counterpart, see http://www.dis.anl.gov/naacsos• Leigh Tesfatsions’s site on computational economics:
http://www.econ.iastate.edu/tesfatsi/ace.htm• See also the Journal of Artificial Societies and Social
Simulation: http://jasss.soc.surrey.ac.uk/JASSS.html

54RePast framework
Controlling simulations
Managingparameters
Displaying behavior
Charting

55Development Environment
int a = 12;if (a == b)
b++;else
a++;
Java source code
EditorJava
compiler
Java libs
Integrated Development Environmente.g. IDEA
JVM
Repast libs