Embed Size (px)
Citation preview

2016 Private & Confidential
Emefcy Group Capital Markets Analysis Update
July 2016

2
Henslow Pty Ltd (Henslow) believes that the information contained in this document has been compiled from sources believed to be reliable, but no representation or warranty,
express or implied, is made by Henslow as to its fairness, accuracy, completeness or correctness. Henslow has not independently verified the facts, assumptions, and estimates
contained herein. All estimates, opinions and other information contained in this document constitute Henslow’s judgement as of the date of this document, are subject to change
without notice and are provided in good faith but without legal responsibility or liability.
This document has been prepared without taking account of your objectives, financial situation or needs. You must not rely on this document. You should consider its
appropriateness having regard to your objectives, financial situation and needs, seek and rely upon your own independent taxation, legal, financial or other professional advice,
and make your own independent assessment. Investments can go up and down. Past performance is not necessarily indicative of future performance.
This document is provided for information purposes only. It is not and should not be considered as an offer or invitation to apply for or purchase any securities or investments or
as a recommendation to make an offer or invitation in respect of securities or investments. No agreement to subscribe for the securities or investments will be entered into on the
basis of this document.
This document is not a disclosure document under Australian law or under any other law. Accordingly, this document neither purports to be exhaustive nor contain all of the
information which any reader or prospective investor may require to make an investment decision and it does not contain all of the information which would otherwise be required
by Australian law or any other law to be disclosed in a prospectus. This document expressly does not constitute an offer or solicitation to buy or sell any securities or investments
in any jurisdiction where such offer or solicitation would be prohibited. This document is not available for distribution outside Australia and New Zealand and may not be passed
on to any third party or person without the prior written consent of Henslow.
Certain statements in this presentation are forward looking statements. You can identify these statements by the fact that they use words such as “anticipate”, “estimate”,
“expect”, “project”, “intend”, “plan”, “believe”, “target”, “may”, “assume” and words of similar import. These forward looking statements speak only as at the date of this
presentation. These statements are based on current expectations and beliefs and, by their nature, are subject to a number of known and unknown risks and uncertainties that
could cause the actual results, performances and achievements to differ materially from any expected future results, performance or achievements expressed or implied by such
forward looking statements. No representation, warranty or assurance (express or implied) is given or made by Henslow that the forward looking statements contained in this
presentation are accurate, complete, reliable or adequate or that they will be achieved or prove to be correct.
To the fullest extent permitted by law, except to the extent that liability cannot be excluded, Henslow and its related bodies corporate, affiliates and each of their respective
directors, officers, partners, employees, advisers and agents and any other person involved in the preparation of this presentation do not accept any liability whatsoever for any
direct, indirect or consequential loss arising from or relating to any use of the information contained in this document or any error in, or omission from, this document. Except for
any statutory liability which cannot be excluded, Henslow and its related bodies corporate, affiliates and each of their respective directors, officers, partners, employees, advisers
and agents and any other person involved in the preparation of this presentation expressly disclaim any and all liability and responsibility for the accuracy or completeness of the
forward looking statements and exclude all liability whatsoever (including without limitation any liability arising from fault or negligence) for any direct or indirect loss or damage
which may arise or be suffered by any person for any reason including but not only as a consequence of use of or reliance on this document, or of any information or error in, or
omission from, this document.
Henslow has been engaged by Emefcy Group Ltd to provide corporate advisory and capital markets advice which also included the preparation of this document. Henslow will
receive fees for providing these services including the preparation of this document. Save for those fees, Henslow does not expect to receive any other direct or indirect pecuniary
advantage or interest in connection with this report or that may be reasonably capable of influencing the preparation of this document.
This document is produced by Henslow Pty Ltd (ABN 38 605 393 137). AFSL 483168.
Disclaimer

3
1
2
3
Emefcy Group Overview Page 4
China Expansion Page 11
Water as a Service Page 20
Table of Contents
2016 Private & Confidential
Emefcy Group Overview
Emefcy Group is a clean technology company providing wastewater treatment products and services
5
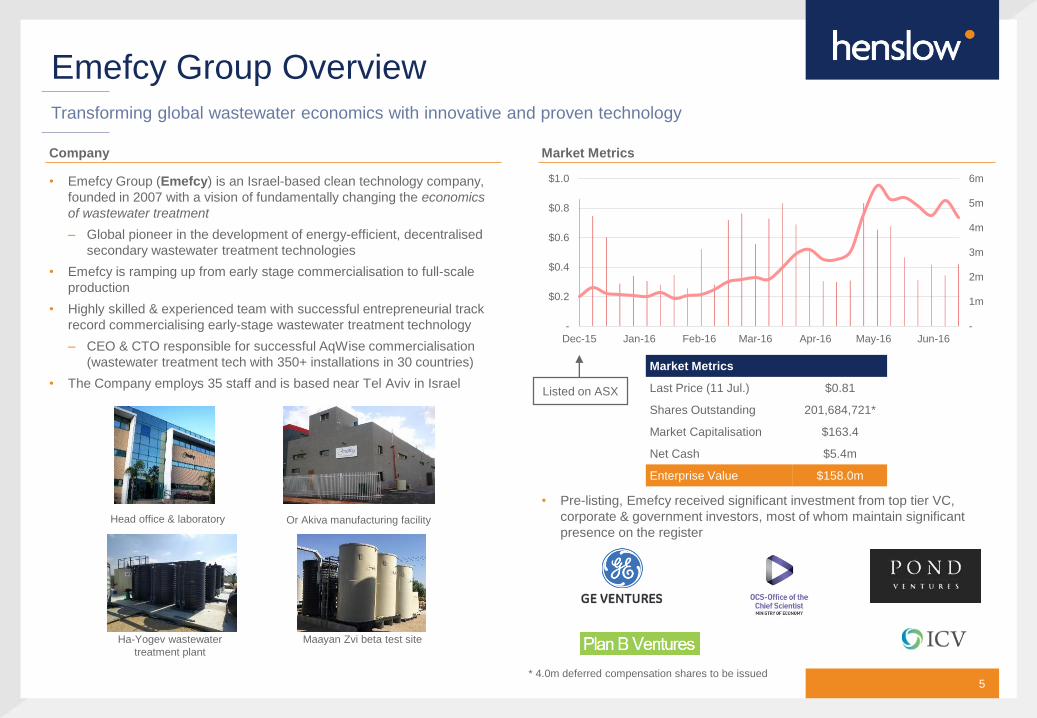
Company
• Emefcy Group (Emefcy) is an Israel-based clean technology company,
founded in 2007 with a vision of fundamentally changing the economics
of wastewater treatment
– Global pioneer in the development of energy-efficient, decentralised
secondary wastewater treatment technologies
• Emefcy is ramping up from early stage commercialisation to full-scale
production
• Highly skilled & experienced team with successful entrepreneurial track
record commercialising early-stage wastewater treatment technology
– CEO & CTO responsible for successful AqWise commercialisation
(wastewater treatment tech with 350+ installations in 30 countries)
• The Company employs 35 staff and is based near Tel Aviv in Israel
Emefcy Group OverviewTransforming global wastewater economics with innovative and proven technology
Market Metrics
• Pre-listing, Emefcy received significant investment from top tier VC,
corporate & government investors, most of whom maintain significant
presence on the registerHead office & laboratory Or Akiva manufacturing facility
Maayan Zvi beta test siteHa-Yogev wastewater
treatment plant
-
1m
2m
3m
4m
5m
6m
-
$0.2
$0.4
$0.6
$0.8
$1.0
Dec-15 Jan-16 Feb-16 Mar-16 Apr-16 May-16 Jun-16
Market Metrics
Last Price (11 Jul.) $0.81
Shares Outstanding 201,684,721*
Market Capitalisation $163.4
Net Cash $5.4m
Enterprise Value $158.0m
* 4.0m deferred compensation shares to be issued
Listed on ASX

6
Global Water Market
• Global demand for water is expected to grow by 72% to 2,878bn m3 by
2030 from 1,668bn m3 in 2005
• The global wastewater market includes both investment in infrastructure
(capex) & ongoing operating costs (opex)
– Investment in wastewater treatment infrastructure (capex) expected to
grow inline with broader market
Wastewater Industry OverviewEver-present market, reaching every corner of the globe
Wastewater Treatment
• Wastewater is typically treated in a three-stage process:
• Energy is a significant cost, making up 35% of global wastewater opex
• Almost all wastewater in Europe (proxy for developed nations) is treated
to some degree with 95% undergoing Primary & Secondary treatment
- 100bn 200bn 300bn 400bn 500bn 600bn
China
India
Sub-Saharan Africa
Rest of Asia
N America
Europe
S America
MENA
Oceania
Increase in Annual Water Demand 2005 – 2030 (m³)
Municipal & Domestic Industry AgricultureSource: IFPRI
Source: GWI
Primary
Basic removal of debris
& solid material
Secondary
Biological removal of
dissolved organic &
nitrogen compounds
Tertiary
Final stage ‘polishing’ or
chlorination
Maintenance, $10.9bn
Energy, $14.6bnLabour, $9.7bn
Parts, $6.1bn
Wastewater Treatment OPEX Breakdown (2013)
Not Collected, 1%
Not Treated, 3%
Primary, 1%
Secondary,
Tertiary,
Wastewater Treatment OPEX Breakdown (Europe)Global Water Market (US$)
2014 2018 CAGR
Capex 221.2bn 283.0bn 6%
Opex 336.5bn 380.1bn 3%
Total Market 557.7bn 663.1bn 4%
Wastewater Treatment Capex 103.8bn 129.8bn 6%
Source: GWI
Source: GWI

7
Centralised Wastewater Treatment
• Large-scale plants serve entire cities, collecting wastewater through
extensive pipe network
– Capex: Significant infrastructure investment for plant & pipes
– Opex: Pipe network has high pumping & maintenance costs
Centralised vs DecentralisedNew technology is disrupting traditional high capex centralised approach
Decentralised Wastewater Treatment
• Systems serve individual facilities or discrete communities
– Capex: Localised plant does not require extensive pipe investment&
may scale ‘just in time’
– Opex: Minimal pumping & maintenance costs over very short distance
• Decentralised wastewater treatment offers significant infrastructure
investment savings
-
$5k
$10k
$15k
$20k
Average Per Connection Cost of Wastewater Treatment
Centralised DecentralisedSource: Nowra
Blue Plains Plant, USA Ha-Yogev Wastewater Treatment Plant
Centralised vs Decentralised Comparison
Centralised (Traditional)MABR - Decentralised
(Disruption)
Capex High Low
Opex High Low
Water
Reuse
• Long return pipes required in
addition to existing network
• Neighbour friendly, odourless &
quiet, enabling local reuse
Footprint• Huge plant size
• Smelly and highly visible
• Flexible and scalable, capable
of blending in
Comments
• Long deployment horizon &
project lifetimes
• Cannot service inland towns
• Wastewater treatment &
dispersal close to source
• Attractive option as stricter
environmental regulations
prevail

8
MABR Technology
• Membrane Aerated Biofilm Reactor (MABR) is technology for
decentralised wastewater treatment that is first-to-market with a reliable,
low-cost solution that was developed entirely in-house over last 7 years
• MABR is fully automated with a self-contained, modular design
– Spirally-wound oxygen-supplying membrane developed a bacteria-
seeded biofilm within tank packaging
– Membrane is not used to filter water, but to supply low pressure
oxygen to bacteria biofilm by osmosis
• Proven technical & commercial track record with continuous (22+
months), successful operations at the Caesarea demonstration plant
– Ministry of Health approval received for recycling use
MABR TechnologyRevolutionary new technology with significant opex & capex reductions
Revolutionary Activated Sludge
• The most common method of secondary stage wastewater treatment is
conventional activated sludge, which cleans wastewater by using
oxygen-dependent bacteria to eat dissolved organic compounds
(pollutants)
– Requires high pressure air pumping to aerate bacteria (supply
oxygen), which can represent ~60% of a plant’s power consumption
– Conventional technology is inefficient & produces excessive amounts
of sludge (waste by-product that adds additional disposal costs)
• MABR technology solves this, significantly reducing opex (50%)…
– Drastically reduced power consumption (~90% reduction)
Membrane-supplied oxygen, removes high pressure air pumping
– Self respiring system halves sludge by-product (~50% reduction)
Dramatically reduces need for waste disposal & associated costs
• …with substantially lower upfront capex…
– ~20% reduction over a comparable plant
• …and less personnel requirements
– Very low maintenance & designed for low operator attention
– Remote operability enables one operator to control multiple plants
Caesarea demonstration plant CAD model of SABRE plant
Membrane biofilm operation MABR spiral membrane
9
MABR Technology
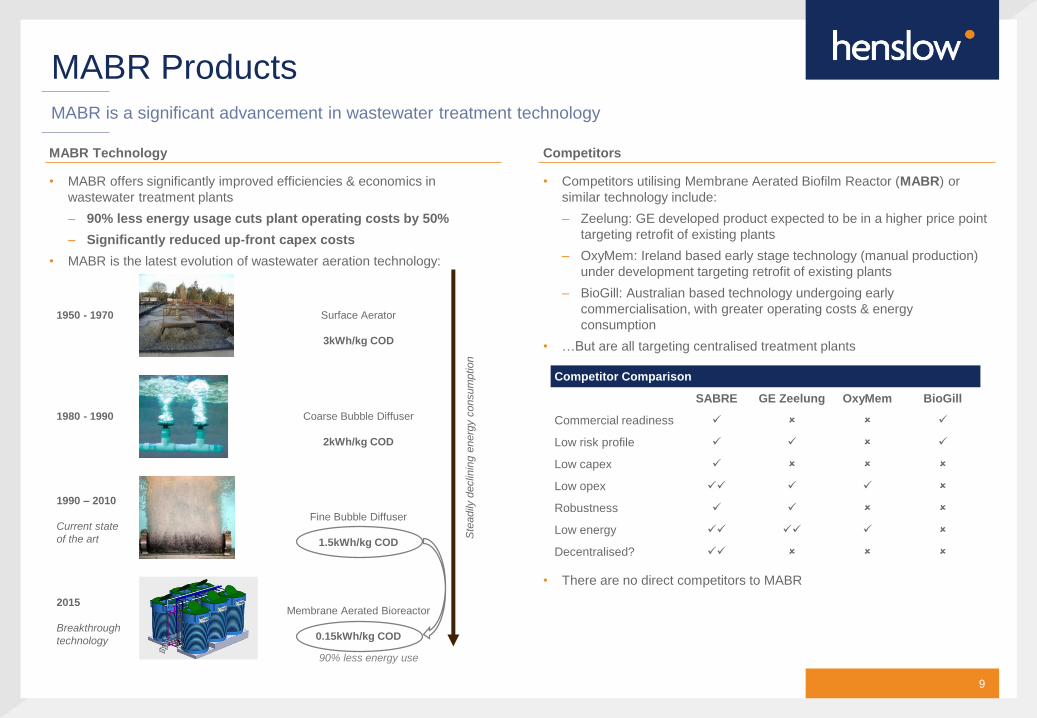
• MABR offers significantly improved efficiencies & economics in
wastewater treatment plants
– 90% less energy usage cuts plant operating costs by 50%
– Significantly reduced up-front capex costs
• MABR is the latest evolution of wastewater aeration technology:
MABR ProductsMABR is a significant advancement in wastewater treatment technology
Competitors
• Competitors utilising Membrane Aerated Biofilm Reactor (MABR) or
similar technology include:
– Zeelung: GE developed product expected to be in a higher price point
targeting retrofit of existing plants
– OxyMem: Ireland based early stage technology (manual production)
under development targeting retrofit of existing plants
– BioGill: Australian based technology undergoing early
commercialisation, with greater operating costs & energy
consumption
• …But are all targeting centralised treatment plants
• There are no direct competitors to MABR
Competitor Comparison
SABRE GE Zeelung OxyMem BioGill
Commercial readiness
Low risk profile
Low capex
Low opex
Robustness
Low energy
Decentralised?
1950 - 1970
1980 - 1990
1990 – 2010
Current state
of the art
2015
Breakthrough
technology
Surface Aerator
3kWh/kg COD
Coarse Bubble Diffuser
2kWh/kg COD
Fine Bubble Diffuser
1.5kWh/kg COD
Membrane Aerated Bioreactor
0.15kWh/kg COD
Ste
adily
declin
ing e
nerg
y c
onsum
ptio
n
90% less energy use
10
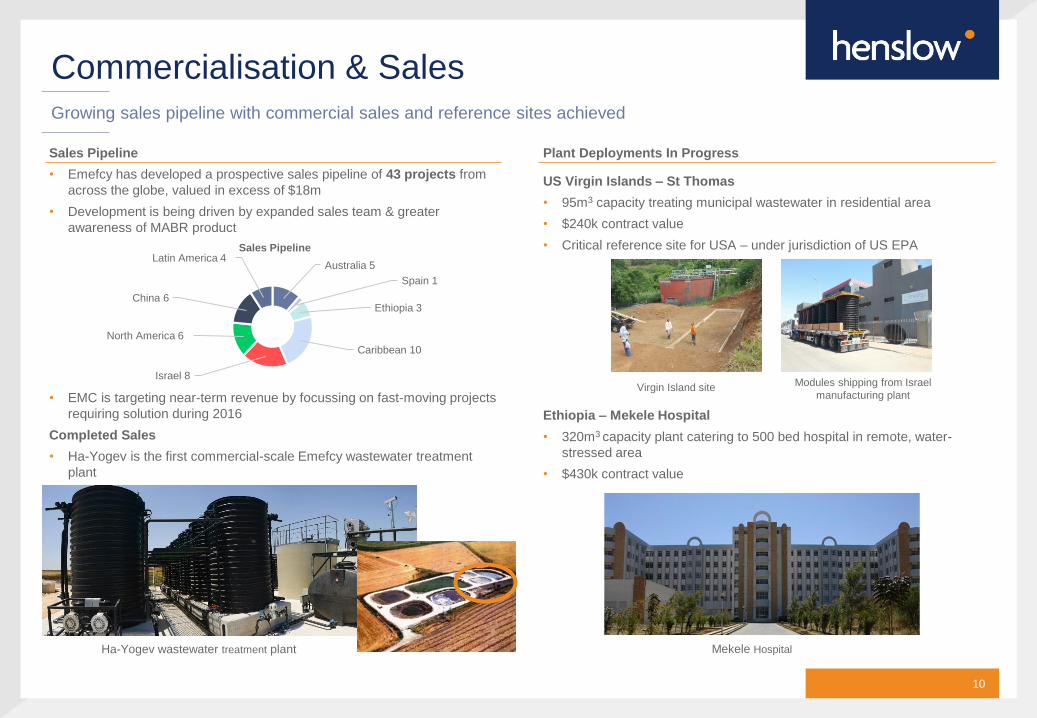
Sales Pipeline
• Emefcy has developed a prospective sales pipeline of 43 projects from
across the globe, valued in excess of $18m
• Development is being driven by expanded sales team & greater
awareness of MABR product
• EMC is targeting near-term revenue by focussing on fast-moving projects
requiring solution during 2016
Completed Sales
• Ha-Yogev is the first commercial-scale Emefcy wastewater treatment
plant
Commercialisation & SalesGrowing sales pipeline with commercial sales and reference sites achieved
Plant Deployments In Progress
US Virgin Islands – St Thomas
• 95m3 capacity treating municipal wastewater in residential area
• $240k contract value
• Critical reference site for USA – under jurisdiction of US EPA
Ethiopia – Mekele Hospital
• 320m3 capacity plant catering to 500 bed hospital in remote, water-
stressed area
• $430k contract value
Ha-Yogev wastewater treatment plant
Australia 5
Spain 1
Ethiopia 3
Caribbean 10
Israel 8
North America 6
China 6
Latin America 4Sales Pipeline
Virgin Island site Modules shipping from Israel
manufacturing plant
Mekele Hospital
2016 Private & Confidential
China Expansion
China is a significant market opportunity for Emefcy, driven by the country’s latest Five Year Plan
12
China
• China is the world’s second largest economy, with GDP of US$13.98
trillion in 2016
• Average GDP growth of 7.8% has been achieved over the last 5 years,
with the central government targeting growth of 6.5% over the next year
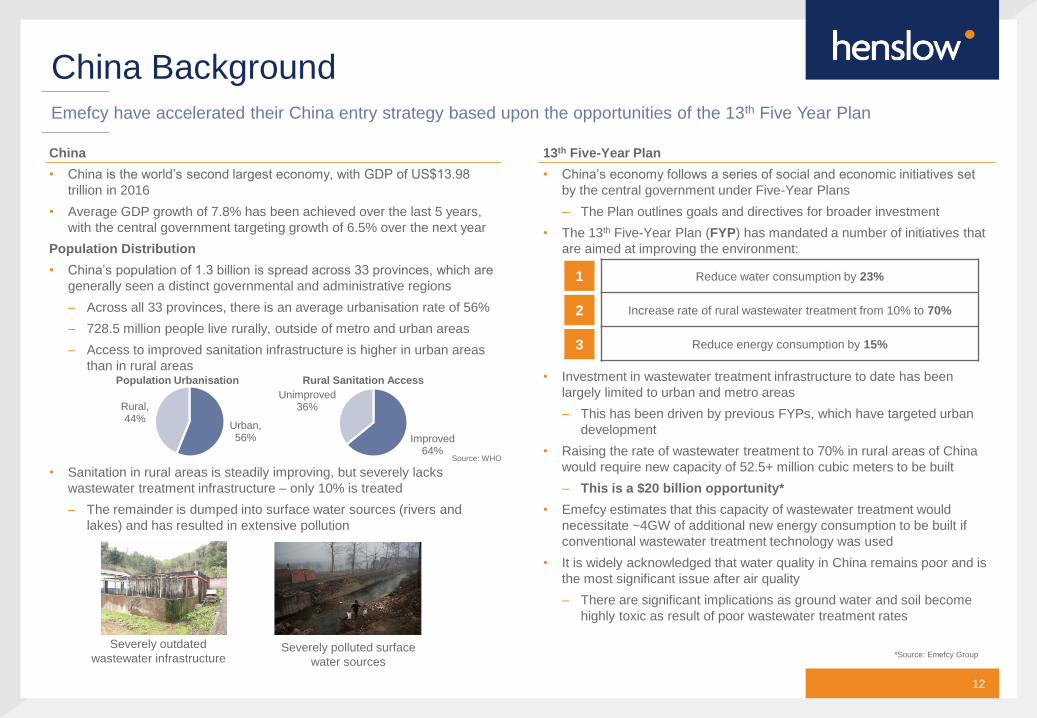
Population Distribution
• China’s population of 1.3 billion is spread across 33 provinces, which are
generally seen a distinct governmental and administrative regions
– Across all 33 provinces, there is an average urbanisation rate of 56%
– 728.5 million people live rurally, outside of metro and urban areas
– Access to improved sanitation infrastructure is higher in urban areas
than in rural areas
• Sanitation in rural areas is steadily improving, but severely lacks
wastewater treatment infrastructure – only 10% is treated
– The remainder is dumped into surface water sources (rivers and
lakes) and has resulted in extensive pollution
China BackgroundEmefcy have accelerated their China entry strategy based upon the opportunities of the 13th Five Year Plan
13th Five-Year Plan
• China’s economy follows a series of social and economic initiatives set
by the central government under Five-Year Plans
– The Plan outlines goals and directives for broader investment
• The 13th Five-Year Plan (FYP) has mandated a number of initiatives that
are aimed at improving the environment:
• Investment in wastewater treatment infrastructure to date has been
largely limited to urban and metro areas
– This has been driven by previous FYPs, which have targeted urban
development
• Raising the rate of wastewater treatment to 70% in rural areas of China
would require new capacity of 52.5+ million cubic meters to be built
– This is a $20 billion opportunity*
• Emefcy estimates that this capacity of wastewater treatment would
necessitate ~4GW of additional new energy consumption to be built if
conventional wastewater treatment technology was used
• It is widely acknowledged that water quality in China remains poor and is
the most significant issue after air quality
– There are significant implications as ground water and soil become
highly toxic as result of poor wastewater treatment rates
Urban, 56%
Rural, 44%
Population Urbanisation
Improved64%
Unimproved36%
Rural Sanitation Access
Reduce water consumption by 23%
Increase rate of rural wastewater treatment from 10% to 70%
Reduce energy consumption by 15%
1
2
3
*Source: Emefcy GroupSeverely outdated
wastewater infrastructureSeverely polluted surface
water sources
Source: WHO

13
Design Responsibility and Authority
• China’s state government has issued the mandate to invest in rural
wastewater treatment plants (WWTPs) under the 13th FYP
– Responsibility and authority for the design of the WWTP is typically
delegated to subordinate levels of government:
• Some provinces may grant concessions where the grantee has authority
to undertake WWTP planning and design for an entire province
• Higher levels of regional government may have internal engineering
capability, and will completely internalise investment planning and design
of the WWTP
• Lower levels of regional government will generally outsource the planning
and design of the WWTP to engineering companies (which may be a
state-owned enterprise or private organisation)
WWTP Investment and FinancingIn China, the responsibility and authority for WWTP design is highly variable
Financing
• Financing for the investment in rural WWTP infrastructure is generally
expected to be in the form of tariffs charged
– User fees charged on a volume basis for the amount of wastewater
treated (taxation)
– Some level of subsidy is expected to supplement these tariffs
• Public-Private Partnerships (PPPs) are the targeted method of deploying
new WWTP infrastructure
• Subsidies provided by the central gov. are costed on the economics of
the current state-of the art wastewater treatment technology
• Infrastructure banks provide project financing on the basis of the 20+
year annuity stream from WWTP operation
State (Central) Gov.
Provincial Gov.
Prefecture Gov.
WWTP Project
Infrastructure bank
Central gov.
Project manager
(Reg. gov. or private coy)
County Gov.
Township Gov.
Issues investment mandate
33 provinces - generally have little input, but some
exceptions may issue concessions
333 prefectures
2,800+ counties
41,000+ townships
Regional
governments are
typically responsible
for making investment
decision, though level
of delegation is highly
variable
Tariff payers
2. Provides up-front financing1.
Issued F
YP
mandate
3. Builds WWTP
4. Provides annuity income
as subsidies and tariffs
5. Shares annuity income 5. Shares annuity income
Source: Emefcy Group
14
Uniquely Suitable for China
• Emefcy’s MABR product is uniquely suited to address the Chinese FYP
mandate, addressing several key directives:
• Size of WWTP will vary with wide range of settlements sizes:
• MABR’s modular nature enables it to scale linearly for both opex & capex
– Conventional technology relies on economies of scale to achieve
efficiency and plants are typically constructed with excess capacity
• At 5,000m3+ capacity, conventional WWTP are generally more economic
China OpportunityEmefcy’s MABR product is highly attractive to potential operators in China
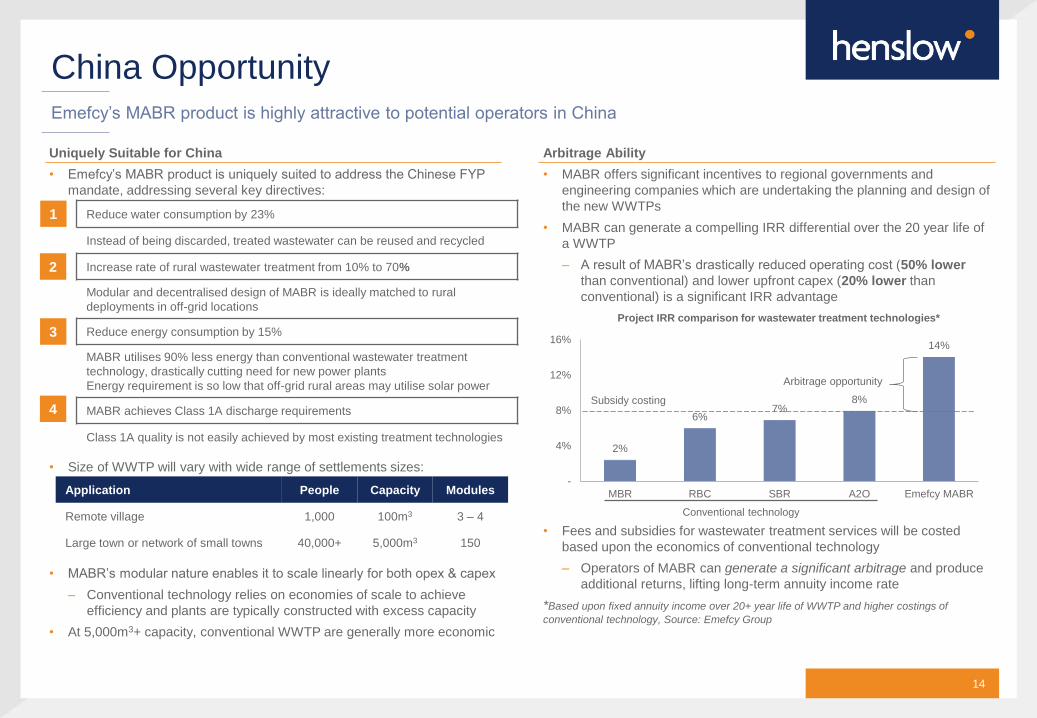
Arbitrage Ability
• MABR offers significant incentives to regional governments and
engineering companies which are undertaking the planning and design of
the new WWTPs
• MABR can generate a compelling IRR differential over the 20 year life of
a WWTP
– A result of MABR’s drastically reduced operating cost (50% lower
than conventional) and lower upfront capex (20% lower than
conventional) is a significant IRR advantage
• Fees and subsidies for wastewater treatment services will be costed
based upon the economics of conventional technology
– Operators of MABR can generate a significant arbitrage and produce
additional returns, lifting long-term annuity income rate
*Based upon fixed annuity income over 20+ year life of WWTP and higher costings of
conventional technology, Source: Emefcy Group
Reduce water consumption by 23%
Instead of being discarded, treated wastewater can be reused and recycled
Increase rate of rural wastewater treatment from 10% to 70%
Modular and decentralised design of MABR is ideally matched to rural
deployments in off-grid locations
Reduce energy consumption by 15%
MABR utilises 90% less energy than conventional wastewater treatment
technology, drastically cutting need for new power plants
Energy requirement is so low that off-grid rural areas may utilise solar power
MABR achieves Class 1A discharge requirements
Class 1A quality is not easily achieved by most existing treatment technologies
1
2
3
2%
6%7%
8%
14%
-
4%
8%
12%
16%
MBR RBC SBR A2O Emefcy MABR
Project IRR comparison for wastewater treatment technologies*
Conventional technology
Arbitrage opportunity
Application People Capacity Modules
Remote village 1,000 100m3 3 – 4
Large town or network of small towns 40,000+ 5,000m3 150
Subsidy costing4
15
Commercialisation
• Emefcy’s China commercialisation strategy is based upon forging deep
partnerships with in-country partners
– Partnerships with established Chinese parties provide leverage,
serving to simultaneously de-risk & accelerate Chinese market entry
• Emefcy has made significant progress down-selecting optimal partners
– 33 parties visited Emefcy with the intention of bringing MABR to the
Chinese market
• The targeted sales-channel partnerships may be categorised as either:
1. State Owned Enterprise (typically holders of large provincial
concessions)
2. Existing private company with expertise in the WWTP industry
3. Private company with civil engineering expertise, but new to the
WWTP industry (may be characterised with ambitions of global
expansion with MABR technology)
• Private operators are generally more nimble and able to act rapidly –
therefore Emefcy are targeting these parties as a priority
Commercialisation StrategyEmefcy will leverage in-country partnerships to navigate the complicated Chinese market
Revenue Model
• Emefcy is seeking to undertake simple B2B sales of its MABR modules
– Upfront sales and collection seek to remove counter-party risk over
the life of a 20+ year annuity stream
– There is significant payment risk associated with long-term annuity
payments, which may be transferred to local partners
• Emefcy will certify quality of plant operations, but will not be involved in
plant operations and management on an ongoing basis – it will be left to
the partners to operate and collect annuity revenue
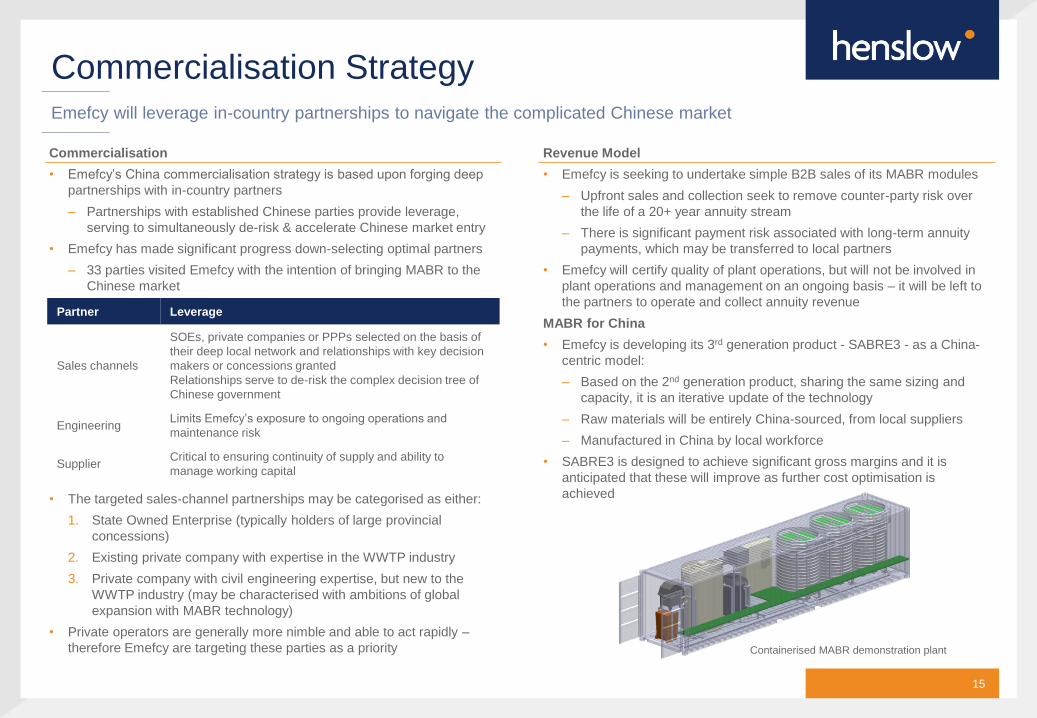
MABR for China
• Emefcy is developing its 3rd generation product - SABRE3 - as a China-
centric model:
– Based on the 2nd generation product, sharing the same sizing and
capacity, it is an iterative update of the technology
– Raw materials will be entirely China-sourced, from local suppliers
– Manufactured in China by local workforce
• SABRE3 is designed to achieve significant gross margins and it is
anticipated that these will improve as further cost optimisation is
achieved
Partner Leverage
Sales channels
SOEs, private companies or PPPs selected on the basis of
their deep local network and relationships with key decision
makers or concessions granted
Relationships serve to de-risk the complex decision tree of
Chinese government
EngineeringLimits Emefcy’s exposure to ongoing operations and
maintenance risk
SupplierCritical to ensuring continuity of supply and ability to
manage working capital
Containerised MABR demonstration plant
16
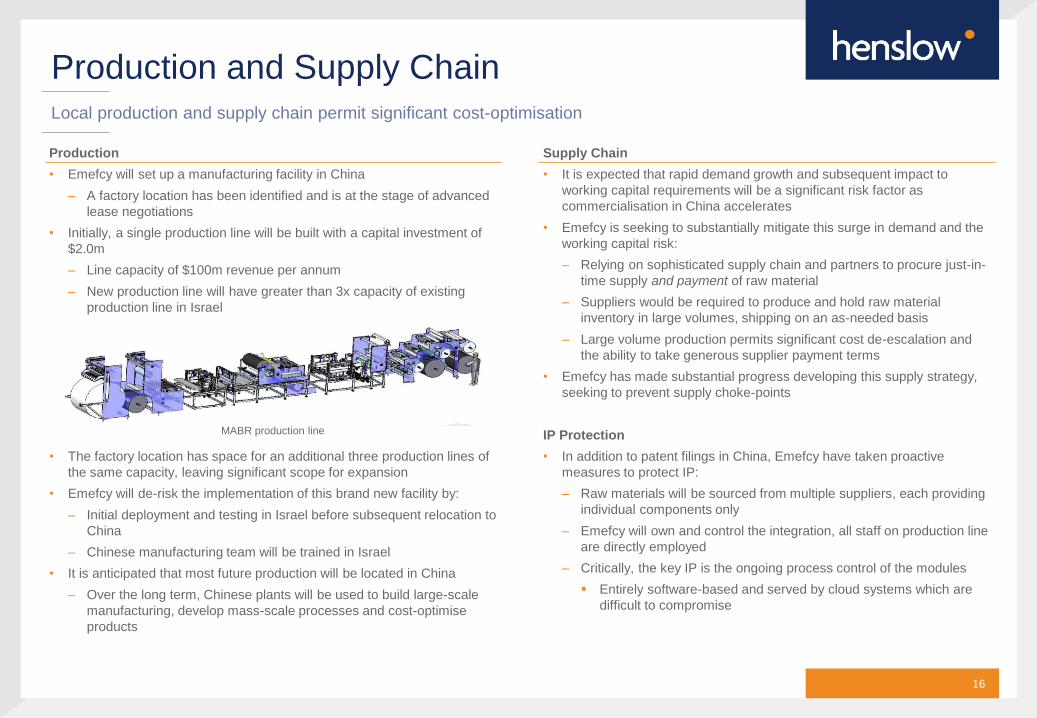
Production
• Emefcy will set up a manufacturing facility in China
– A factory location has been identified and is at the stage of advanced
lease negotiations
• Initially, a single production line will be built with a capital investment of
$2.0m
– Line capacity of $100m revenue per annum
– New production line will have greater than 3x capacity of existing
production line in Israel
• The factory location has space for an additional three production lines of
the same capacity, leaving significant scope for expansion
• Emefcy will de-risk the implementation of this brand new facility by:
– Initial deployment and testing in Israel before subsequent relocation to
China
– Chinese manufacturing team will be trained in Israel
• It is anticipated that most future production will be located in China
– Over the long term, Chinese plants will be used to build large-scale
manufacturing, develop mass-scale processes and cost-optimise
products
Production and Supply ChainLocal production and supply chain permit significant cost-optimisation
Supply Chain
• It is expected that rapid demand growth and subsequent impact to
working capital requirements will be a significant risk factor as
commercialisation in China accelerates
• Emefcy is seeking to substantially mitigate this surge in demand and the
working capital risk:
– Relying on sophisticated supply chain and partners to procure just-in-
time supply and payment of raw material
– Suppliers would be required to produce and hold raw material
inventory in large volumes, shipping on an as-needed basis
– Large volume production permits significant cost de-escalation and
the ability to take generous supplier payment terms
• Emefcy has made substantial progress developing this supply strategy,
seeking to prevent supply choke-points
IP Protection
• In addition to patent filings in China, Emefcy have taken proactive
measures to protect IP:
– Raw materials will be sourced from multiple suppliers, each providing
individual components only
– Emefcy will own and control the integration, all staff on production line
are directly employed
– Critically, the key IP is the ongoing process control of the modules
Entirely software-based and served by cloud systems which are
difficult to compromise
MABR production line

17
Assumptions
1. The critical metric to determine the opportunity in China is the amount of
wastewater treatment capacity required to fulfil the 13th Final Year Plan
(FYP) directives
– Using an average plant size and the possible number of rural
settlements is not applicable, given the large variation of settlement
size (1,000 – 40,000 people)
2. Of the 728.5 million population living in rural areas, the 13th FYP directs
that new WWTPs cater to at least 60%, or 437.1 million
3. This population is spread across 33 provinces, with a generally uniform
amount of wastewater treatment capacity required per person
– Considerations may be made on a mass scale, instead of by plant,
because the economics of MABR scale linearly
Scenario and Returns AnalysisLocal partnerships will dictate access to provinces and will drive speed and scale of rollout
Scenario Analysis
• There are two applicable methods of analysing a rollout scenario:
1. Provincial Segmentation
– Sales channel partners are selected on the basis of their relationships
and concessions granted to build WWTPs, which is generally specific
to a region, driven by the relationship with the relevant government
– Therefore, each sales channel partner is likely to secure a significant
portion of sales at a provincial level (33 total provinces)
– Access and sales to provinces will be substantially driven by securing
partnerships with appropriate partners
Partners are not limited to their home province, but are more likely
to win sales there
Partners are likely to offer multiple WWTP technologies
2. Addressable Marketshare
– Taking 60% of the rural Chinese market as the addressable
opportunity and assuming a given level of market penetration
Current72.9m
Required437.1m
Unserved218.6m
Rural population requiring WWTP service
-
1m
2m
3m
4m
5mRequired wastewater treatment capacity, by province (m3)
Province Segmental Analysis
Average provincial capacity required ~1,589,000m3
Required SABRE3 modules 45,415
Potential revenue $605.5m
Potential revenue (20% probability) $121.1m
Addressable Marketshare Analysis
Market penetration 5.0% 7.5% 10.0% 12.5% 15.0% 17.5% 20.0%
Capacity required (m3) 2.6m 3.9m 5.2m 6.6m 7.9m 9.2m 10.5m
SABRE3 modules req. 0.1m 0.1m 0.1m 0.2m 0.2m 0.3m 0.3m
Potential revenue ($bn) 1.0 1.5 2.0 2.5 3.0 3.5 4.0Source: SACU.org

18
China Commercialisation TimelineEmefcy expects to operate China-based production by 2017, with full-scale production in the following year
2016 2017 2018
Partnerships
Certification
Evaluation period
Expected full-scale production
Deployment
Emefcy is pursuing in-country
partnerships with sales-channels and
suppliers to drive commercialisation
within China
These partnerships include:
• Sales channels
• Engineering
• Supply chain
Emefcy anticipates initial fully paid-for SABRE2 deployments to rapidly take place once
initial sales-channel partnerships have been signed
Initially sourced from Israel production line
Certification from the Health Department is required on a regional basis before mass-deployment
This process seeks to confirm performance of MABR; it is class 1A discharge compliant
It is expected that the first year will see sales made to various regions
on an evaluation basis to confirm performance of technology within
local settings
Emefcy expects that full-scale production will be
commenced at the beginning of 2018
Emefcy will meet increasing demand with additional
production lines as requiredLocal sales and
manufacturing team hired
Manufacturing plant tested
in Israel before China rollout
First SABRE3 unit
produced
2016 Private & Confidential
Water as a Service
Selling water instead of products substantially increases returns to Emefcy

20
WaaS Model Overview:
1. Emefcy sells MABR modules into joint venture with financial partner,
which takes on cost of building & operating (and owning via SPV) the
wastewater treatment plant (WWTP)
– Leverages SABRE technology for low-cost water treatment that is
highly cost-competitive against grid water and sewerage services
with strong arbitrage proposition
2. Customer is supplied water under a water purchase agreement, which
locks-in future costs and guarantees supply at a lower cost
– No need for customer to own or operate a WWTP; WaaS removes
large up-front capex cost & need for skilled WWTP operators
Water as a Service (WaaS)WaaS sells water instead of selling modules
Customer Benefits
• For a given cost of grid-supplied water & sewerage services over a 10-
year period, WaaS offers significant customer cost reductions
• Module purchases offers greater cost reduction, but requires large up-
front capex costs, which can be significant barrier
Cost Reductions
• WaaS can offer significant benefits and immediately earnings benefits
• Water costs typically account for 10% of hotel utility bills
– Any cost reductions realised as result of using WaaS would flow to
bottom line
– WaaS provides the ability to immediately realise a 4.2% lift in
earnings with no required capex
WaaS Key Benefits
Emefcy WaaS Customer
• Long-term & recurring annuity revenue • Capital efficient - no up-front capex
• Full-price up-front sale to SPV • Cost reduction – cheaper than grid
• Guaranteed earnings & rates of return • Lock in future costs – price stability
Customer
Special Purpose Vehicle
Financial Partner
Takes on up-front
capex cost
Receives preferential
cash flow until pre-set
IRR is achieved
Pays reduced costs
for water services
Future water
supplied is secured
SPV owns &
operates WTP
Receives up-front sale
revenue & long-term,
recurring returns
Depreciation
benefit reduces
cost of money
Builds plant and operates
on behalf of SPV
Engineering firm
Best of Both Worlds
Customers have previously faced choice of:
1.Not recycling and saving money, but risking water supply & pricing
2.Recycling and paying more, but locking-in future water prices & supply
WaaS secures customer future water supply at a lower cost
Water Service Costs Before After Reduction
Fresh water (cost per m3) $2.5 $1.5
Wastewater treatment (cost per m3) $3.5 -
WaaS - $2
Total $6 $3.5 42%
Sewerage cost removed
due to WaaS treatment
Fresh water cost reduced due to
increased use of recycled water
21
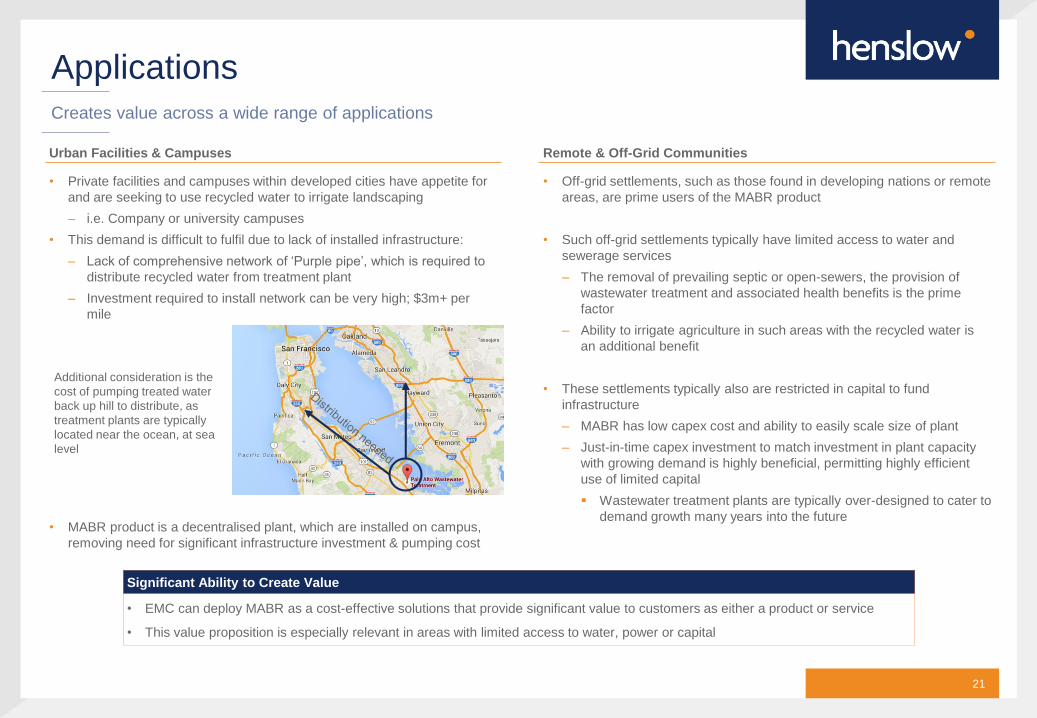
Urban Facilities & Campuses
• Private facilities and campuses within developed cities have appetite for
and are seeking to use recycled water to irrigate landscaping
– i.e. Company or university campuses
• This demand is difficult to fulfil due to lack of installed infrastructure:
– Lack of comprehensive network of ‘Purple pipe’, which is required to
distribute recycled water from treatment plant
– Investment required to install network can be very high; $3m+ per
mile
• MABR product is a decentralised plant, which are installed on campus,
removing need for significant infrastructure investment & pumping cost
ApplicationsCreates value across a wide range of applications
Remote & Off-Grid Communities
• Off-grid settlements, such as those found in developing nations or remote
areas, are prime users of the MABR product
• Such off-grid settlements typically have limited access to water and
sewerage services
– The removal of prevailing septic or open-sewers, the provision of
wastewater treatment and associated health benefits is the prime
factor
– Ability to irrigate agriculture in such areas with the recycled water is
an additional benefit
• These settlements typically also are restricted in capital to fund
infrastructure
– MABR has low capex cost and ability to easily scale size of plant
– Just-in-time capex investment to match investment in plant capacity
with growing demand is highly beneficial, permitting highly efficient
use of limited capital
Wastewater treatment plants are typically over-designed to cater to
demand growth many years into the future
Additional consideration is the
cost of pumping treated water
back up hill to distribute, as
treatment plants are typically
located near the ocean, at sea
level
Significant Ability to Create Value
• EMC can deploy MABR as a cost-effective solutions that provide significant value to customers as either a product or service
• This value proposition is especially relevant in areas with limited access to water, power or capital
22
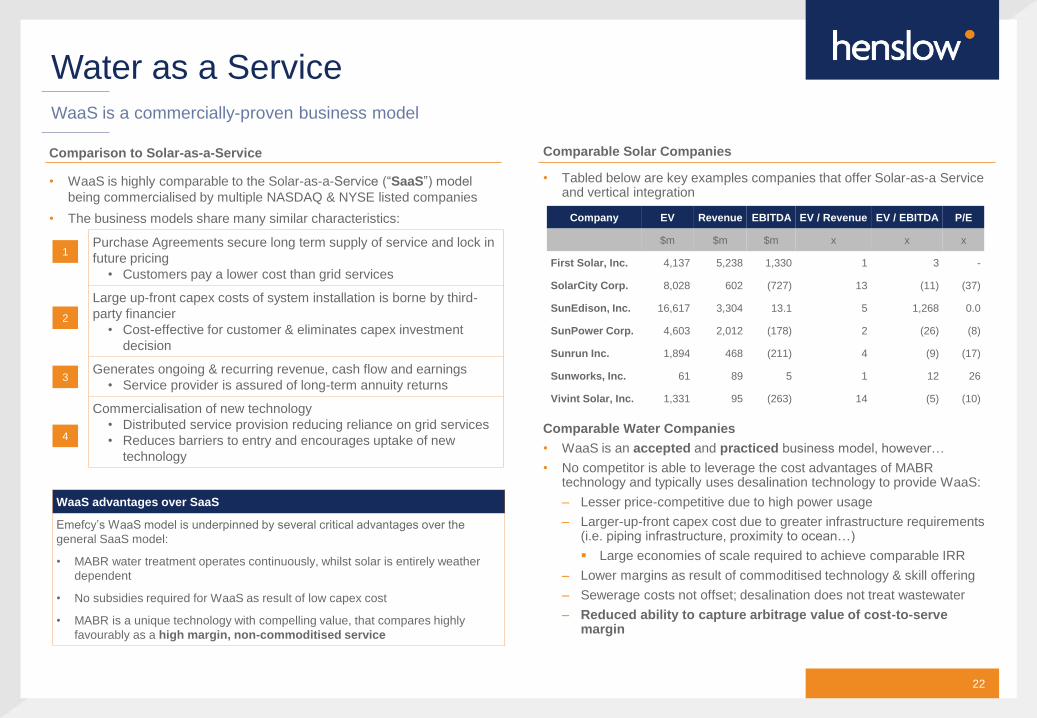
Comparison to Solar-as-a-Service
• WaaS is highly comparable to the Solar-as-a-Service (“SaaS”) model
being commercialised by multiple NASDAQ & NYSE listed companies
• The business models share many similar characteristics:
Water as a ServiceWaaS is a commercially-proven business model
Comparable Solar Companies
• Tabled below are key examples companies that offer Solar-as-a Service and vertical integration
Comparable Water Companies
• WaaS is an accepted and practiced business model, however…
• No competitor is able to leverage the cost advantages of MABR technology and typically uses desalination technology to provide WaaS:
– Lesser price-competitive due to high power usage
– Larger-up-front capex cost due to greater infrastructure requirements (i.e. piping infrastructure, proximity to ocean…)
Large economies of scale required to achieve comparable IRR
– Lower margins as result of commoditised technology & skill offering
– Sewerage costs not offset; desalination does not treat wastewater
– Reduced ability to capture arbitrage value of cost-to-serve margin
Company EV Revenue EBITDA EV / Revenue EV / EBITDA P/E
$m $m $m x x x
First Solar, Inc. 4,137 5,238 1,330 1 3 -
SolarCity Corp. 8,028 602 (727) 13 (11) (37)
SunEdison, Inc. 16,617 3,304 13.1 5 1,268 0.0
SunPower Corp. 4,603 2,012 (178) 2 (26) (8)
Sunrun Inc. 1,894 468 (211) 4 (9) (17)
Sunworks, Inc. 61 89 5 1 12 26
Vivint Solar, Inc. 1,331 95 (263) 14 (5) (10)
WaaS advantages over SaaS
Emefcy’s WaaS model is underpinned by several critical advantages over the
general SaaS model:
• MABR water treatment operates continuously, whilst solar is entirely weather
dependent
• No subsidies required for WaaS as result of low capex cost
• MABR is a unique technology with compelling value, that compares highly
favourably as a high margin, non-commoditised service
Purchase Agreements secure long term supply of service and lock in
future pricing
• Customers pay a lower cost than grid services
Large up-front capex costs of system installation is borne by third-
party financier
• Cost-effective for customer & eliminates capex investment
decision
Generates ongoing & recurring revenue, cash flow and earnings
• Service provider is assured of long-term annuity returns
Commercialisation of new technology
• Distributed service provision reducing reliance on grid services
• Reduces barriers to entry and encourages uptake of new
technology
1
2
3
4
2016 Private & Confidential
Level 8, 446 Collins Street,
Melbourne, Victoria, 3000
T +61 3 8622 3333
www.henslow.com
Henslow Pty Ltd
ABN 38 605 393 137
AFSL 483168
Contact Office Mobile Email
Justin Lewis +61 3 8622 3313 +61 439 162 369 [email protected]
Tim Chapman +61 3 8622 3310 +61 419 897 062 [email protected]
Peter Ward +61 3 8622 3317 +61 414 800 358 [email protected]
Nathan Leong +61 3 8622 3312 +61 408 605 557 [email protected]

24