Embed Size (px)
Citation preview

EMECO State of play, future
development and EMOSDave Mills
CEFAS, Centre for Environment, Fisheries and Aquaculture Sciences
Lowesoft UK
MRI, Brussels, Nov [email protected]
MRI, Brussels, Nov 2011
• Partnership – bottom up
• Integrated approach - EDT
• Whole greater than the sum of its parts
• Make best use of new observational strategies, tools, & technologies
• Research & policy driven community
Creating better evidence & new knowledge
Ferries
Satellites
Research vessels
Gliders
Buoys
Models
Towed bodies
CPR
European Marine Ecosystem Observatory
www.emecogroup.org
An ecosystem based approach

Building the partnerships…
MRI, Brussels, Nov 2011
EMECO – NOOSNorth Sea
Observatory meeting Lowestoft
June 2009
Western Shelf Observatory –
(IBI-ROOS)Kick-Off meeting
AFBI, Belfast June 2010

Why an ecosystem based approach
MRI, Brussels, Nov 2011
• MSFD requires GES by 2020• Management of human activities having an
impact on the marine environment, • Integrating the concepts of environmental
protection and sustainable use• Apply an ecosystem-based approach to the
management of human activities• Regional cooperation at each stage
– Active dialogue between scientists and policy makers to turn ecological data into a useable form

MRI, Brussels, Nov 2011
Turbo-charging observations
• Acoustics• Remote sensing – satellites,
aircraft, radar• Optics – laser particle sizers, flow
cytometry, multispectal sensors• Sensors and probes galore –
optrodes, electrodes, • In situ analysers• Automated water samplers -
multiple variable analysis• Lab on a chip
• Multiplatform – RVs, moorings, ships of opportunity (Ferries), drifters, bottom landers, profilers, towed bodies (CPR, Scanfish), gliders, animals, people (divers, beach goers, sailors)
Data intensive science I

MRI, Brussels, Nov 2011
Ecopath Size – spectra
ECOSYSTEM MODELS
BIOGEOCHEMICAL MODELS
BIOTA – Production, Consumption, Spatial pattern, responses to environmental
change and fishing
Turbo-charging models

Where next - partnerships• UK – Integrated Marine Observing Network• Top down process (MSCC) based largely on
existing resources• Partnership delivering efficiency gains• Research and policy driven observations• Based on UKMMAS infrastructure• Delivering societal benefits: policy, science and
operations
MRI, Brussels, Nov 2011

MRI, Brussels, Nov 2011
EMECO Datatool – Integration & assessment
ICESDelayed mode
Datato
ol In
terface
EMECOAssessment
database
User Q
uery
DataXML, CSV
Assessment map
Time-series
KML–Google Earth
Calibration
Validation
Gridded data
Data ArchiveCentres
Real time
CPR Delayed mode QA’d
Data
Marine Core Service Provision
Delayed mode
Delayed mode
XML

MRI, Brussels, Nov 2011
Marine Integrated Information and Evidence Pipeline
Datato
ol In
terface
Assessmentdatabase
User Q
uery
DataXML, CSV
Assessment map
Time-series/trends
KML–Google Earth
Gridded data
Sea Level
Ocean Color
SST
Sea Ice & Wind
In Situ
Physics
Chemistry
Geology
Biology
Bathymetry
Ur-EMODNET Lots
GMES MCS TAC
CPR
Fish
ICES

MRI, Brussels, Nov 2011
Time series North Sea temperature
www.emecodata.net
Assessment mapTime series chartKML, Data (CSV, SML)
North Sea (OSPAR) UK Maritime Area (CP2)NW European Shelf (1ogrid)Physical (T, S, Waves, SPM)Chemical (N, P, Si, O2)Biological (chlorophyll, benthic species numbers, diversity)
Ship, Buoys (multi
parameter), Wavebuoys,
satellites, models
EMECO Datatools
MRI, Brussels, Nov 2011
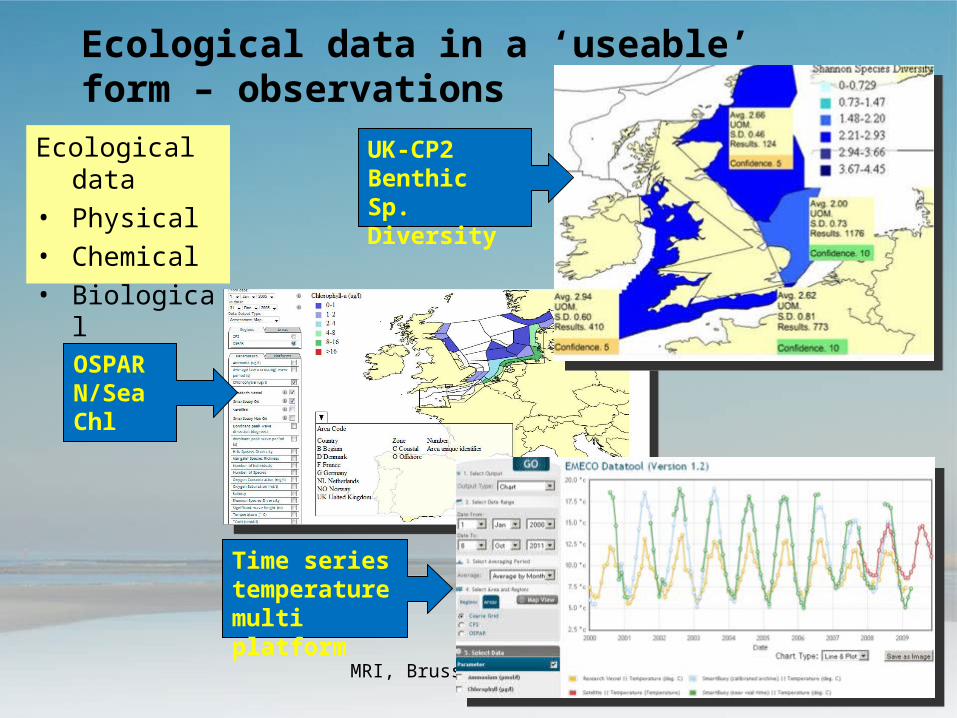
OSPARN/SeaChl
UK-CP2Benthic Sp. Diversity
Ecological data in a ‘useable’ form – observations
Time series temperature multi platform
Ecological data• Physical• Chemical• Biological

MRI, Brussels, Nov 2011Eutrophication – descriptor 5
Useable information – eutrophication assessment

MRI, Brussels, Nov 2011Eutrophication – descriptor 5
Useable information – eutrophication assessment
Other descriptors to follow•Litter•Commercial fisheries•Hydrography (?)

MRI, Brussels, Nov 2011Eutrophication – descriptor 5
Useable information – eutrophication assessment
Other descriptors to follow•Litter•Commercial fisheries•Hydrography (?)
A streamlined ‘on-line’ assessment system that:-“enables rapid integration and assessment of
multi-national, multi-agency multi-platform, and multi-variate ecological
data”

EMECO State of play
• Partnerships, to create better evidence and new knowledge
• Tool to streamline evidence creation from partner data
• Initial focus on North Sea, subsequently Western Shelf
• North Sea partnership based on NOOS consortium
• UK IMON recent development (last week !)

EMECO Datatool - EDT• Enabling technology that streamlines environmental
assessments • Initial focus on eutrophication (OSPAR, MSFD, ND,
UWWTD, WFD) • Current work
– Broadening to other descriptors (Defra)• Litter, Commercial Fisheries, Hydrography (?)
• Risk based approach to monitoring and assessment
– Operationalising EDT (Cefas) (– review compliance)– JERICO Datatool based on EDT engine
• Future work - – FIXO3 (New I3 proposal)– Marine Litter– Uptake into EuroGOOS WG Products

Could EMODNET provide the backbone for a European marine observation system? If not, why? What is lacking?
• Yes – possibly• What purpose will EMOS serve• Will the proposed division of funding for EMODNET
deliver whats needed – will it support ecosystem based management– Problems with biology !
• Clarity about problem(s) to be addressed – ie why do we need EMOS
• Clarity about End User (Funder) and Intermediate User needs is critical
• EMOS needs to be based on a shared vision stretching across the community – Emphasis on co-development of the system, co-ownership and
co-production for its operationMRI, Brussels, Nov 2011

How could they be developed to better serve needs at regional level or at global level
• Regional/global level– Engage with relevant regional /global infrastructures
(policy, programmatic, alliances)
– Being clear about the ‘regional question’ in order to define needs
– Natural system integrity can help to determine correct spatial scale
– Clear links between different parts of the supply chain; from data to information to knowledge and products
– Ensuring solutions (to problems/needs) that are adaptive
– Recognising what is generic and what is specific
– Scaleability
– Aim for operational status – robust, reliable, repeatable etc

• Environmental monitoring/MSFD (policy)– Straight forward where monitoring and assessment
requirements clearly defined (indicators, data needs, reference conditions, targets, measures, confidence requirements etc
• Ocean climate– Real time/delayed mode, forecasting / nowcasting,
operational – Acidfication – ecosystem structure and function
• Industry– Define information products– Use existing infrastructure !
How could they be developed to better serve needs at regional level or at global level

What does useable mean – Future fisheries and environmental assessment needs
• Latest status of marine environment• Monthly time resolution• Set into historical context – long term
time series• Future ‘realistic’ scenarios of
environmental status (much advice based on predictions)
• Method of communication and timing crucial

Summary• Partnerships the flavour of the decade !
• Agreeing to work together easy – making a difference is the challenge
• Clarity about purpose is essential – data management is a means to an end
• Enabling technologies changing the way we can meet need
• EMOS the right way forward
• Need to engage to sustainMRI, Brussels, Nov 2011


Thanks for your attention
MRI, Brussels, Nov 2011

A scientific workflow approach
Workflow
eScience engines !
XMLWeb Services
Databases
Cloud Services
Visualization
After HoweMRI, Brussels, Nov 2011

MRI, Brussels, Nov 2011
Benthic data – Shannon species diversity

MRI, Brussels, Nov 2011
Model results for policy uptake
Ecological data in a ‘useable’ form – model results

MRI, Brussels, Nov 2011
EMECO - Western Shelf Observatory
Map Room
An exercise in scaling !
(www.westernshelfobservatory.org)

EuroGOOS products
MRI, Brussels, Nov 2011

WGOOFEOperational oceanographic products for fisheries and
the environment
MRI, Brussels, Nov 2011


![APPLICATION NOTE 602: SENSORS FOR EMOS 200L · [1] User Manual EMOS 200L (EnOcean) [2] Data Sheet EMOS 200L (EnOcean) [3] Specification Generic Sensor Interface (EnOcean) [4] Data](https://img.pdfslide.us/doc/110x75/5f68721459012164074e81f8/application-note-602-sensors-for-emos-200l-1-user-manual-emos-200l-enocean.jpg)