Embed Size (px)
Citation preview
This report contains a total of 128 pages and may be reproduced in full only. Partial reproduction may only be done with the written consent of CKC Laboratories, Inc.
Texas Instruments
EMC TEST REPORT FOR
Serializer, DS90UB933-Q1
Deserializer, DS90UB934-Q1
Tested to The Following Standards:
CISPR 25 (2008) and ISO 11452-4 (2005)
Report No.: 99145-4
Date of issue: December 19, 2016
This test report bears the accreditation symbol indicating that the testing performed herein meets the test and reporting requirements of ISO/IEC 17025 under the applicable scope of EMC testing for CKC Laboratories, Inc. We strive to create long-term, trust based relationships by providing sound, adaptive, customer first testing services. We embrace each of our customers’ unique EMC challenges, not as an interruption to set processes, but rather as the reason we are in business.
Page 2 of 128 Report No.: 99145-4
TABLE OF CONTENTS
Administrative Information ........................................................................................................................................... 3
Test Report Information ............................................................................................................................................ 3
Report Authorization ................................................................................................................................................. 3
Test Facility Information ............................................................................................................................................ 4
Software Versions ...................................................................................................................................................... 4
Site Registration & Accreditation Information .......................................................................................................... 4
Summary of Results ................................................................................................................................................... 5
Modifications During Testing ..................................................................................................................................... 6
Conditions During Testing.......................................................................................................................................... 6
Equipment Under Test ............................................................................................................................................... 7
CISPR 25 Emissions ........................................................................................................................................................ 8
Section 6.4 – Radiated Emissions .............................................................................................................................. 8
ISO 11452 Immunity .................................................................................................................................................. 120
Immunity Setup and Monitoring ........................................................................................................................... 120
ISO 11452-4 - Bulk Current Injection (BCI) ............................................................................................................. 121
Supplemental Information ........................................................................................................................................ 127
Measurement Uncertainty .................................................................................................................................... 127
Emissions Test Details ............................................................................................................................................ 127
Page 3 of 128 Report No.: 99145-4
ADMINISTRATIVE INFORMATION
Test Report Information REPORT PREPARED FOR:
REPORT PREPARED BY:
Texas Instruments 3875 Kifer Rd Santa Clara, CA 95051
Dianne Dudley CKC Laboratories, Inc. 5046 Sierra Pines Drive Mariposa, CA 95338
Representative: Darryl Jeong Project Number: 99145 Customer Reference Number: 4513178287 DATE OF EQUIPMENT RECEIPT: October 7, 2016 DATE(S) OF TESTING: October 7 – November 11, 2016
Report Authorization The test data contained in this report documents the observed testing parameters pertaining to and are relevant for only the sample equipment tested in the agreed upon operational mode(s) and configuration(s) as identified herein. Compliance assessment remains the client’s responsibility. This report may not be used to claim product endorsement by A2LA or any government agencies. This test report has been authorized for release under quality control from CKC Laboratories, Inc.
Steve Behm
Director of Quality Assurance & Engineering Services CKC Laboratories, Inc.
Page 4 of 128 Report No.: 99145-4
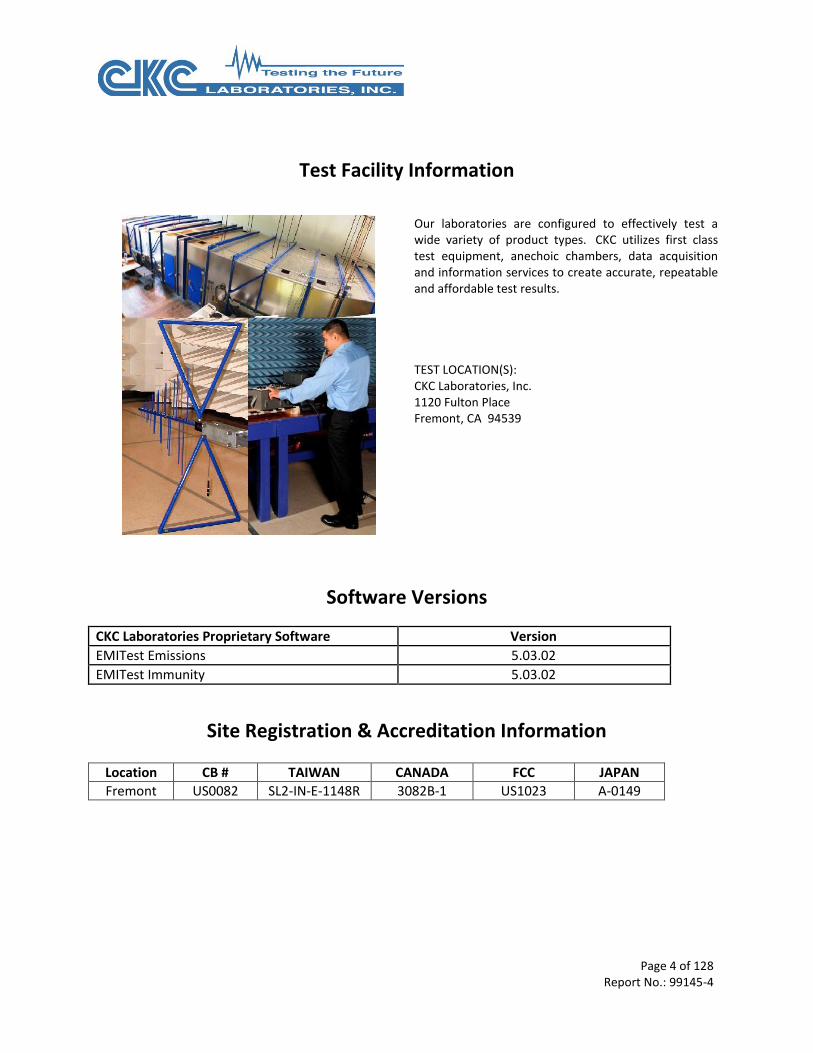
Test Facility Information
Our laboratories are configured to effectively test a wide variety of product types. CKC utilizes first class test equipment, anechoic chambers, data acquisition and information services to create accurate, repeatable and affordable test results. TEST LOCATION(S): CKC Laboratories, Inc. 1120 Fulton Place Fremont, CA 94539
Software Versions
CKC Laboratories Proprietary Software Version
EMITest Emissions 5.03.02
EMITest Immunity 5.03.02
Site Registration & Accreditation Information
Location CB # TAIWAN CANADA FCC JAPAN
Fremont US0082 SL2-IN-E-1148R 3082B-1 US1023 A-0149
Page 5 of 128 Report No.: 99145-4
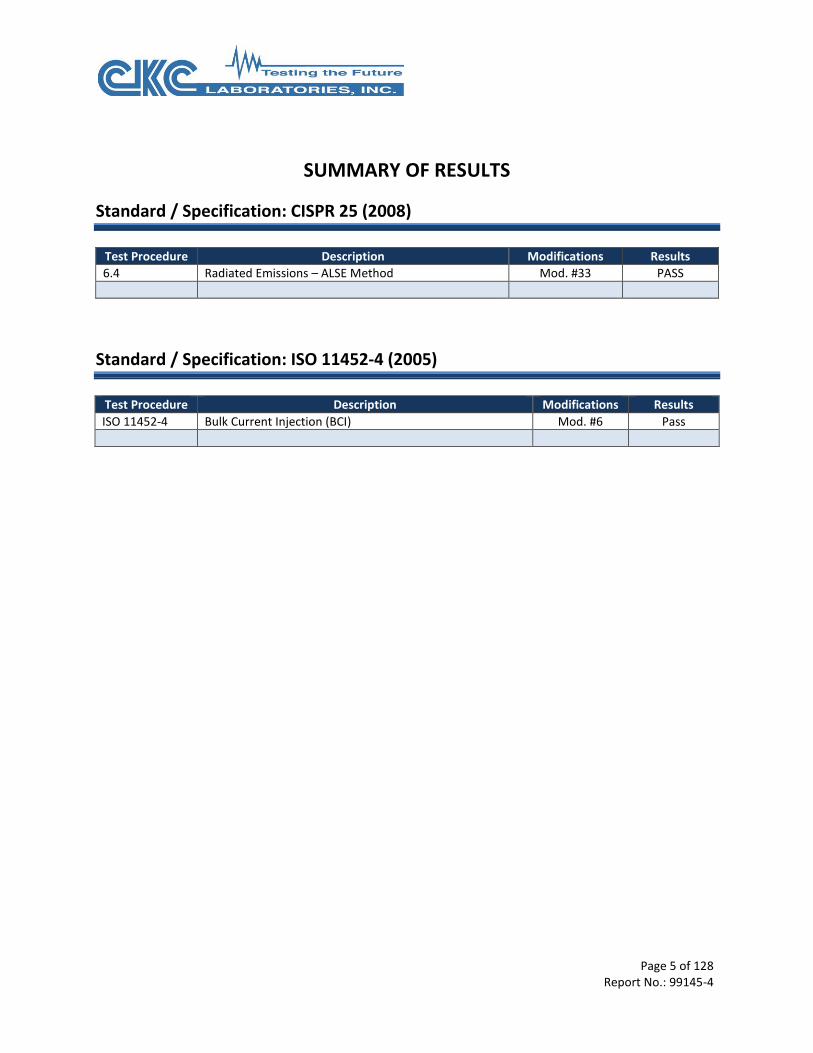
SUMMARY OF RESULTS
Standard / Specification: CISPR 25 (2008)
Test Procedure Description Modifications Results
6.4 Radiated Emissions – ALSE Method Mod. #33 PASS
Standard / Specification: ISO 11452-4 (2005)
Test Procedure Description Modifications Results
ISO 11452-4 Bulk Current Injection (BCI) Mod. #6 Pass
Page 6 of 128 Report No.: 99145-4
Modifications During Testing This list is a summary of the modifications made to the equipment during testing.
Summary of Conditions
MOD #33: 1m Cable – DACAR462
Taped up holes (high speed cable) with copper tape on both boxes
Added a bit more copper tape on entrance of Serializer box
Open Box
Powered up SER & DES
Removed camera
Initialized and wrote to a register 0x3E = 0x13 spread spectrum
No camera
OEN = low
Shorted the Y3 Oscillator
Serializer – reg 0x02 wrote 0xC0
Deserializer – reg 0x14 wrote 0x02, SSCG On, 0x02 =0xC0
Measured approximately 129MHz
Programmed 12-bit mode in 100MHz internal oscillator
Turned on SSCG 0x3E=0x13
Disabled MSP430
Shorted Y3
MOD #6: 1m Cable – DACAR462 Taped up holes (high speed cable) with copper tape on both boxes. Removed lid off of DES & SER Added more copper tape on entrance of Serializer box.
Modifications listed above must be incorporated into all production units.
Conditions During Testing This list is a summary of the conditions noted to the equipment during testing.
Summary of Conditions
None
Page 7 of 128 Report No.: 99145-4
EQUIPMENT UNDER TEST (EUT) During testing, numerous configurations may have been utilized. The configurations listed below support compliance to the standard(s) listed in the Summary of Results section.
Configuration 1 = Configuration A Equipment Tested:
Device Manufacturer Model # S/N
Deserializer Texas Instruments DS90UB934-Q1 None
Serializer Texas Instruments DS90UB933-Q1 None
Support Equipment:
Device Manufacturer Model # S/N
12V Battery DIE HARD 550 CCA M2 None
Page 8 of 128 Report No.: 99145-4
CISPR 25 EMISSIONS
Section 6.4 – Radiated Emissions
Test Setup / Conditions / Data
Seq. # Frequency / Test Polarity / Test Condition
BROADCAST
1 0.15-30MHz / Vertical / Broadcast
14 30-300MHz / Vertical / Broadcast / Mod. 33 in place during testing. / Failing Data
15 30-300MHz / Vertical / Broadcast / Mod. 33 in place during testing. / Failing Data
20 30-300MHz / Vertical / Broadcast / Mod. 33 in place during testing. / Failing Data
23 30-300MHz / Vertical / Broadcast / Mod. 33 in place during testing. / Failing Data
26 30-300MHz / Vertical / Broadcast / Failing Data
27 30-300MHz / Vertical / Broadcast / Failing Data
29 1-2.345GHz / Vertical / Broadcast / AP2 / Mod. 33 in place during testing.
GPS
21 1.567-1.583 / Vertical / GPS / P1 / Mod. 33 in place during testing.
24 1.567-1.583 / Horizontal / GPS / P1 / Mod. 33 in place during testing.
27 1.567-1.583 / Horizontal / GPS / P2 / Mod. 33 in place during testing.
30 1.567-1.583 / Vertical / GPS / P2 / Mod. 33 in place during testing.
MOBILE
2 26-30MHz / Vertical / Mobile
10 300MHz-1GHz / Vertical / Mobile / Mod. 33 in place during testing.
11 300MHz-1GHz / Vertical / Mobile / AMBIENT
12 300MHz-1GHz / Horizontal / Mobile / Mod. 33 in place during testing.
13 300MHz-1GHz / Horizontal / Mobile / AMBIENT
19 1-2.5GHz / Vertical / Mobile / P1 / Mod. 33 in place during testing.
22 1-2.5GHz / Horizontal / Mobile / P1 / Mod. 33 in place during testing.
25 1-2.5GHz / Horizontal / Mobile / P2 / Mod. 33 in place during testing.
28 1-2.5GHz / Vertical / Mobile / P2 / Mod. 33 in place during testing.
Note: P1 = Serializer, P2 = Deserializer
Page 9 of 128 Report No.: 99145-4
Test Location: CKC Laboratories, Inc. • 1120 Fulton Place • Fremont, CA 94539 • (510) 249-1170
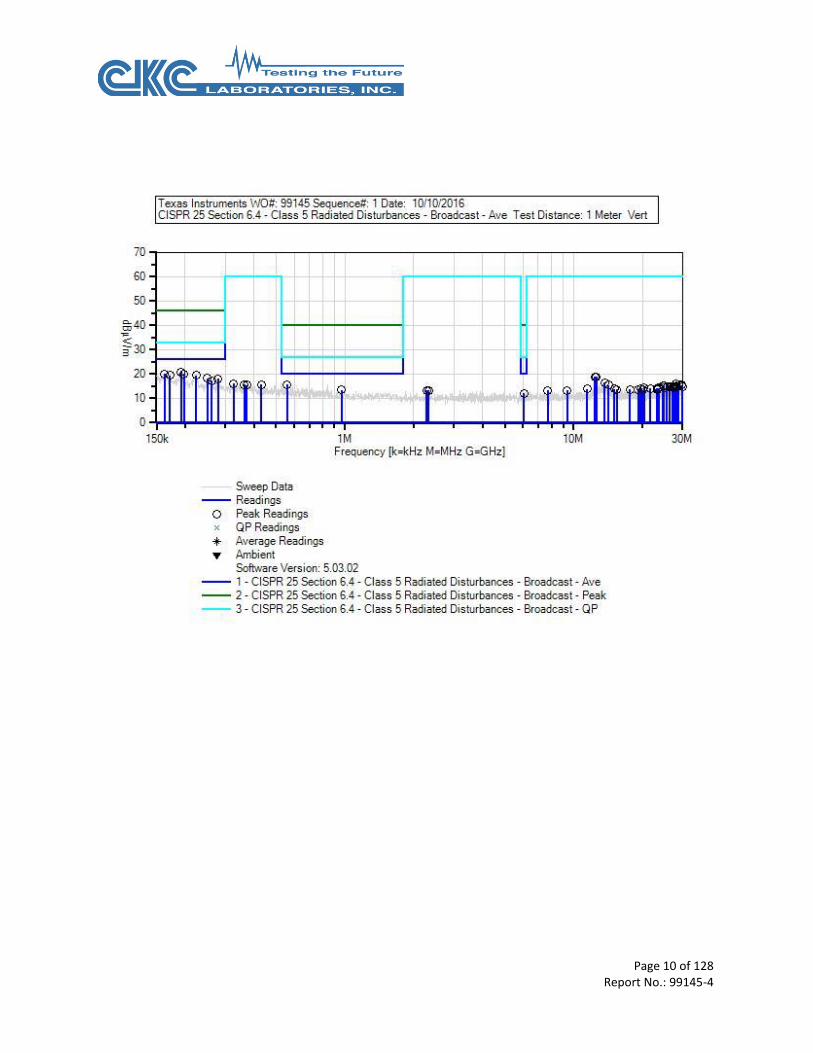
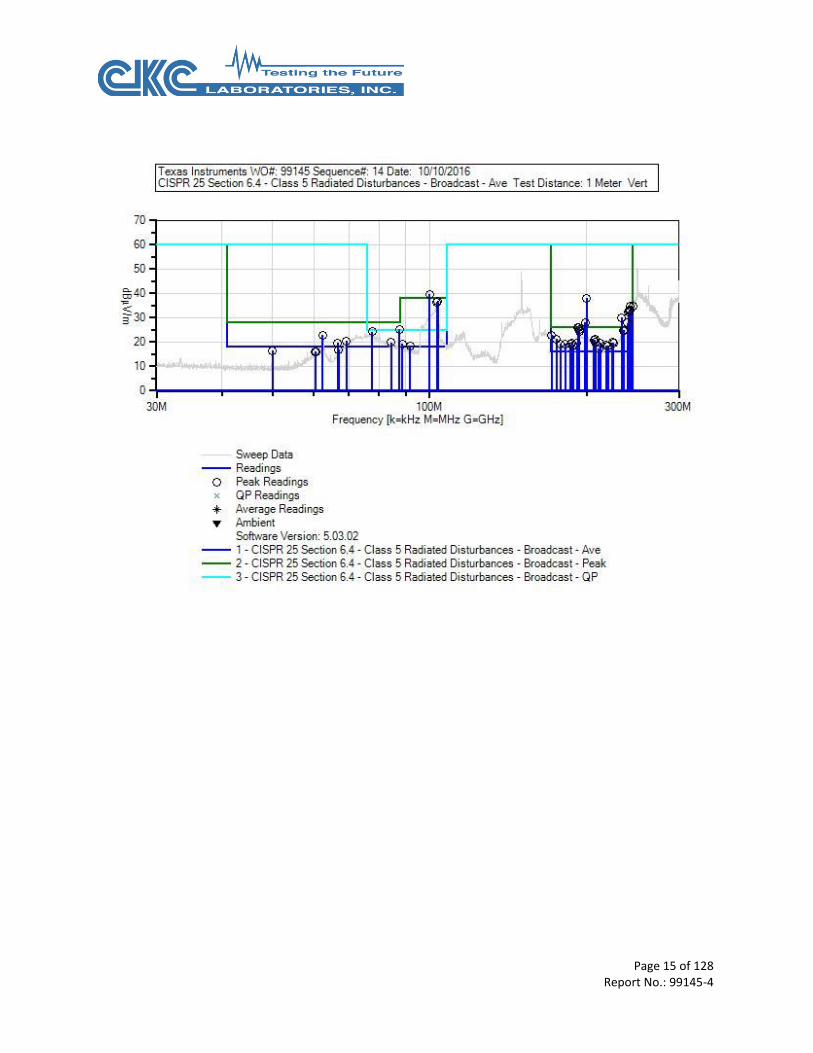
Customer: Texas Instruments Specification: CISPR 25 Section 6.4 - Class 5 Radiated Disturbances - Broadcast - Ave Work Order #: 99145 Date: 10/10/2016
Test Type: Radiated Scan Time: 1:24:40 PM
Tested By: N. Gamez Sequence#: 1
Software: EMITest 5.03.02
Equipment Tested:
Device Manufacturer Model # S/N
Configuration 1
Support Equipment:
Device Manufacturer Model # S/N
Configuration 1
Test Conditions / Notes:
CISPR25 (2008) Sec 6.4.4 Radiated Emissions 0.15-30MHz
Broadcast
Temperature: 23.7°C
Humidity: 49%
Atmospheric Pressure: 101.4kPa
Page 10 of 128 Report No.: 99145-4
Page 11 of 128 Report No.: 99145-4
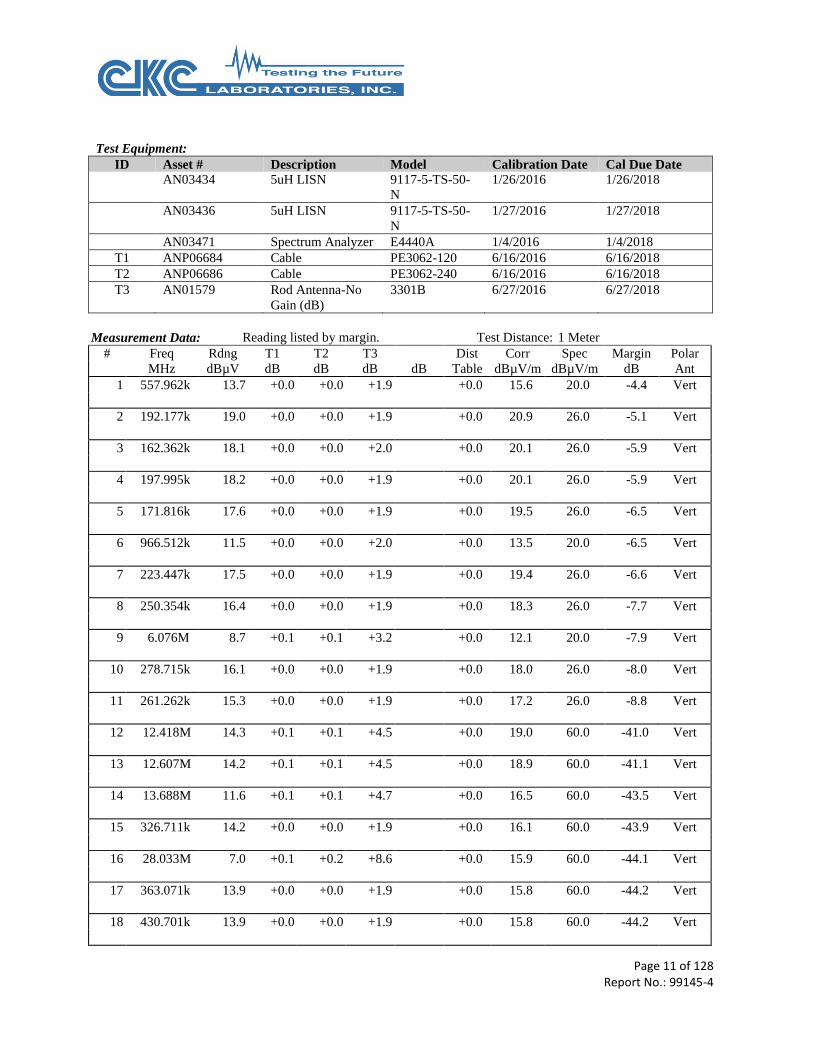
Test Equipment:
ID Asset # Description Model Calibration Date Cal Due Date
AN03434 5uH LISN 9117-5-TS-50-
N
1/26/2016 1/26/2018
AN03436 5uH LISN 9117-5-TS-50-
N
1/27/2016 1/27/2018
AN03471 Spectrum Analyzer E4440A 1/4/2016 1/4/2018
T1 ANP06684 Cable PE3062-120 6/16/2016 6/16/2018
T2 ANP06686 Cable PE3062-240 6/16/2016 6/16/2018
T3 AN01579 Rod Antenna-No
Gain (dB)
3301B 6/27/2016 6/27/2018
Measurement Data: Reading listed by margin. Test Distance: 1 Meter
# Freq Rdng T1 T2 T3 Dist Corr Spec Margin Polar
MHz dBµV dB dB dB dB Table dBµV/m dBµV/m dB Ant
1 557.962k 13.7 +0.0 +0.0 +1.9 +0.0 15.6 20.0 -4.4 Vert
2 192.177k 19.0 +0.0 +0.0 +1.9 +0.0 20.9 26.0 -5.1 Vert
3 162.362k 18.1 +0.0 +0.0 +2.0 +0.0 20.1 26.0 -5.9 Vert
4 197.995k 18.2 +0.0 +0.0 +1.9 +0.0 20.1 26.0 -5.9 Vert
5 171.816k 17.6 +0.0 +0.0 +1.9 +0.0 19.5 26.0 -6.5 Vert
6 966.512k 11.5 +0.0 +0.0 +2.0 +0.0 13.5 20.0 -6.5 Vert
7 223.447k 17.5 +0.0 +0.0 +1.9 +0.0 19.4 26.0 -6.6 Vert
8 250.354k 16.4 +0.0 +0.0 +1.9 +0.0 18.3 26.0 -7.7 Vert
9 6.076M 8.7 +0.1 +0.1 +3.2 +0.0 12.1 20.0 -7.9 Vert
10 278.715k 16.1 +0.0 +0.0 +1.9 +0.0 18.0 26.0 -8.0 Vert
11 261.262k 15.3 +0.0 +0.0 +1.9 +0.0 17.2 26.0 -8.8 Vert
12 12.418M 14.3 +0.1 +0.1 +4.5 +0.0 19.0 60.0 -41.0 Vert
13 12.607M 14.2 +0.1 +0.1 +4.5 +0.0 18.9 60.0 -41.1 Vert
14 13.688M 11.6 +0.1 +0.1 +4.7 +0.0 16.5 60.0 -43.5 Vert
15 326.711k 14.2 +0.0 +0.0 +1.9 +0.0 16.1 60.0 -43.9 Vert
16 28.033M 7.0 +0.1 +0.2 +8.6 +0.0 15.9 60.0 -44.1 Vert
17 363.071k 13.9 +0.0 +0.0 +1.9 +0.0 15.8 60.0 -44.2 Vert
18 430.701k 13.9 +0.0 +0.0 +1.9 +0.0 15.8 60.0 -44.2 Vert
Page 12 of 128 Report No.: 99145-4
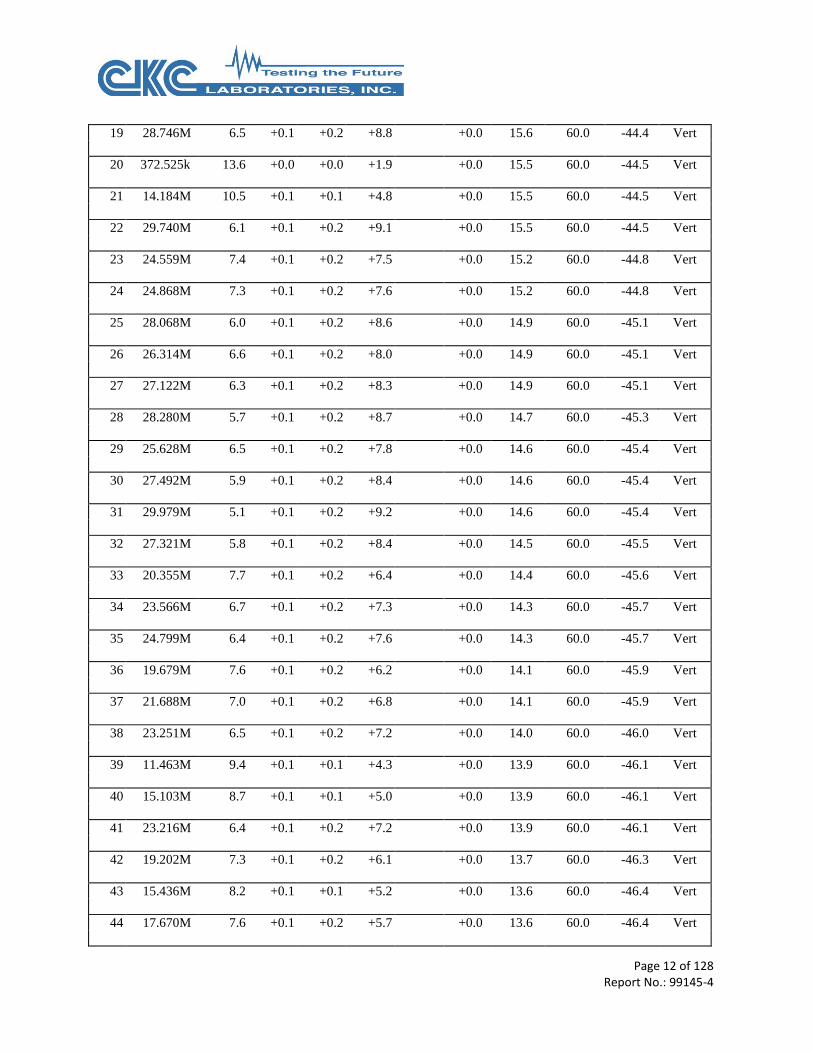
19 28.746M 6.5 +0.1 +0.2 +8.8 +0.0 15.6 60.0 -44.4 Vert
20 372.525k 13.6 +0.0 +0.0 +1.9 +0.0 15.5 60.0 -44.5 Vert
21 14.184M 10.5 +0.1 +0.1 +4.8 +0.0 15.5 60.0 -44.5 Vert
22 29.740M 6.1 +0.1 +0.2 +9.1 +0.0 15.5 60.0 -44.5 Vert
23 24.559M 7.4 +0.1 +0.2 +7.5 +0.0 15.2 60.0 -44.8 Vert
24 24.868M 7.3 +0.1 +0.2 +7.6 +0.0 15.2 60.0 -44.8 Vert
25 28.068M 6.0 +0.1 +0.2 +8.6 +0.0 14.9 60.0 -45.1 Vert
26 26.314M 6.6 +0.1 +0.2 +8.0 +0.0 14.9 60.0 -45.1 Vert
27 27.122M 6.3 +0.1 +0.2 +8.3 +0.0 14.9 60.0 -45.1 Vert
28 28.280M 5.7 +0.1 +0.2 +8.7 +0.0 14.7 60.0 -45.3 Vert
29 25.628M 6.5 +0.1 +0.2 +7.8 +0.0 14.6 60.0 -45.4 Vert
30 27.492M 5.9 +0.1 +0.2 +8.4 +0.0 14.6 60.0 -45.4 Vert
31 29.979M 5.1 +0.1 +0.2 +9.2 +0.0 14.6 60.0 -45.4 Vert
32 27.321M 5.8 +0.1 +0.2 +8.4 +0.0 14.5 60.0 -45.5 Vert
33 20.355M 7.7 +0.1 +0.2 +6.4 +0.0 14.4 60.0 -45.6 Vert
34 23.566M 6.7 +0.1 +0.2 +7.3 +0.0 14.3 60.0 -45.7 Vert
35 24.799M 6.4 +0.1 +0.2 +7.6 +0.0 14.3 60.0 -45.7 Vert
36 19.679M 7.6 +0.1 +0.2 +6.2 +0.0 14.1 60.0 -45.9 Vert
37 21.688M 7.0 +0.1 +0.2 +6.8 +0.0 14.1 60.0 -45.9 Vert
38 23.251M 6.5 +0.1 +0.2 +7.2 +0.0 14.0 60.0 -46.0 Vert
39 11.463M 9.4 +0.1 +0.1 +4.3 +0.0 13.9 60.0 -46.1 Vert
40 15.103M 8.7 +0.1 +0.1 +5.0 +0.0 13.9 60.0 -46.1 Vert
41 23.216M 6.4 +0.1 +0.2 +7.2 +0.0 13.9 60.0 -46.1 Vert
42 19.202M 7.3 +0.1 +0.2 +6.1 +0.0 13.7 60.0 -46.3 Vert
43 15.436M 8.2 +0.1 +0.1 +5.2 +0.0 13.6 60.0 -46.4 Vert
44 17.670M 7.6 +0.1 +0.2 +5.7 +0.0 13.6 60.0 -46.4 Vert
Page 13 of 128 Report No.: 99145-4
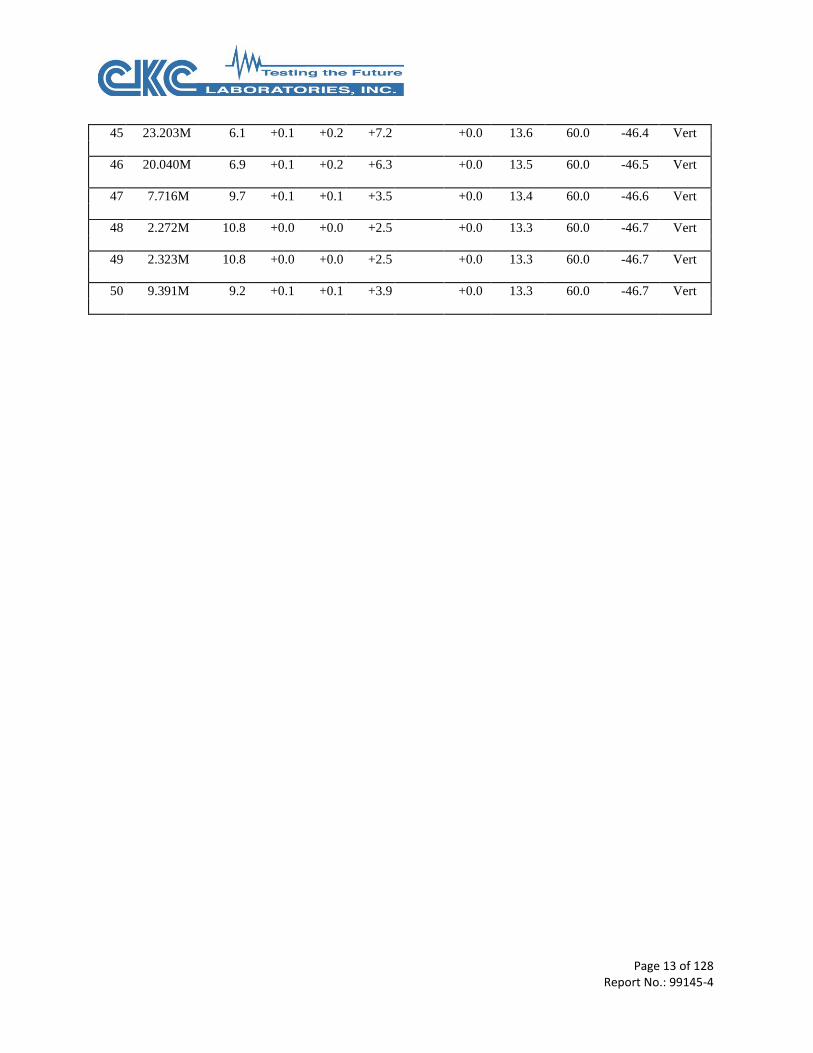
45 23.203M 6.1 +0.1 +0.2 +7.2 +0.0 13.6 60.0 -46.4 Vert
46 20.040M 6.9 +0.1 +0.2 +6.3 +0.0 13.5 60.0 -46.5 Vert
47 7.716M 9.7 +0.1 +0.1 +3.5 +0.0 13.4 60.0 -46.6 Vert
48 2.272M 10.8 +0.0 +0.0 +2.5 +0.0 13.3 60.0 -46.7 Vert
49 2.323M 10.8 +0.0 +0.0 +2.5 +0.0 13.3 60.0 -46.7 Vert
50 9.391M 9.2 +0.1 +0.1 +3.9 +0.0 13.3 60.0 -46.7 Vert

Page 14 of 128 Report No.: 99145-4
Test Location: CKC Laboratories, Inc. • 1120 Fulton Place • Fremont, CA 94539 • (510) 249-1170
Customer: Texas Instruments Specification: CISPR 25 Section 6.4 - Class 5 Radiated Disturbances - Broadcast - Ave Work Order #: 99145 Date: 10/10/2016
Test Type: Radiated Scan Time: 5:21:39 PM
Tested By: N. Gamez Sequence#: 14
Software: EMITest 5.03.02
Equipment Tested:
Device Manufacturer Model # S/N
Configuration 1
Support Equipment:
Device Manufacturer Model # S/N
Configuration 1
Test Conditions / Notes:
CISPR25 (2008) Sec 6.4.4 Radiated Emissions 30-300MHz
Broadcast
Temperature: 23.7°C
Humidity: 49%
Atmospheric Pressure: 101.4kPa
Modification 33 was in place during testing.
Page 15 of 128 Report No.: 99145-4
Page 16 of 128 Report No.: 99145-4
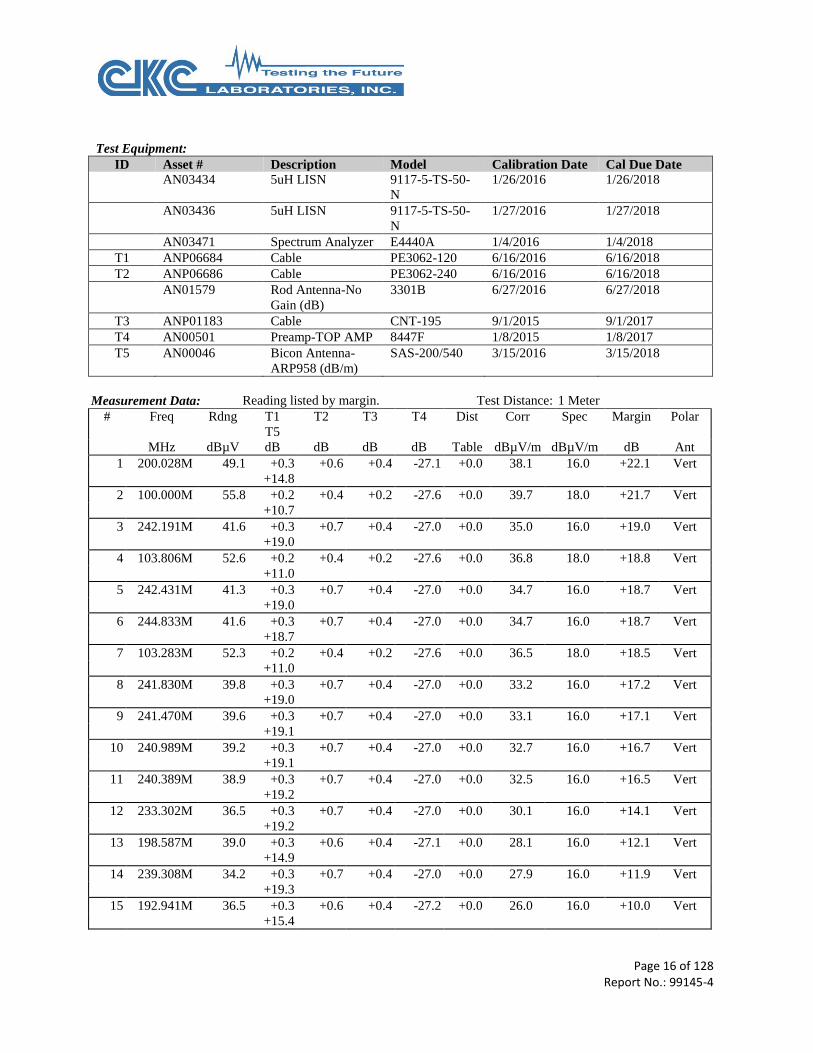
Test Equipment:
ID Asset # Description Model Calibration Date Cal Due Date
AN03434 5uH LISN 9117-5-TS-50-
N
1/26/2016 1/26/2018
AN03436 5uH LISN 9117-5-TS-50-
N
1/27/2016 1/27/2018
AN03471 Spectrum Analyzer E4440A 1/4/2016 1/4/2018
T1 ANP06684 Cable PE3062-120 6/16/2016 6/16/2018
T2 ANP06686 Cable PE3062-240 6/16/2016 6/16/2018
AN01579 Rod Antenna-No
Gain (dB)
3301B 6/27/2016 6/27/2018
T3 ANP01183 Cable CNT-195 9/1/2015 9/1/2017
T4 AN00501 Preamp-TOP AMP 8447F 1/8/2015 1/8/2017
T5 AN00046 Bicon Antenna-
ARP958 (dB/m)
SAS-200/540 3/15/2016 3/15/2018
Measurement Data: Reading listed by margin. Test Distance: 1 Meter
# Freq Rdng T1
T5
T2 T3 T4 Dist Corr Spec Margin Polar
MHz dBµV dB dB dB dB Table dBµV/m dBµV/m dB Ant
1 200.028M 49.1 +0.3
+14.8
+0.6 +0.4 -27.1 +0.0 38.1 16.0 +22.1 Vert
2 100.000M 55.8 +0.2
+10.7
+0.4 +0.2 -27.6 +0.0 39.7 18.0 +21.7 Vert
3 242.191M 41.6 +0.3
+19.0
+0.7 +0.4 -27.0 +0.0 35.0 16.0 +19.0 Vert
4 103.806M 52.6 +0.2
+11.0
+0.4 +0.2 -27.6 +0.0 36.8 18.0 +18.8 Vert
5 242.431M 41.3 +0.3
+19.0
+0.7 +0.4 -27.0 +0.0 34.7 16.0 +18.7 Vert
6 244.833M 41.6 +0.3
+18.7
+0.7 +0.4 -27.0 +0.0 34.7 16.0 +18.7 Vert
7 103.283M 52.3 +0.2
+11.0
+0.4 +0.2 -27.6 +0.0 36.5 18.0 +18.5 Vert
8 241.830M 39.8 +0.3
+19.0
+0.7 +0.4 -27.0 +0.0 33.2 16.0 +17.2 Vert
9 241.470M 39.6 +0.3
+19.1
+0.7 +0.4 -27.0 +0.0 33.1 16.0 +17.1 Vert
10 240.989M 39.2 +0.3
+19.1
+0.7 +0.4 -27.0 +0.0 32.7 16.0 +16.7 Vert
11 240.389M 38.9 +0.3
+19.2
+0.7 +0.4 -27.0 +0.0 32.5 16.0 +16.5 Vert
12 233.302M 36.5 +0.3
+19.2
+0.7 +0.4 -27.0 +0.0 30.1 16.0 +14.1 Vert
13 198.587M 39.0 +0.3
+14.9
+0.6 +0.4 -27.1 +0.0 28.1 16.0 +12.1 Vert
14 239.308M 34.2 +0.3
+19.3
+0.7 +0.4 -27.0 +0.0 27.9 16.0 +11.9 Vert
15 192.941M 36.5 +0.3
+15.4
+0.6 +0.4 -27.2 +0.0 26.0 16.0 +10.0 Vert
Page 17 of 128 Report No.: 99145-4
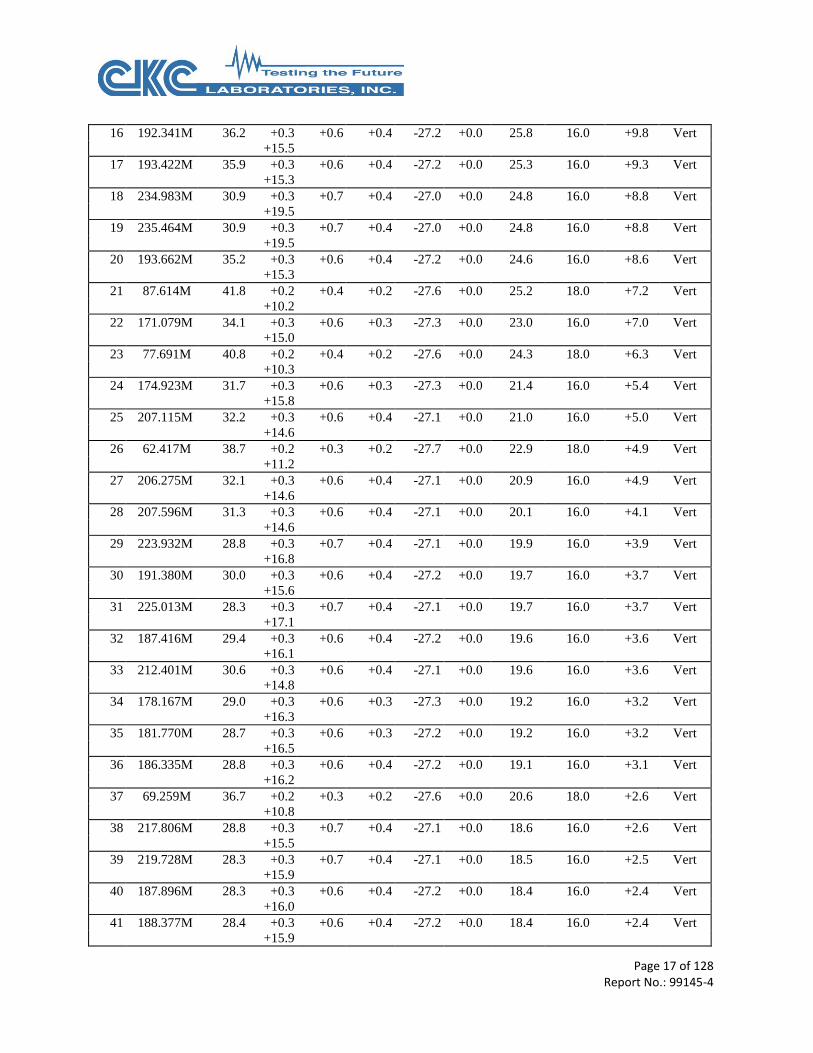
16 192.341M 36.2 +0.3
+15.5
+0.6 +0.4 -27.2 +0.0 25.8 16.0 +9.8 Vert
17 193.422M 35.9 +0.3
+15.3
+0.6 +0.4 -27.2 +0.0 25.3 16.0 +9.3 Vert
18 234.983M 30.9 +0.3
+19.5
+0.7 +0.4 -27.0 +0.0 24.8 16.0 +8.8 Vert
19 235.464M 30.9 +0.3
+19.5
+0.7 +0.4 -27.0 +0.0 24.8 16.0 +8.8 Vert
20 193.662M 35.2 +0.3
+15.3
+0.6 +0.4 -27.2 +0.0 24.6 16.0 +8.6 Vert
21 87.614M 41.8 +0.2
+10.2
+0.4 +0.2 -27.6 +0.0 25.2 18.0 +7.2 Vert
22 171.079M 34.1 +0.3
+15.0
+0.6 +0.3 -27.3 +0.0 23.0 16.0 +7.0 Vert
23 77.691M 40.8 +0.2
+10.3
+0.4 +0.2 -27.6 +0.0 24.3 18.0 +6.3 Vert
24 174.923M 31.7 +0.3
+15.8
+0.6 +0.3 -27.3 +0.0 21.4 16.0 +5.4 Vert
25 207.115M 32.2 +0.3
+14.6
+0.6 +0.4 -27.1 +0.0 21.0 16.0 +5.0 Vert
26 62.417M 38.7 +0.2
+11.2
+0.3 +0.2 -27.7 +0.0 22.9 18.0 +4.9 Vert
27 206.275M 32.1 +0.3
+14.6
+0.6 +0.4 -27.1 +0.0 20.9 16.0 +4.9 Vert
28 207.596M 31.3 +0.3
+14.6
+0.6 +0.4 -27.1 +0.0 20.1 16.0 +4.1 Vert
29 223.932M 28.8 +0.3
+16.8
+0.7 +0.4 -27.1 +0.0 19.9 16.0 +3.9 Vert
30 191.380M 30.0 +0.3
+15.6
+0.6 +0.4 -27.2 +0.0 19.7 16.0 +3.7 Vert
31 225.013M 28.3 +0.3
+17.1
+0.7 +0.4 -27.1 +0.0 19.7 16.0 +3.7 Vert
32 187.416M 29.4 +0.3
+16.1
+0.6 +0.4 -27.2 +0.0 19.6 16.0 +3.6 Vert
33 212.401M 30.6 +0.3
+14.8
+0.6 +0.4 -27.1 +0.0 19.6 16.0 +3.6 Vert
34 178.167M 29.0 +0.3
+16.3
+0.6 +0.3 -27.3 +0.0 19.2 16.0 +3.2 Vert
35 181.770M 28.7 +0.3
+16.5
+0.6 +0.3 -27.2 +0.0 19.2 16.0 +3.2 Vert
36 186.335M 28.8 +0.3
+16.2
+0.6 +0.4 -27.2 +0.0 19.1 16.0 +3.1 Vert
37 69.259M 36.7 +0.2
+10.8
+0.3 +0.2 -27.6 +0.0 20.6 18.0 +2.6 Vert
38 217.806M 28.8 +0.3
+15.5
+0.7 +0.4 -27.1 +0.0 18.6 16.0 +2.6 Vert
39 219.728M 28.3 +0.3
+15.9
+0.7 +0.4 -27.1 +0.0 18.5 16.0 +2.5 Vert
40 187.896M 28.3 +0.3
+16.0
+0.6 +0.4 -27.2 +0.0 18.4 16.0 +2.4 Vert
41 188.377M 28.4 +0.3
+15.9
+0.6 +0.4 -27.2 +0.0 18.4 16.0 +2.4 Vert
Page 18 of 128 Report No.: 99145-4
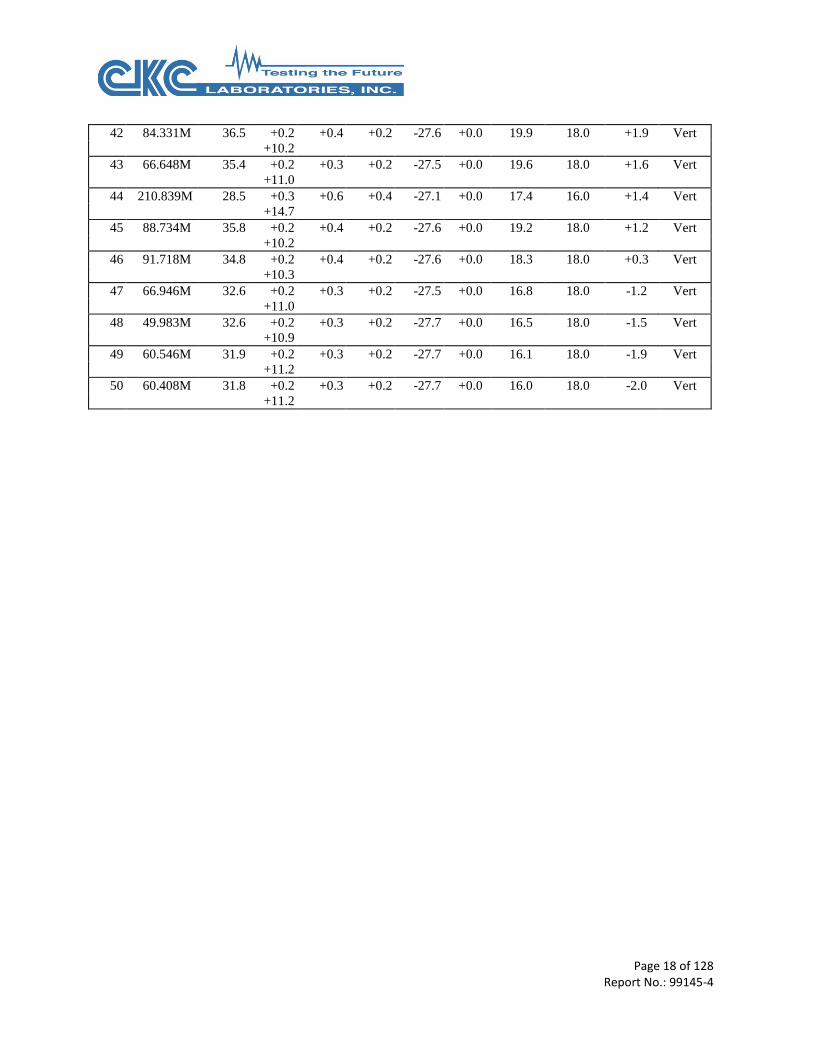
42 84.331M 36.5 +0.2
+10.2
+0.4 +0.2 -27.6 +0.0 19.9 18.0 +1.9 Vert
43 66.648M 35.4 +0.2
+11.0
+0.3 +0.2 -27.5 +0.0 19.6 18.0 +1.6 Vert
44 210.839M 28.5 +0.3
+14.7
+0.6 +0.4 -27.1 +0.0 17.4 16.0 +1.4 Vert
45 88.734M 35.8 +0.2
+10.2
+0.4 +0.2 -27.6 +0.0 19.2 18.0 +1.2 Vert
46 91.718M 34.8 +0.2
+10.3
+0.4 +0.2 -27.6 +0.0 18.3 18.0 +0.3 Vert
47 66.946M 32.6 +0.2
+11.0
+0.3 +0.2 -27.5 +0.0 16.8 18.0 -1.2 Vert
48 49.983M 32.6 +0.2
+10.9
+0.3 +0.2 -27.7 +0.0 16.5 18.0 -1.5 Vert
49 60.546M 31.9 +0.2
+11.2
+0.3 +0.2 -27.7 +0.0 16.1 18.0 -1.9 Vert
50 60.408M 31.8 +0.2
+11.2
+0.3 +0.2 -27.7 +0.0 16.0 18.0 -2.0 Vert

Page 19 of 128 Report No.: 99145-4
Test Location: CKC Laboratories, Inc. • 1120 Fulton Place • Fremont, CA 94539 • (510) 249-1170
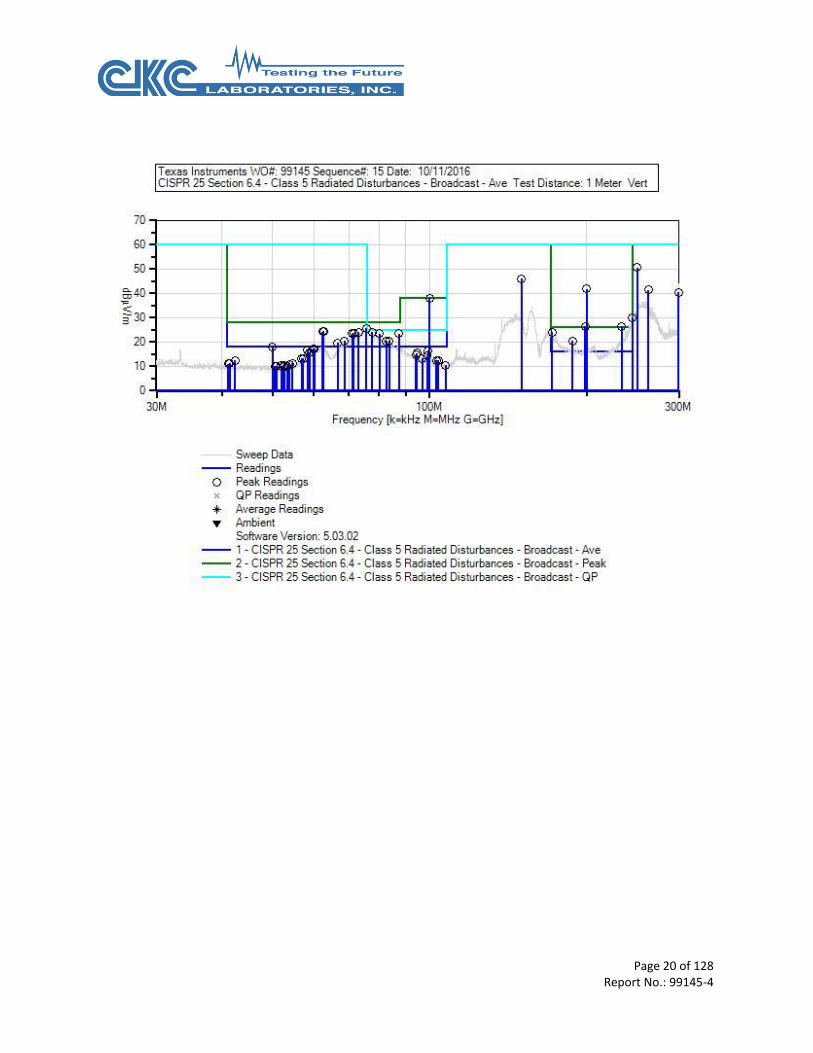
Customer: Texas Instruments Specification: CISPR 25 Section 6.4 - Class 5 Radiated Disturbances - Broadcast - Ave Work Order #: 99145 Date: 10/11/2016
Test Type: Radiated Scan Time: 8:28:51 AM
Tested By: N. Gamez Sequence#: 15
Software: EMITest 5.03.02
Equipment Tested:
Device Manufacturer Model # S/N
Configuration 1
Support Equipment:
Device Manufacturer Model # S/N
Configuration 1
Test Conditions / Notes:
CISPR25 (2008) Sec 6.4.4 Radiated Emissions 30-300MHz
Broadcast
Temperature: 20.4°C
Humidity: 50%
Atmospheric Pressure: 101.5kPa
Modification 33 was in place during testing.
Page 20 of 128 Report No.: 99145-4
Page 21 of 128 Report No.: 99145-4
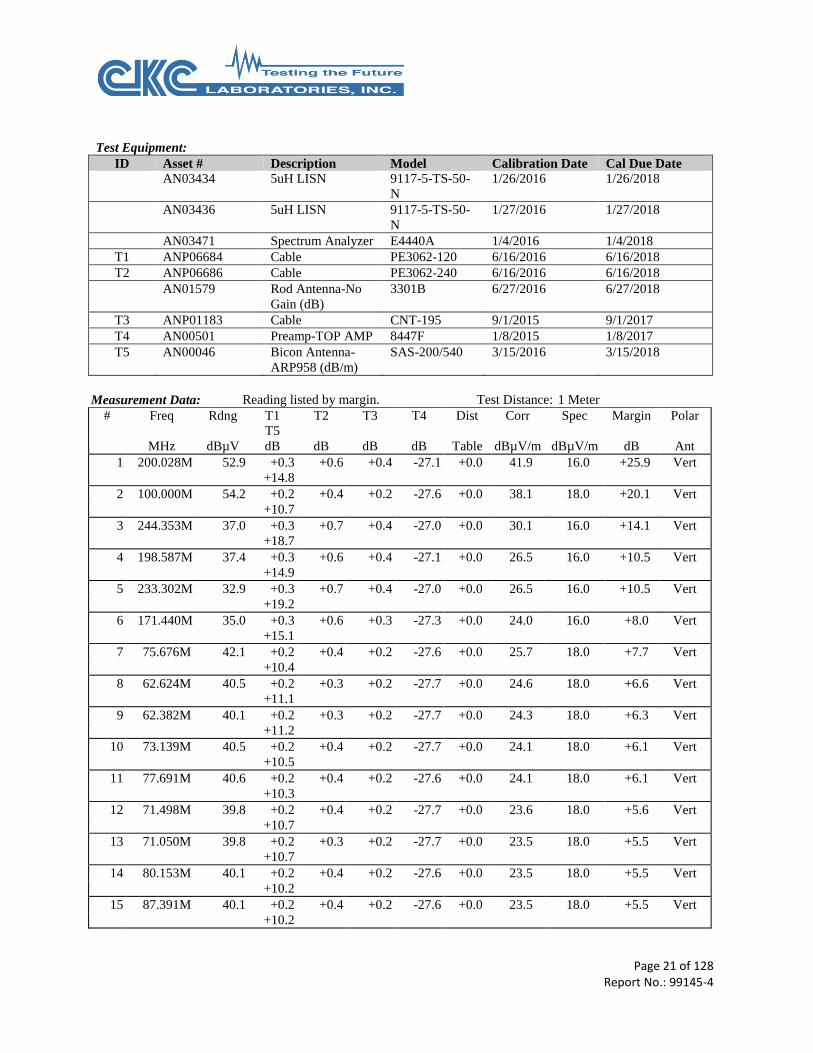
Test Equipment:
ID Asset # Description Model Calibration Date Cal Due Date
AN03434 5uH LISN 9117-5-TS-50-
N
1/26/2016 1/26/2018
AN03436 5uH LISN 9117-5-TS-50-
N
1/27/2016 1/27/2018
AN03471 Spectrum Analyzer E4440A 1/4/2016 1/4/2018
T1 ANP06684 Cable PE3062-120 6/16/2016 6/16/2018
T2 ANP06686 Cable PE3062-240 6/16/2016 6/16/2018
AN01579 Rod Antenna-No
Gain (dB)
3301B 6/27/2016 6/27/2018
T3 ANP01183 Cable CNT-195 9/1/2015 9/1/2017
T4 AN00501 Preamp-TOP AMP 8447F 1/8/2015 1/8/2017
T5 AN00046 Bicon Antenna-
ARP958 (dB/m)
SAS-200/540 3/15/2016 3/15/2018
Measurement Data: Reading listed by margin. Test Distance: 1 Meter
# Freq Rdng T1
T5
T2 T3 T4 Dist Corr Spec Margin Polar
MHz dBµV dB dB dB dB Table dBµV/m dBµV/m dB Ant
1 200.028M 52.9 +0.3
+14.8
+0.6 +0.4 -27.1 +0.0 41.9 16.0 +25.9 Vert
2 100.000M 54.2 +0.2
+10.7
+0.4 +0.2 -27.6 +0.0 38.1 18.0 +20.1 Vert
3 244.353M 37.0 +0.3
+18.7
+0.7 +0.4 -27.0 +0.0 30.1 16.0 +14.1 Vert
4 198.587M 37.4 +0.3
+14.9
+0.6 +0.4 -27.1 +0.0 26.5 16.0 +10.5 Vert
5 233.302M 32.9 +0.3
+19.2
+0.7 +0.4 -27.0 +0.0 26.5 16.0 +10.5 Vert
6 171.440M 35.0 +0.3
+15.1
+0.6 +0.3 -27.3 +0.0 24.0 16.0 +8.0 Vert
7 75.676M 42.1 +0.2
+10.4
+0.4 +0.2 -27.6 +0.0 25.7 18.0 +7.7 Vert
8 62.624M 40.5 +0.2
+11.1
+0.3 +0.2 -27.7 +0.0 24.6 18.0 +6.6 Vert
9 62.382M 40.1 +0.2
+11.2
+0.3 +0.2 -27.7 +0.0 24.3 18.0 +6.3 Vert
10 73.139M 40.5 +0.2
+10.5
+0.4 +0.2 -27.7 +0.0 24.1 18.0 +6.1 Vert
11 77.691M 40.6 +0.2
+10.3
+0.4 +0.2 -27.6 +0.0 24.1 18.0 +6.1 Vert
12 71.498M 39.8 +0.2
+10.7
+0.4 +0.2 -27.7 +0.0 23.6 18.0 +5.6 Vert
13 71.050M 39.8 +0.2
+10.7
+0.3 +0.2 -27.7 +0.0 23.5 18.0 +5.5 Vert
14 80.153M 40.1 +0.2
+10.2
+0.4 +0.2 -27.6 +0.0 23.5 18.0 +5.5 Vert
15 87.391M 40.1 +0.2
+10.2
+0.4 +0.2 -27.6 +0.0 23.5 18.0 +5.5 Vert

Page 22 of 128 Report No.: 99145-4
16 187.656M 30.3 +0.3
+16.0
+0.6 +0.4 -27.2 +0.0 20.4 16.0 +4.4 Vert
17 68.737M 36.5 +0.2
+10.9
+0.3 +0.2 -27.6 +0.0 20.5 18.0 +2.5 Vert
18 83.660M 37.1 +0.2
+10.2
+0.4 +0.2 -27.6 +0.0 20.5 18.0 +2.5 Vert
19 82.541M 37.0 +0.2
+10.2
+0.4 +0.2 -27.6 +0.0 20.4 18.0 +2.4 Vert
20 66.648M 35.4 +0.2
+11.0
+0.3 +0.2 -27.5 +0.0 19.6 18.0 +1.6 Vert
21 50.018M 34.0 +0.2
+10.9
+0.3 +0.2 -27.7 +0.0 17.9 18.0 -0.1 Vert
22 59.923M 33.1 +0.2
+11.2
+0.3 +0.2 -27.7 +0.0 17.3 18.0 -0.7 Vert
23 60.200M 33.1 +0.2
+11.2
+0.3 +0.2 -27.7 +0.0 17.3 18.0 -0.7 Vert
24 58.330M 32.7 +0.2
+11.1
+0.3 +0.2 -27.7 +0.0 16.8 18.0 -1.2 Vert
25 99.254M 32.7 +0.2
+10.6
+0.4 +0.2 -27.6 +0.0 16.5 18.0 -1.5 Vert
26 58.919M 31.5 +0.2
+11.1
+0.3 +0.2 -27.7 +0.0 15.6 18.0 -2.4 Vert
27 94.554M 31.8 +0.2
+10.4
+0.4 +0.2 -27.6 +0.0 15.4 18.0 -2.6 Vert
28 94.255M 31.0 +0.2
+10.4
+0.4 +0.2 -27.6 +0.0 14.6 18.0 -3.4 Vert
29 98.881M 30.5 +0.2
+10.6
+0.4 +0.2 -27.6 +0.0 14.3 18.0 -3.7 Vert
30 56.841M 29.3 +0.2
+11.0
+0.3 +0.2 -27.7 +0.0 13.3 18.0 -4.7 Vert
31 57.291M 29.3 +0.2
+11.0
+0.3 +0.2 -27.7 +0.0 13.3 18.0 -4.7 Vert
32 96.867M 29.5 +0.2
+10.5
+0.4 +0.2 -27.6 +0.0 13.2 18.0 -4.8 Vert
33 103.134M 28.4 +0.2
+11.0
+0.4 +0.2 -27.6 +0.0 12.6 18.0 -5.4 Vert
34 103.955M 28.2 +0.2
+11.1
+0.4 +0.2 -27.6 +0.0 12.5 18.0 -5.5 Vert
35 42.399M 28.2 +0.2
+11.4
+0.3 +0.1 -27.8 +0.0 12.4 18.0 -5.6 Vert
36 41.394M 27.0 +0.2
+11.5
+0.3 +0.1 -27.8 +0.0 11.3 18.0 -6.7 Vert
37 54.589M 27.3 +0.2
+10.9
+0.3 +0.2 -27.7 +0.0 11.2 18.0 -6.8 Vert
38 41.117M 26.8 +0.2
+11.5
+0.3 +0.1 -27.8 +0.0 11.1 18.0 -6.9 Vert
39 53.931M 26.9 +0.2
+10.9
+0.3 +0.2 -27.7 +0.0 10.8 18.0 -7.2 Vert
40 107.387M 25.8 +0.2
+11.5
+0.4 +0.2 -27.6 +0.0 10.5 18.0 -7.5 Vert
41 52.511M 26.5 +0.2
+10.9
+0.3 +0.2 -27.7 +0.0 10.4 18.0 -7.6 Vert

Page 23 of 128 Report No.: 99145-4
42 52.027M 26.4 +0.2
+10.9
+0.3 +0.2 -27.7 +0.0 10.3 18.0 -7.7 Vert
43 50.884M 26.2 +0.2
+10.9
+0.3 +0.2 -27.7 +0.0 10.1 18.0 -7.9 Vert
44 50.537M 26.1 +0.2
+10.9
+0.3 +0.2 -27.7 +0.0 10.0 18.0 -8.0 Vert
45 52.615M 26.0 +0.2
+10.9
+0.3 +0.2 -27.7 +0.0 9.9 18.0 -8.1 Vert
46 53.308M 26.0 +0.2
+10.9
+0.3 +0.2 -27.7 +0.0 9.9 18.0 -8.1 Vert
47 249.998M 58.0 +0.3
+18.1
+0.7 +0.4 -26.9 +0.0 50.6 60.0 -9.4 Vert
48 149.938M 59.4 +0.3
+12.9
+0.5 +0.3 -27.4 +0.0 46.0 60.0 -14.0 Vert
49 262.578M 48.8 +0.4
+18.1
+0.7 +0.4 -26.9 +0.0 41.5 60.0 -18.5 Vert
50 299.919M 41.6 +0.4
+24.2
+0.8 +0.5 -26.9 +0.0 40.6 60.0 -19.4 Vert
Page 24 of 128 Report No.: 99145-4
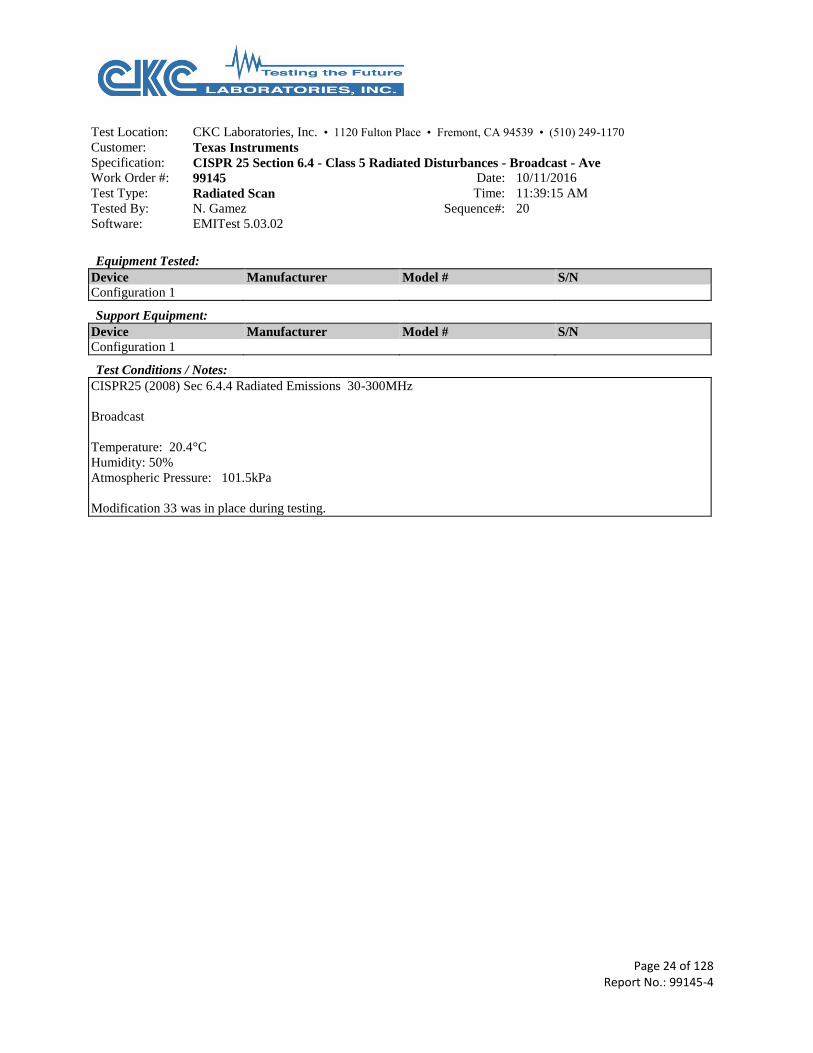
Test Location: CKC Laboratories, Inc. • 1120 Fulton Place • Fremont, CA 94539 • (510) 249-1170
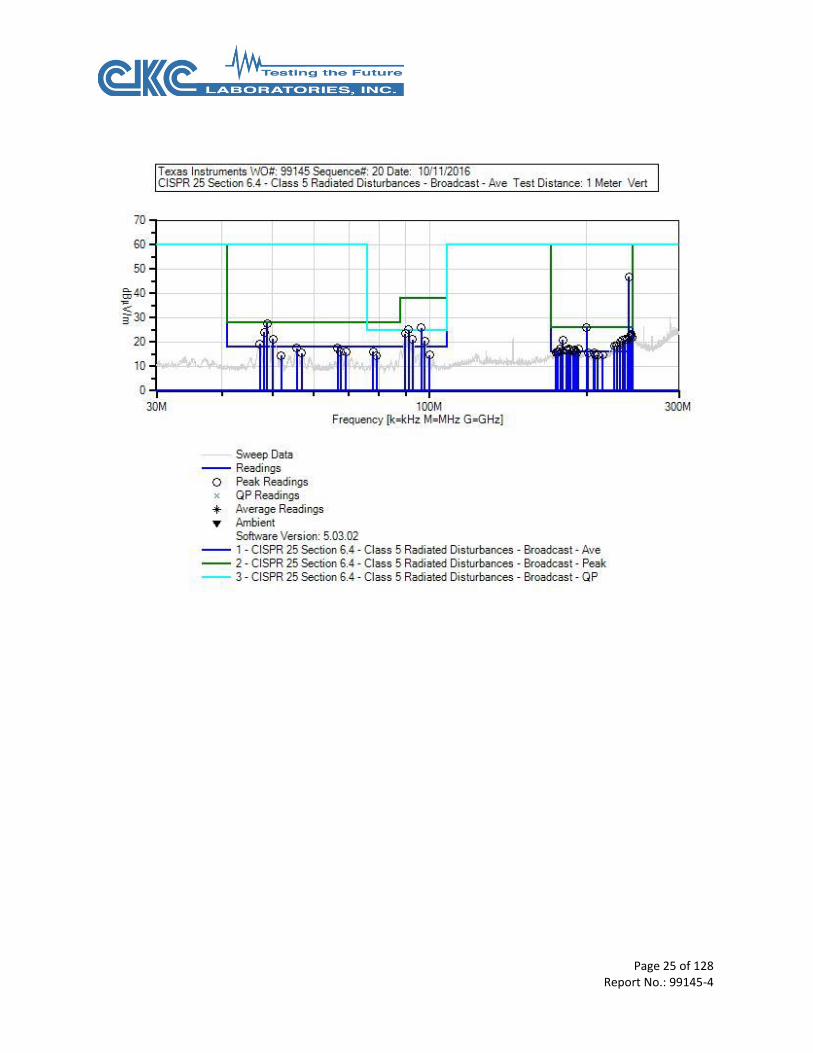
Customer: Texas Instruments Specification: CISPR 25 Section 6.4 - Class 5 Radiated Disturbances - Broadcast - Ave Work Order #: 99145 Date: 10/11/2016
Test Type: Radiated Scan Time: 11:39:15 AM
Tested By: N. Gamez Sequence#: 20
Software: EMITest 5.03.02
Equipment Tested:
Device Manufacturer Model # S/N
Configuration 1
Support Equipment:
Device Manufacturer Model # S/N
Configuration 1
Test Conditions / Notes:
CISPR25 (2008) Sec 6.4.4 Radiated Emissions 30-300MHz
Broadcast
Temperature: 20.4°C
Humidity: 50%
Atmospheric Pressure: 101.5kPa
Modification 33 was in place during testing.
Page 25 of 128 Report No.: 99145-4
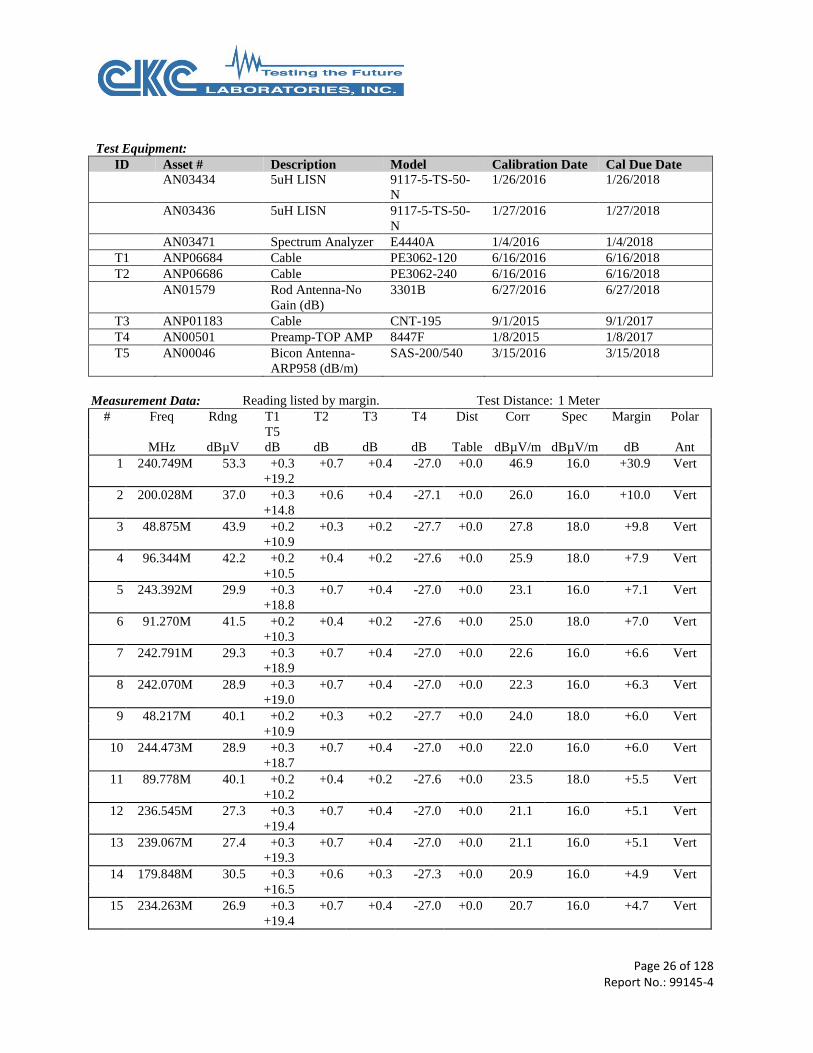
Page 26 of 128 Report No.: 99145-4
Test Equipment:
ID Asset # Description Model Calibration Date Cal Due Date
AN03434 5uH LISN 9117-5-TS-50-
N
1/26/2016 1/26/2018
AN03436 5uH LISN 9117-5-TS-50-
N
1/27/2016 1/27/2018
AN03471 Spectrum Analyzer E4440A 1/4/2016 1/4/2018
T1 ANP06684 Cable PE3062-120 6/16/2016 6/16/2018
T2 ANP06686 Cable PE3062-240 6/16/2016 6/16/2018
AN01579 Rod Antenna-No
Gain (dB)
3301B 6/27/2016 6/27/2018
T3 ANP01183 Cable CNT-195 9/1/2015 9/1/2017
T4 AN00501 Preamp-TOP AMP 8447F 1/8/2015 1/8/2017
T5 AN00046 Bicon Antenna-
ARP958 (dB/m)
SAS-200/540 3/15/2016 3/15/2018
Measurement Data: Reading listed by margin. Test Distance: 1 Meter
# Freq Rdng T1
T5
T2 T3 T4 Dist Corr Spec Margin Polar
MHz dBµV dB dB dB dB Table dBµV/m dBµV/m dB Ant
1 240.749M 53.3 +0.3
+19.2
+0.7 +0.4 -27.0 +0.0 46.9 16.0 +30.9 Vert
2 200.028M 37.0 +0.3
+14.8
+0.6 +0.4 -27.1 +0.0 26.0 16.0 +10.0 Vert
3 48.875M 43.9 +0.2
+10.9
+0.3 +0.2 -27.7 +0.0 27.8 18.0 +9.8 Vert
4 96.344M 42.2 +0.2
+10.5
+0.4 +0.2 -27.6 +0.0 25.9 18.0 +7.9 Vert
5 243.392M 29.9 +0.3
+18.8
+0.7 +0.4 -27.0 +0.0 23.1 16.0 +7.1 Vert
6 91.270M 41.5 +0.2
+10.3
+0.4 +0.2 -27.6 +0.0 25.0 18.0 +7.0 Vert
7 242.791M 29.3 +0.3
+18.9
+0.7 +0.4 -27.0 +0.0 22.6 16.0 +6.6 Vert
8 242.070M 28.9 +0.3
+19.0
+0.7 +0.4 -27.0 +0.0 22.3 16.0 +6.3 Vert
9 48.217M 40.1 +0.2
+10.9
+0.3 +0.2 -27.7 +0.0 24.0 18.0 +6.0 Vert
10 244.473M 28.9 +0.3
+18.7
+0.7 +0.4 -27.0 +0.0 22.0 16.0 +6.0 Vert
11 89.778M 40.1 +0.2
+10.2
+0.4 +0.2 -27.6 +0.0 23.5 18.0 +5.5 Vert
12 236.545M 27.3 +0.3
+19.4
+0.7 +0.4 -27.0 +0.0 21.1 16.0 +5.1 Vert
13 239.067M 27.4 +0.3
+19.3
+0.7 +0.4 -27.0 +0.0 21.1 16.0 +5.1 Vert
14 179.848M 30.5 +0.3
+16.5
+0.6 +0.3 -27.3 +0.0 20.9 16.0 +4.9 Vert
15 234.263M 26.9 +0.3
+19.4
+0.7 +0.4 -27.0 +0.0 20.7 16.0 +4.7 Vert
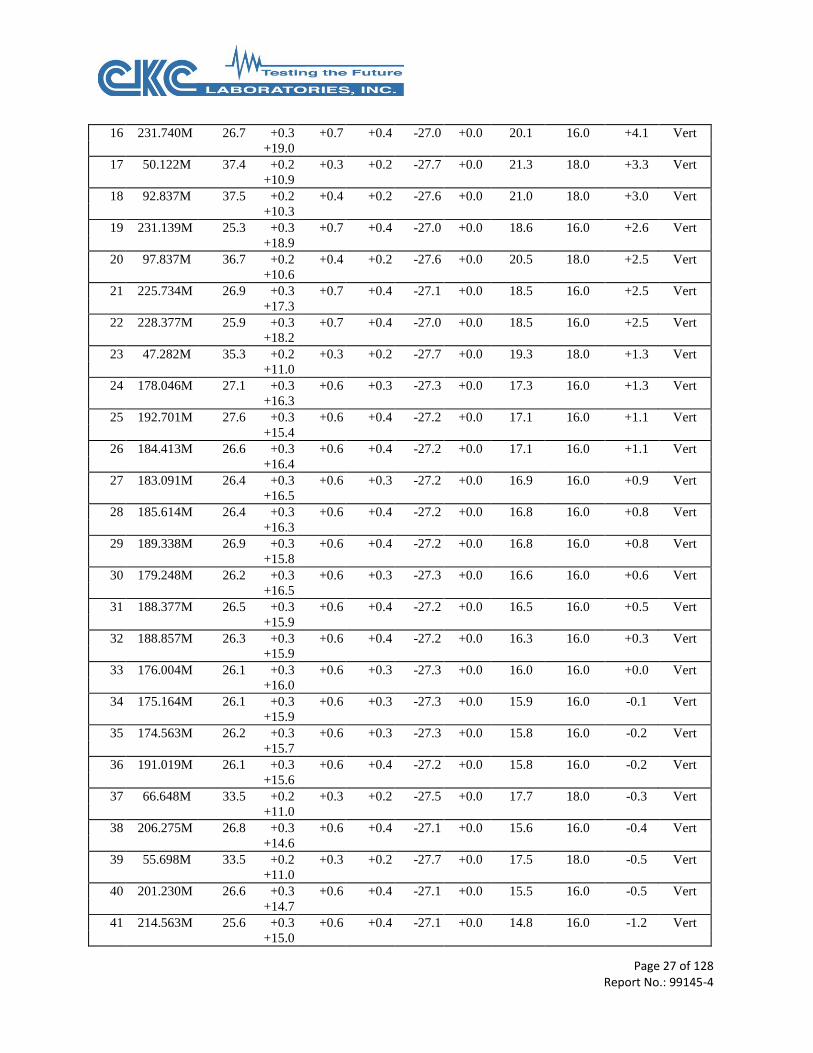
Page 27 of 128 Report No.: 99145-4
16 231.740M 26.7 +0.3
+19.0
+0.7 +0.4 -27.0 +0.0 20.1 16.0 +4.1 Vert
17 50.122M 37.4 +0.2
+10.9
+0.3 +0.2 -27.7 +0.0 21.3 18.0 +3.3 Vert
18 92.837M 37.5 +0.2
+10.3
+0.4 +0.2 -27.6 +0.0 21.0 18.0 +3.0 Vert
19 231.139M 25.3 +0.3
+18.9
+0.7 +0.4 -27.0 +0.0 18.6 16.0 +2.6 Vert
20 97.837M 36.7 +0.2
+10.6
+0.4 +0.2 -27.6 +0.0 20.5 18.0 +2.5 Vert
21 225.734M 26.9 +0.3
+17.3
+0.7 +0.4 -27.1 +0.0 18.5 16.0 +2.5 Vert
22 228.377M 25.9 +0.3
+18.2
+0.7 +0.4 -27.0 +0.0 18.5 16.0 +2.5 Vert
23 47.282M 35.3 +0.2
+11.0
+0.3 +0.2 -27.7 +0.0 19.3 18.0 +1.3 Vert
24 178.046M 27.1 +0.3
+16.3
+0.6 +0.3 -27.3 +0.0 17.3 16.0 +1.3 Vert
25 192.701M 27.6 +0.3
+15.4
+0.6 +0.4 -27.2 +0.0 17.1 16.0 +1.1 Vert
26 184.413M 26.6 +0.3
+16.4
+0.6 +0.4 -27.2 +0.0 17.1 16.0 +1.1 Vert
27 183.091M 26.4 +0.3
+16.5
+0.6 +0.3 -27.2 +0.0 16.9 16.0 +0.9 Vert
28 185.614M 26.4 +0.3
+16.3
+0.6 +0.4 -27.2 +0.0 16.8 16.0 +0.8 Vert
29 189.338M 26.9 +0.3
+15.8
+0.6 +0.4 -27.2 +0.0 16.8 16.0 +0.8 Vert
30 179.248M 26.2 +0.3
+16.5
+0.6 +0.3 -27.3 +0.0 16.6 16.0 +0.6 Vert
31 188.377M 26.5 +0.3
+15.9
+0.6 +0.4 -27.2 +0.0 16.5 16.0 +0.5 Vert
32 188.857M 26.3 +0.3
+15.9
+0.6 +0.4 -27.2 +0.0 16.3 16.0 +0.3 Vert
33 176.004M 26.1 +0.3
+16.0
+0.6 +0.3 -27.3 +0.0 16.0 16.0 +0.0 Vert
34 175.164M 26.1 +0.3
+15.9
+0.6 +0.3 -27.3 +0.0 15.9 16.0 -0.1 Vert
35 174.563M 26.2 +0.3
+15.7
+0.6 +0.3 -27.3 +0.0 15.8 16.0 -0.2 Vert
36 191.019M 26.1 +0.3
+15.6
+0.6 +0.4 -27.2 +0.0 15.8 16.0 -0.2 Vert
37 66.648M 33.5 +0.2
+11.0
+0.3 +0.2 -27.5 +0.0 17.7 18.0 -0.3 Vert
38 206.275M 26.8 +0.3
+14.6
+0.6 +0.4 -27.1 +0.0 15.6 16.0 -0.4 Vert
39 55.698M 33.5 +0.2
+11.0
+0.3 +0.2 -27.7 +0.0 17.5 18.0 -0.5 Vert
40 201.230M 26.6 +0.3
+14.7
+0.6 +0.4 -27.1 +0.0 15.5 16.0 -0.5 Vert
41 214.563M 25.6 +0.3
+15.0
+0.6 +0.4 -27.1 +0.0 14.8 16.0 -1.2 Vert

Page 28 of 128 Report No.: 99145-4
42 207.115M 25.8 +0.3
+14.6
+0.6 +0.4 -27.1 +0.0 14.6 16.0 -1.4 Vert
43 209.878M 25.8 +0.3
+14.6
+0.6 +0.4 -27.1 +0.0 14.6 16.0 -1.4 Vert
44 77.914M 32.6 +0.2
+10.3
+0.4 +0.2 -27.6 +0.0 16.1 18.0 -1.9 Vert
45 67.543M 31.9 +0.2
+10.9
+0.3 +0.2 -27.5 +0.0 16.0 18.0 -2.0 Vert
46 69.185M 32.0 +0.2
+10.8
+0.3 +0.2 -27.6 +0.0 15.9 18.0 -2.1 Vert
47 56.875M 31.4 +0.2
+11.0
+0.3 +0.2 -27.7 +0.0 15.4 18.0 -2.6 Vert
48 100.000M 30.8 +0.2
+10.7
+0.4 +0.2 -27.6 +0.0 14.7 18.0 -3.3 Vert
49 51.957M 30.6 +0.2
+10.9
+0.3 +0.2 -27.7 +0.0 14.5 18.0 -3.5 Vert
50 79.183M 31.0 +0.2
+10.2
+0.4 +0.2 -27.6 +0.0 14.4 18.0 -3.6 Vert

Page 29 of 128 Report No.: 99145-4
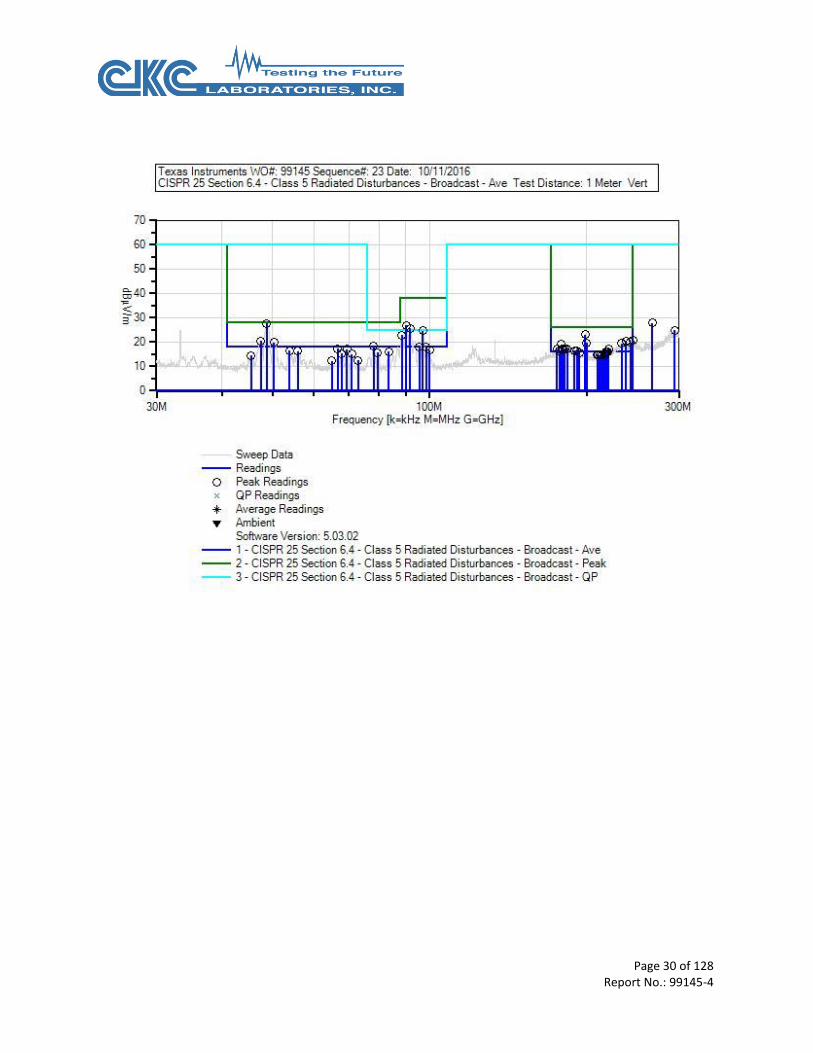
Test Location: CKC Laboratories, Inc. • 1120 Fulton Place • Fremont, CA 94539 • (510) 249-1170
Customer: Texas Instruments Specification: CISPR 25 Section 6.4 - Class 5 Radiated Disturbances - Broadcast - Ave Work Order #: 99145 Date: 10/11/2016
Test Type: Radiated Scan Time: 3:11:27 PM
Tested By: N. Gamez Sequence#: 23
Software: EMITest 5.03.02
Equipment Tested:
Device Manufacturer Model # S/N
Configuration 1
Support Equipment:
Device Manufacturer Model # S/N
Configuration 1
Test Conditions / Notes:
CISPR25 (2008) Sec 6.4.4 Radiated Emissions 30-300MHz
Broadcast
Temperature: 20.4°C
Humidity: 50%
Atmospheric Pressure: 101.5kPa
Modification 33 was in place during testing.
Page 30 of 128 Report No.: 99145-4
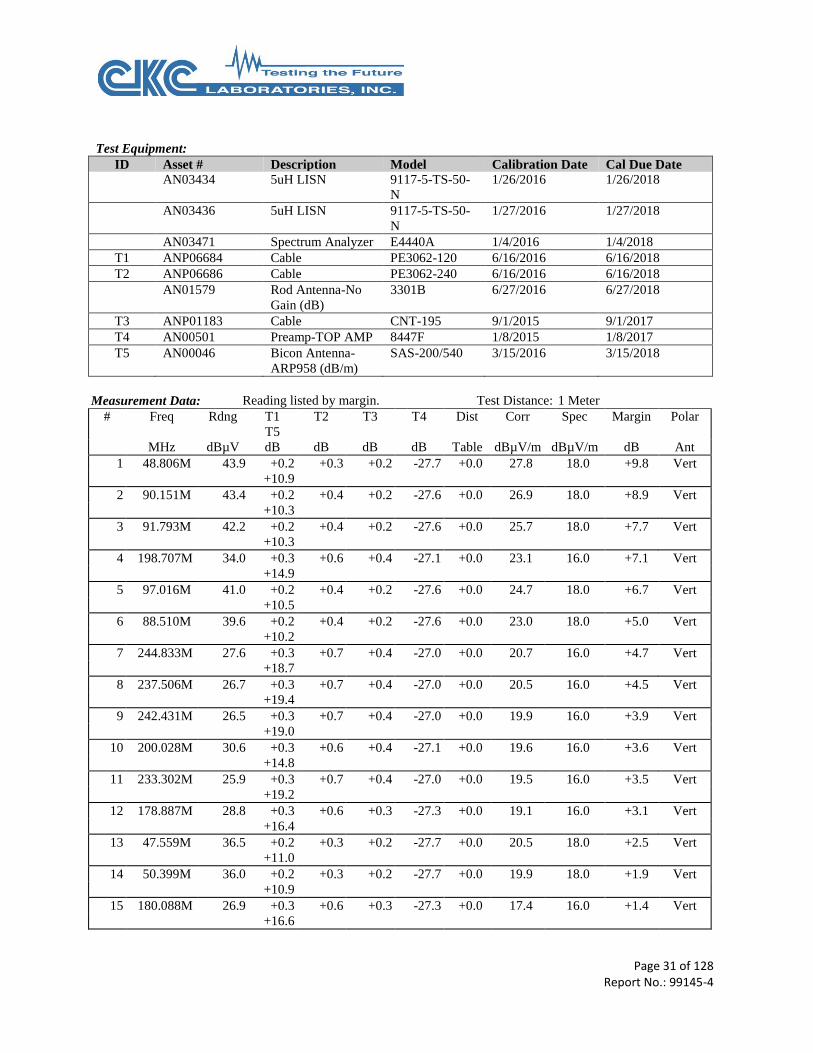
Page 31 of 128 Report No.: 99145-4
Test Equipment:
ID Asset # Description Model Calibration Date Cal Due Date
AN03434 5uH LISN 9117-5-TS-50-
N
1/26/2016 1/26/2018
AN03436 5uH LISN 9117-5-TS-50-
N
1/27/2016 1/27/2018
AN03471 Spectrum Analyzer E4440A 1/4/2016 1/4/2018
T1 ANP06684 Cable PE3062-120 6/16/2016 6/16/2018
T2 ANP06686 Cable PE3062-240 6/16/2016 6/16/2018
AN01579 Rod Antenna-No
Gain (dB)
3301B 6/27/2016 6/27/2018
T3 ANP01183 Cable CNT-195 9/1/2015 9/1/2017
T4 AN00501 Preamp-TOP AMP 8447F 1/8/2015 1/8/2017
T5 AN00046 Bicon Antenna-
ARP958 (dB/m)
SAS-200/540 3/15/2016 3/15/2018
Measurement Data: Reading listed by margin. Test Distance: 1 Meter
# Freq Rdng T1
T5
T2 T3 T4 Dist Corr Spec Margin Polar
MHz dBµV dB dB dB dB Table dBµV/m dBµV/m dB Ant
1 48.806M 43.9 +0.2
+10.9
+0.3 +0.2 -27.7 +0.0 27.8 18.0 +9.8 Vert
2 90.151M 43.4 +0.2
+10.3
+0.4 +0.2 -27.6 +0.0 26.9 18.0 +8.9 Vert
3 91.793M 42.2 +0.2
+10.3
+0.4 +0.2 -27.6 +0.0 25.7 18.0 +7.7 Vert
4 198.707M 34.0 +0.3
+14.9
+0.6 +0.4 -27.1 +0.0 23.1 16.0 +7.1 Vert
5 97.016M 41.0 +0.2
+10.5
+0.4 +0.2 -27.6 +0.0 24.7 18.0 +6.7 Vert
6 88.510M 39.6 +0.2
+10.2
+0.4 +0.2 -27.6 +0.0 23.0 18.0 +5.0 Vert
7 244.833M 27.6 +0.3
+18.7
+0.7 +0.4 -27.0 +0.0 20.7 16.0 +4.7 Vert
8 237.506M 26.7 +0.3
+19.4
+0.7 +0.4 -27.0 +0.0 20.5 16.0 +4.5 Vert
9 242.431M 26.5 +0.3
+19.0
+0.7 +0.4 -27.0 +0.0 19.9 16.0 +3.9 Vert
10 200.028M 30.6 +0.3
+14.8
+0.6 +0.4 -27.1 +0.0 19.6 16.0 +3.6 Vert
11 233.302M 25.9 +0.3
+19.2
+0.7 +0.4 -27.0 +0.0 19.5 16.0 +3.5 Vert
12 178.887M 28.8 +0.3
+16.4
+0.6 +0.3 -27.3 +0.0 19.1 16.0 +3.1 Vert
13 47.559M 36.5 +0.2
+11.0
+0.3 +0.2 -27.7 +0.0 20.5 18.0 +2.5 Vert
14 50.399M 36.0 +0.2
+10.9
+0.3 +0.2 -27.7 +0.0 19.9 18.0 +1.9 Vert
15 180.088M 26.9 +0.3
+16.6
+0.6 +0.3 -27.3 +0.0 17.4 16.0 +1.4 Vert

Page 32 of 128 Report No.: 99145-4
16 179.488M 26.9 +0.3
+16.5
+0.6 +0.3 -27.3 +0.0 17.3 16.0 +1.3 Vert
17 181.650M 26.8 +0.3
+16.5
+0.6 +0.3 -27.2 +0.0 17.3 16.0 +1.3 Vert
18 183.572M 26.7 +0.3
+16.5
+0.6 +0.3 -27.2 +0.0 17.2 16.0 +1.2 Vert
19 175.524M 27.2 +0.3
+15.9
+0.6 +0.3 -27.3 +0.0 17.0 16.0 +1.0 Vert
20 219.848M 26.8 +0.3
+15.9
+0.7 +0.4 -27.1 +0.0 17.0 16.0 +1.0 Vert
21 177.206M 26.5 +0.3
+16.2
+0.6 +0.3 -27.3 +0.0 16.6 16.0 +0.6 Vert
22 191.260M 26.9 +0.3
+15.6
+0.6 +0.4 -27.2 +0.0 16.6 16.0 +0.6 Vert
23 78.064M 35.0 +0.2
+10.3
+0.4 +0.2 -27.6 +0.0 18.5 18.0 +0.5 Vert
24 189.218M 26.4 +0.3
+15.8
+0.6 +0.4 -27.2 +0.0 16.3 16.0 +0.3 Vert
25 219.007M 26.1 +0.3
+15.7
+0.7 +0.4 -27.1 +0.0 16.1 16.0 +0.1 Vert
26 95.598M 34.5 +0.2
+10.4
+0.4 +0.2 -27.6 +0.0 18.1 18.0 +0.1 Vert
27 218.527M 26.1 +0.3
+15.7
+0.7 +0.4 -27.1 +0.0 16.1 16.0 +0.1 Vert
28 98.583M 34.2 +0.2
+10.6
+0.4 +0.2 -27.6 +0.0 18.0 18.0 +0.0 Vert
29 217.686M 26.2 +0.3
+15.5
+0.7 +0.4 -27.1 +0.0 16.0 16.0 +0.0 Vert
30 193.542M 26.4 +0.3
+15.3
+0.6 +0.4 -27.2 +0.0 15.8 16.0 -0.2 Vert
31 66.648M 33.2 +0.2
+11.0
+0.3 +0.2 -27.5 +0.0 17.4 18.0 -0.6 Vert
32 217.446M 25.5 +0.3
+15.5
+0.7 +0.4 -27.1 +0.0 15.3 16.0 -0.7 Vert
33 69.483M 33.2 +0.2
+10.8
+0.3 +0.2 -27.6 +0.0 17.1 18.0 -0.9 Vert
34 209.278M 26.2 +0.3
+14.6
+0.6 +0.4 -27.1 +0.0 15.0 16.0 -1.0 Vert
35 213.842M 25.7 +0.3
+15.0
+0.6 +0.4 -27.1 +0.0 14.9 16.0 -1.1 Vert
36 216.124M 25.4 +0.3
+15.3
+0.6 +0.4 -27.1 +0.0 14.9 16.0 -1.1 Vert
37 212.281M 25.8 +0.3
+14.8
+0.6 +0.4 -27.1 +0.0 14.8 16.0 -1.2 Vert
38 100.000M 32.8 +0.2
+10.7
+0.4 +0.2 -27.6 +0.0 16.7 18.0 -1.3 Vert
39 210.479M 25.8 +0.3
+14.7
+0.6 +0.4 -27.1 +0.0 14.7 16.0 -1.3 Vert
40 53.966M 32.6 +0.2
+10.9
+0.3 +0.2 -27.7 +0.0 16.5 18.0 -1.5 Vert
41 55.940M 32.3 +0.2
+11.0
+0.3 +0.2 -27.7 +0.0 16.3 18.0 -1.7 Vert

Page 33 of 128 Report No.: 99145-4
42 83.511M 32.7 +0.2
+10.2
+0.4 +0.2 -27.6 +0.0 16.1 18.0 -1.9 Vert
43 79.481M 32.3 +0.2
+10.2
+0.4 +0.2 -27.6 +0.0 15.7 18.0 -2.3 Vert
44 67.841M 31.3 +0.2
+10.9
+0.3 +0.2 -27.6 +0.0 15.3 18.0 -2.7 Vert
45 70.975M 31.4 +0.2
+10.7
+0.3 +0.2 -27.7 +0.0 15.1 18.0 -2.9 Vert
46 45.481M 30.5 +0.2
+11.1
+0.3 +0.1 -27.8 +0.0 14.4 18.0 -3.6 Vert
47 72.915M 29.0 +0.2
+10.5
+0.4 +0.2 -27.7 +0.0 12.6 18.0 -5.4 Vert
48 65.006M 27.9 +0.2
+11.1
+0.3 +0.2 -27.5 +0.0 12.2 18.0 -5.8 Vert
49 266.641M 34.8 +0.4
+18.5
+0.7 +0.4 -26.9 +0.0 27.9 60.0 -32.1 Vert
50 294.515M 26.0 +0.4
+24.1
+0.8 +0.5 -26.9 +0.0 24.9 60.0 -35.1 Vert
Page 34 of 128 Report No.: 99145-4
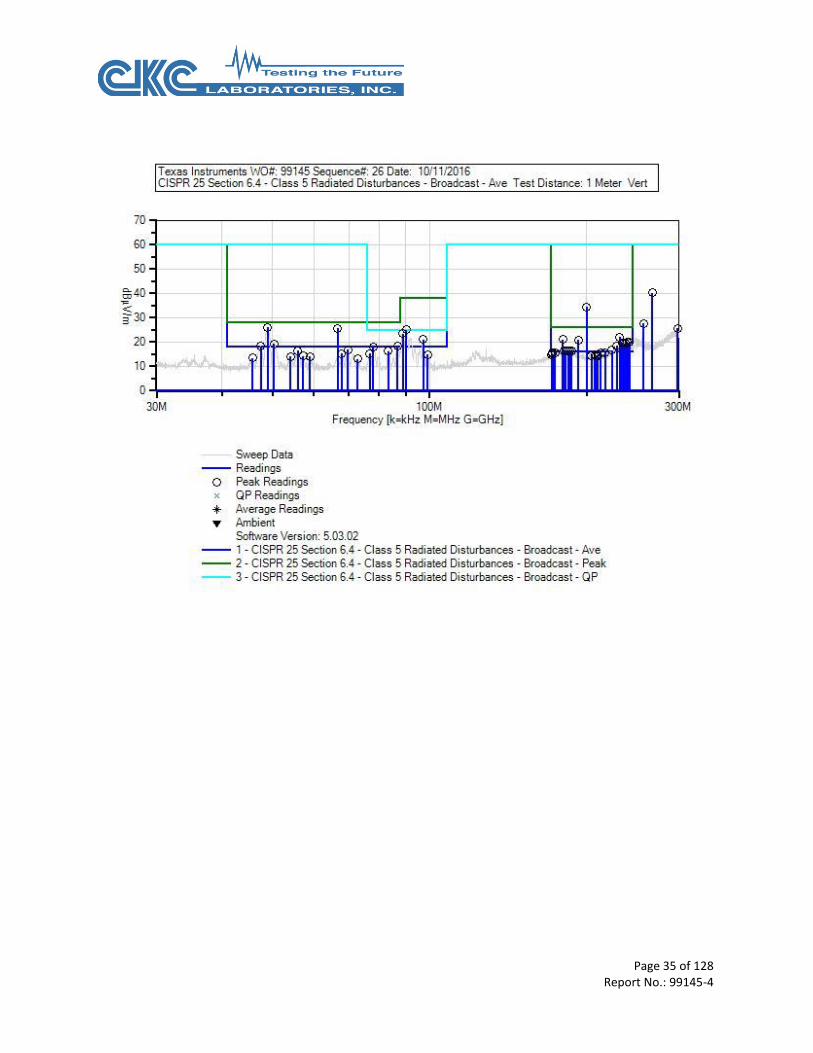
Test Location: CKC Laboratories, Inc. • 1120 Fulton Place • Fremont, CA 94539 • (510) 249-1170
Customer: Texas Instruments Specification: CISPR 25 Section 6.4 - Class 5 Radiated Disturbances - Broadcast - Ave Work Order #: 99145 Date: 10/11/2016
Test Type: Radiated Scan Time: 4:42:20 PM
Tested By: N. Gamez Sequence#: 26
Software: EMITest 5.03.02
Equipment Tested:
Device Manufacturer Model # S/N
Configuration 1
Support Equipment:
Device Manufacturer Model # S/N
Configuration 1
Test Conditions / Notes:
CISPR25 (2008) Sec 6.4.4 Radiated Emissions 30-300MHz
Broadcast
Temperature: 20.4°C
Humidity: 50%
Atmospheric Pressure: 101.5kPa
Page 35 of 128 Report No.: 99145-4
Page 36 of 128 Report No.: 99145-4
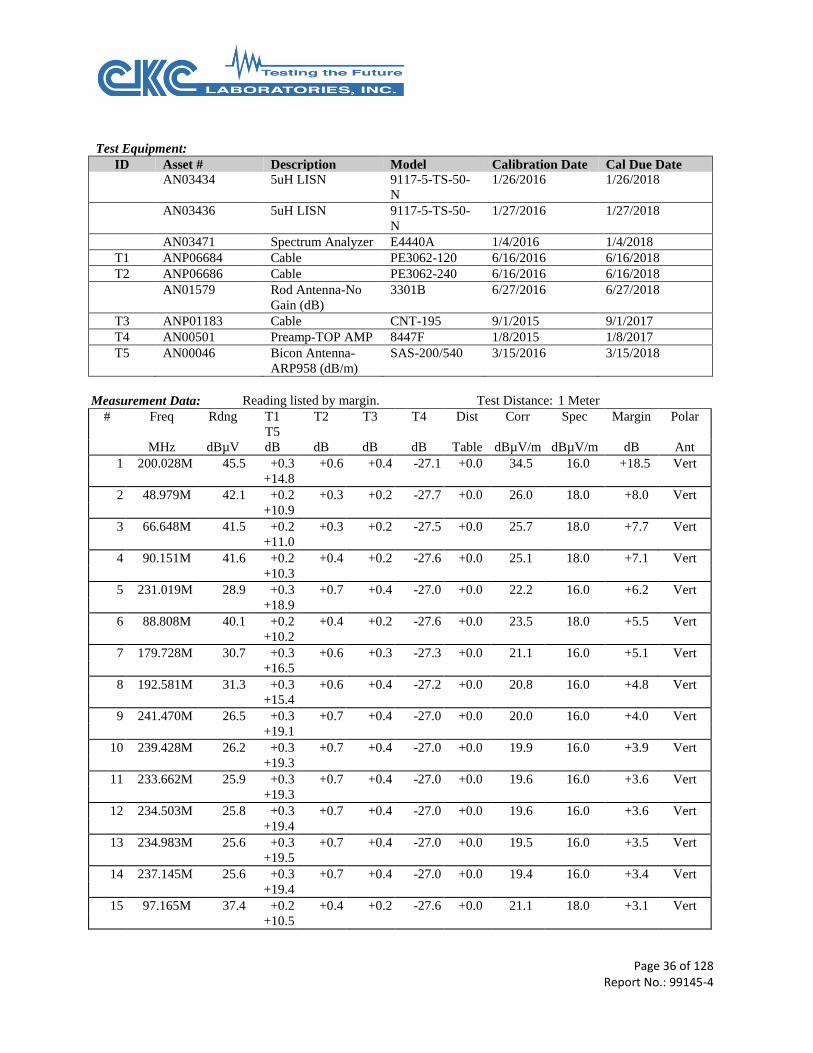
Test Equipment:
ID Asset # Description Model Calibration Date Cal Due Date
AN03434 5uH LISN 9117-5-TS-50-
N
1/26/2016 1/26/2018
AN03436 5uH LISN 9117-5-TS-50-
N
1/27/2016 1/27/2018
AN03471 Spectrum Analyzer E4440A 1/4/2016 1/4/2018
T1 ANP06684 Cable PE3062-120 6/16/2016 6/16/2018
T2 ANP06686 Cable PE3062-240 6/16/2016 6/16/2018
AN01579 Rod Antenna-No
Gain (dB)
3301B 6/27/2016 6/27/2018
T3 ANP01183 Cable CNT-195 9/1/2015 9/1/2017
T4 AN00501 Preamp-TOP AMP 8447F 1/8/2015 1/8/2017
T5 AN00046 Bicon Antenna-
ARP958 (dB/m)
SAS-200/540 3/15/2016 3/15/2018
Measurement Data: Reading listed by margin. Test Distance: 1 Meter
# Freq Rdng T1
T5
T2 T3 T4 Dist Corr Spec Margin Polar
MHz dBµV dB dB dB dB Table dBµV/m dBµV/m dB Ant
1 200.028M 45.5 +0.3
+14.8
+0.6 +0.4 -27.1 +0.0 34.5 16.0 +18.5 Vert
2 48.979M 42.1 +0.2
+10.9
+0.3 +0.2 -27.7 +0.0 26.0 18.0 +8.0 Vert
3 66.648M 41.5 +0.2
+11.0
+0.3 +0.2 -27.5 +0.0 25.7 18.0 +7.7 Vert
4 90.151M 41.6 +0.2
+10.3
+0.4 +0.2 -27.6 +0.0 25.1 18.0 +7.1 Vert
5 231.019M 28.9 +0.3
+18.9
+0.7 +0.4 -27.0 +0.0 22.2 16.0 +6.2 Vert
6 88.808M 40.1 +0.2
+10.2
+0.4 +0.2 -27.6 +0.0 23.5 18.0 +5.5 Vert
7 179.728M 30.7 +0.3
+16.5
+0.6 +0.3 -27.3 +0.0 21.1 16.0 +5.1 Vert
8 192.581M 31.3 +0.3
+15.4
+0.6 +0.4 -27.2 +0.0 20.8 16.0 +4.8 Vert
9 241.470M 26.5 +0.3
+19.1
+0.7 +0.4 -27.0 +0.0 20.0 16.0 +4.0 Vert
10 239.428M 26.2 +0.3
+19.3
+0.7 +0.4 -27.0 +0.0 19.9 16.0 +3.9 Vert
11 233.662M 25.9 +0.3
+19.3
+0.7 +0.4 -27.0 +0.0 19.6 16.0 +3.6 Vert
12 234.503M 25.8 +0.3
+19.4
+0.7 +0.4 -27.0 +0.0 19.6 16.0 +3.6 Vert
13 234.983M 25.6 +0.3
+19.5
+0.7 +0.4 -27.0 +0.0 19.5 16.0 +3.5 Vert
14 237.145M 25.6 +0.3
+19.4
+0.7 +0.4 -27.0 +0.0 19.4 16.0 +3.4 Vert
15 97.165M 37.4 +0.2
+10.5
+0.4 +0.2 -27.6 +0.0 21.1 18.0 +3.1 Vert
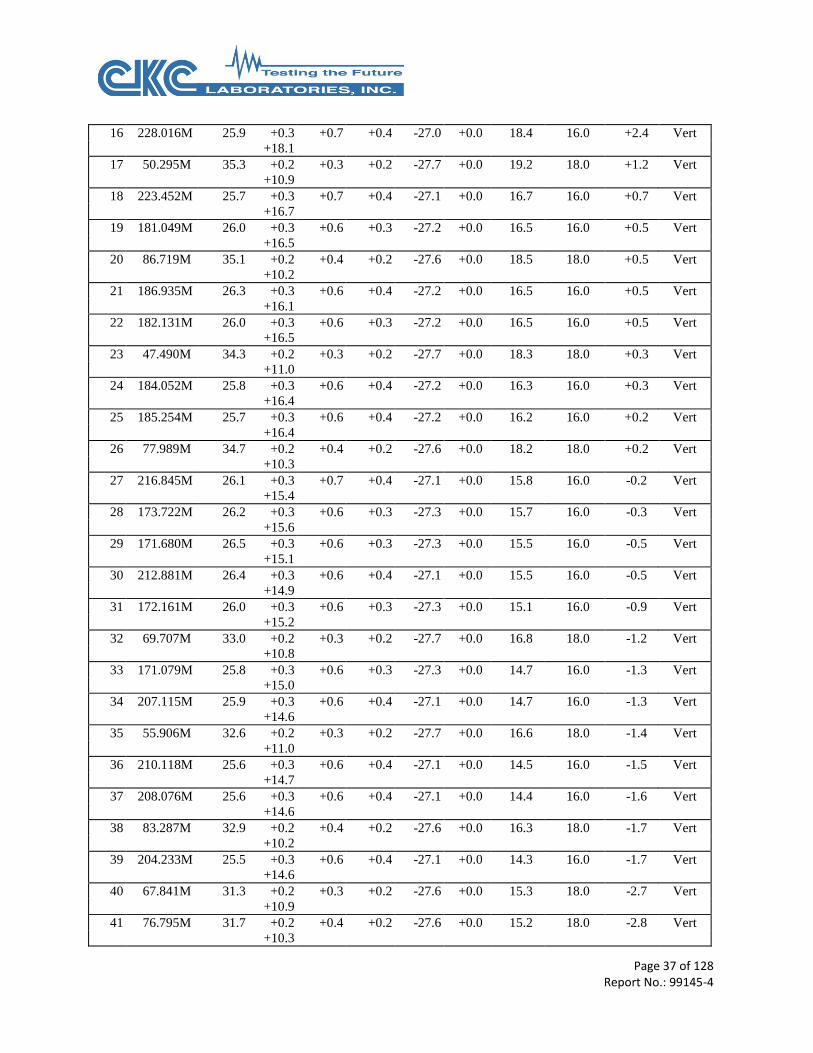
Page 37 of 128 Report No.: 99145-4
16 228.016M 25.9 +0.3
+18.1
+0.7 +0.4 -27.0 +0.0 18.4 16.0 +2.4 Vert
17 50.295M 35.3 +0.2
+10.9
+0.3 +0.2 -27.7 +0.0 19.2 18.0 +1.2 Vert
18 223.452M 25.7 +0.3
+16.7
+0.7 +0.4 -27.1 +0.0 16.7 16.0 +0.7 Vert
19 181.049M 26.0 +0.3
+16.5
+0.6 +0.3 -27.2 +0.0 16.5 16.0 +0.5 Vert
20 86.719M 35.1 +0.2
+10.2
+0.4 +0.2 -27.6 +0.0 18.5 18.0 +0.5 Vert
21 186.935M 26.3 +0.3
+16.1
+0.6 +0.4 -27.2 +0.0 16.5 16.0 +0.5 Vert
22 182.131M 26.0 +0.3
+16.5
+0.6 +0.3 -27.2 +0.0 16.5 16.0 +0.5 Vert
23 47.490M 34.3 +0.2
+11.0
+0.3 +0.2 -27.7 +0.0 18.3 18.0 +0.3 Vert
24 184.052M 25.8 +0.3
+16.4
+0.6 +0.4 -27.2 +0.0 16.3 16.0 +0.3 Vert
25 185.254M 25.7 +0.3
+16.4
+0.6 +0.4 -27.2 +0.0 16.2 16.0 +0.2 Vert
26 77.989M 34.7 +0.2
+10.3
+0.4 +0.2 -27.6 +0.0 18.2 18.0 +0.2 Vert
27 216.845M 26.1 +0.3
+15.4
+0.7 +0.4 -27.1 +0.0 15.8 16.0 -0.2 Vert
28 173.722M 26.2 +0.3
+15.6
+0.6 +0.3 -27.3 +0.0 15.7 16.0 -0.3 Vert
29 171.680M 26.5 +0.3
+15.1
+0.6 +0.3 -27.3 +0.0 15.5 16.0 -0.5 Vert
30 212.881M 26.4 +0.3
+14.9
+0.6 +0.4 -27.1 +0.0 15.5 16.0 -0.5 Vert
31 172.161M 26.0 +0.3
+15.2
+0.6 +0.3 -27.3 +0.0 15.1 16.0 -0.9 Vert
32 69.707M 33.0 +0.2
+10.8
+0.3 +0.2 -27.7 +0.0 16.8 18.0 -1.2 Vert
33 171.079M 25.8 +0.3
+15.0
+0.6 +0.3 -27.3 +0.0 14.7 16.0 -1.3 Vert
34 207.115M 25.9 +0.3
+14.6
+0.6 +0.4 -27.1 +0.0 14.7 16.0 -1.3 Vert
35 55.906M 32.6 +0.2
+11.0
+0.3 +0.2 -27.7 +0.0 16.6 18.0 -1.4 Vert
36 210.118M 25.6 +0.3
+14.7
+0.6 +0.4 -27.1 +0.0 14.5 16.0 -1.5 Vert
37 208.076M 25.6 +0.3
+14.6
+0.6 +0.4 -27.1 +0.0 14.4 16.0 -1.6 Vert
38 83.287M 32.9 +0.2
+10.2
+0.4 +0.2 -27.6 +0.0 16.3 18.0 -1.7 Vert
39 204.233M 25.5 +0.3
+14.6
+0.6 +0.4 -27.1 +0.0 14.3 16.0 -1.7 Vert
40 67.841M 31.3 +0.2
+10.9
+0.3 +0.2 -27.6 +0.0 15.3 18.0 -2.7 Vert
41 76.795M 31.7 +0.2
+10.3
+0.4 +0.2 -27.6 +0.0 15.2 18.0 -2.8 Vert

Page 38 of 128 Report No.: 99145-4
42 99.030M 31.0 +0.2
+10.6
+0.4 +0.2 -27.6 +0.0 14.8 18.0 -3.2 Vert
43 57.291M 30.3 +0.2
+11.0
+0.3 +0.2 -27.7 +0.0 14.3 18.0 -3.7 Vert
44 54.139M 30.2 +0.2
+10.9
+0.3 +0.2 -27.7 +0.0 14.1 18.0 -3.9 Vert
45 59.022M 29.9 +0.2
+11.1
+0.3 +0.2 -27.7 +0.0 14.0 18.0 -4.0 Vert
46 45.793M 29.6 +0.2
+11.1
+0.3 +0.1 -27.8 +0.0 13.5 18.0 -4.5 Vert
47 72.766M 29.4 +0.2
+10.6
+0.4 +0.2 -27.7 +0.0 13.1 18.0 -4.9 Vert
48 266.641M 47.2 +0.4
+18.5
+0.7 +0.4 -26.9 +0.0 40.3 60.0 -19.7 Vert
49 256.605M 35.3 +0.3
+17.9
+0.7 +0.4 -26.9 +0.0 27.7 60.0 -32.3 Vert
50 298.090M 26.6 +0.4
+24.2
+0.8 +0.5 -26.9 +0.0 25.6 60.0 -34.4 Vert

Page 39 of 128 Report No.: 99145-4
Test Location: CKC Laboratories, Inc. • 1120 Fulton Place • Fremont, CA 94539 • (510) 249-1170
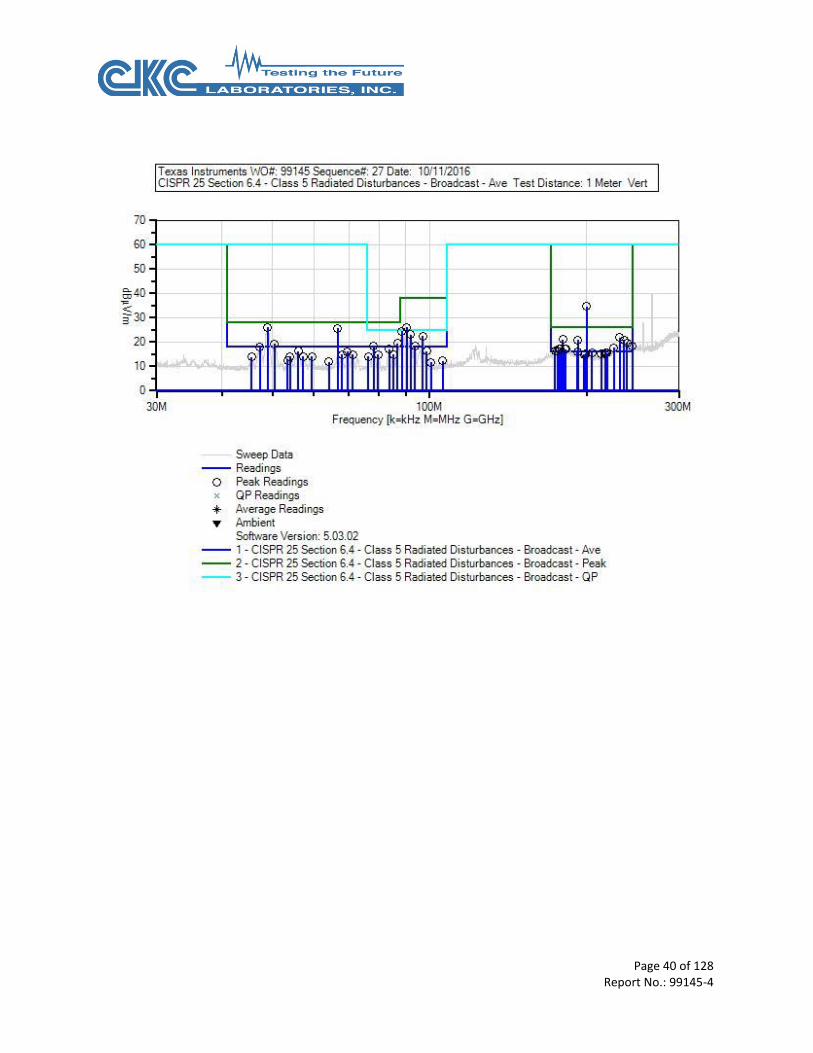
Customer: Texas Instruments Specification: CISPR 25 Section 6.4 - Class 5 Radiated Disturbances - Broadcast - Ave Work Order #: 99145 Date: 10/11/2016
Test Type: Radiated Scan Time: 4:47:20 PM
Tested By: N. Gamez Sequence#: 27
Software: EMITest 5.03.02
Equipment Tested:
Device Manufacturer Model # S/N
Configuration 1
Support Equipment:
Device Manufacturer Model # S/N
Configuration 1
Test Conditions / Notes:
CISPR25 (2008) Sec 6.4.4 Radiated Emissions 30-300MHz
Broadcast
Temperature: 20.4°C
Humidity: 50%
Atmospheric Pressure: 101.5kPa
Page 40 of 128 Report No.: 99145-4

Page 41 of 128 Report No.: 99145-4
Test Equipment:
ID Asset # Description Model Calibration Date Cal Due Date
AN03434 5uH LISN 9117-5-TS-50-
N
1/26/2016 1/26/2018
AN03436 5uH LISN 9117-5-TS-50-
N
1/27/2016 1/27/2018
AN03471 Spectrum Analyzer E4440A 1/4/2016 1/4/2018
T1 ANP06684 Cable PE3062-120 6/16/2016 6/16/2018
T2 ANP06686 Cable PE3062-240 6/16/2016 6/16/2018
AN01579 Rod Antenna-No
Gain (dB)
3301B 6/27/2016 6/27/2018
T3 ANP01183 Cable CNT-195 9/1/2015 9/1/2017
T4 AN00501 Preamp-TOP AMP 8447F 1/8/2015 1/8/2017
T5 AN00046 Bicon Antenna-
ARP958 (dB/m)
SAS-200/540 3/15/2016 3/15/2018
Measurement Data: Reading listed by margin. Test Distance: 1 Meter
# Freq Rdng T1
T5
T2 T3 T4 Dist Corr Spec Margin Polar
MHz dBµV dB dB dB dB Table dBµV/m dBµV/m dB Ant
1 200.028M 45.6 +0.3
+14.8
+0.6 +0.4 -27.1 +0.0 34.6 16.0 +18.6 Vert
2 90.375M 42.6 +0.2
+10.3
+0.4 +0.2 -27.6 +0.0 26.1 18.0 +8.1 Vert
3 48.979M 42.1 +0.2
+10.9
+0.3 +0.2 -27.7 +0.0 26.0 18.0 +8.0 Vert
4 66.648M 41.5 +0.2
+11.0
+0.3 +0.2 -27.5 +0.0 25.7 18.0 +7.7 Vert
5 88.510M 41.0 +0.2
+10.2
+0.4 +0.2 -27.6 +0.0 24.4 18.0 +6.4 Vert
6 231.019M 28.6 +0.3
+18.9
+0.7 +0.4 -27.0 +0.0 21.9 16.0 +5.9 Vert
7 91.867M 39.6 +0.2
+10.3
+0.4 +0.2 -27.6 +0.0 23.1 18.0 +5.1 Vert
8 179.728M 30.6 +0.3
+16.5
+0.6 +0.3 -27.3 +0.0 21.0 16.0 +5.0 Vert
9 192.461M 31.4 +0.3
+15.4
+0.6 +0.4 -27.2 +0.0 20.9 16.0 +4.9 Vert
10 235.584M 26.9 +0.3
+19.5
+0.7 +0.4 -27.0 +0.0 20.8 16.0 +4.8 Vert
11 97.090M 38.8 +0.2
+10.5
+0.4 +0.2 -27.6 +0.0 22.5 18.0 +4.5 Vert
12 238.827M 26.0 +0.3
+19.3
+0.7 +0.4 -27.0 +0.0 19.7 16.0 +3.7 Vert
13 244.473M 25.2 +0.3
+18.7
+0.7 +0.4 -27.0 +0.0 18.3 16.0 +2.3 Vert
14 225.494M 26.1 +0.3
+17.3
+0.7 +0.4 -27.1 +0.0 17.7 16.0 +1.7 Vert
15 86.794M 36.1 +0.2
+10.2
+0.4 +0.2 -27.6 +0.0 19.5 18.0 +1.5 Vert

Page 42 of 128 Report No.: 99145-4
16 178.046M 27.1 +0.3
+16.3
+0.6 +0.3 -27.3 +0.0 17.3 16.0 +1.3 Vert
17 50.433M 35.3 +0.2
+10.9
+0.3 +0.2 -27.7 +0.0 19.2 18.0 +1.2 Vert
18 181.650M 26.6 +0.3
+16.5
+0.6 +0.3 -27.2 +0.0 17.1 16.0 +1.1 Vert
19 182.371M 26.6 +0.3
+16.5
+0.6 +0.3 -27.2 +0.0 17.1 16.0 +1.1 Vert
20 176.725M 27.0 +0.3
+16.1
+0.6 +0.3 -27.3 +0.0 17.0 16.0 +1.0 Vert
21 175.764M 26.7 +0.3
+16.0
+0.6 +0.3 -27.3 +0.0 16.6 16.0 +0.6 Vert
22 78.138M 35.0 +0.2
+10.3
+0.4 +0.2 -27.6 +0.0 18.5 18.0 +0.5 Vert
23 93.733M 34.9 +0.2
+10.4
+0.4 +0.2 -27.6 +0.0 18.5 18.0 +0.5 Vert
24 173.962M 27.0 +0.3
+15.6
+0.6 +0.3 -27.3 +0.0 16.5 16.0 +0.5 Vert
25 47.317M 34.1 +0.2
+11.0
+0.3 +0.2 -27.7 +0.0 18.1 18.0 +0.1 Vert
26 191.860M 26.3 +0.3
+15.5
+0.6 +0.4 -27.2 +0.0 15.9 16.0 -0.1 Vert
27 217.085M 26.1 +0.3
+15.4
+0.7 +0.4 -27.1 +0.0 15.8 16.0 -0.2 Vert
28 204.473M 26.8 +0.3
+14.6
+0.6 +0.4 -27.1 +0.0 15.6 16.0 -0.4 Vert
29 218.527M 25.5 +0.3
+15.7
+0.7 +0.4 -27.1 +0.0 15.5 16.0 -0.5 Vert
30 198.947M 26.3 +0.3
+14.8
+0.6 +0.4 -27.1 +0.0 15.3 16.0 -0.7 Vert
31 213.001M 26.2 +0.3
+14.9
+0.6 +0.4 -27.1 +0.0 15.3 16.0 -0.7 Vert
32 216.605M 25.7 +0.3
+15.3
+0.7 +0.4 -27.1 +0.0 15.3 16.0 -0.7 Vert
33 83.660M 33.7 +0.2
+10.2
+0.4 +0.2 -27.6 +0.0 17.1 18.0 -0.9 Vert
34 197.506M 25.7 +0.3
+15.0
+0.6 +0.4 -27.2 +0.0 14.8 16.0 -1.2 Vert
35 56.044M 32.2 +0.2
+11.0
+0.3 +0.2 -27.7 +0.0 16.2 18.0 -1.8 Vert
36 98.732M 32.4 +0.2
+10.6
+0.4 +0.2 -27.6 +0.0 16.2 18.0 -1.8 Vert
37 69.632M 32.2 +0.2
+10.8
+0.3 +0.2 -27.6 +0.0 16.1 18.0 -1.9 Vert
38 67.991M 30.9 +0.2
+10.9
+0.3 +0.2 -27.6 +0.0 14.9 18.0 -3.1 Vert
39 71.199M 31.1 +0.2
+10.7
+0.3 +0.2 -27.7 +0.0 14.8 18.0 -3.2 Vert
40 79.705M 31.4 +0.2
+10.2
+0.4 +0.2 -27.6 +0.0 14.8 18.0 -3.2 Vert
41 85.376M 31.4 +0.2
+10.2
+0.4 +0.2 -27.6 +0.0 14.8 18.0 -3.2 Vert
Page 43 of 128 Report No.: 99145-4
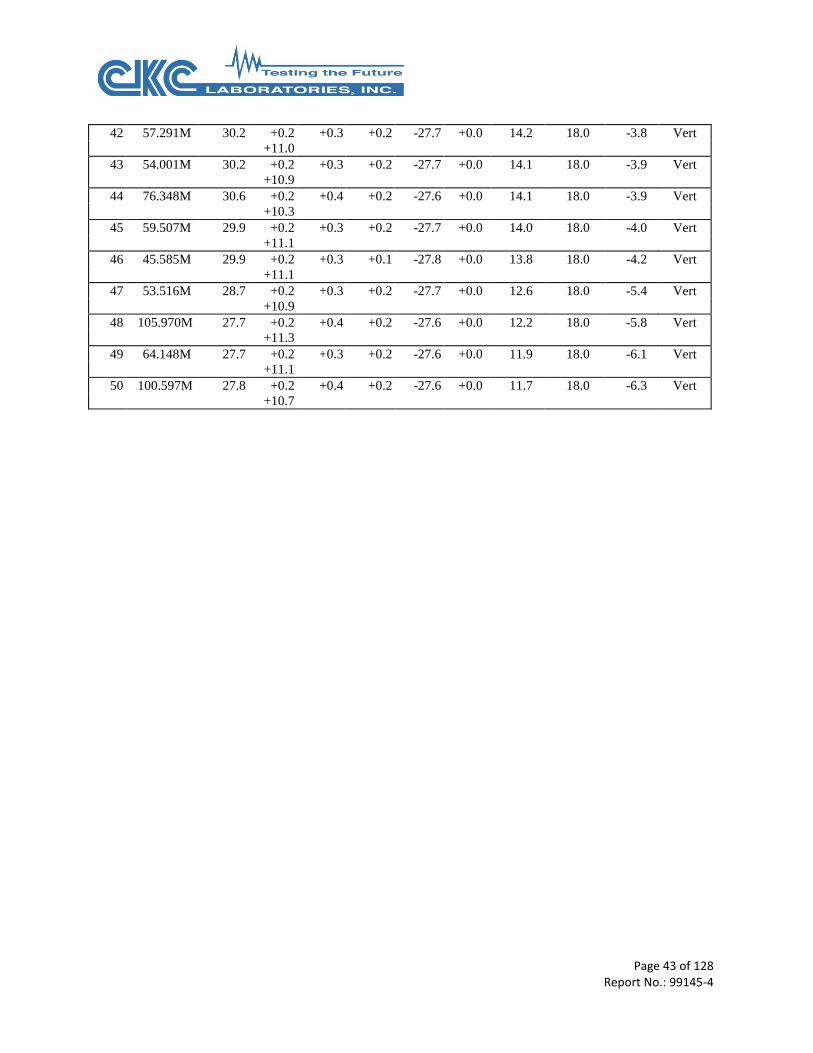
42 57.291M 30.2 +0.2
+11.0
+0.3 +0.2 -27.7 +0.0 14.2 18.0 -3.8 Vert
43 54.001M 30.2 +0.2
+10.9
+0.3 +0.2 -27.7 +0.0 14.1 18.0 -3.9 Vert
44 76.348M 30.6 +0.2
+10.3
+0.4 +0.2 -27.6 +0.0 14.1 18.0 -3.9 Vert
45 59.507M 29.9 +0.2
+11.1
+0.3 +0.2 -27.7 +0.0 14.0 18.0 -4.0 Vert
46 45.585M 29.9 +0.2
+11.1
+0.3 +0.1 -27.8 +0.0 13.8 18.0 -4.2 Vert
47 53.516M 28.7 +0.2
+10.9
+0.3 +0.2 -27.7 +0.0 12.6 18.0 -5.4 Vert
48 105.970M 27.7 +0.2
+11.3
+0.4 +0.2 -27.6 +0.0 12.2 18.0 -5.8 Vert
49 64.148M 27.7 +0.2
+11.1
+0.3 +0.2 -27.6 +0.0 11.9 18.0 -6.1 Vert
50 100.597M 27.8 +0.2
+10.7
+0.4 +0.2 -27.6 +0.0 11.7 18.0 -6.3 Vert

Page 44 of 128 Report No.: 99145-4
Test Location: CKC Laboratories, Inc. • 1120 Fulton Place • Fremont, CA 94539 • (510) 249-1170
Customer: Texas Instruments Specification: CISPR 25 Section 6.4 - Class 5 Radiated Disturbances - Broadcast - Ave Work Order #: 99145 Date: 11/11/2016
Test Type: Radiated Scan Time: 15:31:43
Tested By: N. Gamez Sequence#: 29
Software: EMITest 5.03.02
Equipment Tested:
Device Manufacturer Model # S/N
Configuration 1
Support Equipment:
Device Manufacturer Model # S/N
Configuration 1
Test Conditions / Notes:
CISPR25 (2008) Sec 6.4.4 Radiated Emissions 1-2.345GHz
Broadcast
Temperature: 23°C
Humidity: 50%
Atmospheric Pressure: 101.5kPa
Position 2
Modification 33 was in place during testing.

Page 45 of 128 Report No.: 99145-4

Page 46 of 128 Report No.: 99145-4
Test Equipment:
ID Asset # Description Model Calibration Date Cal Due Date
AN03434 5uH LISN 9117-5-TS-50-
N
1/26/2016 1/26/2018
AN03436 5uH LISN 9117-5-TS-50-
N
1/27/2016 1/27/2018
AN03471 Spectrum Analyzer E4440A 1/4/2016 1/4/2018
T1 AN03114 Preamp AMF-7D-
00101800-30-
10P
4/22/2015 4/22/2017
T2 ANP06126 Cable 32022-29094K-
29094K-168TC
3/18/2015 3/18/2017
T3 ANP06138 Cable 32022-29094K-
29094K-72TC
3/18/2015 3/18/2017
T4 AN02157 Horn Antenna-
ARP958
Calibration
3115 12/2/2014 12/2/2016
T5 ANP06711 Cable 32022-29094K-
29094K-132TC
11/21/2014 11/21/2016
Measurement Data: Reading listed by margin. Test Distance: 1 Meter
# Freq Rdng T1
T5
T2 T3 T4 Dist Corr Spec Margin Polar
MHz dBµV dB dB dB dB Table dBµV/m dBµV/m dB Ant
1 1477.711M 36.3 -58.2
+1.5
+1.8 +0.9 +25.5 +0.0 7.8 18.0 -10.2 Vert
Ave
^ 1477.711M 50.1 -58.2
+1.5
+1.8 +0.9 +25.5 +0.0 21.6 18.0 +3.6 Vert
3 1493.570M 35.4 -58.3
+1.5
+1.8 +0.9 +25.6 +0.0 6.9 18.0 -11.1 Vert
Ave
^ 1493.570M 48.8 -58.3
+1.5
+1.8 +0.9 +25.6 +0.0 20.3 18.0 +2.3 Vert
5 1483.498M 35.3 -58.3
+1.5
+1.8 +0.9 +25.5 +0.0 6.7 18.0 -11.3 Vert
Ave
^ 1483.498M 48.5 -58.3
+1.5
+1.8 +0.9 +25.5 +0.0 19.9 18.0 +1.9 Vert
7 2341.808M 36.2 -58.1
+1.9
+2.3 +1.1 +28.5 +0.0 11.9 24.0 -12.1 Vert
Ave
^ 2341.808M 49.3 -58.1
+1.9
+2.3 +1.1 +28.5 +0.0 25.0 24.0 +1.0 Vert
9 2338.506M 36.2 -58.1
+1.9
+2.3 +1.1 +28.5 +0.0 11.9 24.0 -12.1 Vert
Ave
^ 2338.506M 48.9 -58.1
+1.9
+2.3 +1.1 +28.5 +0.0 24.6 24.0 +0.6 Vert
11 1456.452M 34.3 -58.3
+1.5
+1.8 +0.9 +25.5 +0.0 5.7 18.0 -12.3 Vert
Ave
^ 1456.452M 47.6 -58.3
+1.5
+1.8 +0.9 +25.5 +0.0 19.0 18.0 +1.0 Vert
Page 47 of 128 Report No.: 99145-4
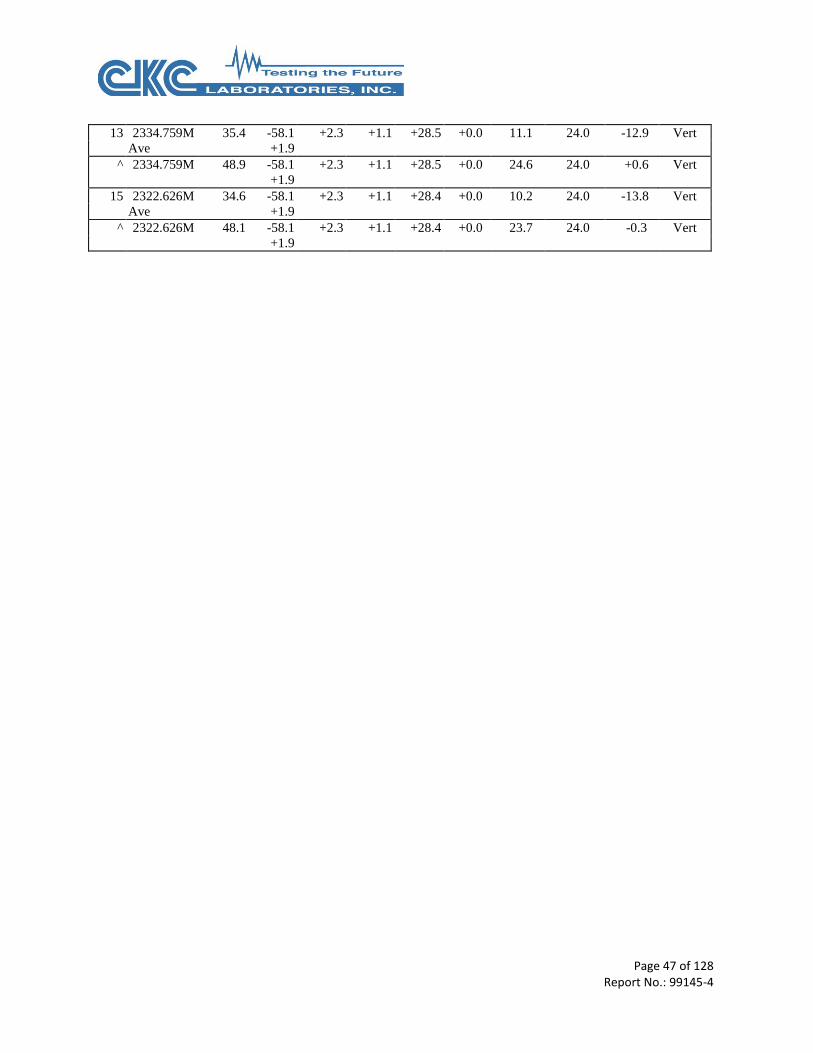
13 2334.759M 35.4 -58.1
+1.9
+2.3 +1.1 +28.5 +0.0 11.1 24.0 -12.9 Vert
Ave
^ 2334.759M 48.9 -58.1
+1.9
+2.3 +1.1 +28.5 +0.0 24.6 24.0 +0.6 Vert
15 2322.626M 34.6 -58.1
+1.9
+2.3 +1.1 +28.4 +0.0 10.2 24.0 -13.8 Vert
Ave
^ 2322.626M 48.1 -58.1
+1.9
+2.3 +1.1 +28.4 +0.0 23.7 24.0 -0.3 Vert

Page 48 of 128 Report No.: 99145-4
Test Location: CKC Laboratories, Inc. • 1120 Fulton Place • Fremont, CA 94539 • (510) 249-1170
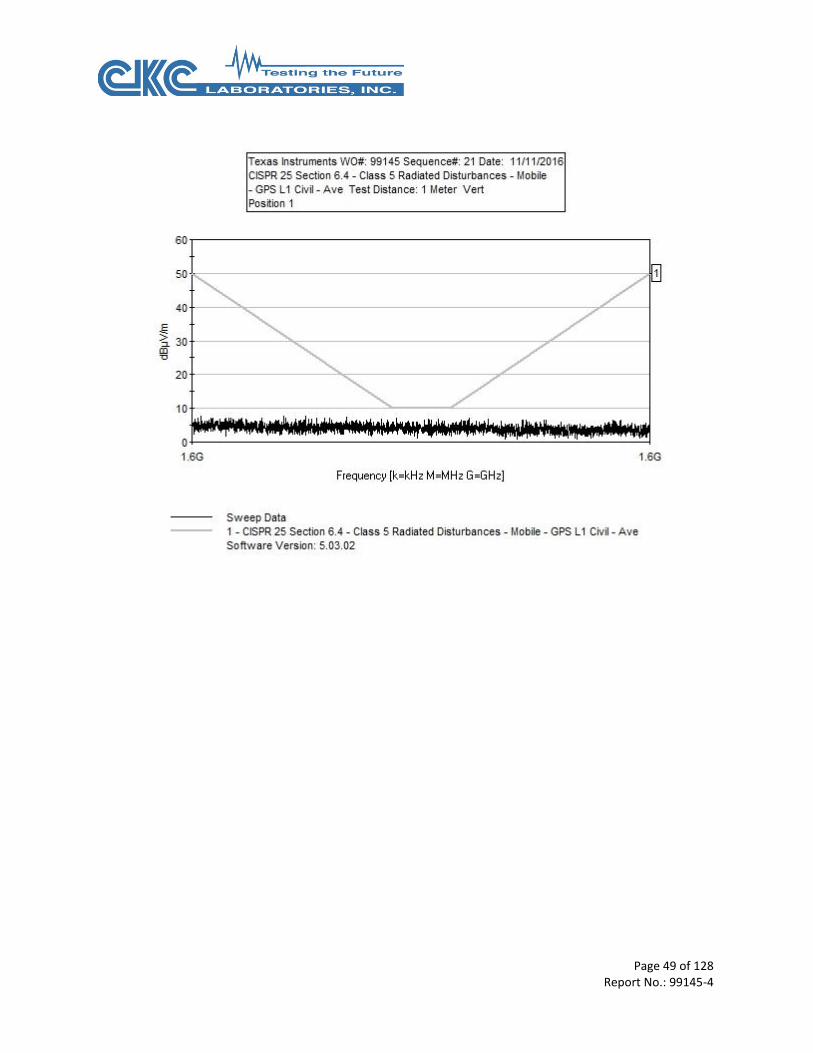
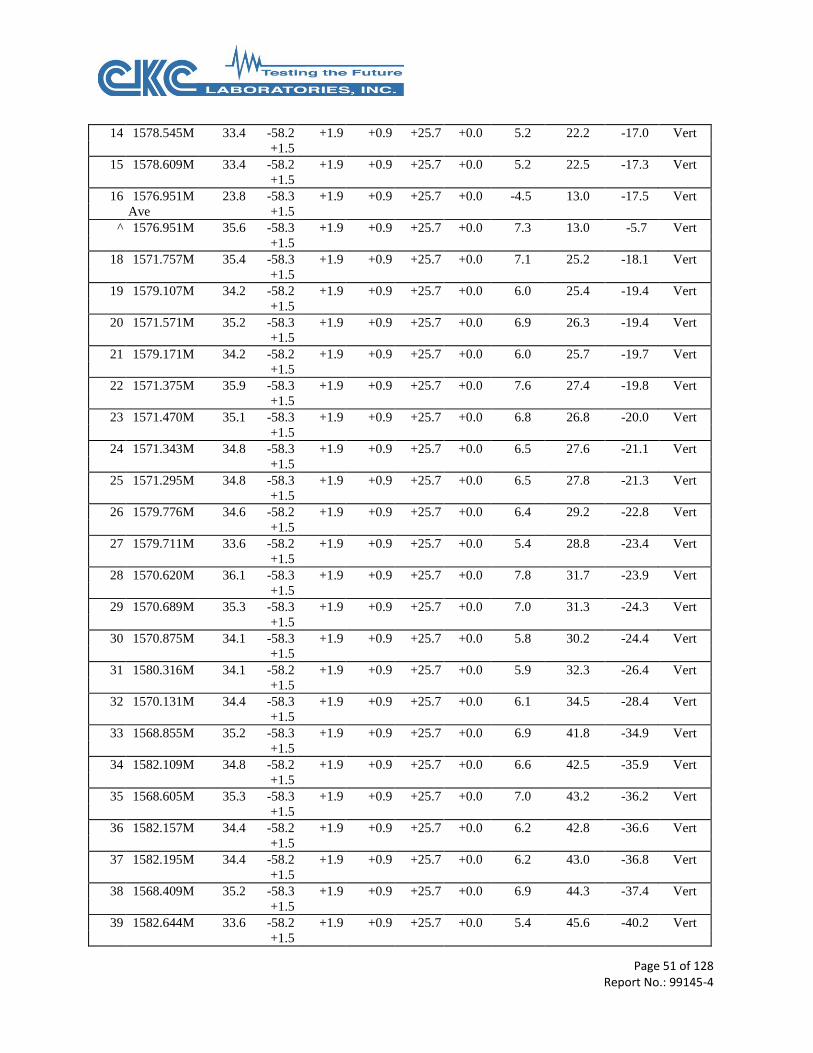
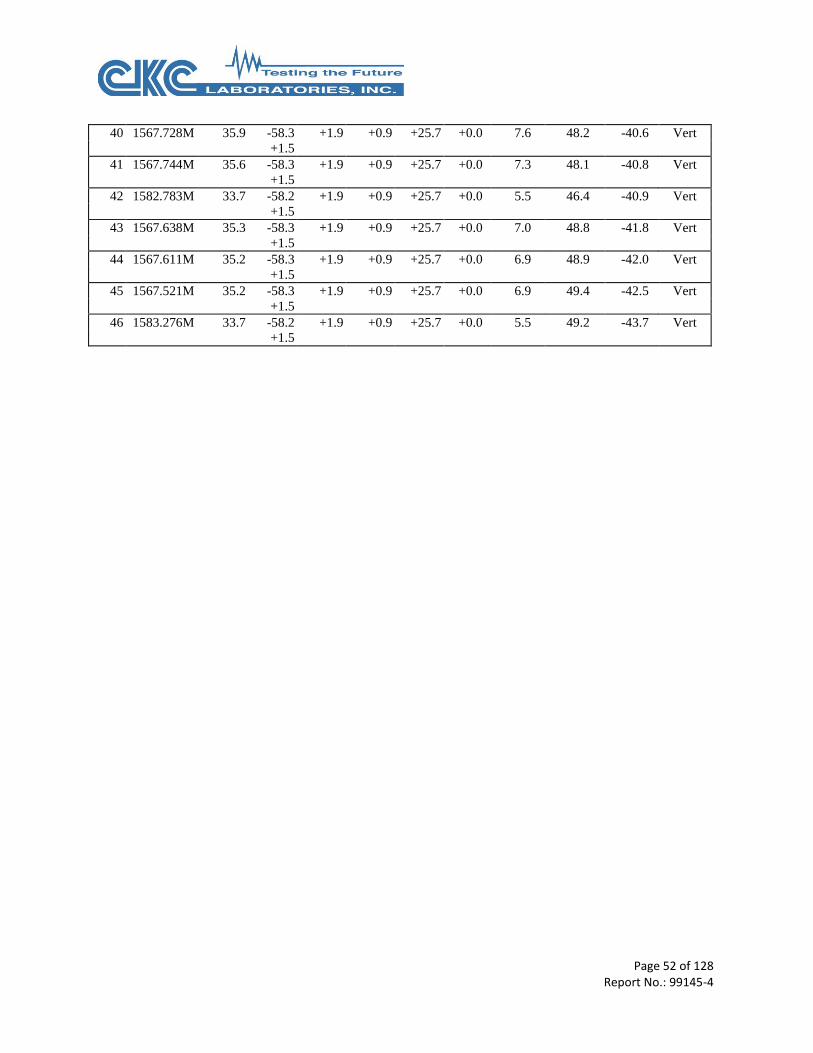
Customer: Texas Instruments Specification: CISPR 25 Section 6.4 - Class 5 Radiated Disturbances - Mobile - GPS L1 Civil - Ave Work Order #: 99145 Date: 11/11/2016
Test Type: Radiated Scan Time: 10:42:01
Tested By: N. Gamez Sequence#: 21
Software: EMITest 5.03.02
Equipment Tested:
Device Manufacturer Model # S/N
Configuration 1
Support Equipment:
Device Manufacturer Model # S/N
Configuration 1
Test Conditions / Notes:
CISPR25 (2008) Sec 6.4.4 Radiated Emissions 1.567-1.583GHz
Mobile
Temperature: 23°C
Humidity: 50%
Atmospheric Pressure: 101.5kPa
Position 1
Modification 33 was in place during testing.
Page 49 of 128 Report No.: 99145-4

Page 50 of 128 Report No.: 99145-4
Test Equipment:
ID Asset # Description Model Calibration Date Cal Due Date
AN03434 5uH LISN 9117-5-TS-50-
N
1/26/2016 1/26/2018
AN03436 5uH LISN 9117-5-TS-50-
N
1/27/2016 1/27/2018
AN03471 Spectrum Analyzer E4440A 1/4/2016 1/4/2018
T1 AN03114 Preamp AMF-7D-
00101800-30-
10P
4/22/2015 4/22/2017
T2 ANP06126 Cable 32022-29094K-
29094K-168TC
3/18/2015 3/18/2017
T3 ANP06138 Cable 32022-29094K-
29094K-72TC
3/18/2015 3/18/2017
T4 AN02157 Horn Antenna-
ARP958
Calibration
3115 12/2/2014 12/2/2016
T5 ANP06711 Cable 32022-29094K-
29094K-132TC
11/21/2014 11/21/2016
Measurement Data: Reading listed by margin. Test Distance: 1 Meter
# Freq Rdng T1
T5
T2 T3 T4 Dist Corr Spec Margin Polar
MHz dBµV dB dB dB dB Table dBµV/m dBµV/m dB Ant
1 1573.647M 35.2 -58.3
+1.5
+1.9 +0.9 +25.7 +0.0 6.9 14.4 -7.5 Vert
2 1573.594M 34.3 -58.3
+1.5
+1.9 +0.9 +25.7 +0.0 6.0 14.7 -8.7 Vert
3 1573.514M 34.7 -58.3
+1.5
+1.9 +0.9 +25.7 +0.0 6.4 15.2 -8.8 Vert
4 1577.322M 34.4 -58.2
+1.5
+1.9 +0.9 +25.7 +0.0 6.2 15.2 -9.0 Vert
5 1572.821M 35.6 -58.3
+1.5
+1.9 +0.9 +25.7 +0.0 7.3 19.1 -11.8 Vert
6 1578.202M 34.3 -58.2
+1.5
+1.9 +0.9 +25.7 +0.0 6.1 20.2 -14.1 Vert
7 1572.608M 34.3 -58.3
+1.5
+1.9 +0.9 +25.7 +0.0 6.0 20.3 -14.3 Vert
8 1574.645M 23.8 -58.3
+1.5
+1.9 +0.9 +25.7 +0.0 -4.5 10.0 -14.5 Vert
Ave
^ 1574.645M 35.3 -58.3
+1.5
+1.9 +0.9 +25.7 +0.0 7.0 10.0 -3.0 Vert
10 1575.669M 23.6 -58.3
+1.5
+1.9 +0.9 +25.7 +0.0 -4.7 10.0 -14.7 Vert
Ave
^ 1575.669M 36.1 -58.3
+1.5
+1.9 +0.9 +25.7 +0.0 7.8 10.0 -2.2 Vert
12 1578.379M 32.9 -58.2
+1.5
+1.9 +0.9 +25.7 +0.0 4.7 21.2 -16.5 Vert
13 1578.427M 33.2 -58.2
+1.5
+1.9 +0.9 +25.7 +0.0 5.0 21.5 -16.5 Vert
Page 51 of 128 Report No.: 99145-4
14 1578.545M 33.4 -58.2
+1.5
+1.9 +0.9 +25.7 +0.0 5.2 22.2 -17.0 Vert
15 1578.609M 33.4 -58.2
+1.5
+1.9 +0.9 +25.7 +0.0 5.2 22.5 -17.3 Vert
16 1576.951M 23.8 -58.3
+1.5
+1.9 +0.9 +25.7 +0.0 -4.5 13.0 -17.5 Vert
Ave
^ 1576.951M 35.6 -58.3
+1.5
+1.9 +0.9 +25.7 +0.0 7.3 13.0 -5.7 Vert
18 1571.757M 35.4 -58.3
+1.5
+1.9 +0.9 +25.7 +0.0 7.1 25.2 -18.1 Vert
19 1579.107M 34.2 -58.2
+1.5
+1.9 +0.9 +25.7 +0.0 6.0 25.4 -19.4 Vert
20 1571.571M 35.2 -58.3
+1.5
+1.9 +0.9 +25.7 +0.0 6.9 26.3 -19.4 Vert
21 1579.171M 34.2 -58.2
+1.5
+1.9 +0.9 +25.7 +0.0 6.0 25.7 -19.7 Vert
22 1571.375M 35.9 -58.3
+1.5
+1.9 +0.9 +25.7 +0.0 7.6 27.4 -19.8 Vert
23 1571.470M 35.1 -58.3
+1.5
+1.9 +0.9 +25.7 +0.0 6.8 26.8 -20.0 Vert
24 1571.343M 34.8 -58.3
+1.5
+1.9 +0.9 +25.7 +0.0 6.5 27.6 -21.1 Vert
25 1571.295M 34.8 -58.3
+1.5
+1.9 +0.9 +25.7 +0.0 6.5 27.8 -21.3 Vert
26 1579.776M 34.6 -58.2
+1.5
+1.9 +0.9 +25.7 +0.0 6.4 29.2 -22.8 Vert
27 1579.711M 33.6 -58.2
+1.5
+1.9 +0.9 +25.7 +0.0 5.4 28.8 -23.4 Vert
28 1570.620M 36.1 -58.3
+1.5
+1.9 +0.9 +25.7 +0.0 7.8 31.7 -23.9 Vert
29 1570.689M 35.3 -58.3
+1.5
+1.9 +0.9 +25.7 +0.0 7.0 31.3 -24.3 Vert
30 1570.875M 34.1 -58.3
+1.5
+1.9 +0.9 +25.7 +0.0 5.8 30.2 -24.4 Vert
31 1580.316M 34.1 -58.2
+1.5
+1.9 +0.9 +25.7 +0.0 5.9 32.3 -26.4 Vert
32 1570.131M 34.4 -58.3
+1.5
+1.9 +0.9 +25.7 +0.0 6.1 34.5 -28.4 Vert
33 1568.855M 35.2 -58.3
+1.5
+1.9 +0.9 +25.7 +0.0 6.9 41.8 -34.9 Vert
34 1582.109M 34.8 -58.2
+1.5
+1.9 +0.9 +25.7 +0.0 6.6 42.5 -35.9 Vert
35 1568.605M 35.3 -58.3
+1.5
+1.9 +0.9 +25.7 +0.0 7.0 43.2 -36.2 Vert
36 1582.157M 34.4 -58.2
+1.5
+1.9 +0.9 +25.7 +0.0 6.2 42.8 -36.6 Vert
37 1582.195M 34.4 -58.2
+1.5
+1.9 +0.9 +25.7 +0.0 6.2 43.0 -36.8 Vert
38 1568.409M 35.2 -58.3
+1.5
+1.9 +0.9 +25.7 +0.0 6.9 44.3 -37.4 Vert
39 1582.644M 33.6 -58.2
+1.5
+1.9 +0.9 +25.7 +0.0 5.4 45.6 -40.2 Vert
Page 52 of 128 Report No.: 99145-4
40 1567.728M 35.9 -58.3
+1.5
+1.9 +0.9 +25.7 +0.0 7.6 48.2 -40.6 Vert
41 1567.744M 35.6 -58.3
+1.5
+1.9 +0.9 +25.7 +0.0 7.3 48.1 -40.8 Vert
42 1582.783M 33.7 -58.2
+1.5
+1.9 +0.9 +25.7 +0.0 5.5 46.4 -40.9 Vert
43 1567.638M 35.3 -58.3
+1.5
+1.9 +0.9 +25.7 +0.0 7.0 48.8 -41.8 Vert
44 1567.611M 35.2 -58.3
+1.5
+1.9 +0.9 +25.7 +0.0 6.9 48.9 -42.0 Vert
45 1567.521M 35.2 -58.3
+1.5
+1.9 +0.9 +25.7 +0.0 6.9 49.4 -42.5 Vert
46 1583.276M 33.7 -58.2
+1.5
+1.9 +0.9 +25.7 +0.0 5.5 49.2 -43.7 Vert
Page 53 of 128 Report No.: 99145-4
Test Location: CKC Laboratories, Inc. • 1120 Fulton Place • Fremont, CA 94539 • (510) 249-1170
Customer: Texas Instruments Specification: CISPR 25 Section 6.4 - Class 5 Radiated Disturbances - Mobile - GPS L1 Civil - Ave Work Order #: 99145 Date: 11/11/2016
Test Type: Radiated Scan Time: 12:05:56
Tested By: N. Gamez Sequence#: 24
Software: EMITest 5.03.02
Equipment Tested:
Device Manufacturer Model # S/N
Configuration 1
Support Equipment:
Device Manufacturer Model # S/N
Configuration 1
Test Conditions / Notes:
CISPR25 (2008) Sec 6.4.4 Radiated Emissions 1.567-1.583GHz
Mobile
Temperature: 23°C
Humidity: 50%
Atmospheric Pressure: 101.5kPa
Position 1
Modification 33 was in place during testing.

Page 54 of 128 Report No.: 99145-4

Page 55 of 128 Report No.: 99145-4
Test Equipment:
ID Asset # Description Model Calibration Date Cal Due Date
AN03434 5uH LISN 9117-5-TS-50-
N
1/26/2016 1/26/2018
AN03436 5uH LISN 9117-5-TS-50-
N
1/27/2016 1/27/2018
AN03471 Spectrum Analyzer E4440A 1/4/2016 1/4/2018
T1 AN03114 Preamp AMF-7D-
00101800-30-
10P
4/22/2015 4/22/2017
T2 ANP06126 Cable 32022-29094K-
29094K-168TC
3/18/2015 3/18/2017
T3 ANP06138 Cable 32022-29094K-
29094K-72TC
3/18/2015 3/18/2017
T4 AN02157 Horn Antenna-
ARP958
Calibration
3115 12/2/2014 12/2/2016
T5 ANP06711 Cable 32022-29094K-
29094K-132TC
11/21/2014 11/21/2016
Measurement Data: Reading listed by margin. Test Distance: 1 Meter
# Freq Rdng T1
T5
T2 T3 T4 Dist Corr Spec Margin Polar
MHz dBµV dB dB dB dB Table dBµV/m dBµV/m dB Ant
1 1573.994M 34.3 -58.3
+1.5
+1.9 +0.9 +25.7 +0.0 6.0 12.4 -6.4 Horiz
2 1573.077M 35.6 -58.3
+1.5
+1.9 +0.9 +25.7 +0.0 7.3 17.7 -10.4 Horiz
3 1577.503M 33.9 -58.2
+1.5
+1.9 +0.9 +25.7 +0.0 5.7 16.2 -10.5 Horiz
4 1573.205M 34.2 -58.3
+1.5
+1.9 +0.9 +25.7 +0.0 5.9 16.9 -11.0 Horiz
5 1573.039M 35.0 -58.3
+1.5
+1.9 +0.9 +25.7 +0.0 6.7 17.9 -11.2 Horiz
6 1578.069M 34.0 -58.2
+1.5
+1.9 +0.9 +25.7 +0.0 5.8 19.4 -13.6 Horiz
7 1572.586M 35.0 -58.3
+1.5
+1.9 +0.9 +25.7 +0.0 6.7 20.5 -13.8 Horiz
8 1578.042M 33.6 -58.2
+1.5
+1.9 +0.9 +25.7 +0.0 5.4 19.3 -13.9 Horiz
9 1572.714M 33.8 -58.3
+1.5
+1.9 +0.9 +25.7 +0.0 5.5 19.7 -14.2 Horiz
10 1572.672M 33.8 -58.3
+1.5
+1.9 +0.9 +25.7 +0.0 5.5 20.0 -14.5 Horiz
11 1572.656M 33.6 -58.3
+1.5
+1.9 +0.9 +25.7 +0.0 5.3 20.1 -14.8 Horiz
12 1572.416M 34.4 -58.3
+1.5
+1.9 +0.9 +25.7 +0.0 6.1 21.4 -15.3 Horiz
Page 56 of 128 Report No.: 99145-4
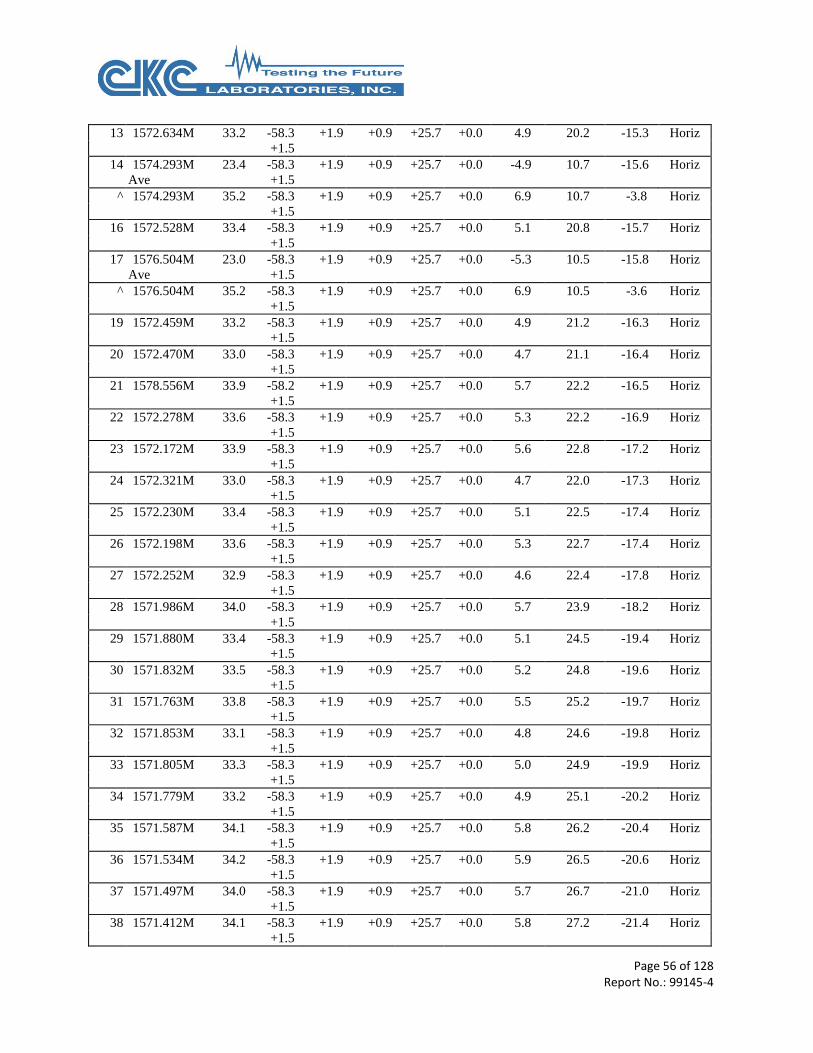
13 1572.634M 33.2 -58.3
+1.5
+1.9 +0.9 +25.7 +0.0 4.9 20.2 -15.3 Horiz
14 1574.293M 23.4 -58.3
+1.5
+1.9 +0.9 +25.7 +0.0 -4.9 10.7 -15.6 Horiz
Ave
^ 1574.293M 35.2 -58.3
+1.5
+1.9 +0.9 +25.7 +0.0 6.9 10.7 -3.8 Horiz
16 1572.528M 33.4 -58.3
+1.5
+1.9 +0.9 +25.7 +0.0 5.1 20.8 -15.7 Horiz
17 1576.504M 23.0 -58.3
+1.5
+1.9 +0.9 +25.7 +0.0 -5.3 10.5 -15.8 Horiz
Ave
^ 1576.504M 35.2 -58.3
+1.5
+1.9 +0.9 +25.7 +0.0 6.9 10.5 -3.6 Horiz
19 1572.459M 33.2 -58.3
+1.5
+1.9 +0.9 +25.7 +0.0 4.9 21.2 -16.3 Horiz
20 1572.470M 33.0 -58.3
+1.5
+1.9 +0.9 +25.7 +0.0 4.7 21.1 -16.4 Horiz
21 1578.556M 33.9 -58.2
+1.5
+1.9 +0.9 +25.7 +0.0 5.7 22.2 -16.5 Horiz
22 1572.278M 33.6 -58.3
+1.5
+1.9 +0.9 +25.7 +0.0 5.3 22.2 -16.9 Horiz
23 1572.172M 33.9 -58.3
+1.5
+1.9 +0.9 +25.7 +0.0 5.6 22.8 -17.2 Horiz
24 1572.321M 33.0 -58.3
+1.5
+1.9 +0.9 +25.7 +0.0 4.7 22.0 -17.3 Horiz
25 1572.230M 33.4 -58.3
+1.5
+1.9 +0.9 +25.7 +0.0 5.1 22.5 -17.4 Horiz
26 1572.198M 33.6 -58.3
+1.5
+1.9 +0.9 +25.7 +0.0 5.3 22.7 -17.4 Horiz
27 1572.252M 32.9 -58.3
+1.5
+1.9 +0.9 +25.7 +0.0 4.6 22.4 -17.8 Horiz
28 1571.986M 34.0 -58.3
+1.5
+1.9 +0.9 +25.7 +0.0 5.7 23.9 -18.2 Horiz
29 1571.880M 33.4 -58.3
+1.5
+1.9 +0.9 +25.7 +0.0 5.1 24.5 -19.4 Horiz
30 1571.832M 33.5 -58.3
+1.5
+1.9 +0.9 +25.7 +0.0 5.2 24.8 -19.6 Horiz
31 1571.763M 33.8 -58.3
+1.5
+1.9 +0.9 +25.7 +0.0 5.5 25.2 -19.7 Horiz
32 1571.853M 33.1 -58.3
+1.5
+1.9 +0.9 +25.7 +0.0 4.8 24.6 -19.8 Horiz
33 1571.805M 33.3 -58.3
+1.5
+1.9 +0.9 +25.7 +0.0 5.0 24.9 -19.9 Horiz
34 1571.779M 33.2 -58.3
+1.5
+1.9 +0.9 +25.7 +0.0 4.9 25.1 -20.2 Horiz
35 1571.587M 34.1 -58.3
+1.5
+1.9 +0.9 +25.7 +0.0 5.8 26.2 -20.4 Horiz
36 1571.534M 34.2 -58.3
+1.5
+1.9 +0.9 +25.7 +0.0 5.9 26.5 -20.6 Horiz
37 1571.497M 34.0 -58.3
+1.5
+1.9 +0.9 +25.7 +0.0 5.7 26.7 -21.0 Horiz
38 1571.412M 34.1 -58.3
+1.5
+1.9 +0.9 +25.7 +0.0 5.8 27.2 -21.4 Horiz
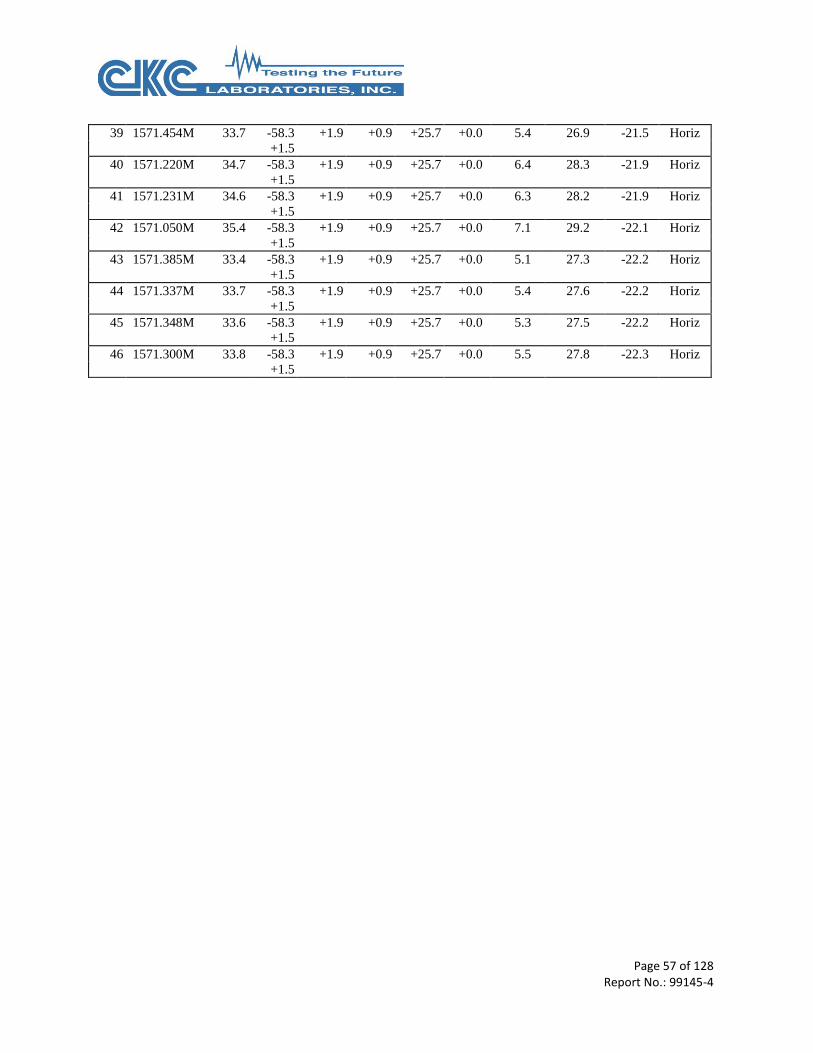
Page 57 of 128 Report No.: 99145-4
39 1571.454M 33.7 -58.3
+1.5
+1.9 +0.9 +25.7 +0.0 5.4 26.9 -21.5 Horiz
40 1571.220M 34.7 -58.3
+1.5
+1.9 +0.9 +25.7 +0.0 6.4 28.3 -21.9 Horiz
41 1571.231M 34.6 -58.3
+1.5
+1.9 +0.9 +25.7 +0.0 6.3 28.2 -21.9 Horiz
42 1571.050M 35.4 -58.3
+1.5
+1.9 +0.9 +25.7 +0.0 7.1 29.2 -22.1 Horiz
43 1571.385M 33.4 -58.3
+1.5
+1.9 +0.9 +25.7 +0.0 5.1 27.3 -22.2 Horiz
44 1571.337M 33.7 -58.3
+1.5
+1.9 +0.9 +25.7 +0.0 5.4 27.6 -22.2 Horiz
45 1571.348M 33.6 -58.3
+1.5
+1.9 +0.9 +25.7 +0.0 5.3 27.5 -22.2 Horiz
46 1571.300M 33.8 -58.3
+1.5
+1.9 +0.9 +25.7 +0.0 5.5 27.8 -22.3 Horiz

Page 58 of 128 Report No.: 99145-4
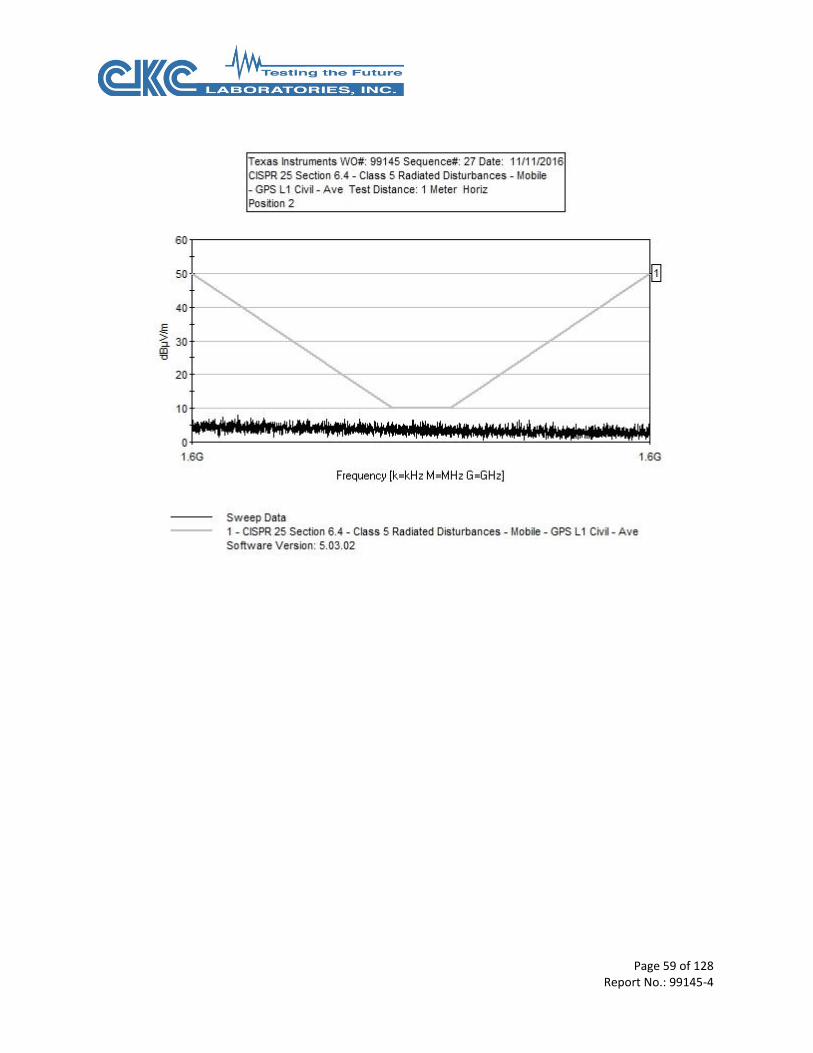
Test Location: CKC Laboratories, Inc. • 1120 Fulton Place • Fremont, CA 94539 • (510) 249-1170
Customer: Texas Instruments Specification: CISPR 25 Section 6.4 - Class 5 Radiated Disturbances - Mobile - GPS L1 Civil - Ave Work Order #: 99145 Date: 11/11/2016
Test Type: Radiated Scan Time: 14:29:21
Tested By: N. Gamez Sequence#: 27
Software: EMITest 5.03.02
Equipment Tested:
Device Manufacturer Model # S/N
Configuration 1
Support Equipment:
Device Manufacturer Model # S/N
Configuration 1
Test Conditions / Notes:
CISPR25 (2008) Sec 6.4.4 Radiated Emissions 1.567-1.583GHz
Mobile
Temperature: 23°C
Humidity: 50%
Atmospheric Pressure: 101.5kPa
Position 2
Modification 33 was in place during testing.
Page 59 of 128 Report No.: 99145-4
Page 60 of 128 Report No.: 99145-4
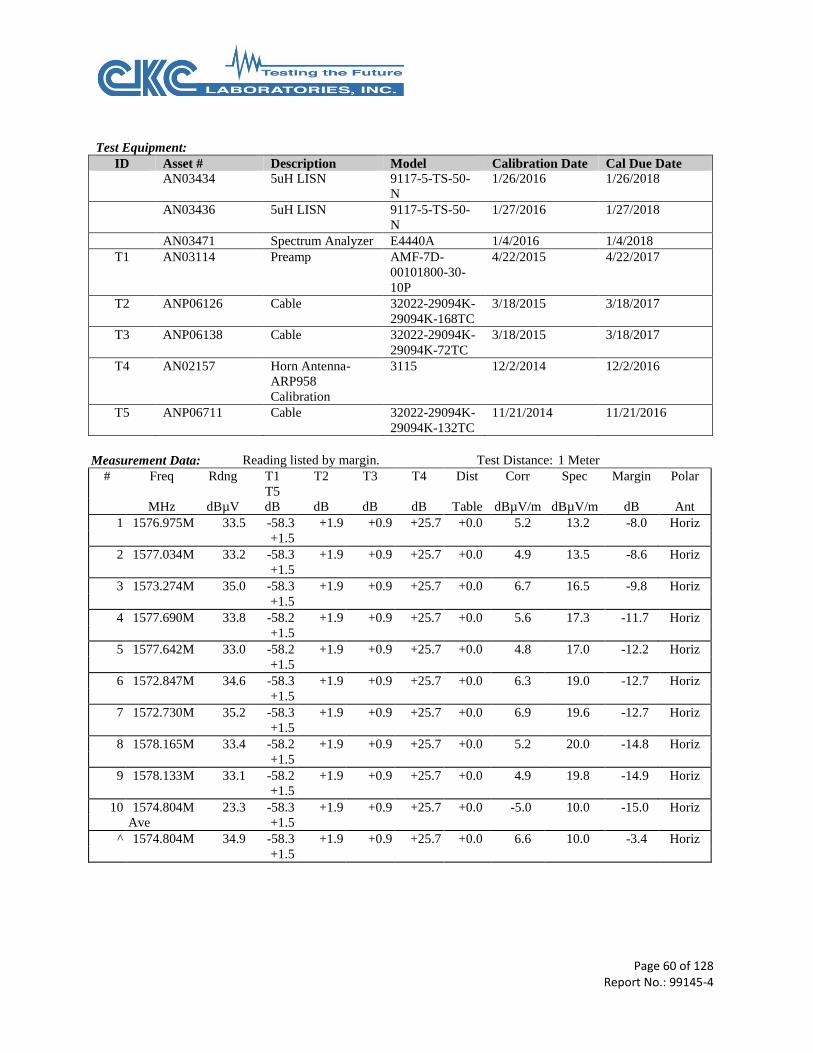
Test Equipment:
ID Asset # Description Model Calibration Date Cal Due Date
AN03434 5uH LISN 9117-5-TS-50-
N
1/26/2016 1/26/2018
AN03436 5uH LISN 9117-5-TS-50-
N
1/27/2016 1/27/2018
AN03471 Spectrum Analyzer E4440A 1/4/2016 1/4/2018
T1 AN03114 Preamp AMF-7D-
00101800-30-
10P
4/22/2015 4/22/2017
T2 ANP06126 Cable 32022-29094K-
29094K-168TC
3/18/2015 3/18/2017
T3 ANP06138 Cable 32022-29094K-
29094K-72TC
3/18/2015 3/18/2017
T4 AN02157 Horn Antenna-
ARP958
Calibration
3115 12/2/2014 12/2/2016
T5 ANP06711 Cable 32022-29094K-
29094K-132TC
11/21/2014 11/21/2016
Measurement Data: Reading listed by margin. Test Distance: 1 Meter
# Freq Rdng T1
T5
T2 T3 T4 Dist Corr Spec Margin Polar
MHz dBµV dB dB dB dB Table dBµV/m dBµV/m dB Ant
1 1576.975M 33.5 -58.3
+1.5
+1.9 +0.9 +25.7 +0.0 5.2 13.2 -8.0 Horiz
2 1577.034M 33.2 -58.3
+1.5
+1.9 +0.9 +25.7 +0.0 4.9 13.5 -8.6 Horiz
3 1573.274M 35.0 -58.3
+1.5
+1.9 +0.9 +25.7 +0.0 6.7 16.5 -9.8 Horiz
4 1577.690M 33.8 -58.2
+1.5
+1.9 +0.9 +25.7 +0.0 5.6 17.3 -11.7 Horiz
5 1577.642M 33.0 -58.2
+1.5
+1.9 +0.9 +25.7 +0.0 4.8 17.0 -12.2 Horiz
6 1572.847M 34.6 -58.3
+1.5
+1.9 +0.9 +25.7 +0.0 6.3 19.0 -12.7 Horiz
7 1572.730M 35.2 -58.3
+1.5
+1.9 +0.9 +25.7 +0.0 6.9 19.6 -12.7 Horiz
8 1578.165M 33.4 -58.2
+1.5
+1.9 +0.9 +25.7 +0.0 5.2 20.0 -14.8 Horiz
9 1578.133M 33.1 -58.2
+1.5
+1.9 +0.9 +25.7 +0.0 4.9 19.8 -14.9 Horiz
10 1574.804M 23.3 -58.3
+1.5
+1.9 +0.9 +25.7 +0.0 -5.0 10.0 -15.0 Horiz
Ave
^ 1574.804M 34.9 -58.3
+1.5
+1.9 +0.9 +25.7 +0.0 6.6 10.0 -3.4 Horiz

Page 61 of 128 Report No.: 99145-4
12 1576.009M 23.0 -58.3
+1.5
+1.9 +0.9 +25.7 +0.0 -5.3 10.0 -15.3 Horiz
Ave
^ 1576.009M 35.6 -58.3
+1.5
+1.9 +0.9 +25.7 +0.0 7.3 10.0 -2.7 Horiz
^ 1576.095M 34.6 -58.3
+1.5
+1.9 +0.9 +25.7 +0.0 6.3 10.0 -3.7 Horiz
15 1578.090M 32.4 -58.2
+1.5
+1.9 +0.9 +25.7 +0.0 4.2 19.6 -15.4 Horiz
16 1578.363M 33.6 -58.2
+1.5
+1.9 +0.9 +25.7 +0.0 5.4 21.1 -15.7 Horiz
17 1578.438M 33.9 -58.2
+1.5
+1.9 +0.9 +25.7 +0.0 5.7 21.5 -15.8 Horiz
18 1578.079M 31.6 -58.2
+1.5
+1.9 +0.9 +25.7 +0.0 3.4 19.5 -16.1 Horiz
19 1572.103M 35.2 -58.3
+1.5
+1.9 +0.9 +25.7 +0.0 6.9 23.2 -16.3 Horiz
20 1578.604M 33.9 -58.2
+1.5
+1.9 +0.9 +25.7 +0.0 5.7 22.5 -16.8 Horiz
21 1572.177M 34.2 -58.3
+1.5
+1.9 +0.9 +25.7 +0.0 5.9 22.8 -16.9 Horiz
22 1578.620M 33.5 -58.2
+1.5
+1.9 +0.9 +25.7 +0.0 5.3 22.6 -17.3 Horiz
23 1572.034M 34.5 -58.3
+1.5
+1.9 +0.9 +25.7 +0.0 6.2 23.6 -17.4 Horiz
24 1578.759M 34.1 -58.2
+1.5
+1.9 +0.9 +25.7 +0.0 5.9 23.4 -17.5 Horiz
25 1578.850M 34.6 -58.2
+1.5
+1.9 +0.9 +25.7 +0.0 6.4 23.9 -17.5 Horiz
26 1571.986M 34.4 -58.3
+1.5
+1.9 +0.9 +25.7 +0.0 6.1 23.9 -17.8 Horiz
27 1578.641M 32.6 -58.2
+1.5
+1.9 +0.9 +25.7 +0.0 4.4 22.7 -18.3 Horiz
28 1578.695M 32.8 -58.2
+1.5
+1.9 +0.9 +25.7 +0.0 4.6 23.0 -18.4 Horiz
29 1578.673M 32.7 -58.2
+1.5
+1.9 +0.9 +25.7 +0.0 4.5 22.9 -18.4 Horiz
30 1578.909M 33.7 -58.2
+1.5
+1.9 +0.9 +25.7 +0.0 5.5 24.2 -18.7 Horiz
31 1579.203M 34.6 -58.2
+1.5
+1.9 +0.9 +25.7 +0.0 6.4 25.9 -19.5 Horiz
32 1578.796M 32.0 -58.2
+1.5
+1.9 +0.9 +25.7 +0.0 3.8 23.6 -19.8 Horiz
33 1579.000M 33.0 -58.2
+1.5
+1.9 +0.9 +25.7 +0.0 4.8 24.8 -20.0 Horiz
34 1579.128M 33.4 -58.2
+1.5
+1.9 +0.9 +25.7 +0.0 5.2 25.5 -20.3 Horiz
35 1571.305M 34.5 -58.3
+1.5
+1.9 +0.9 +25.7 +0.0 6.2 27.8 -21.6 Horiz
36 1571.183M 34.8 -58.3
+1.5
+1.9 +0.9 +25.7 +0.0 6.5 28.5 -22.0 Horiz
37 1571.109M 34.9 -58.3
+1.5
+1.9 +0.9 +25.7 +0.0 6.6 28.9 -22.3 Horiz
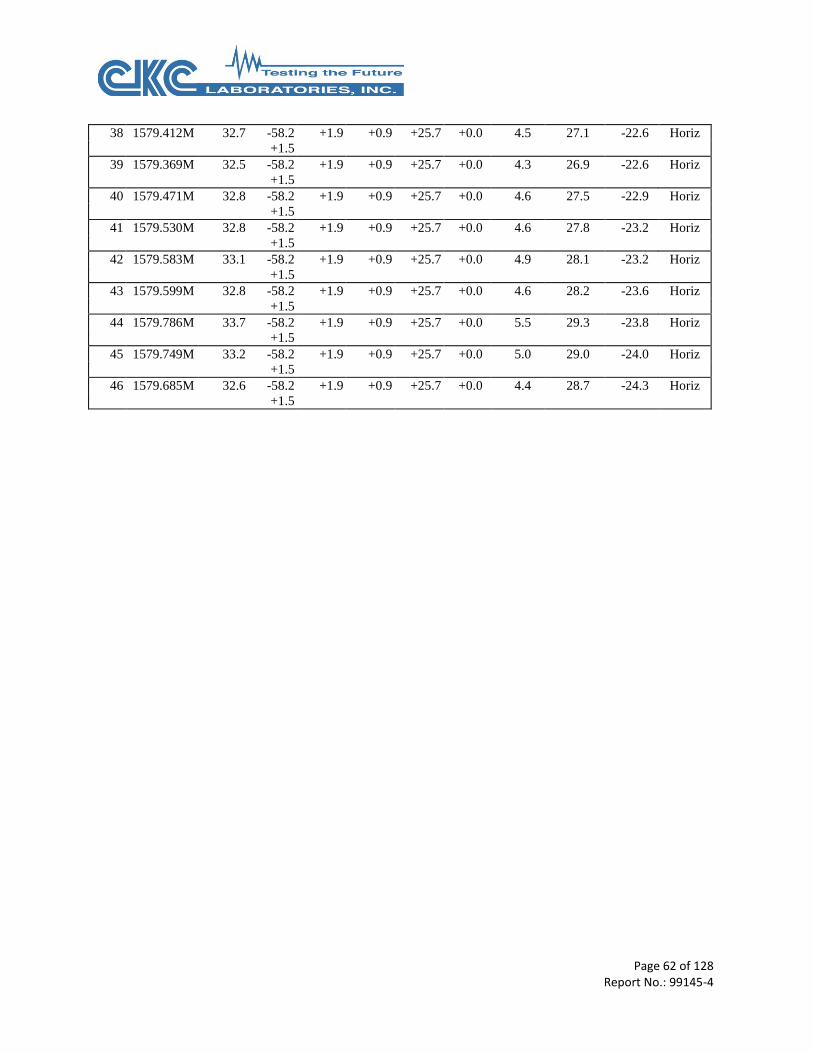
Page 62 of 128 Report No.: 99145-4
38 1579.412M 32.7 -58.2
+1.5
+1.9 +0.9 +25.7 +0.0 4.5 27.1 -22.6 Horiz
39 1579.369M 32.5 -58.2
+1.5
+1.9 +0.9 +25.7 +0.0 4.3 26.9 -22.6 Horiz
40 1579.471M 32.8 -58.2
+1.5
+1.9 +0.9 +25.7 +0.0 4.6 27.5 -22.9 Horiz
41 1579.530M 32.8 -58.2
+1.5
+1.9 +0.9 +25.7 +0.0 4.6 27.8 -23.2 Horiz
42 1579.583M 33.1 -58.2
+1.5
+1.9 +0.9 +25.7 +0.0 4.9 28.1 -23.2 Horiz
43 1579.599M 32.8 -58.2
+1.5
+1.9 +0.9 +25.7 +0.0 4.6 28.2 -23.6 Horiz
44 1579.786M 33.7 -58.2
+1.5
+1.9 +0.9 +25.7 +0.0 5.5 29.3 -23.8 Horiz
45 1579.749M 33.2 -58.2
+1.5
+1.9 +0.9 +25.7 +0.0 5.0 29.0 -24.0 Horiz
46 1579.685M 32.6 -58.2
+1.5
+1.9 +0.9 +25.7 +0.0 4.4 28.7 -24.3 Horiz

Page 63 of 128 Report No.: 99145-4
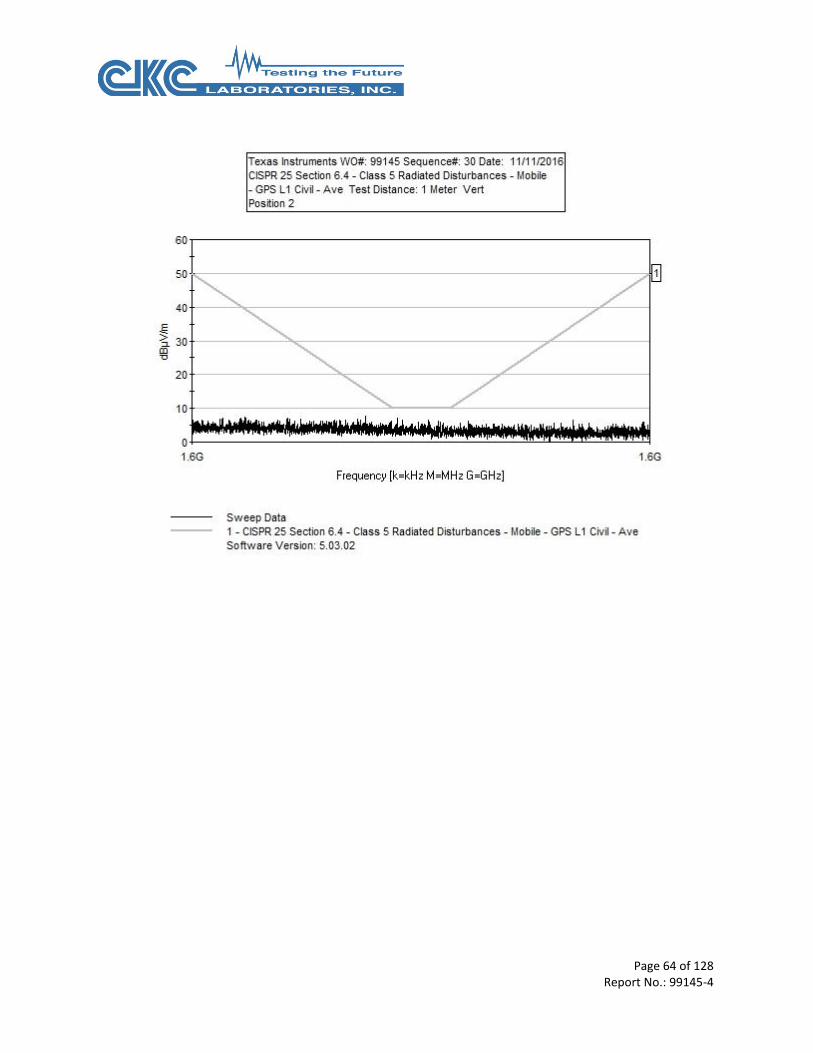
Test Location: CKC Laboratories, Inc. • 1120 Fulton Place • Fremont, CA 94539 • (510) 249-1170
Customer: Texas Instruments Specification: CISPR 25 Section 6.4 - Class 5 Radiated Disturbances - Mobile - GPS L1 Civil - Ave Work Order #: 99145 Date: 11/11/2016
Test Type: Radiated Scan Time: 15:39:05
Tested By: N. Gamez Sequence#: 30
Software: EMITest 5.03.02
Equipment Tested:
Device Manufacturer Model # S/N
Configuration 1
Support Equipment:
Device Manufacturer Model # S/N
Configuration 1
Test Conditions / Notes:
CISPR25 (2008) Sec 6.4.4 Radiated Emissions 1.567-1.583GHz
Mobile
Temperature: 23°C
Humidity: 50%
Atmospheric Pressure: 101.5kPa
Position 2
Modification 33 was in place during testing.
Page 64 of 128 Report No.: 99145-4
Page 65 of 128 Report No.: 99145-4
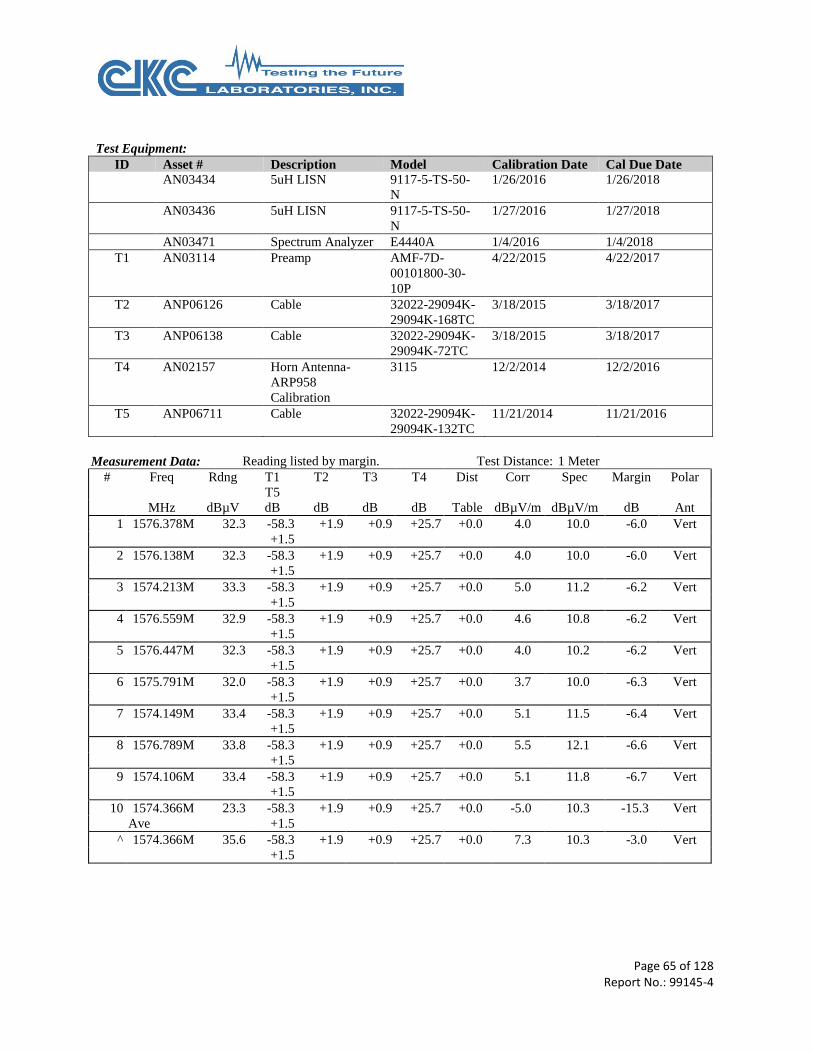
Test Equipment:
ID Asset # Description Model Calibration Date Cal Due Date
AN03434 5uH LISN 9117-5-TS-50-
N
1/26/2016 1/26/2018
AN03436 5uH LISN 9117-5-TS-50-
N
1/27/2016 1/27/2018
AN03471 Spectrum Analyzer E4440A 1/4/2016 1/4/2018
T1 AN03114 Preamp AMF-7D-
00101800-30-
10P
4/22/2015 4/22/2017
T2 ANP06126 Cable 32022-29094K-
29094K-168TC
3/18/2015 3/18/2017
T3 ANP06138 Cable 32022-29094K-
29094K-72TC
3/18/2015 3/18/2017
T4 AN02157 Horn Antenna-
ARP958
Calibration
3115 12/2/2014 12/2/2016
T5 ANP06711 Cable 32022-29094K-
29094K-132TC
11/21/2014 11/21/2016
Measurement Data: Reading listed by margin. Test Distance: 1 Meter
# Freq Rdng T1
T5
T2 T3 T4 Dist Corr Spec Margin Polar
MHz dBµV dB dB dB dB Table dBµV/m dBµV/m dB Ant
1 1576.378M 32.3 -58.3
+1.5
+1.9 +0.9 +25.7 +0.0 4.0 10.0 -6.0 Vert
2 1576.138M 32.3 -58.3
+1.5
+1.9 +0.9 +25.7 +0.0 4.0 10.0 -6.0 Vert
3 1574.213M 33.3 -58.3
+1.5
+1.9 +0.9 +25.7 +0.0 5.0 11.2 -6.2 Vert
4 1576.559M 32.9 -58.3
+1.5
+1.9 +0.9 +25.7 +0.0 4.6 10.8 -6.2 Vert
5 1576.447M 32.3 -58.3
+1.5
+1.9 +0.9 +25.7 +0.0 4.0 10.2 -6.2 Vert
6 1575.791M 32.0 -58.3
+1.5
+1.9 +0.9 +25.7 +0.0 3.7 10.0 -6.3 Vert
7 1574.149M 33.4 -58.3
+1.5
+1.9 +0.9 +25.7 +0.0 5.1 11.5 -6.4 Vert
8 1576.789M 33.8 -58.3
+1.5
+1.9 +0.9 +25.7 +0.0 5.5 12.1 -6.6 Vert
9 1574.106M 33.4 -58.3
+1.5
+1.9 +0.9 +25.7 +0.0 5.1 11.8 -6.7 Vert
10 1574.366M 23.3 -58.3
+1.5
+1.9 +0.9 +25.7 +0.0 -5.0 10.3 -15.3 Vert
Ave
^ 1574.366M 35.6 -58.3
+1.5
+1.9 +0.9 +25.7 +0.0 7.3 10.3 -3.0 Vert
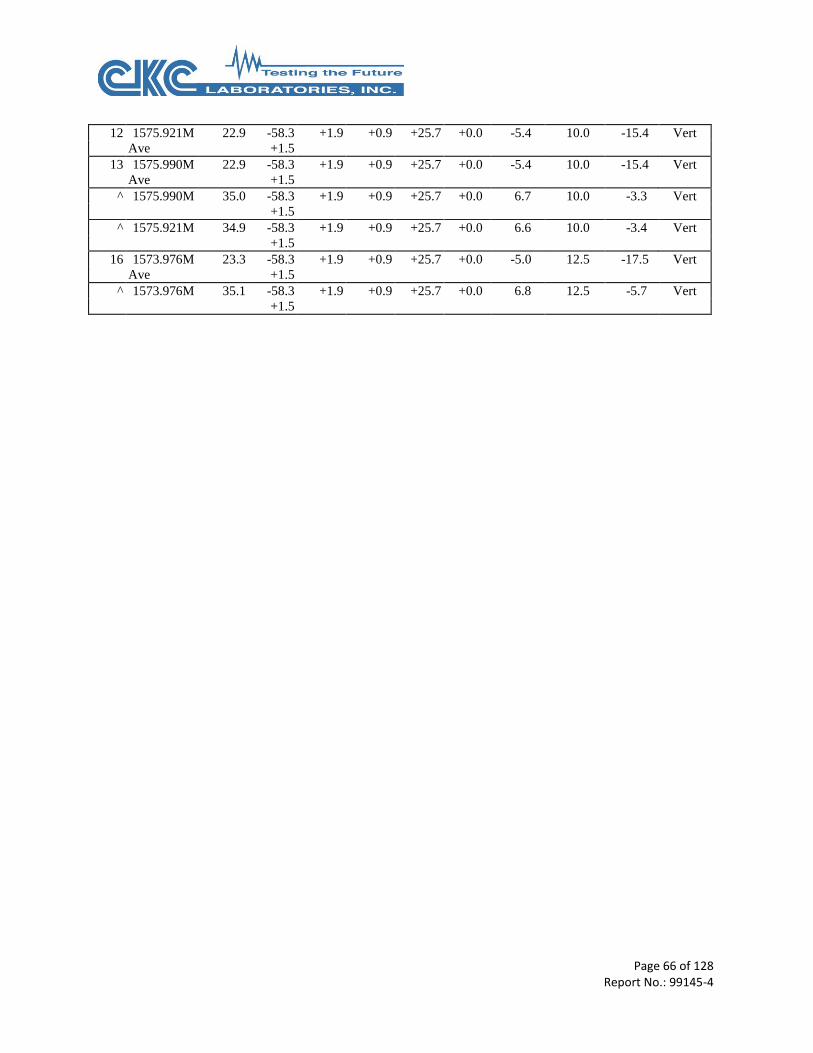
Page 66 of 128 Report No.: 99145-4
12 1575.921M 22.9 -58.3
+1.5
+1.9 +0.9 +25.7 +0.0 -5.4 10.0 -15.4 Vert
Ave
13 1575.990M 22.9 -58.3
+1.5
+1.9 +0.9 +25.7 +0.0 -5.4 10.0 -15.4 Vert
Ave
^ 1575.990M 35.0 -58.3
+1.5
+1.9 +0.9 +25.7 +0.0 6.7 10.0 -3.3 Vert
^ 1575.921M 34.9 -58.3
+1.5
+1.9 +0.9 +25.7 +0.0 6.6 10.0 -3.4 Vert
16 1573.976M 23.3 -58.3
+1.5
+1.9 +0.9 +25.7 +0.0 -5.0 12.5 -17.5 Vert
Ave
^ 1573.976M 35.1 -58.3
+1.5
+1.9 +0.9 +25.7 +0.0 6.8 12.5 -5.7 Vert
Page 67 of 128 Report No.: 99145-4
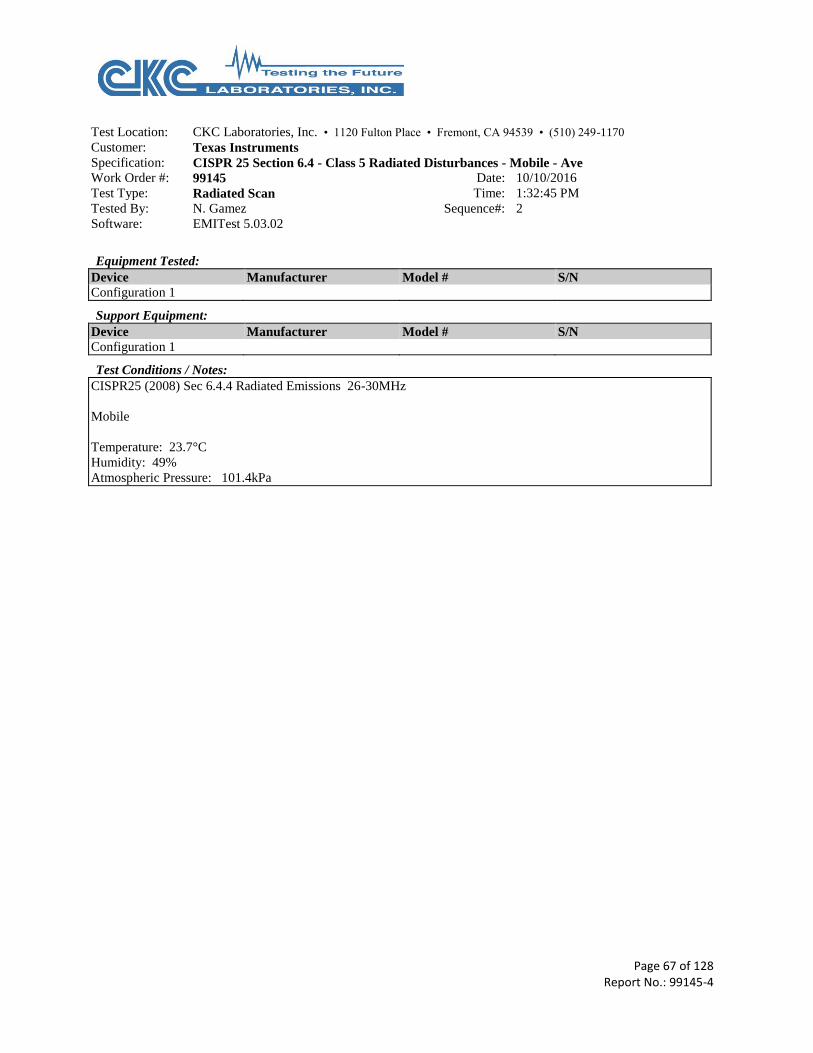
Test Location: CKC Laboratories, Inc. • 1120 Fulton Place • Fremont, CA 94539 • (510) 249-1170
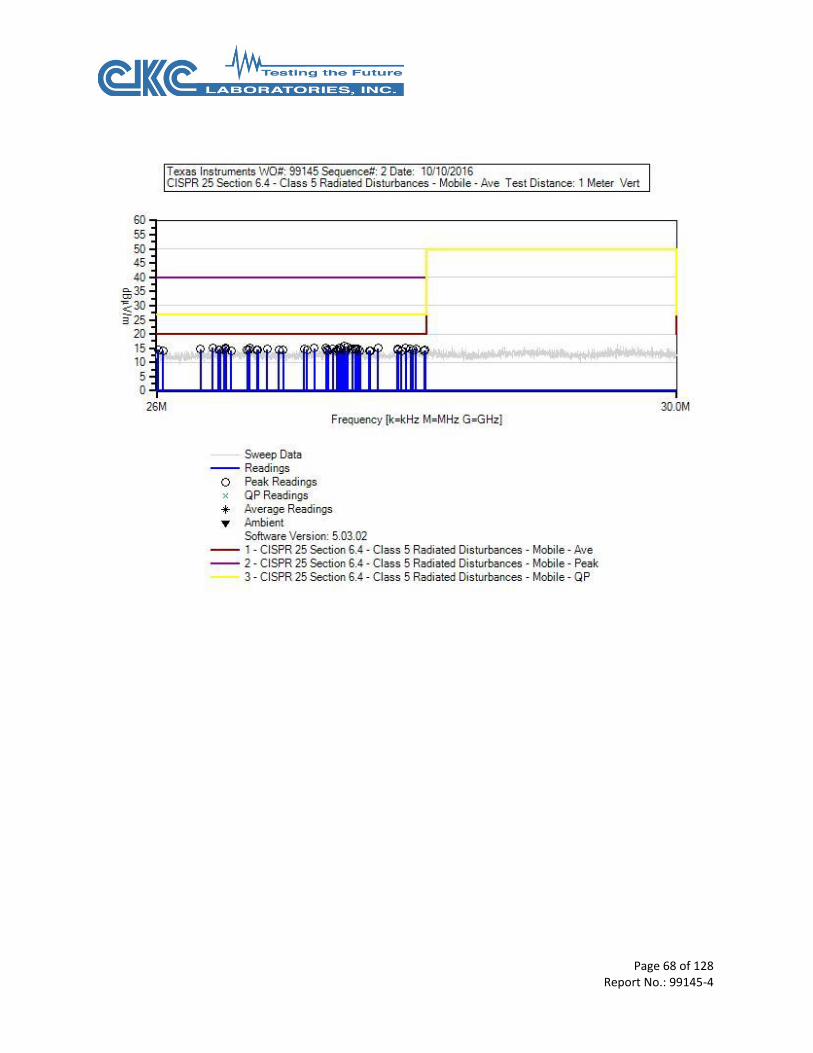
Customer: Texas Instruments Specification: CISPR 25 Section 6.4 - Class 5 Radiated Disturbances - Mobile - Ave Work Order #: 99145 Date: 10/10/2016
Test Type: Radiated Scan Time: 1:32:45 PM
Tested By: N. Gamez Sequence#: 2
Software: EMITest 5.03.02
Equipment Tested:
Device Manufacturer Model # S/N
Configuration 1
Support Equipment:
Device Manufacturer Model # S/N
Configuration 1
Test Conditions / Notes:
CISPR25 (2008) Sec 6.4.4 Radiated Emissions 26-30MHz
Mobile
Temperature: 23.7°C
Humidity: 49%
Atmospheric Pressure: 101.4kPa
Page 68 of 128 Report No.: 99145-4
Page 69 of 128 Report No.: 99145-4
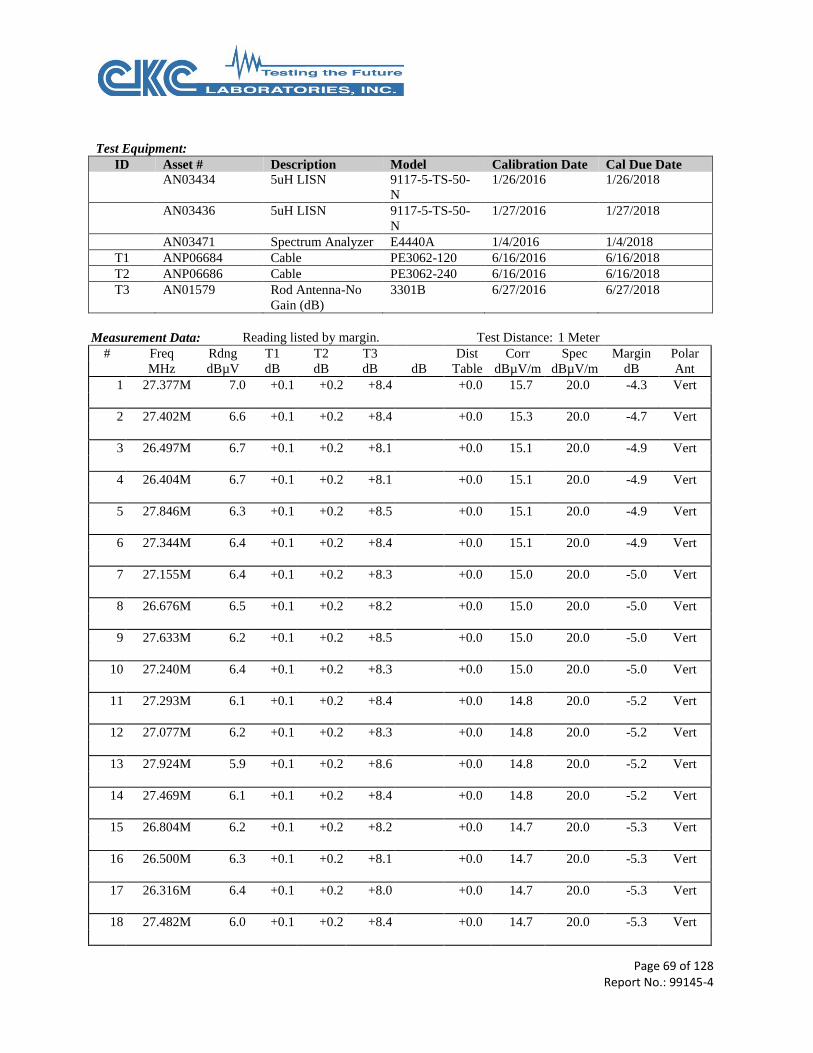
Test Equipment:
ID Asset # Description Model Calibration Date Cal Due Date
AN03434 5uH LISN 9117-5-TS-50-
N
1/26/2016 1/26/2018
AN03436 5uH LISN 9117-5-TS-50-
N
1/27/2016 1/27/2018
AN03471 Spectrum Analyzer E4440A 1/4/2016 1/4/2018
T1 ANP06684 Cable PE3062-120 6/16/2016 6/16/2018
T2 ANP06686 Cable PE3062-240 6/16/2016 6/16/2018
T3 AN01579 Rod Antenna-No
Gain (dB)
3301B 6/27/2016 6/27/2018
Measurement Data: Reading listed by margin. Test Distance: 1 Meter
# Freq Rdng T1 T2 T3 Dist Corr Spec Margin Polar
MHz dBµV dB dB dB dB Table dBµV/m dBµV/m dB Ant
1 27.377M 7.0 +0.1 +0.2 +8.4 +0.0 15.7 20.0 -4.3 Vert
2 27.402M 6.6 +0.1 +0.2 +8.4 +0.0 15.3 20.0 -4.7 Vert
3 26.497M 6.7 +0.1 +0.2 +8.1 +0.0 15.1 20.0 -4.9 Vert
4 26.404M 6.7 +0.1 +0.2 +8.1 +0.0 15.1 20.0 -4.9 Vert
5 27.846M 6.3 +0.1 +0.2 +8.5 +0.0 15.1 20.0 -4.9 Vert
6 27.344M 6.4 +0.1 +0.2 +8.4 +0.0 15.1 20.0 -4.9 Vert
7 27.155M 6.4 +0.1 +0.2 +8.3 +0.0 15.0 20.0 -5.0 Vert
8 26.676M 6.5 +0.1 +0.2 +8.2 +0.0 15.0 20.0 -5.0 Vert
9 27.633M 6.2 +0.1 +0.2 +8.5 +0.0 15.0 20.0 -5.0 Vert
10 27.240M 6.4 +0.1 +0.2 +8.3 +0.0 15.0 20.0 -5.0 Vert
11 27.293M 6.1 +0.1 +0.2 +8.4 +0.0 14.8 20.0 -5.2 Vert
12 27.077M 6.2 +0.1 +0.2 +8.3 +0.0 14.8 20.0 -5.2 Vert
13 27.924M 5.9 +0.1 +0.2 +8.6 +0.0 14.8 20.0 -5.2 Vert
14 27.469M 6.1 +0.1 +0.2 +8.4 +0.0 14.8 20.0 -5.2 Vert
15 26.804M 6.2 +0.1 +0.2 +8.2 +0.0 14.7 20.0 -5.3 Vert
16 26.500M 6.3 +0.1 +0.2 +8.1 +0.0 14.7 20.0 -5.3 Vert
17 26.316M 6.4 +0.1 +0.2 +8.0 +0.0 14.7 20.0 -5.3 Vert
18 27.482M 6.0 +0.1 +0.2 +8.4 +0.0 14.7 20.0 -5.3 Vert

Page 70 of 128 Report No.: 99145-4
19 27.459M 6.0 +0.1 +0.2 +8.4 +0.0 14.7 20.0 -5.3 Vert
20 27.357M 6.0 +0.1 +0.2 +8.4 +0.0 14.7 20.0 -5.3 Vert
21 27.437M 5.9 +0.1 +0.2 +8.4 +0.0 14.6 20.0 -5.4 Vert
22 27.782M 5.8 +0.1 +0.2 +8.5 +0.0 14.6 20.0 -5.4 Vert
23 27.883M 5.7 +0.1 +0.2 +8.6 +0.0 14.6 20.0 -5.4 Vert
24 26.729M 6.0 +0.1 +0.2 +8.2 +0.0 14.5 20.0 -5.5 Vert
25 27.900M 5.6 +0.1 +0.2 +8.6 +0.0 14.5 20.0 -5.5 Vert
26 26.457M 6.1 +0.1 +0.2 +8.1 +0.0 14.5 20.0 -5.5 Vert
27 26.448M 6.1 +0.1 +0.2 +8.1 +0.0 14.5 20.0 -5.5 Vert
28 26.669M 6.0 +0.1 +0.2 +8.2 +0.0 14.5 20.0 -5.5 Vert
29 26.485M 6.1 +0.1 +0.2 +8.1 +0.0 14.5 20.0 -5.5 Vert
30 26.734M 5.9 +0.1 +0.2 +8.2 +0.0 14.4 20.0 -5.6 Vert
31 26.011M 6.2 +0.1 +0.2 +7.9 +0.0 14.4 20.0 -5.6 Vert
32 27.100M 5.8 +0.1 +0.2 +8.3 +0.0 14.4 20.0 -5.6 Vert
33 27.465M 5.7 +0.1 +0.2 +8.4 +0.0 14.4 20.0 -5.6 Vert
34 27.247M 5.8 +0.1 +0.2 +8.3 +0.0 14.4 20.0 -5.6 Vert
35 26.923M 5.8 +0.1 +0.2 +8.2 +0.0 14.3 20.0 -5.7 Vert
36 26.889M 5.8 +0.1 +0.2 +8.2 +0.0 14.3 20.0 -5.7 Vert
37 26.657M 5.9 +0.1 +0.2 +8.1 +0.0 14.3 20.0 -5.7 Vert
38 27.994M 5.4 +0.1 +0.2 +8.6 +0.0 14.3 20.0 -5.7 Vert
39 27.785M 5.5 +0.1 +0.2 +8.5 +0.0 14.3 20.0 -5.7 Vert
40 27.332M 5.6 +0.1 +0.2 +8.4 +0.0 14.3 20.0 -5.7 Vert
41 26.539M 5.8 +0.1 +0.2 +8.1 +0.0 14.2 20.0 -5.8 Vert
42 26.047M 6.0 +0.1 +0.2 +7.9 +0.0 14.2 20.0 -5.8 Vert
43 27.254M 5.6 +0.1 +0.2 +8.3 +0.0 14.2 20.0 -5.8 Vert
44 27.811M 5.4 +0.1 +0.2 +8.5 +0.0 14.2 20.0 -5.8 Vert
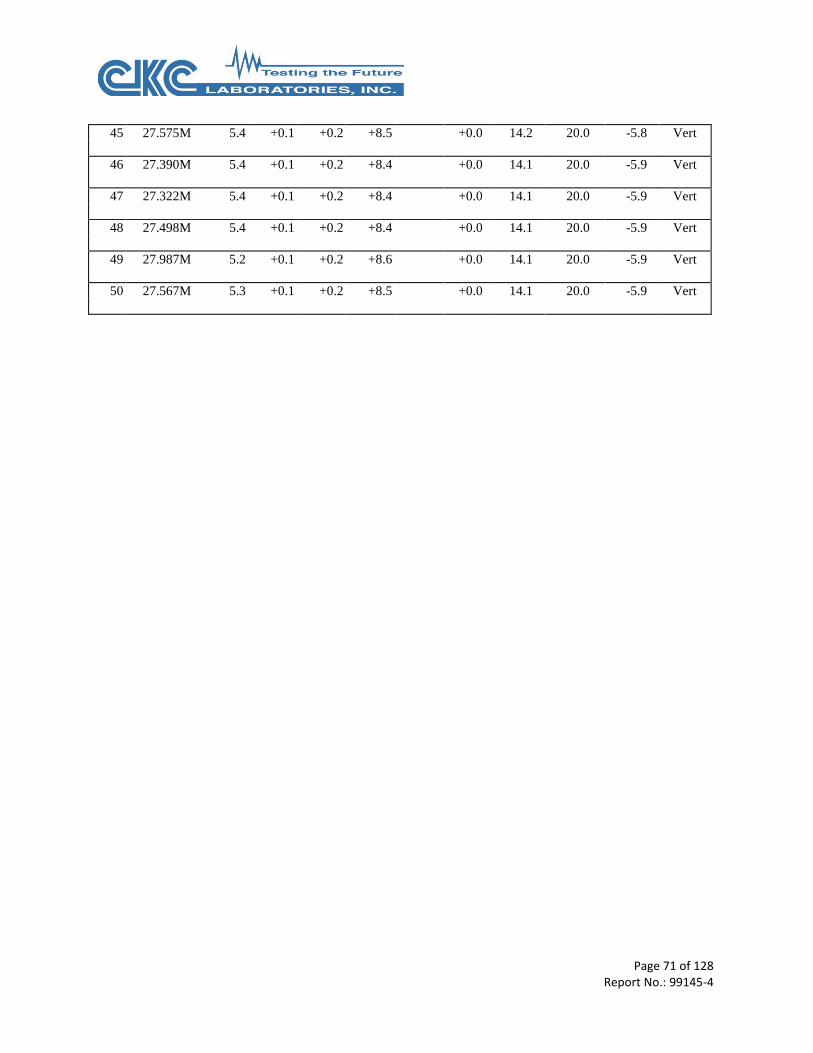
Page 71 of 128 Report No.: 99145-4
45 27.575M 5.4 +0.1 +0.2 +8.5 +0.0 14.2 20.0 -5.8 Vert
46 27.390M 5.4 +0.1 +0.2 +8.4 +0.0 14.1 20.0 -5.9 Vert
47 27.322M 5.4 +0.1 +0.2 +8.4 +0.0 14.1 20.0 -5.9 Vert
48 27.498M 5.4 +0.1 +0.2 +8.4 +0.0 14.1 20.0 -5.9 Vert
49 27.987M 5.2 +0.1 +0.2 +8.6 +0.0 14.1 20.0 -5.9 Vert
50 27.567M 5.3 +0.1 +0.2 +8.5 +0.0 14.1 20.0 -5.9 Vert

Page 72 of 128 Report No.: 99145-4
Test Location: CKC Laboratories, Inc. • 1120 Fulton Place • Fremont, CA 94539 • (510) 249-1170
Customer: Texas Instruments Specification: CISPR 25 Section 6.4 - Class 5 Radiated Disturbances - Mobile - Ave Work Order #: 99145 Date: 10/26/2016
Test Type: Radiated Scan Time: 14:58:16
Tested By: N. Gamez Sequence#: 10
Software: EMITest 5.03.02
Equipment Tested:
Device Manufacturer Model # S/N
Configuration 1
Support Equipment:
Device Manufacturer Model # S/N
Configuration 1
Test Conditions / Notes:
CISPR25 (2008) Sec 6.4.4 Radiated Emissions 300-1000MHz
Mobile
Temperature: 23°C
Humidity: 55%
Atmospheric Pressure: 101.6kPa
Modification 33 was in place during testing.
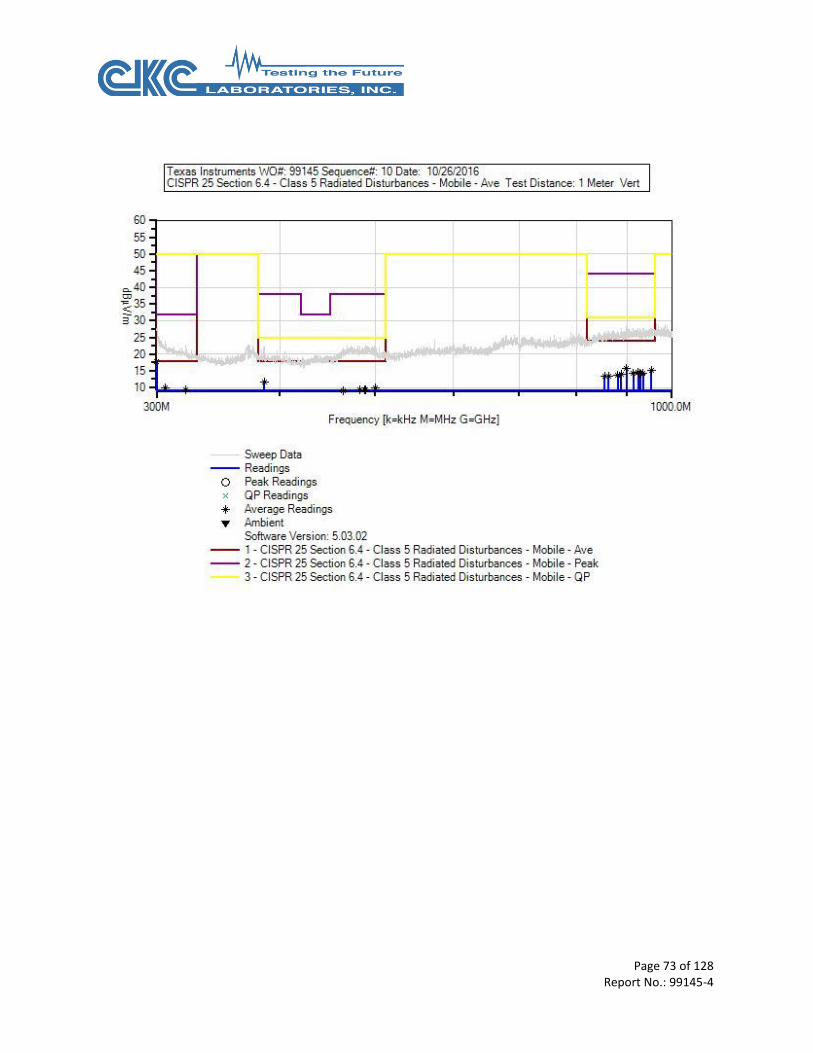
Page 73 of 128 Report No.: 99145-4
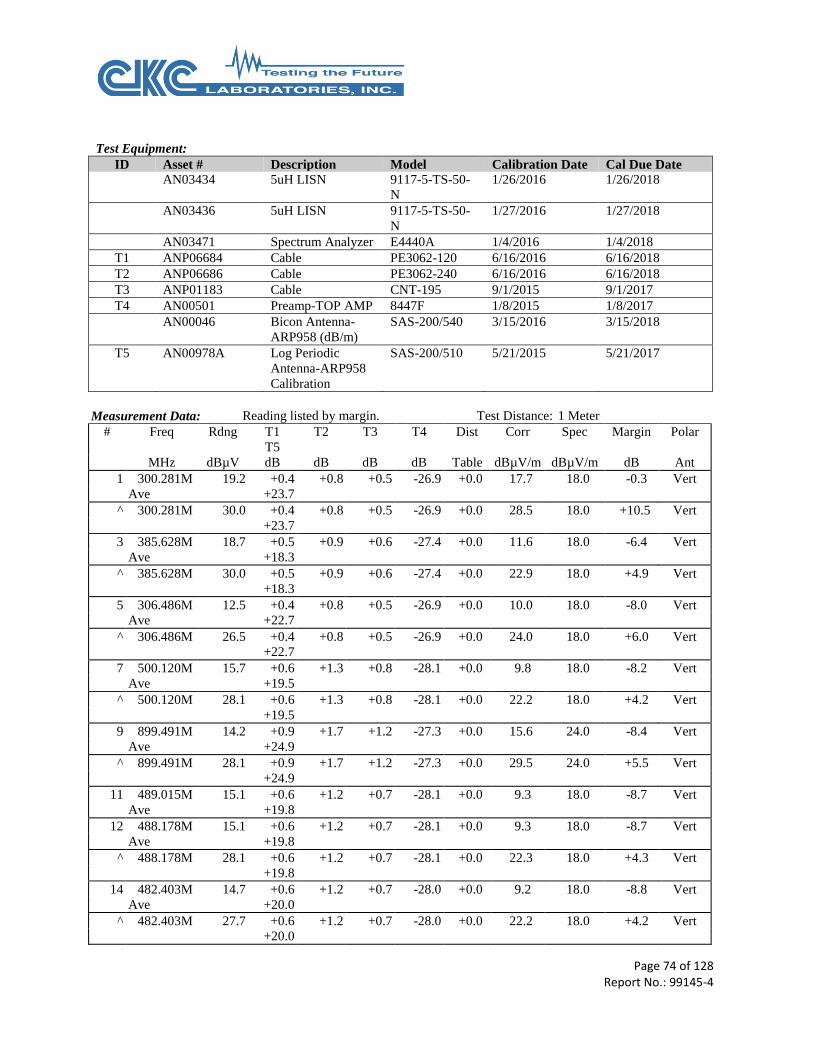
Page 74 of 128 Report No.: 99145-4
Test Equipment:
ID Asset # Description Model Calibration Date Cal Due Date
AN03434 5uH LISN 9117-5-TS-50-
N
1/26/2016 1/26/2018
AN03436 5uH LISN 9117-5-TS-50-
N
1/27/2016 1/27/2018
AN03471 Spectrum Analyzer E4440A 1/4/2016 1/4/2018
T1 ANP06684 Cable PE3062-120 6/16/2016 6/16/2018
T2 ANP06686 Cable PE3062-240 6/16/2016 6/16/2018
T3 ANP01183 Cable CNT-195 9/1/2015 9/1/2017
T4 AN00501 Preamp-TOP AMP 8447F 1/8/2015 1/8/2017
AN00046 Bicon Antenna-
ARP958 (dB/m)
SAS-200/540 3/15/2016 3/15/2018
T5 AN00978A Log Periodic
Antenna-ARP958
Calibration
SAS-200/510 5/21/2015 5/21/2017
Measurement Data: Reading listed by margin. Test Distance: 1 Meter
# Freq Rdng T1
T5
T2 T3 T4 Dist Corr Spec Margin Polar
MHz dBµV dB dB dB dB Table dBµV/m dBµV/m dB Ant
1 300.281M 19.2 +0.4
+23.7
+0.8 +0.5 -26.9 +0.0 17.7 18.0 -0.3 Vert
Ave
^ 300.281M 30.0 +0.4
+23.7
+0.8 +0.5 -26.9 +0.0 28.5 18.0 +10.5 Vert
3 385.628M 18.7 +0.5
+18.3
+0.9 +0.6 -27.4 +0.0 11.6 18.0 -6.4 Vert
Ave
^ 385.628M 30.0 +0.5
+18.3
+0.9 +0.6 -27.4 +0.0 22.9 18.0 +4.9 Vert
5 306.486M 12.5 +0.4
+22.7
+0.8 +0.5 -26.9 +0.0 10.0 18.0 -8.0 Vert
Ave
^ 306.486M 26.5 +0.4
+22.7
+0.8 +0.5 -26.9 +0.0 24.0 18.0 +6.0 Vert
7 500.120M 15.7 +0.6
+19.5
+1.3 +0.8 -28.1 +0.0 9.8 18.0 -8.2 Vert
Ave
^ 500.120M 28.1 +0.6
+19.5
+1.3 +0.8 -28.1 +0.0 22.2 18.0 +4.2 Vert
9 899.491M 14.2 +0.9
+24.9
+1.7 +1.2 -27.3 +0.0 15.6 24.0 -8.4 Vert
Ave
^ 899.491M 28.1 +0.9
+24.9
+1.7 +1.2 -27.3 +0.0 29.5 24.0 +5.5 Vert
11 489.015M 15.1 +0.6
+19.8
+1.2 +0.7 -28.1 +0.0 9.3 18.0 -8.7 Vert
Ave
12 488.178M 15.1 +0.6
+19.8
+1.2 +0.7 -28.1 +0.0 9.3 18.0 -8.7 Vert
Ave
^ 488.178M 28.1 +0.6
+19.8
+1.2 +0.7 -28.1 +0.0 22.3 18.0 +4.3 Vert
14 482.403M 14.7 +0.6
+20.0
+1.2 +0.7 -28.0 +0.0 9.2 18.0 -8.8 Vert
Ave
^ 482.403M 27.7 +0.6
+20.0
+1.2 +0.7 -28.0 +0.0 22.2 18.0 +4.2 Vert
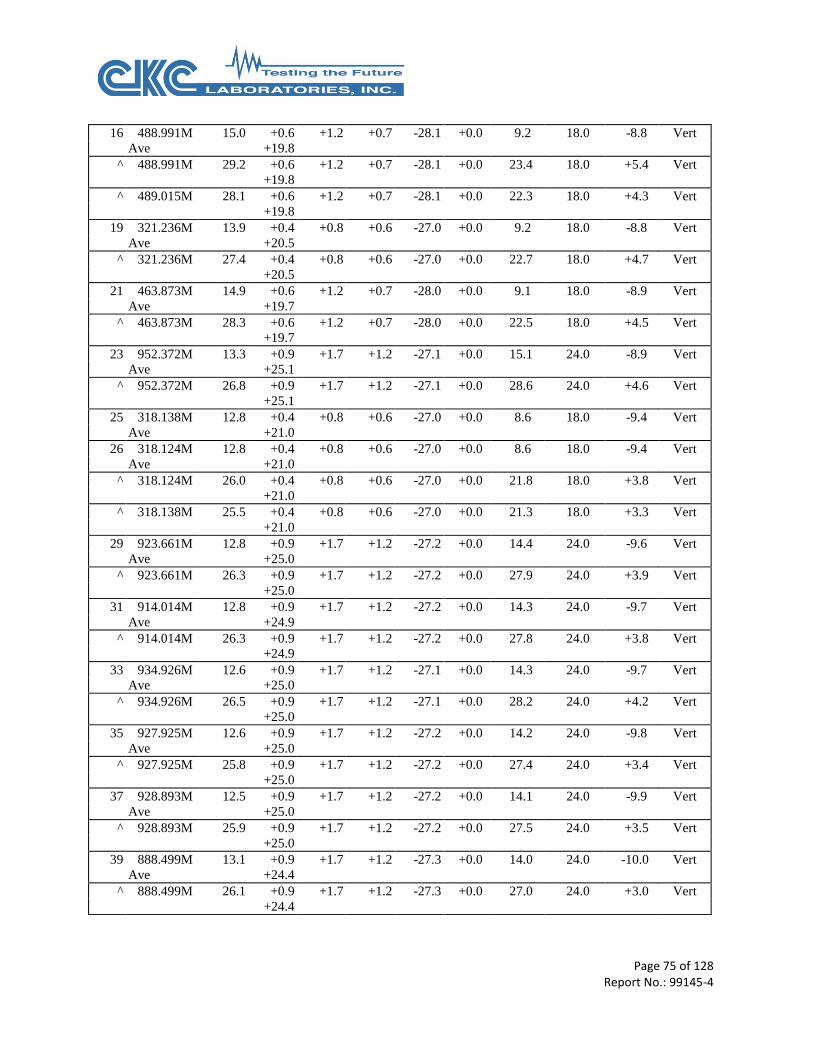
Page 75 of 128 Report No.: 99145-4
16 488.991M 15.0 +0.6
+19.8
+1.2 +0.7 -28.1 +0.0 9.2 18.0 -8.8 Vert
Ave
^ 488.991M 29.2 +0.6
+19.8
+1.2 +0.7 -28.1 +0.0 23.4 18.0 +5.4 Vert
^ 489.015M 28.1 +0.6
+19.8
+1.2 +0.7 -28.1 +0.0 22.3 18.0 +4.3 Vert
19 321.236M 13.9 +0.4
+20.5
+0.8 +0.6 -27.0 +0.0 9.2 18.0 -8.8 Vert
Ave
^ 321.236M 27.4 +0.4
+20.5
+0.8 +0.6 -27.0 +0.0 22.7 18.0 +4.7 Vert
21 463.873M 14.9 +0.6
+19.7
+1.2 +0.7 -28.0 +0.0 9.1 18.0 -8.9 Vert
Ave
^ 463.873M 28.3 +0.6
+19.7
+1.2 +0.7 -28.0 +0.0 22.5 18.0 +4.5 Vert
23 952.372M 13.3 +0.9
+25.1
+1.7 +1.2 -27.1 +0.0 15.1 24.0 -8.9 Vert
Ave
^ 952.372M 26.8 +0.9
+25.1
+1.7 +1.2 -27.1 +0.0 28.6 24.0 +4.6 Vert
25 318.138M 12.8 +0.4
+21.0
+0.8 +0.6 -27.0 +0.0 8.6 18.0 -9.4 Vert
Ave
26 318.124M 12.8 +0.4
+21.0
+0.8 +0.6 -27.0 +0.0 8.6 18.0 -9.4 Vert
Ave
^ 318.124M 26.0 +0.4
+21.0
+0.8 +0.6 -27.0 +0.0 21.8 18.0 +3.8 Vert
^ 318.138M 25.5 +0.4
+21.0
+0.8 +0.6 -27.0 +0.0 21.3 18.0 +3.3 Vert
29 923.661M 12.8 +0.9
+25.0
+1.7 +1.2 -27.2 +0.0 14.4 24.0 -9.6 Vert
Ave
^ 923.661M 26.3 +0.9
+25.0
+1.7 +1.2 -27.2 +0.0 27.9 24.0 +3.9 Vert
31 914.014M 12.8 +0.9
+24.9
+1.7 +1.2 -27.2 +0.0 14.3 24.0 -9.7 Vert
Ave
^ 914.014M 26.3 +0.9
+24.9
+1.7 +1.2 -27.2 +0.0 27.8 24.0 +3.8 Vert
33 934.926M 12.6 +0.9
+25.0
+1.7 +1.2 -27.1 +0.0 14.3 24.0 -9.7 Vert
Ave
^ 934.926M 26.5 +0.9
+25.0
+1.7 +1.2 -27.1 +0.0 28.2 24.0 +4.2 Vert
35 927.925M 12.6 +0.9
+25.0
+1.7 +1.2 -27.2 +0.0 14.2 24.0 -9.8 Vert
Ave
^ 927.925M 25.8 +0.9
+25.0
+1.7 +1.2 -27.2 +0.0 27.4 24.0 +3.4 Vert
37 928.893M 12.5 +0.9
+25.0
+1.7 +1.2 -27.2 +0.0 14.1 24.0 -9.9 Vert
Ave
^ 928.893M 25.9 +0.9
+25.0
+1.7 +1.2 -27.2 +0.0 27.5 24.0 +3.5 Vert
39 888.499M 13.1 +0.9
+24.4
+1.7 +1.2 -27.3 +0.0 14.0 24.0 -10.0 Vert
Ave
^ 888.499M 26.1 +0.9
+24.4
+1.7 +1.2 -27.3 +0.0 27.0 24.0 +3.0 Vert
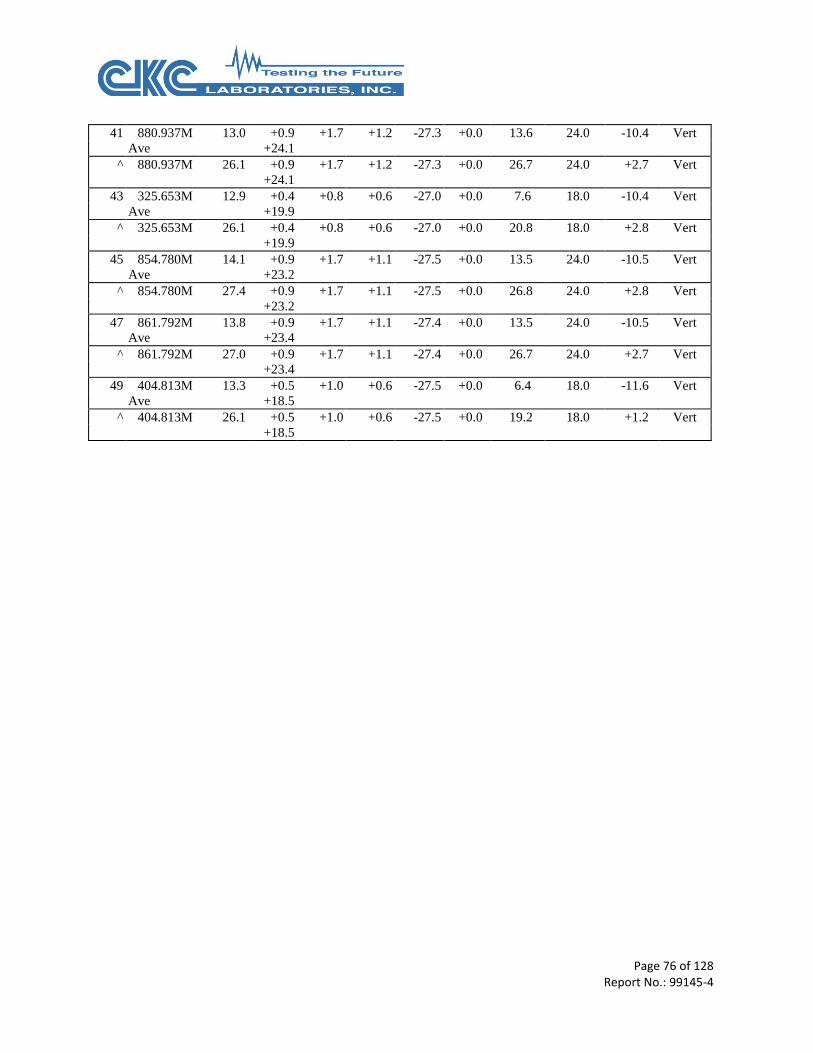
Page 76 of 128 Report No.: 99145-4
41 880.937M 13.0 +0.9
+24.1
+1.7 +1.2 -27.3 +0.0 13.6 24.0 -10.4 Vert
Ave
^ 880.937M 26.1 +0.9
+24.1
+1.7 +1.2 -27.3 +0.0 26.7 24.0 +2.7 Vert
43 325.653M 12.9 +0.4
+19.9
+0.8 +0.6 -27.0 +0.0 7.6 18.0 -10.4 Vert
Ave
^ 325.653M 26.1 +0.4
+19.9
+0.8 +0.6 -27.0 +0.0 20.8 18.0 +2.8 Vert
45 854.780M 14.1 +0.9
+23.2
+1.7 +1.1 -27.5 +0.0 13.5 24.0 -10.5 Vert
Ave
^ 854.780M 27.4 +0.9
+23.2
+1.7 +1.1 -27.5 +0.0 26.8 24.0 +2.8 Vert
47 861.792M 13.8 +0.9
+23.4
+1.7 +1.1 -27.4 +0.0 13.5 24.0 -10.5 Vert
Ave
^ 861.792M 27.0 +0.9
+23.4
+1.7 +1.1 -27.4 +0.0 26.7 24.0 +2.7 Vert
49 404.813M 13.3 +0.5
+18.5
+1.0 +0.6 -27.5 +0.0 6.4 18.0 -11.6 Vert
Ave
^ 404.813M 26.1 +0.5
+18.5
+1.0 +0.6 -27.5 +0.0 19.2 18.0 +1.2 Vert
Page 77 of 128 Report No.: 99145-4
Test Location: CKC Laboratories, Inc. • 1120 Fulton Place • Fremont, CA 94539 • (510) 249-1170
Customer: Texas Instruments Specification: CISPR 25 Section 6.4 - Class 5 Radiated Disturbances - Mobile - Ave Work Order #: 99145 Date: 10/26/2016
Test Type: Radiated Scan Time: 15:30:45
Tested By: N. Gamez Sequence#: 11
Software: EMITest 5.03.02
Equipment Tested:
Device Manufacturer Model # S/N
Configuration 1
Support Equipment:
Device Manufacturer Model # S/N
Configuration 1
Test Conditions / Notes:
CISPR25 (2008) Sec 6.4.4 Radiated Emissions 300-1000MHz
Mobile
Temperature: 23°C
Humidity: 55%
Atmospheric Pressure: 101.6kPa
Ambient Scan
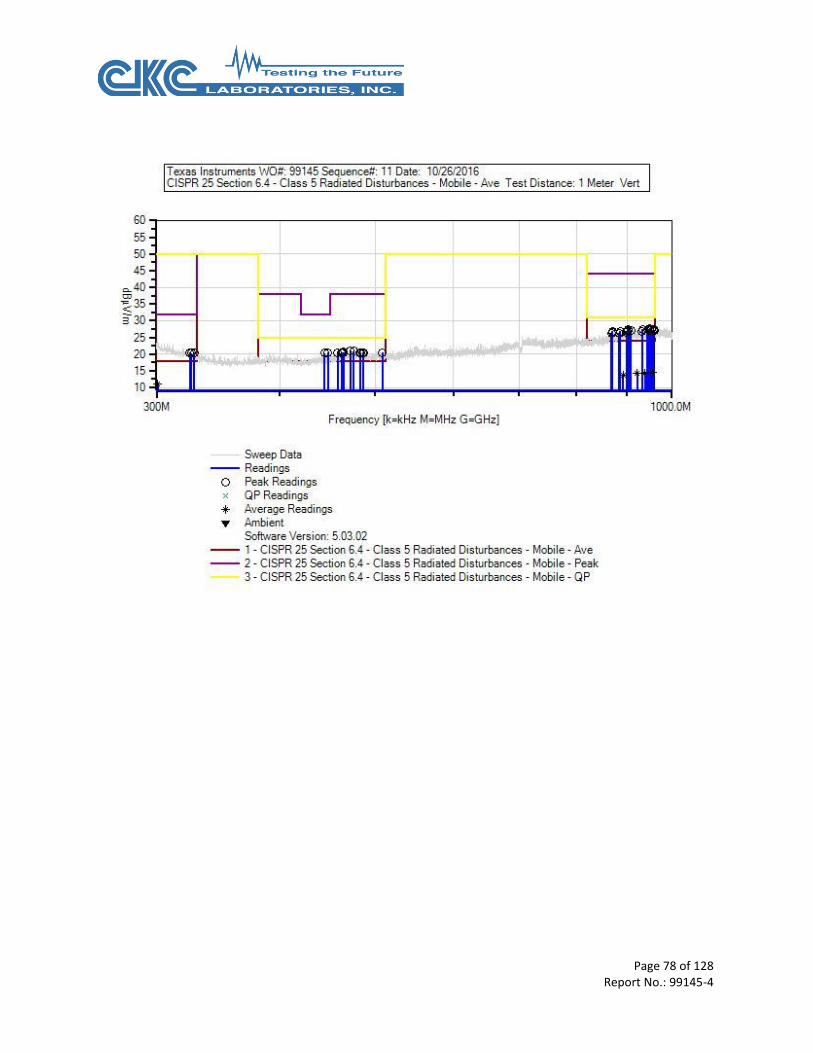
Page 78 of 128 Report No.: 99145-4

Page 79 of 128 Report No.: 99145-4
Test Equipment:
ID Asset # Description Model Calibration Date Cal Due Date
AN03434 5uH LISN 9117-5-TS-50-
N
1/26/2016 1/26/2018
AN03436 5uH LISN 9117-5-TS-50-
N
1/27/2016 1/27/2018
AN03471 Spectrum Analyzer E4440A 1/4/2016 1/4/2018
T1 ANP06684 Cable PE3062-120 6/16/2016 6/16/2018
T2 ANP06686 Cable PE3062-240 6/16/2016 6/16/2018
T3 ANP01183 Cable CNT-195 9/1/2015 9/1/2017
T4 AN00501 Preamp-TOP AMP 8447F 1/8/2015 1/8/2017
AN00046 Bicon Antenna-
ARP958 (dB/m)
SAS-200/540 3/15/2016 3/15/2018
T5 AN00978A Log Periodic
Antenna-ARP958
Calibration
SAS-200/510 5/21/2015 5/21/2017
Measurement Data: Reading listed by margin. Test Distance: 1 Meter
# Freq Rdng T1
T5
T2 T3 T4 Dist Corr Spec Margin Polar
MHz dBµV dB dB dB dB Table dBµV/m dBµV/m dB Ant
1 948.809M 25.8 +0.9
+25.1
+1.7 +1.2 -27.1 +0.0 27.6 24.0 +3.6 Vert
2 903.284M 26.1 +0.9
+24.9
+1.7 +1.2 -27.3 +0.0 27.5 24.0 +3.5 Vert
3 933.800M 25.8 +0.9
+25.0
+1.7 +1.2 -27.1 +0.0 27.5 24.0 +3.5 Vert
4 949.704M 25.6 +0.9
+25.1
+1.7 +1.2 -27.1 +0.0 27.4 24.0 +3.4 Vert
5 952.984M 25.6 +0.9
+25.1
+1.7 +1.2 -27.1 +0.0 27.4 24.0 +3.4 Vert
6 944.734M 25.5 +0.9
+25.1
+1.7 +1.2 -27.1 +0.0 27.3 24.0 +3.3 Vert
7 957.755M 25.4 +0.9
+25.1
+1.7 +1.3 -27.1 +0.0 27.3 24.0 +3.3 Vert
8 908.751M 25.7 +0.9
+24.9
+1.7 +1.2 -27.2 +0.0 27.2 24.0 +3.2 Vert
9 959.544M 25.2 +0.9
+25.1
+1.7 +1.3 -27.0 +0.0 27.2 24.0 +3.2 Vert
10 471.892M 26.4 +0.6
+20.1
+1.2 +0.7 -28.0 +0.0 21.0 18.0 +3.0 Vert
11 902.290M 25.6 +0.9
+24.9
+1.7 +1.2 -27.3 +0.0 27.0 24.0 +3.0 Vert
12 956.761M 25.1 +0.9
+25.1
+1.7 +1.3 -27.1 +0.0 27.0 24.0 +3.0 Vert
13 948.213M 25.2 +0.9
+25.1
+1.7 +1.2 -27.1 +0.0 27.0 24.0 +3.0 Vert
14 475.615M 26.2 +0.6
+20.2
+1.2 +0.7 -28.0 +0.0 20.9 18.0 +2.9 Vert
15 899.879M 25.5 +0.9
+24.9
+1.7 +1.2 -27.3 +0.0 26.9 24.0 +2.9 Vert
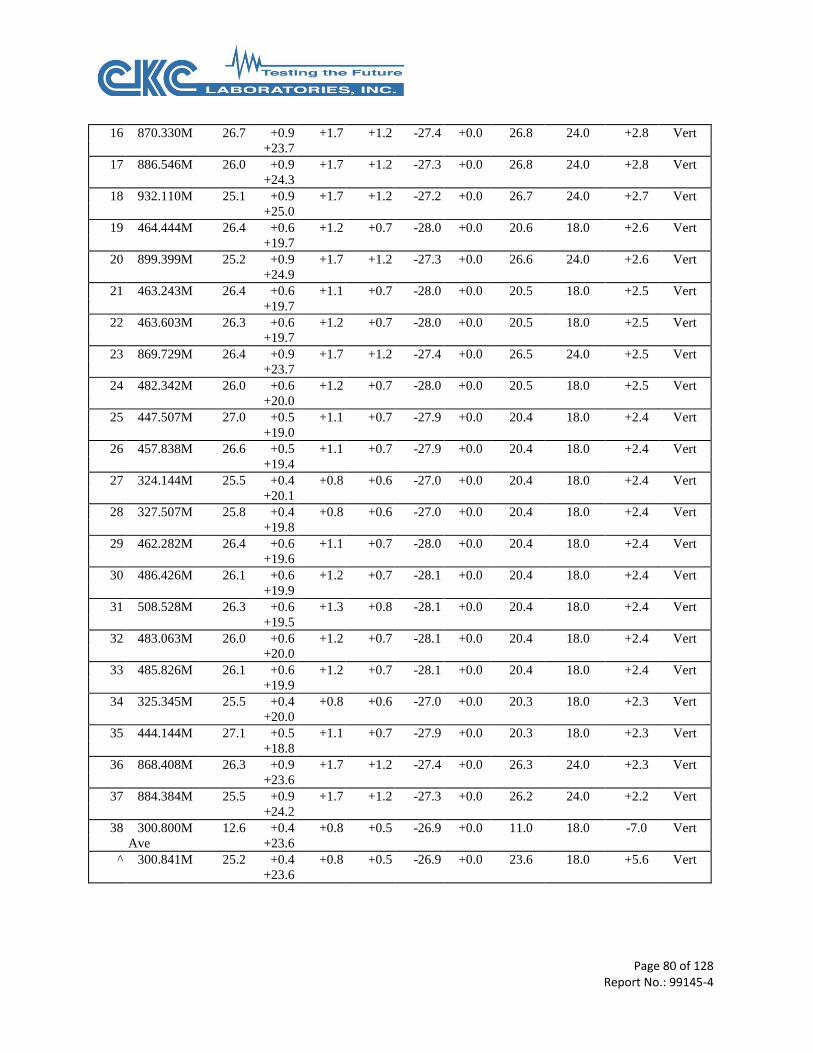
Page 80 of 128 Report No.: 99145-4
16 870.330M 26.7 +0.9
+23.7
+1.7 +1.2 -27.4 +0.0 26.8 24.0 +2.8 Vert
17 886.546M 26.0 +0.9
+24.3
+1.7 +1.2 -27.3 +0.0 26.8 24.0 +2.8 Vert
18 932.110M 25.1 +0.9
+25.0
+1.7 +1.2 -27.2 +0.0 26.7 24.0 +2.7 Vert
19 464.444M 26.4 +0.6
+19.7
+1.2 +0.7 -28.0 +0.0 20.6 18.0 +2.6 Vert
20 899.399M 25.2 +0.9
+24.9
+1.7 +1.2 -27.3 +0.0 26.6 24.0 +2.6 Vert
21 463.243M 26.4 +0.6
+19.7
+1.1 +0.7 -28.0 +0.0 20.5 18.0 +2.5 Vert
22 463.603M 26.3 +0.6
+19.7
+1.2 +0.7 -28.0 +0.0 20.5 18.0 +2.5 Vert
23 869.729M 26.4 +0.9
+23.7
+1.7 +1.2 -27.4 +0.0 26.5 24.0 +2.5 Vert
24 482.342M 26.0 +0.6
+20.0
+1.2 +0.7 -28.0 +0.0 20.5 18.0 +2.5 Vert
25 447.507M 27.0 +0.5
+19.0
+1.1 +0.7 -27.9 +0.0 20.4 18.0 +2.4 Vert
26 457.838M 26.6 +0.5
+19.4
+1.1 +0.7 -27.9 +0.0 20.4 18.0 +2.4 Vert
27 324.144M 25.5 +0.4
+20.1
+0.8 +0.6 -27.0 +0.0 20.4 18.0 +2.4 Vert
28 327.507M 25.8 +0.4
+19.8
+0.8 +0.6 -27.0 +0.0 20.4 18.0 +2.4 Vert
29 462.282M 26.4 +0.6
+19.6
+1.1 +0.7 -28.0 +0.0 20.4 18.0 +2.4 Vert
30 486.426M 26.1 +0.6
+19.9
+1.2 +0.7 -28.1 +0.0 20.4 18.0 +2.4 Vert
31 508.528M 26.3 +0.6
+19.5
+1.3 +0.8 -28.1 +0.0 20.4 18.0 +2.4 Vert
32 483.063M 26.0 +0.6
+20.0
+1.2 +0.7 -28.1 +0.0 20.4 18.0 +2.4 Vert
33 485.826M 26.1 +0.6
+19.9
+1.2 +0.7 -28.1 +0.0 20.4 18.0 +2.4 Vert
34 325.345M 25.5 +0.4
+20.0
+0.8 +0.6 -27.0 +0.0 20.3 18.0 +2.3 Vert
35 444.144M 27.1 +0.5
+18.8
+1.1 +0.7 -27.9 +0.0 20.3 18.0 +2.3 Vert
36 868.408M 26.3 +0.9
+23.6
+1.7 +1.2 -27.4 +0.0 26.3 24.0 +2.3 Vert
37 884.384M 25.5 +0.9
+24.2
+1.7 +1.2 -27.3 +0.0 26.2 24.0 +2.2 Vert
38 300.800M 12.6 +0.4
+23.6
+0.8 +0.5 -26.9 +0.0 11.0 18.0 -7.0 Vert
Ave
^ 300.841M 25.2 +0.4
+23.6
+0.8 +0.5 -26.9 +0.0 23.6 18.0 +5.6 Vert

Page 81 of 128 Report No.: 99145-4
40 319.265M 12.9 +0.4
+20.8
+0.8 +0.6 -27.0 +0.0 8.5 18.0 -9.5 Vert
Ave
^ 319.339M 26.4 +0.4
+20.8
+0.8 +0.6 -27.0 +0.0 22.0 18.0 +4.0 Vert
^ 319.339M 12.9 +0.4
+20.8
+0.8 +0.6 -27.0 +0.0 8.5 18.0 -9.5 Vert
43 954.971M 12.5 +0.9
+25.1
+1.7 +1.3 -27.1 +0.0 14.4 24.0 -9.6 Vert
Ave
^ 954.972M 25.7 +0.9
+25.1
+1.7 +1.3 -27.1 +0.0 27.6 24.0 +3.6 Vert
45 476.713M 13.5 +0.6
+20.2
+1.2 +0.7 -28.0 +0.0 8.2 18.0 -9.8 Vert
Ave
^ 476.697M 26.6 +0.6
+20.2
+1.2 +0.7 -28.0 +0.0 21.3 18.0 +3.3 Vert
47 921.955M 12.6 +0.9
+25.0
+1.7 +1.2 -27.2 +0.0 14.2 24.0 -9.8 Vert
Ave
^ 921.971M 26.1 +0.9
+25.0
+1.7 +1.2 -27.2 +0.0 27.7 24.0 +3.7 Vert
49 938.709M 12.5 +0.9
+25.0
+1.7 +1.2 -27.1 +0.0 14.2 24.0 -9.8 Vert
Ave
^ 938.770M 26.2 +0.9
+25.0
+1.7 +1.2 -27.1 +0.0 27.9 24.0 +3.9 Vert
51 479.737M 13.4 +0.6
+20.1
+1.2 +0.7 -28.0 +0.0 8.0 18.0 -10.0 Vert
Ave
^ 479.700M 26.4 +0.6
+20.1
+1.2 +0.7 -28.0 +0.0 21.0 18.0 +3.0 Vert
53 468.528M 13.5 +0.6
+19.9
+1.2 +0.7 -28.0 +0.0 7.9 18.0 -10.1 Vert
Ave
^ 468.528M 26.4 +0.6
+19.9
+1.2 +0.7 -28.0 +0.0 20.8 18.0 +2.8 Vert
55 892.511M 12.6 +0.9
+24.6
+1.7 +1.2 -27.3 +0.0 13.7 24.0 -10.3 Vert
Ave
^ 892.432M 26.2 +0.9
+24.6
+1.7 +1.2 -27.3 +0.0 27.3 24.0 +3.3 Vert
57 505.324M 13.6 +0.6
+19.5
+1.3 +0.8 -28.1 +0.0 7.7 18.0 -10.3 Vert
Ave
^ 505.285M 26.6 +0.6
+19.5
+1.3 +0.8 -28.1 +0.0 20.7 18.0 +2.7 Vert
59 501.709M 13.5 +0.6
+19.5
+1.3 +0.8 -28.1 +0.0 7.6 18.0 -10.4 Vert
Ave
^ 501.709M 27.1 +0.6
+19.5
+1.3 +0.8 -28.1 +0.0 21.2 18.0 +3.2 Vert
^ 501.802M 26.6 +0.6
+19.5
+1.3 +0.8 -28.1 +0.0 20.7 18.0 +2.7 Vert
62 487.657M 13.2 +0.6
+19.9
+1.2 +0.7 -28.1 +0.0 7.5 18.0 -10.5 Vert
Ave
^ 487.627M 26.6 +0.6
+19.9
+1.2 +0.7 -28.1 +0.0 20.9 18.0 +2.9 Vert
64 390.691M 13.5 +0.5
+18.4
+1.0 +0.6 -27.5 +0.0 6.5 18.0 -11.5 Vert
Ave
^ 390.691M 27.5 +0.5
+18.4
+1.0 +0.6 -27.5 +0.0 20.5 18.0 +2.5 Vert
Page 82 of 128 Report No.: 99145-4
Test Location: CKC Laboratories, Inc. • 1120 Fulton Place • Fremont, CA 94539 • (510) 249-1170
Customer: Texas Instruments Specification: CISPR 25 Section 6.4 - Class 5 Radiated Disturbances - Mobile - Ave Work Order #: 99145 Date: 10/26/2016
Test Type: Radiated Scan Time: 16:14:13
Tested By: N. Gamez Sequence#: 12
Software: EMITest 5.03.02
Equipment Tested:
Device Manufacturer Model # S/N
Configuration 1
Support Equipment:
Device Manufacturer Model # S/N
Configuration 1
Test Conditions / Notes:
CISPR25 (2008) Sec 6.4.4 Radiated Emissions 300-1000MHz
Mobile
Temperature: 23°C
Humidity: 55%
Atmospheric Pressure: 101.6kPa
Modification 33 was in place during testing.
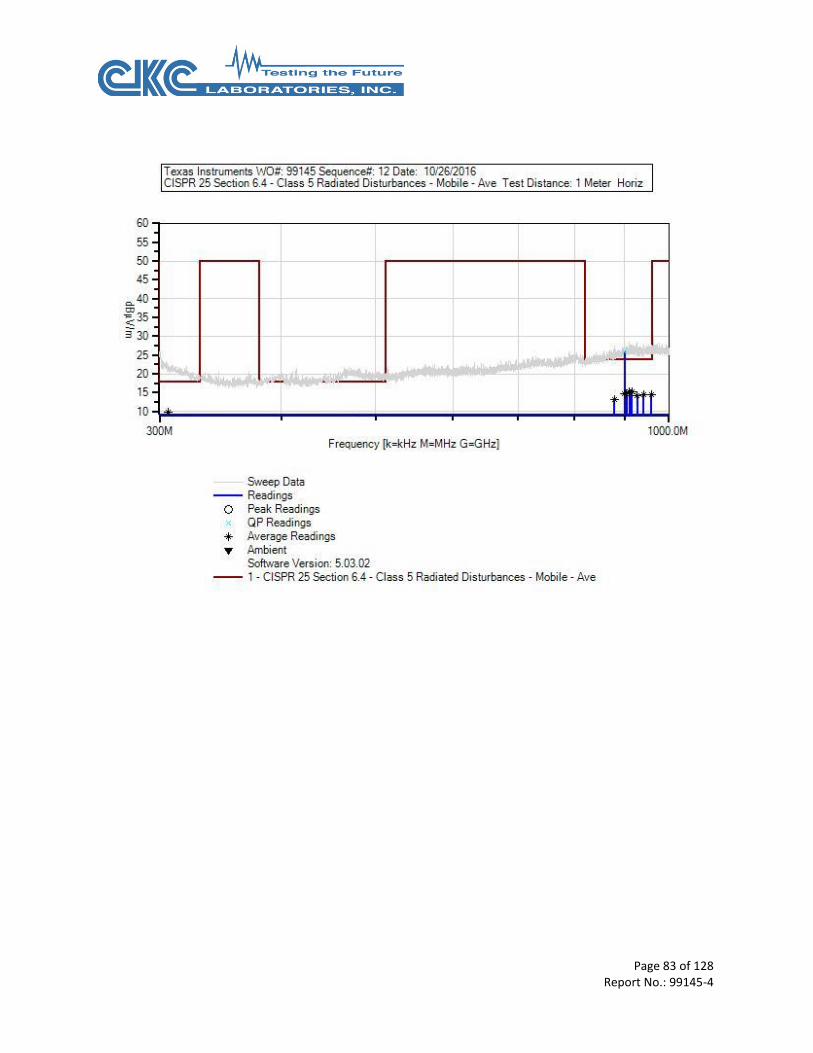
Page 83 of 128 Report No.: 99145-4

Page 84 of 128 Report No.: 99145-4
Test Equipment:
ID Asset # Description Model Calibration Date Cal Due Date
AN03434 5uH LISN 9117-5-TS-50-
N
1/26/2016 1/26/2018
AN03436 5uH LISN 9117-5-TS-50-
N
1/27/2016 1/27/2018
AN03471 Spectrum Analyzer E4440A 1/4/2016 1/4/2018
T1 ANP06684 Cable PE3062-120 6/16/2016 6/16/2018
T2 ANP06686 Cable PE3062-240 6/16/2016 6/16/2018
T3 ANP01183 Cable CNT-195 9/1/2015 9/1/2017
T4 AN00501 Preamp-TOP AMP 8447F 1/8/2015 1/8/2017
AN00046 Bicon Antenna-
ARP958 (dB/m)
SAS-200/540 3/15/2016 3/15/2018
T5 AN00978A Log Periodic
Antenna-ARP958
Calibration
SAS-200/510 5/21/2015 5/21/2017
Measurement Data: Reading listed by margin. Test Distance: 1 Meter
# Freq Rdng T1
T5
T2 T3 T4 Dist Corr Spec Margin Polar
MHz dBµV dB dB dB dB Table dBµV/m dBµV/m dB Ant
1 899.937M 24.4 +0.9
+24.9
+1.7 +1.2 -27.3 +0.0 25.8 31.0 -5.2 Horiz
QP
2 306.486M 12.4 +0.4
+22.7
+0.8 +0.5 -26.9 +0.0 9.9 18.0 -8.1 Horiz
Ave
^ 306.486M 25.1 +0.4
+22.7
+0.8 +0.5 -26.9 +0.0 22.6 18.0 +4.6 Horiz
4 916.125M 13.7 +0.9
+25.0
+1.7 +1.2 -27.2 +0.0 15.3 24.0 -8.7 Horiz
Ave
^ 916.125M 27.2 +0.9
+25.0
+1.7 +1.2 -27.2 +0.0 28.8 24.0 +4.8 Horiz
6 910.500M 13.7 +0.9
+24.9
+1.7 +1.2 -27.2 +0.0 15.2 24.0 -8.8 Horiz
Ave
^ 910.500M 27.7 +0.9
+24.9
+1.7 +1.2 -27.2 +0.0 29.2 24.0 +5.2 Horiz
8 903.916M 13.4 +0.9
+24.9
+1.7 +1.2 -27.3 +0.0 14.8 24.0 -9.2 Horiz
Ave
^ 903.916M 27.2 +0.9
+24.9
+1.7 +1.2 -27.3 +0.0 28.6 24.0 +4.6 Horiz
10 899.937M 13.4 +0.9
+24.9
+1.7 +1.2 -27.3 +0.0 14.8 24.0 -9.2 Horiz
Ave
^ 899.937M 29.9 +0.9
+24.9
+1.7 +1.2 -27.3 +0.0 31.3 24.0 +7.3 Horiz
12 474.498M 13.8 +0.6
+20.2
+1.2 +0.7 -28.0 +0.0 8.5 18.0 -9.5 Horiz
Ave
^ 474.498M 27.3 +0.6
+20.2
+1.2 +0.7 -28.0 +0.0 22.0 18.0 +4.0 Horiz
14 941.933M 12.6 +0.9
+25.1
+1.7 +1.2 -27.1 +0.0 14.4 24.0 -9.6 Horiz
Ave
^ 941.933M 26.6 +0.9
+25.1
+1.7 +1.2 -27.1 +0.0 28.4 24.0 +4.4 Horiz
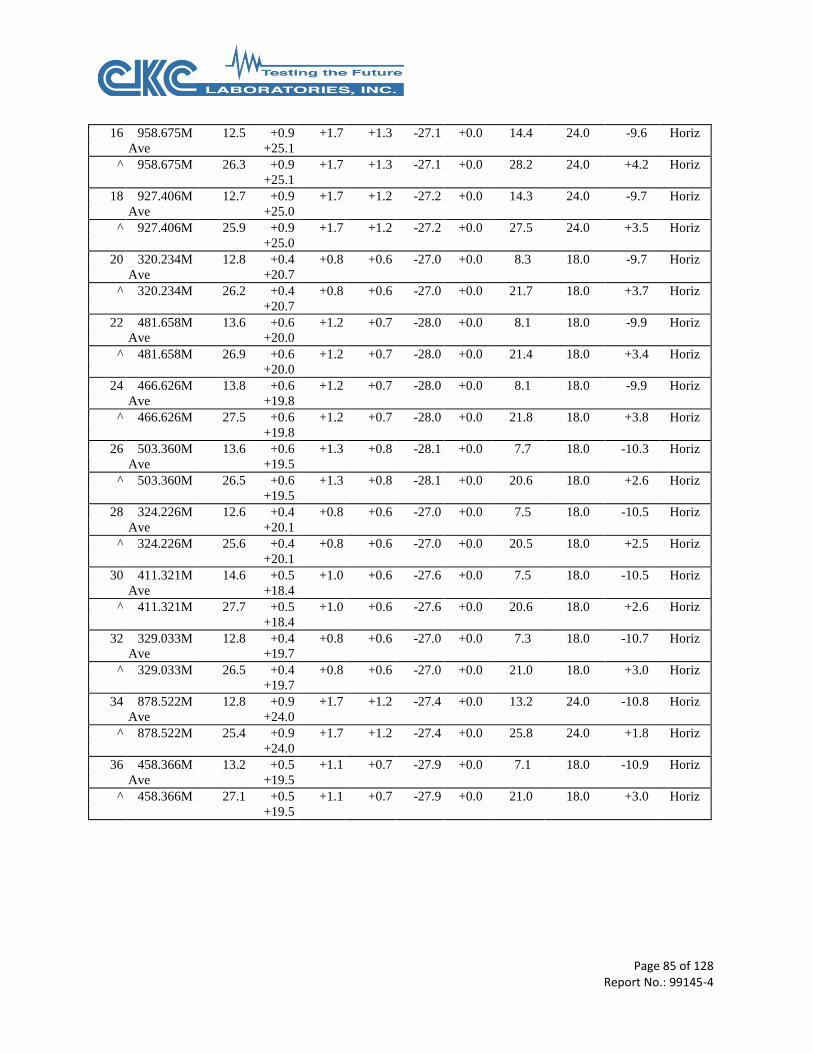
Page 85 of 128 Report No.: 99145-4
16 958.675M 12.5 +0.9
+25.1
+1.7 +1.3 -27.1 +0.0 14.4 24.0 -9.6 Horiz
Ave
^ 958.675M 26.3 +0.9
+25.1
+1.7 +1.3 -27.1 +0.0 28.2 24.0 +4.2 Horiz
18 927.406M 12.7 +0.9
+25.0
+1.7 +1.2 -27.2 +0.0 14.3 24.0 -9.7 Horiz
Ave
^ 927.406M 25.9 +0.9
+25.0
+1.7 +1.2 -27.2 +0.0 27.5 24.0 +3.5 Horiz
20 320.234M 12.8 +0.4
+20.7
+0.8 +0.6 -27.0 +0.0 8.3 18.0 -9.7 Horiz
Ave
^ 320.234M 26.2 +0.4
+20.7
+0.8 +0.6 -27.0 +0.0 21.7 18.0 +3.7 Horiz
22 481.658M 13.6 +0.6
+20.0
+1.2 +0.7 -28.0 +0.0 8.1 18.0 -9.9 Horiz
Ave
^ 481.658M 26.9 +0.6
+20.0
+1.2 +0.7 -28.0 +0.0 21.4 18.0 +3.4 Horiz
24 466.626M 13.8 +0.6
+19.8
+1.2 +0.7 -28.0 +0.0 8.1 18.0 -9.9 Horiz
Ave
^ 466.626M 27.5 +0.6
+19.8
+1.2 +0.7 -28.0 +0.0 21.8 18.0 +3.8 Horiz
26 503.360M 13.6 +0.6
+19.5
+1.3 +0.8 -28.1 +0.0 7.7 18.0 -10.3 Horiz
Ave
^ 503.360M 26.5 +0.6
+19.5
+1.3 +0.8 -28.1 +0.0 20.6 18.0 +2.6 Horiz
28 324.226M 12.6 +0.4
+20.1
+0.8 +0.6 -27.0 +0.0 7.5 18.0 -10.5 Horiz
Ave
^ 324.226M 25.6 +0.4
+20.1
+0.8 +0.6 -27.0 +0.0 20.5 18.0 +2.5 Horiz
30 411.321M 14.6 +0.5
+18.4
+1.0 +0.6 -27.6 +0.0 7.5 18.0 -10.5 Horiz
Ave
^ 411.321M 27.7 +0.5
+18.4
+1.0 +0.6 -27.6 +0.0 20.6 18.0 +2.6 Horiz
32 329.033M 12.8 +0.4
+19.7
+0.8 +0.6 -27.0 +0.0 7.3 18.0 -10.7 Horiz
Ave
^ 329.033M 26.5 +0.4
+19.7
+0.8 +0.6 -27.0 +0.0 21.0 18.0 +3.0 Horiz
34 878.522M 12.8 +0.9
+24.0
+1.7 +1.2 -27.4 +0.0 13.2 24.0 -10.8 Horiz
Ave
^ 878.522M 25.4 +0.9
+24.0
+1.7 +1.2 -27.4 +0.0 25.8 24.0 +1.8 Horiz
36 458.366M 13.2 +0.5
+19.5
+1.1 +0.7 -27.9 +0.0 7.1 18.0 -10.9 Horiz
Ave
^ 458.366M 27.1 +0.5
+19.5
+1.1 +0.7 -27.9 +0.0 21.0 18.0 +3.0 Horiz

Page 86 of 128 Report No.: 99145-4
Test Location: CKC Laboratories, Inc. • 1120 Fulton Place • Fremont, CA 94539 • (510) 249-1170
Customer: Texas Instruments Specification: CISPR 25 Section 6.4 - Class 5 Radiated Disturbances - Mobile - Ave Work Order #: 99145 Date: 10/26/2016
Test Type: Radiated Scan Time: 16:38:09
Tested By: N. Gamez Sequence#: 13
Software: EMITest 5.03.02
Equipment Tested:
Device Manufacturer Model # S/N
Configuration 1
Support Equipment:
Device Manufacturer Model # S/N
Configuration 1
Test Conditions / Notes:
CISPR25 (2008) Sec 6.4.4 Radiated Emissions 300-1000MHz
Mobile
Temperature: 23°C
Humidity: 55%
Atmospheric Pressure: 101.6kPa
Ambient Scan
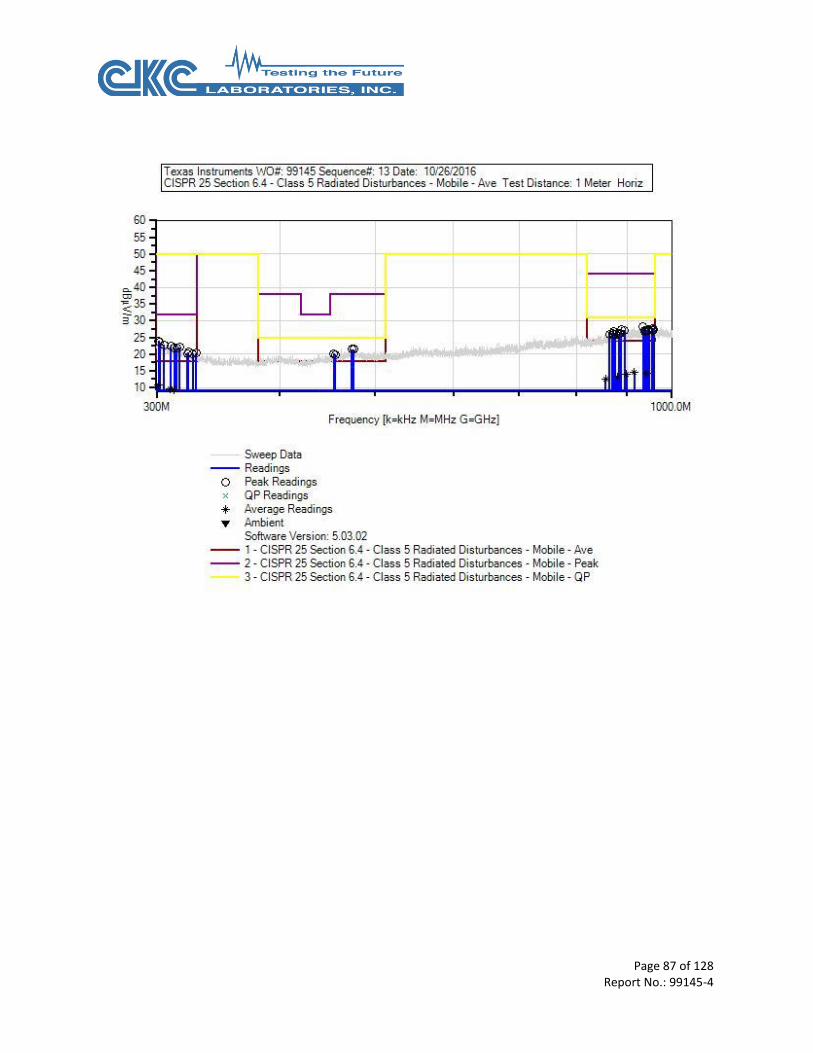
Page 87 of 128 Report No.: 99145-4
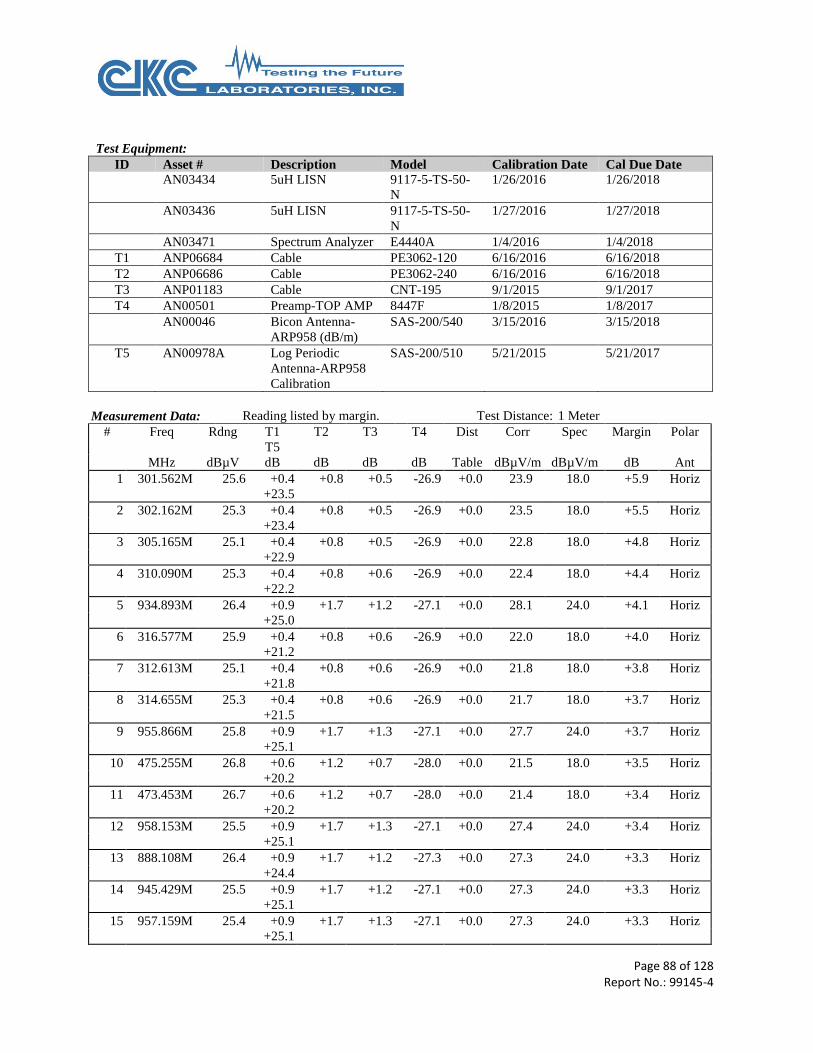
Page 88 of 128 Report No.: 99145-4
Test Equipment:
ID Asset # Description Model Calibration Date Cal Due Date
AN03434 5uH LISN 9117-5-TS-50-
N
1/26/2016 1/26/2018
AN03436 5uH LISN 9117-5-TS-50-
N
1/27/2016 1/27/2018
AN03471 Spectrum Analyzer E4440A 1/4/2016 1/4/2018
T1 ANP06684 Cable PE3062-120 6/16/2016 6/16/2018
T2 ANP06686 Cable PE3062-240 6/16/2016 6/16/2018
T3 ANP01183 Cable CNT-195 9/1/2015 9/1/2017
T4 AN00501 Preamp-TOP AMP 8447F 1/8/2015 1/8/2017
AN00046 Bicon Antenna-
ARP958 (dB/m)
SAS-200/540 3/15/2016 3/15/2018
T5 AN00978A Log Periodic
Antenna-ARP958
Calibration
SAS-200/510 5/21/2015 5/21/2017
Measurement Data: Reading listed by margin. Test Distance: 1 Meter
# Freq Rdng T1
T5
T2 T3 T4 Dist Corr Spec Margin Polar
MHz dBµV dB dB dB dB Table dBµV/m dBµV/m dB Ant
1 301.562M 25.6 +0.4
+23.5
+0.8 +0.5 -26.9 +0.0 23.9 18.0 +5.9 Horiz
2 302.162M 25.3 +0.4
+23.4
+0.8 +0.5 -26.9 +0.0 23.5 18.0 +5.5 Horiz
3 305.165M 25.1 +0.4
+22.9
+0.8 +0.5 -26.9 +0.0 22.8 18.0 +4.8 Horiz
4 310.090M 25.3 +0.4
+22.2
+0.8 +0.6 -26.9 +0.0 22.4 18.0 +4.4 Horiz
5 934.893M 26.4 +0.9
+25.0
+1.7 +1.2 -27.1 +0.0 28.1 24.0 +4.1 Horiz
6 316.577M 25.9 +0.4
+21.2
+0.8 +0.6 -26.9 +0.0 22.0 18.0 +4.0 Horiz
7 312.613M 25.1 +0.4
+21.8
+0.8 +0.6 -26.9 +0.0 21.8 18.0 +3.8 Horiz
8 314.655M 25.3 +0.4
+21.5
+0.8 +0.6 -26.9 +0.0 21.7 18.0 +3.7 Horiz
9 955.866M 25.8 +0.9
+25.1
+1.7 +1.3 -27.1 +0.0 27.7 24.0 +3.7 Horiz
10 475.255M 26.8 +0.6
+20.2
+1.2 +0.7 -28.0 +0.0 21.5 18.0 +3.5 Horiz
11 473.453M 26.7 +0.6
+20.2
+1.2 +0.7 -28.0 +0.0 21.4 18.0 +3.4 Horiz
12 958.153M 25.5 +0.9
+25.1
+1.7 +1.3 -27.1 +0.0 27.4 24.0 +3.4 Horiz
13 888.108M 26.4 +0.9
+24.4
+1.7 +1.2 -27.3 +0.0 27.3 24.0 +3.3 Horiz
14 945.429M 25.5 +0.9
+25.1
+1.7 +1.2 -27.1 +0.0 27.3 24.0 +3.3 Horiz
15 957.159M 25.4 +0.9
+25.1
+1.7 +1.3 -27.1 +0.0 27.3 24.0 +3.3 Horiz
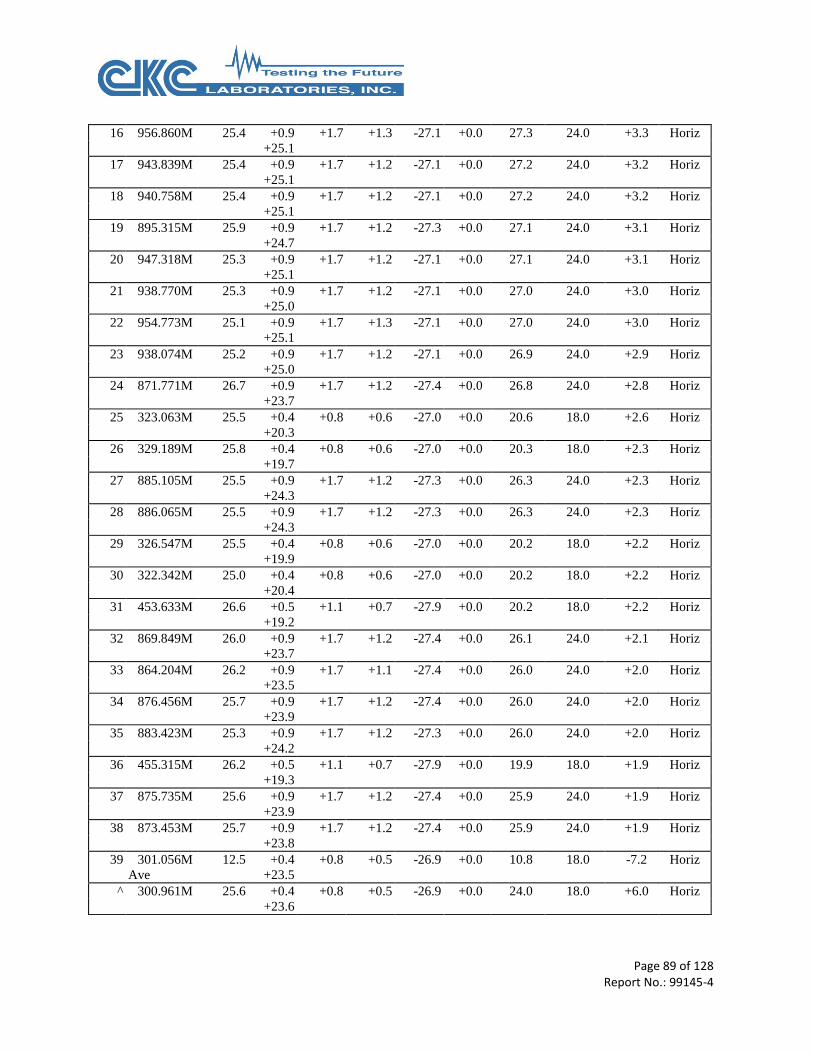
Page 89 of 128 Report No.: 99145-4
16 956.860M 25.4 +0.9
+25.1
+1.7 +1.3 -27.1 +0.0 27.3 24.0 +3.3 Horiz
17 943.839M 25.4 +0.9
+25.1
+1.7 +1.2 -27.1 +0.0 27.2 24.0 +3.2 Horiz
18 940.758M 25.4 +0.9
+25.1
+1.7 +1.2 -27.1 +0.0 27.2 24.0 +3.2 Horiz
19 895.315M 25.9 +0.9
+24.7
+1.7 +1.2 -27.3 +0.0 27.1 24.0 +3.1 Horiz
20 947.318M 25.3 +0.9
+25.1
+1.7 +1.2 -27.1 +0.0 27.1 24.0 +3.1 Horiz
21 938.770M 25.3 +0.9
+25.0
+1.7 +1.2 -27.1 +0.0 27.0 24.0 +3.0 Horiz
22 954.773M 25.1 +0.9
+25.1
+1.7 +1.3 -27.1 +0.0 27.0 24.0 +3.0 Horiz
23 938.074M 25.2 +0.9
+25.0
+1.7 +1.2 -27.1 +0.0 26.9 24.0 +2.9 Horiz
24 871.771M 26.7 +0.9
+23.7
+1.7 +1.2 -27.4 +0.0 26.8 24.0 +2.8 Horiz
25 323.063M 25.5 +0.4
+20.3
+0.8 +0.6 -27.0 +0.0 20.6 18.0 +2.6 Horiz
26 329.189M 25.8 +0.4
+19.7
+0.8 +0.6 -27.0 +0.0 20.3 18.0 +2.3 Horiz
27 885.105M 25.5 +0.9
+24.3
+1.7 +1.2 -27.3 +0.0 26.3 24.0 +2.3 Horiz
28 886.065M 25.5 +0.9
+24.3
+1.7 +1.2 -27.3 +0.0 26.3 24.0 +2.3 Horiz
29 326.547M 25.5 +0.4
+19.9
+0.8 +0.6 -27.0 +0.0 20.2 18.0 +2.2 Horiz
30 322.342M 25.0 +0.4
+20.4
+0.8 +0.6 -27.0 +0.0 20.2 18.0 +2.2 Horiz
31 453.633M 26.6 +0.5
+19.2
+1.1 +0.7 -27.9 +0.0 20.2 18.0 +2.2 Horiz
32 869.849M 26.0 +0.9
+23.7
+1.7 +1.2 -27.4 +0.0 26.1 24.0 +2.1 Horiz
33 864.204M 26.2 +0.9
+23.5
+1.7 +1.1 -27.4 +0.0 26.0 24.0 +2.0 Horiz
34 876.456M 25.7 +0.9
+23.9
+1.7 +1.2 -27.4 +0.0 26.0 24.0 +2.0 Horiz
35 883.423M 25.3 +0.9
+24.2
+1.7 +1.2 -27.3 +0.0 26.0 24.0 +2.0 Horiz
36 455.315M 26.2 +0.5
+19.3
+1.1 +0.7 -27.9 +0.0 19.9 18.0 +1.9 Horiz
37 875.735M 25.6 +0.9
+23.9
+1.7 +1.2 -27.4 +0.0 25.9 24.0 +1.9 Horiz
38 873.453M 25.7 +0.9
+23.8
+1.7 +1.2 -27.4 +0.0 25.9 24.0 +1.9 Horiz
39 301.056M 12.5 +0.4
+23.5
+0.8 +0.5 -26.9 +0.0 10.8 18.0 -7.2 Horiz
Ave
^ 300.961M 25.6 +0.4
+23.6
+0.8 +0.5 -26.9 +0.0 24.0 18.0 +6.0 Horiz
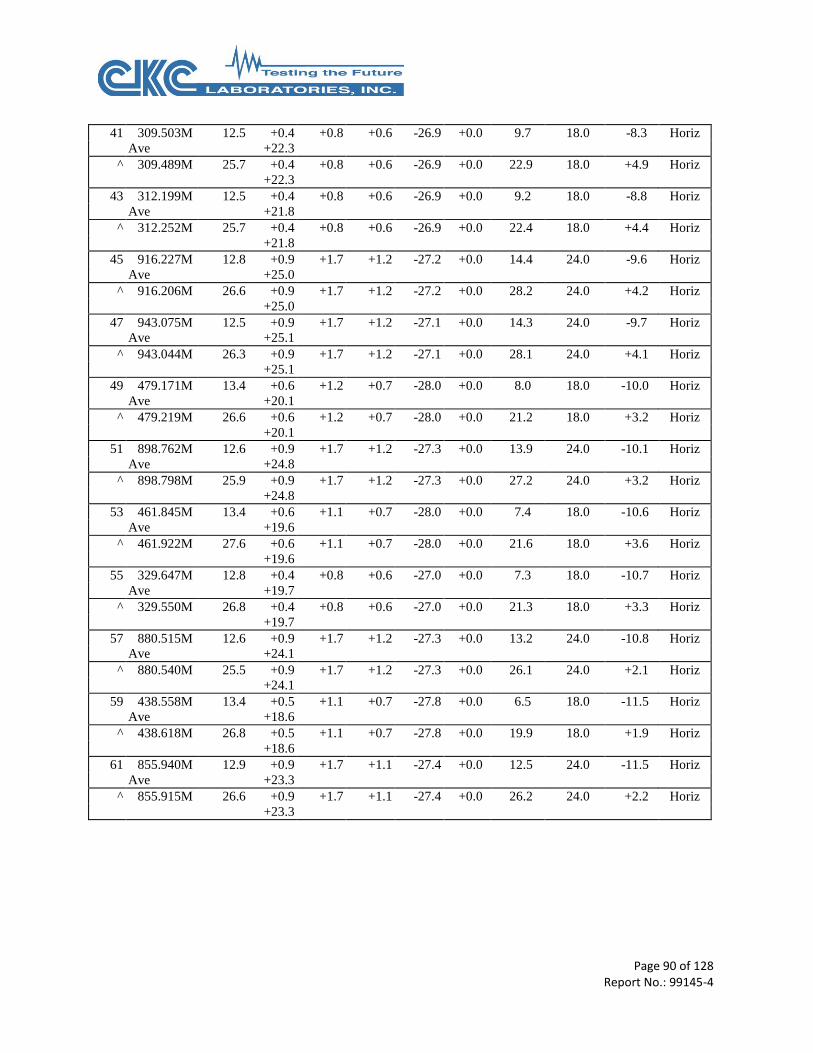
Page 90 of 128 Report No.: 99145-4
41 309.503M 12.5 +0.4
+22.3
+0.8 +0.6 -26.9 +0.0 9.7 18.0 -8.3 Horiz
Ave
^ 309.489M 25.7 +0.4
+22.3
+0.8 +0.6 -26.9 +0.0 22.9 18.0 +4.9 Horiz
43 312.199M 12.5 +0.4
+21.8
+0.8 +0.6 -26.9 +0.0 9.2 18.0 -8.8 Horiz
Ave
^ 312.252M 25.7 +0.4
+21.8
+0.8 +0.6 -26.9 +0.0 22.4 18.0 +4.4 Horiz
45 916.227M 12.8 +0.9
+25.0
+1.7 +1.2 -27.2 +0.0 14.4 24.0 -9.6 Horiz
Ave
^ 916.206M 26.6 +0.9
+25.0
+1.7 +1.2 -27.2 +0.0 28.2 24.0 +4.2 Horiz
47 943.075M 12.5 +0.9
+25.1
+1.7 +1.2 -27.1 +0.0 14.3 24.0 -9.7 Horiz
Ave
^ 943.044M 26.3 +0.9
+25.1
+1.7 +1.2 -27.1 +0.0 28.1 24.0 +4.1 Horiz
49 479.171M 13.4 +0.6
+20.1
+1.2 +0.7 -28.0 +0.0 8.0 18.0 -10.0 Horiz
Ave
^ 479.219M 26.6 +0.6
+20.1
+1.2 +0.7 -28.0 +0.0 21.2 18.0 +3.2 Horiz
51 898.762M 12.6 +0.9
+24.8
+1.7 +1.2 -27.3 +0.0 13.9 24.0 -10.1 Horiz
Ave
^ 898.798M 25.9 +0.9
+24.8
+1.7 +1.2 -27.3 +0.0 27.2 24.0 +3.2 Horiz
53 461.845M 13.4 +0.6
+19.6
+1.1 +0.7 -28.0 +0.0 7.4 18.0 -10.6 Horiz
Ave
^ 461.922M 27.6 +0.6
+19.6
+1.1 +0.7 -28.0 +0.0 21.6 18.0 +3.6 Horiz
55 329.647M 12.8 +0.4
+19.7
+0.8 +0.6 -27.0 +0.0 7.3 18.0 -10.7 Horiz
Ave
^ 329.550M 26.8 +0.4
+19.7
+0.8 +0.6 -27.0 +0.0 21.3 18.0 +3.3 Horiz
57 880.515M 12.6 +0.9
+24.1
+1.7 +1.2 -27.3 +0.0 13.2 24.0 -10.8 Horiz
Ave
^ 880.540M 25.5 +0.9
+24.1
+1.7 +1.2 -27.3 +0.0 26.1 24.0 +2.1 Horiz
59 438.558M 13.4 +0.5
+18.6
+1.1 +0.7 -27.8 +0.0 6.5 18.0 -11.5 Horiz
Ave
^ 438.618M 26.8 +0.5
+18.6
+1.1 +0.7 -27.8 +0.0 19.9 18.0 +1.9 Horiz
61 855.940M 12.9 +0.9
+23.3
+1.7 +1.1 -27.4 +0.0 12.5 24.0 -11.5 Horiz
Ave
^ 855.915M 26.6 +0.9
+23.3
+1.7 +1.1 -27.4 +0.0 26.2 24.0 +2.2 Horiz

Page 91 of 128 Report No.: 99145-4
Test Location: CKC Laboratories, Inc. • 1120 Fulton Place • Fremont, CA 94539 • (510) 249-1170
Customer: Texas Instruments Specification: CISPR 25 Section 6.4 - Class 5 Radiated Disturbances - Mobile - Ave Work Order #: 99145 Date: 11/11/2016
Test Type: Radiated Scan Time: 10:02:29
Tested By: N. Gamez Sequence#: 19
Software: EMITest 5.03.02
Equipment Tested:
Device Manufacturer Model # S/N
Configuration 1
Support Equipment:
Device Manufacturer Model # S/N
Configuration 1
Test Conditions / Notes:
CISPR25 (2008) Sec 6.4.4 Radiated Emissions 1-2.5GHz
Mobile
Temperature: 23°C
Humidity: 50%
Atmospheric Pressure: 101.5kPa
Position 1: Serializer
Modification 33 was in place during testing.
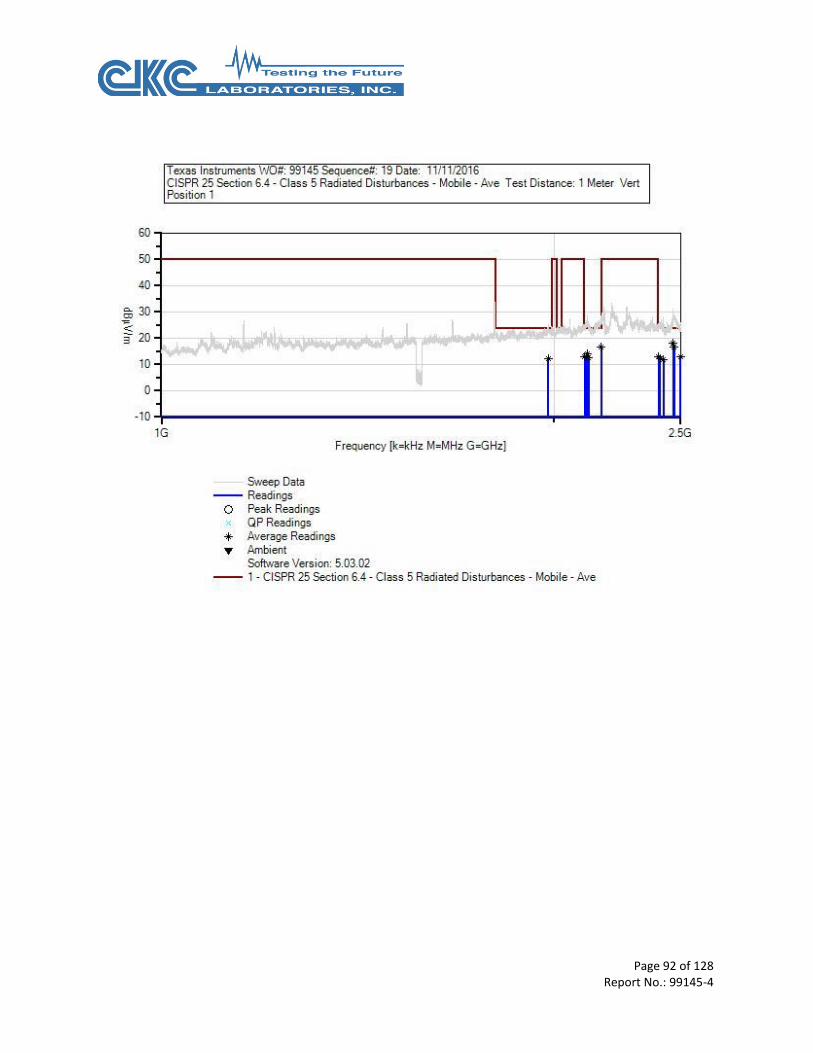
Page 92 of 128 Report No.: 99145-4

Page 93 of 128 Report No.: 99145-4
Test Equipment:
ID Asset # Description Model Calibration Date Cal Due Date
AN03434 5uH LISN 9117-5-TS-50-
N
1/26/2016 1/26/2018
AN03436 5uH LISN 9117-5-TS-50-
N
1/27/2016 1/27/2018
AN03471 Spectrum Analyzer E4440A 1/4/2016 1/4/2018
T1 AN03114 Preamp AMF-7D-
00101800-30-
10P
4/22/2015 4/22/2017
T2 ANP06126 Cable 32022-29094K-
29094K-168TC
3/18/2015 3/18/2017
T3 ANP06138 Cable 32022-29094K-
29094K-72TC
3/18/2015 3/18/2017
T4 AN02157 Horn Antenna-
ARP958
Calibration
3115 12/2/2014 12/2/2016
T5 ANP06711 Cable 32022-29094K-
29094K-132TC
11/21/2014 11/21/2016
Measurement Data: Reading listed by margin. Test Distance: 1 Meter
# Freq Rdng T1
T5
T2 T3 T4 Dist Corr Spec Margin Polar
MHz dBµV dB dB dB dB Table dBµV/m dBµV/m dB Ant
1 2467.022M 41.9 -58.3
+1.9
+2.4 +1.2 +29.1 +0.0 18.2 24.0 -5.8 Vert
Ave
^ 2467.022M 54.7 -58.3
+1.9
+2.4 +1.2 +29.1 +0.0 31.0 24.0 +7.0 Vert
3 2471.059M 40.4 -58.3
+1.9
+2.4 +1.2 +29.1 +0.0 16.7 24.0 -7.3 Vert
Ave
^ 2471.059M 52.7 -58.3
+1.9
+2.4 +1.2 +29.1 +0.0 29.0 24.0 +5.0 Vert
5 2171.995M 41.4 -58.1
+1.8
+2.3 +1.1 +28.1 +0.0 16.6 24.0 -7.4 Vert
Ave
^ 2171.995M 54.3 -58.1
+1.8
+2.3 +1.1 +28.1 +0.0 29.5 24.0 +5.5 Vert
7 2120.057M 38.8 -58.1
+1.8
+2.3 +1.1 +28.2 +0.0 14.1 24.0 -9.9 Vert
Ave
^ 2120.057M 54.5 -58.1
+1.8
+2.3 +1.1 +28.2 +0.0 29.8 24.0 +5.8 Vert
9 2404.800M 37.0 -58.2
+1.9
+2.4 +1.2 +28.8 +0.0 13.1 24.0 -10.9 Vert
Ave
^ 2404.800M 50.0 -58.2
+1.9
+2.4 +1.2 +28.8 +0.0 26.1 24.0 +2.1 Vert
11 2109.995M 37.7 -58.2
+1.8
+2.2 +1.1 +28.2 +0.0 12.8 24.0 -11.2 Vert
Ave
^ 2109.995M 50.2 -58.2
+1.8
+2.2 +1.1 +28.2 +0.0 25.3 24.0 +1.3 Vert
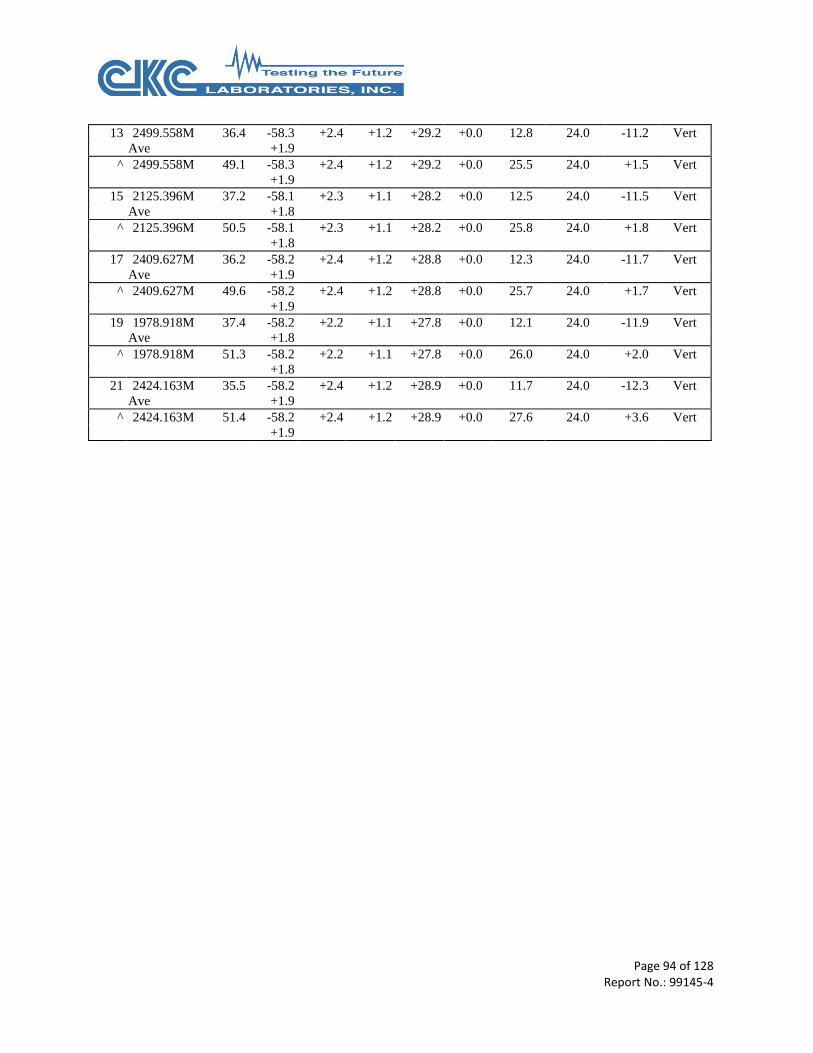
Page 94 of 128 Report No.: 99145-4
13 2499.558M 36.4 -58.3
+1.9
+2.4 +1.2 +29.2 +0.0 12.8 24.0 -11.2 Vert
Ave
^ 2499.558M 49.1 -58.3
+1.9
+2.4 +1.2 +29.2 +0.0 25.5 24.0 +1.5 Vert
15 2125.396M 37.2 -58.1
+1.8
+2.3 +1.1 +28.2 +0.0 12.5 24.0 -11.5 Vert
Ave
^ 2125.396M 50.5 -58.1
+1.8
+2.3 +1.1 +28.2 +0.0 25.8 24.0 +1.8 Vert
17 2409.627M 36.2 -58.2
+1.9
+2.4 +1.2 +28.8 +0.0 12.3 24.0 -11.7 Vert
Ave
^ 2409.627M 49.6 -58.2
+1.9
+2.4 +1.2 +28.8 +0.0 25.7 24.0 +1.7 Vert
19 1978.918M 37.4 -58.2
+1.8
+2.2 +1.1 +27.8 +0.0 12.1 24.0 -11.9 Vert
Ave
^ 1978.918M 51.3 -58.2
+1.8
+2.2 +1.1 +27.8 +0.0 26.0 24.0 +2.0 Vert
21 2424.163M 35.5 -58.2
+1.9
+2.4 +1.2 +28.9 +0.0 11.7 24.0 -12.3 Vert
Ave
^ 2424.163M 51.4 -58.2
+1.9
+2.4 +1.2 +28.9 +0.0 27.6 24.0 +3.6 Vert

Page 95 of 128 Report No.: 99145-4
Test Location: CKC Laboratories, Inc. • 1120 Fulton Place • Fremont, CA 94539 • (510) 249-1170
Customer: Texas Instruments Specification: CISPR 25 Section 6.4 - Class 5 Radiated Disturbances - Mobile - Ave Work Order #: 99145 Date: 11/11/2016
Test Type: Radiated Scan Time: 11:31:16
Tested By: N. Gamez Sequence#: 22
Software: EMITest 5.03.02
Equipment Tested:
Device Manufacturer Model # S/N
Configuration 1
Support Equipment:
Device Manufacturer Model # S/N
Configuration 1
Test Conditions / Notes:
CISPR25 (2008) Sec 6.4.4 Radiated Emissions 1-2.5GHz
Mobile
Temperature: 23°C
Humidity: 50%
Atmospheric Pressure: 101.5kPa
Position 1
Modification 33 was in place during testing.
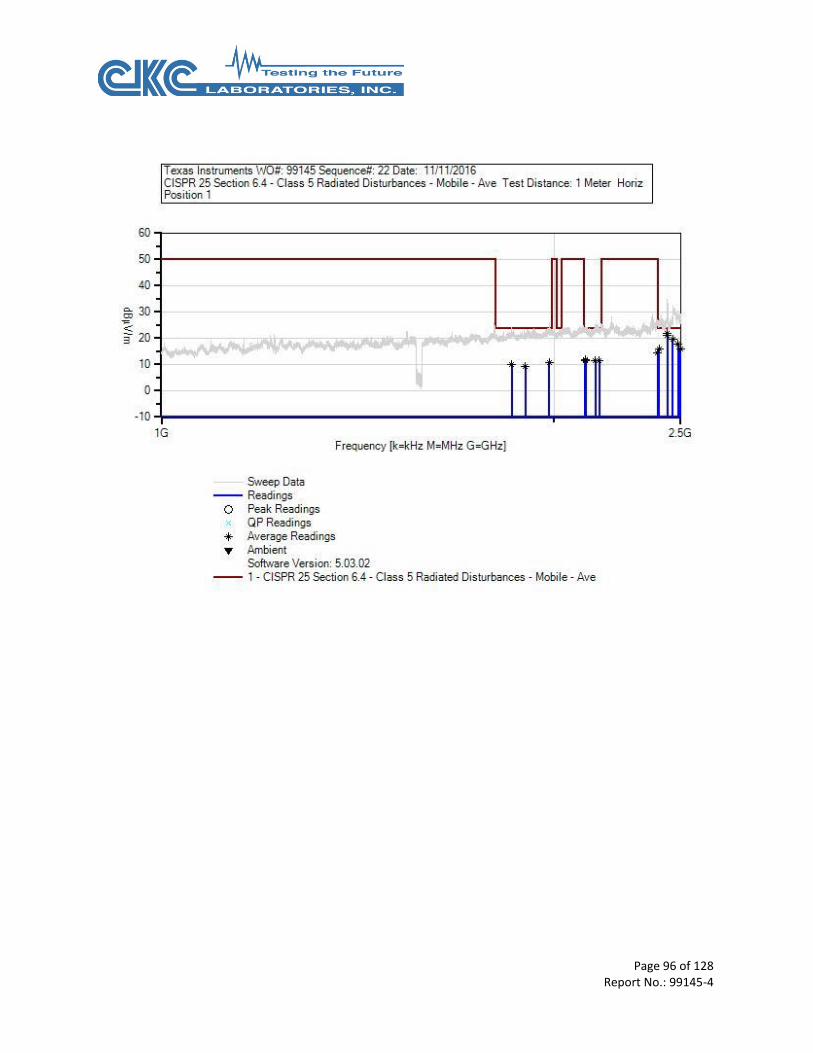
Page 96 of 128 Report No.: 99145-4

Page 97 of 128 Report No.: 99145-4
Test Equipment:
ID Asset # Description Model Calibration Date Cal Due Date
AN03434 5uH LISN 9117-5-TS-50-
N
1/26/2016 1/26/2018
AN03436 5uH LISN 9117-5-TS-50-
N
1/27/2016 1/27/2018
AN03471 Spectrum Analyzer E4440A 1/4/2016 1/4/2018
T1 AN03114 Preamp AMF-7D-
00101800-30-
10P
4/22/2015 4/22/2017
T2 ANP06126 Cable 32022-29094K-
29094K-168TC
3/18/2015 3/18/2017
T3 ANP06138 Cable 32022-29094K-
29094K-72TC
3/18/2015 3/18/2017
T4 AN02157 Horn Antenna-
ARP958
Calibration
3115 12/2/2014 12/2/2016
T5 ANP06711 Cable 32022-29094K-
29094K-132TC
11/21/2014 11/21/2016
Measurement Data: Reading listed by margin. Test Distance: 1 Meter
# Freq Rdng T1
T5
T2 T3 T4 Dist Corr Spec Margin Polar
MHz dBµV dB dB dB dB Table dBµV/m dBµV/m dB Ant
1 2441.562M 45.6 -58.3
+1.9
+2.4 +1.2 +29.0 +0.0 21.8 24.0 -2.2 Horiz
Ave
^ 2441.562M 58.8 -58.3
+1.9
+2.4 +1.2 +29.0 +0.0 35.0 24.0 +11.0 Horiz
3 2441.762M 45.0 -58.3
+1.9
+2.4 +1.2 +29.0 +0.0 21.2 24.0 -2.8 Horiz
Ave
^ 2441.762M 58.6 -58.3
+1.9
+2.4 +1.2 +29.0 +0.0 34.8 24.0 +10.8 Horiz
5 2465.880M 43.5 -58.3
+1.9
+2.4 +1.2 +29.1 +0.0 19.8 24.0 -4.2 Horiz
Ave
^ 2465.880M 56.6 -58.3
+1.9
+2.4 +1.2 +29.1 +0.0 32.9 24.0 +8.9 Horiz
7 2487.306M 41.3 -58.3
+1.9
+2.4 +1.2 +29.2 +0.0 17.7 24.0 -6.3 Horiz
Ave
^ 2487.306M 54.8 -58.3
+1.9
+2.4 +1.2 +29.2 +0.0 31.2 24.0 +7.2 Horiz
9 2499.254M 39.5 -58.3
+1.9
+2.4 +1.2 +29.2 +0.0 15.9 24.0 -8.1 Horiz
Ave
^ 2499.254M 53.8 -58.3
+1.9
+2.4 +1.2 +29.2 +0.0 30.2 24.0 +6.2 Horiz
11 2406.184M 39.7 -58.2
+1.9
+2.4 +1.2 +28.8 +0.0 15.8 24.0 -8.2 Horiz
Ave
^ 2406.184M 52.2 -58.2
+1.9
+2.4 +1.2 +28.8 +0.0 28.3 24.0 +4.3 Horiz
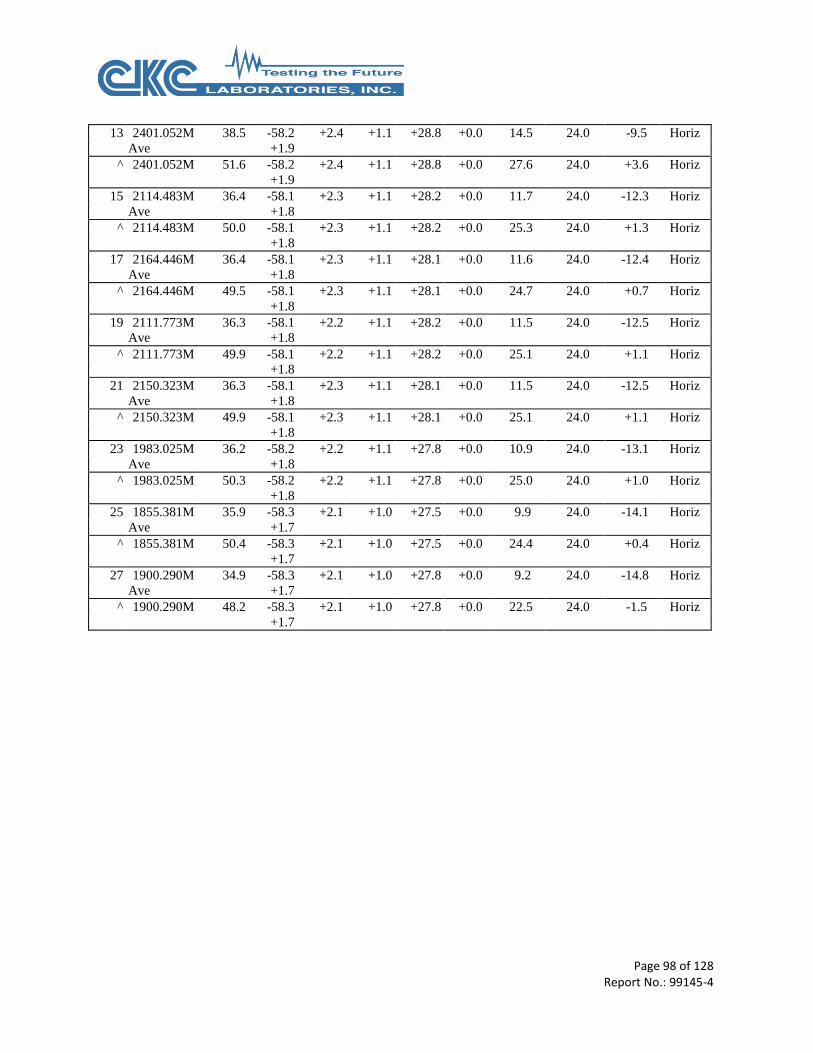
Page 98 of 128 Report No.: 99145-4
13 2401.052M 38.5 -58.2
+1.9
+2.4 +1.1 +28.8 +0.0 14.5 24.0 -9.5 Horiz
Ave
^ 2401.052M 51.6 -58.2
+1.9
+2.4 +1.1 +28.8 +0.0 27.6 24.0 +3.6 Horiz
15 2114.483M 36.4 -58.1
+1.8
+2.3 +1.1 +28.2 +0.0 11.7 24.0 -12.3 Horiz
Ave
^ 2114.483M 50.0 -58.1
+1.8
+2.3 +1.1 +28.2 +0.0 25.3 24.0 +1.3 Horiz
17 2164.446M 36.4 -58.1
+1.8
+2.3 +1.1 +28.1 +0.0 11.6 24.0 -12.4 Horiz
Ave
^ 2164.446M 49.5 -58.1
+1.8
+2.3 +1.1 +28.1 +0.0 24.7 24.0 +0.7 Horiz
19 2111.773M 36.3 -58.1
+1.8
+2.2 +1.1 +28.2 +0.0 11.5 24.0 -12.5 Horiz
Ave
^ 2111.773M 49.9 -58.1
+1.8
+2.2 +1.1 +28.2 +0.0 25.1 24.0 +1.1 Horiz
21 2150.323M 36.3 -58.1
+1.8
+2.3 +1.1 +28.1 +0.0 11.5 24.0 -12.5 Horiz
Ave
^ 2150.323M 49.9 -58.1
+1.8
+2.3 +1.1 +28.1 +0.0 25.1 24.0 +1.1 Horiz
23 1983.025M 36.2 -58.2
+1.8
+2.2 +1.1 +27.8 +0.0 10.9 24.0 -13.1 Horiz
Ave
^ 1983.025M 50.3 -58.2
+1.8
+2.2 +1.1 +27.8 +0.0 25.0 24.0 +1.0 Horiz
25 1855.381M 35.9 -58.3
+1.7
+2.1 +1.0 +27.5 +0.0 9.9 24.0 -14.1 Horiz
Ave
^ 1855.381M 50.4 -58.3
+1.7
+2.1 +1.0 +27.5 +0.0 24.4 24.0 +0.4 Horiz
27 1900.290M 34.9 -58.3
+1.7
+2.1 +1.0 +27.8 +0.0 9.2 24.0 -14.8 Horiz
Ave
^ 1900.290M 48.2 -58.3
+1.7
+2.1 +1.0 +27.8 +0.0 22.5 24.0 -1.5 Horiz

Page 99 of 128 Report No.: 99145-4
Test Location: CKC Laboratories, Inc. • 1120 Fulton Place • Fremont, CA 94539 • (510) 249-1170
Customer: Texas Instruments Specification: CISPR 25 Section 6.4 - Class 5 Radiated Disturbances - Mobile - Ave Work Order #: 99145 Date: 11/11/2016
Test Type: Radiated Scan Time: 13:58:46
Tested By: N. Gamez Sequence#: 25
Software: EMITest 5.03.02
Equipment Tested:
Device Manufacturer Model # S/N
Configuration 1
Support Equipment:
Device Manufacturer Model # S/N
Configuration 1
Test Conditions / Notes:
CISPR25 (2008) Sec 6.4.4 Radiated Emissions 1-2.5GHz
Mobile
Temperature: 23°C
Humidity: 50%
Atmospheric Pressure: 101.5kPa
Position 2
Modification 33 was in place during testing.
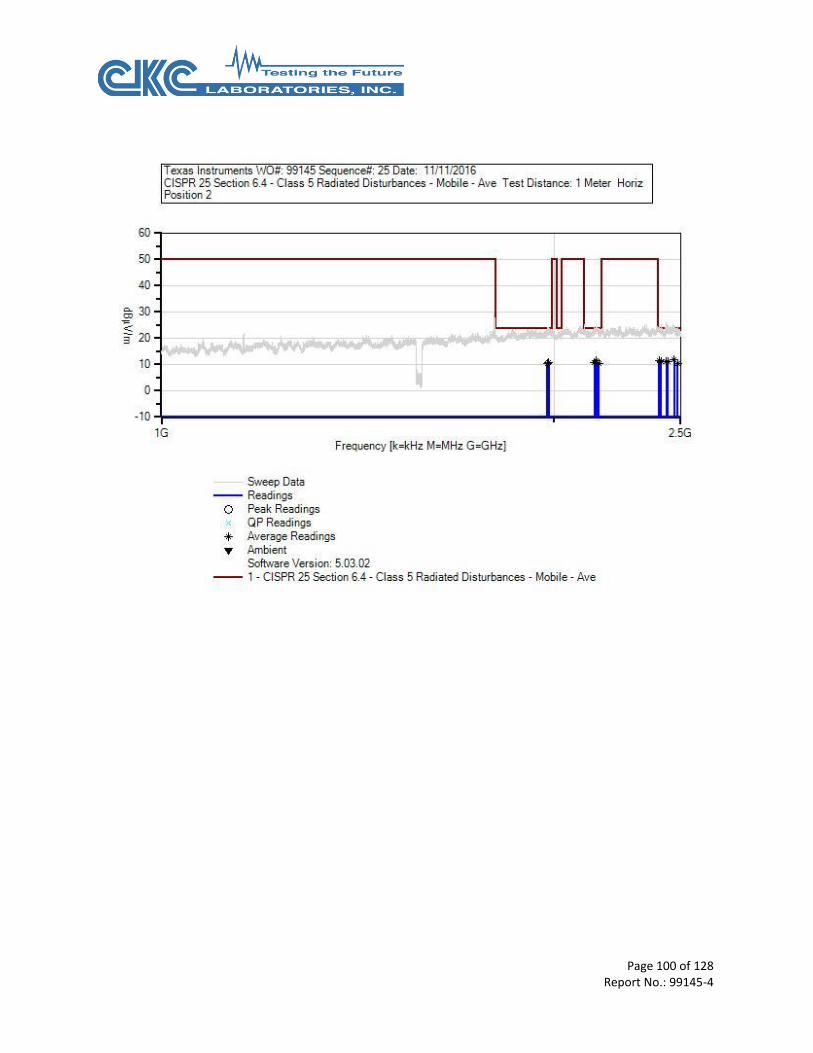
Page 100 of 128 Report No.: 99145-4
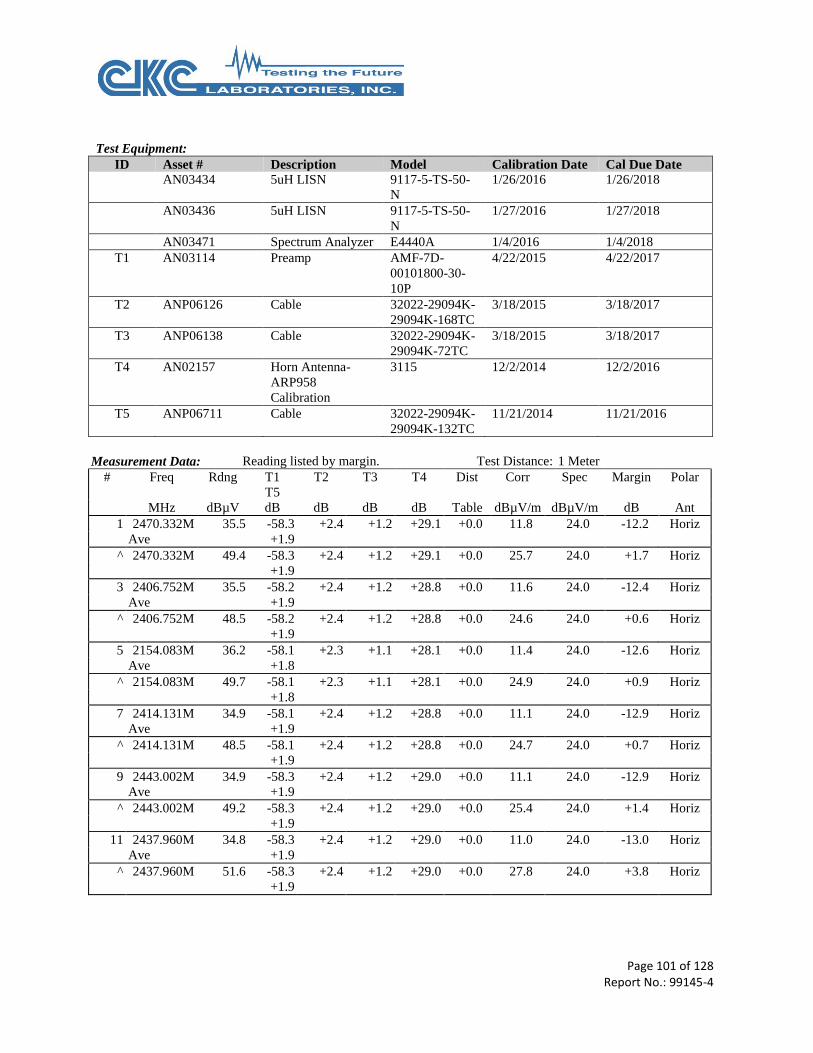
Page 101 of 128 Report No.: 99145-4
Test Equipment:
ID Asset # Description Model Calibration Date Cal Due Date
AN03434 5uH LISN 9117-5-TS-50-
N
1/26/2016 1/26/2018
AN03436 5uH LISN 9117-5-TS-50-
N
1/27/2016 1/27/2018
AN03471 Spectrum Analyzer E4440A 1/4/2016 1/4/2018
T1 AN03114 Preamp AMF-7D-
00101800-30-
10P
4/22/2015 4/22/2017
T2 ANP06126 Cable 32022-29094K-
29094K-168TC
3/18/2015 3/18/2017
T3 ANP06138 Cable 32022-29094K-
29094K-72TC
3/18/2015 3/18/2017
T4 AN02157 Horn Antenna-
ARP958
Calibration
3115 12/2/2014 12/2/2016
T5 ANP06711 Cable 32022-29094K-
29094K-132TC
11/21/2014 11/21/2016
Measurement Data: Reading listed by margin. Test Distance: 1 Meter
# Freq Rdng T1
T5
T2 T3 T4 Dist Corr Spec Margin Polar
MHz dBµV dB dB dB dB Table dBµV/m dBµV/m dB Ant
1 2470.332M 35.5 -58.3
+1.9
+2.4 +1.2 +29.1 +0.0 11.8 24.0 -12.2 Horiz
Ave
^ 2470.332M 49.4 -58.3
+1.9
+2.4 +1.2 +29.1 +0.0 25.7 24.0 +1.7 Horiz
3 2406.752M 35.5 -58.2
+1.9
+2.4 +1.2 +28.8 +0.0 11.6 24.0 -12.4 Horiz
Ave
^ 2406.752M 48.5 -58.2
+1.9
+2.4 +1.2 +28.8 +0.0 24.6 24.0 +0.6 Horiz
5 2154.083M 36.2 -58.1
+1.8
+2.3 +1.1 +28.1 +0.0 11.4 24.0 -12.6 Horiz
Ave
^ 2154.083M 49.7 -58.1
+1.8
+2.3 +1.1 +28.1 +0.0 24.9 24.0 +0.9 Horiz
7 2414.131M 34.9 -58.1
+1.9
+2.4 +1.2 +28.8 +0.0 11.1 24.0 -12.9 Horiz
Ave
^ 2414.131M 48.5 -58.1
+1.9
+2.4 +1.2 +28.8 +0.0 24.7 24.0 +0.7 Horiz
9 2443.002M 34.9 -58.3
+1.9
+2.4 +1.2 +29.0 +0.0 11.1 24.0 -12.9 Horiz
Ave
^ 2443.002M 49.2 -58.3
+1.9
+2.4 +1.2 +29.0 +0.0 25.4 24.0 +1.4 Horiz
11 2437.960M 34.8 -58.3
+1.9
+2.4 +1.2 +29.0 +0.0 11.0 24.0 -13.0 Horiz
Ave
^ 2437.960M 51.6 -58.3
+1.9
+2.4 +1.2 +29.0 +0.0 27.8 24.0 +3.8 Horiz
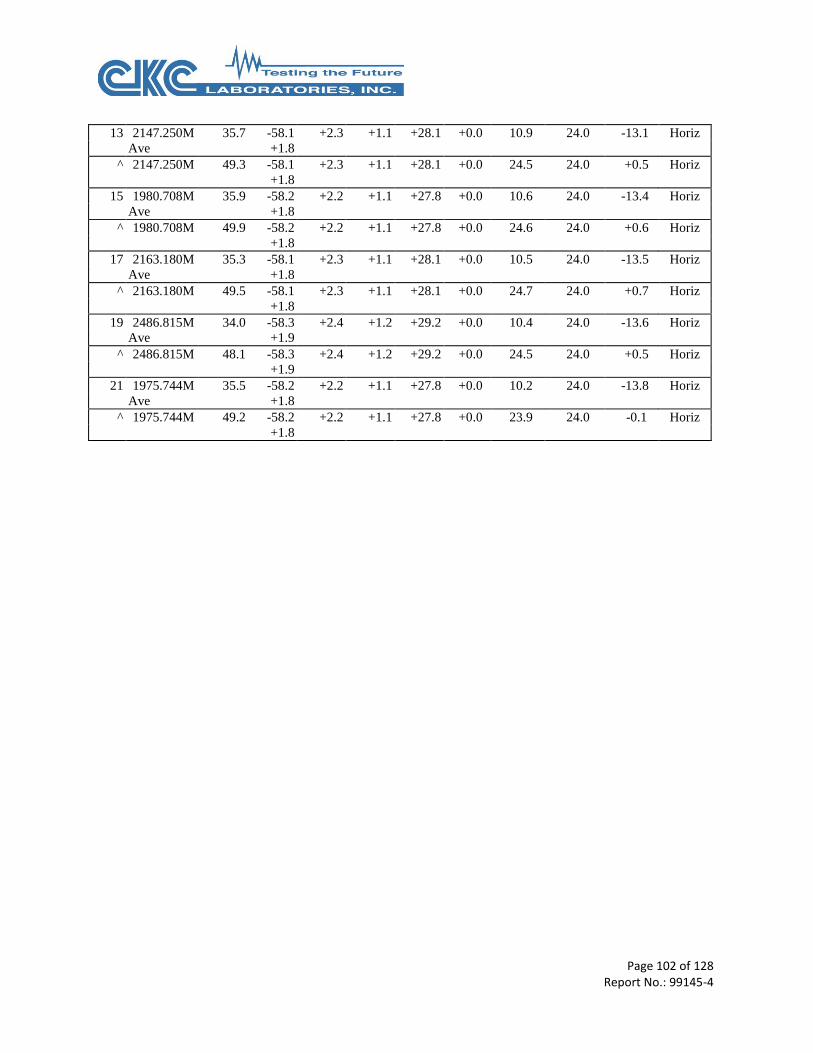
Page 102 of 128 Report No.: 99145-4
13 2147.250M 35.7 -58.1
+1.8
+2.3 +1.1 +28.1 +0.0 10.9 24.0 -13.1 Horiz
Ave
^ 2147.250M 49.3 -58.1
+1.8
+2.3 +1.1 +28.1 +0.0 24.5 24.0 +0.5 Horiz
15 1980.708M 35.9 -58.2
+1.8
+2.2 +1.1 +27.8 +0.0 10.6 24.0 -13.4 Horiz
Ave
^ 1980.708M 49.9 -58.2
+1.8
+2.2 +1.1 +27.8 +0.0 24.6 24.0 +0.6 Horiz
17 2163.180M 35.3 -58.1
+1.8
+2.3 +1.1 +28.1 +0.0 10.5 24.0 -13.5 Horiz
Ave
^ 2163.180M 49.5 -58.1
+1.8
+2.3 +1.1 +28.1 +0.0 24.7 24.0 +0.7 Horiz
19 2486.815M 34.0 -58.3
+1.9
+2.4 +1.2 +29.2 +0.0 10.4 24.0 -13.6 Horiz
Ave
^ 2486.815M 48.1 -58.3
+1.9
+2.4 +1.2 +29.2 +0.0 24.5 24.0 +0.5 Horiz
21 1975.744M 35.5 -58.2
+1.8
+2.2 +1.1 +27.8 +0.0 10.2 24.0 -13.8 Horiz
Ave
^ 1975.744M 49.2 -58.2
+1.8
+2.2 +1.1 +27.8 +0.0 23.9 24.0 -0.1 Horiz
Page 103 of 128 Report No.: 99145-4
Test Location: CKC Laboratories, Inc. • 1120 Fulton Place • Fremont, CA 94539 • (510) 249-1170
Customer: Texas Instruments Specification: CISPR 25 Section 6.4 - Class 5 Radiated Disturbances - Mobile - Ave Work Order #: 99145 Date: 11/11/2016
Test Type: Radiated Scan Time: 15:11:57
Tested By: N. Gamez Sequence#: 28
Software: EMITest 5.03.02
Equipment Tested:
Device Manufacturer Model # S/N
Configuration 1
Support Equipment:
Device Manufacturer Model # S/N
Configuration 1
Test Conditions / Notes:
CISPR25 (2008) Sec 6.4.4 Radiated Emissions 1-2.5GHz
Mobile
Temperature: 23°C
Humidity: 50%
Atmospheric Pressure: 101.5kPa
Position 2
Modification 33 was in place during testing.
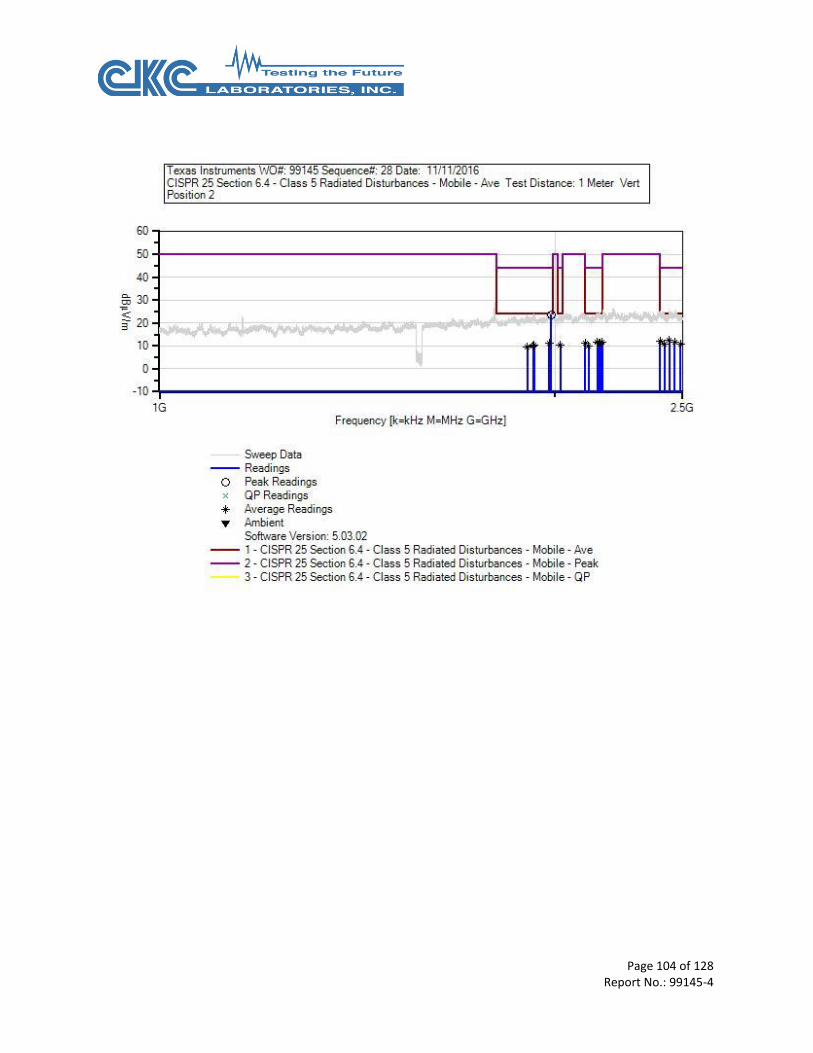
Page 104 of 128 Report No.: 99145-4

Page 105 of 128 Report No.: 99145-4
Test Equipment:
ID Asset # Description Model Calibration Date Cal Due Date
AN03434 5uH LISN 9117-5-TS-50-
N
1/26/2016 1/26/2018
AN03436 5uH LISN 9117-5-TS-50-
N
1/27/2016 1/27/2018
AN03471 Spectrum Analyzer E4440A 1/4/2016 1/4/2018
T1 AN03114 Preamp AMF-7D-
00101800-30-
10P
4/22/2015 4/22/2017
T2 ANP06126 Cable 32022-29094K-
29094K-168TC
3/18/2015 3/18/2017
T3 ANP06138 Cable 32022-29094K-
29094K-72TC
3/18/2015 3/18/2017
T4 AN02157 Horn Antenna-
ARP958
Calibration
3115 12/2/2014 12/2/2016
T5 ANP06711 Cable 32022-29094K-
29094K-132TC
11/21/2014 11/21/2016
Measurement Data: Reading listed by margin. Test Distance: 1 Meter
# Freq Rdng T1
T5
T2 T3 T4 Dist Corr Spec Margin Polar
MHz dBµV dB dB dB dB Table dBµV/m dBµV/m dB Ant
1 1984.905M 48.9 -58.2
+1.8
+2.2 +1.1 +27.8 +0.0 23.6 24.0 -0.4 Vert
2 2441.750M 36.1 -58.3
+1.9
+2.4 +1.2 +29.0 +0.0 12.3 24.0 -11.7 Vert
Ave
^ 2441.750M 49.2 -58.3
+1.9
+2.4 +1.2 +29.0 +0.0 25.4 24.0 +1.4 Vert
4 2403.552M 35.8 -58.2
+1.9
+2.4 +1.2 +28.8 +0.0 11.9 24.0 -12.1 Vert
Ave
^ 2403.552M 49.3 -58.2
+1.9
+2.4 +1.2 +28.8 +0.0 25.4 24.0 +1.4 Vert
6 2152.966M 36.4 -58.1
+1.8
+2.3 +1.1 +28.1 +0.0 11.6 24.0 -12.4 Vert
Ave
^ 2152.966M 50.4 -58.1
+1.8
+2.3 +1.1 +28.1 +0.0 25.6 24.0 +1.6 Vert
8 2171.198M 36.4 -58.1
+1.8
+2.3 +1.1 +28.1 +0.0 11.6 24.0 -12.4 Vert
Ave
^ 2171.198M 50.6 -58.1
+1.8
+2.3 +1.1 +28.1 +0.0 25.8 24.0 +1.8 Vert
10 2464.718M 35.3 -58.3
+1.9
+2.4 +1.2 +29.1 +0.0 11.6 24.0 -12.4 Vert
Ave
^ 2464.718M 49.3 -58.3
+1.9
+2.4 +1.2 +29.1 +0.0 25.6 24.0 +1.6 Vert
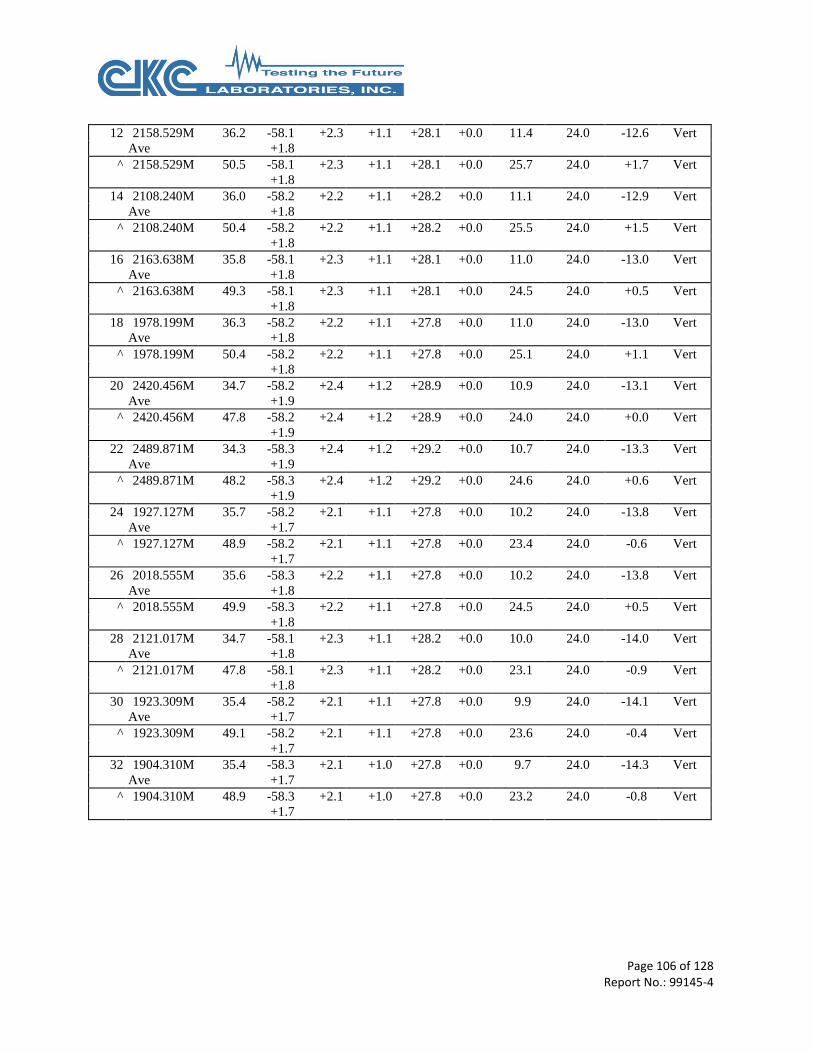
Page 106 of 128 Report No.: 99145-4
12 2158.529M 36.2 -58.1
+1.8
+2.3 +1.1 +28.1 +0.0 11.4 24.0 -12.6 Vert
Ave
^ 2158.529M 50.5 -58.1
+1.8
+2.3 +1.1 +28.1 +0.0 25.7 24.0 +1.7 Vert
14 2108.240M 36.0 -58.2
+1.8
+2.2 +1.1 +28.2 +0.0 11.1 24.0 -12.9 Vert
Ave
^ 2108.240M 50.4 -58.2
+1.8
+2.2 +1.1 +28.2 +0.0 25.5 24.0 +1.5 Vert
16 2163.638M 35.8 -58.1
+1.8
+2.3 +1.1 +28.1 +0.0 11.0 24.0 -13.0 Vert
Ave
^ 2163.638M 49.3 -58.1
+1.8
+2.3 +1.1 +28.1 +0.0 24.5 24.0 +0.5 Vert
18 1978.199M 36.3 -58.2
+1.8
+2.2 +1.1 +27.8 +0.0 11.0 24.0 -13.0 Vert
Ave
^ 1978.199M 50.4 -58.2
+1.8
+2.2 +1.1 +27.8 +0.0 25.1 24.0 +1.1 Vert
20 2420.456M 34.7 -58.2
+1.9
+2.4 +1.2 +28.9 +0.0 10.9 24.0 -13.1 Vert
Ave
^ 2420.456M 47.8 -58.2
+1.9
+2.4 +1.2 +28.9 +0.0 24.0 24.0 +0.0 Vert
22 2489.871M 34.3 -58.3
+1.9
+2.4 +1.2 +29.2 +0.0 10.7 24.0 -13.3 Vert
Ave
^ 2489.871M 48.2 -58.3
+1.9
+2.4 +1.2 +29.2 +0.0 24.6 24.0 +0.6 Vert
24 1927.127M 35.7 -58.2
+1.7
+2.1 +1.1 +27.8 +0.0 10.2 24.0 -13.8 Vert
Ave
^ 1927.127M 48.9 -58.2
+1.7
+2.1 +1.1 +27.8 +0.0 23.4 24.0 -0.6 Vert
26 2018.555M 35.6 -58.3
+1.8
+2.2 +1.1 +27.8 +0.0 10.2 24.0 -13.8 Vert
Ave
^ 2018.555M 49.9 -58.3
+1.8
+2.2 +1.1 +27.8 +0.0 24.5 24.0 +0.5 Vert
28 2121.017M 34.7 -58.1
+1.8
+2.3 +1.1 +28.2 +0.0 10.0 24.0 -14.0 Vert
Ave
^ 2121.017M 47.8 -58.1
+1.8
+2.3 +1.1 +28.2 +0.0 23.1 24.0 -0.9 Vert
30 1923.309M 35.4 -58.2
+1.7
+2.1 +1.1 +27.8 +0.0 9.9 24.0 -14.1 Vert
Ave
^ 1923.309M 49.1 -58.2
+1.7
+2.1 +1.1 +27.8 +0.0 23.6 24.0 -0.4 Vert
32 1904.310M 35.4 -58.3
+1.7
+2.1 +1.0 +27.8 +0.0 9.7 24.0 -14.3 Vert
Ave
^ 1904.310M 48.9 -58.3
+1.7
+2.1 +1.0 +27.8 +0.0 23.2 24.0 -0.8 Vert
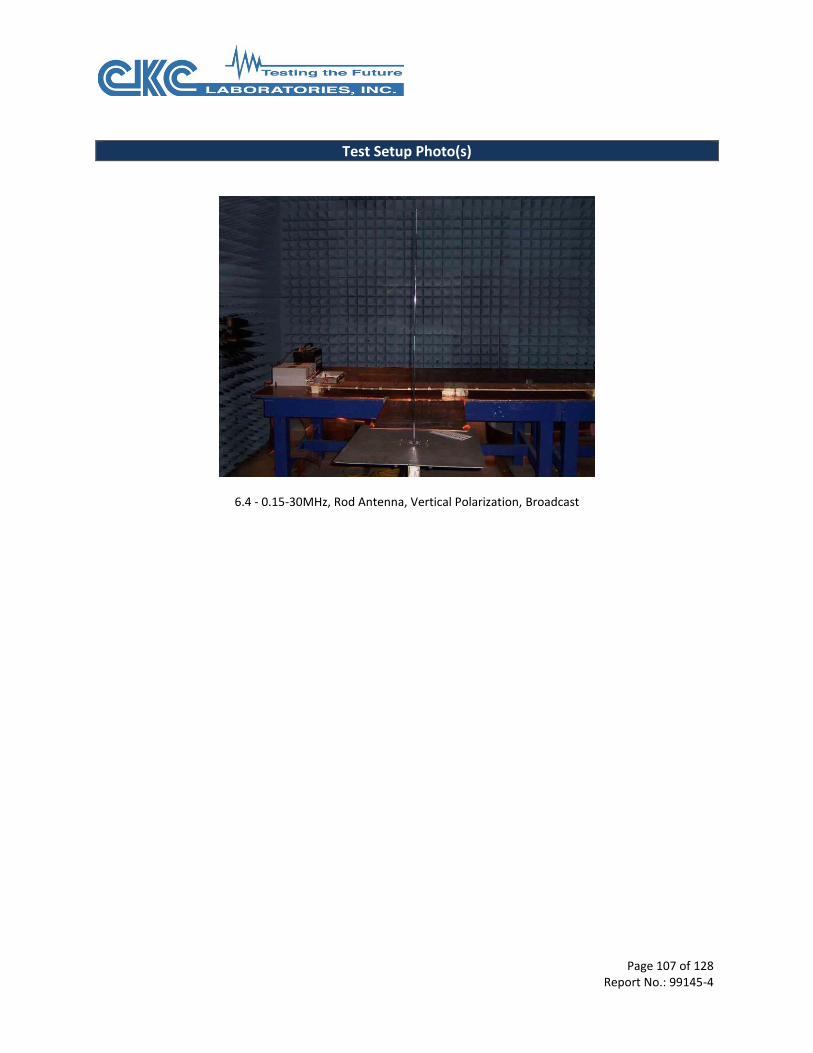
Page 107 of 128 Report No.: 99145-4
Test Setup Photo(s)
6.4 - 0.15-30MHz, Rod Antenna, Vertical Polarization, Broadcast
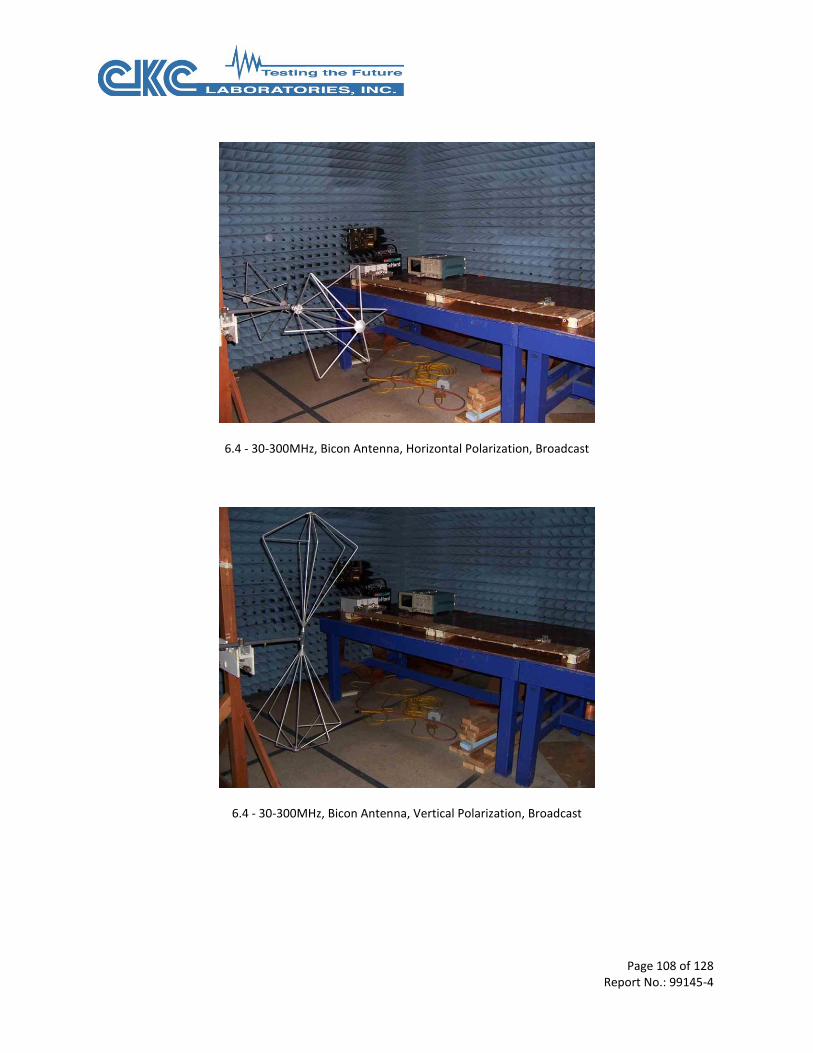
Page 108 of 128 Report No.: 99145-4
6.4 - 30-300MHz, Bicon Antenna, Horizontal Polarization, Broadcast
6.4 - 30-300MHz, Bicon Antenna, Vertical Polarization, Broadcast
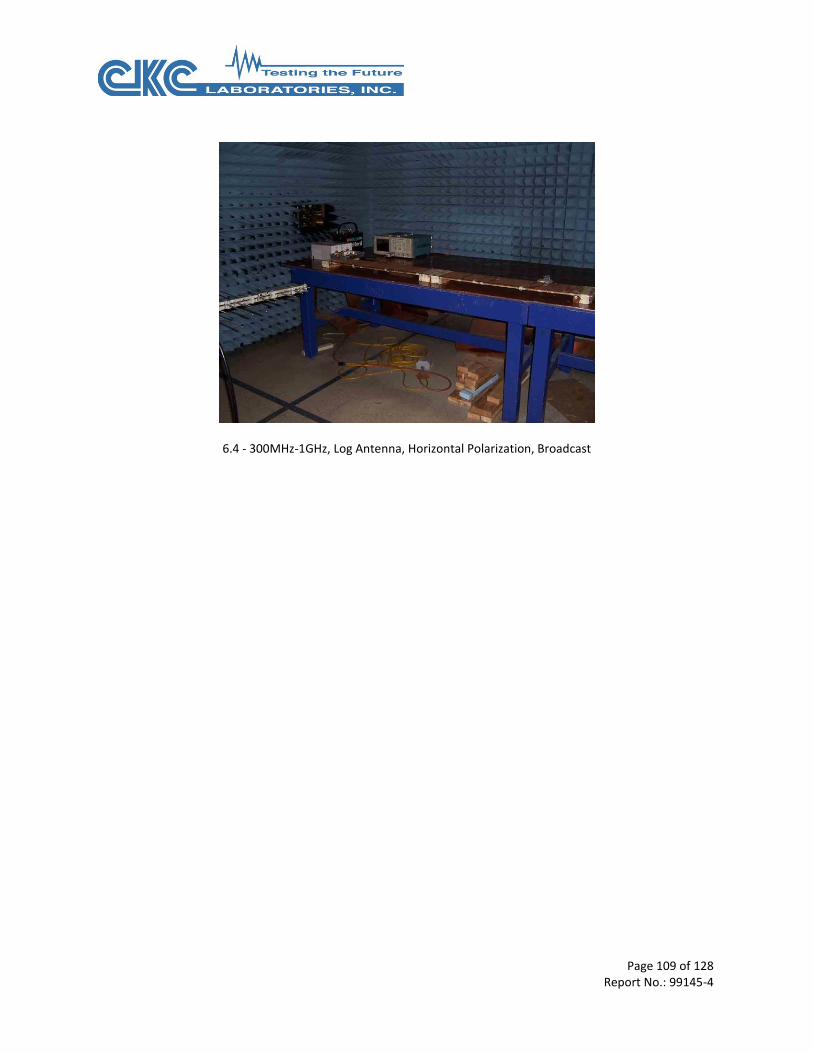
Page 109 of 128 Report No.: 99145-4
6.4 - 300MHz-1GHz, Log Antenna, Horizontal Polarization, Broadcast
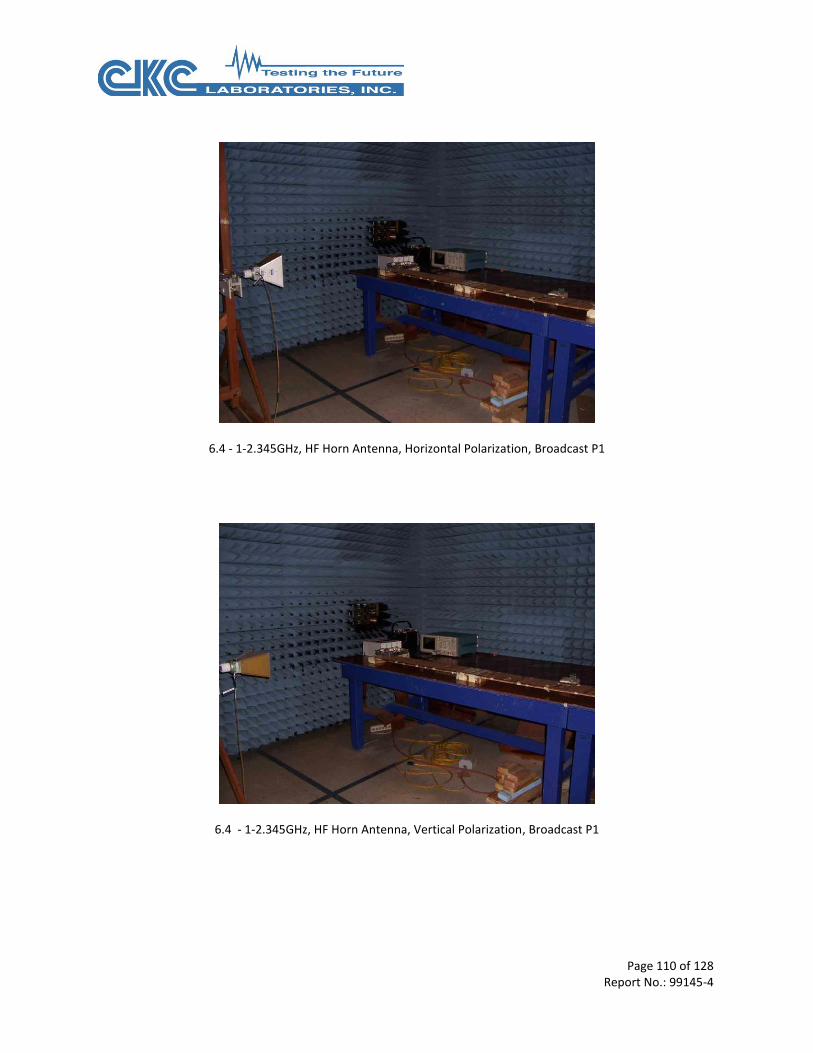
Page 110 of 128 Report No.: 99145-4
6.4 - 1-2.345GHz, HF Horn Antenna, Horizontal Polarization, Broadcast P1
6.4 - 1-2.345GHz, HF Horn Antenna, Vertical Polarization, Broadcast P1
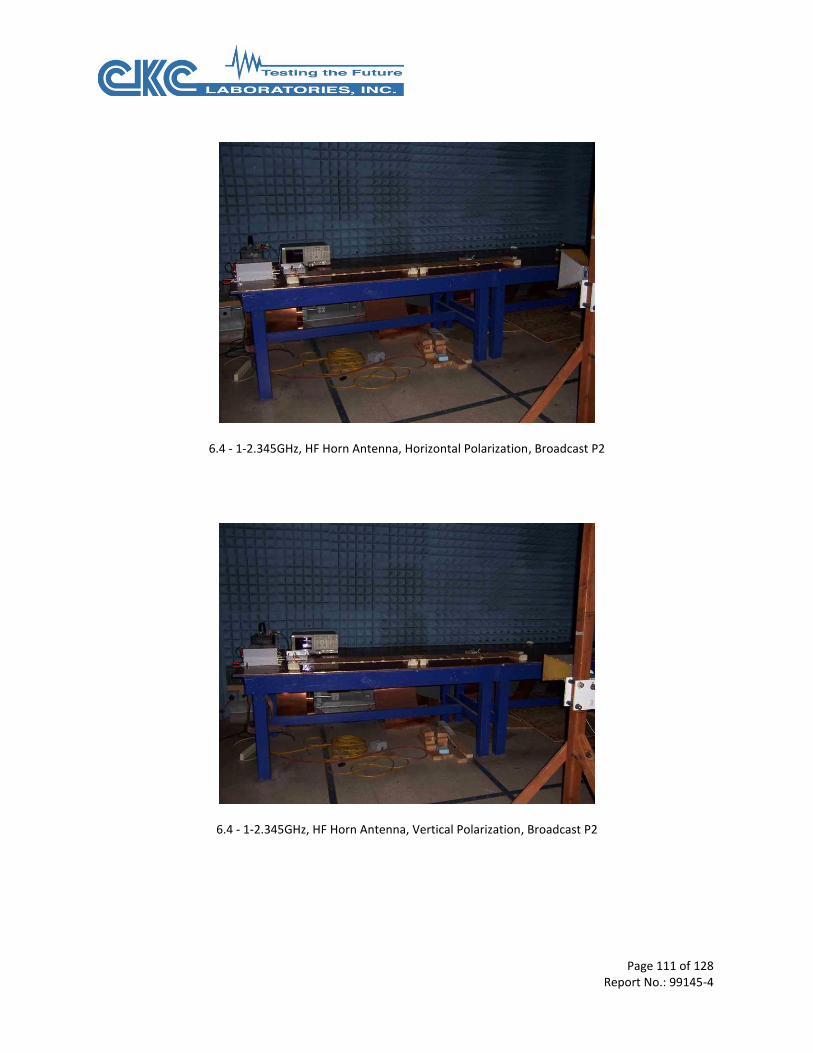
Page 111 of 128 Report No.: 99145-4
6.4 - 1-2.345GHz, HF Horn Antenna, Horizontal Polarization, Broadcast P2
6.4 - 1-2.345GHz, HF Horn Antenna, Vertical Polarization, Broadcast P2

Page 112 of 128 Report No.: 99145-4
6.4 - 1.567-1.583GHz, HF Horn Antenna, Horizontal Polarization, GPS Mobile P1
6.4 - 1.567-1.583GHz, HF Horn Antenna, Vertical Polarization, GPS Mobile P1
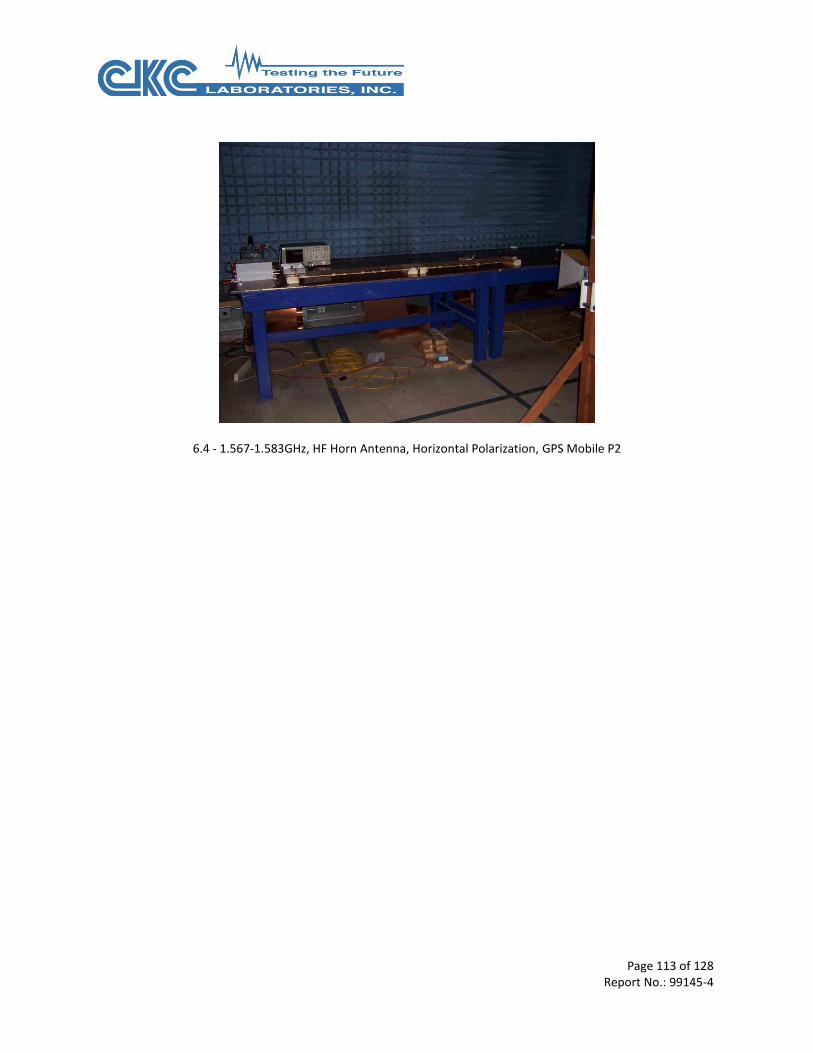
Page 113 of 128 Report No.: 99145-4
6.4 - 1.567-1.583GHz, HF Horn Antenna, Horizontal Polarization, GPS Mobile P2
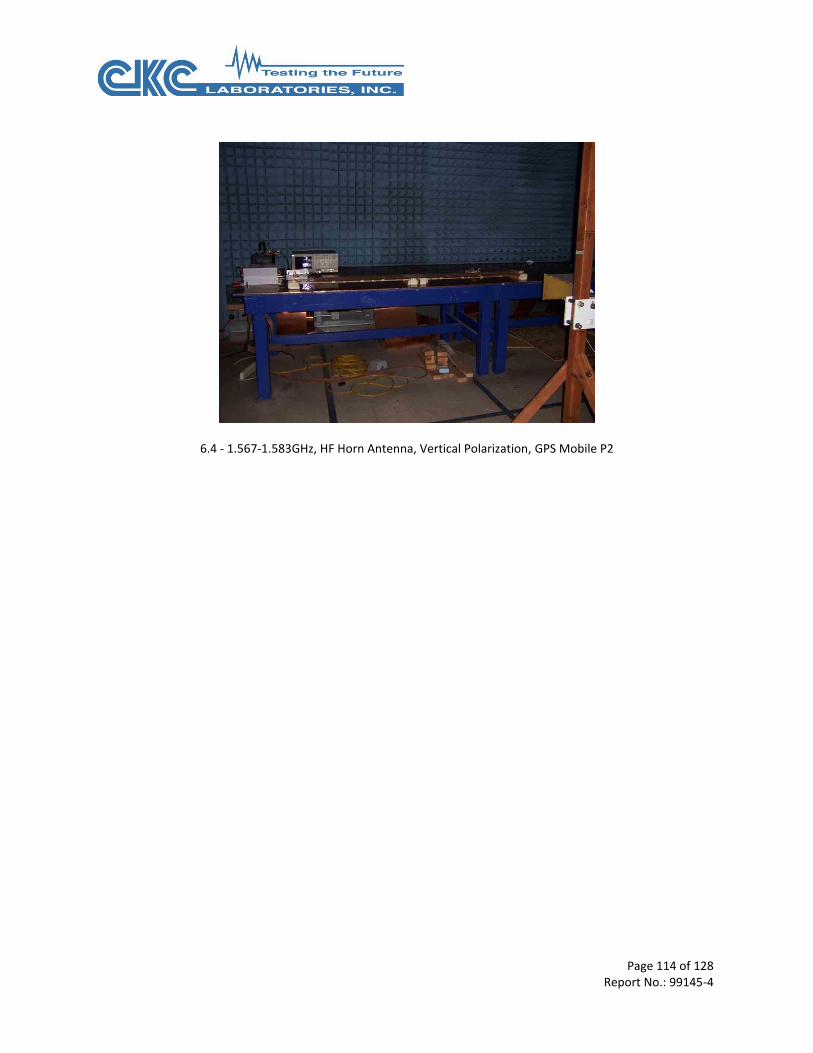
Page 114 of 128 Report No.: 99145-4
6.4 - 1.567-1.583GHz, HF Horn Antenna, Vertical Polarization, GPS Mobile P2
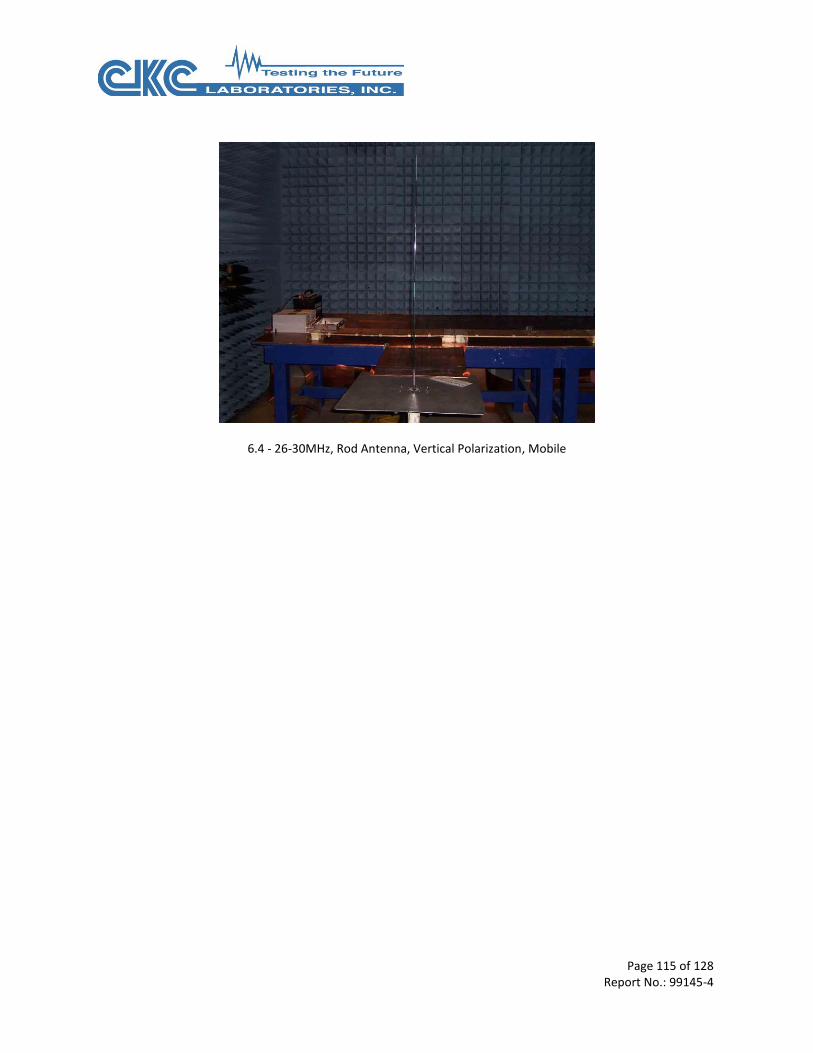
Page 115 of 128 Report No.: 99145-4
6.4 - 26-30MHz, Rod Antenna, Vertical Polarization, Mobile
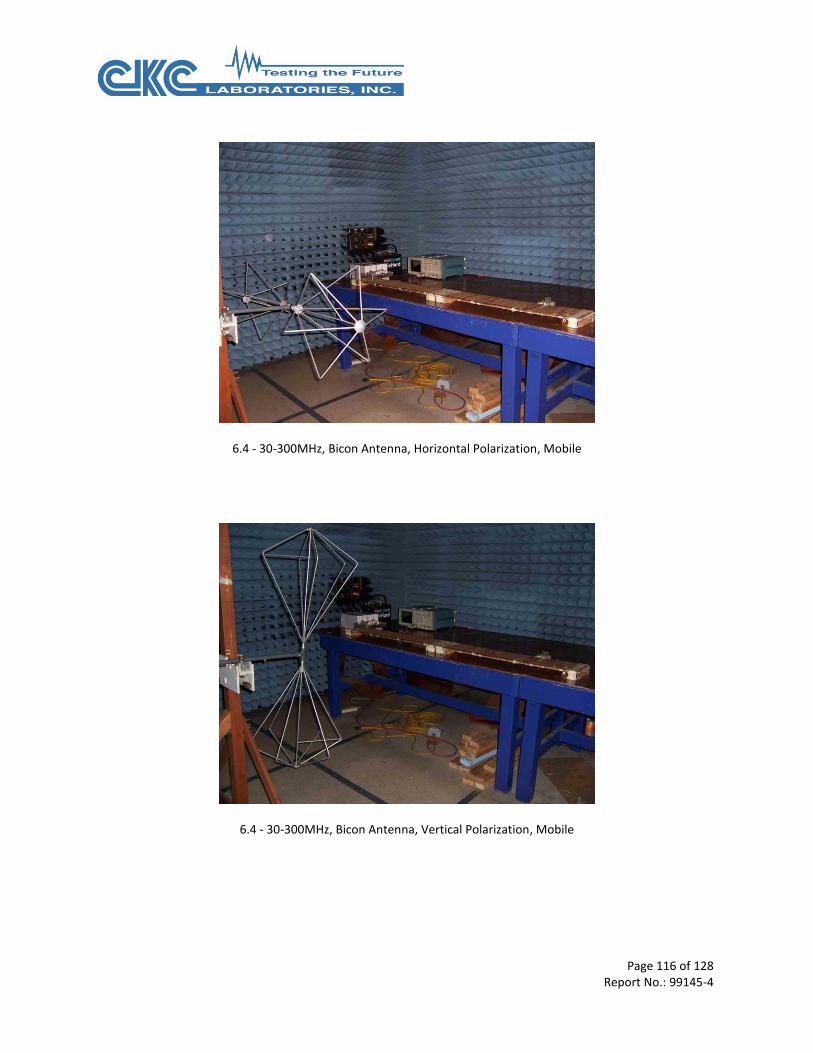
Page 116 of 128 Report No.: 99145-4
6.4 - 30-300MHz, Bicon Antenna, Horizontal Polarization, Mobile
6.4 - 30-300MHz, Bicon Antenna, Vertical Polarization, Mobile
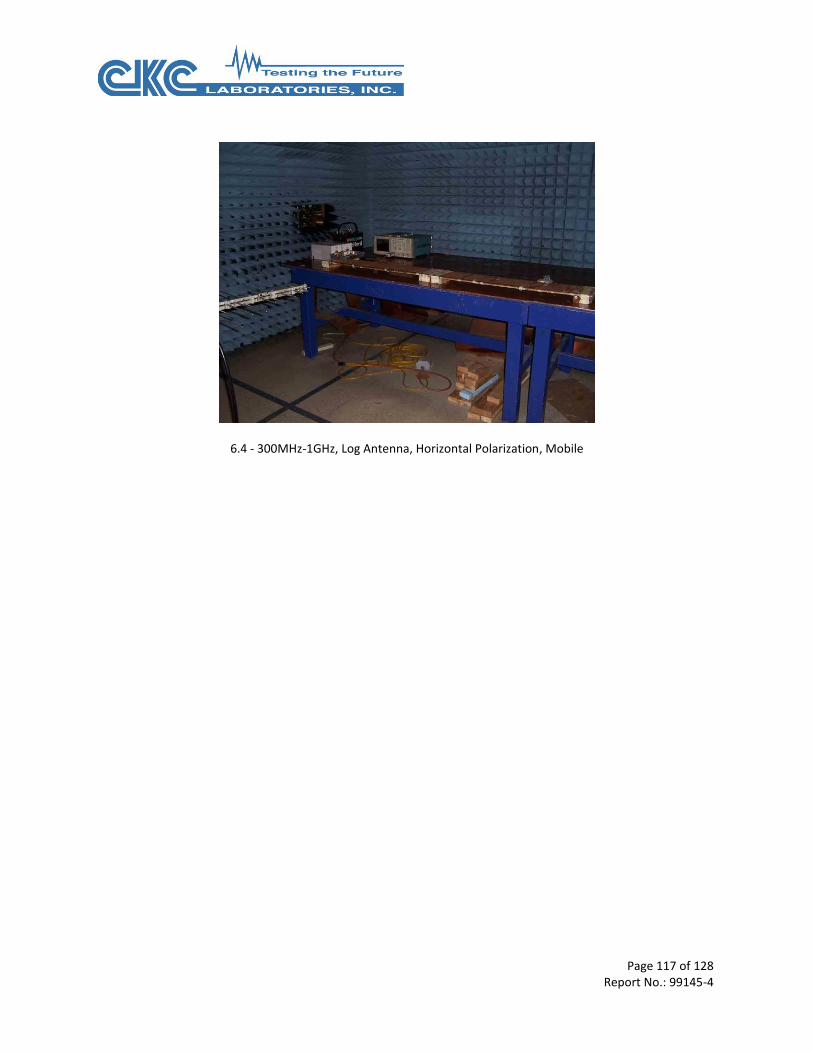
Page 117 of 128 Report No.: 99145-4
6.4 - 300MHz-1GHz, Log Antenna, Horizontal Polarization, Mobile

Page 118 of 128 Report No.: 99145-4
6.4 - 1-2.5GHz, HF Horn Antenna, Horizontal Polarization, Mobile P1
6.4 - 1-2.5GHz, HF Horn Antenna, Vertical Polarization, Mobile P1

Page 119 of 128 Report No.: 99145-4
6.4 - 1-2.5GHz, HF Horn Antenna, Horizontal Polarization, Mobile P2
6.4 - 1-2.5GHz, HF Horn Antenna, Vertical Polarization, Mobile P2
Page 120 of 128 Report No.: 99145-4
ISO 11452 IMMUNITY
Immunity Setup and Monitoring Equipment Setup: The DUT is setup such that the Serializer is connected to the Deserializer with a cable and placed on 5cm non-conducted support. The internal clock on the Serializer has been programmed for 100MHz. EUT set up in configuration A. Degradation Criteria: If the DUT has degradation, the LED light of lock latch (D5) on the Deserializer unit will turn on.
Monitoring: The Customer is monitoring for degradation via his oscilloscope.
Page 121 of 128 Report No.: 99145-4
ISO 11452-4 - BULK CURRENT INJECTION (BCI)
Test Setup/Conditions Test Location: Fremont Test Engineer: N. Gamez
Test Method: ISO 11452-2 (2004) Test Date(s): 10/7-10/2016
Test Level: 100mA 1-400MHz, CW & 80%AM 1kHz modulation at 150mm, 450mm, & 750mm test distance.
Declarations: Modification 6 was in place during testing.
Configuration: A
Test Equipment
Asset # Description Manufacturer Model Cal Date Cal Due
03470 Spectrum Analyzer Agilent E4440A 12/9/2015 12/9/2017
01406 Spectrum Analyzer HP 8564E 10/10/2016 10/10/2018
01367 Amplifier Amplifier Research 150A100A 1/23/2015 1/23/2017
00640 Amplifier Amplifier Research 50W1000A 3/26/2015 3/26/2017
01363 RF Generator Marconi 2022D 3/11/2015 3/11/2017
02671 Directional Coupler Werlatone C5571-10 1/13/2015 1/13/2017
P05713 Attenuator Pasternack PE7015-20 3/24/2015 3/24/2017
P01898 RF Load Bird 8201 2/18/2015 2/18/2017
02145 Bulk Injection Probe FCC F-130-1-A 12/5/2014 12/5/2014
03271 Current Injection Probe Solar 9217-1N 2/1/2016 2/1/2018
Test Results Test Results Test Observations
Serializer No degradation No degradation observed for CW or 80%AM 1kHz tests at 150mm, 450mm, & 750mm distances
Deserializer No degradation No degradation observed for CW or 80%AM 1kHz tests at 150mm, 450mm, & 750mm distances
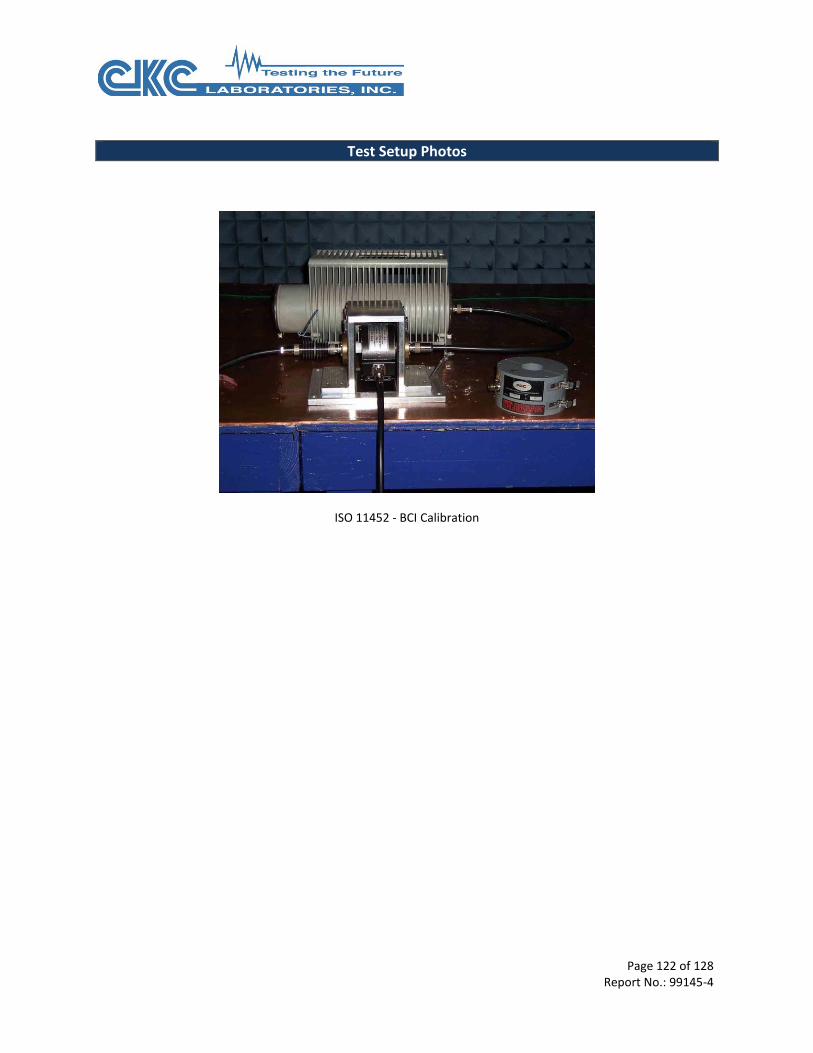
Page 122 of 128 Report No.: 99145-4
Test Setup Photos
ISO 11452 - BCI Calibration
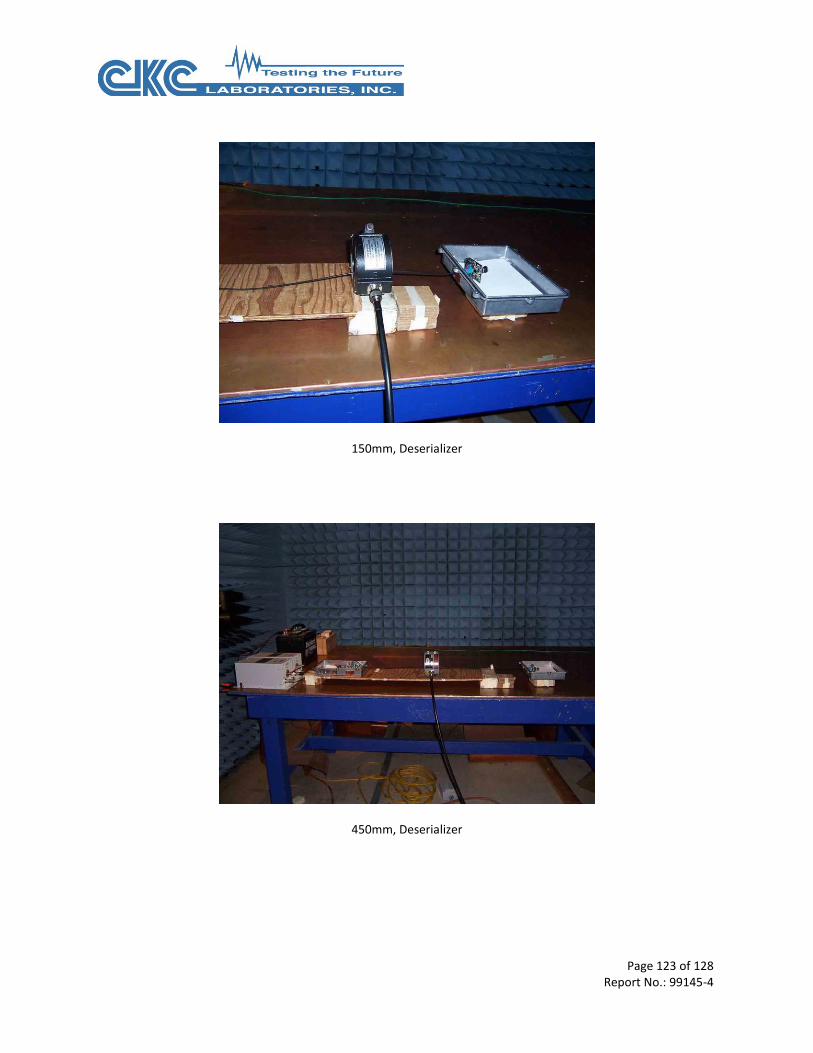
Page 123 of 128 Report No.: 99145-4
150mm, Deserializer
450mm, Deserializer
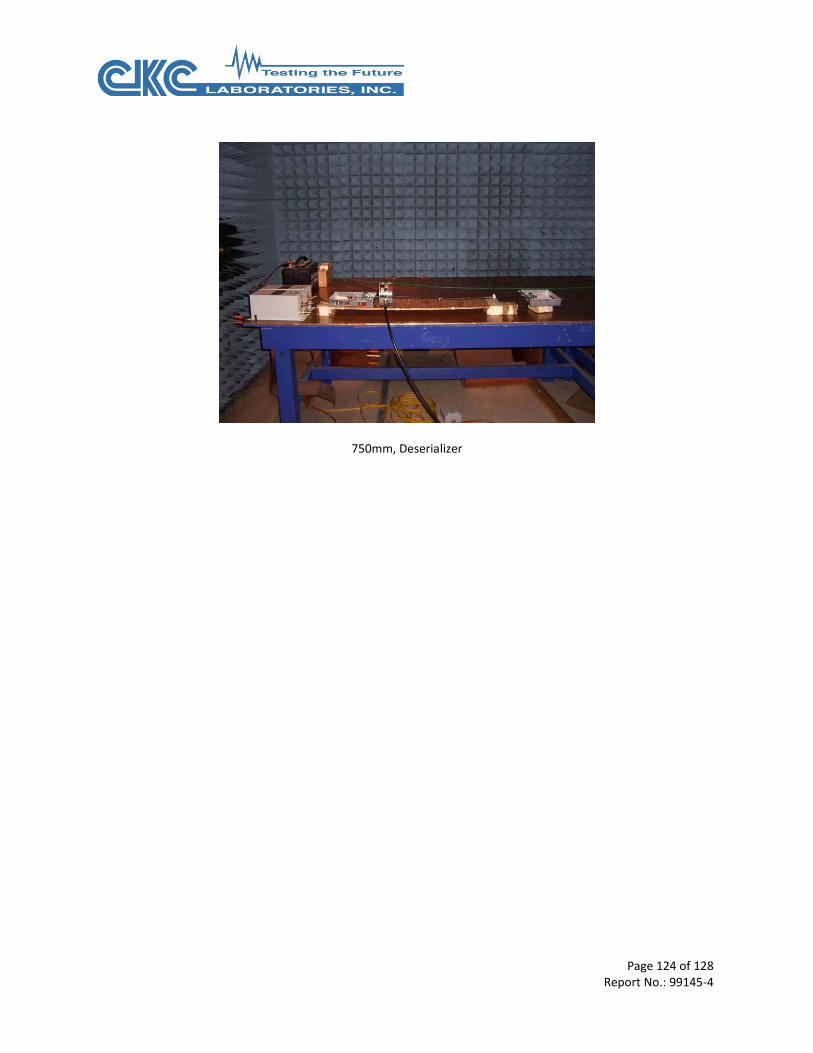
Page 124 of 128 Report No.: 99145-4
750mm, Deserializer
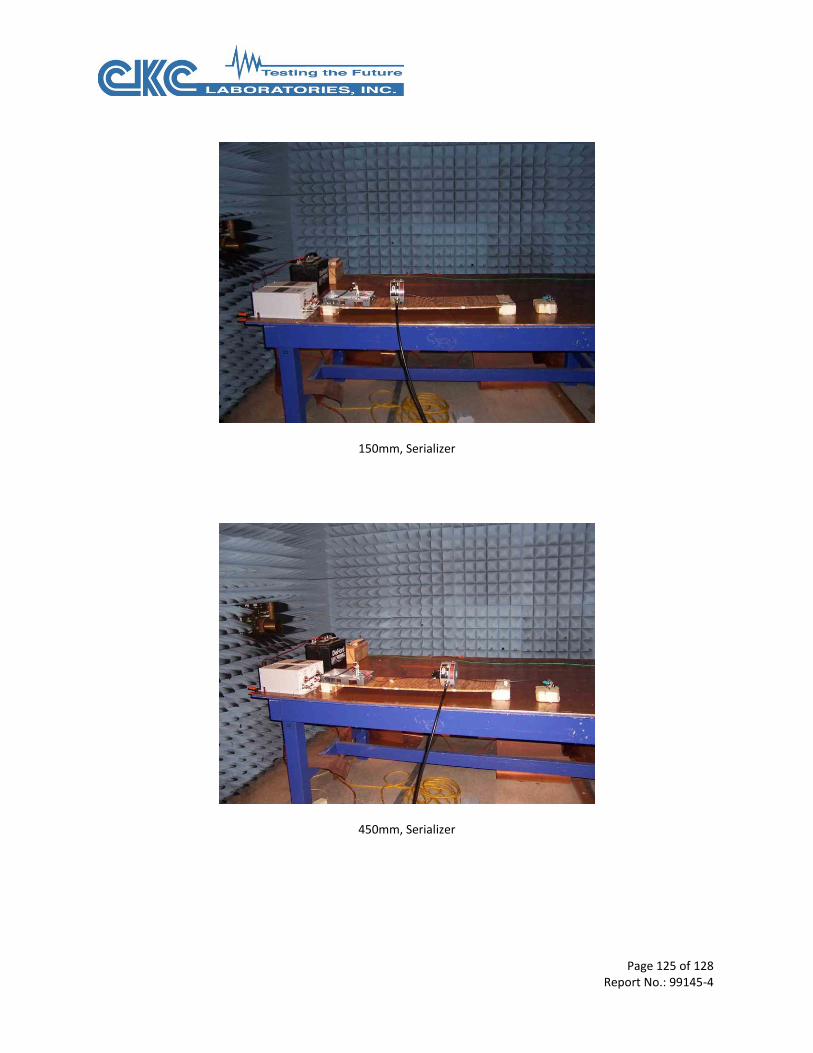
Page 125 of 128 Report No.: 99145-4
150mm, Serializer
450mm, Serializer
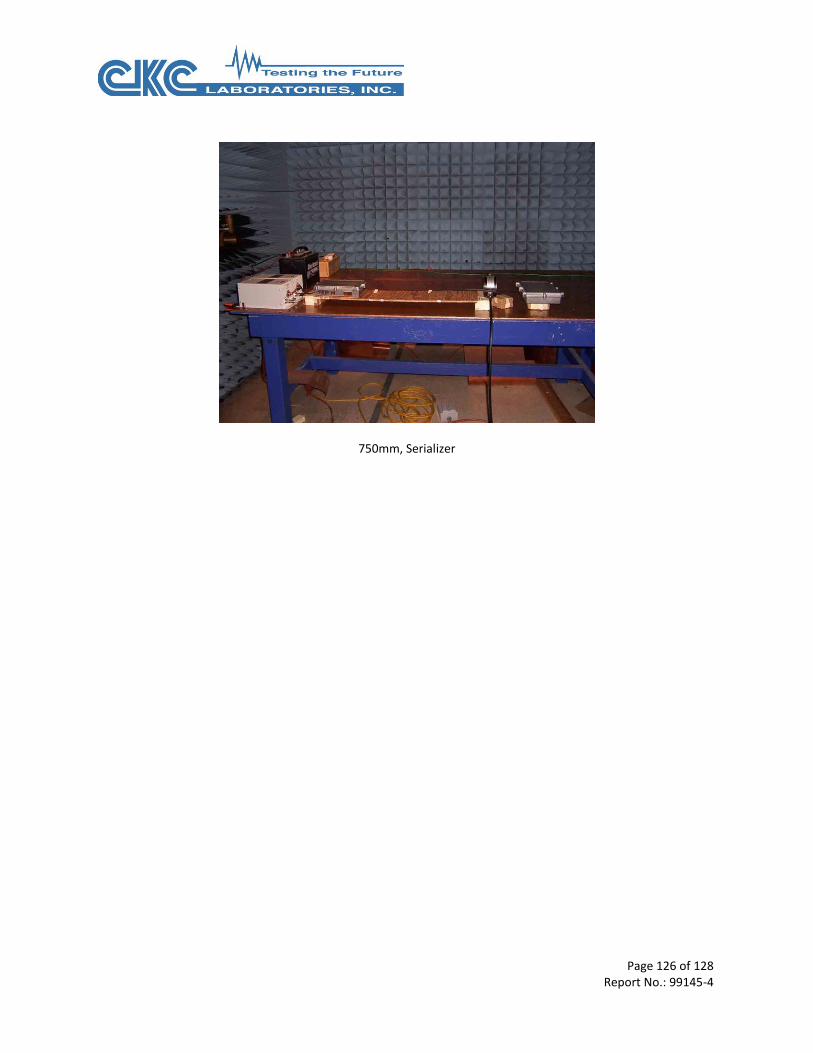
Page 126 of 128 Report No.: 99145-4
750mm, Serializer
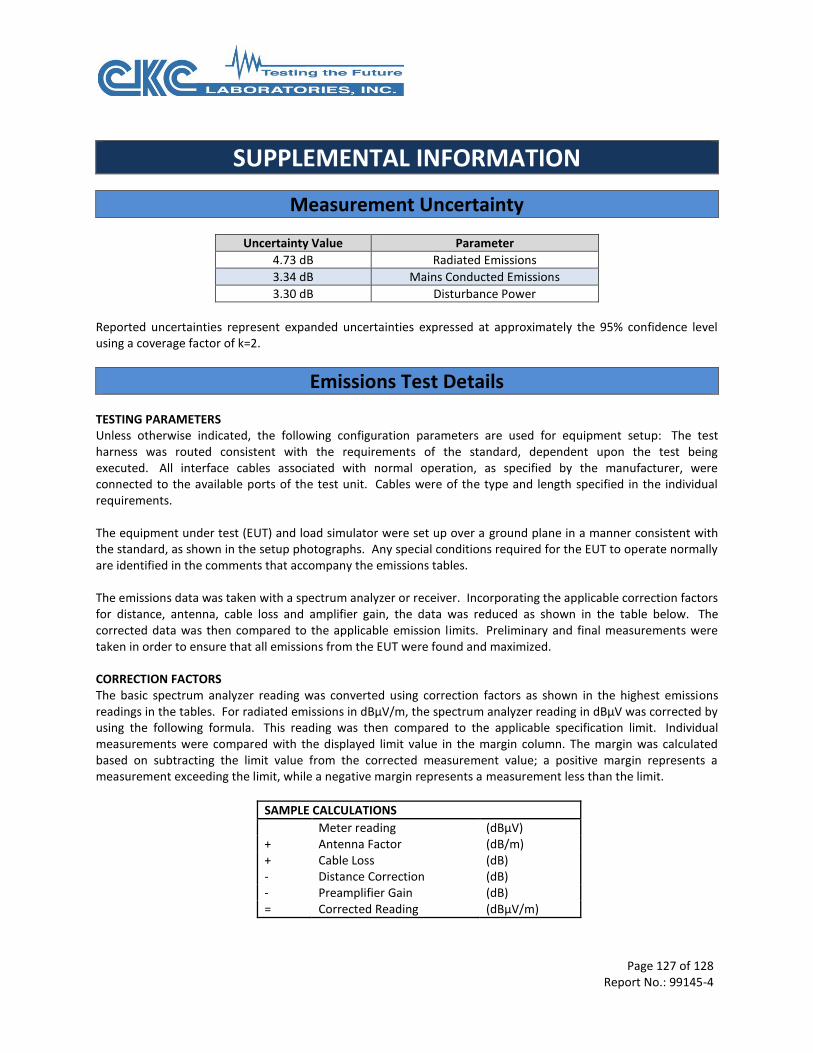
Page 127 of 128 Report No.: 99145-4
SUPPLEMENTAL INFORMATION
Measurement Uncertainty
Uncertainty Value Parameter
4.73 dB Radiated Emissions
3.34 dB Mains Conducted Emissions
3.30 dB Disturbance Power
Reported uncertainties represent expanded uncertainties expressed at approximately the 95% confidence level using a coverage factor of k=2.
Emissions Test Details TESTING PARAMETERS Unless otherwise indicated, the following configuration parameters are used for equipment setup: The test harness was routed consistent with the requirements of the standard, dependent upon the test being executed. All interface cables associated with normal operation, as specified by the manufacturer, were connected to the available ports of the test unit. Cables were of the type and length specified in the individual requirements. The equipment under test (EUT) and load simulator were set up over a ground plane in a manner consistent with the standard, as shown in the setup photographs. Any special conditions required for the EUT to operate normally are identified in the comments that accompany the emissions tables. The emissions data was taken with a spectrum analyzer or receiver. Incorporating the applicable correction factors for distance, antenna, cable loss and amplifier gain, the data was reduced as shown in the table below. The corrected data was then compared to the applicable emission limits. Preliminary and final measurements were taken in order to ensure that all emissions from the EUT were found and maximized. CORRECTION FACTORS The basic spectrum analyzer reading was converted using correction factors as shown in the highest emissions readings in the tables. For radiated emissions in dBµV/m, the spectrum analyzer reading in dBµV was corrected by using the following formula. This reading was then compared to the applicable specification limit. Individual measurements were compared with the displayed limit value in the margin column. The margin was calculated based on subtracting the limit value from the corrected measurement value; a positive margin represents a measurement exceeding the limit, while a negative margin represents a measurement less than the limit.
SAMPLE CALCULATIONS
Meter reading (dBµV) + Antenna Factor (dB/m) + Cable Loss (dB) - Distance Correction (dB) - Preamplifier Gain (dB) = Corrected Reading (dBµV/m)
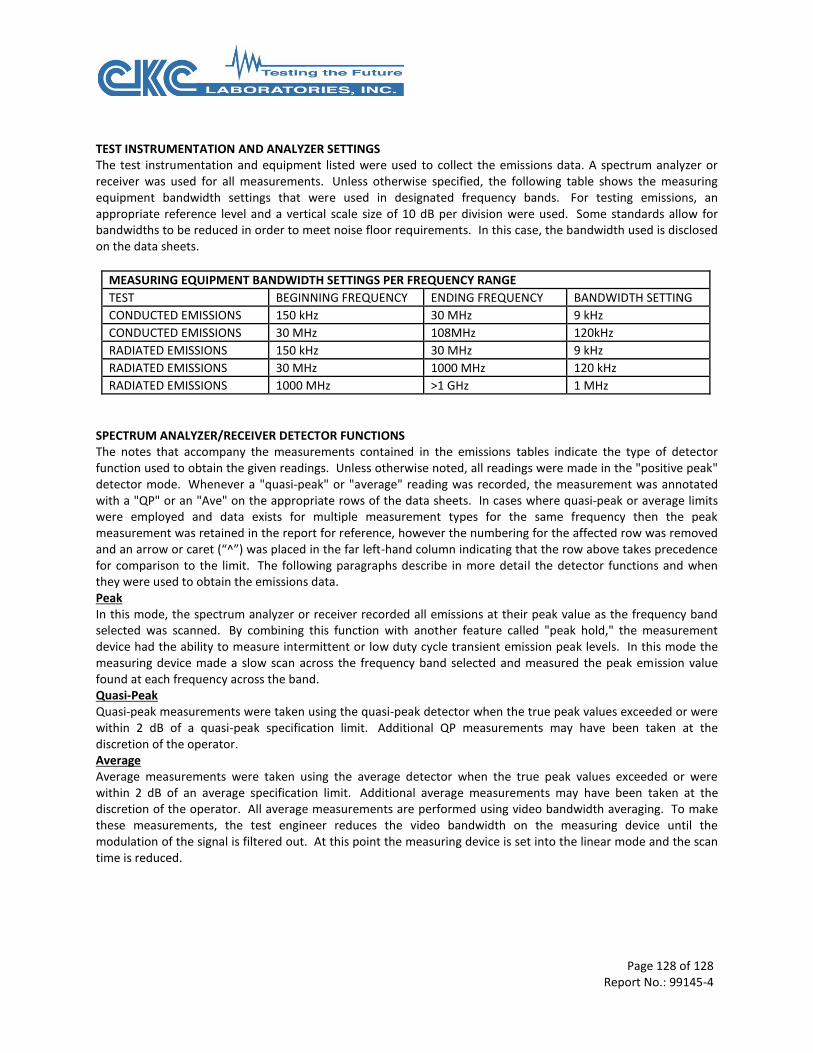
Page 128 of 128 Report No.: 99145-4
TEST INSTRUMENTATION AND ANALYZER SETTINGS The test instrumentation and equipment listed were used to collect the emissions data. A spectrum analyzer or receiver was used for all measurements. Unless otherwise specified, the following table shows the measuring equipment bandwidth settings that were used in designated frequency bands. For testing emissions, an appropriate reference level and a vertical scale size of 10 dB per division were used. Some standards allow for bandwidths to be reduced in order to meet noise floor requirements. In this case, the bandwidth used is disclosed on the data sheets.
MEASURING EQUIPMENT BANDWIDTH SETTINGS PER FREQUENCY RANGE
TEST BEGINNING FREQUENCY ENDING FREQUENCY BANDWIDTH SETTING
CONDUCTED EMISSIONS 150 kHz 30 MHz 9 kHz
CONDUCTED EMISSIONS 30 MHz 108MHz 120kHz
RADIATED EMISSIONS 150 kHz 30 MHz 9 kHz
RADIATED EMISSIONS 30 MHz 1000 MHz 120 kHz
RADIATED EMISSIONS 1000 MHz >1 GHz 1 MHz
SPECTRUM ANALYZER/RECEIVER DETECTOR FUNCTIONS The notes that accompany the measurements contained in the emissions tables indicate the type of detector function used to obtain the given readings. Unless otherwise noted, all readings were made in the "positive peak" detector mode. Whenever a "quasi-peak" or "average" reading was recorded, the measurement was annotated with a "QP" or an "Ave" on the appropriate rows of the data sheets. In cases where quasi-peak or average limits were employed and data exists for multiple measurement types for the same frequency then the peak measurement was retained in the report for reference, however the numbering for the affected row was removed and an arrow or caret (“^”) was placed in the far left-hand column indicating that the row above takes precedence for comparison to the limit. The following paragraphs describe in more detail the detector functions and when they were used to obtain the emissions data. Peak In this mode, the spectrum analyzer or receiver recorded all emissions at their peak value as the frequency band selected was scanned. By combining this function with another feature called "peak hold," the measurement device had the ability to measure intermittent or low duty cycle transient emission peak levels. In this mode the measuring device made a slow scan across the frequency band selected and measured the peak emission value found at each frequency across the band. Quasi-Peak Quasi-peak measurements were taken using the quasi-peak detector when the true peak values exceeded or were within 2 dB of a quasi-peak specification limit. Additional QP measurements may have been taken at the discretion of the operator. Average Average measurements were taken using the average detector when the true peak values exceeded or were within 2 dB of an average specification limit. Additional average measurements may have been taken at the discretion of the operator. All average measurements are performed using video bandwidth averaging. To make these measurements, the test engineer reduces the video bandwidth on the measuring device until the modulation of the signal is filtered out. At this point the measuring device is set into the linear mode and the scan time is reduced.