Embed Size (px)
Citation preview

VMware Horizon 6 with App Volumes and Virtual SAN Reference ArchitectureT E C H N I C A L W H I T E PA P E R

VMware Horizon 6 with App Volumes and Virtual SAN Reference Architecture
T E C H N I C A L W H I T E PA P E R / 2
Table of Contents
Executive Summary . . . . . . . . . . . . . . . . . . . . . . . . . . . . . . . . . . . . . . . . . . . . . . . . . . . . . . . . 9
Introduction . . . . . . . . . . . . . . . . . . . . . . . . . . . . . . . . . . . . . . . . . . . . . . . . . . . . . . . . . . . . . . 10
Hardware Components . . . . . . . . . . . . . . . . . . . . . . . . . . . . . . . . . . . . . . . . . . . . . . . . . . . . 11
Software Components . . . . . . . . . . . . . . . . . . . . . . . . . . . . . . . . . . . . . . . . . . . . . . . . . . . . . 11
VMware vSphere . . . . . . . . . . . . . . . . . . . . . . . . . . . . . . . . . . . . . . . . . . . . . . . . . . . . . . . 12
VMware Horizon 6 . . . . . . . . . . . . . . . . . . . . . . . . . . . . . . . . . . . . . . . . . . . . . . . . . . . . . . 12
Modular Pod and Block Design . . . . . . . . . . . . . . . . . . . . . . . . . . . . . . . . . . . . . . . . . . . . . 13
Management Block Design . . . . . . . . . . . . . . . . . . . . . . . . . . . . . . . . . . . . . . . . . . . . . . 14
Desktop Block Design . . . . . . . . . . . . . . . . . . . . . . . . . . . . . . . . . . . . . . . . . . . . . . . . . . 15
Testing and Results . . . . . . . . . . . . . . . . . . . . . . . . . . . . . . . . . . . . . . . . . . . . . . . . . . . . . . . . 16
Workload Testing Tool . . . . . . . . . . . . . . . . . . . . . . . . . . . . . . . . . . . . . . . . . . . . . . . . . . . . 16
View Planner Operations . . . . . . . . . . . . . . . . . . . . . . . . . . . . . . . . . . . . . . . . . . . . . . . . 17
View Planner Run Phases . . . . . . . . . . . . . . . . . . . . . . . . . . . . . . . . . . . . . . . . . . . . . . . 18
View Planner Quality of Service . . . . . . . . . . . . . . . . . . . . . . . . . . . . . . . . . . . . . . . . . . 18
Linked-Clone Virtual Desktops on Virtual SAN . . . . . . . . . . . . . . . . . . . . . . . . . . . . . . . 18
Workload Testing – Test Cases . . . . . . . . . . . . . . . . . . . . . . . . . . . . . . . . . . . . . . . . . . . 18
View Planner 3.5 Test Results . . . . . . . . . . . . . . . . . . . . . . . . . . . . . . . . . . . . . . . . . . . . 21
Findings of View Planner Workload Tests . . . . . . . . . . . . . . . . . . . . . . . . . . . . . . . . . 27
Operations Testing . . . . . . . . . . . . . . . . . . . . . . . . . . . . . . . . . . . . . . . . . . . . . . . . . . . . . 28
Resiliency Testing – Virtual SAN . . . . . . . . . . . . . . . . . . . . . . . . . . . . . . . . . . . . . . . . . . 37
View RDSH Desktops . . . . . . . . . . . . . . . . . . . . . . . . . . . . . . . . . . . . . . . . . . . . . . . . . . . . . . 42
RDSH Server Image Build . . . . . . . . . . . . . . . . . . . . . . . . . . . . . . . . . . . . . . . . . . . . . . . 43
View Planner Test Results . . . . . . . . . . . . . . . . . . . . . . . . . . . . . . . . . . . . . . . . . . . . . . . 45
Summary of View Planner Workload Test Results . . . . . . . . . . . . . . . . . . . . . . . . . . 48
Horizon Writable Volumes Test . . . . . . . . . . . . . . . . . . . . . . . . . . . . . . . . . . . . . . . . . . . . . 49
Operations Testing . . . . . . . . . . . . . . . . . . . . . . . . . . . . . . . . . . . . . . . . . . . . . . . . . . . . . 52
Writable Volumes Test Findings . . . . . . . . . . . . . . . . . . . . . . . . . . . . . . . . . . . . . . . . . . 53
System Configuration . . . . . . . . . . . . . . . . . . . . . . . . . . . . . . . . . . . . . . . . . . . . . . . . . . . . . . 54
vCenter Server . . . . . . . . . . . . . . . . . . . . . . . . . . . . . . . . . . . . . . . . . . . . . . . . . . . . . . . . . . . 54
vSphere Cluster Configuration . . . . . . . . . . . . . . . . . . . . . . . . . . . . . . . . . . . . . . . . . . . . . . 54
ESXi Configuration . . . . . . . . . . . . . . . . . . . . . . . . . . . . . . . . . . . . . . . . . . . . . . . . . . . . . . . . 55
CPU Sizing – Virtual SAN and Virtual Desktops . . . . . . . . . . . . . . . . . . . . . . . . . . . . 55
CPU Sizing – RDSH Hosts . . . . . . . . . . . . . . . . . . . . . . . . . . . . . . . . . . . . . . . . . . . . . . . 55
Memory Sizing – Virtual SAN and Virtual Desktops . . . . . . . . . . . . . . . . . . . . . . . . 56
Memory Sizing – RDSH Servers . . . . . . . . . . . . . . . . . . . . . . . . . . . . . . . . . . . . . . . . . . 57

VMware Horizon 6 with App Volumes and Virtual SAN Reference Architecture
T E C H N I C A L W H I T E PA P E R / 3
Network Configuration . . . . . . . . . . . . . . . . . . . . . . . . . . . . . . . . . . . . . . . . . . . . . . . . . . . . 57
View . . . . . . . . . . . . . . . . . . . . . . . . . . . . . . . . . . . . . . . . . . . . . . . . . . . . . . . . . . . . . . . . . . . . 59
View Global Policies and Settings . . . . . . . . . . . . . . . . . . . . . . . . . . . . . . . . . . . . . . . . 60
View Manager Pool Settings . . . . . . . . . . . . . . . . . . . . . . . . . . . . . . . . . . . . . . . . . . . . . 61
Linked-Clone Desktop Pool . . . . . . . . . . . . . . . . . . . . . . . . . . . . . . . . . . . . . . . . . . . . . . 61
RDSH Desktop Pool . . . . . . . . . . . . . . . . . . . . . . . . . . . . . . . . . . . . . . . . . . . . . . . . . . . . 62
App Volumes . . . . . . . . . . . . . . . . . . . . . . . . . . . . . . . . . . . . . . . . . . . . . . . . . . . . . . . . . . . . . 63
Storage for Virtual SAN . . . . . . . . . . . . . . . . . . . . . . . . . . . . . . . . . . . . . . . . . . . . . . . . . . . . 64
Virtual SAN Sizing . . . . . . . . . . . . . . . . . . . . . . . . . . . . . . . . . . . . . . . . . . . . . . . . . . . . . . 66
Objects and Components . . . . . . . . . . . . . . . . . . . . . . . . . . . . . . . . . . . . . . . . . . . . . . . 66
Estimating Required Capacity . . . . . . . . . . . . . . . . . . . . . . . . . . . . . . . . . . . . . . . . . . . 76
Storage for RDSH Hosts . . . . . . . . . . . . . . . . . . . . . . . . . . . . . . . . . . . . . . . . . . . . . . . . . . . 77
Active Directory Group Policies . . . . . . . . . . . . . . . . . . . . . . . . . . . . . . . . . . . . . . . . . . . . 78
PCoIP Group Policy . . . . . . . . . . . . . . . . . . . . . . . . . . . . . . . . . . . . . . . . . . . . . . . . . . . . . 79
Persona and User Data . . . . . . . . . . . . . . . . . . . . . . . . . . . . . . . . . . . . . . . . . . . . . . . . . . 81
App Volumes Group Policy . . . . . . . . . . . . . . . . . . . . . . . . . . . . . . . . . . . . . . . . . . . . . . . . 82
SQL Server . . . . . . . . . . . . . . . . . . . . . . . . . . . . . . . . . . . . . . . . . . . . . . . . . . . . . . . . . . . . 84
Windows File Services . . . . . . . . . . . . . . . . . . . . . . . . . . . . . . . . . . . . . . . . . . . . . . . . . . 85
vRealize Operations for Horizon . . . . . . . . . . . . . . . . . . . . . . . . . . . . . . . . . . . . . . . . . 85
Availability . . . . . . . . . . . . . . . . . . . . . . . . . . . . . . . . . . . . . . . . . . . . . . . . . . . . . . . . . . . . . . . 87
Conclusion . . . . . . . . . . . . . . . . . . . . . . . . . . . . . . . . . . . . . . . . . . . . . . . . . . . . . . . . . . . . . . . . 89
About the Author and Contributors . . . . . . . . . . . . . . . . . . . . . . . . . . . . . . . . . . . . . . . . . . 90
References . . . . . . . . . . . . . . . . . . . . . . . . . . . . . . . . . . . . . . . . . . . . . . . . . . . . . . . . . . . . . . . . 90
Appendix A: Linked Clones on Virtual SAN Tests . . . . . . . . . . . . . . . . . . . . . . . . . . . . . . 91
Appendix B: RDSH Testing . . . . . . . . . . . . . . . . . . . . . . . . . . . . . . . . . . . . . . . . . . . . . . . . . . 93
Appendix C: Writable Volumes Test . . . . . . . . . . . . . . . . . . . . . . . . . . . . . . . . . . . . . . . . . 101
Appendix D: Bill of Materials . . . . . . . . . . . . . . . . . . . . . . . . . . . . . . . . . . . . . . . . . . . . . . . 108

VMware Horizon 6 with App Volumes and Virtual SAN Reference Architecture
T E C H N I C A L W H I T E PA P E R / 4
List of Figures
Figure 1: Highlights . . . . . . . . . . . . . . . . . . . . . . . . . . . . . . . . . . . . . . . . . . . . . . . . . . . . . . . . . . . .9
Figure 2: Horizon 6 System Components . . . . . . . . . . . . . . . . . . . . . . . . . . . . . . . . . . . . . . . 10
Figure 3: Hardware Components . . . . . . . . . . . . . . . . . . . . . . . . . . . . . . . . . . . . . . . . . . . . . . 11
Figure 4: Software Components . . . . . . . . . . . . . . . . . . . . . . . . . . . . . . . . . . . . . . . . . . . . . . 11
Figure 5: View Pod and Block . . . . . . . . . . . . . . . . . . . . . . . . . . . . . . . . . . . . . . . . . . . . . . . . . 13
Figure 6: View Management Block . . . . . . . . . . . . . . . . . . . . . . . . . . . . . . . . . . . . . . . . . . . . 14
Figure 7: View Desktop Block . . . . . . . . . . . . . . . . . . . . . . . . . . . . . . . . . . . . . . . . . . . . . . . . . 15
Figure 8: View Planner 3.5 Architecture . . . . . . . . . . . . . . . . . . . . . . . . . . . . . . . . . . . . . . . . 16
Figure 9: Linked-Clone Test Pools . . . . . . . . . . . . . . . . . . . . . . . . . . . . . . . . . . . . . . . . . . . . . 18
Figure 10: AppStack for Linked Clones . . . . . . . . . . . . . . . . . . . . . . . . . . . . . . . . . . . . . . . . 20
Figure 11: AppStack for RDSH Servers . . . . . . . . . . . . . . . . . . . . . . . . . . . . . . . . . . . . . . . . 20
Figure 12: Linked-Clone Workload Test – View Planner Score Comparison . . . . . . . . . 21
Figure 13: Linked-Clone Workload Test – View Planner Latency Comparison . . . . . . . 22
Figure 14: Linked-Clone Workload Test – ESXi CPU Usage (MHz) Comparison . . . . . 23
Figure 15: Linked-Clone Workload Test – ESXi Memory Consumed (GB) Comparison . . . .24
Figure 16: Linked-Clone Workload Test – ESXi Memory Active (GB) Comparison . . . 25
Figure 17: Linked-Clone Workload Test – ESXi Reads per Second Comparison . . . . . 26
Figure 18: Linked-Clone Workload Test – ESXi Writes per Second Comparison . . . . . 27
Figure 19: Time to Provision 700 Linked Clones Against Average ESXi CPU Usage . . 28
Figure 20: Power-On and AD Login Test for 700 Virtual Desktops on Virtual SAN . . . 29
Figure 21: Virtual SAN Observer – Client Layer Statistics . . . . . . . . . . . . . . . . . . . . . . . . 30
Figure 22: ESXi Host Advanced System Settings – Enable CBRC . . . . . . . . . . . . . . . . . . 31
Figure 23: View Console – vCenter Settings for View Storage Accelerator (CBRC) . . 31
Figure 24: Virtual SAN Observer – CBRC . . . . . . . . . . . . . . . . . . . . . . . . . . . . . . . . . . . . . . . 32
Figure 25: Virtual SAN Observer – Disk Layer Statistics . . . . . . . . . . . . . . . . . . . . . . . . . . 33
Figure 26: Office 2010 AppStack Used for Refresh Test . . . . . . . . . . . . . . . . . . . . . . . . . . 34
Figure 27: Sample Desktop Before Delta Increase . . . . . . . . . . . . . . . . . . . . . . . . . . . . . . . 34
Figure 28: Sample Desktop – Post-Delta Increase
(101 MB of Files Written to C: Drive) . . . . . . . . . . . . . . . . . . . . . . . . . . . . . . . . . . . . . . . . . 35
Figure 29: Time to Refresh Desktop Pool with and Without AppStack Attached . . . . 35
Figure 30: Time to Recompose a Desktop Pool with and Without AppStack . . . . . . . 36
Figure 31: ESXi Host – Simulated Hardware Failure . . . . . . . . . . . . . . . . . . . . . . . . . . . . . . 37
Figure 32: Simulated ESXi Host Hardware Failure – AppStack Replica
Component Absent . . . . . . . . . . . . . . . . . . . . . . . . . . . . . . . . . . . . . . . . . . . . . . . . . . . . . . . . . 38
Figure 33: ESXi Advanced Settings – Setting Rebuild Timer . . . . . . . . . . . . . . . . . . . . . . 38
Figure 34: Virtual SAN Object Components – AppStack with FTT=2 . . . . . . . . . . . . . . 40

VMware Horizon 6 with App Volumes and Virtual SAN Reference Architecture
T E C H N I C A L W H I T E PA P E R / 5
Figure 35: vSphere – Create New Storage Policy . . . . . . . . . . . . . . . . . . . . . . . . . . . . . . . . 40
Figure 36: AppStack After New FTT=3 Storage Policy Applied . . . . . . . . . . . . . . . . . . . 41
Figure 37: RDSH Test Pools . . . . . . . . . . . . . . . . . . . . . . . . . . . . . . . . . . . . . . . . . . . . . . . . . . . 42
Figure 38: RDSH Test Images . . . . . . . . . . . . . . . . . . . . . . . . . . . . . . . . . . . . . . . . . . . . . . . . . 43
Figure 39: RDSH – Departmental AppStack Used in Testing . . . . . . . . . . . . . . . . . . . . . . 45
Figure 40: RDSH Workload Test – View Planner Score Comparison . . . . . . . . . . . . . . . . 45
Figure 41: RDSH Workload Test – View Planner Latency Comparison . . . . . . . . . . . . . 46
Figure 42: RDSH Workload Test – ESXi CPU Usage (MHz) Comparison . . . . . . . . . . . . 47
Figure 43: Linked-Clone Pools with and Without Writable Volumes . . . . . . . . . . . . . . . 49
Figure 44: Writable Volumes Workload Test – View Planner Latency Comparison . . 50
Figure 45: Time to Create Writable Volumes Against IOPS . . . . . . . . . . . . . . . . . . . . . . . 52
Figure 46: Time to Create Writable Volumes Against Write Rate . . . . . . . . . . . . . . . . . . 53
Figure 47: vDS Configuration . . . . . . . . . . . . . . . . . . . . . . . . . . . . . . . . . . . . . . . . . . . . . . . . . 57
Figure 48: View Configuration . . . . . . . . . . . . . . . . . . . . . . . . . . . . . . . . . . . . . . . . . . . . . . . . 59
Figure 49: RDSH Farm . . . . . . . . . . . . . . . . . . . . . . . . . . . . . . . . . . . . . . . . . . . . . . . . . . . . . . . 62
Figure 50: App Volumes Deployment . . . . . . . . . . . . . . . . . . . . . . . . . . . . . . . . . . . . . . . . . . 63
Figure 51: Reconfiguring the App Volumes Manager Timeout . . . . . . . . . . . . . . . . . . . . 64
Figure 52: Virtual SAN Cluster ESXi Configuration . . . . . . . . . . . . . . . . . . . . . . . . . . . . . . . 64
Figure 53: Virtual SAN Disk Group . . . . . . . . . . . . . . . . . . . . . . . . . . . . . . . . . . . . . . . . . . . . . 65
Figure 54: Virtual SAN Cluster Resources . . . . . . . . . . . . . . . . . . . . . . . . . . . . . . . . . . . . . . 65
Figure 55: View Virtual SAN Storage Policy Integration . . . . . . . . . . . . . . . . . . . . . . . . . . 67
Figure 56: Virtual SAN Failures to Tolerate – Replica Disk . . . . . . . . . . . . . . . . . . . . . . . . 68
Figure 57: Virtual SAN Failures to Tolerate – Floating Linked-Clone OS Disk . . . . . . . 69
Figure 58: Desktop with App Volumes AppStack Attached . . . . . . . . . . . . . . . . . . . . . . 70
Figure 59: Desktop with an App Volumes AppStack Attached . . . . . . . . . . . . . . . . . . . . 77
Figure 60: View with App Volumes Group Policies . . . . . . . . . . . . . . . . . . . . . . . . . . . . . . 79
Figure 61: PCoIP Group Policy . . . . . . . . . . . . . . . . . . . . . . . . . . . . . . . . . . . . . . . . . . . . . . . . 80
Figure 62: Redirection Group Policy . . . . . . . . . . . . . . . . . . . . . . . . . . . . . . . . . . . . . . . . . . . 81
Figure 63: GPO to Add Multiple App Volumes Manager Servers . . . . . . . . . . . . . . . . . . 82
Figure 64: vRealize Operations for Horizon Architecture . . . . . . . . . . . . . . . . . . . . . . . . . 86
Figure 65: Linked-Clone Workload Test – ESXi Read Rate (KBps) Comparison . . . . . 91
Figure 66: Linked-Clone Workload Test – ESXi Write Rate (KBps) Comparison . . . . . 92
Figure 67: RDSH Workload Test – ESXi Memory Consumed (GB) Comparison . . . . . . 93
Figure 68: RDSH Workload Test – ESXi Memory Active (GB)
Comparison . . . . . . . . . . . . . . . . . . . . . . . . . . . . . . . . . . . . . . . . . . . . . . . . . . . . . . . . . . . . . . . 94
Figure 69: RDSH Workload Test – ESXi Storage Reads per Second Comparison . . . . 95
Figure 70: RDSH Workload Test – ESXi Storage Writes per Second Comparison . . . . 96
Figure 71: RDSH Workload Test – ESXi Read Rate (KBps) Comparison . . . . . . . . . . . . 97
Figure 72: RDSH Workload Test – ESXi Write Rate (KBps) Comparison . . . . . . . . . . . . 98

VMware Horizon 6 with App Volumes and Virtual SAN Reference Architecture
T E C H N I C A L W H I T E PA P E R / 6
Figure 73: RDSH Workload Test – ESXi Network Receive Rate (KBps) Comparison . 99
Figure 74: RDSH Workload Test – ESXi Network Transmit Rate (KBps) Comparison . . 100
Figure 75: Writable Volumes Test – ESXi CPU Usage (MHz) Comparison . . . . . . . . . 101
Figure 76: Writable Volumes Test – ESXi Memory Active (GB) Comparison . . . . . . . 102
Figure 77: Writable Volumes Test – ESXi Memory Consumed (GB) Comparison . . . 103
Figure 78: Writable Volumes Test – ESXi Reads per Second Comparison . . . . . . . . . 104
Figure 79: Writable Volumes Test – ESXi Writes per Second Comparison . . . . . . . . . 105
Figure 80: Writable Volumes Test – ESXi Read Rate (KBps) Comparison . . . . . . . . . 106
Figure 81: Writable Volumes Test – ESXi Write Rate (KBps) Comparison . . . . . . . . . 107

VMware Horizon 6 with App Volumes and Virtual SAN Reference Architecture
T E C H N I C A L W H I T E PA P E R / 7
List of Tables
Table 1: View Planner 3.5 Test Operations . . . . . . . . . . . . . . . . . . . . . . . . . . . . . . . . . . . . . . 17
Table 2: Linked-Clone Test Pools – Configuration . . . . . . . . . . . . . . . . . . . . . . . . . . . . . . . . 19
Table 3: Linked-Clone Workload Test – View Planner Score Metrics . . . . . . . . . . . . . . . 21
Table 4: Linked-Clone Workload Test – ESXi CPU Usage (MHz) Metrics . . . . . . . . . . . . 23
Table 5: Linked-Clone Workload Test – ESXi Memory Consumed (GB) Metrics . . . . . . 24
Table 6: Linked-Clone Workload Test – ESXi Memory Active (GB) Metrics . . . . . . . . . . 25
Table 7: Linked-Clone Workload Test – ESXi Reads per Second Metrics . . . . . . . . . . . . 26
Table 8: Linked-Clone Workload Test ESXi Writes per Second Comparison . . . . . . . . . 27
Table 9: RDSH Virtual Machine Specifications with and Without AppStacks . . . . . . . . 44
Table 10: RDSH Workload Test – ESXi CPU Usage (MHz) Metrics . . . . . . . . . . . . . . . . . 47
Table 11: RDSH Workload Test – ESXi Metrics Summary . . . . . . . . . . . . . . . . . . . . . . . . . 48
Table 12: Workload Testing – Linked Clones with and Without Writable Volume . . . . 51
Table 13: Datastore Metrics for Creation of 100 Writable Volumes . . . . . . . . . . . . . . . . 52
Table 14: vCenter Server Configuration . . . . . . . . . . . . . . . . . . . . . . . . . . . . . . . . . . . . . . . . 54
Table 15: vSphere Clusters . . . . . . . . . . . . . . . . . . . . . . . . . . . . . . . . . . . . . . . . . . . . . . . . . . . 54
Table 16: ESXi CPU Sizing – Virtual SAN and Linked Clones . . . . . . . . . . . . . . . . . . . . . . 55
Table 17: ESXi CPU Sizing – RDSH Servers . . . . . . . . . . . . . . . . . . . . . . . . . . . . . . . . . . . . . 56
Table 18: ESXi Memory Sizing – Virtual SAN and Linked Clones . . . . . . . . . . . . . . . . . . . 56
Table 19: ESXi Memory Sizing – RDSH Servers . . . . . . . . . . . . . . . . . . . . . . . . . . . . . . . . . . 57
Table 20: vDS Configuration . . . . . . . . . . . . . . . . . . . . . . . . . . . . . . . . . . . . . . . . . . . . . . . . . . 58
Table 21: View VM Hardware Specifications . . . . . . . . . . . . . . . . . . . . . . . . . . . . . . . . . . . . 60
Table 22: View vCenter Settings . . . . . . . . . . . . . . . . . . . . . . . . . . . . . . . . . . . . . . . . . . . . . . . 60
Table 23: View Linked-Clone Pool Settings . . . . . . . . . . . . . . . . . . . . . . . . . . . . . . . . . . . . . 62
Table 24: Virtual SAN Objects and Components . . . . . . . . . . . . . . . . . . . . . . . . . . . . . . . . 66
Table 25: Virtual SAN Storage Policy Capabilities . . . . . . . . . . . . . . . . . . . . . . . . . . . . . . . 66
Table 26: Virtual SAN FTT Requirements . . . . . . . . . . . . . . . . . . . . . . . . . . . . . . . . . . . . . . . 67
Table 27: Maximum Number of App Volumes AppStacks or Writable Volumes
per View Pool Type . . . . . . . . . . . . . . . . . . . . . . . . . . . . . . . . . . . . . . . . . . . . . . . . . . . . . . . . . 71
Table 28: Linked-Clone Pool (No Disposable or Persistent Disk) with
Maximum AppStacks . . . . . . . . . . . . . . . . . . . . . . . . . . . . . . . . . . . . . . . . . . . . . . . . . . . . . . . 74
Table 29: App Volumes Datastore Sizing . . . . . . . . . . . . . . . . . . . . . . . . . . . . . . . . . . . . . . . 76
Table 30: RDSH Datastore Sizing . . . . . . . . . . . . . . . . . . . . . . . . . . . . . . . . . . . . . . . . . . . . . . 78
Table 31: SQL Server Configuration . . . . . . . . . . . . . . . . . . . . . . . . . . . . . . . . . . . . . . . . . . . . 84
Table 32: Windows File Services Configuration . . . . . . . . . . . . . . . . . . . . . . . . . . . . . . . . . 85
Table 33: vRealize Operations Specifications . . . . . . . . . . . . . . . . . . . . . . . . . . . . . . . . . . . 87
Table 34: Resiliency of Horizon Services . . . . . . . . . . . . . . . . . . . . . . . . . . . . . . . . . . . . . . . . 88
Table 35: Linked-Clone Workload Test – ESXi Read Rate (KBps) Metrics . . . . . . . . . . . 92

VMware Horizon 6 with App Volumes and Virtual SAN Reference Architecture
T E C H N I C A L W H I T E PA P E R / 8
Table 36: Linked-Clone Workload Test – ESXi Write Rate (KBps) Metrics . . . . . . . . . . . 92
Table 37: RDSH Workload Test – ESXi Memory Consumed (GB) Metrics . . . . . . . . . . . 93
Table 38: RDSH Workload Test – ESXi Memory Active (GB) Metrics . . . . . . . . . . . . . . . 94
Table 39: RDSH Workload Test – ESXi Storage Reads per Second Metrics . . . . . . . . . . 95
Table 40: RDSH Workload Test – ESXi Storage Writes per Second Metrics . . . . . . . . . 96
Table 41: RDSH Workload Test – ESXi Read Rate (KBps) Metrics . . . . . . . . . . . . . . . . . . 97
Table 42: RDSH Workload Test – ESXi Write Rate (KBps) Metrics . . . . . . . . . . . . . . . . . 98
Table 43: RDSH Workload Test – ESXi Network Receive Rate (KBps) Metrics . . . . . . . 99
Table 44: RDSH Workload Test – ESXi Network Transmit Rate (KBps) Metrics . . . . . 100
Table 45: Writable Volumes Test – ESXi CPU Usage (MHz) Metrics . . . . . . . . . . . . . . . 101
Table 46: Writable Volumes Test – ESXi Memory Active (GB) Metrics . . . . . . . . . . . . . 102
Table 47: Writable Volumes Test – ESXi Memory Consumed (GB) Metrics . . . . . . . . . 103
Table 48: Writable Volumes Test – ESXi Reads per Second Metrics . . . . . . . . . . . . . . . 104
Table 49: Writable Volumes Test – ESXi Writes per Second Metrics . . . . . . . . . . . . . . . 105
Table 50: Writable Volumes Test – ESXi Read Rate (KBps) Metrics . . . . . . . . . . . . . . . 106
Table 51: Writable Volumes Test – ESXi Write Rate (KBps) Metrics . . . . . . . . . . . . . . . 107
Table 52: Bill of Materials . . . . . . . . . . . . . . . . . . . . . . . . . . . . . . . . . . . . . . . . . . . . . . . . . . . . 109

T E C H N I C A L W H I T E PA P E R / 9
VMware Horizon 6 with App Volumes and Virtual SAN Reference Architecture
Executive Summary This paper describes a deployment that supports over 960 users—700 View linked-clone desktops and 260 RDSH desktop sessions—based on VMware Horizon® 6 Enterprise Edition, which includes VMware App Volumes™ and VMware Virtual SAN™.
It is intended to help IT architects, consultants, and administrators involved in the early phases of planning, design, and deployment by offering a standard, repeatable, and highly scalable design that can easily be adapted to specific environments and requirements.
The reference environment was subjected to rigorous performance benchmarking, workload simulation, and operations testing. Performance tests, including workload testing with VMware View Planner and View operations testing, were also performed on the hardware configuration. The results can be characterized as follows.
Less CPU usage thanTraditional Apps
4% less average CPU usage for linked clonesand 5% less for RDSH desktop sessions than with Traditional Apps
Less memory consumedthan Traditional Apps
10% less average ESXi memory consumed with AppStacks than with Traditional Apps
Linked cloneswith AppStack
Passed View Planner medium workload test: 100 linked clones per ESXi
Linked clones withAppStack and ThinApp
Passed View Planner medium workload test: 100 linked clones per ESXi
View RDSH desktopsessions with AppStack
Passed View Planner medium workload test: 130 RDSH sessions per ESXi
Time to provision700 linked clones
on Virtual SAN
60 minutes
Time to refresh700 linked clones
on Virtual SAN
29 minutes
Time to recompose 700 linked clones
on Virtual SAN
77 minutes
Virtual SANnode failure
2 minutes to restore desktop session
Outstanding Desktop Performance • Performance similar to high-end physical computers
• Excellent user experience characteristics, even with diverse use cases and burst-heavy workloads
• Consistent, first-rate performance across di�erent application delivery methods
Increased Desktop Consolidation• Reduced CPU and memory usage with App Volumes
• Improved desktop consolidation ratio
Fast Desktop Operations • User desktop pools provisioned quickly
• Rapid desktop maintenance
• Enterprise use cases up and running the same day as requested
• Dynamic application delivery
Ease of Maintenance• Entire environment maintained end-to-end by one administrator
• Effortless storage provisioning and management with Virtual SAN
• Application delivery and patching with App Volumes
CPU
Figure 1: Highlights

T E C H N I C A L W H I T E PA P E R / 1 0
VMware Horizon 6 with App Volumes and Virtual SAN Reference Architecture
IntroductionHorizon 6 enables the delivery of virtualized or remote desktops and applications through a single virtual desktop infrastructure (VDI) platform, providing end users with access to all their desktops and applications through a single, unified workspace. Horizon provides
•Application remoting, based on Microsoft Remote Desktop Session Host (RDSH) technology
•Real-time application delivery and lifecycle management with App Volumes
Clients
VMware vSphere
THINAPP
Apps
Apps
Apps
RDSH
RDSH
RDSH
Linked-CloneDesktops
ThinApp
App VolumesManager
Composer
vCenter
View ConnectionServer
View SecurityServer
vRealizeOperations
RDSH Hosts
Workspace
Figure 2: Horizon 6 System Components
T E C H N I C A L W H I T E PA P E R / 1 1
VMware Horizon 6 with App Volumes and Virtual SAN Reference Architecture
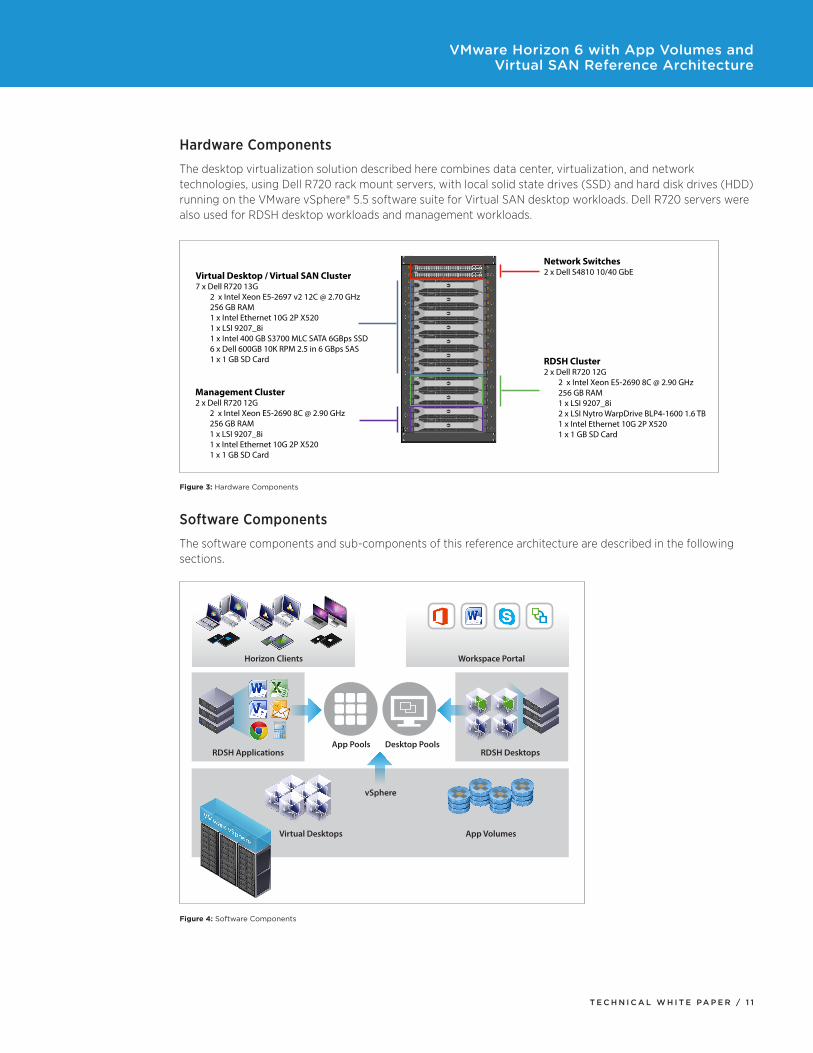
Hardware Components
The desktop virtualization solution described here combines data center, virtualization, and network technologies, using Dell R720 rack mount servers, with local solid state drives (SSD) and hard disk drives (HDD) running on the VMware vSphere® 5.5 software suite for Virtual SAN desktop workloads. Dell R720 servers were also used for RDSH desktop workloads and management workloads.
Virtual Desktop / Virtual SAN Cluster7 x Dell R720 13G
2 x Intel Xeon E5-2697 v2 12C @ 2.70 GHz256 GB RAM1 x Intel Ethernet 10G 2P X5201 x LSI 9207_8i1 x Intel 400 GB S3700 MLC SATA 6GBps SSD6 x Dell 600GB 10K RPM 2.5 in 6 GBps SAS1 x 1 GB SD Card
Network Switches2 x Dell S4810 10/40 GbE
RDSH Cluster2 x Dell R720 12G
2 x Intel Xeon E5-2690 8C @ 2.90 GHz256 GB RAM1 x LSI 9207_8i2 x LSI Nytro WarpDrive BLP4-1600 1.6 TB1 x Intel Ethernet 10G 2P X5201 x 1 GB SD Card
Management Cluster2 x Dell R720 12G
2 x Intel Xeon E5-2690 8C @ 2.90 GHz256 GB RAM1 x LSI 9207_8i1 x Intel Ethernet 10G 2P X5201 x 1 GB SD Card
Figure 3: Hardware Components
Software Components
The software components and sub-components of this reference architecture are described in the following sections.
Horizon Clients Workspace Portal
RDSH Applications
Virtual Desktops App Volumes
App Pools Desktop Pools
vSphere
RDSH Desktops
Figure 4: Software Components

T E C H N I C A L W H I T E PA P E R / 1 2
VMware Horizon 6 with App Volumes and Virtual SAN Reference Architecture
VMware vSpherevSphere is a virtualization platform for building cloud infrastructures. It separates applications and operating systems from the underlying hardware so that existing applications see dedicated resources, but servers can be managed as a pool of resources.
VMware Horizon 6Horizon 6 delivers hosted virtual desktops and applications to end users through a single platform. Desktop and application services—including RDSH applications, applications packaged with VMware ThinApp®, software-as-a-service (SaaS) applications, and virtualized applications from Citrix—can all be accessed from a unified workspace across devices, locations, media, and connections.
VMware Virtual SANVirtual SAN is a hypervisor-converged, software-defined storage platform that is fully integrated with vSphere.
Virtual SAN uses a hybrid disk architecture, with flash-based devices for performance and magnetic disks for capacity and persistent data storage. Its distributed datastore is an object-store file system that uses the vSphere Storage Policy-Based Management (SPBM) feature to deliver centrally managed, application-centric storage services and capabilities. Administrators can specify storage attributes, such as capacity, performance, and availability, as a policy on a per-virtual machine basis. The policies dynamically self-tune and load-balance the system so that each virtual machine has the right level of resources.
Virtual SAN provides the ability to scale linearly, with each host capable of supporting approximately 100 users. This reference architecture ran 700 desktops on a Virtual SAN cluster with seven VMware ESXi™ hosts. VMware testing, however, has shown that View with Virtual SAN can scale up to 2,000 desktops on 20 ESXi hosts in a single cluster in vSphere 5.5.
VMware Workspace PortalHorizon 6 allows users to access desktops and applications through VMware Workspace™ Portal. Workspace Portal also provides IT a central place to entitle and deliver Windows applications, desktops, SaaS applications, ThinApp packaged applications, and XenApp applications.
Workspace Portal provides a single pane of glass that gives users convenient access to their applications and desktops, regardless of type. Applications can be made available by default, and users can see and rearrange the applications for which they have been granted entitlements.
VMware vRealize Operations for HorizonVMware vRealize™ Operations for Horizon is a monitoring solution that extends the capability of VMware vRealize Operations Manager™ to troubleshoot, monitor, and manage the health, capacity, and performance of View environments.
With advanced analytics, vRealize Operations for Horizon has the ability to learn normal operating parameters for infrastructure and user workloads. It offers proactive warnings and alerts based on dynamic thresholds (rather than hard thresholds) that adapt to each environment, and can send advance notifications before events affect end users.
VMware App VolumesApp Volumes provides real-time application delivery to end users and desktops. IT can use App Volumes to deliver applications and data to users without compromising the user experience.

T E C H N I C A L W H I T E PA P E R / 1 3
VMware Horizon 6 with App Volumes and Virtual SAN Reference Architecture
Modular Pod and Block Design
This Horizon 6 reference architecture is based on the proven approach of scalable, modular pod and block design principles.
View SecurityServer
View Connection Server
View Connection Server
App VolumesManagers
vRealizeOperations
WorkspacePortal
Storage
Virtual SAN
vSphere Cluster
Shared Storage
vSphere ESXi Cluster(7 hosts)
vSphere ESXi Management Cluster
View SecurityServer
View SecurityServer
View Connection Server
View Connection Server
App VolumesManager
Management Block
View Pod
Desktop Block
vRealizeOperations
WorkspacePortal
vSphere Distributed Switch
vSphere Distributed Switch
vCenter
Linked-Clone Desktop Pool
vSphere Cluster
vSphere ESXi Cluster(2 hosts)
RDSH Desktop Pool
Figure 5: View Pod and Block
A View pod is a logical administrative entity that can support up to 10,000 users or sessions. That limit can be increased to 20,000 users or sessions with the use of two to four pods. In this reference architecture, the pod supported 960 users or sessions, consisting of 700 linked-clone virtual desktops and 260 RDSH sessions.
Each pod contains a management block and one or more desktop blocks. View, App Volumes, and Workspace Portal server workloads were placed in the management block of a Horizon 6 pod. Desktop workloads were placed in the desktop block. The use of distinct clusters and ESXi hosts kept the desktop and RDSH server workloads separated.

T E C H N I C A L W H I T E PA P E R / 1 4
VMware Horizon 6 with App Volumes and Virtual SAN Reference Architecture
Management Block DesignThe management block contained all the View server virtual machines. In customer production deployments, one VMware vCenter Server™ is typically deployed for every 2,000 virtual desktops. Although View can support up to 10,000 desktop virtual machines in a single VMware vCenter™ instance, a limit of 2,000 desktops improves power and provisioning operation times.
Each View Connection Server supports a maximum of 2,000 concurrent sessions. An additional View Connection Server is typically deployed for redundancy. Two additional View Connection Servers are paired with View security servers to provide secure, redundant external access to View desktops. Each security server can also handle up to 2,000 connections.
2 x ESXi Servers32C, 512 GB RAM
Server VMs
2 x 1 TB Datastores - Production1 x 250 GB Datastore - ISOs/Images
2 x View Security Servers
4 x View Servers(2 external, 2 internal)
Server VMs
Server VMs 2 x Workspace Portal VA
2 x Active DirectoryServer VMs
Server VMs 2 x App Volumes Managers
1 x vRealize Operations Manager VA
Server VMs
Server VMs 2 x SQL Servers
2 x File ServersServer VMs
vCenter
View Management Block
ESXi Cluster
Figure 6: View Management Block
•A single Workspace vApp can scale to as many as 30,000 users. To provide redundancy, it is sufficient to deploy a single instance and add virtual appliances for each component.
•A single vRealize Operations Manager vApp can handle up to 10,000 virtual desktops.
•An App Volumes Manager server can handle 10,000 user-to-AppStack sessions at a time. Additional App Volumes managers can be added for load balancing and redundancy.
•A clustered SQL Server is capable of supporting the database requirements of all the core management block services.

T E C H N I C A L W H I T E PA P E R / 1 5
VMware Horizon 6 with App Volumes and Virtual SAN Reference Architecture
Desktop Block DesignIn a standard View reference architecture design, a desktop block, supported by a dedicated vCenter instance, supports up to 2,000 concurrent sessions. Multiple desktop blocks within a pod can support up to 10,000 concurrent sessions.
In this reference architecture, the desktop block contained two vSphere clusters to isolate the differentiated workloads of hosted virtual desktop instances from the RDSH server instances:
•A seven-node ESXi cluster with a Virtual SAN volume supporting 700 linked-clone virtual desktops
•A two-node vSphere cluster supporting 260 RDSH sessions
Shared storage allows RDSH servers to recover quickly and run on another host in the cluster in the event of a hardware fault on an ESXi host. The virtual desktops are floating desktops, so a user can quickly resume desktop connectivity on another virtual desktop on a different ESXi host.
7 x ESXi Hosts168 Cores, 1792 GB RAM
1 x Virtual SAN22.9 TB Volume
Floating 700 x Virtual Desktops1 vCPU, 2 GB RAMMedium Workload
vCenter
View Desktop Block
ESXi Cluster
2 x ESXi Hosts32 Cores, 512 GB RAM
2 x 1.6 TB Datastore
Floating 260+ x RDSH Desktop SessionsMedium Workload
ESXi Cluster
Figure 7: View Desktop Block

T E C H N I C A L W H I T E PA P E R / 1 6
VMware Horizon 6 with App Volumes and Virtual SAN Reference Architecture
Testing and ResultsThe tools, tests, and configurations used in this reference architecture are described in the following sections.
Workload Testing Tool
VMware View Planner 3.5 was used to generate a synthetic workload for the 260 RDSH sessions and 700 virtual desktops. View Planner simulates application workloads for various user types by running applications typically used in a Windows desktop environment. During the execution of a workload, applications are randomly called to perform common user operations.
Storage
PhysicalServers
WebInterface
VMware vCenter Horizon
Harness
Virtual Client VMs
RemoteDisplay
Protocol
ViewPlanner Appliance Manage
Desktop Management
Client Management
Storage
PhysicalServers
Virtual Desktops
Figure 8: View Planner 3 .5 Architecture

T E C H N I C A L W H I T E PA P E R / 1 7
VMware Horizon 6 with App Volumes and Virtual SAN Reference Architecture
View Planner OperationsThe View Planner workload consisted of seven applications, performing a total of 35 user operations. These user operations were separated into three groups: interactive operations (Group A); I/O operations (Group B); and background load operations (Group C). The operations in Group A were used to determine quality of service (QoS). The operations in Group C were used to generate additional load. The same workload was applied to the RDSH sessions and the virtual desktop sessions.
GROUP A – INTERACTIVE OPERATIONS
GROUP B – I/O OPERATIONS
GROUP C – BACKGROUND LOAD OPERATIONS
AdobeReader: Browse AdobeReader: Open 7zip: Compress
AdobeReader: Close Excel_Sort: Open PowerPoint: SaveAs
AdobeReader: Maximize Excel_Sort: Save Video: Play
AdobeReader: Minimize Firefox: Open
Excel_Sort: Close IE_ApacheDoc: Open
Excel_Sort: Compute IE_WebAlbum: Open
Excel_Sort: Entry PowerPoint: Open
Excel_Sort: Maximize Video: Open
Excel_Sort: Minimize Word: Open
Firefox: Close Word: Save
IE_ApacheDoc: Browse
IE_ApacheDoc: Close
IE_WebAlbum: Browse
IE_WebAlbum: Close
PowerPoint: AppendSlides
PowerPoint: Close
PowerPoint: Maximize
PowerPoint: ModifySlides
PowerPoint: RunSlideShow
Video: Close
Word: Close
Word: Maximize
Word: Minimize
Word: Modify
Table 1: View Planner 3 .5 Test Operations

T E C H N I C A L W H I T E PA P E R / 1 8
VMware Horizon 6 with App Volumes and Virtual SAN Reference Architecture
View Planner Run PhasesView Planner performed a total of five iterations in test runs:
•Ramp up (first iteration)
•Steady state (second, third, and fourth iterations)
•Ramp down (fifth iteration)
During each iteration, View Planner reported the latencies for each operation performed in each virtual machine.
View Planner Quality of ServiceQoS was determined separately for Group A and Group B user operations, with default thresholds of 1 second for Group A and 6 seconds for Group B and 95 percent of operations required to complete within the respective thresholds.
Linked-Clone Virtual Desktops on Virtual SAN
User operation workload testing was carried out on 700 linked-clone floating desktops running on Virtual SAN.
Workload Testing – Test CasesThree pools of 700 virtual desktops underwent View Planner 3.5 workload testing. Each pool was based on a different image and used a different application deployment model. The virtual desktop images and application deployment models are described below and illustrated in Figure 9.
•Traditional Desktop – Windows 7 SP1 (32-bit) with test applications and View Planner agent installed on the desktop image (Traditional Apps)
•Desktop with AppStack – Windows 7 SP1 (32-bit) with test applications and View Planner agent installed in an AppStack, and App Volumes Agent in the Guest OS
•Desktop with AppStack and ThinApp – Windows 7 SP1 (32-bit) with Microsoft Office 2010 installed on the desktop image and ThinApp (Adobe Acrobat and Firefox) and View Planner agent installed in an AppStack, with App Volumes Agent installed in the Guest OS
Desktop with AppStack
AppStack
Settings
Traditional Apps Traditional Apps
Traditional Desktop
Settings
View PlannerAgent
App Volumes Agent
GuestOS
Windows 7
Desktop with AppStack and ThinApp
AppStack
Settings
Traditional Apps
Windows 7
ThinApp ThinApp
Windows 7
View PlannerAgent
View PlannerAgent
App Volumes Agent
GuestOS
Figure 9: Linked-Clone Test Pools

T E C H N I C A L W H I T E PA P E R / 1 9
VMware Horizon 6 with App Volumes and Virtual SAN Reference Architecture
ATTRIBUTE TRADITIONAL DESKTOP
DESKTOP WITH APPSTACK
DESKTOP WITH APPSTACK AND THINAPP
Desktop OS Windows 7 Enterprise Edition SP1 (32-bit)
Windows 7 Enterprise Edition SP1 (32-bit)
Windows 7 Enterprise Edition SP1 (32-bit)
VM hardware v9 v9 v9
CPU 1 1 1
Memory 2048 MB 2048 MB 2048 MB
Memory reserved 0 MB 0 MB 0 MB
Video RAM 35 MB 35 MB 35 MB
3D graphics Off Off Off
NICs 1 1 1
Virtual network adapter VMXNet3 adapter VMXNet3 adapter VMXNet3 adapter
Virtual SCSI controller 0 Paravirtual Paravirtual Paravirtual
Virtual disk – VMDK 1 24 GB (OS C:\) 24 GB (OS C:\) 24 GB (OS C:\)
Virtual disk – VMDK 2 1 GB (View Planner Data E:\)
1 GB (View Planner Data E:\)
1 GB (View Planner Data E:\)
Virtual floppy drive Removed Removed Removed
Virtual CD/DVD drive Removed Removed Removed
Traditional apps •AdobeAcrobat10.1.4•Firefox7.01•InternetExplorer10•Office2010SP2•ViewPlanner3.5agent
Internet Explorer 10 •InternetExplorer10•Office2010
AppStack 1 (6.2 GB) 1 (1.4 GB)
AppStack applications •AdobeAcrobat10.1.4•Firefox7.01•Office2010•ViewPlanner3.5agent
•AdobeAcrobat10.1.4 (ThinApp)•Firefox7.01(ThinApp)•ViewPlanner3.5agent
App Volumes Agent 2.6.0 build 3106 2.6.0 – build 3106
VMware Tools™ 9.4.11 – build 2400950 9.4.11 – build 2400950 9.4.11 – build 2400950
View Agent 6.0.2 – build 2331487 6.0.2 – build 2331487 6.0.2 – build 2331487
Table 2: Linked-Clone Test Pools – Configuration
Each image was optimized with the VMware OS Optimization tool in accordance with the Optimization Guide for Windows 7 and Windows 8 Virtual Desktops in Horizon with View and in conformity with the View Planner 3.5 test standards, which restrict the versions of applications to be tested.

T E C H N I C A L W H I T E PA P E R / 2 0
VMware Horizon 6 with App Volumes and Virtual SAN Reference Architecture
Each desktop had a primary OS disk and a secondary 1 GB thick disk containing View Planner 3.5 data files. Each desktop was cloned from the same base OS image and had the same OS optimizations applied. A fourth clone was used as a clean desktop to provision the AppStacks.
Each AppStack was stored on the same Virtual SAN datastore as the test virtual desktops.
The AppStack named W7-All was provisioned to a template desktop with Adobe Reader, Firefox, Office, Office SP2, and View Planner. The size of the finished AppStack was 6283 MB. This AppStack was assigned to an AD user group for the Desktop with AppStack pool.
Figure 10: AppStack for Linked Clones
The AppStack named W7-ThinappAppStack was provisioned to a template desktop, and the Adobe Reader and Mozilla Firefox ThinApp packages were copied across and registered on the Win7 Guest OS with Thinreg.exe. View Planner agent was then installed in the AppStack. This AppStack was assigned to an AD user group for the Desktop with AppStack and ThinApp pool.
Figure 11: AppStack for RDSH Servers

T E C H N I C A L W H I T E PA P E R / 2 1
VMware Horizon 6 with App Volumes and Virtual SAN Reference Architecture
View Planner 3.5 Test ResultsFive iterations of View Planner medium workload were executed on each of the three desktop pools. During each iteration, the desktops executed the following operations to simulate 700 end users working on the desktop pool with 100 percent concurrency:
•Interactive (Group A)
•I/O operations (Group B)
•Background load (Group C)
Group A and B operations determine the QoS of the desktop and ensure a satisfactory end-user experience. The View Planner passing marks are: Group A < 1 second, Group B < 6 seconds.
AppStack with ThinApps
Time (in seconds)
0
Group A (≤ 1.0)
QoS Groups
Group B (≤ 6.0)
View Planner 3.5 Benchmark ScoreTraditional Apps Versus AppStack Versus AppStack with ThinApps
AppStack Traditional Apps
1 2 3 4 5 6
Figure 12: Linked-Clone Workload Test – View Planner Score Comparison
Each of the three pools met Group A and B requirements and passed the View Planner benchmark. AppStack and AppStack with ThinApp had some overhead, but it was light.
GROUP POOL TIME
Group A Traditional 0.75 seconds
AppStack with ThinApp 0.77 seconds
AppStack 0.89 seconds
Group B Traditional 2.66 seconds
AppStack with ThinApp 3.08 seconds
AppStack 3.11 seconds
Table 3: Linked-Clone Workload Test – View Planner Score Metrics
The most noticeable difference between the three test pools was in latencies for the AppStack with the ThinApp versions of Firefox and Adobe Reader. ThinApp Firefox and ThinApp Adobe Reader file open operations took 1–2 seconds longer to launch and open documents than the AppStack and Traditional Apps versions. The AppStack pool had slightly lower application latencies in eight of the twenty-five Group A operations (AdobeReader: Browse, AdobeReader: Maximize, AdobeReader: Minimize, Excel Sort: Minimize, PPT: AppendSlides, PPT: Close, PPT: Maximize, Word: Save). The Traditional Apps pool had lower latencies for all Group B operations, with differences on the order of hundredths and thousandths of a second.

T E C H N I C A L W H I T E PA P E R / 2 2
VMware Horizon 6 with App Volumes and Virtual SAN Reference Architecture
Time (in seconds)
App
licat
ion
Ope
ratio
n
View Planner 3.5 Benchmark TestApplication Operation Execution TimesTraditional Apps Versus AppStack Versus AppStack with ThinApps
0 0.5 1 1.5 2 2.5 3 3.5 4 4.5 5
7zip-Compress
AdobeReader-Browse
AdobeReader-Close
AdobeReader-Maximize
AdobeReader-Minimize
AdobeReader-Open
Excel Sort-Close
Excel Sort-Compute
Excel Sort-Entry
Excel Sort-Maximize
Excel Sort-Minimize
Excel Sort-Open
Excel Sort-Save
Firefox-Close
Firefox-Open
IE ApacheDoc-Browse
IE ApacheDoc-Close
IE ApacheDoc-Open
IE WebAlbum-Browse
IE WebAlbum-Close
IE WebAlbum-Open
PPTx-AppendSlides
PPTx-Close
PPTx-Maximize
PPTx-Minimize
PPTx-ModifySlides
PPTx-Open
PPTx-RunSlideShow
PPTx-SaveAs
Video-Close
Video-Open
Word-Maximize
Word-Minimize
Word-Modify
Word-Open
Word-Save
AppStack with ThinApps AppStack Traditional Apps
Figure 13: Linked-Clone Workload Test – View Planner Latency Comparison

T E C H N I C A L W H I T E PA P E R / 2 3
VMware Horizon 6 with App Volumes and Virtual SAN Reference Architecture
Metrics were collected from the ESXi hosts in the Virtual SAN desktop cluster with a sample interval of 20 seconds. A comparison of the CPU usage for the clusters from each of the three View Planner workload test runs yields the following graph, showing average CPU usage per ESXi (approximately 100 virtual machines per host).
Time (in seconds)
CPU
Usa
ge (M
Hz)
AppStack with ThinApps
View Planner Workload TestESXi CPU Usage (MHz) for 100 Linked ClonesTraditional Apps Versus AppStack Versus AppStack with ThinApps
AppStack Traditional Apps
Figure 14: Linked-Clone Workload Test – ESXi CPU Usage (MHz) Comparison
Table 4 shows the average ESXi CPU usage for the three pools for the period from 40–100 minutes with the View Planner workload running concurrently on 700 desktops.
TRADITIONAL APPS APPSTACK APPSTACK WITH THINAPP
Average CPU Usage (MHz) 37,919 36,273 37,938
Maximum CPU Usage (MHz) 44,805 43,889 46,271
Table 4: Linked-Clone Workload Test – ESXi CPU Usage (MHz) Metrics
The AppStack Pool has 4 percent less average CPU usage and 2 percent less maximum CPU usage than Traditional Apps pool.
The memory consumed and active memory metrics are helpful for analyzing comparative memory usage on the ESXi host.
•Memory consumed is the amount of machine memory used on the host, including virtual machine memory, service console memory, and VMkernel memory.
•Active memory is the sum of the active guest physical memory of all powered-on virtual machines plus the memory used by basic VMkernel applications. Active memory is estimated by the VMkernel, based on the current workload on the hosts.

T E C H N I C A L W H I T E PA P E R / 2 4
VMware Horizon 6 with App Volumes and Virtual SAN Reference Architecture
Mem
ory
Usa
ge –
Con
sum
ed (G
B)
AppStack with ThinApps
View Planner Workload TestESXi Memory Consumed (GB) for 100 Linked ClonesTraditional Apps Versus AppStack Versus AppStack with ThinApps
AppStack Native Apps
Time (in minutes)
Figure 15: Linked-Clone Workload Test – ESXi Memory Consumed (GB) Comparison
Table 5 shows the average ESXi memory consumed for the three pools for the period from 40–100 minutes when the View Planner workload is running concurrently on 700 desktops.
TRADITIONAL APPS APPSTACK APPSTACK WITH THINAPP
Average Memory Consumed (GB) 224 202 222
Maximum Memory Consumed (GB) 224 203 222
Table 5: Linked-Clone Workload Test – ESXi Memory Consumed (GB) Metrics
The AppStack pool consumed 10 percent less average memory and 9.8 percent less maximum memory than the Traditional Apps pool.

T E C H N I C A L W H I T E PA P E R / 2 5
VMware Horizon 6 with App Volumes and Virtual SAN Reference Architecture
ESXi
Mem
ory
Activ
e (G
B)
AppStack with ThinApps
View Planner Workload TestESXi Memory Active (GB) for 100 Linked ClonesTraditional Apps Versus AppStack Versus AppStack with ThinApps
AppStack Native Apps
Time (in minutes)
Figure 16: Linked-Clone Workload Test – ESXi Memory Active (GB) Comparison
Table 6 shows the average ESXi active memory for the three pools for the period from 40–100 minutes when the View Planner workload is running concurrently on 700 desktops.
TRADITIONAL APPS APPSTACK APPSTACK WITH THINAPP
Average Active Memory (GB) 53 92 78
Maximum Active Memory (GB) 55 94 80
Table 6: Linked-Clone Workload Test – ESXi Memory Active (GB) Metrics
The Traditional Apps pool uses 53 percent less average active memory and 52 percent less maximum active memory than the AppStack pool.

T E C H N I C A L W H I T E PA P E R / 2 6
VMware Horizon 6 with App Volumes and Virtual SAN Reference Architecture
Aver
age
ESXi
Rea
ds (p
s)
AppStack with ThinApps
View Planner Workload TestESXi Reads for 100 Linked ClonesTraditional Apps Versus AppStack Versus AppStack with ThinApps
AppStack Traditional Apps
Time (in minutes)
Figure 17: Linked-Clone Workload Test – ESXi Reads per Second Comparison
Table 7 shows the results of an analysis of the reads per second statistics for the 40–100 minute period with the workload running concurrently on 700 desktops.
TRADITIONAL APPS APPSTACK APPSTACK WITH THINAPP
Average Reads per Second 2,634 1,614 2,092
Maximum Reads per Second 3,842 3,514 5,695
Table 7: Linked-Clone Workload Test – ESXi Reads per Second Metrics
The AppStack pool has 48 percent fewer average reads per second and 8.9 percent fewer maximum reads per second than the Traditional Apps pool.

T E C H N I C A L W H I T E PA P E R / 2 7
VMware Horizon 6 with App Volumes and Virtual SAN Reference Architecture
Aver
age
ESXi
Writ
es (p
s)AppStack with ThinApps
View Planner Workload TestESXi Writes for 100 Linked ClonesTraditional Apps Versus AppStack Versus AppStack with ThinApps
AppStack Traditional Apps
Time (in minutes)
Figure 18: Linked-Clone Workload Test – ESXi Writes per Second Comparison
Table 8 shows the results of an analysis of the writes per second statistics for the 40–100 minute period with the workload running concurrently on 700 desktops.
TRADITIONAL APPS APPSTACK APPSTACK WITH THINAPP
Average Writes per Second 1,473 1,327 1,505
Maximum Writes per Second 2,068 1,990 2,774
Table 8: Linked-Clone Workload Test ESXi Writes per Second Comparison
Findings of View Planner Workload TestsThe AppStack, Traditional Apps, and AppStack with ThinApp test cases all comfortably passed View Planner benchmark tests for this Virtual SAN configuration.
Resource usage:
•The AppStack pool had 4 percent less average CPU usage and 2 percent less maximum CPU usage than Traditional Apps when deployed on Virtual SAN.
•The AppStack pool had 10 percent less average memory consumed and 9.8 percent less maximum memory consumed than the Traditional Apps pool.
•The Traditional Desktop pool had 53 percent less average active memory and 52 percent less maximum memory active than the AppStack pool.
•The AppStack pool had 48 percent fewer average reads per second and 8.9 percent fewer maximum reads per second than the Traditional Apps pool.

T E C H N I C A L W H I T E PA P E R / 2 8
VMware Horizon 6 with App Volumes and Virtual SAN Reference Architecture
•The AppStack pool had 10 percent fewer average writes per second and 3.8 percent fewer maximum writes per second than the Traditional Apps pool.
Virtual SAN performance:
•Latency, congestion, and outstanding I/O were all minimal.
•Virtual SAN read cache hit rate operated at over 95 percent for almost the entire test period, and the write buffer was never more than 32 percent full.
•App Volumes and ThinApp work effectively together with no performance penalty other than the usual ThinApp launch time.
Operations TestingThe following sections describe the operations testing carried out on 700 linked-clone floating desktops running on Virtual SAN.
ProvisioningA new pool of 700 32-bit Windows 7 linked-clone virtual desktops was provisioned on the Virtual SAN datastore with an average of 100 desktops per ESXi host. To complete this task, View Composer first created a replica copy of the 24 GB base image on the Virtual SAN datastore and then created and customized the desktops and joined them to the Active Directory domain. It then took a snapshot of the virtual desktop, and the desktop went into an Available state in the View Administrator console, ready for user login.
This process took 60 minutes and 54 seconds.
Avai
labl
e D
eskt
ops
per E
SXi
ESXi CPU U
sage (MH
z)
View Operations TestTime to Provision 700 Linked-Clone DesktopsESXi CPU Usage (MHz) Against Available Desktops
Available Desktops CPU Usage (MHz)
Time (in minutes)
Figure 19: Time to Provision 700 Linked Clones Against Average ESXi CPU Usage
Average ESXi CPU usage peaked at 23,253 MHz (36 percent) and fell to 9,907 MHz (15 percent) as virtual desktops settled down and ran at steady state.

T E C H N I C A L W H I T E PA P E R / 2 9
VMware Horizon 6 with App Volumes and Virtual SAN Reference Architecture
Power On and Login of 700 Linked ClonesA boot-and-login storm was simulated for a pool of 700 virtual desktops. The virtual desktops were configured for automatic login to the AD domain and booted simultaneously from vCenter. The objective was to measure time to completion and observe Virtual SAN performance under stress.
It took just under 10 minutes for all 700 desktops to power on and report their status as Connected in View Manager.
Des
ktop
s Co
nnec
ted
View Operations TestPower On / Login 700 Virtual DesktopsTime to Completion
Time (in minutes)
Figure 20: Power-On and AD Login Test for 700 Virtual Desktops on Virtual SAN
The Virtual SAN Observer tool gathered performance statistics from the Virtual SAN cluster at sample intervals of 30 seconds throughout the tests and examined them from the points of view of the Virtual SAN client, the virtual desktops running on the cluster, and the disk layer, reporting on the following measures:
•Latency – Length of time it takes an I/O operation to complete
•IOPS – Number of read and write operations per second
•Bandwidth – Amount of data being transferred
•Congestion – Difficulty the underlying disk layer has in keeping up with I/O, indicating a problem in the configuration
•Outstanding I/O – Number of I/O requests that are waiting to be completed (the fewer outstanding I/O requests, the better)

T E C H N I C A L W H I T E PA P E R / 3 0
VMware Horizon 6 with App Volumes and Virtual SAN Reference Architecture
Latency30
2010
0 0 0 0 002:30 02:45
4k
2k
40k
20k 100
100
50200
02:30 02:45 02:30 02:45 02:30 02:45 02:30 02:45
IOPS Bandwidth Congestion Outstanding IO
Latency30
2010
0 0 0 0 002:30 02:45
4k
2k
40k
20k 100
100
50200
02:30 02:45 02:30 02:45 02:30 02:45 02:30 02:45
IOPS Bandwidth Congestion Outstanding IO
Latency30
2010
0 0 0 0 002:30 02:45
4k
2k
40k
20k 100
100
50200
02:30 02:45 02:30 02:45 02:30 02:45 02:30 02:45
IOPS Bandwidth Congestion Outstanding IO
Latency30
2010
0 0 0 0 002:30 02:45
4k
2k
40k
20k 100
100
50200
02:30 02:45 02:30 02:45 02:30 02:45 02:30 02:45
IOPS Bandwidth Congestion Outstanding IO
Latency30
2010
0 0 0 0 002:30 02:45
4k
2k
40k
20k 100
100
50200
02:30 02:45 02:30 02:45 02:30 02:45 02:30 02:45
IOPS Bandwidth Congestion Outstanding IO
Latency30
2010
0 0 0 0 002:30 02:45
4k
2k
40k
20k 100
100
50200
02:30 02:45 02:30 02:45 02:30 02:45 02:30 02:45
IOPS Bandwidth Congestion Outstanding IO
Latency30
2010
0 0 0 0 002:30 02:45
4k
2k
40k
20k 100
100
50200
02:30 02:45 02:30 02:45 02:30 02:45 02:30 02:45
IOPS Bandwidth Congestion Outstanding IO
esxi-r720-10
esxi-r720-11
esxi-r720-12
esxi-r720-5
esxi-r720-6
esxi-r720-8
esxi-r720-9
Figure 21: Virtual SAN Observer – Client Layer Statistics
The Virtual SAN Observer client showed that outstanding I/O spiked temporarily to 97, but this spike was not a cause for concern because the LSI Logic storage controllers have a queue depth of 600. Latency reached a maximum of 33 ms at 2,267 read IOPS, 33,790 KBps per host. The total combined read IOPS at peak was 18,583 at 224,785 KBps. No congestion was observed.

T E C H N I C A L W H I T E PA P E R / 3 1
VMware Horizon 6 with App Volumes and Virtual SAN Reference Architecture
Virtual SAN is fully compatible with View Storage Accelerator, which uses the vSphere Content Based Read Cache (CBRC) feature. CBRC allows some ESXi host RAM to be dedicated for use as a cache for common read blocks, thus reducing I/O to the storage system. CBRC was enabled in vSphere and configured and managed through the View Management Console.
Figure 22: ESXi Host Advanced System Settings – Enable CBRC
View Storage Accelerator was enabled, with the host cache size set to a maximum of 2048 MB for all tests.
Figure 23: View Console – vCenter Settings for View Storage Accelerator (CBRC)

T E C H N I C A L W H I T E PA P E R / 3 2
VMware Horizon 6 with App Volumes and Virtual SAN Reference Architecture
As shown in Figure 24, CBRC on a single ESXi host had a hit ratio of 90 percent at peak during a boot and login storm, serving 9,768 read operations from its in-memory cache.
CBRC Hit Rate
CBRC IOPS
Set Max y-Axis
Hit Rate 90.99
Set Max y-Axis
Read Misses 880.64
Total Read 9768.90
02:2102:2202:2302:2402:2502:2602:2702:2802:2902:3002:3102:3202:3302:3402:3502:3602:3702:3802:3902:4002:4102:4202:4302:4402:4502:4602:4702:4802:490
10
20
30
40
50
60
70
80
90
100
02:2102:2202:2302:2402:2502:2602:2702:2802:2902:3002:3102:3202:3302:3402:3502:3602:3702:3802:3902:4002:4102:4202:4302:4402:4502:4602:4702:4802:490
1k
2k
3k
4k
5k
6k
7k
8k
9k
Figure 24: Virtual SAN Observer – CBRC
Virtual SAN Observer disk statistics show that the read cache (RC) hit rate remained above 95 percent across all hosts for the duration of the boot and login test. Write buffer fill did not exceed 10 percent full on any host during the test, and read latency spiked to 4 ms.

T E C H N I C A L W H I T E PA P E R / 3 3
VMware Horizon 6 with App Volumes and Virtual SAN Reference Architecture
The Virtual SAN Observer disk layer section offers a deep view into the physical disk layer of a Virtual SAN host, with an aggregate view across the disks. The performance of the read cache can be observed through its hit ratio and the write buffer.
Latency1
10m
0 0 0 0 002:30 02:45
4k
2k
100
50
100
50
30
2010
02:30 02:45 02:30 02:45 02:30 02:45 02:30 02:45
IOPS RC Hit Rate Evictions WriteBu�er Fill
Latency1
10m
0 0 0 0 002:30 02:45
4k
2k
100
50
100
50
30
2010
02:30 02:45 02:30 02:45 02:30 02:45 02:30 02:45
IOPS RC Hit Rate Evictions WriteBu�er Fill
Latency1.5
10m0 0 0 0 0
02:30 02:45
5k
100
50
100
50302010
02:30 02:45 02:30 02:45 02:30 02:45 02:30 02:45
IOPS RC Hit Rate Evictions WriteBu�er Fill
1
302010
Latency1
10m
0 0 0 0 002:30 02:45
4k2k
100
50
100
50
02:30 02:45 02:30 02:45 02:30 02:45 02:30 02:45
IOPS RC Hit Rate Evictions WriteBu�er Fill
6k
Latency
1
10m
0 0 0 0 002:30 02:45
4k2k
100
50
100
50
40
20
02:30 02:45 02:30 02:45 02:30 02:45 02:30 02:45
IOPS RC Hit Rate Evictions WriteBu�er Fill
6k
Latency2
1
0 0 0 0 002:30 02:45
4k2k
100
50
100
50302010
02:30 02:45 02:30 02:45 02:30 02:45 02:30 02:45
IOPS RC Hit Rate Evictions WriteBu�er Fill
6k
esxi-r720-10
Latency1
10m
0 0 0 0 002:30 02:45
4k6k
6k
2k
100
50
100
50
30
2010
02:30 02:45 02:30 02:45 02:30 02:45 02:30 02:45
IOPS RC Hit Rate Evictions WriteBu�er Fill
esxi-r720-11
esxi-r720-12
esxi-r720-5
esxi-r720-6
esxi-r720-8
esxi-r720-9
Figure 25: Virtual SAN Observer – Disk Layer Statistics
Refresh of 700 Linked ClonesA View refresh operation reverts a pool of linked-clone desktops to their original state. Any changes made to the desktop after it was provisioned, recomposed, or last refreshed are discarded. When a refresh operation is initiated, desktops in the pool are refreshed in a rolling fashion, several at a time.
A refresh test was conducted on a pool of floating linked-clone desktops with no AppStacks assigned or attached, and the same refresh operation was repeated for a pool of virtual desktops with an Office 2010 AppStack assigned and attached. AD users were logged in to all desktops in the pool for both tests. Several desktops were refreshed simultaneously, and users were logged off automatically before their desktops were taken down for maintenance. After a desktop was refreshed, the AD user was logged back in automatically. The AppStack was assigned to the AD users and mounted on login.

T E C H N I C A L W H I T E PA P E R / 3 4
VMware Horizon 6 with App Volumes and Virtual SAN Reference Architecture
The objectives of the test were to measure time to completion for both pools and to record the performance metrics.
Figure 26: Office 2010 AppStack Used for Refresh Test
Before the refresh operation, 101 MB of changes were written to the C drive of each virtual desktop in the pool.
Figure 27: Sample Desktop Before Delta Increase

T E C H N I C A L W H I T E PA P E R / 3 5
VMware Horizon 6 with App Volumes and Virtual SAN Reference Architecture
Figure 28: Sample Desktop – Post-Delta Increase (101 MB of Files Written to C: Drive)
It took 28 minutes and 12 seconds for the pool of 700 virtual desktops with no AppStacks attached to complete a refresh. The pool of 700 desktops with an AppStack attached took 29 minutes and 52 seconds to refresh. This time included AD users reconnecting with their desktops.
Time (in minutes)
Des
ktop
s Re
fres
hed
View Operations TestRefresh of 700 Linked-Clone DesktopsTime to Completion for Desktop Pool with Traditional Apps Versus AppStack
AppStack Traditional Apps
Figure 29: Time to Refresh Desktop Pool with and Without AppStack Attached

T E C H N I C A L W H I T E PA P E R / 3 6
VMware Horizon 6 with App Volumes and Virtual SAN Reference Architecture
Recompose of 700 Linked ClonesA View recompose operation changes the linked clones to a new parent base image. View Composer creates a replica of the new base image on the Virtual SAN datastore. It then creates a new OS disk for each virtual desktop and deletes the old one. The new desktop is customized, and a new snapshot created. This is the operation that administrators use to push out patches and software updates to pools of desktops.
A recompose operation was carried out for a pool of 700 floating linked-clone Windows 7 desktops with no AppStacks assigned or attached. The new replica image for the recompose operation was the old base image with an additional 357 MB of files copied to the C: drive. A recompose operation was repeated for a pool of 700 Windows 7 desktops with an Office 2010 32-bit AppStack attached. AD users were logged in to all desktops in the pool for both tests. Several desktops were refreshed simultaneously, and AD users were automatically logged in to available desktops when the desktops were refreshed.
The Traditional Apps linked-clone pool took 73 minutes and 10 seconds to recompose to a new base image. The linked-clone pool with an AppStack attached took 77 minutes and 36 seconds.
Time (in minutes)
Des
ktop
s Re
com
pose
d
View Operations TestTime to Recompose 700 Linked-Clone DesktopsPool with Traditional Apps Versus AppStack
AppStack Traditional Apps
Figure 30: Time to Recompose a Desktop Pool with and Without AppStack

T E C H N I C A L W H I T E PA P E R / 3 7
VMware Horizon 6 with App Volumes and Virtual SAN Reference Architecture
Resiliency Testing – Virtual SANThe following sections describe the testing carried out to simulate a hardware outage on a seven-node Virtual SAN cluster with 700 running virtual desktops.
Single Host Failure ExerciseThis test simulated a Virtual SAN host failure, to observe the effect on the App Volumes AppStack assigned to other hosts in the cluster.
An ESXi host with 97 running virtual desktops was manually powered off from the Dell DRAC to simulate a hardware failure. The host went into Not Responding state, and desktops became unavailable.
Figure 31: ESXi Host – Simulated Hardware Failure

T E C H N I C A L W H I T E PA P E R / 3 8
VMware Horizon 6 with App Volumes and Virtual SAN Reference Architecture
Examination of an AppStack that had a Virtual SAN replica component on the failed host showed that the AppStack component changed state from Active to Absent.
Figure 32: Simulated ESXi Host Hardware Failure – AppStack Replica Component Absent
There was no impact on AppStack accessibility or performance of virtual desktops on the remaining ESXi hosts in the cluster.
Timeout IntervalBy default, Virtual SAN waits 60 minutes before marking the Absent component as Degraded. If the components do not become available within this time, Virtual SAN begins rebuilding them elsewhere in the cluster. To modify the default Virtual SAN timeout interval (VSAN.ClomRepairDelay), change the ESXi advanced options for each ESXi in the Virtual SAN cluster, as shown in Figure 33.
Figure 33: ESXi Advanced Settings – Setting Rebuild Timer

T E C H N I C A L W H I T E PA P E R / 3 9
VMware Horizon 6 with App Volumes and Virtual SAN Reference Architecture
After setting the default timeout, use the following command to restart the Cluster Level Object Manager on each host.
/init.d/clomd restart
Simulating Host FailureVirtual SAN has a useful Ruby vSphere Console command that simulates the effect of the loss of a host. It reports back the current cache reservations, capacity, and components used and the effect of a host failure and rebuild on the remaining nodes in the cluster.
/vcenter.vmwra.com/RA-DC/computers> vsan.whatif_host_failures -s DesktopCluster/
Current utilization of hosts:
+------------------------+---------+--------------+------+----------+------------------+--------------+
| | | HDD Capacity | | | Components | SSD Capacity |
| Host | NumHDDs | Total | Used | Reserved | Used | Reserved |
+------------------------+---------+--------------+------+----------+------------------+--------------+
| esxi-r720-5.vmwra.com | 6 | 3352.50 GB | 5 % | 3 % | 2706/3000 (90 %) | 0 % |
| esxi-r720-8.vmwra.com | 6 | 3352.50 GB | 5 % | 3 % | 2705/3000 (90 %) | 0 % |
| esxi-r720-12.vmwra.com | 6 | 3352.50 GB | 5 % | 3 % | 2704/3000 (90 %) | 0 % |
| esxi-r720-9.vmwra.com | 6 | 3352.50 GB | 6 % | 3 % | 2704/3000 (90 %) | 0 % |
| esxi-r720-6.vmwra.com | 6 | 3352.50 GB | 6 % | 2 % | 2709/3000 (90 %) | 0 % |
| esxi-r720-11.vmwra.com | 6 | 3352.50 GB | 6 % | 3 % | 2705/3000 (90 %) | 0 % |
| esxi-r720-10.vmwra.com | 6 | 3352.50 GB | 5 % | 2 % | 2706/3000 (90 %) | 0 % |
+------------------------+---------+--------------+------+----------+------------------+--------------+
Simulating 1 host failures:
+-----------------+------------------------------+-----------------------------------+
| Resource | Usage right now | Usage after failure/re-protection |
+-----------------+------------------------------+-----------------------------------+
| HDD capacity | 6% used (22159.15 GB free) | 7% used (18806.65 GB free) |
| Components | 90% used (2061 available) | 105% used (-939 available) |
| RC reservations | 0% used (1820.96 GB free) | 0% used (1560.13 GB free) |
+-----------------+------------------------------+-----------------------------------+
T E C H N I C A L W H I T E PA P E R / 4 0
VMware Horizon 6 with App Volumes and Virtual SAN Reference Architecture
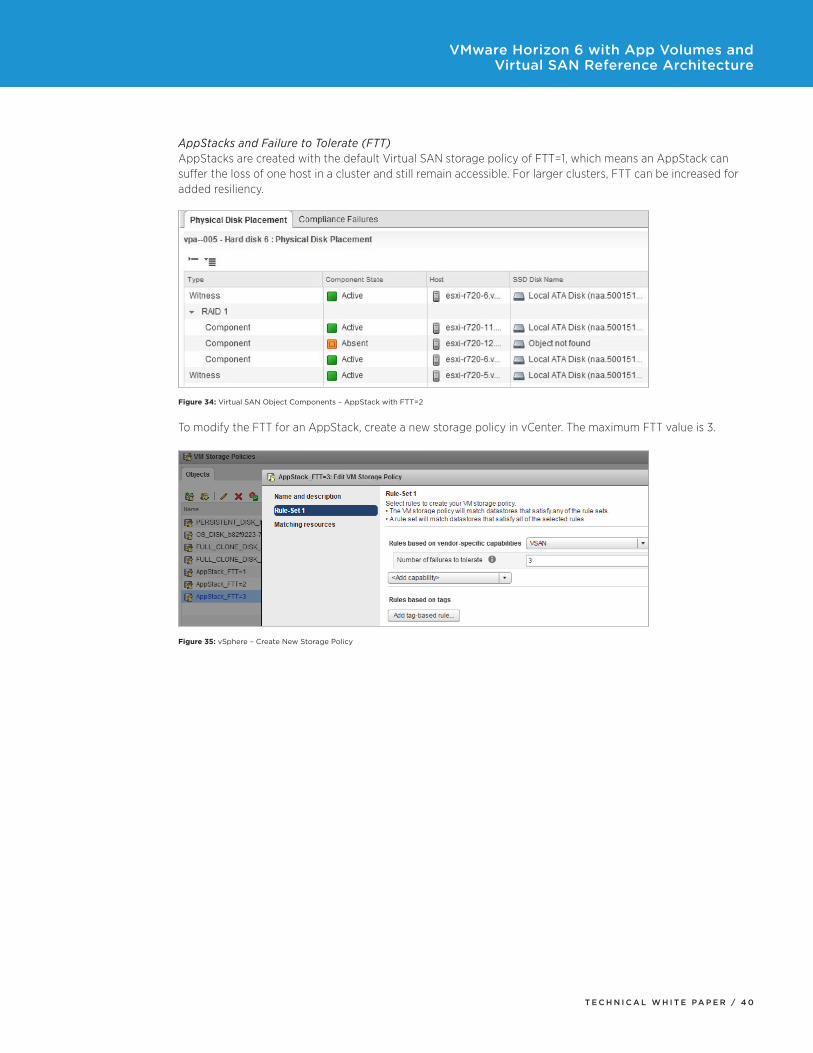
AppStacks and Failure to Tolerate (FTT)AppStacks are created with the default Virtual SAN storage policy of FTT=1, which means an AppStack can suffer the loss of one host in a cluster and still remain accessible. For larger clusters, FTT can be increased for added resiliency.
Figure 34: Virtual SAN Object Components – AppStack with FTT=2
To modify the FTT for an AppStack, create a new storage policy in vCenter. The maximum FTT value is 3.
Figure 35: vSphere – Create New Storage Policy

T E C H N I C A L W H I T E PA P E R / 4 1
VMware Horizon 6 with App Volumes and Virtual SAN Reference Architecture
Mount the AppStack on a powered-off virtual machine, and apply the new storage policy to the AppStack disk. The AppStack can be in use and attached to other virtual machines.
Figure 36: AppStack After New FTT=3 Storage Policy Applied
Virtual SAN creates additional replicas, which go into Reconfiguring state before becoming Active after the copy operation has completed. It also creates additional witnesses, which are used as tiebreakers in Virtual SAN availability decisions.
Increasing the FTT for an AppStack contributes components only to the VMDK file, not to the redo files, which are created on attachment.
Findings of Operations TestsOperations testing produced the following results.
•Rapid provisioning – 700 linked clones provisioned in 60 minutes and 54 seconds
•Fast desktop maintenance operations
- Refresh of 700 linked clones in less than 30 minutes
- Recompose of 700 linked clones in less than 74 minutes
•AppStack usage – No significant increase in maintenance operation times
- Refresh times – Traditional 28 minutes and 12 seconds versus AppStack 29 minutes and 52 seconds
- Recompose – Traditional 73 minutes and 10 seconds versus AppStack 77 minutes and 36 seconds
•View Storage Accelerator and Virtual SAN – Form an effective partnership to tackle boot and login storms
- 18,583 reads at peak of boot and login storm
- Peak latency of 33 ms and no congestion
•Resilient platform for deploying virtual desktops with App Volumes AppStack

T E C H N I C A L W H I T E PA P E R / 4 2
VMware Horizon 6 with App Volumes and Virtual SAN Reference Architecture
View RDSH Desktops
To compare the performance characteristics for traditional RDSH and RDSH with AppStacks under a View Planner workload, a cluster was created with two ESXi hosts, each with a single datastore. Two types of RDSH configurations were tested:
•8 x RDSH servers with Traditional Apps installed in the Guest OS
•8 x RDSH servers with departmental AppStack assigned
2 x ESXi Hosts2 x Intel Xeon E5-26908C @ 2.90 GHz256 GB RAM
2 x 1 TB Datastores
8 x RDSH Servers8 x 1 vCPU32 GB RAM100 GB Disk
AD Group: 260 Users
vCenter
RDS RDS withAppStack
2 x ESXi Hosts2 x Intel Xeon E5-26908C @ 2.90 GHz256 GB RAM
2 x 1 TB Datastores
8 x RDSH Servers8 x 1 vCPU32 GB RAM100 GB Disk
1 x AppStackMicrosoft O�ce 2010Adobe ReaderFirefoxView Planner Agent
AD Group: 260 Users
Figure 37: RDSH Test Pools
Two separate RDSH farms were created in View. Two desktop pools were then created using these RDSH farms.
View Planner 3.5 was used to drive a synthetic workload on the RDSH servers to simulate 260 concurrent users running applications and executing a workload of common user operations.

T E C H N I C A L W H I T E PA P E R / 4 3
VMware Horizon 6 with App Volumes and Virtual SAN Reference Architecture
RDSH Server Image BuildThe RDSH images and application deployment methods were:
•Traditional RDSH server – Windows 2012 R2 with test applications and View Planner agent installed on the server image (Traditional Apps)
•RDSH server with AppStack – Windows 2012 R2 with test applications and View Planner agent installed in an AppStack
Settings
Data Applications
Traditional RDS Host RDS Host with AppStack
GuestOS
App Volumes Agent
OS
View PlannerAgent
Settings
Data Applications AppStack
View PlannerAgent
OS
Figure 38: RDSH Test Images

T E C H N I C A L W H I T E PA P E R / 4 4
VMware Horizon 6 with App Volumes and Virtual SAN Reference Architecture
Each image was optimized with the VMware OS Optimization tool.
ATTRIBUTE TRADITIONAL RDSH RDSH WITH APPSTACK
Desktop OS Windows 2012 R2 Windows 2012 R2
VM hardware v9 v9
CPU 8 (8 x 1 core) 8 (8 x 1 core)
Memory 32768 MB 32768 MB
Memory reserved 0 MB 0 MB
Video RAM 128 MB 128 MB
3D graphics Off Off
NICs 1 1
Virtual network adapter VMXNet3 Adapter VMXNet3 Adapter
Virtual SCSI controller 0 Paravirtual Paravirtual
Virtual disk – VMDK 1 70 GB (OS C:\) 70 GB (OS C:\)
Virtual disk – VMDK 2 70 GB (View Planner Data E:\) 70 GB (View Planner Data E:\)
Virtual floppy drive Removed Removed
Virtual CD/DVD drive Removed Removed
Traditional Apps •AdobeAcrobat10.1.4•Firefox7.01•InternetExplorer10•Office2010SP2•ViewPlanner3.5agent
Internet Explorer 10
AppStack 1 (6.2 GB)
AppStack Apps •AdobeAcrobat10.1.4•Firefox7.01•Office2010•ViewPlanner3.5agent
App Volumes Agent 2.6.0 build 3106
VMware Tools 9.4.11 – build 2400950 9.4.11 – build 2400950
VMware View Agent 6.0.2 – build 2331487 6.0.2 – build 2331487
Table 9: RDSH Virtual Machine Specifications with and Without AppStacks
Each RDSH server had a primary OS disk and a secondary 70 GB thin disk with View Planner 3.5 data files. Both images were cloned from the same base OS template and had the same OS optimizations applied. A third clone was used as a clean image to provision the AppStacks.
Each AppStack was stored on the same datastore as the RDSH servers.

T E C H N I C A L W H I T E PA P E R / 4 5
VMware Horizon 6 with App Volumes and Virtual SAN Reference Architecture
The Win2012-RDSH AppStack was provisioned to the clean desktop and had Adobe Reader, Firefox, Office 2010, and View Planner installed. The size of the finished AppStack was 14.1 GB. This AppStack was assigned to the AD machines for the RDSH with AppStack View desktop pool.
Figure 39: RDSH – Departmental AppStack Used in Testing
View Planner Test ResultsFive iterations of View Planner medium workload were executed on the Traditional Apps RDSH pool and on the AppStack RDSH pool. During each iteration, the desktops executed operations to simulate 130 RDSH sessions per host with 100 percent concurrency. The operations were interactive (Group A), I/O Operations (Group B), and background load (Group C). Group A and B operations determine the QoS of the desktop and are responsible for ensuring that the end-user experience is satisfactory. The View Planner passing marks are Group A < 1 second, Group B < 6 seconds.
Time (in seconds)
0
Group A (≤ 1.0)
QoS Groups
Group B (≤ 6.0)
View Planner 3.5 Benchmark ScoreTraditional Apps Versus AppStack
AppStack Traditional Apps
1 2 3 4 5 6
Figure 40: RDSH Workload Test – View Planner Score Comparison
Each RDSH pool met Group A and Group B requirements and passed the View Planner benchmark test. Traditional Apps and AppStack both scored 0.56 in the Group A score, but AppStack trumped Traditional Apps in the Group B score of 4.83 versus 5.27.
In the individual View Planner application operations, the AppStack RDSH pool scored lower latencies in 18 of the 25 Group A operations, 5 of the 10 Group B operations, and 2 of the 3 Group C operations.

T E C H N I C A L W H I T E PA P E R / 4 6
VMware Horizon 6 with App Volumes and Virtual SAN Reference Architecture
Time (in seconds)
App
licat
ion
Ope
ratio
n
View Planner 3.5 Benchmark TestApplication Operation Execution TimesTraditional Apps Versus AppStack
0 0.5 1 1.5 2 2.5 3 3.5 4 4.5 5
7zip-Compress
AdobeReader-Browse
AdobeReader-Close
AdobeReader-Maximize
AdobeReader-Minimize
AdobeReader-Open
Excel Sort-Close
Excel Sort-Compute
Excel Sort-Entry
Excel Sort-Maximize
Excel Sort-Minimize
Excel Sort-Open
Excel Sort-Save
Firefox-Close
Firefox-Open
IE ApacheDoc-Browse
IE ApacheDoc-Close
IE ApacheDoc-Open
IE WebAlbum-Browse
IE WebAlbum-Close
IE WebAlbum-Open
PPTx-AppendSlides
PPTx-Close
PPTx-Maximize
PPTx-Minimize
PPTx-ModifySlides
PPTx-Open
PPTx-RunSlideShow
PPTx-SaveAs
Video-Close
Video-Open
Word-Maximize
Word-Minimize
Word-Modify
Word-Open
Word-Save
AppStack Traditional Apps
Figure 41: RDSH Workload Test – View Planner Latency Comparison

T E C H N I C A L W H I T E PA P E R / 4 7
VMware Horizon 6 with App Volumes and Virtual SAN Reference Architecture
Metrics were collected from the ESXi hosts with a sample interval of 20 seconds. A comparison of CPU usage for the clusters from the RDSH AppStack and RDSH Traditional Apps pools produced the graph in Figure 42.
Time (in minutes)
CPU
Usa
ge (M
Hz)
View Planner Workload TestESXi CPU Usage (MHz) for 130 RDSH DesktopsTraditional Apps Versus AppStack
AppStack Traditional Apps
Figure 42: RDSH Workload Test – ESXi CPU Usage (MHz) Comparison
RDSH TRADITIONAL APPS RDSH APPSTACK
Average CPU Usage (MHz) 43,537 41,318
Maximum CPU Usage (MHz) 46,399 46,315
Table 10: RDSH Workload Test – ESXi CPU Usage (MHz) Metrics

T E C H N I C A L W H I T E PA P E R / 4 8
VMware Horizon 6 with App Volumes and Virtual SAN Reference Architecture
METRIC RDSH TRADITIONAL APPS RDSH WITH APPSTACK
Average Maximum Average Maximum
CPU Usage (MHz) 43,537 46,399 41,318 46,315
Memory Usage (Consumed) 101 104 115 118
Memory Usage (Active) 47 72 47 74
Storage Reads per second 9 501 109 901
Storage Writes per second 371 756 354 1,254
Storage Read Rate (KB per second) 418 11,903 3,151 25,955
Storage Write Rate (KB per second) 7,901 22,053 6,467 82,861
Network Rx (KB per second) 93 294 98 387
Network Tx (KB per second) 508 1,545 532 1,412
Network Read Rate (KB per second) 418 11,903 3,151 25,955
Network Write Rate (KB per second) 7,901 22,053 6,467 82,861
Table 11: RDSH Workload Test – ESXi Metrics Summary
Summary of View Planner Workload Test ResultsRDSH and RDSH with AppStack both comfortably passed the View Planner benchmark test for this configuration. The AppStack pool achieved slightly better results for Group B (storage I/O operations). In summary:
•The AppStack pool had a 5 percent lower average CPU usage than the Traditional Apps pool during workload.
•The AppStack pool showed more host memory consumed than Traditional Apps. Active memory was the same for both pools.
•The RDSH AppStack pool had more reads and slightly fewer (5 percent) average writes per second than the Traditional Apps desktop pool.
•The AppStack pool had a 5 percent higher average network receive rate (Rx) and a 4 percent average network transmission rate (Tx) than the RDSH AppStack pool.

T E C H N I C A L W H I T E PA P E R / 4 9
VMware Horizon 6 with App Volumes and Virtual SAN Reference Architecture
Horizon Writable Volumes Test
The purpose of this test was to determine the IOPS requirement for writable volumes (profile data) under user login and workload testing.
Two ESXi hosts were provisioned, each with a pool of 100 linked-clone virtual desktops. One of the ESXi hosts was assigned a second datastore in which 100 writable volumes were created for user profile data.
Two AD groups were created, each with 100 users. The writable volumes were assigned to one of the AD groups.
Single ESXi Host2 x Intel Xeon E5-26908C @ 2.90 GHz256 GB RAM
1 x 1 TB Datastore
100 Linked-Clone Desktops
AD Group 1: 100 Users
vCenter
Desktops Desktopswith Writables
Single ESXi Host2 x Intel Xeon E5-26908C @ 2.90 GHz256 GB RAM
2 x 1 TB DatastoreDesktop DatastoreWritable Volume Datastore
100 Linked-Clone Desktops
AD Group 2: 100 Users
100 Writable Volumes
Figure 43: Linked-Clone Pools with and Without Writable Volumes
View Planner 3.5 was used to drive a medium workload on each linked-clone pool. The application latency results from both test runs are shown in Figure 44.
With writable volumes, the average increase in application latencies was 0.08 seconds, with a maximum observed difference of 0.48 seconds for one application task.

T E C H N I C A L W H I T E PA P E R / 5 0
VMware Horizon 6 with App Volumes and Virtual SAN Reference Architecture
Time (in seconds)
App
licat
ion
Ope
ratio
n
View Planner 3.5 Benchmark TestApplication Operation Execution TimesTraditional Apps Versus Traditional Apps with Writable
0 0.5 1 1.5 2 2.5 3 3.5 4 4.5 5
7zip-Compress
AdobeReader-Browse
AdobeReader-Close
AdobeReader-Maximize
AdobeReader-Minimize
AdobeReader-Open
Excel Sort-Close
Excel Sort-Compute
Excel Sort-Entry
Excel Sort-Maximize
Excel Sort-Minimize
Excel Sort-Open
Excel Sort-Save
Firefox-Close
Firefox-Open
IE ApacheDoc-Browse
IE ApacheDoc-Close
IE ApacheDoc-Open
IE WebAlbum-Browse
IE WebAlbum-Close
IE WebAlbum-Open
PPTx-AppendSlides
PPTx-Close
PPTx-Maximize
PPTx-Minimize
PPTx-ModifySlides
PPTx-Open
PPTx-RunSlideShow
PPTx-SaveAs
Video-Close
Video-Open
Word-Close
Word-Maximize
Word-Minimize
Word-Modify
Word-Open
Word-Save
Traditional Apps Traditional Apps with Writable
Figure 44: Writable Volumes Workload Test – View Planner Latency Comparison

T E C H N I C A L W H I T E PA P E R / 5 1
VMware Horizon 6 with App Volumes and Virtual SAN Reference Architecture
Table 12 compares ESXi performance metrics for a pool of virtual desktops with and without writable volumes. The pool with writable volumes shows a slight increase in CPU usage (3 percent on average) but no difference in average memory consumed or average active memory usage.
POOL 1 – TRADITIONAL DESKTOPS
POOL 2 – DESKTOPS WITH WRITABLE VOLUMES (DESKTOP DATASTORE)
POOL 2 – DESKTOPS WITH WRITABLE VOLUMES (WRITABLE VOLUMES DATASTORE)
Average Maximum Average Maximum Average Maximum
CPU usage (MHz)
31,583 MHz 44,499 MHz 32,549 MHz 46,399 MHz
Memory usage (consumed)
213 GB 213 GB 213 GB 213 GB
Memory usage (active)
44 GB 79 GB 44 GB 77 GB
Storage reads per second
769 6,172 756 6,844 9 249
Storage writes per second
379 1,660 318 1,674 124 593
Storage read rate (KBps)
814 15,809 694 16,246 240 5220
Storage write rate (KBps)
2,613 24,748 1,674 9,621 1,107 14,810
Table 12: Workload Testing – Linked Clones with and Without Writable Volume

T E C H N I C A L W H I T E PA P E R / 5 2
VMware Horizon 6 with App Volumes and Virtual SAN Reference Architecture
Operations TestingOne hundred writable volumes were created from the App Volumes Manager console. The writable volume VMDKs are thin-provisioned and stored in the same datastore as the writable volumes template VMDK. It took just under 10 minutes to create the 100 writable volumes, with 806 maximum reads per second and 858 maximum writes per second.
IOPS
Writable Volum
es Created
App Volumes Writable Volumes TestTime to Create 100 Writable Volumes
Datastore Reads (ps) Datastore Writes (ps) Writable Volumes Created
Time (in minutes)
Figure 45: Time to Create Writable Volumes Against IOPS
AVERAGE MAXIMUM
Reads per second 305 806
Writes per second 296 858
Read rate (KBps) 16,062 49,490
Write rate (KBps) 12,028 46,275
Table 13: Datastore Metrics for Creation of 100 Writable Volumes

T E C H N I C A L W H I T E PA P E R / 5 3
VMware Horizon 6 with App Volumes and Virtual SAN Reference Architecture
Stor
age
Band
wid
th (K
Bps) W
ritable Volumes Created
App Volumes Writable Volumes TestTime to Create 100 Writable Volumes
Datastore Read Rate (KBps) Datastore Write Rate (KBps) Writable Volumes Created
Time (in minutes)
Figure 46: Time to Create Writable Volumes Against Write Rate
Writable Volumes Test FindingsUsing writable volumes for profile data did not introduce significant CPU or memory overhead on the ESXi host. There was a small penalty in application response times, but this was an average of 0.08 seconds across all View Planner workload operations.
The maximum IOPS for a single writable volume was 2.5 reads and 6 writes during workload testing, including login.

T E C H N I C A L W H I T E PA P E R / 5 4
VMware Horizon 6 with App Volumes and Virtual SAN Reference Architecture
System ConfigurationThe following section describes the virtual infrastructure sizing and configuration.
vCenter Server
vCenter Server manages the ESXi hosts, vSphere clusters, virtual networking, Virtual SAN and local datastores, and the provisioning of virtual machines. For automated testing with View Planner, a single vCenter Server can manage both the management cluster and the desktop clusters. In production implementations, however, VMware recommends deploying an additional vCenter Server to separate the management of server and desktop workloads. Ideally, a vCenter Server running on an existing vSphere platform manages the management block, and another vCenter Server running in the management block manages the desktop block.
The vCenter Server was sized to accommodate server workloads and up to 2,000 virtual desktops. For concurrent provisioning and high availability, deploy multiple vCenter Servers.
ATTRIBUTE DESCRIPTION
OS Windows Server 2012 R2
vCPU 4 vCPUs
vRAM 24 GB
Storage 100 GB
Table 14: vCenter Server Configuration
vSphere Cluster Configuration
Table 15 lists the vSphere clusters.
CLUSTER NUMBER OF HOSTS
DESCRIPTION HA DRS
Management 2 Contains all server workload virtual machines.
Enabled (default settings)
Enabled (default settings)
Desktop 7 Contains linked-clone virtual desktops created by View
700 users and 100 virtual machines per host
Enabled (default settings)
RDSH 2 Contains all RDSH servers
260 users and 32 sessions per RDSH
Table 15: vSphere Clusters
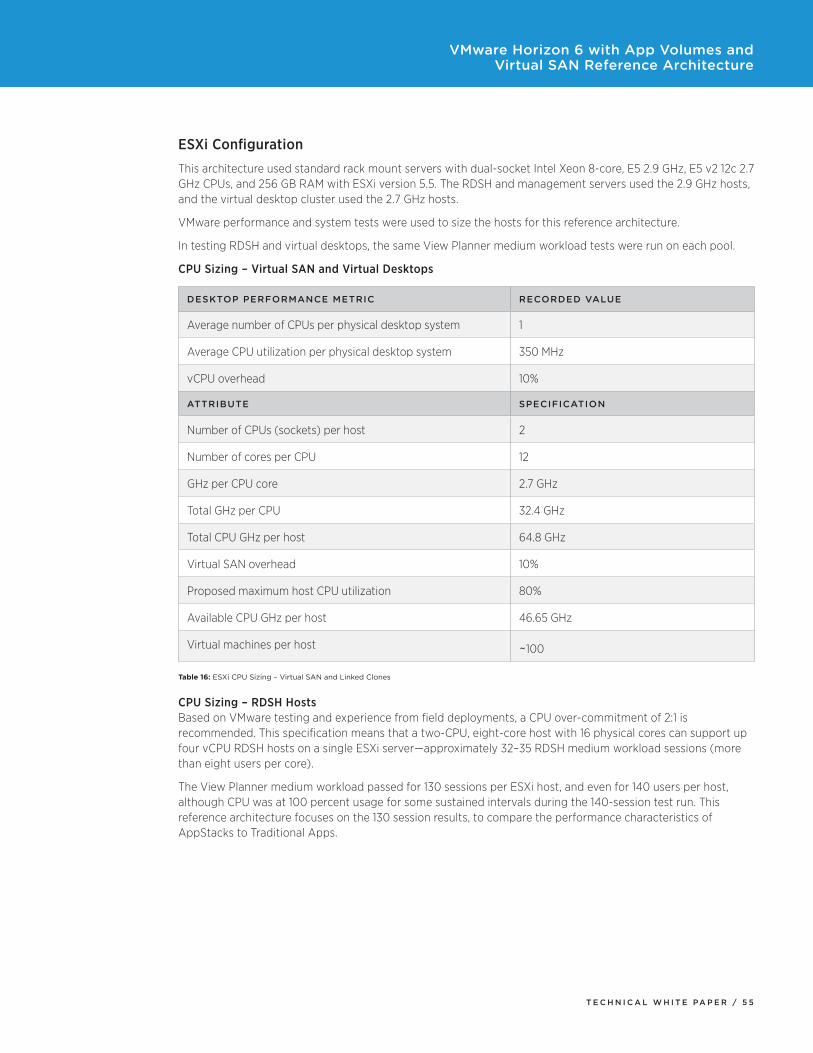
T E C H N I C A L W H I T E PA P E R / 5 5
VMware Horizon 6 with App Volumes and Virtual SAN Reference Architecture
ESXi Configuration
This architecture used standard rack mount servers with dual-socket Intel Xeon 8-core, E5 2.9 GHz, E5 v2 12c 2.7 GHz CPUs, and 256 GB RAM with ESXi version 5.5. The RDSH and management servers used the 2.9 GHz hosts, and the virtual desktop cluster used the 2.7 GHz hosts.
VMware performance and system tests were used to size the hosts for this reference architecture.
In testing RDSH and virtual desktops, the same View Planner medium workload tests were run on each pool.
CPU Sizing – Virtual SAN and Virtual Desktops
DESKTOP PERFORMANCE METRIC RECORDED VALUE
Average number of CPUs per physical desktop system 1
Average CPU utilization per physical desktop system 350 MHz
vCPU overhead 10%
ATTRIBUTE SPECIFICATION
Number of CPUs (sockets) per host 2
Number of cores per CPU 12
GHz per CPU core 2.7 GHz
Total GHz per CPU 32.4 GHz
Total CPU GHz per host 64.8 GHz
Virtual SAN overhead 10%
Proposed maximum host CPU utilization 80%
Available CPU GHz per host 46.65 GHz
Virtual machines per host ~100
Table 16: ESXi CPU Sizing – Virtual SAN and Linked Clones
CPU Sizing – RDSH Hosts Based on VMware testing and experience from field deployments, a CPU over-commitment of 2:1 is recommended. This specification means that a two-CPU, eight-core host with 16 physical cores can support up four vCPU RDSH hosts on a single ESXi server—approximately 32–35 RDSH medium workload sessions (more than eight users per core).
The View Planner medium workload passed for 130 sessions per ESXi host, and even for 140 users per host, although CPU was at 100 percent usage for some sustained intervals during the 140-session test run. This reference architecture focuses on the 130 session results, to compare the performance characteristics of AppStacks to Traditional Apps.

T E C H N I C A L W H I T E PA P E R / 5 6
VMware Horizon 6 with App Volumes and Virtual SAN Reference Architecture
ATTRIBUTE SPECIFICATION
CPUs per desktop 1
Average CPU utilization per desktop 350 MHz
vCPU overhead 10%
Number of CPUs (sockets) per ESXi 2
Number of cores per ESXi CPU 8
GHz per ESXi CPU core 2.9 GHz
Total GHz per ESXi CPU 23.2 GHz
Total CPU GHz per ESXi 46.4 GHz
Proposed maximum host CPU utilization 80%
Available CPU GHz per ESXi 37.12 GHz
Table 17: ESXi CPU Sizing – RDSH Servers
Memory Sizing – Virtual SAN and Virtual Desktops Each desktop was allocated 2 GB RAM, with no over-commitment and no memory reserved. In View deployments, most Windows 7 x86 virtual desktops have between 1–2 GB RAM.
ATTRIBUTE SPECIFICATION
Total amount of RAM per virtual desktop 2048 MB
Memory reservation 0%
Display resolution 1920 x 1600 (1 monitor)
Memory overhead per virtual desktop 41 MB
Total RAM required for desktop virtual machines 204 GB
Virtual SAN memory overhead 5 GB1
Amount of memory required per host 209 GB
Proposed maximum host memory usage 80%
Total amount of RAM per host 256 GB
Table 18: ESXi Memory Sizing – Virtual SAN and Linked Clones
1. This is a liberal estimate, based on the number of disks in the test configuration (single disk group 6 MDDs).

T E C H N I C A L W H I T E PA P E R / 5 7
VMware Horizon 6 with App Volumes and Virtual SAN Reference Architecture
Memory Sizing – RDSH Servers RDSH workloads vary in memory requirements, depending on the application workload, ranging from approximately 500 MB to 1 GB. For the medium workload testing, 1 GB was allocated with the expectation that usage would be lower—512 MB RAM per session could have been adequate.
ATTRIBUTE SPECIFICATION
Total amount of RAM per RDSH session 512 MB
Total number of sessions per RDSH server 32
Total RAM required per RDSH server 16 GB
Number of RDSH sessions per ESXi host 4
Memory overhead per virtual desktop session 41 MB
Total RAM required per ESXi host 64 GB
Minimum RAM required per host (including overhead) 97 GB
Total RAM allocated per RDSH server (1 GB per session plus overhead) 129 GB
Proposed maximum host memory usage 80%
Total amount of RAM per host 256 GB
Table 19: ESXi Memory Sizing – RDSH Servers
Network Configuration
A single vSphere Distributed Switch (vDS) was created for virtual networking between the management and desktop clusters. Each ESXi had two 10GbE uplinks, each to a separate Dell 10GbE switch for resiliency.
vmk0
10GbE 10GbE
Force10Switches
Active Load BalancingBased on Physical NIC Load
vmk1 vmk2
VMNet Management vMotion Storage vLAN
vSphere Distributed Switch
Figure 47: vDS Configuration

T E C H N I C A L W H I T E PA P E R / 5 8
VMware Horizon 6 with App Volumes and Virtual SAN Reference Architecture
Four VLANs were used for network traffic, with a port group created for each VLAN on the vDS. The virtual machine port groups were:
•dvPG-Management – Network for ESXi management
•dvPG-VMNET – Network for virtual machines
•dvPG-Storage – Network for Virtual SAN traffic
•dvPG-vMotion – Network for VMware vSphere vMotion® traffic for migrating running virtual machines to other ESXi hosts
Network I/O Control (NIOC) was enabled on the vDS to ensure that all tenants received their fair share of network I/O resources. Jumbo frames were configured on physical and virtual switches for vSphere vMotion and storage traffic.
PROPERTY SETTING DEFAULT REVISED
General Port binding Static –
Policies: Security Promiscuous mode Reject –
MAC address changes Accept Reject
Forged transmits Accept Reject
Policies: Traffic Shaping
Status Disabled –
Policies: Teaming and Failover
Load balancing Route based on the originating virtual port ID
Route based on physical NIC load
Failover detection Caution Link Status only –
Notify switches Yes –
Policies: Resource Allocation
Network I/O Control Disabled Enabled
Advanced Maximum MTU 1500 9000
Table 20: vDS Configuration

T E C H N I C A L W H I T E PA P E R / 5 9
VMware Horizon 6 with App Volumes and Virtual SAN Reference Architecture
View
View provides access to and management of virtual desktops, RDSH desktops, and RDSH applications. In this reference architecture, View was sized and configured to provision 700 stateless desktops and 260 RDSH desktops.
A View virtual desktop is accessed from a Horizon Client installed on an end-user device, which connects to View security servers for external access or View Connection Servers for internal access.
•View Connection Servers broker View connections to RDSH sessions and desktops running on vSphere ESXi hosts.
•View Administrator and vCenter Server provide ESXi host and virtual machine management functions.
•View Composer provides linked-clone management.
•App Volumes provides application delivery.
•vRealize Operations is responsible for health and performance monitoring.
Data Center
DMZVirtual View
Connection Servers
Internet-Facing Endpoint
Internal Endpoint on Trusted Network
Enterprise Resources
App VolumesManagers
WorkspacePortal vApp
vRealize Operationsfor Horizon
Virtual Desktop Pools
View RDSH Cluster Datastores
Virtual SANView Virtual SAN VDI Cluster
View Connection Servers
(Internal Use Only)
View ConnectionServers with RSA
View Security Servers
Load Balancer
Load Balancer
View Composer
vCenter
Trusted Network
HTTPS / PCoIP
HTTPS / PCoIP
Internet
Figure 48: View Configuration

T E C H N I C A L W H I T E PA P E R / 6 0
VMware Horizon 6 with App Volumes and Virtual SAN Reference Architecture
View Connection Servers handle AD authentication and broker connections to virtual desktops and RDSH desktops over PCoIP. For external users, the View security server forwards PCoIP traffic to the desktop session. For internal users, the client is connected directly to the desktop session.
If a desktop is not available, View Connection Server can automatically provision additional desktops through vCenter Server. Entitling users or a group to preconfigured pools of desktops in View Administrator enables automatic provisioning. View Composer minimizes storage requirements by using linked clones for virtual desktops.
View Connection Servers and security servers are installed in the management block. A View pod can support up to seven View Connection Servers, not to exceed 10,000 concurrent sessions, and up to four View security servers per View Connection Server.
The recommended deployment is one vCenter Server per desktop block, along with a single instance of View Composer. View Composer can be installed in standalone mode or on a vCenter Server.
COMPONENT QUANTITY OS vCPU VRAM HDD
View Connection Server 4 (2 internal, 2 external) Windows 2012 R2 4 16 50 GB
View security server 2 (2 per external View Connection Server)
Windows 2012 R2 4 16 40 GB
View Composer 1 Windows 2012 R2 4 16 40 GB
Table 21: View VM Hardware Specifications
View Global Policies and SettingsWorkspace was the delegated authentication mechanism for View. The SAML authenticator was set to the externally facing fully qualified domain name (FQDN) of the Workspace Gateway load balancer IP address.
View Accelerator was enabled with a 2 GB host cache. The default number of View Composer and vCenter provisioning and maintenance operations was increased from the default values to the settings below.
ATTRIBUTE SPECIFICATION
Description View vCenter Server
Connect using SSL Yes
vCenter port 443
View Composer port 18443
Enable View Composer Yes
Advanced settings:•MaximumConcurrentvCenterProvisioningOperations•MaximumConcurrentPowerOperations•MaximumConcurrentViewComposerMaintenanceOperations•MaximumConcurrentViewComposerProvisioningOperations
30503030
Storage settings:•EnableViewStorageAccelerator•DefaultHostCacheSize
√2048 MB
Table 22: View vCenter Settings

T E C H N I C A L W H I T E PA P E R / 6 1
VMware Horizon 6 with App Volumes and Virtual SAN Reference Architecture
View Manager Pool SettingsTwo desktop pools were created in the View Administrator, one for linked clones and one for RDSH servers.
Linked-Clone Desktop PoolAn automated floating desktop pool with 700 Windows 7 linked-clone desktops was provisioned with View Composer to enable load testing. No persistent disk or disposable disks were used. Replica and OS disks were stored on the Virtual SAN datastore. The default settings were used for the advanced storage options.
The following View Manager pool settings were used for the Linked-Clone pool.
ATTRIBUTE SPECIFICATION
Pool Type Automated Pool
User Assignment Floating
Pool Definition – vCenter Server Linked Clones
Pool ID Desktops
Display Name Desktops
View Folder /
Remote Desktop Power Policy Take no power action
Auto Logoff Time Never
User Reset Allowed False
Multi-Session Allowed False
Delete on Logoff Never
Display Protocol PCoIP
Allow Protocol Override False
Maximum Number of Monitors 1
Maximum Resolution 1920 x 1200
HTML Access Not selected
Flash Quality Level Do not control
Flash Throttling Level Disabled
Enable Provisioning Enabled
Stop Provisioning on error Enabled
Provision all desktops up-front Enabled
Disposable File Redirection Do not redirect
Use VMware Virtual SAN Enabled
Use View Storage Accelerator Selected

T E C H N I C A L W H I T E PA P E R / 6 2
VMware Horizon 6 with App Volumes and Virtual SAN Reference Architecture
ATTRIBUTE SPECIFICATION
Disk Types OS disks
Reclaim VM disk space N/A
Regenerate Storage Accelerator after 7 days
Reclaim VM Disk Space N/A
Use QuickPrep Enabled
Table 23: View Linked-Clone Pool Settings
RDSH Desktop PoolEight Windows servers were cloned from the same template and configured as RDSH session hosts. An RDSH farm was created using the RDSH servers and used to back the RDSH desktop pool in View.
PCoIP was configured as the connection protocol for the 260 desktop sessions. All other pool and farm configuration options were left at default.
View RDSH Pool130+ Desktops per Host8+ Desktops per Core
RDSH Farm8 x RDSH Server64 vCPU256 GB RAM
ESXi Cluster2 x ESXi32 Cores512 GB RAM
RDSH Server RDSH Server
RDSH Server RDSH Server
RDSH Server RDSH Server
RDSH Server RDSH Server
RDSH Desktop Pool
RDSH Farm
ESXi Cluster
View Connection Server
Figure 49: RDSH Farm

T E C H N I C A L W H I T E PA P E R / 6 3
VMware Horizon 6 with App Volumes and Virtual SAN Reference Architecture
App Volumes
App Volumes presents applications, data files, environment settings to View virtual desktops and RDSH servers as read-only containers known as AppStacks. AppStacks are assigned from the Web-based App Volumes Manager, which is also integrated with Active Directory for application entitlements. AppStacks are stored in shared volumes accessible by a pool of desktops running the App Volumes Agent. App Volumes Manager delivers the AppStacks to the desktop or to the chosen user or group. For end users, applications delivered by App Volumes appear and perform as if they were natively installed. Applications follow users across sessions and devices. Data can also optionally follow that user. IT can update or replace applications in real time and can also quickly remove assigned applications. App Volumes also allows user data (profile, settings, files, and user-installed apps) to be stored in a container known as a writable volume, which can move with the user.
The App Volumes deployment configuration and relevant network ports are shown in Figure 50.
Desktops / RDSH Serverswith App Volumes Agents
LoadBalancer View Connection Servers
with App Volumes BrokerIntegration Service
vCenter Server and ESXi Hosts
App VolumesManagers
AD Server
SQL Server Cluster
HTTP: 80HTTPS: 443
HTTP: 80HTTPS: 443Broker IntegrationService: 5986Powershell: 5985
Broker IntegrationService: 5986
MSSQL: TCP 1433
SOAP/Hosted: 443
LDAP: 389LDAPS: 636
Agent
Desktop
Agent
RDSH
vCenter
Figure 50: App Volumes Deployment
The App Volumes deployment consists of the following components:
•App Volumes Manager – A Windows server used to administer configuration, provisioning, and assignment of AppStacks and writable volumes. It also serves as a broker for AppStack and writable volume assignment during desktop or RDSH server startup or login.
•App Volumes Agent – Software installed on all desktops and RDSH servers that runs as a service. It uses a filter driver to handle application calls and file system redirects to AppStacks and writable volumes.
•App Volumes Broker Integration Service – An optional component that can be installed on each View Connection Server to reduce user login time for View desktop pools by attaching volumes to virtual machines prior to user login. The broker was installed for testing.
•Active Directory – App Volumes uses Active Directory to assign AppStacks to user or computer accounts or AD groups. An AppStack cannot be attached to a computer and a logged-in user simultaneously—only one is possible at a time, and machine accounts take precedence. Writable volumes are assigned to an AD user account or AD group, one writable volume per user.
•SQL Server – App Volumes Manager is stateless and stores all configuration information in a remote SQL database in which each App Volumes Agent machine is cataloged by an identifier and BIOS_UUID. The BIOS_UUID matches the one used in the vCenter database. A clustered SQL Server is recommended for production deployments.

T E C H N I C A L W H I T E PA P E R / 6 4
VMware Horizon 6 with App Volumes and Virtual SAN Reference Architecture
•vCenter and ESXi hosts – App Volumes Manager connects to vCenter and uses BIOS_UUID for all VM reconfigure operations. Through Direct Connect, it is possible to bypass vCenter and issue mount commands directly to the ESXi host to speed up operations. Direct Connect was enabled throughout testing.
•Load Balancer – A load balancer can be introduced for production deployments to distribute HTTP and HTTPS requests efficiently across two or more App Volumes Manager servers.
App Volumes Manager has a default timeout of 3 minutes for VM reconfigure operations. This value was found to be insufficient for some of the more intensive tests, such as boot storm testing. The VM reconfigure task timeout was increased to 600 for testing by creating a new environment variable CV_RECONFIG_TIMEOUT on each App Volumes Manager server and restarting the App Volumes Manager service. This was the only change made from the default settings.
Figure 51: Reconfiguring the App Volumes Manager Timeout
Storage for Virtual SAN
Virtual SAN was used as storage for the linked-clone desktop pool.
Each ESXi host in the desktop cluster had the same configuration, and all disks were presented directly to the ESXi host and not configured in a RAID group.
Dell PowerEdge R7202 x Intel Xeon E5-2697 v212 C @ 2.70 GHz256 GB RAM
1 x Intel 10 GB 2P X520
1 x LSI 9207-8i
1 x 400 GB S3700 MLC SATA 6 Gbps SSD
6 x 600 GB 10K SAS 6 Gbps
Figure 52: Virtual SAN Cluster ESXi Configuration

T E C H N I C A L W H I T E PA P E R / 6 5
VMware Horizon 6 with App Volumes and Virtual SAN Reference Architecture
A single disk group was created on each ESXi, using one Intel S3700 400 GB SSD and six 600 GB HP 10 K SAS disks. This configuration was validated for a medium or office worker View Planner workload. For heavier workloads, 15 K disks are recommended, and additional disk groups per server might be required.
Figure 53: Virtual SAN Disk Group
Collectively, the seven disk groups combined to form a Virtual SAN datastore of 22.92 TB.
Figure 54: Virtual SAN Cluster Resources

T E C H N I C A L W H I T E PA P E R / 6 6
VMware Horizon 6 with App Volumes and Virtual SAN Reference Architecture
Virtual SAN SizingThe recommended sizing for the SSD is 10 percent of the total consumed storage capacity, excluding FTT. For a pool of 700 linked-clone desktops that is expected to use 5 GB of disk space per virtual desktop, the figures would be:
10% (700 x 5) = 350 GB flash per cluster
For this particular configuration, the minimum recommended SSD size is 50 GB per host. Only magnetic disks count toward cluster capacity. The formula for cluster capacity is:
Num_hosts x Num_disk_groups x Num_disks_per_group x disk_size
For the test configuration, the formula for usable capacity was:
7 x 1 x 6 x 558 GB = 22.92 TB
Objects and ComponentsEach virtual machine deployed to a Virtual SAN datastore consists of the following set of objects.
VIRTUAL SAN OBJECTS OBJECT TYPE
VM Name Homespace VMX file, VM logs, CBRC digest
Virtual Disk File OS disk, AppStack VMDK, writable volumes
Virtual Disk Snapshots VM Snapshot, AppStack Redo log (when assigned, VM is powered on)
VM Swap (When VM is powered on)
Table 24: Virtual SAN Objects and Components
Each object consists of components, the number of which is determined by the storage policy. vSphere can set availability, capacity, and performance policies for each virtual machine deployed on the Virtual SAN datastore.
VIRTUAL SAN STORAGE POLICY CAPABILITIES
DESCRIPTION
Number of disks striped per object Number of HDDs across which each VM is striped
Flash read cache reservation (%) SSD capacity reserved as read cache for the virtual machine object
Number of failures to tolerate (FTT) Number of host, disk, or network failures a virtual machine object can tolerate.Maximum FTT=3
Object space reservation Percentage of the logical size of the object reserved, expressed as a percentage of the logical size of the object
Table 25: Virtual SAN Storage Policy Capabilities
To satisfy storage policy object availability requirements, Virtual SAN can maintain multiple copies or replicas of the virtual machine objects. The FTT value determines the number of replicas that are created. For n failures tolerated, n+1 copies of the virtual machine object are created, and 2n+1 hosts with storage are required.

T E C H N I C A L W H I T E PA P E R / 6 7
VMware Horizon 6 with App Volumes and Virtual SAN Reference Architecture
Virtual SAN witnesses are part of every storage object that has an FTT value greater than 0. A witness does not contain data, but it serves as a tiebreaker during availability decisions in the Virtual SAN cluster. Table 26 lists the number of replicas, witnesses, and components required to maintain availability.
NUMBER OF FAILURES TO TOLERATE
COMPONENT COUNT
NUMBER OF HOSTS NEEDED
COMPONENT TYPES
0 1 1 1 Replica
1 3 3 2 Replicas plus1 Witness
2 5 5 3 Replicas plus2 Witnesses
3 7 7 4 Replicas plus3 Witnesses
Table 26: Virtual SAN FTT Requirements
View has predefined storage policies that can be leveraged when a new desktop pool is created. Different types of desktop pool take different storage policies with varying capabilities.
Figure 55: View Virtual SAN Storage Policy Integration
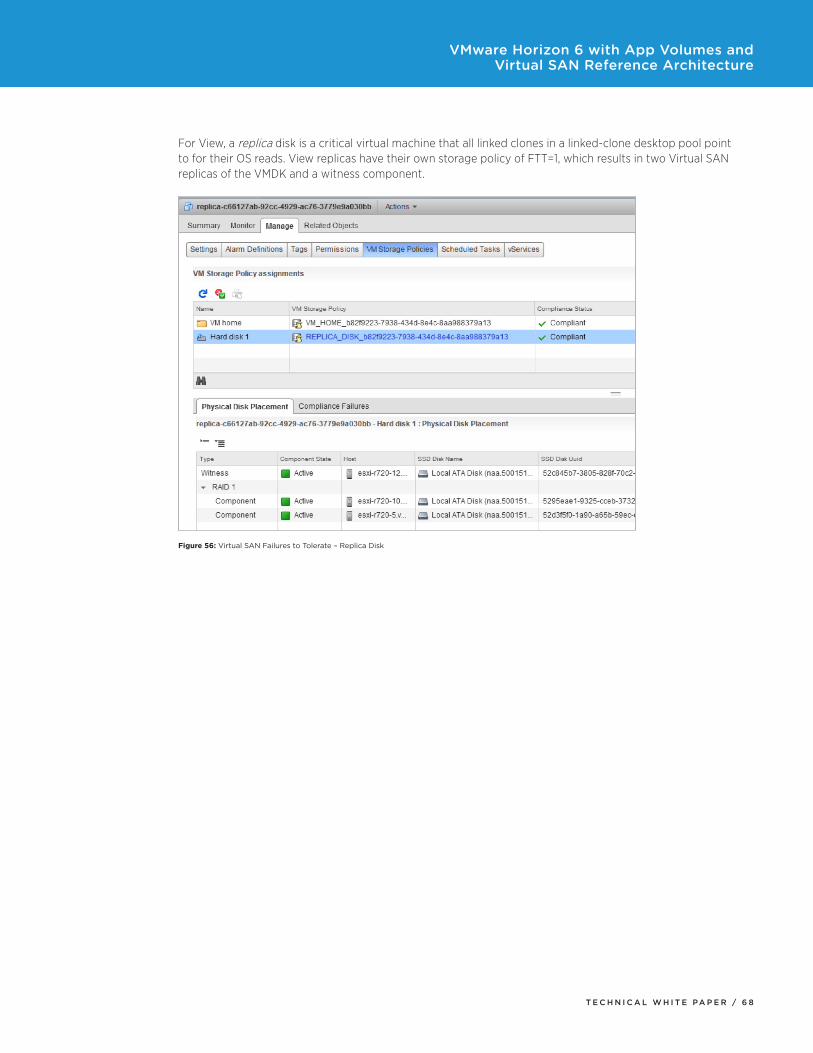
T E C H N I C A L W H I T E PA P E R / 6 8
VMware Horizon 6 with App Volumes and Virtual SAN Reference Architecture
For View, a replica disk is a critical virtual machine that all linked clones in a linked-clone desktop pool point to for their OS reads. View replicas have their own storage policy of FTT=1, which results in two Virtual SAN replicas of the VMDK and a witness component.
Figure 56: Virtual SAN Failures to Tolerate – Replica Disk

T E C H N I C A L W H I T E PA P E R / 6 9
VMware Horizon 6 with App Volumes and Virtual SAN Reference Architecture
In a pool of floating linked clones, FTT=0 for the virtual desktop OS disks. This setting provides no redundancy but consumes the minimum amount of disk space. In the event of a hardware failure, the virtual desktop becomes unavailable, but a user can log in to an available virtual machine within a matter of seconds and have access to profile data through writable volumes or View Persona.
Figure 57: Virtual SAN Failures to Tolerate – Floating Linked-Clone OS Disk
The number of objects per virtual machine, in addition to their performance and availability requirements, dictates the number of components to be created. Virtual SAN supports a maximum of 3,000 components per host, and 100 virtual machines per ESXi.
App Volumes AppStacks and writable volumes contribute to the number of components per host. The default storage policy for Virtual SAN objects is FTT=1, as shown below. It applies to all AppStacks and writable volumes created on the Virtual SAN datastore.
/~ # esxcli vsan policy getdefault
Policy Class Policy Value
------------ -------------------------------------------------------------
Cluster ((“hostFailuresToTolerate” i1))
Vdisk ((“hostFailuresToTolerate” i1))
vmnamespace ((“hostFailuresToTolerate” i1))
vmswap ((“hostFailuresToTolerate” i1) (“forceProvisioning” i1))
/~ #

T E C H N I C A L W H I T E PA P E R / 7 0
VMware Horizon 6 with App Volumes and Virtual SAN Reference Architecture
AppStacks are mounted on each desktop as independent, non-persistent disks. The resulting redo log shows three components per AppStack mounted on each desktop. For example, 700 desktops x 5 AppStacks x 3 components = 10,500 components per cluster.
Figure 58: Desktop with App Volumes AppStack Attached
Writable volumes are persistent. This results in just three components per writable volume. For example, 700 virtual desktops with writable volumes attached = 2,100 components per cluster.

T E C H N I C A L W H I T E PA P E R / 7 1
VMware Horizon 6 with App Volumes and Virtual SAN Reference Architecture
The maximum number of AppStacks and writable volumes that can be assigned to desktops on Virtual SAN can be derived from the default Virtual SAN storage policies in View and the type of desktop pool deployed.
USER ASSIGNMENT
VIRTUAL MACHINE TYPE
DISPOSABLE DISK
PERSISTENT DISK
COMPONENTS MAXIMUM NUMBER OF APPSTACKS OR WRITABLE VOLUMES PER DESKTOP
Floating Linked Clone
N N Replica 9Desktop 9
6 AppStacks or5 AppStacks plus 1 writable volume
Floating Linked Clone
Y N Replica 9Desktop 11
6 AppStacks or5 AppStacks plus 1 writable volume
Dedicated Linked Clone
Y Y Replica 9Desktop 24
1 AppStack or1 writable volume
Dedicated Linked Clone
N Y Replica 9Desktop 18
3 AppStacks or2 AppStacks plus 1 writable volume
Dedicated Linked Clone
Y N Replica 9Desktop 21
2 AppStacks or1 AppStack plus 1 writable volume
Floating Full Clone Desktop 7 7 AppStacks or6 AppStacks plus 1 writable volume
Dedicated Full Clone Desktop 9 6 AppStacks or5 AppStacks plus 1 writable volume
Table 27: Maximum Number of App Volumes AppStacks or Writable Volumes per View Pool Type
Note: Adjusting the default Storage Policy-Based Management policies alters the component counts listed in Table 27.
Taking the test configuration as an example, 700 floating linked-clone virtual desktops were provisioned, with no disposable disk and no persistent disk.

T E C H N I C A L W H I T E PA P E R / 7 2
VMware Horizon 6 with App Volumes and Virtual SAN Reference Architecture
The total number of components for the pool of 700 virtual machines is:
replica (9) + linked clones (700 x 9) = 6309 per cluster
/vcenter.vmwra.com/RA-DC/computers> vsan.check_limits DesktopCluster/
+------------------------+---------------------+--------------------------+
| Host | RDT | Disks |
+------------------------+---------------------+--------------------------+
| esxi-r720-5.vmwra.com | Assocs: 2869/20000 | Components: 901/3000 |
| | Sockets: 1565/10000 | naa.5000c500762183cf: 3% |
| | Clients: 517 | naa.5000c5007279b0cb: 3% |
| | Owners: 519 | naa.5000c5007279e727: 3% |
| | | naa.5000c500727a1fe3: 3% |
| | | naa.5000c5007279e62b: 3% |
| | | naa.50015178f35ff602: 0% |
| | | naa.5000c500727a45a7: 3% |
| esxi-r720-6.vmwra.com | Assocs: 2815/20000 | Components: 900/3000 |
| | Sockets: 1577/10000 | naa.5000c500727622e7: 3% |
| | Clients: 502 | naa.5000c500761f128b: 5% |
| | Owners: 500 | naa.50015178f360b5f9: 0% |
| | | naa.5000c50076218b33: 3% |
| | | naa.5000c50072742703: 3% |
| | | naa.5000c500727a3f6f: 3% |
| | | naa.5000c5007621cf53: 3% |
| esxi-r720-9.vmwra.com | Assocs: 2699/20000 | Components: 902/3000 |
| | Sockets: 1485/10000 | naa.5000c50072762077: 3% |
| | Clients: 472 | naa.5000c5007279fed7: 3% |
| | Owners: 477 | naa.50015178f35f55fb: 0% |
| | | naa.5000c50072761167: 3% |
| | | naa.5000c50076217437: 3% |
| | | naa.5000c5007279e77b: 4% |
| | | naa.5000c5007273311b: 3% |
| esxi-r720-11.vmwra.com | Assocs: 2881/20000 | Components: 902/3000 |
| | Sockets: 1587/10000 | naa.50015178f35ffb0d: 0% |
| | Clients: 522 | naa.5000c5007621de4f: 3% |
| | Owners: 516 | naa.5000c5007275fd07: 3% |
| | | naa.5000c5007279e5c3: 3% |
| | | naa.5000c50076217477: 3% |

T E C H N I C A L W H I T E PA P E R / 7 3
VMware Horizon 6 with App Volumes and Virtual SAN Reference Architecture
| | | naa.5000c50072740beb: 3% |
| | | naa.5000c500727625bb: 3% |
| esxi-r720-10.vmwra.com | Assocs: 2926/20000 | Components: 901/3000 |
| | Sockets: 1602/10000 | naa.5000c5007621cb13: 4% |
| | Clients: 542 | naa.50015178f3604b1e: 0% |
| | Owners: 526 | naa.5000c500727a269b: 5% |
| | | naa.5000c500727607c3: 2% |
| | | naa.5000c500727a1e8b: 4% |
| | | naa.5000c500762184b7: 3% |
| | | naa.5000c5007279bf7f: 3% |
| esxi-r720-12.vmwra.com | Assocs: 2658/20000 | Components: 901/3000 |
| | Sockets: 1474/10000 | naa.5000c5007275ed5f: 3% |
| | Clients: 462 | naa.5000c5007272dc5b: 4% |
| | Owners: 463 | naa.5000c5007622dfd7: 3% |
| | | naa.5000c5007621bccb: 3% |
| | | naa.5000c5007273461f: 4% |
| | | naa.5000c50076209fd3: 4% |
| | | naa.50015178f360b772: 0% |
| esxi-r720-8.vmwra.com | Assocs: 2810/20000 | Components: 902/3000 |
| | Sockets: 1552/10000 | naa.5000c5007621d30b: 3% |
| | Clients: 497 | naa.5000c5007275fbcb: 4% |
| | Owners: 502 | naa.5000c5007622410b: 3% |
| | | naa.50015178f35f6b76: 0% |
| | | naa.5000c5007272dd6b: 3% |
| | | naa.5000c500727a30ab: 3% |
| | | naa.5000c500727a178b: 4% |
+------------------------+---------------------+--------------------------+

T E C H N I C A L W H I T E PA P E R / 74
VMware Horizon 6 with App Volumes and Virtual SAN Reference Architecture
Based on this example, the maximum number of AppStacks and writable volumes that the configuration can accommodate is six AppStacks or five AppStacks plus one writable volume. Table 28 presents further details.
ITEM DESCRIPTION NUMBER OF COMPONENTS
Desktop pool View replica (9) + linked clones (9=700 x 9) 6,309
App Volumes folder and subdirectories
\\vmfs\volumes\vsanDatastore\cloudvolumes\... 3
AppStack 5 AppStack VMDKs (5 x 3) plus AppStack redo log (700 x 15)
10,515
Writable volume 700 desktops x writable volume components (3) 2,100
AppStack template 1 x default AppStack template 3
Writable volume template 3 x default AppStack template 9
Total components ClusterHost
18,9392,705
Table 28: Linked-Clone Pool (No Disposable or Persistent Disk) with Maximum AppStacks
The total number of components per cluster is 18,939, or approximately 2,705 components per ESXi, which falls inside the maximum threshold of 3,000.
/vcenter.vmwra.com/RA-DC/computers> vsan.check_limits DesktopCluster/
+------------------------+---------------------+---------------------------+
| Host | RDT | Disks |
+------------------------+---------------------+---------------------------+
| esxi-r720-5.vmwra.com | Assocs: 7531/20000 | Components: 2706/3000 |
| | Sockets: 4527/10000 | naa.5000c500762183cf: 5% |
| | Clients: 958 | naa.5000c5007279b0cb: 5% |
| | Owners: 1163 | naa.5000c5007279e727: 3% |
| | | naa.5000c500727a1fe3: 5% |
| | | naa.5000c5007279e62b: 6% |
| | | naa.50015178f35ff602: 0% |
| | | naa.5000c500727a45a7: 4% |
| esxi-r720-6.vmwra.com | Assocs: 7541/20000 | Components: 2709/3000 |
| | Sockets: 4623/10000 | naa.5000c500727622e7: 4% |
| | Clients: 1088 | naa.5000c500761f128b: 7% |
| | Owners: 1104 | naa.50015178f360b5f9: 0% |
| | | naa.5000c50076218b33: 5% |
| | | naa.5000c50072742703: 5% |
| | | naa.5000c500727a3f6f: 5% |

T E C H N I C A L W H I T E PA P E R / 7 5
VMware Horizon 6 with App Volumes and Virtual SAN Reference Architecture
| | | naa.5000c5007621cf53: 5% |
| esxi-r720-9.vmwra.com | Assocs: 7362/20000 | Components: 2704/3000 |
| | Sockets: 4520/10000 | naa.5000c50072762077: 4% |
| | Clients: 998 | naa.5000c5007279fed7: 5% |
| | Owners: 1086 | naa.50015178f35f55fb: 0% |
| | | naa.5000c50072761167: 4% |
| | | naa.5000c50076217437: 11% |
| | | naa.5000c5007279e77b: 5% |
| | | naa.5000c5007273311b: 6% |
| esxi-r720-11.vmwra.com | Assocs: 7548/20000 | Components: 2705/3000 |
| | Sockets: 4570/10000 | naa.50015178f35ffb0d: 0% |
| | Clients: 969 | naa.5000c5007621de4f: 4% |
| | Owners: 1148 | naa.5000c5007275fd07: 4% |
| | | naa.5000c5007279e5c3: 12% |
| | | naa.5000c50076217477: 4% |
| | | naa.5000c50072740beb: 5% |
| | | naa.5000c500727625bb: 5% |
| esxi-r720-10.vmwra.com | Assocs: 7113/20000 | Components: 2706/3000 |
| | Sockets: 4403/10000 | naa.5000c5007621cb13: 4% |
| | Clients: 939 | naa.50015178f3604b1e: 0% |
| | Owners: 1023 | naa.5000c500727a269b: 6% |
| | | naa.5000c500727607c3: 4% |
| | | naa.5000c500727a1e8b: 5% |
| | | naa.5000c500762184b7: 4% |
| | | naa.5000c5007279bf7f: 6% |
| esxi-r720-12.vmwra.com | Assocs: 7407/20000 | Components: 2704/3000 |
| | Sockets: 4525/10000 | naa.5000c5007275ed5f: 5% |
| | Clients: 1089 | naa.5000c5007272dc5b: 4% |
| | Owners: 1071 | naa.5000c5007622dfd7: 5% |
| | | naa.5000c5007621bccb: 5% |
| | | naa.5000c5007273461f: 4% |
| | | naa.5000c50076209fd3: 4% |
| | | naa.50015178f360b772: 0% |
| esxi-r720-8.vmwra.com | Assocs: 7510/20000 | Components: 2705/3000 |
| | Sockets: 4568/10000 | naa.5000c5007621d30b: 6% |
| | Clients: 1020 | naa.5000c5007275fbcb: 5% |

T E C H N I C A L W H I T E PA P E R / 7 6
VMware Horizon 6 with App Volumes and Virtual SAN Reference Architecture
| | Owners: 1118 | naa.5000c5007622410b: 5% |
| | | naa.50015178f35f6b76: 0% |
| | | naa.5000c5007272dd6b: 4% |
| | | naa.5000c500727a30ab: 5% |
| | | naa.5000c500727a178b: 4% |
+------------------------+---------------------+---------------------------+
Estimating Required Capacity A capacity sizing exercise based on the View pool of 700 floating linked clones uses the following assumptions to arrive at the sizing figures shown in Table 29:
•Replica disk – 24 GB
•Memory – 2 GB per virtual desktop (no memory reserved)
•Virtual desktop log size – 10 MB
•Maximum virtual desktop growth delta file – 5 GB
ITEM OBJECT CALCULATION SIZE (MB)
Replica disk Replica OS Disk Master replica size x (FTT_ReplicaDisk+1)
49,152
Witness_ReplicaDisk FTT_ReplicaDisk x 2 MB 2
Capacity required for replica disk
49,154 MB
Virtual desktops VMSwap File (.vswp) RAM_Size-MemoryReservation
2,048
Suspend State File (.vmss) RAM_Size 2,048
Witness_OS_Disk FTT_OS_Disk_VMDK x 2 MB 0
Estimated Delta Growth 5,120
VM_Log_file (FTT_VM_Home+1) x 10 MB 20
Witness_VM_Home (FTT_VM_Home+1) x 2 MB 4
Capacity required per linked clone
9236
Capacity required for 700 linked clones
6,465,200 MB
Estimated capacity required 6,514,354 MB
Table 29: App Volumes Datastore Sizing

T E C H N I C A L W H I T E PA P E R / 7 7
VMware Horizon 6 with App Volumes and Virtual SAN Reference Architecture
A liberal estimate for the required capacity is 6.51 TB. Reserving some memory and reducing the size of the swap file could further reduced this figure, but RAM was not reserved for testing, and the default virtual machine settings were used.
It is recommended to leave 30 percent free capacity across the Virtual SAN datastore to accommodate automatic rebuilds. It is possible to size for less capacity than this, but doing so can affect virtual SAN performance when datastore usage reaches 80 percent of capacity.
Storage for RDSH Hosts
Each ESXi host in the RDSH cluster used a local LSI Nytro WarpDrive 1.6 TB datastore for the duration of the testing. The RDSH servers and a copy of the AppStack were stored on each datastore.
2 x ESXi Hosts32 Cores, 512 GB RAM
RDSH VMs
2 x 1.6 TB datastoresAppVolumes AppStacksRDSH Servers
8 x RDSH Servers (8 x Active)
vCenter
RDSH Cluster
ESXi Cluster
Figure 59: Desktop with an App Volumes AppStack Attached

T E C H N I C A L W H I T E PA P E R / 7 8
VMware Horizon 6 with App Volumes and Virtual SAN Reference Architecture
Local storage facilitated a side-by-side performance analysis comparing Traditional Apps to AppStack apps. It was helpful in the sizing exercise, but it could not leverage VMware vSphere High Availability protection for the cluster. It also had the disadvantage of RDSH downtime for ESXi maintenance windows. Shared storage provides a more resilient solution for production deployments.
ATTRIBUTE SPECIFICATION DESCRIPTION
Number of RDSH servers per datastore
4 1.6 TB local datastores, offering 280,000 reads and 200,000 writes. Estimating 5 IOPS per hosted session, these datastores can comfortably support the IOPS requirements.
OS disk datastore size At least 288 GB Size is based on the following calculations:
•Serversize–40GB(WindowsServer2012R2)•Swapfilesize–32GB•Logfilesize(maximum)–10MB•Minimumallocateddatastoresize–288GB (4 virtual machines x (40960 + 32768 +10))
Total number of datastores
2 2 datastores required for 8 RDSH servers
Hosts per datastore 1 Each host has access to its own local datastore
Table 30: RDSH Datastore Sizing
Active Directory Group Policies
The design uses organizational units (OU) created specifically for View desktops, RDSH servers, and custom Group Policy Objects (GPO) created for App Volumes. An OU is an Active Directory subdivision that contains users, groups, computers, or other OUs.
Dedicated OUs allow View policies to be applied through GPOs to all machines created dynamically by View. RDSH servers can also be added manually to an OU to apply RDSH-specific policies.
View has administrative templates for managing View virtual desktops and RDSH servers. Administrators can import these templates and use GPOs to apply them to the respective OUs. This method provides a straightforward and consistent way to manage policies specific to View virtual desktops and users.
For this reference architecture:
•The created OUs allowed management of users, virtual desktops, and RDSH servers.
•Virtual desktops were added automatically to the virtual desktops and App Volumes OU when provisioned by vCenter or View Composer.
•RDSH servers were added manually to the RDSH services and App Volumes OU when provisioned with vCenter.
•Group policies were applied to RDSH servers and virtual desktops for folder redirection, profile management, and PCoIP.
•RDSH servers and virtual desktops needed Allow Log On Locally and Allow Log on Through Remote Desktop Services to be set for the appropriate user groups.
•Group policy loopback processing was enabled to ensure that policies were applied to users accessing computers within the RDSH services or virtual desktop OUs.

T E C H N I C A L W H I T E PA P E R / 7 9
VMware Horizon 6 with App Volumes and Virtual SAN Reference Architecture
vmwra.com
HorizonView–Test
Virtual Desktops (GPO – Blocked Inheritance)
Organizational Unit
Organizational Unit
HorizonView_PCoIP Policies AppVolumes GPO PoliciesVDI Computer Accounts
HorizonView_PCoIP Policies AppVolumes GPO Policies HorizonView_HomeDrive PoliciesRDSH Computer Accounts
RDSH Servers (GPO – Blocked Inheritance)
Organizational Unit
Figure 60: View with App Volumes Group Policies
PCoIP Group PolicyPCoIP is the default protocol for View desktops and applications. It can be configured with a Group Policy Administrative Template. Active Directory OUs were established for RDSH services and virtual desktops and a single PCoIP policy linked to both OUs.

T E C H N I C A L W H I T E PA P E R / 8 0
VMware Horizon 6 with App Volumes and Virtual SAN Reference Architecture
PCoIP settings were modified for optimal performance and resource utilization, as shown in Figure 5.
Figure 61: PCoIP Group Policy
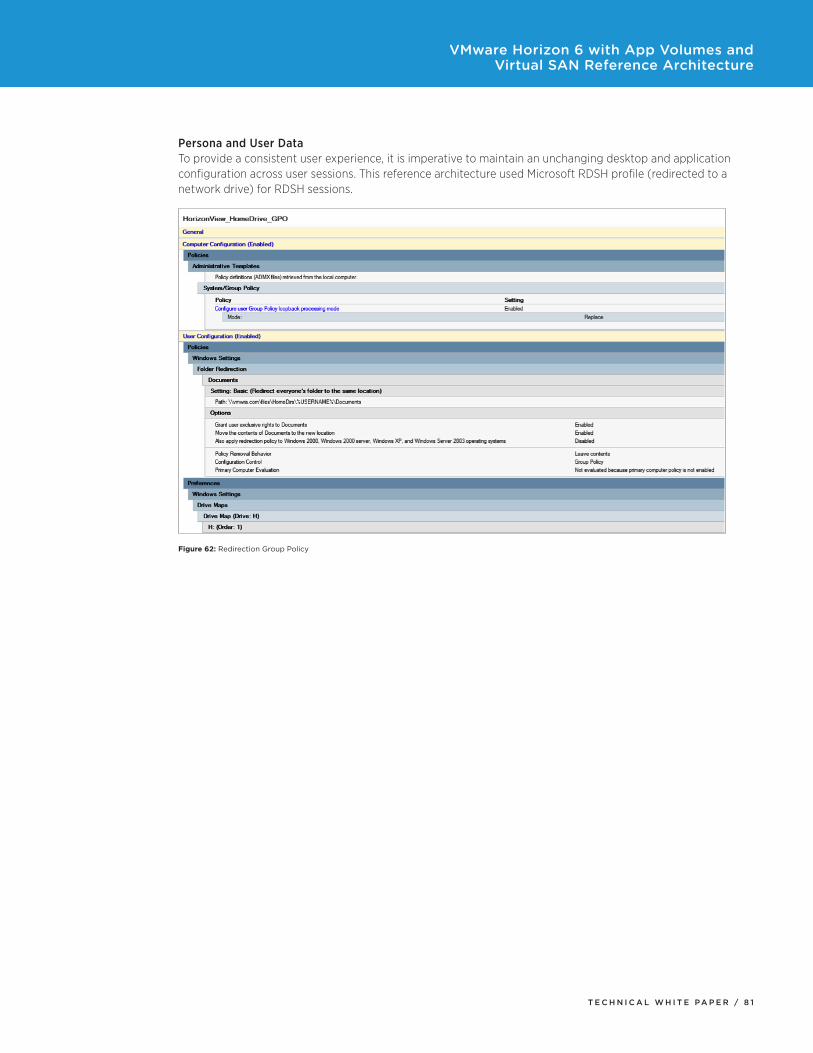
T E C H N I C A L W H I T E PA P E R / 8 1
VMware Horizon 6 with App Volumes and Virtual SAN Reference Architecture
Persona and User DataTo provide a consistent user experience, it is imperative to maintain an unchanging desktop and application configuration across user sessions. This reference architecture used Microsoft RDSH profile (redirected to a network drive) for RDSH sessions.
Figure 62: Redirection Group Policy

T E C H N I C A L W H I T E PA P E R / 8 2
VMware Horizon 6 with App Volumes and Virtual SAN Reference Architecture
App Volumes Group Policy
App Volumes Agent is configured with a single App Volumes Manager name at install. This name can be the primary App Volumes Manager or the virtual IP address (VIP) for a pool of App Volumes Manager servers, if a load balancer is used.
Additional App Volumes Manager servers can be configured, to mitigate the result of a failure of the primary, and added to the client with
HKLM\CurrentControlSet\Services\svservice\Parameters
Figure 63: GPO to Add Multiple App Volumes Manager Servers
The following additional configuration GPOs can be edited in the Windows registry.
•Log and timing
- LogFileSizeInKB – Size of the log file before rotating the log file. If undefined, the default is 5120 (5 MB).
- MaxDelayTimeOutS – Maximum wait for a response, in seconds, from the App Volumes Manager. If 0, wait forever. The default is 2 minutes.
- ResolveTimeOutMs – Number of milliseconds to wait for name resolution. If resolution takes longer than this timeout value, the action is canceled. The default is to wait for completion.
- ConnectTimeOutMs – Number of milliseconds to wait for server connection requests. If the request takes longer than this timeout value, it is canceled. The default is 10 seconds.
- SendTimeOutMs – Number of milliseconds to wait for sending requests. If the request takes longer than this timeout value, the send is canceled. The default is 30 seconds.

T E C H N I C A L W H I T E PA P E R / 8 3
VMware Horizon 6 with App Volumes and Virtual SAN Reference Architecture
- ReceiveTimeOutMs – Number of milliseconds to wait for a response to a request. If the response takes longer than this timeout value, the request is canceled. The default is 5 minutes.
- ProvisioningCompleteTimeOut – Number of seconds to keep trying to contact the App Volumes Manager after provisioning is completed. The default is 120 seconds.
- DomainNameWaitTimeOut – Number of seconds to wait for the computer to resolve the Active Directory domain name during startup. On non-domain-joined machines, this can be set to 1 to allow for a faster login time. The default is 60 seconds.
•Volume behavior parameters
- WaitForFirstVolumeOnly – Number of seconds to wait for for the first volume to load. After the first volume is complete, the rest are handled in the background, and the login process is allowed to proceed. To wait for all volumes to load before releasing the login process, set this value to 0. The default is 1.
- VolWaitTimeout – Number of seconds to wait for a volume to be processed before ignoring the volume and proceeding with the login process. The default is 180.
- VolDelayLoadTime – Number of seconds to delay volume attachments after the login process. This value is ignored if a writable volume is used. Writable volumes must be attached before AppStacks. If the value is greater than VolWaitTimeout, it is reduced to the value of VolWaitTimeout. This setting can speed up login time by delaying the virtualizing of applications until after login is complete. The default is 0 (do not delay load time).
•Services, drivers, and general behavior parameters
- RebootAfterDetach – If set to 1, automatically reboots the system after a user logs off. The default is 0.
- DisableAutoStartServices – If set to 1, services do not automatically start on volumes after attach. The default is 0.
- HidePopups – If set to 1, svservice.exe does not generate popups. The default is 0.
- DisableRunKeys – If set to 1, applications in the Run key are not called. This setting applies to both AppStacks and writable volumes. The default is 0.

T E C H N I C A L W H I T E PA P E R / 8 4
VMware Horizon 6 with App Volumes and Virtual SAN Reference Architecture
SQL ServervCenter, View, App Volumes, and View Composer require database connectivity to store information. This reference architecture used a Cluster In a Box to create a MSCS SQL Server 2008 R2 failover cluster for resiliency. For production use, Cluster Across Boxes is recommended. SQL Server configuration specifications are listed in Table 31.
ATTRIBUTE SPECIFICATION
Version SQL Server 2008 R2 Standard
Virtual machine hardware VMware Virtual Hardware version 9
OS Windows Server 2008 R2 Standard
vCPU 4
vMemory 10 GB
vNICs 2 (1 x production, 1 x private network)
Virtual network adapter 1 VMXNet3 adapter
Virtual SCSI controller 0 LSI Logic SAS
Virtual disk – VMDK (scsi0:x) Scsi0:1 Windows OS 40 GB
Virtual SCSI controller 1 LSI Logic SAS (bus sharing set to virtual)
Virtual disk – VMDK (scsi1:x) •scsi1:0ClusterQuorum1GB•scsi1:1SQLData100GB•scsi1:2SQLLog5GB•scsi1:3ClusterDTC2GB
Table 31: SQL Server Configuration

T E C H N I C A L W H I T E PA P E R / 8 5
VMware Horizon 6 with App Volumes and Virtual SAN Reference Architecture
Windows File ServicesView relies on file services to provide users with access to data. Two Windows file servers provide network shares for user data and RDSH profiles. Each file server is allocated a 100 GB disk.
Microsoft Distributed File System (DFS) is a highly available file services solution. The following table shows the DFS shares set up to replicate the data between the two file servers.
Note: Size file shares based on user quota and expected profile size.
ATTRIBUTE SPECIFICATION
Number of file servers 2
VM hardware VMware Virtual Hardware version 9
OS Windows Server 2012 R2 (64-bit)
vCPU 4
vMemory 10 GB
vNICs 1
Virtual network adapter 1 VMXNet3 adapter
Virtual SCSI controller 0 LSI Logic Parallel
Virtual disk – VMDK •40GBWindowsOS•100GBdatadisk:
- User home drives – \HomeDrives- RDSH profiles – \RDSHProfiles
Table 32: Windows File Services Configuration
vRealize Operations for HorizonvRealize Operations for Horizon simplifies the management of VDI and provides end-to-end visibility into its health and performance. It presents data through alerts, in configurable dashboards, and on predefined pages in the user interface.
vRealize Operations for Horizon extends the functionality of vRealize Operations and enables IT administrators and help desk specialists to monitor and manage Horizon with View environments.
vRealize Operations for Horizon uses an adapter to pull data from View Connection Server and View Agent. The View adapter obtains the topology from the Horizon environment, collects metrics and other types of information from the desktops, and passes the information to vCenter Operations Manager.
Another vCenter Server adapter pulls data relating to vSphere, networking, storage, and virtual machine performance.

T E C H N I C A L W H I T E PA P E R / 8 6
VMware Horizon 6 with App Volumes and Virtual SAN Reference Architecture
Out-of-the-box dashboards monitor the health of the Horizon infrastructure and components. Dashboards can be accessed from the Web-based vRealize Operations console.
vRealize Operations Console (Browser)
Uni�ed UI View Dashboards
Desktop Metrics(PCoIP, CPU, memory,disk, session info)
vSphere Metrics (ESX, virtual machine, datastore, data center)
Objects, metrics, KPIs, alerts, events
View Topology and Events
View Desktops
View Instance
VMware vRealize Operations for Horizon Architecture
View EventsDatabase
VMware vCenter Adapter
vRealize Operations for Horizon Adapter
View Connection Server View Database
vCenterServer
vRealize Operations Cluster
vRealize Operationsfor Horizon
Desktop Agent
vRealize Operationsfor Horizon
Broker Agent
Figure 64: vRealize Operations for Horizon Architecture

T E C H N I C A L W H I T E PA P E R / 8 7
VMware Horizon 6 with App Volumes and Virtual SAN Reference Architecture
vRealize Operations for Horizon consists of a SuSE Linux Enterprise 11 (64-bit) virtual appliance that supports 2,000 virtual desktops. The appliance collects data such as metrics, topology, and change events from vCenter Server and third-party sources. The Web UI appliance permits access to the analytics results and the Administration Portal to perform management tasks. An additional replica node is added to the vRealize Operations cluster for HA. It is also possible to add vRealize Operations nodes to the cluster for storage capacity.
ATTRIBUTE SPECIFICATION
Number of vRealize appliances 2
VM hardware VMware Virtual Hardware version 9
OS SuSE Linux Enterprise 11 (64-bit)
vCPU 4
vMemory 16 GB
vNICs 1
Virtual network adapter 1 VMXNet3 adapter
Virtual SCSI controller 0 LSI Logic Parallel
Virtual disk – VMDK 266 GB disk
Table 33: vRealize Operations Specifications
Availability
The system is resilient in the event of a component system failure. The design does not cover a disaster recovery scenario in which the entire site is lost, but it does cover limited component failure.
FAILURE POINT REDUNDANCY
Workspace Portal virtual appliance
Multiple virtual appliances provide a highly available Workspace Portal solution. No load balancer is required.
View security server At least two load-balanced View security servers are required for redundancy. If a server fails, users are disconnected from their session. User data is not lost, and a user can reconnect quickly. A third-party load balancer is required.
View Connection Server
At least two load-balanced View Connection Servers are required for redundancy. If a server fails, users are not disconnected from their session. A third-party load balancer is required.
View desktop If a desktop fails, the user might lose data. A new desktop can be provisioned if the current desktop cannot be fixed. Alternatively, a pool of pre-provisioned desktops allows users to quickly connect to another desktop.
RDSH server Users are disconnected from their session. View supports RDSH farms in which multiple RDSH servers are pooled for desktop or application access. Users can reconnect to a different RDSH server, but might have lost data.

T E C H N I C A L W H I T E PA P E R / 8 8
VMware Horizon 6 with App Volumes and Virtual SAN Reference Architecture
FAILURE POINT REDUNDANCY
vCenter Server If vCenter Server fails, View is not affected. Virtual desktops can still be connected, but new desktops cannot be provisioned. Workloads are not balanced across clustered hosts. Desktops cannot be powered on or off. Desktops with AppStacks or writable volumes are unaffected.
ESXi host If a virtual desktop host fails, the user loses connection to the desktop. The user can login to another available floating desktop or hosted session.
ESXi host: Virtual SAN node
If the ESXi host fails unexpectedly, any FTT=0 objects on the host are not available until ESXi is restored to service. If ESXi is unavailable for longer than the clomd timer setting (default is 60 minutes), rebuild kicks off for objects protected by distributed RAID (FTT>0).
View desktop cluster failure
If all hosts in a View desktop cluster lose connectivity or fail, users assigned to the desktop pools hosted on the affected cluster cannot access a virtual desktop until the cluster is restored.
Management cluster failure
The service is unavailable if the management cluster fails. Users directly accessing virtual desktops and RDSH servers are disconnected, but might lose services, such as printing, Active Directory, and user profile data.
App Volumes Manager One or more App Volumes Managers work in active-active. If one fails, service is not affected. If both fail, desktops with attached AppStacks or writable volumes are not affected.
SQL Server Two SQL Servers work as failover cluster. If one fails, the other takes over.
Table 34: Resiliency of Horizon Services

T E C H N I C A L W H I T E PA P E R / 8 9
VMware Horizon 6 with App Volumes and Virtual SAN Reference Architecture
ConclusionThis reference architecture evaluated a deployment for 960 users on 700 linked-clone View desktops and 260 RDSH sessions. This deployment was supported by Horizon 6 Enterprise Edition, which includes App Volumes and Virtual SAN. Performance was similar to high-end physical computers, with rapid desktop provisioning and excellent user experience characteristics across a wide range of use cases and application delivery methods.
Extensive test results support the following conclusions:
•App Volumes improved the desktop consolidation ratio and reduces CPU and memory usage while providing satisfactory or better end-user experience.
•Storage provisioning and management required little effort, and performance was excellent with low latency from Virtual SAN, even under heavy load.
•Desktop maintenance, storage provisioning and management, and application delivery and patching required only minimal time and effort from one administrator for this large deployment.
The tests were carried out with a defined set of applications required for View Planner workload testing and a streamlined desktop template. Production deployments should employ thorough testing, including a proof-of-concept phase, because results can vary depending on the environment, application set, and hardware and software configurations. In particular, the following practical measures are highly recommended:
•For heavy workloads, use 15 K magnetic disk drives in the Virtual SAN capacity layer.
•Deploy AppStacks with multiple applications to reduce the number of associated Virtual SAN components.
•Increase the App Volumes reconfigure timeout value CV_RECONFIG_TIMEOUT from the default of 300. It was set to 600 for the tests reported here.

T E C H N I C A L W H I T E PA P E R / 9 0
VMware Horizon 6 with App Volumes and Virtual SAN Reference Architecture
About the Author and ContributorsDonal Geary is a Desktop Virtualization Reference Architecture Engineer in the VMware End-User-Computing Group. He wishes to thank the following people for their contributions to the content and presentation of this paper:
•Stephane Asselin, Senior End-User-Computing Technical Enablement Architect, VMware
•Tristan Todd, End-User-Computing Technical Enablement Architect, VMware
•Gary Sloane, Consulting Editor, VMware
ReferencesOptimization Guide for Windows 7 and Windows 8 Virtual Desktops in Horizon with View
Wikibon Server SAN 2012-2026
Setup for Failover Clustering and Microsoft Cluster Service
View Documentation
View Planner Resources
View Technical Resources
VMware App Volumes Documentation
VMware Desktop Virtualization Services
VMware End-User Computing Solutions
VMware Horizon 6 Documentation
VMware Virtual SAN Documentation

T E C H N I C A L W H I T E PA P E R / 9 1
VMware Horizon 6 with App Volumes and Virtual SAN Reference Architecture
Appendix A: Linked Clones on Virtual SAN TestsThis appendix details the observed performance metrics for a side-by-side comparison for a View Planner medium workload test on a pool of 700 linked clones with Traditional Apps, a pool of linked clones with an AppStack, and a pool of linked clones with an AppStack and ThinApp packages. The following performance metrics are the average ESXi results from a cluster of seven ESXi servers.
AppStack with ThinApps
View Planner Workload TestESXi Reads for 100 Linked ClonesAppStack Versus AppStack with ThinApp Versus Traditional Apps
AppStack Traditional Apps
Time (in minutes)
Aver
age
ESXi
Rea
ds (p
s)
Figure 65: Linked-Clone Workload Test – ESXi Read Rate (KBps) Comparison

T E C H N I C A L W H I T E PA P E R / 9 2
VMware Horizon 6 with App Volumes and Virtual SAN Reference Architecture
As shown in Figure 9, for the 40–100 minute period, with the workload running concurrently on 700 desktops, the storage performance statistics are:
TRADITIONAL APPS
APPSTACK APPSTACK WITH THINAPP
Average read rate (KBps) 10,441 9,353 11,370
Maximum read rate (KBps) 19,888 26,963 34,743
Table 35: Linked-Clone Workload Test – ESXi Read Rate (KBps) Metrics
The AppStack desktop pool has 10 percent lower average read rate (KBps) and 30 percent higher maximum read rate (KBps) than the Traditional Apps desktop pool.
AppStack with ThinApps
View Planner Workload TestESXi Writes for 100 Linked ClonesAppStack Versus AppStack with ThinApp Versus Traditional Apps
AppStack Traditional Apps
Time (in minutes)
Aver
age
ESXi
Writ
es (p
s)
Figure 66: Linked-Clone Workload Test – ESXi Write Rate (KBps) Comparison
In the 40–100 minute period, with the workload running concurrently on 700 desktops, analysis of the storage performance statistics yields the following results:
TRADITIONAL APPS
APPSTACK APPSTACK WITH THINAPP
Average write (KBps) 12,146 10,163 12,222
Maximum write (KBps) 19,392 18,335 28,548
Table 36: Linked-Clone Workload Test – ESXi Write Rate (KBps) Metrics

T E C H N I C A L W H I T E PA P E R / 9 3
VMware Horizon 6 with App Volumes and Virtual SAN Reference Architecture
Appendix B: RDSH TestingThis appendix details the observed performance metrics for a side-by-side comparison for a View Planner medium workload test carried out on a pool of 260 RDSH sessions with Traditional Apps and a pool of RDSH sessions with an AppStack. The performance metrics below are the average ESXi results from two ESXi servers.
View Planner Workload TestESXi Memory Consumed (GB) for 130 RDSH SessionsTraditional Apps Versus AppStack
AppStack Traditional Apps
Time (in minutes)
ESXi
Mem
ory
Cons
umed
(GB)
Figure 67: RDSH Workload Test – ESXi Memory Consumed (GB) Comparison
RDSH TRADITIONAL APPS RDSH APPSTACK
Average memory consumed (GB) 101 115
Maximum memory consumed (GB) 104 118
Table 37: RDSH Workload Test – ESXi Memory Consumed (GB) Metrics

T E C H N I C A L W H I T E PA P E R / 9 4
VMware Horizon 6 with App Volumes and Virtual SAN Reference Architecture
View Planner Workload TestESXi Memory Active (GB) for 130 RDSH SessionsTraditional Apps Versus AppStack
AppStack Traditional Apps
Time (in minutes)
ESXi
Mem
ory
Usa
ge –
Act
ive
(GB)
Figure 68: RDSH Workload Test – ESXi Memory Active (GB) Comparison
RDSH TRADITIONAL APPS RDSH APPSTACK
Average memory active (GB) 47 47
Maximum memory active (GB) 72 74
Table 38: RDSH Workload Test – ESXi Memory Active (GB) Metrics

T E C H N I C A L W H I T E PA P E R / 9 5
VMware Horizon 6 with App Volumes and Virtual SAN Reference Architecture
View Planner Workload TestESXi Read Operations for 130 RDSH SessionsTraditional Apps Versus AppStack
AppStack Traditional Apps
Time (in minutes)
Read
Ope
ratio
ns (p
s)
Figure 69: RDSH Workload Test – ESXi Storage Reads per Second Comparison
RDSH TRADITIONAL APPS RDSH APPSTACK
Average reads per second 9 109
Maximum reads per second 501 901
Table 39: RDSH Workload Test – ESXi Storage Reads per Second Metrics

T E C H N I C A L W H I T E PA P E R / 9 6
VMware Horizon 6 with App Volumes and Virtual SAN Reference Architecture
View Planner Workload TestESXi Write Operations for 130 RDSH SessionsTraditional Apps Versus AppStack
AppStack Traditional Apps
Time (in minutes)
Writ
e O
pera
tions
(ps)
Figure 70: RDSH Workload Test – ESXi Storage Writes per Second Comparison
RDSH TRADITIONAL APPS RDSH APPSTACK
Average writes per second 371 354
Maximum writes per second 756 1,254
Table 40: RDSH Workload Test – ESXi Storage Writes per Second Metrics

T E C H N I C A L W H I T E PA P E R / 9 7
VMware Horizon 6 with App Volumes and Virtual SAN Reference Architecture
View Planner Workload TestESXi Read Rate for 130 RDSH SessionsTraditional Apps Versus AppStack
AppStack Traditional Apps
Time (in minutes)
Read
Rat
e (K
Bps)
Figure 71: RDSH Workload Test – ESXi Read Rate (KBps) Comparison
RDSH TRADITIONAL APPS RDSH APPSTACK
Average read rate (KBps) 418 3,151
Maximum read rate (KBps) 11,903 25,955
Table 41: RDSH Workload Test – ESXi Read Rate (KBps) Metrics

T E C H N I C A L W H I T E PA P E R / 9 8
VMware Horizon 6 with App Volumes and Virtual SAN Reference Architecture
View Planner Workload TestESXi Write Rate for 130 RDSH SessionsTraditional Apps Versus AppStack
AppStack Traditional Apps
Time (in minutes)
Writ
e Ra
te (K
Bps)
Figure 72: RDSH Workload Test – ESXi Write Rate (KBps) Comparison
RDSH TRADITIONAL APPS RDSH APPSTACK
Average write rate (KBps) 7,901 6,467
Maximum write rate (KBps) 22,053 82,861
Table 42: RDSH Workload Test – ESXi Write Rate (KBps) Metrics

T E C H N I C A L W H I T E PA P E R / 9 9
VMware Horizon 6 with App Volumes and Virtual SAN Reference Architecture
View Planner Workload TestESXi Network Receive for 130 RDSH SessionsTraditional Apps Versus AppStack
AppStack Traditional Apps
Time (in minutes)
Net
_Rx
(KBp
s)
Figure 73: RDSH Workload Test – ESXi Network Receive Rate (KBps) Comparison
RDSH TRADITIONAL APPS RDSH APPSTACK
Average network Rx (KBps) 93 98
Maximum network Rx (KBps) 294 387
Table 43: RDSH Workload Test – ESXi Network Receive Rate (KBps) Metrics

T E C H N I C A L W H I T E PA P E R / 1 0 0
VMware Horizon 6 with App Volumes and Virtual SAN Reference Architecture
View Planner Workload TestESXi Network Transmit for 130 RDSH SessionsTraditional Apps Versus AppStack
AppStack Traditional Apps
Time (in minutes)
Net
_Tx
(KBp
s)
Figure 74: RDSH Workload Test – ESXi Network Transmit Rate (KBps) Comparison
RDSH TRADITIONAL APPS RDSH APPSTACK
Average network transmits (KBps) 508 532
Maximum network transmits (KBps) 1,545 1,412
Table 44: RDSH Workload Test – ESXi Network Transmit Rate (KBps) Metrics

T E C H N I C A L W H I T E PA P E R / 1 0 1
VMware Horizon 6 with App Volumes and Virtual SAN Reference Architecture
Appendix C: Writable Volumes TestThis appendix details the observed performance metrics for a side-by-side comparison for a View Planner medium workload test carried out on a pool of 100 linked-clone desktops with and without an App Volumes writable volume attached for user profile data.
View Planner Workload TestESXi CPU Usage (MHz) for 100 Linked ClonesTraditional Desktops Versus Desktops with Writable Volumes
Pool 2: Desktops with Writable VolumesPool 1: Traditional Desktops
CPU
Usa
ge (M
Hz)
Time (in minutes)
Figure 75: Writable Volumes Test – ESXi CPU Usage (MHz) Comparison
POOL 1 – TRADITIONAL DESKTOPS DATASTORE
POOL 2 – DESKTOPS WITH WRITABLE VOLUMES
Average CPU MHz 31,583 MHz 32,549 MHz
Maximum CPU MHz 44,499 MHz 46,399 MHz
Table 45: Writable Volumes Test – ESXi CPU Usage (MHz) Metrics

T E C H N I C A L W H I T E PA P E R / 1 0 2
VMware Horizon 6 with App Volumes and Virtual SAN Reference Architecture
View Planner Workload TestESXi Memory Active (GB) for 100 Linked ClonesTraditional Desktops Versus Desktops with Writable Volumes
Pool 2: Desktops with Writable VolumesPool 1: Traditional Desktops
ESXi
Mem
ory
Activ
e (G
B)
Time (in minutes)
Figure 76: Writable Volumes Test – ESXi Memory Active (GB) Comparison
There was no difference in average active memory usage (44 GB). The maximum observed active memory was higher for the pool without a writable volume than for the pool with a writable volume.
POOL 1 – TRADITIONAL DESKTOPS DATASTORE
POOL 2 – DESKTOPS WITH WRITABLE VOLUMES
Average memory active 44 GB 44 GB
Maximum memory active 79 GB 77 GB
Table 46: Writable Volumes Test – ESXi Memory Active (GB) Metrics

T E C H N I C A L W H I T E PA P E R / 1 0 3
VMware Horizon 6 with App Volumes and Virtual SAN Reference Architecture
View Planner Workload TestESXi Memory Consumed (GB) for 100 Linked ClonesTraditional Desktops Versus Desktops with Writable
Pool 2: Desktops with WritablePool 1: Traditional Desktops
ESXi
Mem
ory
Usa
ge –
Con
sum
ed (G
B)
Time (in minutes)
Figure 77: Writable Volumes Test – ESXi Memory Consumed (GB) Comparison
POOL 1 – TRADITIONAL DESKTOPS DATASTORE
POOL 2 – DESKTOPS WITH WRITABLE VOLUMES
Average memory consumed 213 GB 213 GB
Maximum memory consumed 213 GB 213 GB
Table 47: Writable Volumes Test – ESXi Memory Consumed (GB) Metrics
There was no difference in average memory consumed.

T E C H N I C A L W H I T E PA P E R / 1 0 4
VMware Horizon 6 with App Volumes and Virtual SAN Reference Architecture
View Planner Workload TestESXi Reads for 100 Linked ClonesTraditional Desktops Versus Desktops with Writable
Pool 1: Traditional Desktops
Pool 2: Desktops with Writable – Linked-Clones Datastore
Pool 2: Desktops with Writable – Writable-Volumes Datastore
ESXi
Rea
ds (p
s)
Time (in minutes)
Figure 78: Writable Volumes Test – ESXi Reads per Second Comparison
POOL 1 – TRADITIONAL DESKTOPS DATASTORE
POOL 2 – DESKTOP DATASTORE
POOL 2 – WRITABLE-VOLUMES DATASTORE
Average reads 769 756 9
Maximum reads 6,172 6,844 249
Table 48: Writable Volumes Test – ESXi Reads per Second Metrics

T E C H N I C A L W H I T E PA P E R / 1 0 5
VMware Horizon 6 with App Volumes and Virtual SAN Reference Architecture
View Planner Workload TestESXi Writes for 100 Linked ClonesTraditional Desktops Versus Desktops with Writable
Pool 1: Traditional Desktops
Pool 2: Desktops with Writable – Linked-Clones Datastore
Pool 2: Desktops with Writable – Writable-Volumes Datastore
ESXi
Writ
es (p
s)
Time (in minutes)
Figure 79: Writable Volumes Test – ESXi Writes per Second Comparison
POOL 1 – TRADITIONAL DESKTOPS DATASTORE
POOL 2 – DESKTOP DATASTORE
POOL 2 – WRITABLE-VOLUMES DATASTORE
Average writes per second 379 318 124
Maximum writes per second
1,660 1,674 593
Table 49: Writable Volumes Test – ESXi Writes per Second Metrics

T E C H N I C A L W H I T E PA P E R / 1 0 6
VMware Horizon 6 with App Volumes and Virtual SAN Reference Architecture
View Planner Workload TestESXi Read Rate for 100 Linked ClonesTraditional Desktops Versus Desktops with Writable
Pool 1: Traditional Desktops
Pool 2: Desktops with Writable – Linked-Clones Datastore
Pool 2: Desktops with Writable – Writable-Volumes Datastore
ESXi
Rea
d Ra
te (K
Bps)
Time (in minutes)
Figure 80: Writable Volumes Test – ESXi Read Rate (KBps) Comparison
POOL 1 – TRADITIONAL DESKTOPS DATASTORE
POOL 2 – DESKTOP DATASTORE
POOL 2 – WRITABLE-VOLUMESDATASTORE
Average read rate (KBps) 814 694 240
Maximum read rate (KBps) 15,809 16,246 5,220
Table 50: Writable Volumes Test – ESXi Read Rate (KBps) Metrics

T E C H N I C A L W H I T E PA P E R / 1 0 7
VMware Horizon 6 with App Volumes and Virtual SAN Reference Architecture
View Planner Workload TestESXi Write Rate for 100 Linked ClonesTraditional Desktops Versus Desktops with Writable
Pool 1: Traditional Desktops
Pool 2: Desktops with Writable – Linked-Clones Datastore
Pool 2: Desktops with Writable – Writable-Volumes Datastore
ESXi
Writ
e Ra
te (K
Bps)
Time (in minutes)
Figure 81: Writable Volumes Test – ESXi Write Rate (KBps) Comparison
POOL 1 – TRADITIONAL DESKTOPS DATASTORE
POOL 2 – DESKTOP DATASTORE
POOL 2 – WRITABLE-VOLUMES DATASTORE
Average write rate (KBps) 2,613 1,674 1,107
Maximum write rate (KBps)
24,748 9,621 14,810
Table 51: Writable Volumes Test – ESXi Write Rate (KBps) Metrics

T E C H N I C A L W H I T E PA P E R / 1 0 8
VMware Horizon 6 with App Volumes and Virtual SAN Reference Architecture
Appendix D: Bill of Materials
AREA COMPONENT QUANTITY
Server Management: Dell PowerEdge R720 2
Intel Xeon E5-2690 8C @ 2.90 GHz 2
16 GB DIMMs 16
LSI 9207_8i 1
Intel Ethernet 10G 2P X520 1
1 GB SD Card 1
Desktops: Dell PowerEdge R720 7
Intel Xeon E5-2697 v2 12C @ 2.70 GHz 2
16 GB DIMMs 16
LSI 9207_8i 1
Intel Ethernet 10G 2P X520 1
1 GB SD Card 1
Intel 400 GB S3700 MLC SATA 6 Gbps SSD 1
Dell 600 GB 10 K RPM 2.5in 6 Gbps SAS 6
RDSH: Dell PowerEdge R720 2
Intel Xeon E5-2690 8C @ 2.90 GHz 2
16 GB DIMMs 16
LSI 9207_8i 1
LSI Nytro WarpDrive BLP4-1600 1.6 TB 1
Intel Ethernet 10G 2P X520 1
1 GB SD Card 1
Storage Management: 1.5 TB NAS Datastore 1
RDSH: 750 GB NAS Datastore 2
Desktops: Virtual SAN Datastore 22.92 TB 1
Network Dell Force10 S4810 10/40GbE 2

VMware, Inc. 3401 Hillview Avenue Palo Alto CA 94304 USA Tel 877-486-9273 Fax 650-427-5001 www.vmware.comCopyright © 2015 VMware, Inc. All rights reserved. This product is protected by U.S. and international copyright and intellectual property laws. VMware products are covered by one or more patents listed athttp://www.vmware.com/go/patents. VMware is a registered trademark or trademark of VMware, Inc. in the United States and/or other jurisdictions. All other marks and names mentioned herein may be trademarks of their respective companies. Item No: VMW-TWP-HORI6APPVOLVSANRA-USLET-20150826-WEB
VMware Horizon 6 with App Volumes and Virtual SAN Reference Architecture
AREA COMPONENT QUANTITY
Software Horizon Enterprise Edition 1,000 users
Microsoft Windows 7 VDA 1,000 users
Microsoft RDSH CAL 1,000 users
Microsoft Windows 2012 R2 27
Microsoft Windows 2008 R2 2
Microsoft SQL Server 2008 R2 2
Table 52: Bill of Materials


![Distributed Case Management in the Public Health Area...Documentum xCP [39], Kofax with Kofax TotalAgility [40], Whitestein Technologies with Living Systems Process Suite [41], DST](https://img.pdfslide.us/doc/110x75/60a7ad75fcf0913e9a7003d3/distributed-case-management-in-the-public-health-area-documentum-xcp-39-kofax.jpg)