Embed Size (px)
Citation preview
May 16, 2013
© Anderson Economic Group, LLC, 2013Permission to reproduce in entirety granted with proper citation. All other rights reserved.
Anderson Economic Group, LLC1555 Watertower Place, Suite 100East Lansing, Michigan 48823Tel: (517) 333-6984Fax: (517) 333-7058
www.AndersonEconomicGroup.com
Embracing Entrepreneurship: The URC’s Growing Support for Entrepreneurs in Michigan and Throughout the World
Prepared by:Anderson Economic Group, LLCErin Agemy Grover, Senior AnalystColby Spencer Cesaro, Senior AnalystSamantha Superstine, Senior Analyst
Foreword by:Patrick L. Anderson, Principal & CEO
Commissioned by the University Research Corridor:Michigan State UniversityUniversity of MichiganWayne State University
Anderson Economic Group, LLC i
Foreword
I am extremely pleased to introduce this report on the hottest topic in today’s economy: entrepreneurship. As a two-time graduate of a URC university, and the founder of two companies, I feel a special kinship with fellow alumni entre-preneurs, and know first-hand how their struggles can produce innovation, employment, and advancement for our society.
Until recently, America’s thought leaders tended to concentrate on the role of big business in the economy. Certainly, my home state of Michigan greatly ben-efited from large corporations like General Motors, Ford, and Chrysler. How-ever, small businesses generate the majority of new jobs in the United States. Furthermore, recently-started companies are often the fastest-growing in the economy, as well as those generating a disproportionate share of investment and innovation.
While we have excellent data on the revenues, products, and employees of well--established businesses, we have not kept very good tabs on our entrepreneurs. This study, one of the largest ever attempted, fills in a lot of what has been miss-ing.
What we found is very encouraging. The alumni of the three major research uni-versities in Michigan—Michigan State University, the University of Michigan, and Wayne State University—are now, and have been for decades, starting and sustaining businesses at an impressive rate. In particular:
• Nearly one in five—19%—of URC alumni have started a new business. This statistic is hugely impressive when you consider the number of alumni from these universities, and the multi-decade breadth of the alumni we surveyed.
• Contrary to the popular myth that most entrepreneurs are twenty-something wunderkinds, the highest rate of entrepreneurship was among the more experi-enced alumni: graduates from the 1960s and 1970s.
• URC alumni entrepreneurs have a wide global reach, starting businesses in all 50 U.S. states, and over 100 different countries.
• Over half of the businesses started by alumni are in fields that are different than the degree they received when they graduated. This suggests that the classical university ideals of creating an educated workforce also benefits society by increasing both innovation and the number of employers.
• There is some evidence that recent graduates are starting businesses several years earlier in their careers. This suggests that the efforts by the universities to acquaint students with entrepreneurship, and provide them with encouragement and resources on the topic, is starting to pay off.
These results arise from a neutrally-worded, very-large sample survey of gradu-ates from the 1930s through the 2010s. With the cooperation of the universities and their alumni offices, this survey was sent to nearly half a million of the 1.2 million living alumni of the three universities. We received over 40,000 valid responses on a range of topics, including whether they had started or acquired a company during their careers, and were neither encouraged nor discouraged
Anderson Economic Group, LLC ii
from indicating if they were entrepreneurs. Of course, all survey data is subject to some uncertainty. However, the careful steps taken by our research team, the URC, and other partners, accompanied by the very large number of responses, mean that we can be confident in our findings.
The traditional role of universities has been to prepare students to participate in civil society, and to enhance the base of knowledge and culture in that society. Consistent with that aim, this study shows that Michigan’s major research uni-versities are preparing their graduates to enrich society by founding businesses that become both pillars of the community, and foundations of the economy of the future.
Patrick L. Anderson
Patrick L. Anderson founded Anderson Economic Group, LLC in 1996, and serves as the CEO of that company. He also founded Supported Intelligence, LLC in 2012, and serves as the executive chairman of that firm.
Mr. Anderson is the author of numerous published works, including the just-released The Economics of Business Valuation from Stanford University Press. He was recognized in 2004 and again in 2008 for “outstanding writing in busi-ness economics” by the National Association for Business Economics. Mr. Anderson received his bachelor’s and master’s degrees from the University of Michigan.
Table of Contents
Anderson Economic Group, LLC
I. Executive Summary............................................................. 1About this Series ...................................................................................... 1Report Purpose ......................................................................................... 1Overview of Approach ............................................................................. 1Summary of Findings ............................................................................... 2About Anderson Economic Group ........................................................... 7
II. An Introduction to Entrepreneurship.................................. 8Defining Entrepreneurship ....................................................................... 8What It Means to Start a Business ........................................................... 9Rate of Firm Survival ............................................................................. 12Role of the URC Universities in Fostering Entrepreneurship ............... 15
III. Supplying Entrepreneurs: URC Alumni .......................... 16Common Characteristics of URC Alumni Entrepreneurs ...................... 16Companies Created by URC Alumni ..................................................... 22URC Entrepreneurs in Michigan ........................................................... 32Economic Footprint of URC-Alumni Firms .......................................... 36
IV. Providing Tools: The Academic Foundation at the URC Universities ...................................................................... 38
Big Picture: How the URC Supports Entrepreneurship ......................... 38Research and Technology Transfer ....................................................... 39Cultivating Talent .................................................................................. 42Curriculum ............................................................................................. 44Expanding Beyond the Conventional Role ............................................ 48
V. Supporting The Entrepreneurial Process: The Evolving Role of the URC Universities .......................................... 50
An Overview of URC Programs and Resources Available to Entrepreneurs ....................................................................................... 50
Incubators and Collaborative Workspace .............................................. 53Start-ups and Entity Formation .............................................................. 54Networking, Conferences, and Additional Support Services ................ 56Engagement with Community Entrepreneurs and Resources ................ 61Alumni Perspective on URC’s Evolving Role ....................................... 64
Appendix A. Data and Methodology ..................................... A-1
Appendix B. Alumni Survey Instrument ................................ B-1
Appendix C: About the Authors ............................................ C-1
Executive Summary
Anderson Economic Group, LLC 1
I. Executive Summary
ABOUT THIS SERIES This report is part of a series of studies that began in 2007 regarding the impact of the URC institutions (Michigan State University, University of Michigan, and Wayne State University) on specific sectors of the Michigan economy. Past reports have highlighted the life sciences industry, advanced manufacturing, alternative energy, and other sectors. This report focuses on entrepreneurs, who affect nearly every sector in the economy.
REPORT PURPOSE Universities play an important role in many aspects of our economic prosperity, from advancing technology to educating a productive workforce. What is less often examined is their role in another source of economic progress: entrepre-neurship. Entrepreneurs build a business from an idea, a new product, or improve upon an existing business. They coordinate product development, secure funding, build a team, and face many more challenges while starting and growing a business.
Defining Entrepreneurship. For the purpose of this report, we define entrepre-neurship as creating a business or acquiring an existing company. We define the entrepreneur as the owner, founder, or co-founder of a firm.1
This report examines the ways in which Michigan’s URC universities contribute to and support entrepreneurship. Specifically, this report:
• Examines the contribution that URC alumni entrepreneurs have made, by sum-marizing the results of a large-scale alumni survey on the number, size, type, nature, economic footprint, and location of the thousands of businesses that were founded or acquired by URC alumni;
• Describes the contribution that universities have always made to entrepreneur-ship by creating technologies that underlie new products and services and edu-cating students that will go on to start or run businesses; and
• Describes the role that URC universities are now playing with increased vigor in fostering entrepreneurship by offering specialized curricula and providing other programs and initiatives that support entrepreneurs as they strive to get their businesses off the ground.
OVERVIEW OF APPROACH
This report examines the URC universities’ contributions to entrepreneurship by analyzing extensive survey data on entrepreneurial activity and its connec-tion to URC universities by profiling alumni, and examining the existing curric-ulum, programs, and other support provided by the universities. To acquire data on URC alumni, the URC hired an independent survey firm, Survey Sciences Group, LLC (SSG), to conduct an “Alumni Impact Survey.” The goal of this alumni survey was to better understand their occupations, industries, entrepre-neurial endeavors, and geographies.
1. Our discussion of URC alumni entrepreneurs is based on responses from an Alumni Impact Survey, which is described on this page in “Overview of Approach.” The survey asked alumni whether or not they had started or acquired a business.
Executive Summary
Anderson Economic Group, LLC 2
AEG reviewed the survey questions to ensure question framing and phrasing would not bias the results.2 SSG administered the survey, which had 40,752 complete responses out of the nearly half a million (452,608) URC alumni sur-veyed.3
SSG provided AEG with the survey data, which we used to identify common characteristics of URC alumni entrepreneurs, as well as estimate the economic footprint of firms started by alumni in terms of revenue, payroll, and employees. This is discussed in detail in “To see the survey questions pertaining to URC alumni entrepreneurs, see Exhibit 2 “2013 URC Alumni Survey Instrument, Section B: Entrepreneurship,” on page B-4. We discuss the survey instrument itself in Appendix B.” on page A-5. This report also uses data from the URC universities and interviews with URC faculty involved in entrepreneur pro-grams at each university.
SUMMARY OF FINDINGS
1. The primary connection of the URC universities to entrepreneurship is educating a large number of people who are more likely than average to start or acquire a business.
19.1% OF URC ALUMNI RESPONDENTS HAVE FOUNDED OR CO-FOUNDED A BUSINESS.
Of the 45,432 respondents who completed the question, 8,673 responded posi-tively when asked whether or not they had ever started a business. As the sur-vey is representative of the URC population as a whole, we can estimate the total number of URC alumni that have founded or co-founded a business. Of the URC’s 1.2 million living alumni, we estimate nearly 229,000 have started at least one business. This does not include alumni entrepreneurs who have acquired a business.
SURVEY RESPONDENTS REPORTED STARTING 14,435 BUSINESSES TO-DATE, WHICH AMOUNTS TO 1.67 BUSINESSES ON AVERAGE PER ALUMNI ENTREPRENEUR.
According to the survey, URC alumni entrepreneurs have started 1.67 busi-nesses on average. We estimate that more than 380,000 firms have been started to-date by URC alumni entrepreneurs.4
THE RATE OF ENTREPRENEURIAL ACTIVITY AMONG URC ALUMNI IS MORE THAN TWICE THAT OF THE U.S. AVERAGE SINCE 1996.
2. Respondents were invited to participate in a general alumni survey. Questions included in the survey did not require respondents to self-identify as entrepreneurs. See “Survey Methods and Potential Sources of Bias” on page A-3.
3. Not all respondents answered every question.We discuss partial and complete survey responses, as well as how the response rate is more than sufficient for our sample size in “Responses” on page A-2.
4. See “To see the survey questions pertaining to URC alumni entrepreneurs, see Exhibit 2 “2013 URC Alumni Survey Instrument, Section B: Entrepreneurship,” on page B-4. We dis-cuss the survey instrument itself in Appendix B.” on page A-5 for information about our esti-mates.
Executive Summary
Anderson Economic Group, LLC 3
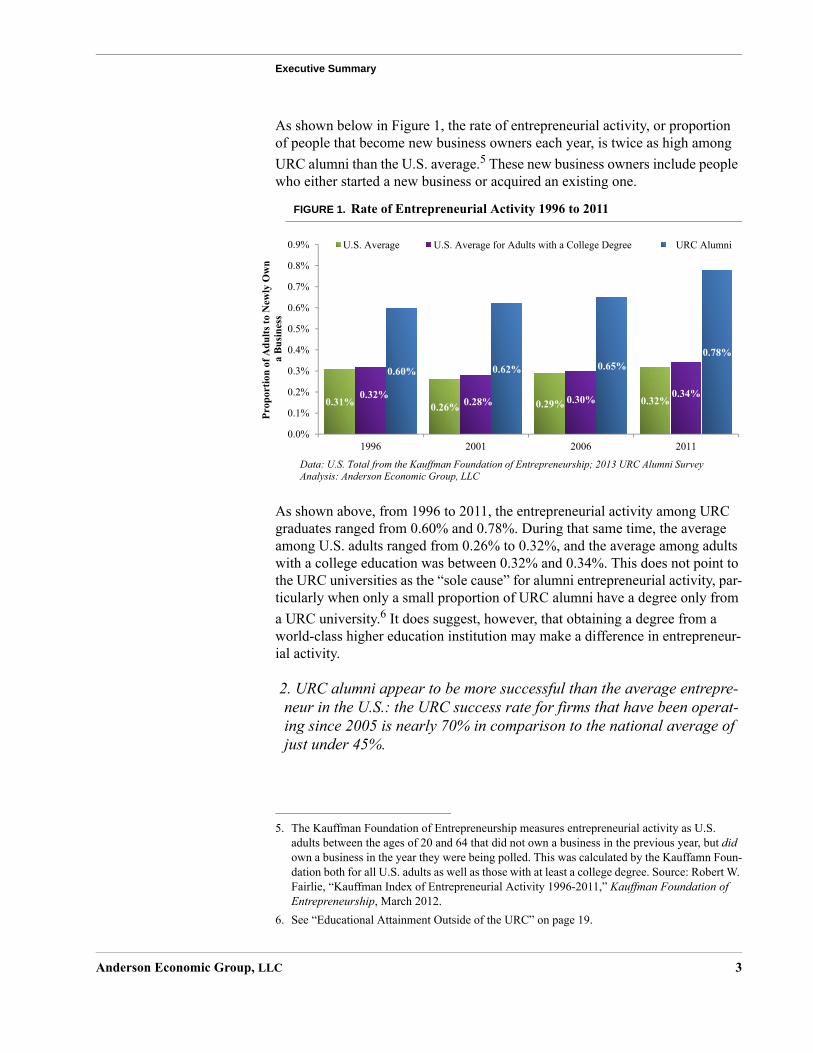
As shown below in Figure 1, the rate of entrepreneurial activity, or proportionof people that become new business owners each year, is twice as high amongURC alumni than the U.S. average.5 These new business owners include peoplewho either started a new business or acquired an existing one.
FIGURE 1. Rate of Entrepreneurial Activity 1996 to 2011
As shown above, from 1996 to 2011, the entrepreneurial activity among URC graduates ranged from 0.60% and 0.78%. During that same time, the average among U.S. adults ranged from 0.26% to 0.32%, and the average among adults with a college education was between 0.32% and 0.34%. This does not point to the URC universities as the “sole cause” for alumni entrepreneurial activity, par-ticularly when only a small proportion of URC alumni have a degree only from a URC university.6 It does suggest, however, that obtaining a degree from a world-class higher education institution may make a difference in entrepreneur-ial activity.
2. URC alumni appear to be more successful than the average entrepre-neur in the U.S.: the URC success rate for firms that have been operat-ing since 2005 is nearly 70% in comparison to the national average of just under 45%.
5. The Kauffman Foundation of Entrepreneurship measures entrepreneurial activity as U.S. adults between the ages of 20 and 64 that did not own a business in the previous year, but did own a business in the year they were being polled. This was calculated by the Kauffamn Foun-dation both for all U.S. adults as well as those with at least a college degree. Source: Robert W. Fairlie, “Kauffman Index of Entrepreneurial Activity 1996-2011,” Kauffman Foundation of Entrepreneurship, March 2012.
0.31% 0.26% 0.29% 0.32%0.32%0.28% 0.30% 0.34%
0.60% 0.62% 0.65%0.78%
Prop
ortio
n of
Adu
lts to
New
ly O
wn
a Bu
sine
ss
Data: U.S. Total from the Kauffman Foundation of Entrepreneurship; 2013 URC Alumni SurveyAnalysis: Anderson Economic Group, LLC
6. See “Educational Attainment Outside of the URC” on page 19.
Executive Summary
Anderson Economic Group, LLC 4
Firms started in 2005 by URC graduates are approximately 1.5 times as success-ful at remaining in operation as the average business started in the same year.7 Of the businesses started or purchased by URC alumni in 2005, 69% reported still being in operation at the time of the survey. The U.S. Census reported 43% of all U.S. businesses started that year to be in operation five years later (2010).
This high success rate still holds when we look beyond firms started or acquired in 2005 to all firms reported in the survey. Of the firms ever started or acquired by URC alumni, 58% were still in operation and run by their founders at the time of the survey, and 11% are still in operation but have been acquired from URC alumni by other companies or entrepreneurs. This gives a combined “suc-cess rate” of 69% among firms ever run by URC entrepreneurs. If we apply the survey success rate to our estimates of total firms started by the URC, we esti-mate about 220,000 are still in operation and 42,000 have been acquired.
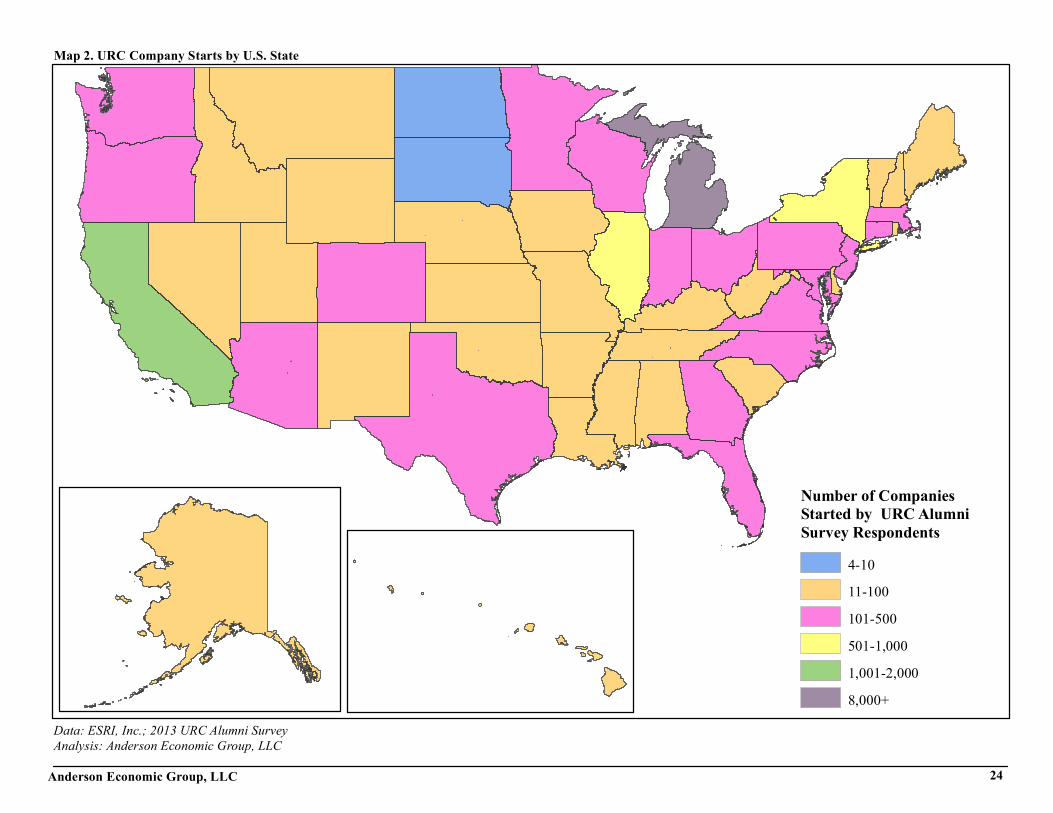
3. While nearly half of the companies started by URC alumni are located in Michigan, the URC’s entrepreneurial reach touches all 50 U.S. states and 100 different countries.
Over 10,000 businesses were started in the U.S. by survey respondents. Canada, India, and China had the second most business starts by URC grads with 116, 75, and 50 businesses, respectively. There were at least four, and in most cases many more, businesses started by URC alumni in each U.S. state. Other than Michigan, URC alumni started the most companies in California, New York, and Illinois, with at least 500 companies started by survey respondents in each.
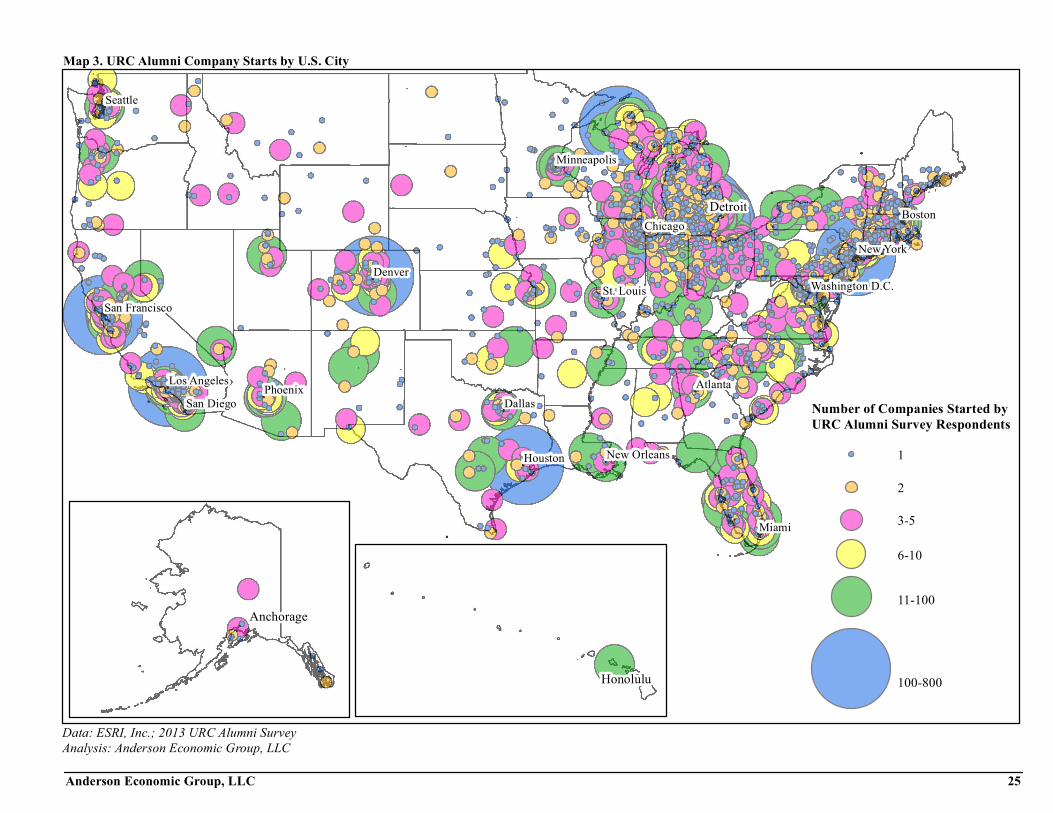
Many new businesses were started by alumni in large metropolitan areas such as Los Angeles, New York, Chicago, San Francisco, Houston, and Washington, D.C. See Map 2, “URC Alumni Company Starts by U.S. State,” on page 24 and Map 3, “URC Alumni Company Starts by U.S. City,” on page 25.
4. URC-alumni firms employed an estimated 5.5 million people in 2012. Respondents reported employing 201,173 people in 2012. This is an underesti-mate of the total employed for all URC-alumni-started firms that were operating in 2012 because it only represents the firms in the survey. We estimate that the firms operated by URC alumni in 2012 employed 5.5 million, which is roughly equal to the population of Finland. For more information on our methods please see “To see the survey questions pertaining to URC alumni entrepreneurs, see Exhibit 2 “2013 URC Alumni Survey Instrument, Section B: Entrepreneur-ship,” on page B-4. We discuss the survey instrument itself in Appendix B.” on page A-5.
7. Business Dynamic Statistics, which is collected by the U.S. Census Bureau, publishes annual data on firm exits and entrances. The most recent data available was for 2010. Therefore, we used 2005 start dates to determine the most current five-year success rates for U.S. firms on average. To access this data see: http://www.census.gov/ces/dataproducts/bds/data.html.
Executive Summary
Anderson Economic Group, LLC 5
5. URC graduates that have started a business come from all majors and work in all industries, suggesting that the URC universities excel in pre-paring graduates with a broad base of skills useful in business.
ACCORDING TO THE SURVEY DATA, THERE WERE 10 DEGREE CATEGORIES WITH GRAD-UATES THAT HAD A HIGHER RATE OF STARTING A BUSINESS ON AVERAGE.
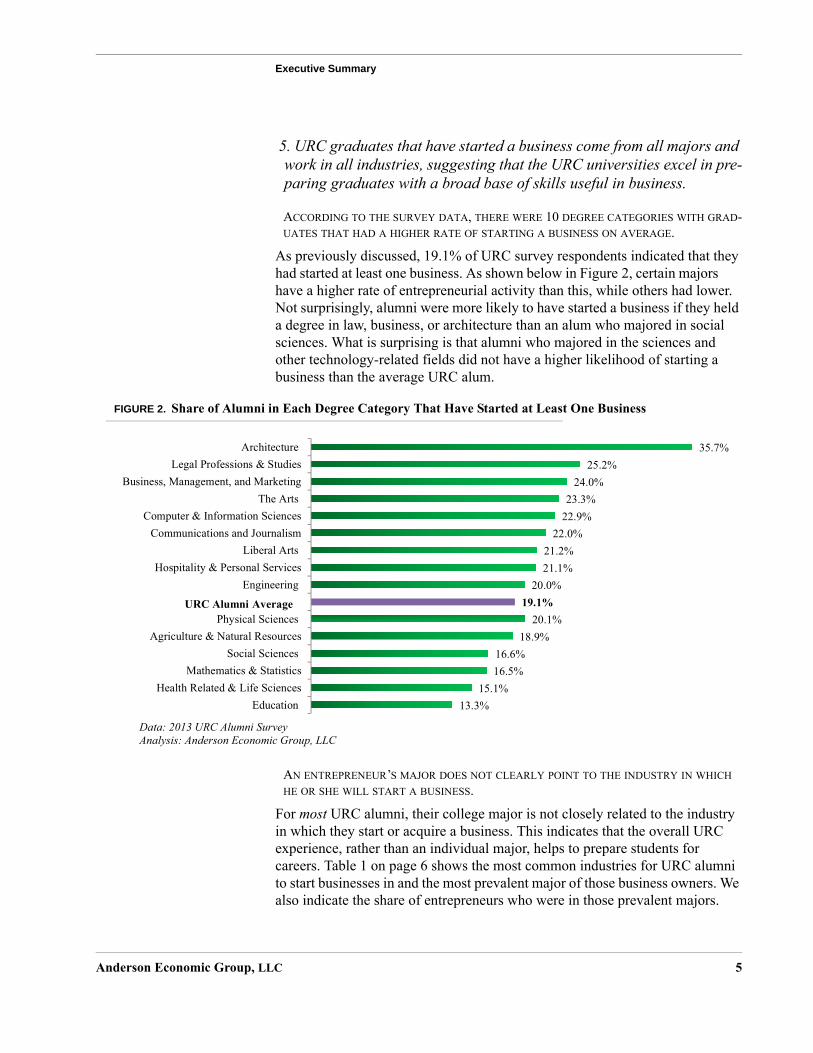
As previously discussed, 19.1% of URC survey respondents indicated that they had started at least one business. As shown below in Figure 2, certain majors have a higher rate of entrepreneurial activity than this, while others had lower. Not surprisingly, alumni were more likely to have started a business if they held a degree in law, business, or architecture than an alum who majored in social sciences. What is surprising is that alumni who majored in the sciences and other technology-related fields did not have a higher likelihood of starting a business than the average URC alum.
FIGURE 2. Share of Alumni in Each Degree Category That Have Started at Least One Business
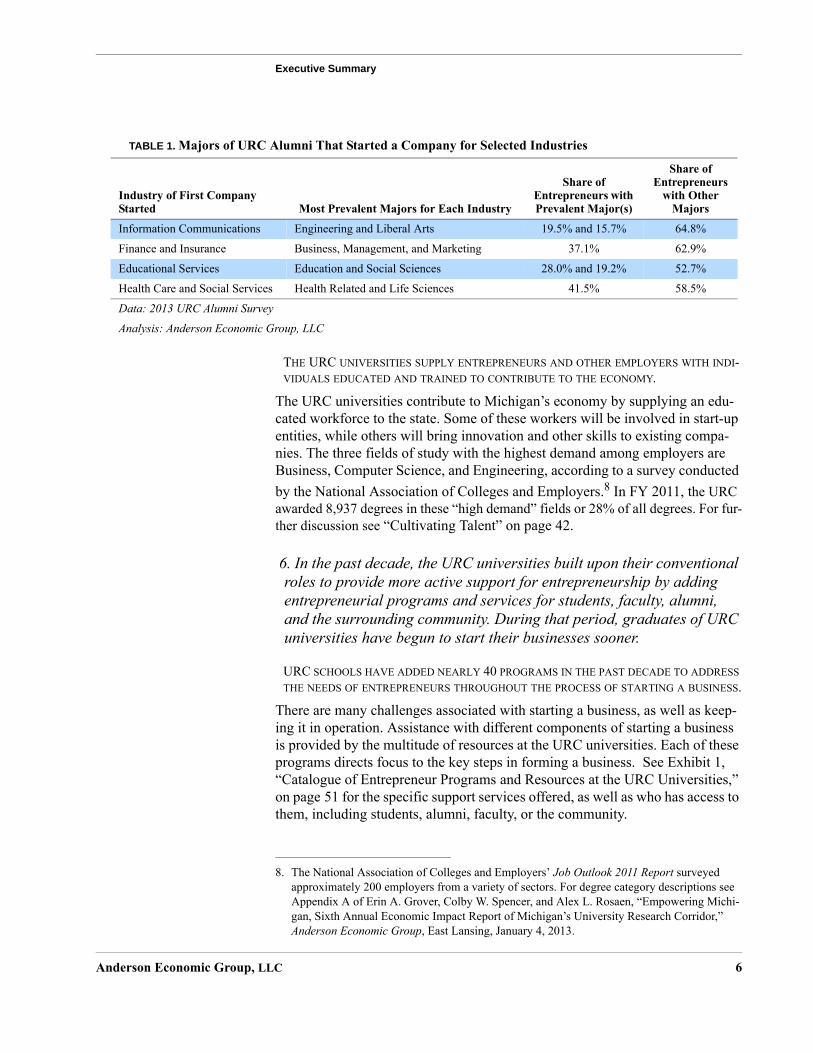
AN ENTREPRENEUR’S MAJOR DOES NOT CLEARLY POINT TO THE INDUSTRY IN WHICH HE OR SHE WILL START A BUSINESS.
For most URC alumni, their college major is not closely related to the industry in which they start or acquire a business. This indicates that the overall URC experience, rather than an individual major, helps to prepare students for careers. Table 1 on page 6 shows the most common industries for URC alumni to start businesses in and the most prevalent major of those business owners. We also indicate the share of entrepreneurs who were in those prevalent majors.
35.7%25.2%
24.0%23.3%
22.9%22.0%
21.2%21.1%
20.0%19.1%
20.1%18.9%
16.6%16.5%
15.1%13.3%
ArchitectureLegal Professions & Studies
Business, Management, and MarketingThe Arts
Computer & Information SciencesCommunications and Journalism
Liberal ArtsHospitality & Personal Services
Engineering
Physical SciencesAgriculture & Natural Resources
Social SciencesMathematics & Statistics
Health Related & Life SciencesEducation
Data: 2013 URC Alumni SurveyAnalysis: Anderson Economic Group, LLC
URC Alumni Average
Executive Summary
Anderson Economic Group, LLC 6
THE URC UNIVERSITIES SUPPLY ENTREPRENEURS AND OTHER EMPLOYERS WITH INDI-VIDUALS EDUCATED AND TRAINED TO CONTRIBUTE TO THE ECONOMY.
The URC universities contribute to Michigan’s economy by supplying an edu-cated workforce to the state. Some of these workers will be involved in start-up entities, while others will bring innovation and other skills to existing compa-nies. The three fields of study with the highest demand among employers are Business, Computer Science, and Engineering, according to a survey conducted by the National Association of Colleges and Employers.8 In FY 2011, the URC awarded 8,937 degrees in these “high demand” fields or 28% of all degrees. For fur-ther discussion see “Cultivating Talent” on page 42.
6. In the past decade, the URC universities built upon their conventional roles to provide more active support for entrepreneurship by adding entrepreneurial programs and services for students, faculty, alumni, and the surrounding community. During that period, graduates of URC universities have begun to start their businesses sooner.
URC SCHOOLS HAVE ADDED NEARLY 40 PROGRAMS IN THE PAST DECADE TO ADDRESS THE NEEDS OF ENTREPRENEURS THROUGHOUT THE PROCESS OF STARTING A BUSINESS.
There are many challenges associated with starting a business, as well as keep-ing it in operation. Assistance with different components of starting a business is provided by the multitude of resources at the URC universities. Each of these programs directs focus to the key steps in forming a business. See Exhibit 1, “Catalogue of Entrepreneur Programs and Resources at the URC Universities,” on page 51 for the specific support services offered, as well as who has access to them, including students, alumni, faculty, or the community.
TABLE 1. Majors of URC Alumni That Started a Company for Selected Industries
Industry of First Company Started Most Prevalent Majors for Each Industry
Share of Entrepreneurs with Prevalent Major(s)
Share of Entrepreneurs
with Other Majors
Information Communications Engineering and Liberal Arts 19.5% and 15.7% 64.8%
Finance and Insurance Business, Management, and Marketing 37.1% 62.9%
Educational Services Education and Social Sciences 28.0% and 19.2% 52.7%
Health Care and Social Services Health Related and Life Sciences 41.5% 58.5%
Data: 2013 URC Alumni Survey
Analysis: Anderson Economic Group, LLC
8. The National Association of Colleges and Employers’ Job Outlook 2011 Report surveyed approximately 200 employers from a variety of sectors. For degree category descriptions see Appendix A of Erin A. Grover, Colby W. Spencer, and Alex L. Rosaen, “Empowering Michi-gan, Sixth Annual Economic Impact Report of Michigan’s University Research Corridor,” Anderson Economic Group, East Lansing, January 4, 2013.
Executive Summary
Anderson Economic Group, LLC 7
For further discussion see “Providing Tools: The Academic Foundation at the URC Universities” on page 38 and “Supporting The Entrepreneurial Process: The Evolving Role of the URC Universities” on page 50.
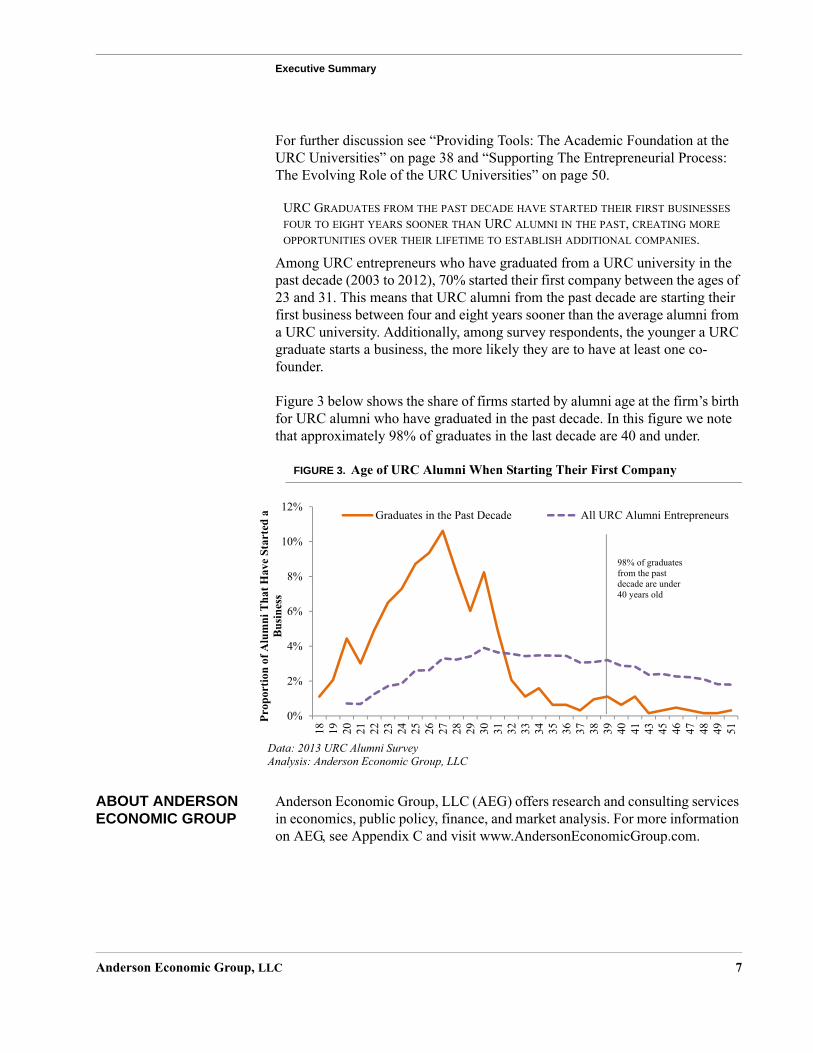
URC GRADUATES FROM THE PAST DECADE HAVE STARTED THEIR FIRST BUSINESSES FOUR TO EIGHT YEARS SOONER THAN URC ALUMNI IN THE PAST, CREATING MORE OPPORTUNITIES OVER THEIR LIFETIME TO ESTABLISH ADDITIONAL COMPANIES.
Among URC entrepreneurs who have graduated from a URC university in the past decade (2003 to 2012), 70% started their first company between the ages of 23 and 31. This means that URC alumni from the past decade are starting their first business between four and eight years sooner than the average alumni from a URC university. Additionally, among survey respondents, the younger a URC graduate starts a business, the more likely they are to have at least one co-founder.
Figure 3 below shows the share of firms started by alumni age at the firm’s birth for URC alumni who have graduated in the past decade. In this figure we note that approximately 98% of graduates in the last decade are 40 and under.
FIGURE 3. Age of URC Alumni When Starting Their First Company
ABOUT ANDERSON ECONOMIC GROUP
Anderson Economic Group, LLC (AEG) offers research and consulting services in economics, public policy, finance, and market analysis. For more information on AEG, see Appendix C and visit www.AndersonEconomicGroup.com.
0%
2%
4%
6%
8%
10%
12%
18 19 20 21 22 23 24 25 26 27 28 29 30 31 32 33 34 35 36 37 38 39 40 41 43 45 46 47 48 49 51
Prop
ortio
n of
Alu
mni
Tha
t Hav
e St
arte
d a
Bus
ines
s
Graduates in the Past Decade All URC Alumni Entrepreneurs
Data: 2013 URC Alumni SurveyAnalysis: Anderson Economic Group, LLC
98% of graduatesfrom the past decade are under 40 years old
An Introduction to Entrepreneurship
Anderson Economic Group, LLC 8
II. An Introduction to Entrepreneurship
The emergence of innovating giants such as Bill Gates, Steve Jobs, Mark Zuck-erberg, and the like, has rapidly re-introduced “entrepreneur” as a popular buzz-word. Although entrepreneurs have had a substantial presence throughout U.S. economic history, there is no universal meaning of the words “entrepreneur” or “entrepreneurship.” Therefore, to begin this section, we define both for the con-text of this report. We then describe the challenging and often frustrating pro-cess of starting a business. We also discuss the high rate of failure for small businesses, particularly during the first crucial years of the establishment pro-cess. We close with a brief introduction of how the URC universities foster entrepreneurship, which is contained in the last three chapters of this report.
DEFINING ENTREPRENEURSHIP
Entrepreneurship can mean different things to different people. The irish econo-mist Richard Cantillon described entrepreneur as a risk-bearer as early as the eighteenth century.9 Loosely translated from French, entrepreneur means “to undertake.” Entrepreneurs embark on risky undertakings, with very little assur-ance of an end reward. Those undertakings generally, in some capacity, create wealth, whether it be in terms of knowledge, innovation, or employment.
An entrepreneur may create an innovative way of marketing, distributing, or branding an existing product, or invent something entirely new. Or an entrepre-neur can be someone who acts with the perspective of a business owner, whether it be in a management, advisory, or investment capacity. Entrepreneur-ship can refer to the inclination to seek out opportunities to create a brand new business.
For the purpose of this report, we define entrepreneurship as creating a busi-ness or acquiring an existing firm; the entrepreneur is defined as the owner, founder, or co-founder of that firm. The URC Alumni Survey did not ask respondents to self-identify as an “entrepreneur,” rather it asked within a battery of questions if they started a company or purchased a business.10 Furthermore, how self-employed individuals answered those questions would dictate whether they would be included in our discussion of URC alumni entrepreneurs.
Entrepreneurs are critical elements to the success, prosperity, growth, and opportunity in any economy. Every firm from a doctor’s private practice to an innovative bio-tech company contributes to the market by providing goods and/or services to consumers, as well as support employment. Even failing or failed
9. Vivian, Walsh, The New Palgrave Dictionary of Economics, 2011 Version, pp. 150-154. 10.The introductory letter given to each respondent from their alma mater’s president described
the purpose of the survey to be to collect information about alumni occupations, industries, entrepreneurial endeavors, and geographies, so as to better understand the impact that URC alumni have on the economies of Michigan, the United States, and the world.
An Introduction to Entrepreneurship
Anderson Economic Group, LLC 9
firms are significant in the U.S., a dynamic economy, because it forces firms to constantly adjust to external events and changing consumer preferences. We provide context regarding firm failures in the U.S. in “Rate of Firm Survival” on page 12.
WHAT IT MEANS TO START A BUSINESS
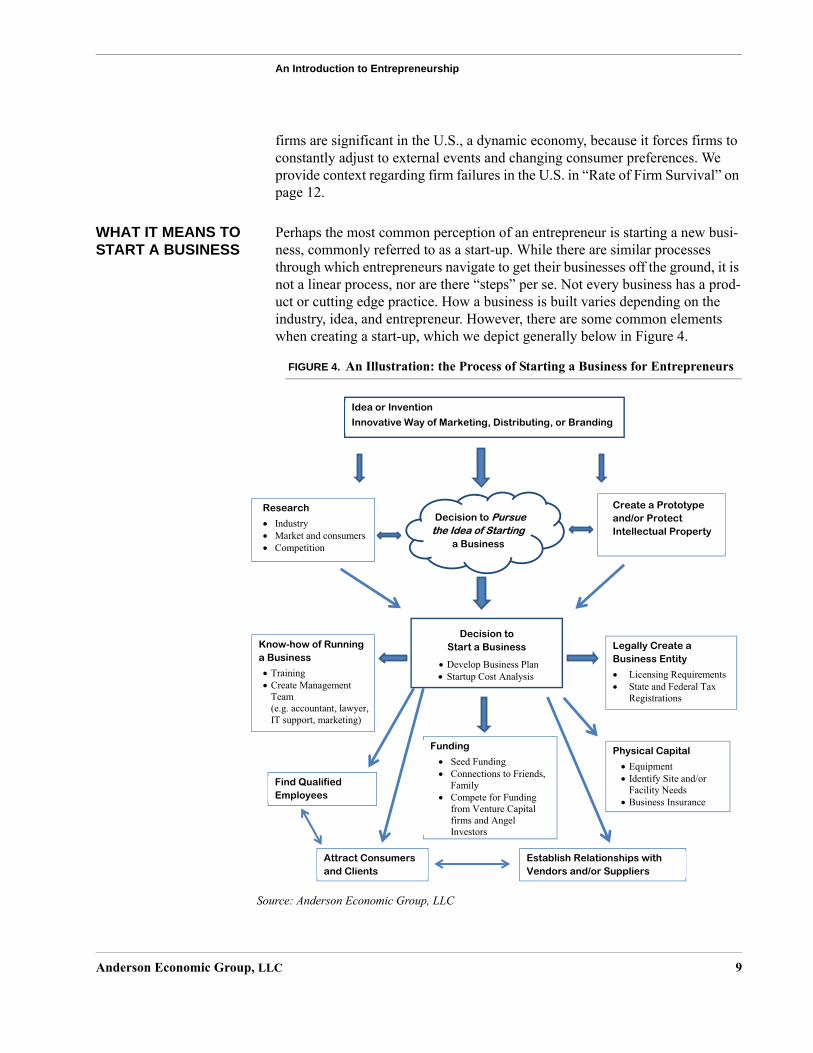
Perhaps the most common perception of an entrepreneur is starting a new busi-ness, commonly referred to as a start-up. While there are similar processes through which entrepreneurs navigate to get their businesses off the ground, it is not a linear process, nor are there “steps” per se. Not every business has a prod-uct or cutting edge practice. How a business is built varies depending on the industry, idea, and entrepreneur. However, there are some common elements when creating a start-up, which we depict generally below in Figure 4.
FIGURE 4. An Illustration: the Process of Starting a Business for Entrepreneurs
Idea or Invention
Innovative Way of Marketing, Distributing, or Branding
Research
� Industry � Market and consumers � Competition
Decision to Start a Business
� Develop Business Plan � Startup Cost Analysis
Know-how of Running a Business
� Training � Create Management
Team (e.g. accountant, lawyer, IT support, marketing)
Legally Create a Business Entity
� Licensing Requirements � State and Federal Tax
Registrations
Funding
� Seed Funding � Connections to Friends,
Family � Compete for Funding
from Venture Capital firms and Angel Investors
Create a Prototype and/or Protect Intellectual Property
Physical Capital
� Equipment � Identify Site and/or
Facility Needs � Business Insurance
Decision to Pursue tthe Idea of Starting
a Business
Find Qualified Employees
Attract Consumers and Clients
Establish Relationships with Vendors and/or Suppliers
Source: Anderson Economic Group, LLC
An Introduction to Entrepreneurship
Anderson Economic Group, LLC 10
Starting a business generally begins with an idea. That idea can be anything from improving upon a current product or practice to meeting a need in the mar-ket. Wonderfully, but rarely, an idea can lead to a ground-breaking invention. Certain ideas have varying first steps: the type of idea and the entrepreneur tend to dictate whether the venture requires a prototype, intellectual property advice, market research, or other due diligence before a decision is made about actually starting a business. Pushing past pursuing the idea of starting a business and taking action is when a dreamer becomes an entrepreneur.
An entrepreneur must be passionate and driven in order to establish enough credibility and support to move a venture forward in the business process. Unfortunately, there are obstacles entrepreneurs must overcome to successfully start a business that are unrelated to an entrepreneur’s level of motivation. In this report, we address some of these hurdles, which include legally creating a business entity, obtaining funding, and knowing how to run a business. See Figure 4 on page 9 for more detail of these obstacles. We provide a brief discus-sion of this part of the entrepreneurial process because very few people, particu-larly first-time entrepreneurs, know how to accomplish each of these feats without taking the initiative to connect with supportive resources.
Creating a New Business EntityDeciding on the name of the business itself is a significant step toward begin-ning operations. In addition to reflecting brand identity, an entrepreneur needs to ensure it is properly registered and not already trademarked.
Creating a legal business entity early on can protect an entrepreneur’s liability for debts incurred by the business. Without this legal protection, the risk of bankruptcy lies on the owner and not the business, putting not only the business, but also personal property at risk. Different types of businesses have inherent advantages and disadvantages. For instance, a sole proprietorship requires less paperwork than a limited liability corporation (LLC); a sole proprietor obtains a certificate to do business, whereas the owner of an LLC must file more docu-ments and remit fees to the state. However, an LLC has more protections for the owner than a sole proprietorship.
Another legal consideration for entrepreneurs while marketing an invention is protecting their intellectual property and applying for patents. Additionally, there may be business licensing and permit requirements depending on the type of business. An entrepreneur must also register with state and federal tax author-ities, consider purchasing business insurance, as well as establish an online presence and register a domain name. An entrepreneur also must decide if or when to establish a physical location, and then consider facility requirements, as well as local zoning laws.
An Introduction to Entrepreneurship
Anderson Economic Group, LLC 11
Business “Know-How”Business know-how is not inherent or necessarily common for all entrepreneurs. When starting any business, a learning curve inevitably plays a role in achieving success. Unfortunately, making a mistake in the process can cost an entrepre-neur money, and, in some cases, the entire business.
Starting a business requires a significant amount of planning. Identifying start-up needs and costs, as well as achieving access to available resources and financing options is challenging. Creating a business plan can help the entrepre-neur to look ahead, create a strategy, and prepare for both problems and oppor-tunities. The business plan acts as a blueprint for the entrepreneur, although it often changes as a start-up evolves. Generally, it includes a description of the company, the product or service offered, an analysis of the competition, and a financial analysis. A business plan is also one of the first steps toward acquiring financing; investors, even family and friends, will want to know their invest-ment is backed by a solid plan that will help to ensure profitability.
Beyond the ability to plan, most entrepreneurs need to possess a diverse skill set because very few can afford to hire staff in the beginning. An established busi-ness, however, usually has several employees who each play a different role in the firm’s success. For a start-up, there are usually just as many roles to fill, but far fewer people to fill them. For example, most businesses need some type of marketing, someone to keep track of the books, some type of IT support, and, if a company gets big enough, human resources.
Hopefully, the entrepreneur possesses some of these skills, or has the aptitude to learn them. In many cases, however, an entrepreneur may be lacking in some areas, which presents a challenge to the success of the enterprise. The “know-how” may be one of the leading contributors to business success or failure. See “Rate of Firm Survival” on page 12 for the number of new firms that succeed and remain in operation.
FundingObtaining funding is one of the most difficult obstacles for most entrepreneurs. It may seem like a simple concept, but running out of money can cause a busi-ness to fail. Different types of funding are associated with various stages in the entrepreneurial process. However, regardless of when an entrepreneur needs funding, it is one of the key components to pursuing their endeavor. Below we outline some of the key components of entrepreneurial funding and their diffi-culties.
Personal Loans. Many small firms rely on personal loans to get off the ground. Early on, it is incredibly difficult to find investors, which is why some entrepre-neurs turn to family and friends. Other first-time business owners use their per-
An Introduction to Entrepreneurship
Anderson Economic Group, LLC 12
sonal savings, pursue private loans from the bank and/or put a second mortgage on their home.
Seed funding. Pre-seed and seed funding is essentially pre-production capital that allows the entrepreneur to complete the beginning stages of development for their product or service (business plan, market research, prototype creation, etc.) in order to make it commercially viable and attractive to potential inves-tors. The level of competition is high at this particular phase due to the level of risk and uncertainty involved, as well as potential length of delay with regard to return on investment. Money can come from institutions as well as friends, fam-ily, and neighbors. Nowadays, the internet is a primary vehicle through which various contributors can donate funds to help ensure the successful creation or continuation of a business venture.11
Venture Capital, Private Equity, Angel Investment. Venture capital (VC) and private equity (PE) capture a different stage at which entrepreneurs require funding. Both VC and PE seek to take existing companies and make them more financially successful. Angel investment differs from VC funding in that they have different structures through which funding is approved, with VC decisions tending to follow a more defined set of rules. Angel investors typically invest their own funds, in contrast to VC funds, which are professionally-managed pools of investors’ money. Additionally, VC funding may be orders of magni-tude larger than funding from an Angel Investor.
RATE OF FIRM SURVIVAL
All of the challenges listed above contribute to the success or failure of a new enterprise. Being an entrepreneur requires more than simply creating a com-pany; it involves the assumption of sometimes enormous risk. Given the time, effort, and money involved throughout this process, it is not surprising that there is a high failure rate for small businesses, particularly in the first crucial years of establishment.
The Small Business Administration (SBA) compiles annual data on the number of U.S. business “births,” or firms that enter the market, as well as the “deaths,” which are firms that exit the economy.12 In Figure 5 on page 13, we show the number of births, deaths, and bankruptcies for employer firms, or firms with at least one employee, from 2000 to 2010.13
11.Websites such as Kickstarter encourage individuals from around the world to take part in the investment process, albeit for typically small amounts.
12.The SBA defines firm births as new, original establishments, which were not open in the previ-ous year, and firm deaths as closed original establishments for that year. We note that not all deaths are a firm being forced out of the marketplace— an owner could wind down his or her business to retire, or sell to an individual or entity that elects to change its name.
An Introduction to Entrepreneurship
Anderson Economic Group, LLC 13
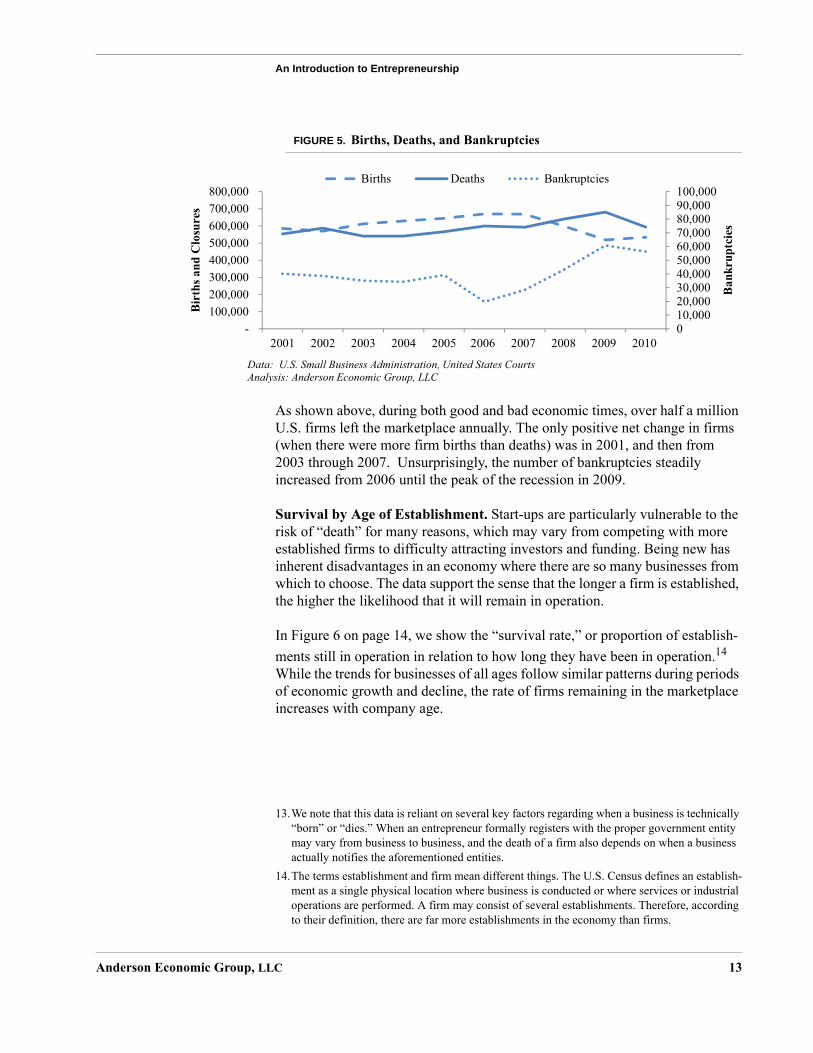
FIGURE 5. Births, Deaths, and Bankruptcies
As shown above, during both good and bad economic times, over half a million U.S. firms left the marketplace annually. The only positive net change in firms (when there were more firm births than deaths) was in 2001, and then from 2003 through 2007. Unsurprisingly, the number of bankruptcies steadily increased from 2006 until the peak of the recession in 2009.
Survival by Age of Establishment. Start-ups are particularly vulnerable to the risk of “death” for many reasons, which may vary from competing with more established firms to difficulty attracting investors and funding. Being new has inherent disadvantages in an economy where there are so many businesses from which to choose. The data support the sense that the longer a firm is established, the higher the likelihood that it will remain in operation.
In Figure 6 on page 14, we show the “survival rate,” or proportion of establish-ments still in operation in relation to how long they have been in operation.14 While the trends for businesses of all ages follow similar patterns during periods of economic growth and decline, the rate of firms remaining in the marketplace increases with company age.
13.We note that this data is reliant on several key factors regarding when a business is technically “born” or “dies.” When an entrepreneur formally registers with the proper government entity may vary from business to business, and the death of a firm also depends on when a business actually notifies the aforementioned entities.
010,00020,00030,00040,00050,00060,00070,00080,00090,000100,000
- 100,000 200,000 300,000 400,000 500,000 600,000 700,000 800,000
2001 2002 2003 2004 2005 2006 2007 2008 2009 2010
Ban
krup
tcie
s
Bir
ths a
nd C
losu
res
Births Deaths Bankruptcies
Data: U.S. Small Business Administration, United States CourtsAnalysis: Anderson Economic Group, LLC
14.The terms establishment and firm mean different things. The U.S. Census defines an establish-ment as a single physical location where business is conducted or where services or industrial operations are performed. A firm may consist of several establishments. Therefore, according to their definition, there are far more establishments in the economy than firms.
An Introduction to Entrepreneurship
Anderson Economic Group, LLC 14
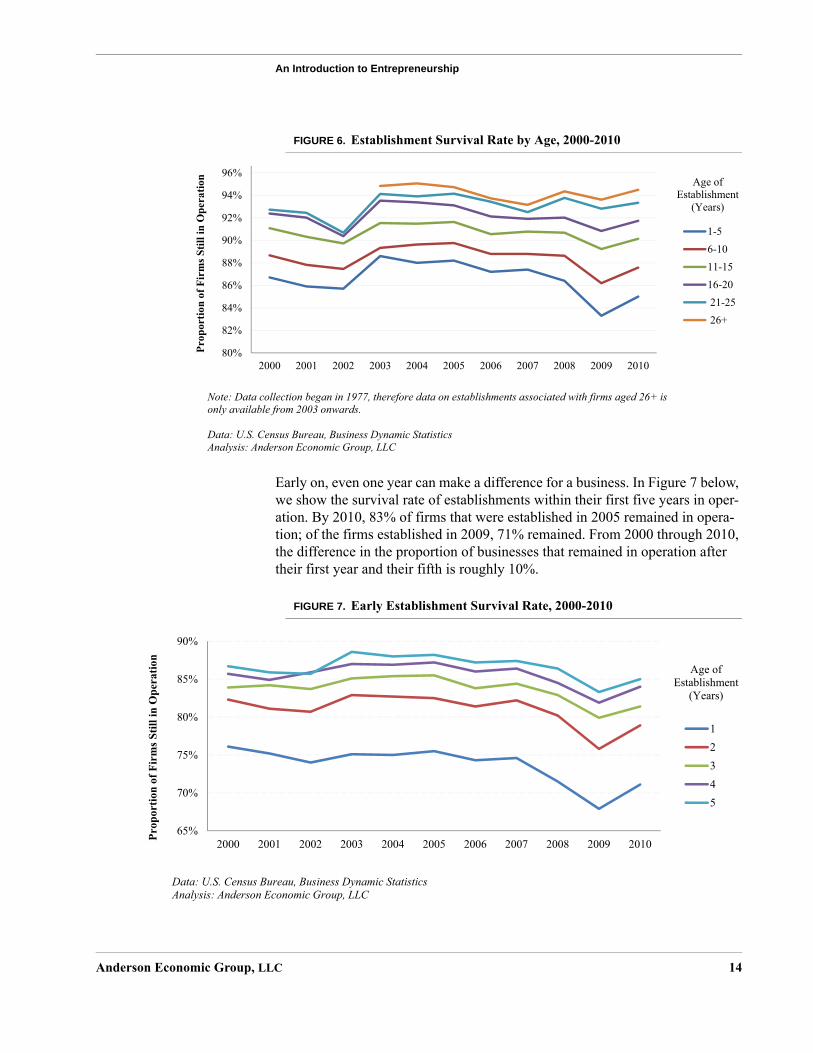
FIGURE 6. Establishment Survival Rate by Age, 2000-2010
Early on, even one year can make a difference for a business. In Figure 7 below, we show the survival rate of establishments within their first five years in oper-ation. By 2010, 83% of firms that were established in 2005 remained in opera-tion; of the firms established in 2009, 71% remained. From 2000 through 2010, the difference in the proportion of businesses that remained in operation after their first year and their fifth is roughly 10%.
FIGURE 7. Early Establishment Survival Rate, 2000-2010
80%
82%
84%
86%
88%
90%
92%
94%
96%
2000 2001 2002 2003 2004 2005 2006 2007 2008 2009 2010
Prop
ortio
n of
Fir
ms S
till i
n O
pera
tion
1-56-1011-1516-20 21-25 26+
Age of Establishment
(Years)
Note: Data collection began in 1977, therefore data on establishments associated with firms aged 26+ is only available from 2003 onwards.
Data: U.S. Census Bureau, Business Dynamic StatisticsAnalysis: Anderson Economic Group, LLC
65%
70%
75%
80%
85%
90%
2000 2001 2002 2003 2004 2005 2006 2007 2008 2009 2010Prop
ortio
n of
Fir
ms S
till i
n O
pera
tion
12345
Data: U.S. Census Bureau, Business Dynamic StatisticsAnalysis: Anderson Economic Group, LLC
Age of Establishment
(Years)
An Introduction to Entrepreneurship
Anderson Economic Group, LLC 15
ROLE OF THE URC UNIVERSITIES IN FOSTERING ENTREPRENEURSHIP
The URC universities primarily contribute to entrepreneurship in three ways:
1. Educating a large number of people who choose to start businesses;2. Exposing students to cutting-edge research and providing them with the
tools to enter the business world; and 3. Making resources available for aspiring entrepreneurs that provide support
throughout the process of starting a business.
In the remainder of our report, we dedicate a chapter to each of these topics.
First we discuss the hundreds of thousands of URC alumni who have started a business in “Supplying Entrepreneurs: URC Alumni.” This section discusses our analysis of the survey results from the URC’s 2013 Alumni Impact Survey which was conducted by an independent survey firm.15 The goal of this alumni survey was to better understand the occupations, industries, entrepreneurial endeavors, and geographies of URC alumni. Using the survey data, we exam-ined the contribution that thousands of URC-alumni firms have made in terms of size, type, nature, location, and the economic footprint of those that continue to operate today.
Next, we discuss how the URC exposes students to research and provides them with either foundational or specialized skills for their future aspirations in the “real world” in “Providing Tools: The Academic Foundation at the URC Uni-versities.” In this section, we discuss the conventional role of research and com-mercialization activities on campus, as well as their provision of a talented, educated workforce to the economy.
Finally, we discuss how the URC universities are moving beyond this long-standing role and actively engaging entrepreneurs in “Supporting The Entrepre-neurial Process: The Evolving Role of the URC Universities.” In this section, we discuss the entrepreneurial ecosystem that the URC universities are creating on-campus and contributing to off-campus. We also list and describe some of the services and resources that the URC universities make available for entre-preneurs, which include current students, alumni, faculty, and, in some cases, the surrounding community.
15.As discussed in “Overview of Approach” on page 1, in order to acquire data on URC alumni, the URC hired an independent survey firm, Survey Sciences Group, LLC (SSG), to conduct an “Alumni Impact Survey.” Prior to releasing the survey, AEG, the URC, and SSG worked together to frame the questions used in the survey of alumni. SSG administered this study, and provided AEG with the survey data. Throughout the remainder of this report, we refer to the survey as the 2013 URC Alumni Survey.
Supplying Entrepreneurs: URC Alumni
Anderson Economic Group, LLC 16
III. Supplying Entrepreneurs: URC Alumni Attending a URC university not only increases the future earning power for many graduates, but the URC Alumni Survey indicates that URC graduates are also extremely entrepreneurial.16 Graduates from URC universities have started and purchased businesses all across the United States and the world—they’ve started or purchased at least one company in every U.S. state, as well as in 100 different countries. In this section, we will highlight characteristics of the URC’s alumni entrepreneurs, profile the types of companies started and pur-chased by URC alumni, and provide a lower-bound estimate for the economic footprint created by URC alumni-companies in 2012.
COMMON CHARACTERISTICS OF URC ALUMNI ENTREPRENEURS
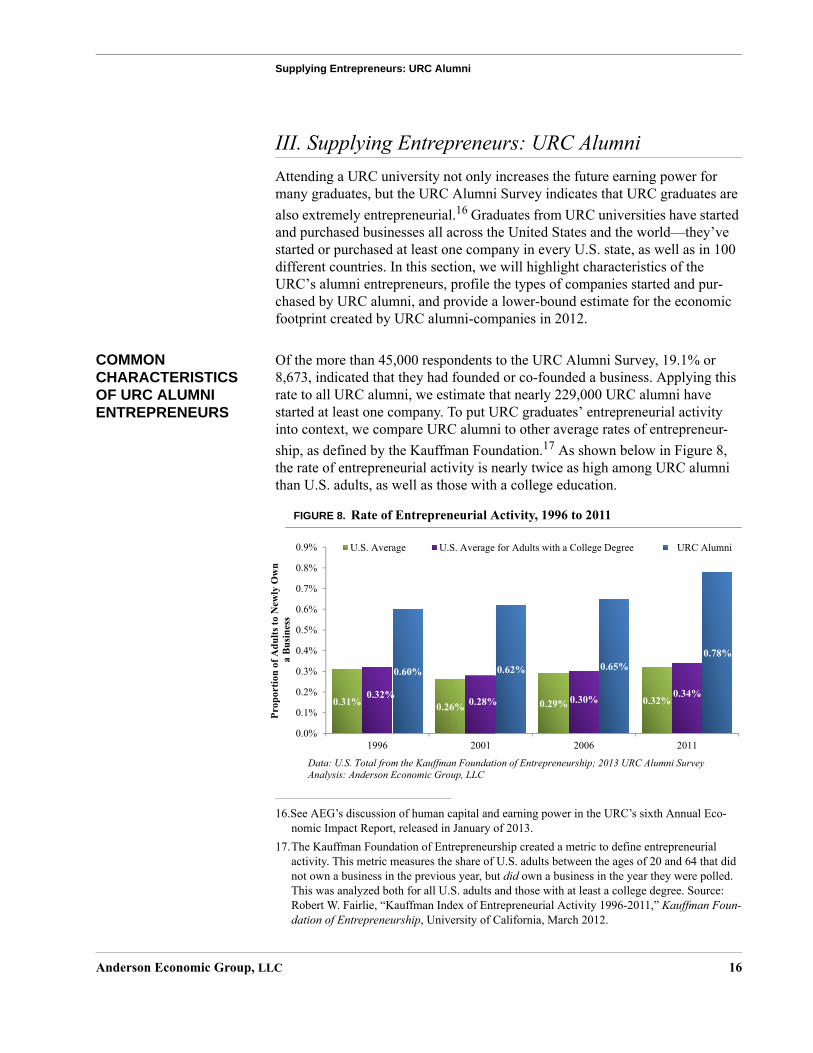
Of the more than 45,000 respondents to the URC Alumni Survey, 19.1% or 8,673, indicated that they had founded or co-founded a business. Applying this rate to all URC alumni, we estimate that nearly 229,000 URC alumni have started at least one company. To put URC graduates’ entrepreneurial activity into context, we compare URC alumni to other average rates of entrepreneur-ship, as defined by the Kauffman Foundation.17 As shown below in Figure 8, the rate of entrepreneurial activity is nearly twice as high among URC alumni than U.S. adults, as well as those with a college education.
FIGURE 8. Rate of Entrepreneurial Activity, 1996 to 2011
16.See AEG’s discussion of human capital and earning power in the URC’s sixth Annual Eco-nomic Impact Report, released in January of 2013.
17.The Kauffman Foundation of Entrepreneurship created a metric to define entrepreneurial activity. This metric measures the share of U.S. adults between the ages of 20 and 64 that did not own a business in the previous year, but did own a business in the year they were polled. This was analyzed both for all U.S. adults and those with at least a college degree. Source: Robert W. Fairlie, “Kauffman Index of Entrepreneurial Activity 1996-2011,” Kauffman Foun-dation of Entrepreneurship, University of California, March 2012.
0.31% 0.26% 0.29% 0.32%0.32%0.28% 0.30% 0.34%
0.60% 0.62% 0.65%0.78%
Prop
ortio
n of
Adu
lts to
New
ly O
wn
a Bu
sine
ss
Data: U.S. Total from the Kauffman Foundation of Entrepreneurship; 2013 URC Alumni SurveyAnalysis: Anderson Economic Group, LLC
Supplying Entrepreneurs: URC Alumni
Anderson Economic Group, LLC 17
Among all adults aged 20 to 64, entrepreneurial activity ranged from 0.26% to 0.32% between 1996 and 2011. The rate among U.S. adults of the same age with a college degree, the index was slightly higher, ranging from 0.28% to 0.34%. The share among URC graduates of the same age ranged between 0.60% and 0.78%. This does not point to the URC universities as the “sole cause” for alumni entrepreneurial activity, but it suggests that obtaining a degree in general versus obtaining a degree from a world-class higher education institution might make a difference in entrepreneurial activity.18
Additionally, entrepreneurial activity (as defined by the Kauffman Foundation’s metric) has steadily been increasing among URC graduates. Levels of entrepre-neurial activity among the average adult and adults with a college degree has remained relatively flat over the same time periods.
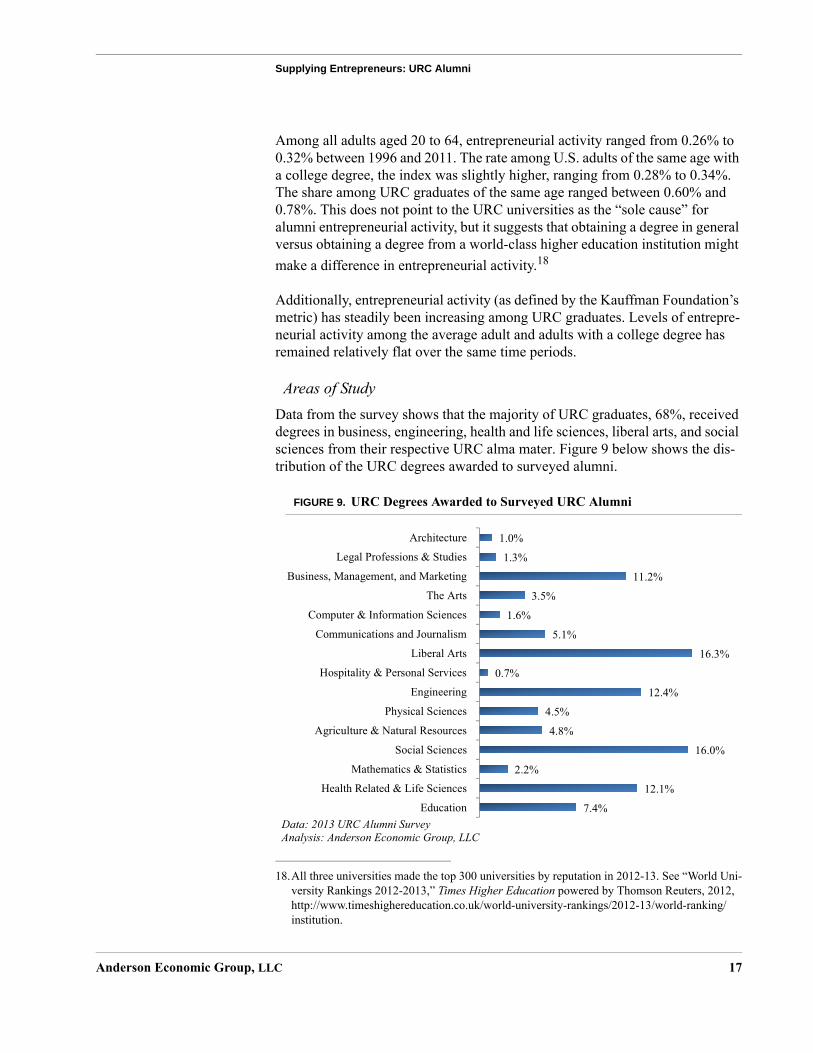
Areas of StudyData from the survey shows that the majority of URC graduates, 68%, received degrees in business, engineering, health and life sciences, liberal arts, and social sciences from their respective URC alma mater. Figure 9 below shows the dis-tribution of the URC degrees awarded to surveyed alumni.
FIGURE 9. URC Degrees Awarded to Surveyed URC Alumni
18.All three universities made the top 300 universities by reputation in 2012-13. See “World Uni-versity Rankings 2012-2013,” Times Higher Education powered by Thomson Reuters, 2012, http://www.timeshighereducation.co.uk/world-university-rankings/2012-13/world-ranking/institution.
1.0%
1.3%
11.2%
3.5%
1.6%
5.1%
16.3%
0.7%
12.4%
4.5%
4.8%
16.0%
2.2%
12.1%
7.4%
Architecture
Legal Professions & Studies
Business, Management, and Marketing
The Arts
Computer & Information Sciences
Communications and Journalism
Liberal Arts
Hospitality & Personal Services
Engineering
Physical Sciences
Agriculture & Natural Resources
Social Sciences
Mathematics & Statistics
Health Related & Life Sciences
EducationData: 2013 URC Alumni SurveyAnalysis: Anderson Economic Group, LLC
Supplying Entrepreneurs: URC Alumni
Anderson Economic Group, LLC 18
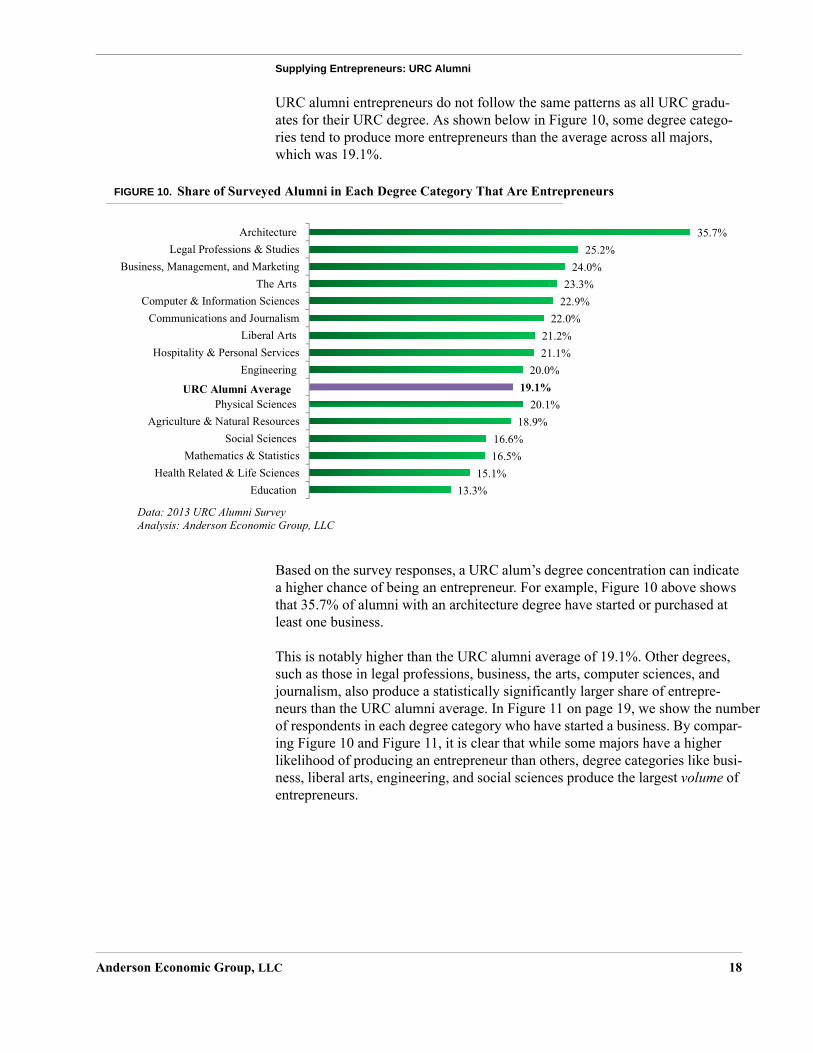
URC alumni entrepreneurs do not follow the same patterns as all URC gradu-ates for their URC degree. As shown below in Figure 10, some degree catego-ries tend to produce more entrepreneurs than the average across all majors, which was 19.1%.
FIGURE 10. Share of Surveyed Alumni in Each Degree Category That Are Entrepreneurs
Based on the survey responses, a URC alum’s degree concentration can indicate a higher chance of being an entrepreneur. For example, Figure 10 above shows that 35.7% of alumni with an architecture degree have started or purchased at least one business.
This is notably higher than the URC alumni average of 19.1%. Other degrees, such as those in legal professions, business, the arts, computer sciences, and journalism, also produce a statistically significantly larger share of entrepre-neurs than the URC alumni average. In Figure 11 on page 19, we show the number of respondents in each degree category who have started a business. By compar-ing Figure 10 and Figure 11, it is clear that while some majors have a higher likelihood of producing an entrepreneur than others, degree categories like busi-ness, liberal arts, engineering, and social sciences produce the largest volume of entrepreneurs.
35.7%25.2%
24.0%23.3%
22.9%22.0%
21.2%21.1%
20.0%19.1%
20.1%18.9%
16.6%16.5%
15.1%13.3%
ArchitectureLegal Professions & Studies
Business, Management, and MarketingThe Arts
Computer & Information SciencesCommunications and Journalism
Liberal ArtsHospitality & Personal Services
Engineering
Physical SciencesAgriculture & Natural Resources
Social SciencesMathematics & Statistics
Health Related & Life SciencesEducation
Data: 2013 URC Alumni SurveyAnalysis: Anderson Economic Group, LLC
URC Alumni Average
Supplying Entrepreneurs: URC Alumni
Anderson Economic Group, LLC 19
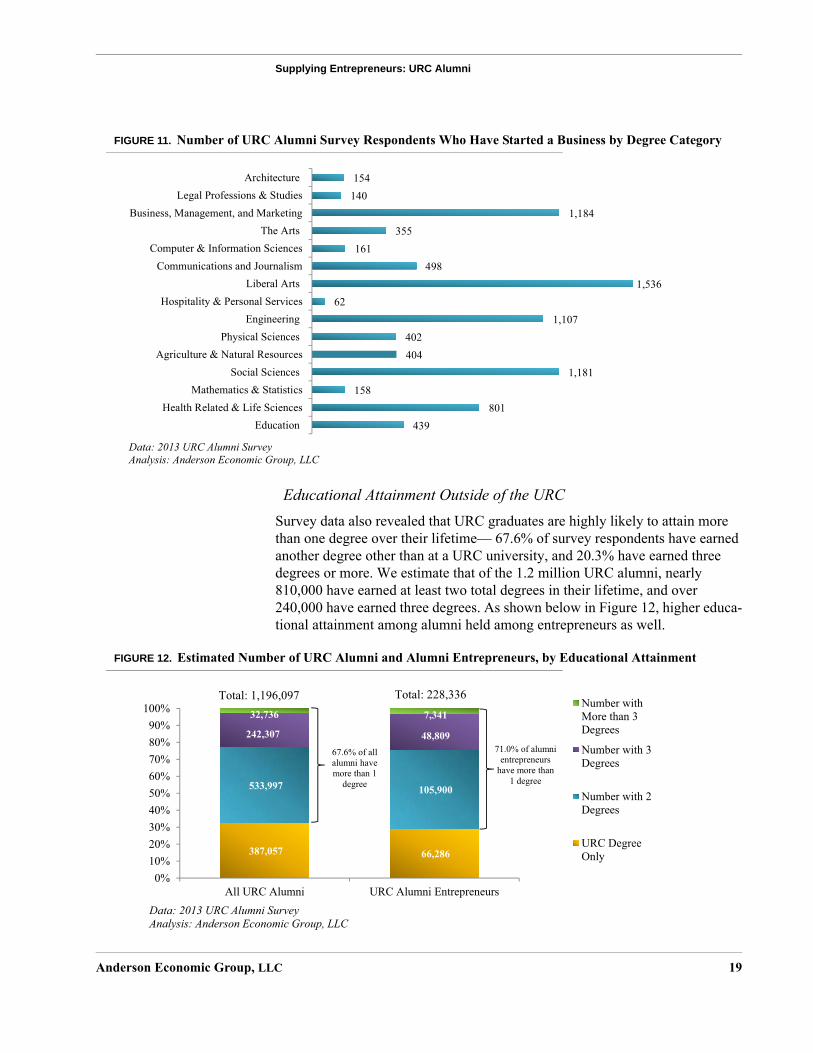
FIGURE 11. Number of URC Alumni Survey Respondents Who Have Started a Business by Degree Category
Educational Attainment Outside of the URCSurvey data also revealed that URC graduates are highly likely to attain more than one degree over their lifetime— 67.6% of survey respondents have earned another degree other than at a URC university, and 20.3% have earned three degrees or more. We estimate that of the 1.2 million URC alumni, nearly 810,000 have earned at least two total degrees in their lifetime, and over 240,000 have earned three degrees. As shown below in Figure 12, higher educa-tional attainment among alumni held among entrepreneurs as well.
FIGURE 12. Estimated Number of URC Alumni and Alumni Entrepreneurs, by Educational Attainment
154140
1,184 355
161498
1,536 62
1,107402404
1,181158
801439
ArchitectureLegal Professions & Studies
Business, Management, and MarketingThe Arts
Computer & Information SciencesCommunications and Journalism
Liberal ArtsHospitality & Personal Services
EngineeringPhysical Sciences
Agriculture & Natural ResourcesSocial Sciences
Mathematics & StatisticsHealth Related & Life Sciences
Education
Data: 2013 URC Alumni SurveyAnalysis: Anderson Economic Group, LLC
387,057 66,286
533,997 105,900
242,307 48,809
32,736 7,341
0%10%20%30%40%50%60%70%80%90%
100%
All URC Alumni URC Alumni Entrepreneurs
Number withMore than 3Degrees
Number with 3Degrees
Number with 2Degrees
URC DegreeOnly
Data: 2013 URC Alumni SurveyAnalysis: Anderson Economic Group, LLC
Total: 1,196,097 Total: 228,336
67.6% of allalumni have more than 1
degree
71.0% of alumni entrepreneurs
have more than 1 degree
Supplying Entrepreneurs: URC Alumni
Anderson Economic Group, LLC 20
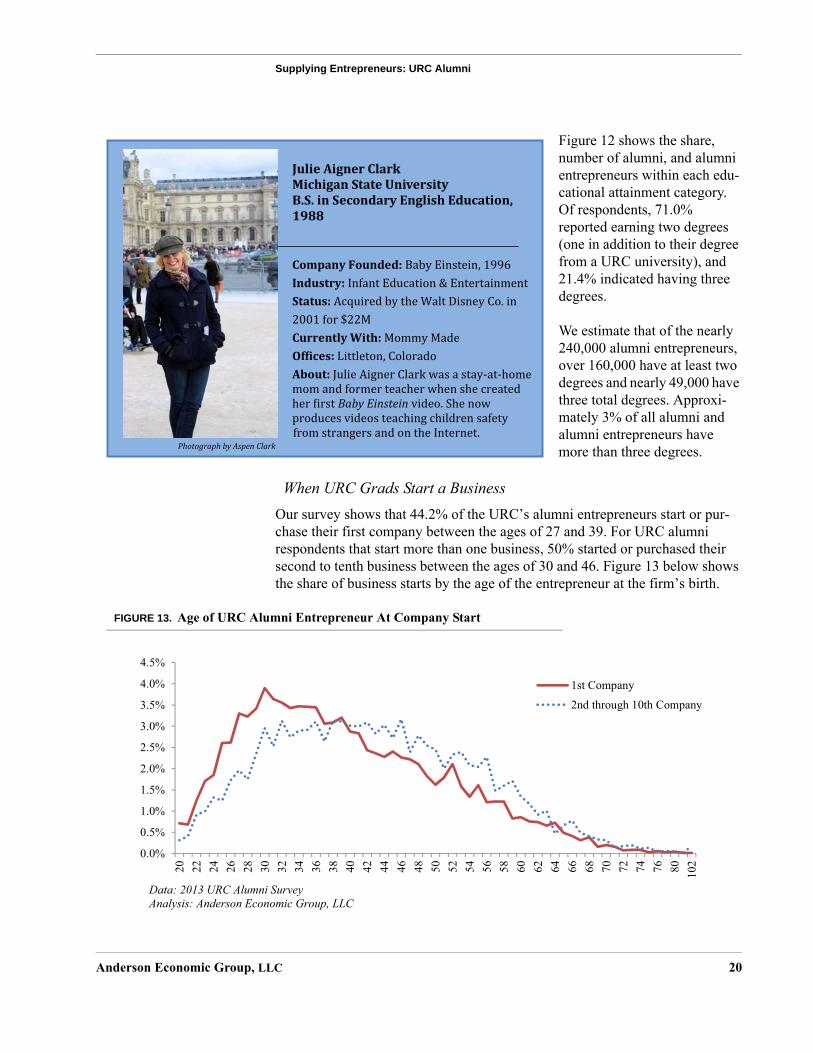
Figure 12 shows the share, number of alumni, and alumni entrepreneurs within each edu-cational attainment category. Of respondents, 71.0% reported earning two degrees (one in addition to their degree from a URC university), and 21.4% indicated having three degrees.
We estimate that of the nearly 240,000 alumni entrepreneurs, over 160,000 have at least two degrees and nearly 49,000 have three total degrees. Approxi-mately 3% of all alumni and alumni entrepreneurs have more than three degrees.
When URC Grads Start a BusinessOur survey shows that 44.2% of the URC’s alumni entrepreneurs start or pur-chase their first company between the ages of 27 and 39. For URC alumni respondents that start more than one business, 50% started or purchased their second to tenth business between the ages of 30 and 46. Figure 13 below shows the share of business starts by the age of the entrepreneur at the firm’s birth.
FIGURE 13. Age of URC Alumni Entrepreneur At Company Start
JulieAignerClark MichiganStateUniversity B.S.inSecondaryEnglishEducation,1988CompanyFounded:BabyEinstein,1996Industry:InfantEducation&EntertainmentStatus:AcquiredbytheWaltDisneyCo.in2001for$22MCurrentlyWith:MommyMadeOf�ices:Littleton,ColoradoAbout:JulieAignerClarkwasastay-at-homemomandformerteacherwhenshecreatedher�irstBabyEinsteinvideo.ShenowproducesvideosteachingchildrensafetyfromstrangersandontheInternet.
PhotographbyAspenClark
0.0%
0.5%
1.0%
1.5%
2.0%
2.5%
3.0%
3.5%
4.0%
4.5%
20 22 24 26 28 30 32 34 36 38 40 42 44 46 48 50 52 54 56 58 60 62 64 66 68 70 72 74 76 80 102
1st Company
2nd through 10th Company
Supplying Entrepreneurs: URC Alumni
Anderson Economic Group, LLC 21
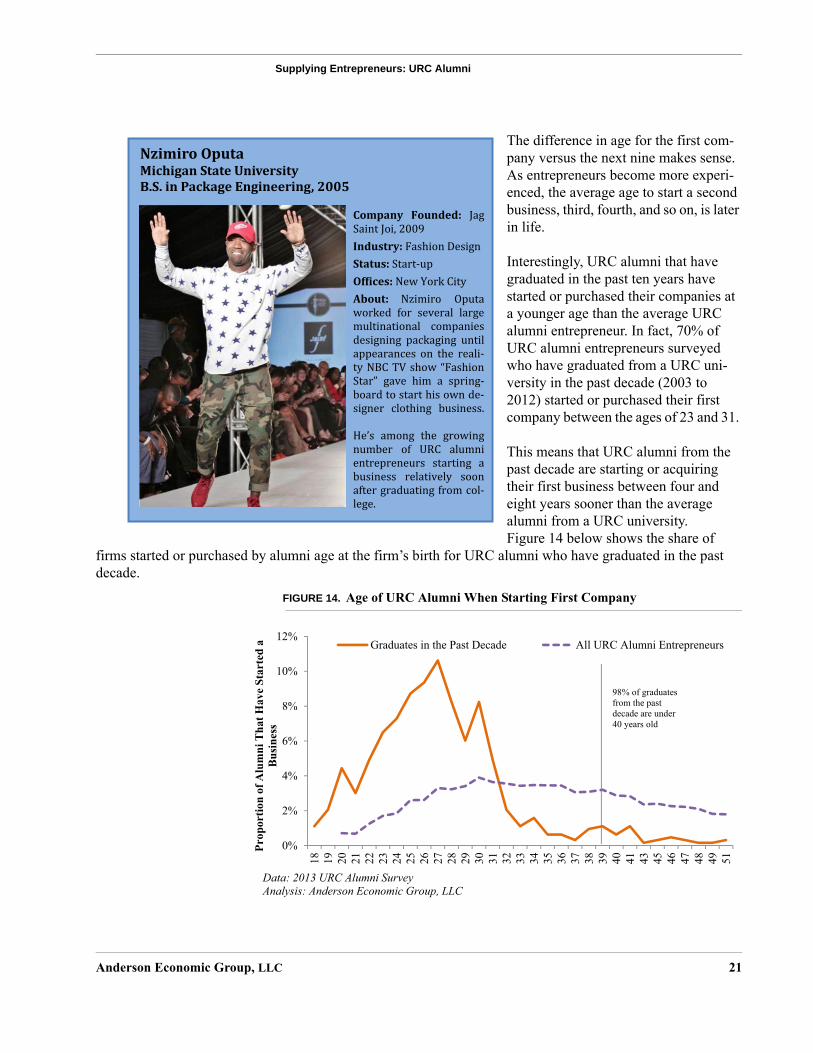
The difference in age for the first com-pany versus the next nine makes sense. As entrepreneurs become more experi-enced, the average age to start a second business, third, fourth, and so on, is later in life.
Interestingly, URC alumni that have graduated in the past ten years have started or purchased their companies at a younger age than the average URC alumni entrepreneur. In fact, 70% of URC alumni entrepreneurs surveyed who have graduated from a URC uni-versity in the past decade (2003 to 2012) started or purchased their first company between the ages of 23 and 31.
This means that URC alumni from the past decade are starting or acquiring their first business between four and eight years sooner than the average alumni from a URC university. Figure 14 below shows the share of
firms started or purchased by alumni age at the firm’s birth for URC alumni who have graduated in the past decade.
FIGURE 14. Age of URC Alumni When Starting First Company
NzimiroOputa MichiganStateUniversity B.S.inPackageEngineering,2005
Company Founded: JagSaintJoi,2009
Industry:FashionDesignStatus:Start-upOf�ices:NewYorkCityAbout: Nzimiro Oputaworked for several largemultinational companiesdesigning packaging untilappearances on the reali-tyNBCTVshow“FashionStar” gave him a spring-boardtostarthisownde-signer clothing business.He’s among the growingnumber of URC alumnientrepreneurs starting abusiness relatively soonaftergraduatingfromcol-lege.
0%
2%
4%
6%
8%
10%
12%
18 19 20 21 22 23 24 25 26 27 28 29 30 31 32 33 34 35 36 37 38 39 40 41 43 45 46 47 48 49 51
Prop
ortio
n of
Alu
mni
Tha
t Hav
e St
arte
d a
Bus
ines
s
Graduates in the Past Decade All URC Alumni Entrepreneurs
Data: 2013 URC Alumni SurveyAnalysis: Anderson Economic Group, LLC
98% of graduatesfrom the past decade are under 40 years old
Supplying Entrepreneurs: URC Alumni
Anderson Economic Group, LLC 22
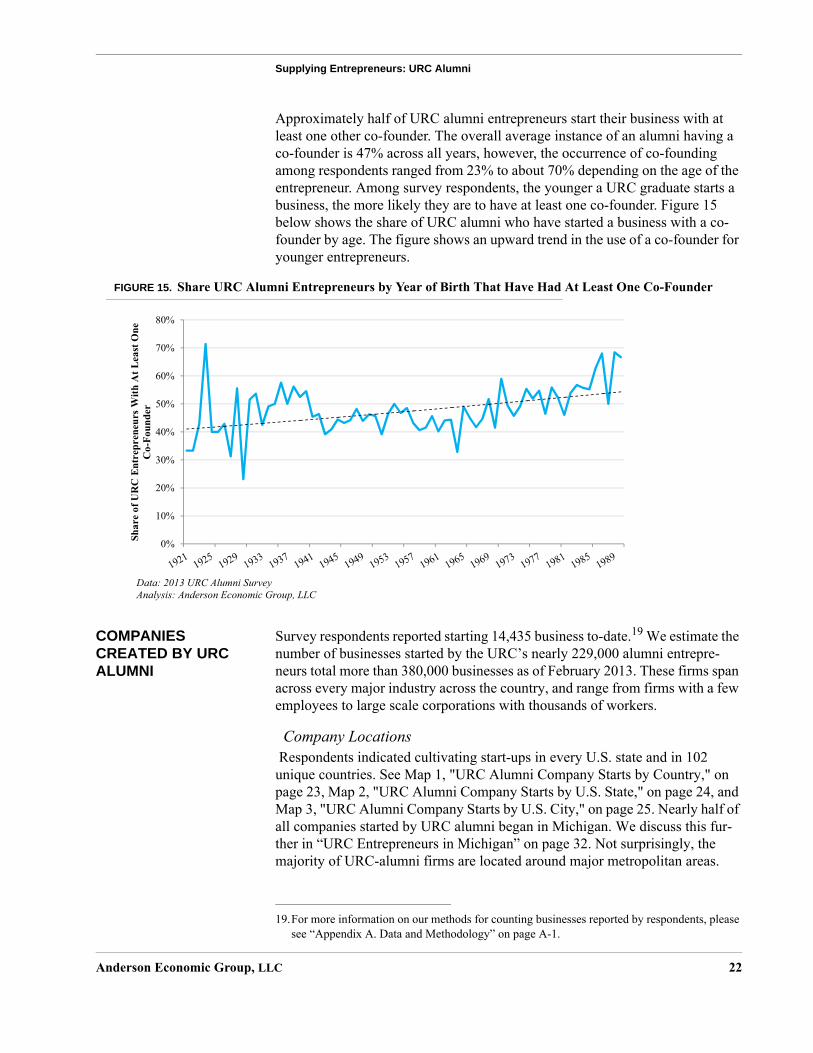
Approximately half of URC alumni entrepreneurs start their business with at least one other co-founder. The overall average instance of an alumni having a co-founder is 47% across all years, however, the occurrence of co-founding among respondents ranged from 23% to about 70% depending on the age of the entrepreneur. Among survey respondents, the younger a URC graduate starts a business, the more likely they are to have at least one co-founder. Figure 15 below shows the share of URC alumni who have started a business with a co-founder by age. The figure shows an upward trend in the use of a co-founder for younger entrepreneurs.
FIGURE 15. Share URC Alumni Entrepreneurs by Year of Birth That Have Had At Least One Co-Founder
COMPANIES CREATED BY URC ALUMNI
Survey respondents reported starting 14,435 business to-date.19 We estimate the number of businesses started by the URC’s nearly 229,000 alumni entrepre-neurs total more than 380,000 businesses as of February 2013. These firms span across every major industry across the country, and range from firms with a few employees to large scale corporations with thousands of workers.
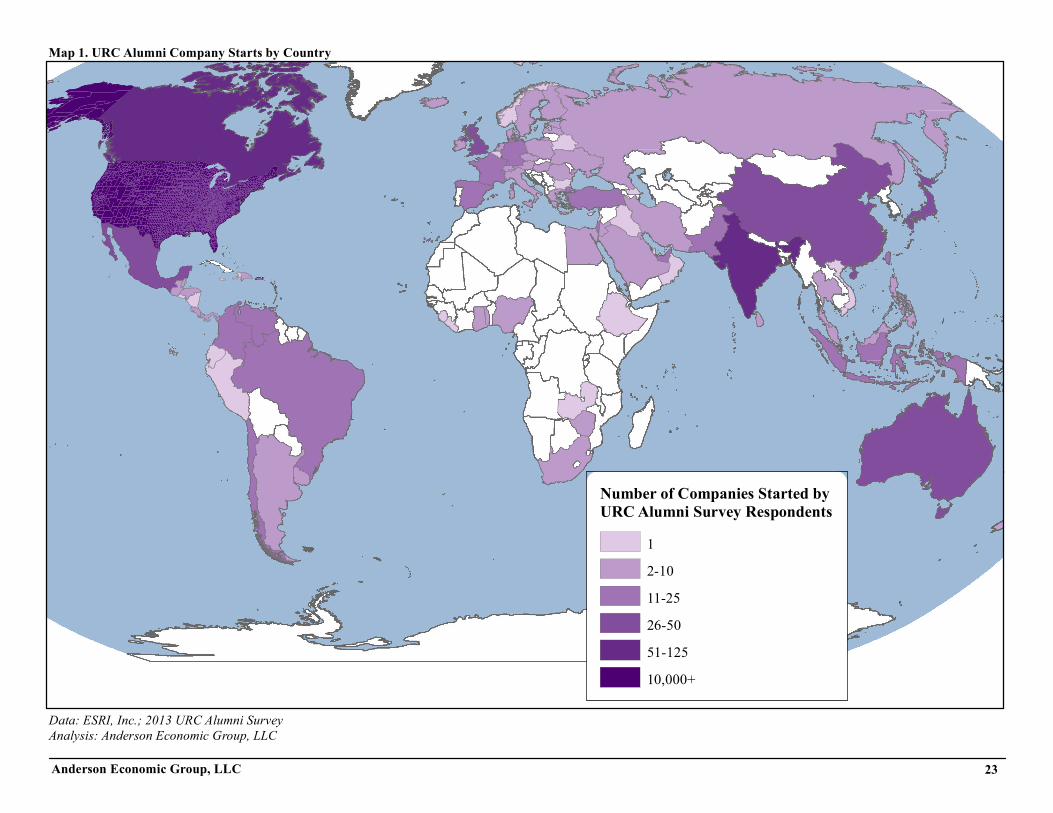
Company Locations Respondents indicated cultivating start-ups in every U.S. state and in 102 unique countries. See Map 1, "URC Alumni Company Starts by Country," on page 23, Map 2, "URC Alumni Company Starts by U.S. State," on page 24, and Map 3, "URC Alumni Company Starts by U.S. City," on page 25. Nearly half of all companies started by URC alumni began in Michigan. We discuss this fur-ther in “URC Entrepreneurs in Michigan” on page 32. Not surprisingly, the majority of URC-alumni firms are located around major metropolitan areas.
0%
10%
20%
30%
40%
50%
60%
70%
80%
Shar
e of
UR
C E
ntre
pren
eurs
With
At L
east
One
C
o-Fo
unde
r
Data: 2013 URC Alumni SurveyAnalysis: Anderson Economic Group, LLC
19.For more information on our methods for counting businesses reported by respondents, please see “Appendix A. Data and Methodology” on page A-1.
Number of Companies Started by URC Alumni Survey Respondents
12-1011-2526-5051-12510,000+
Data: ESRI, Inc.; 2013 URC Alumni SurveyAnalysis: Anderson Economic Group, LLC
Map 1. URC Alumni Company Starts by Country
Anderson Economic Group, LLC 23
Number of CompaniesStarted by URC AlumniSurvey Respondents
4-1011-100101-500501-1,0001,001-2,0008,000+
Data: ESRI, Inc.; 2013 URC Alumni SurveyAnalysis: Anderson Economic Group, LLC
Map 2. URC Company Starts by U.S. State
24Anderson Economic Group, LLC
Miami
Denver
Boston
DallasAtlantaPhoenix
Seattle
Houston
ChicagoNew York
St. Louis
San DiegoLos Angeles
Minneapolis
New Orleans
San FranciscoWashington D.C.
Detroit
Honolulu
Anchorage
Data: ESRI, Inc.; 2013 URC Alumni SurveyAnalysis: Anderson Economic Group, LLC
Number of Companies Started by URC Alumni Survey Respondents
1
2
3-5
6-10
11-100
100-800
Map 3. URC Alumni Company Starts by U.S. City
Anderson Economic Group, LLC 25
Supplying Entrepreneurs: URC Alumni
Anderson Economic Group, LLC 26
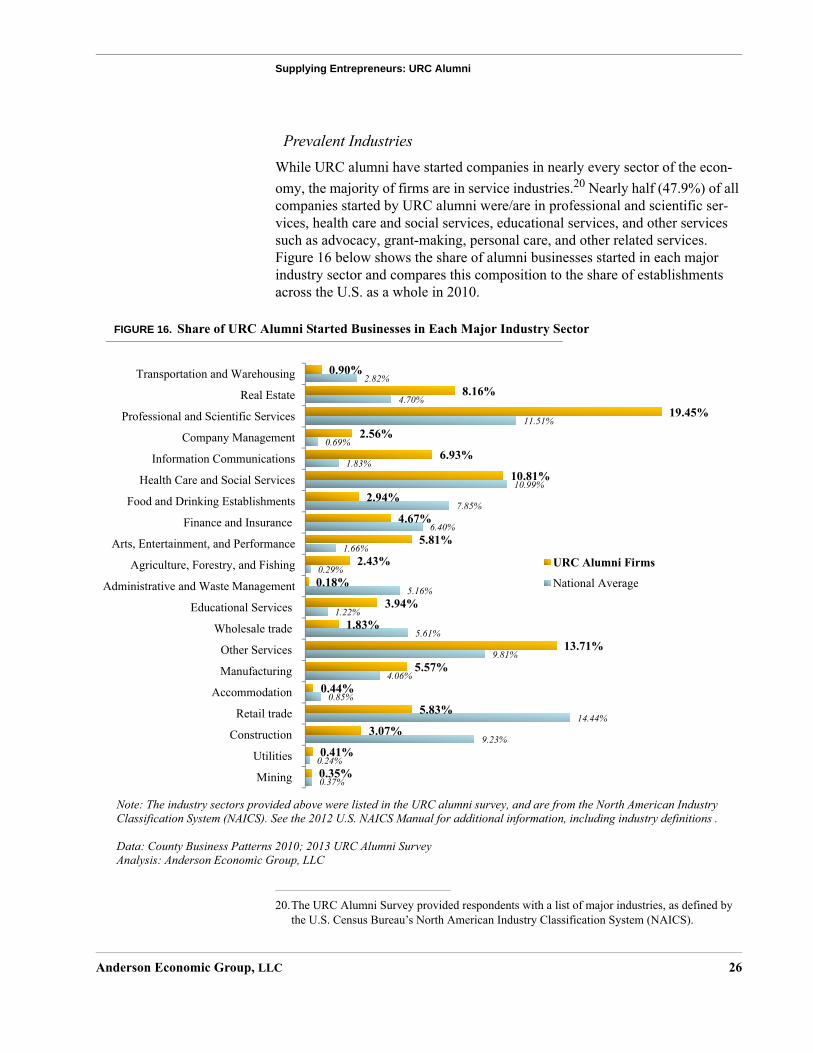
Prevalent IndustriesWhile URC alumni have started companies in nearly every sector of the econ-omy, the majority of firms are in service industries.20 Nearly half (47.9%) of all companies started by URC alumni were/are in professional and scientific ser-vices, health care and social services, educational services, and other services such as advocacy, grant-making, personal care, and other related services. Figure 16 below shows the share of alumni businesses started in each major industry sector and compares this composition to the share of establishments across the U.S. as a whole in 2010.
FIGURE 16. Share of URC Alumni Started Businesses in Each Major Industry Sector
20.The URC Alumni Survey provided respondents with a list of major industries, as defined by the U.S. Census Bureau’s North American Industry Classification System (NAICS).
0.37%
0.24%
9.23%
14.44%
0.85%
4.06%
9.81%
5.61%
1.22%
5.16%
0.29%
1.66%
6.40%
7.85%
10.99%
1.83%
0.69%
11.51%
4.70%
2.82%
0.35%
0.41%
3.07%
5.83%
0.44%
5.57%
13.71%
1.83%
3.94%
0.18%
2.43%
5.81%
4.67%
2.94%
10.81%
6.93%
2.56%
19.45%
8.16%
0.90%
Mining
Utilities
Construction
Retail trade
Accommodation
Manufacturing
Other Services
Wholesale trade
Educational Services
Administrative and Waste Management
Agriculture, Forestry, and Fishing
Arts, Entertainment, and Performance
Finance and Insurance
Food and Drinking Establishments
Health Care and Social Services
Information Communications
Company Management
Professional and Scientific Services
Real Estate
Transportation and Warehousing
URC Alumni Firms
National Average
Note: The industry sectors provided above were listed in the URC alumni survey, and are from the North American Industry Classification System (NAICS). See the 2012 U.S. NAICS Manual for additional information, including industry definitions .
Data: County Business Patterns 2010; 2013 URC Alumni SurveyAnalysis: Anderson Economic Group, LLC
Supplying Entrepreneurs: URC Alumni
Anderson Economic Group, LLC 27
While the industry comparison of business starts by URC grads to establish-ments nation-wide is not an apples-to-apples comparison, looking at the data together provides some insights into which industries URC entrepreneurs gravi-tate towards. For example, Figure 16 on page 26 indicates that the U.S. overall has a significantly larger share of firms in retail and construction. URC alumni start a larger share of businesses than the national average in professional ser-vices, other services, real estate, educational services, the arts, agriculture, and information.
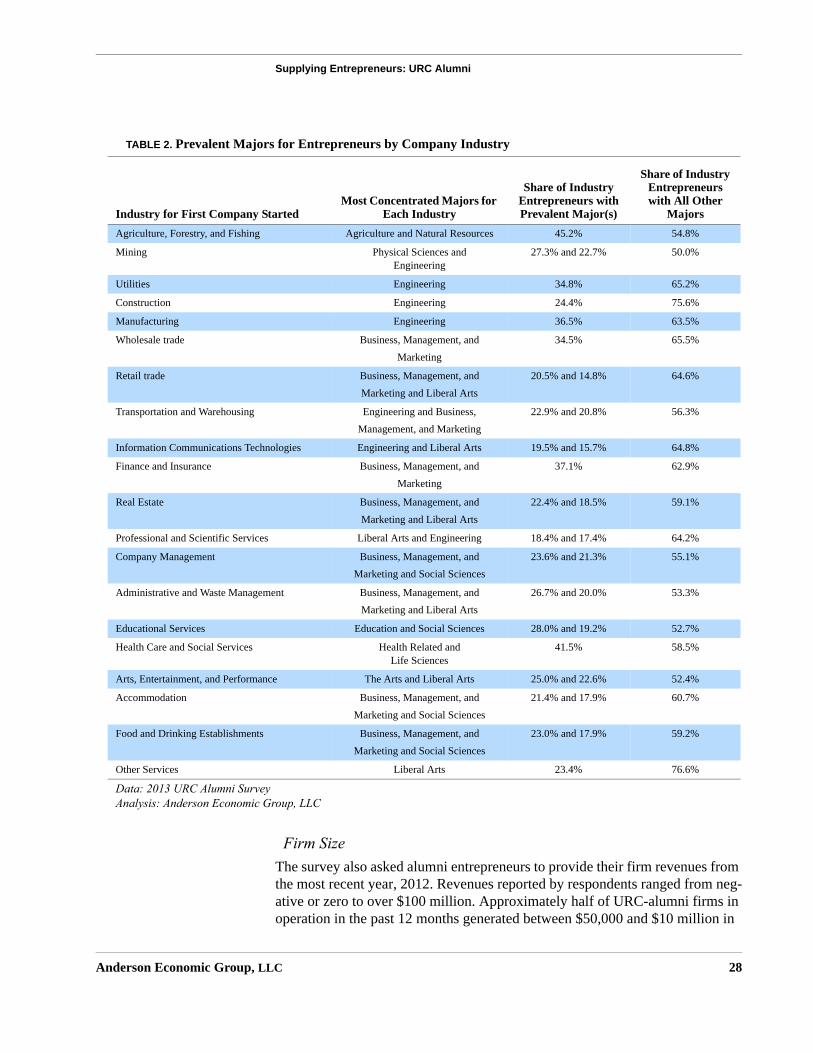
Industry Concentration by URC Degree. While it may seem reasonable to assume that an entrepreneur would start a company in a similar field to their major, this is not the case for the majority of URC alumni entrepreneurs. For many industries the most concentrated group of entrepreneurs have a related major, however they do not make up the majority. For example, 45.2% of URC alumni that started businesses in agriculture, forestry, and fishing have a degree in agriculture and natural resources but 54.8% do not.
Following this pattern are entrepreneurs who have started or purchased compa-nies related to professional and scientific services or information communica-tions technologies. The largest two majors represented in these two industries are, not surprisingly, engineering, but also liberal arts. However, nearly 65% of entrepreneurs in these industries majored in something other than engineering and liberal arts. Table 2 on page 28 shows the most concentrated URC majors for entrepreneurs organized by the industry of the first company started or pur-chased by alumni entrepreneurs. Note that for most industries the most concen-trated major may be the most highly related but the majority of entrepreneurs in a given industry majored in something relatively unrelated.
The data in Table 2 on page 28 shows that an entrepreneur’s college major does not necessarily dictate the industry in which they will start or purchase a busi-ness. While the industry could be related to another degree (71% of URC entre-preneurs have another degree outside of the URC), the URC degree itself does not clearly point to what type of business an entrepreneur will start or purchase.
Supplying Entrepreneurs: URC Alumni
Anderson Economic Group, LLC 28
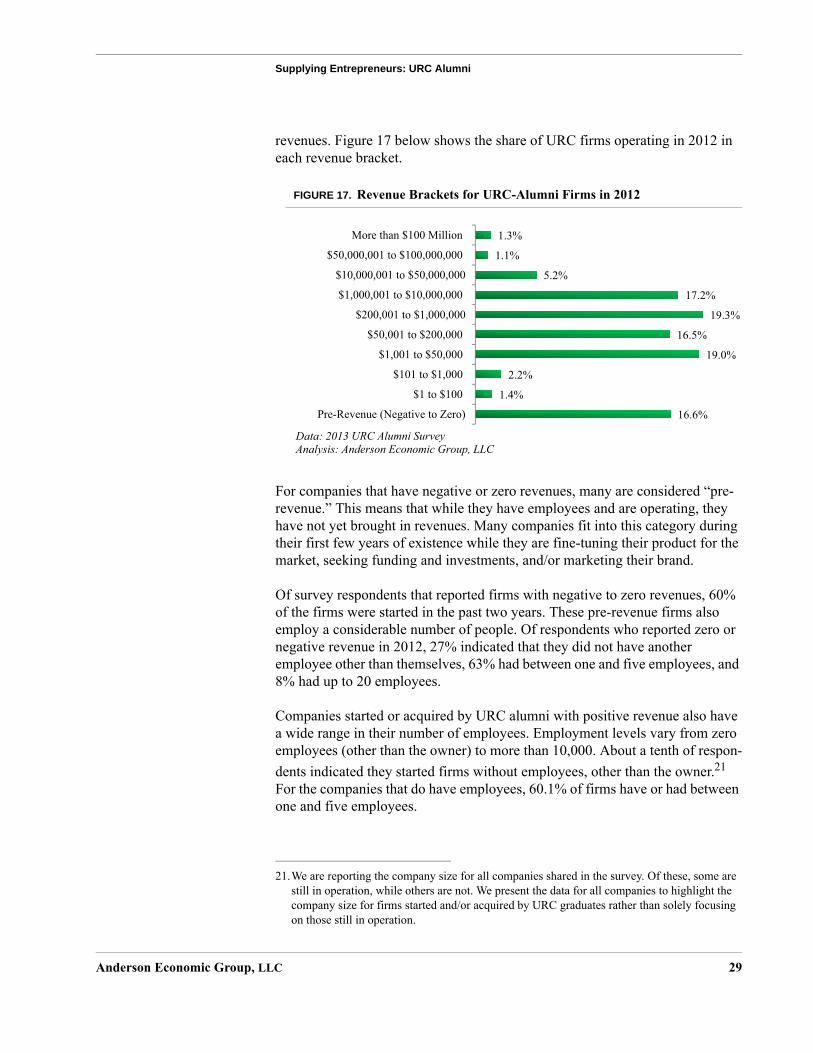
Firm SizeThe survey also asked alumni entrepreneurs to provide their firm revenues from the most recent year, 2012. Revenues reported by respondents ranged from neg-ative or zero to over $100 million. Approximately half of URC-alumni firms in operation in the past 12 months generated between $50,000 and $10 million in
TABLE 2. Prevalent Majors for Entrepreneurs by Company Industry
Industry for First Company StartedMost Concentrated Majors for
Each Industry
Share of Industry Entrepreneurs with Prevalent Major(s)
Share of Industry Entrepreneurs with All Other
MajorsAgriculture, Forestry, and Fishing Agriculture and Natural Resources 45.2% 54.8%
Mining Physical Sciences and Engineering
27.3% and 22.7% 50.0%
Utilities Engineering 34.8% 65.2%
Construction Engineering 24.4% 75.6%
Manufacturing Engineering 36.5% 63.5%
Wholesale trade Business, Management, and Marketing
34.5% 65.5%
Retail trade Business, Management, and Marketing and Liberal Arts
20.5% and 14.8% 64.6%
Transportation and Warehousing Engineering and Business, Management, and Marketing
22.9% and 20.8% 56.3%
Information Communications Technologies Engineering and Liberal Arts 19.5% and 15.7% 64.8%
Finance and Insurance Business, Management, and Marketing
37.1% 62.9%
Real Estate Business, Management, and Marketing and Liberal Arts
22.4% and 18.5% 59.1%
Professional and Scientific Services Liberal Arts and Engineering 18.4% and 17.4% 64.2%
Company Management Business, Management, and Marketing and Social Sciences
23.6% and 21.3% 55.1%
Administrative and Waste Management Business, Management, and Marketing and Liberal Arts
26.7% and 20.0% 53.3%
Educational Services Education and Social Sciences 28.0% and 19.2% 52.7%
Health Care and Social Services Health Related and Life Sciences
41.5% 58.5%
Arts, Entertainment, and Performance The Arts and Liberal Arts 25.0% and 22.6% 52.4%
Accommodation Business, Management, and Marketing and Social Sciences
21.4% and 17.9% 60.7%
Food and Drinking Establishments Business, Management, and Marketing and Social Sciences
23.0% and 17.9% 59.2%
Other Services Liberal Arts 23.4% 76.6%
Data: 2013 URC Alumni SurveyAnalysis: Anderson Economic Group, LLC
Supplying Entrepreneurs: URC Alumni
Anderson Economic Group, LLC 29
revenues. Figure 17 below shows the share of URC firms operating in 2012 in each revenue bracket.
FIGURE 17. Revenue Brackets for URC-Alumni Firms in 2012
For companies that have negative or zero revenues, many are considered “pre-revenue.” This means that while they have employees and are operating, they have not yet brought in revenues. Many companies fit into this category during their first few years of existence while they are fine-tuning their product for the market, seeking funding and investments, and/or marketing their brand.
Of survey respondents that reported firms with negative to zero revenues, 60% of the firms were started in the past two years. These pre-revenue firms also employ a considerable number of people. Of respondents who reported zero or negative revenue in 2012, 27% indicated that they did not have another employee other than themselves, 63% had between one and five employees, and 8% had up to 20 employees.
Companies started or acquired by URC alumni with positive revenue also have a wide range in their number of employees. Employment levels vary from zero employees (other than the owner) to more than 10,000. About a tenth of respon-dents indicated they started firms without employees, other than the owner.21 For the companies that do have employees, 60.1% of firms have or had between one and five employees.
21.We are reporting the company size for all companies shared in the survey. Of these, some are still in operation, while others are not. We present the data for all companies to highlight the company size for firms started and/or acquired by URC graduates rather than solely focusing on those still in operation.
16.6%
1.4%
2.2%
19.0%
16.5%
19.3%
17.2%
5.2%
1.1%
1.3%
Pre-Revenue (Negative to Zero)
$1 to $100
$101 to $1,000
$1,001 to $50,000
$50,001 to $200,000
$200,001 to $1,000,000
$1,000,001 to $10,000,000
$10,000,001 to $50,000,000
$50,000,001 to $100,000,000
More than $100 Million
Supplying Entrepreneurs: URC Alumni
Anderson Economic Group, LLC 30
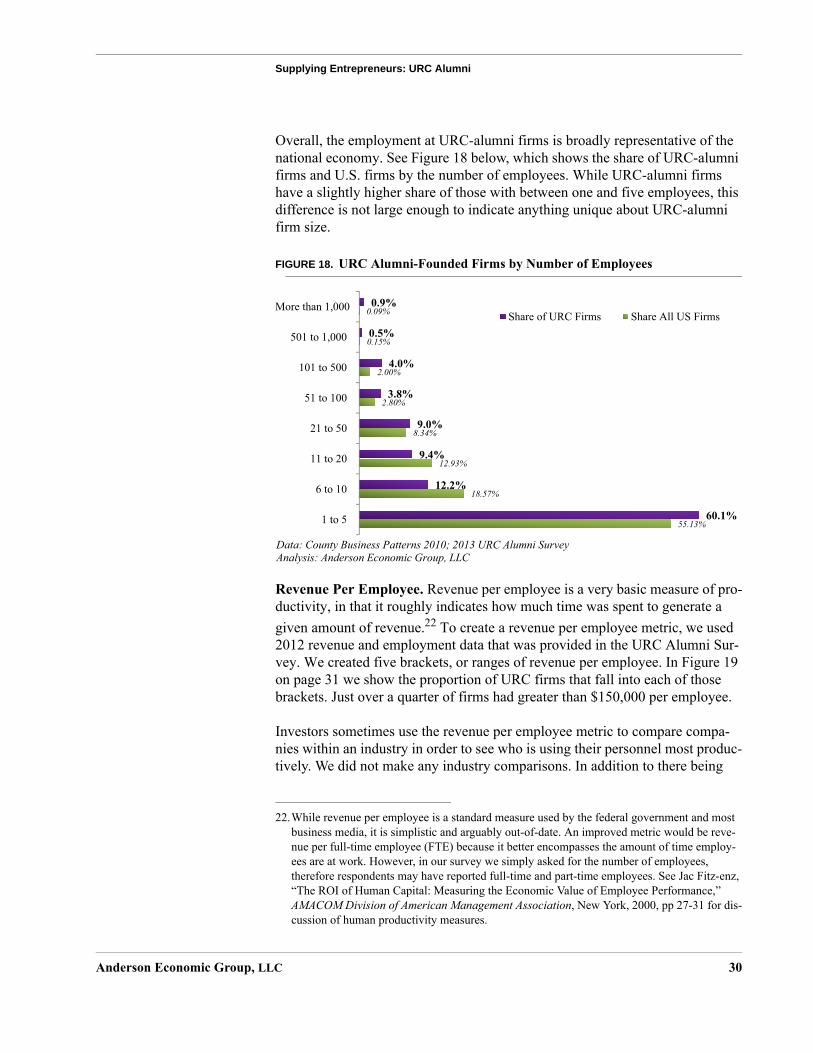
Overall, the employment at URC-alumni firms is broadly representative of the national economy. See Figure 18 below, which shows the share of URC-alumni firms and U.S. firms by the number of employees. While URC-alumni firms have a slightly higher share of those with between one and five employees, this difference is not large enough to indicate anything unique about URC-alumni firm size.
FIGURE 18. URC Alumni-Founded Firms by Number of Employees
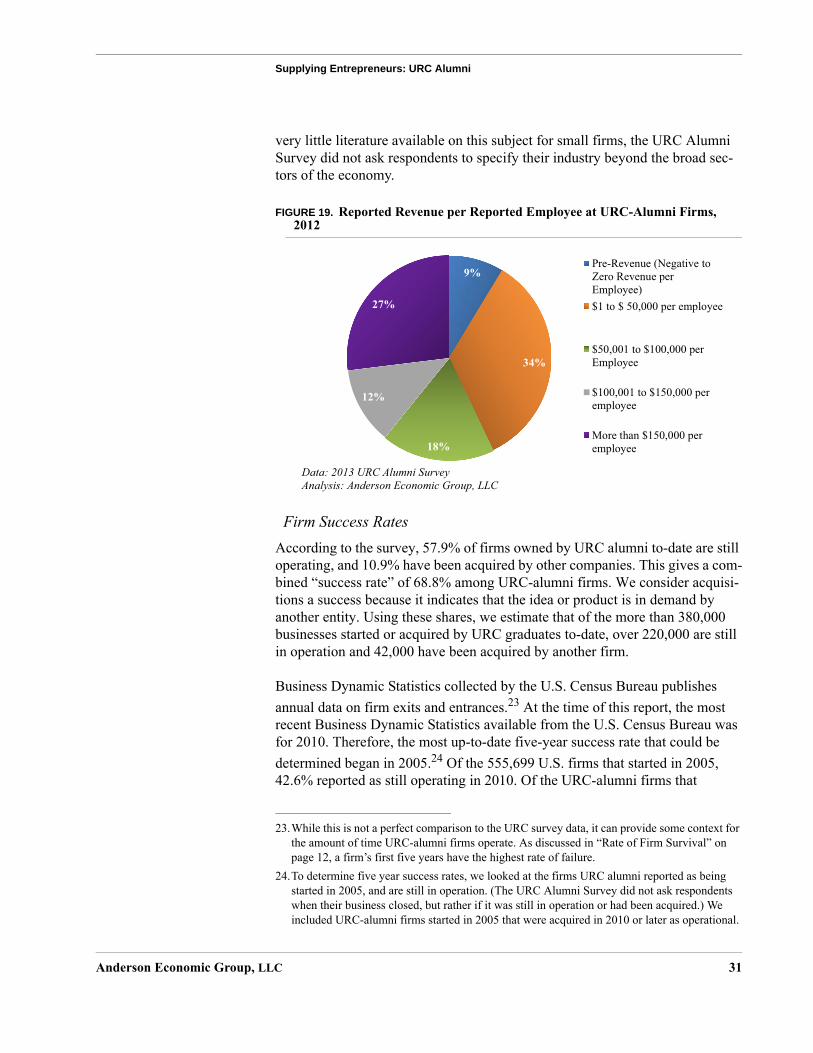
Revenue Per Employee. Revenue per employee is a very basic measure of pro-ductivity, in that it roughly indicates how much time was spent to generate a given amount of revenue.22 To create a revenue per employee metric, we used 2012 revenue and employment data that was provided in the URC Alumni Sur-vey. We created five brackets, or ranges of revenue per employee. In Figure 19 on page 31 we show the proportion of URC firms that fall into each of those brackets. Just over a quarter of firms had greater than $150,000 per employee.
Investors sometimes use the revenue per employee metric to compare compa-nies within an industry in order to see who is using their personnel most produc-tively. We did not make any industry comparisons. In addition to there being
60.1%
12.2%
9.4%
9.0%
3.8%
4.0%
0.5%
0.9%
1 to 5
6 to 10
11 to 20
21 to 50
51 to 100
101 to 500
501 to 1,000
More than 1,000Share of URC Firms Share All US Firms
22.While revenue per employee is a standard measure used by the federal government and most business media, it is simplistic and arguably out-of-date. An improved metric would be reve-nue per full-time employee (FTE) because it better encompasses the amount of time employ-ees are at work. However, in our survey we simply asked for the number of employees, therefore respondents may have reported full-time and part-time employees. See Jac Fitz-enz, “The ROI of Human Capital: Measuring the Economic Value of Employee Performance,” AMACOM Division of American Management Association, New York, 2000, pp 27-31 for dis-cussion of human productivity measures.
Supplying Entrepreneurs: URC Alumni
Anderson Economic Group, LLC 31
very little literature available on this subject for small firms, the URC Alumni Survey did not ask respondents to specify their industry beyond the broad sec-tors of the economy.
FIGURE 19. Reported Revenue per Reported Employee at URC-Alumni Firms, 2012
Firm Success RatesAccording to the survey, 57.9% of firms owned by URC alumni to-date are still operating, and 10.9% have been acquired by other companies. This gives a com-bined “success rate” of 68.8% among URC-alumni firms. We consider acquisi-tions a success because it indicates that the idea or product is in demand by another entity. Using these shares, we estimate that of the more than 380,000 businesses started or acquired by URC graduates to-date, over 220,000 are still in operation and 42,000 have been acquired by another firm.
Business Dynamic Statistics collected by the U.S. Census Bureau publishes annual data on firm exits and entrances.23 At the time of this report, the most recent Business Dynamic Statistics available from the U.S. Census Bureau was for 2010. Therefore, the most up-to-date five-year success rate that could be determined began in 2005.24 Of the 555,699 U.S. firms that started in 2005, 42.6% reported as still operating in 2010. Of the URC-alumni firms that
23.While this is not a perfect comparison to the URC survey data, it can provide some context for the amount of time URC-alumni firms operate. As discussed in “Rate of Firm Survival” on page 12, a firm’s first five years have the highest rate of failure.
24.To determine five year success rates, we looked at the firms URC alumni reported as being started in 2005, and are still in operation. (The URC Alumni Survey did not ask respondents when their business closed, but rather if it was still in operation or had been acquired.) We included URC-alumni firms started in 2005 that were acquired in 2010 or later as operational.
9%
34%
18%
12%
27%
Pre-Revenue (Negative toZero Revenue perEmployee)$1 to $ 50,000 per employee
$50,001 to $100,000 perEmployee
$100,001 to $150,000 peremployee
More than $150,000 peremployee
Data: 2013 URC Alumni SurveyAnalysis: Anderson Economic Group, LLC
Supplying Entrepreneurs: URC Alumni
Anderson Economic Group, LLC 32
reported in the survey that they opened their business in 2005, 69.5% were still in operation at the time of the survey, and 5.32% have been acquired. See below in Table 3.
URC ENTREPRENEURS IN MICHIGAN
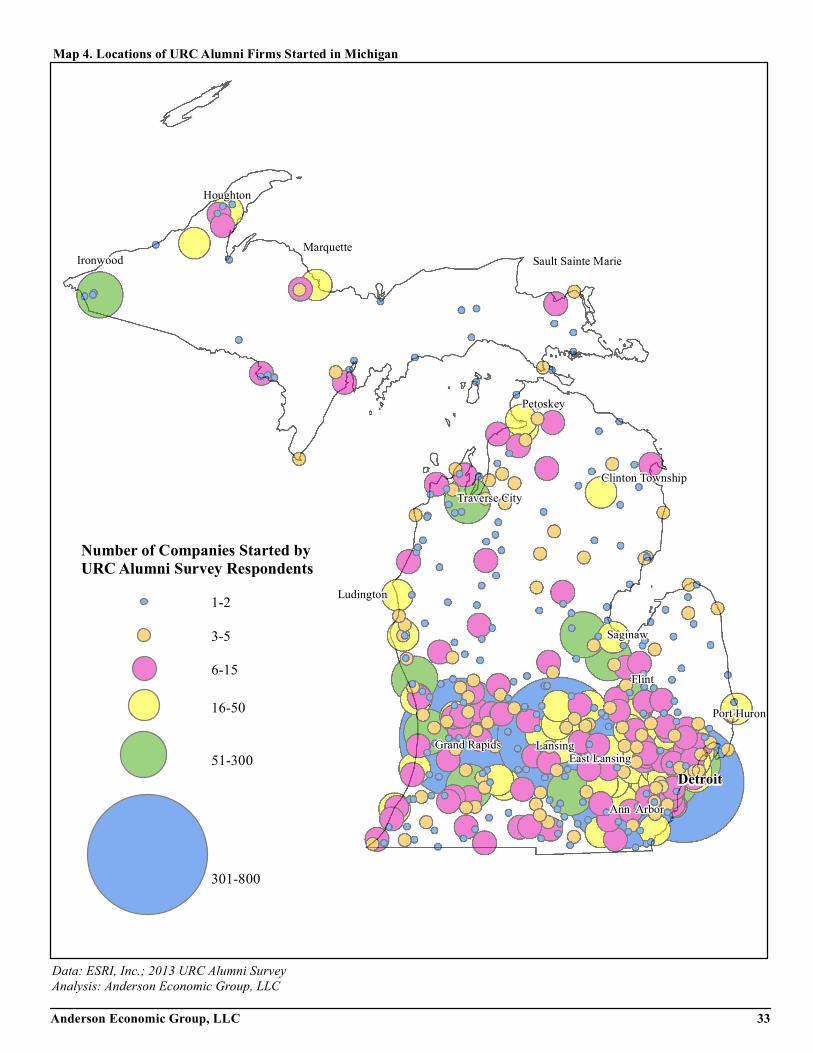
Not surprisingly, nearly 50% of all companies started or purchased by URC graduates are or were in Michigan. Survey respondents who have started or pur-chased a business indicated that where they grew up or went to college ranked very high on why they located their businesses in a given region.
Map 4 on page 33 shows the number of firms reported in the survey and started or acquired by URC alumni in Michigan by city. The map provides further evidence for this as Ann Arbor, Detroit, and East Lansing have the largest number of business starts in the state.
TABLE 3. Five Year Start-Up Success Rates for the U.S. and URC-Alumni Firms
Share of 2005 Start-Ups Still Operating
U.S. Average Firm Success Rate 42.6%
URC-Alumni Firm Success Rate 69.5%
Data: Business Dynamic Statistics, U.S. Census; 2013 URC Alumni Survey
Analysis: Anderson Economic Group, LLC
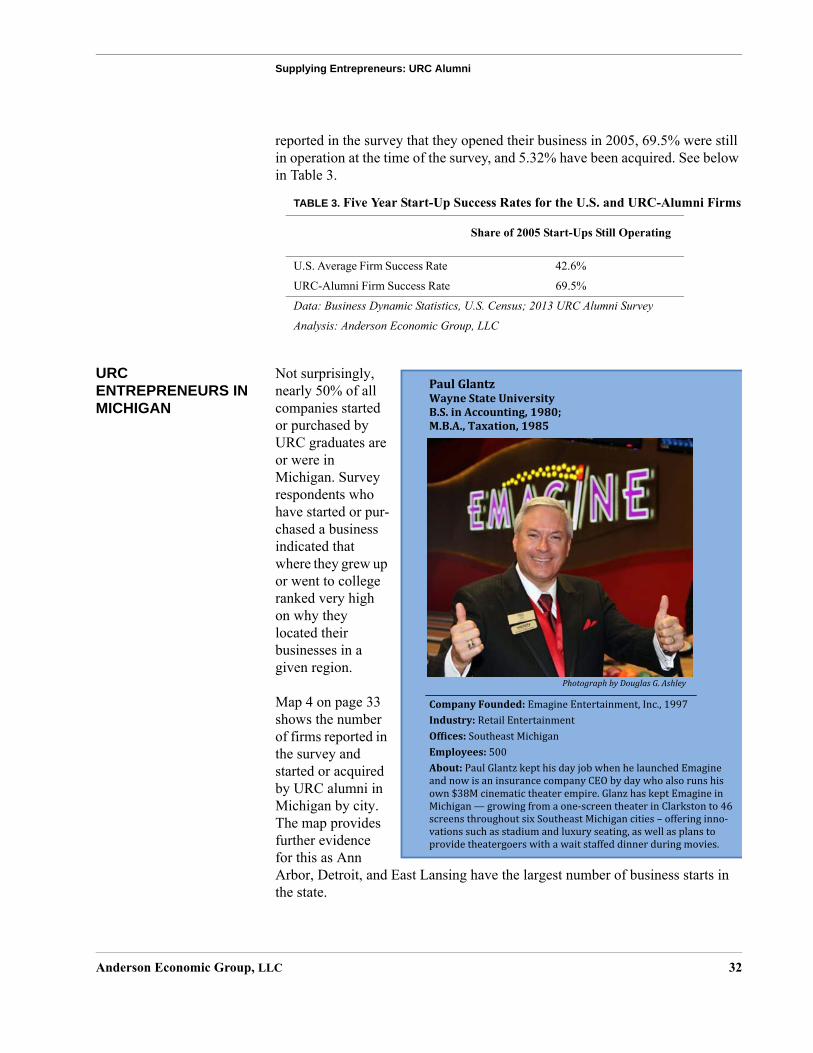
PaulGlantz WayneStateUniversity B.S.inAccounting,1980;M.B.A.,Taxation,1985
CompanyFounded:EmagineEntertainment,Inc.,1997Industry:RetailEntertainmentOf�ices:SoutheastMichiganEmployees:500About:PaulGlantzkepthisdayjobwhenhelaunchedEmagineandnowisaninsurancecompanyCEObydaywhoalsorunshisown$38Mcinematictheaterempire.GlanzhaskeptEmagineinMichigan—growingfromaone-screentheaterinClarkstonto46screensthroughoutsixSoutheastMichigancities–offeringinno-vationssuchasstadiumandluxuryseating,aswellasplanstoprovidetheatergoerswithawaitstaffeddinnerduringmovies.
PhotographbyDouglasG.Ashley
Number of Companies Started by URC Alumni Survey Respondents
1-2
3-5
6-15
16-50
51-300
301-800
East Lansing
Ann Arbor
Traverse City
Detroit
Grand Rapids Lansing
Data: ESRI, Inc.; 2013 URC Alumni SurveyAnalysis: Anderson Economic Group, LLC
Sault Sainte MarieIronwood
Houghton
Marquette
Petoskey
Clinton Township
Saginaw
Ludington
Port Huron
Flint
Map 4. Locations of URC Alumni Firms Started in Michigan
Anderson Economic Group, LLC 33
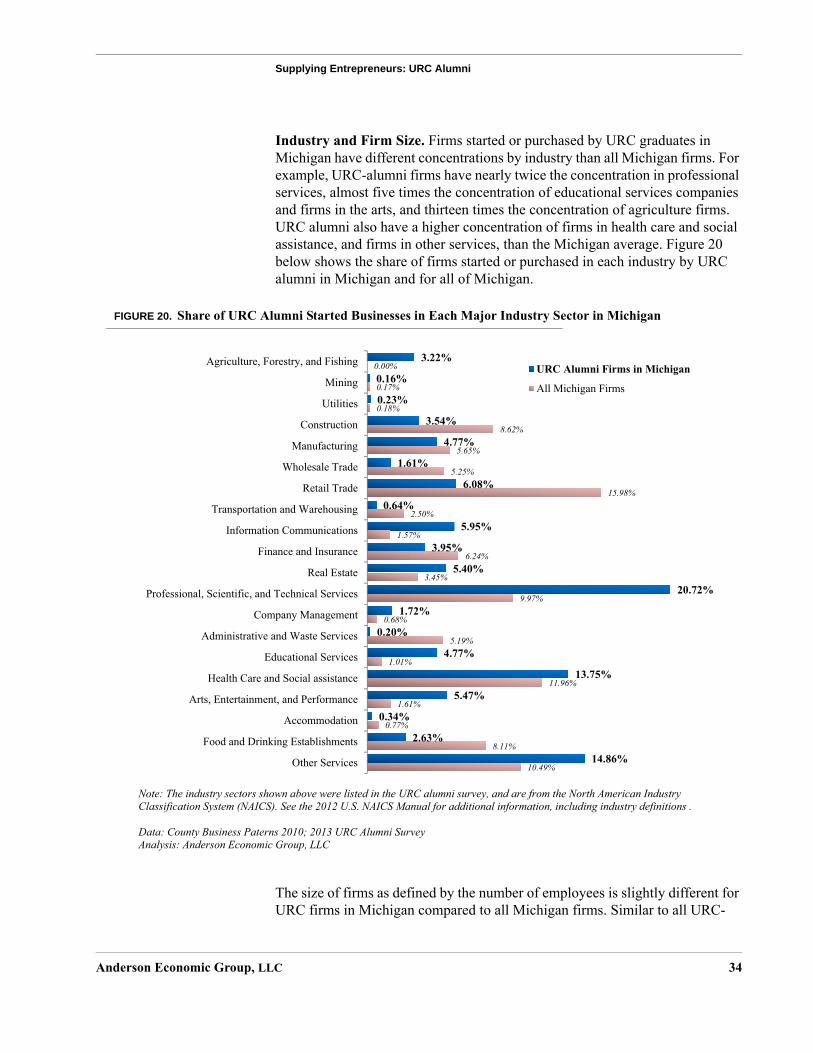
Supplying Entrepreneurs: URC Alumni
Anderson Economic Group, LLC 34
Industry and Firm Size. Firms started or purchased by URC graduates in Michigan have different concentrations by industry than all Michigan firms. For example, URC-alumni firms have nearly twice the concentration in professional services, almost five times the concentration of educational services companies and firms in the arts, and thirteen times the concentration of agriculture firms. URC alumni also have a higher concentration of firms in health care and social assistance, and firms in other services, than the Michigan average. Figure 20 below shows the share of firms started or purchased in each industry by URC alumni in Michigan and for all of Michigan.
FIGURE 20. Share of URC Alumni Started Businesses in Each Major Industry Sector in Michigan
The size of firms as defined by the number of employees is slightly different for URC firms in Michigan compared to all Michigan firms. Similar to all URC-
3.22%
0.16%
0.23%
3.54%
4.77%
1.61%
6.08%
0.64%
5.95%
3.95%
5.40%
20.72%
1.72%
0.20%
4.77%
13.75%
5.47%
0.34%
2.63%
14.86%
0.00%
0.17%
0.18%
8.62%
5.65%
5.25%
15.98%
2.50%
1.57%
6.24%
3.45%
9.97%
0.68%
5.19%
1.01%
11.96%
1.61%
0.77%
8.11%
10.49%
Agriculture, Forestry, and Fishing
Mining
Utilities
Construction
Manufacturing
Wholesale Trade
Retail Trade
Transportation and Warehousing
Information Communications
Finance and Insurance
Real Estate
Professional, Scientific, and Technical Services
Company Management
Administrative and Waste Services
Educational Services
Health Care and Social assistance
Arts, Entertainment, and Performance
Accommodation
Food and Drinking Establishments
Other Services
URC Alumni Firms in Michigan
All Michigan Firms
Note: The industry sectors shown above were listed in the URC alumni survey, and are from the North American Industry Classification System (NAICS). See the 2012 U.S. NAICS Manual for additional information, including industry definitions .
Data: County Business Paterns 2010; 2013 URC Alumni SurveyAnalysis: Anderson Economic Group, LLC
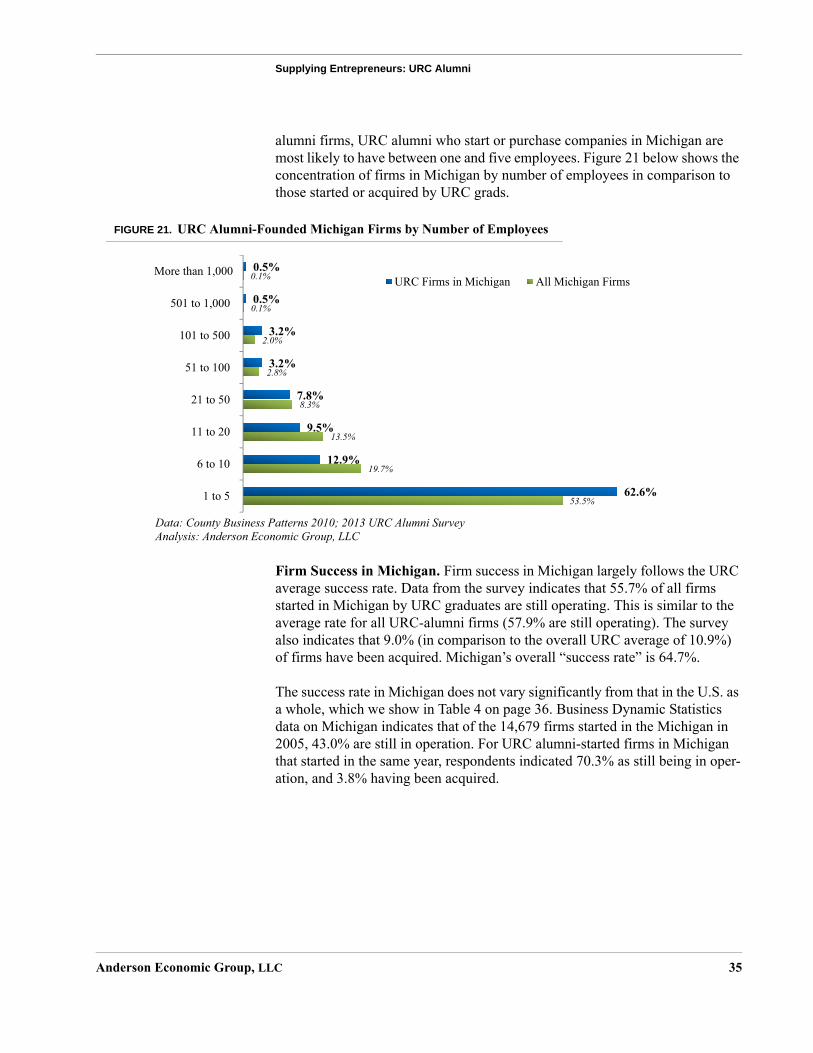
Supplying Entrepreneurs: URC Alumni
Anderson Economic Group, LLC 35
alumni firms, URC alumni who start or purchase companies in Michigan are most likely to have between one and five employees. Figure 21 below shows the concentration of firms in Michigan by number of employees in comparison to those started or acquired by URC grads.
FIGURE 21. URC Alumni-Founded Michigan Firms by Number of Employees
Firm Success in Michigan. Firm success in Michigan largely follows the URC average success rate. Data from the survey indicates that 55.7% of all firms started in Michigan by URC graduates are still operating. This is similar to the average rate for all URC-alumni firms (57.9% are still operating). The survey also indicates that 9.0% (in comparison to the overall URC average of 10.9%) of firms have been acquired. Michigan’s overall “success rate” is 64.7%.
The success rate in Michigan does not vary significantly from that in the U.S. as a whole, which we show in Table 4 on page 36. Business Dynamic Statistics data on Michigan indicates that of the 14,679 firms started in the Michigan in 2005, 43.0% are still in operation. For URC alumni-started firms in Michigan that started in the same year, respondents indicated 70.3% as still being in oper-ation, and 3.8% having been acquired.
62.6%
12.9%
9.5%
7.8%
3.2%
3.2%
0.5%
0.5%
1 to 5
6 to 10
11 to 20
21 to 50
51 to 100
101 to 500
501 to 1,000
More than 1,000URC Firms in Michigan All Michigan Firms
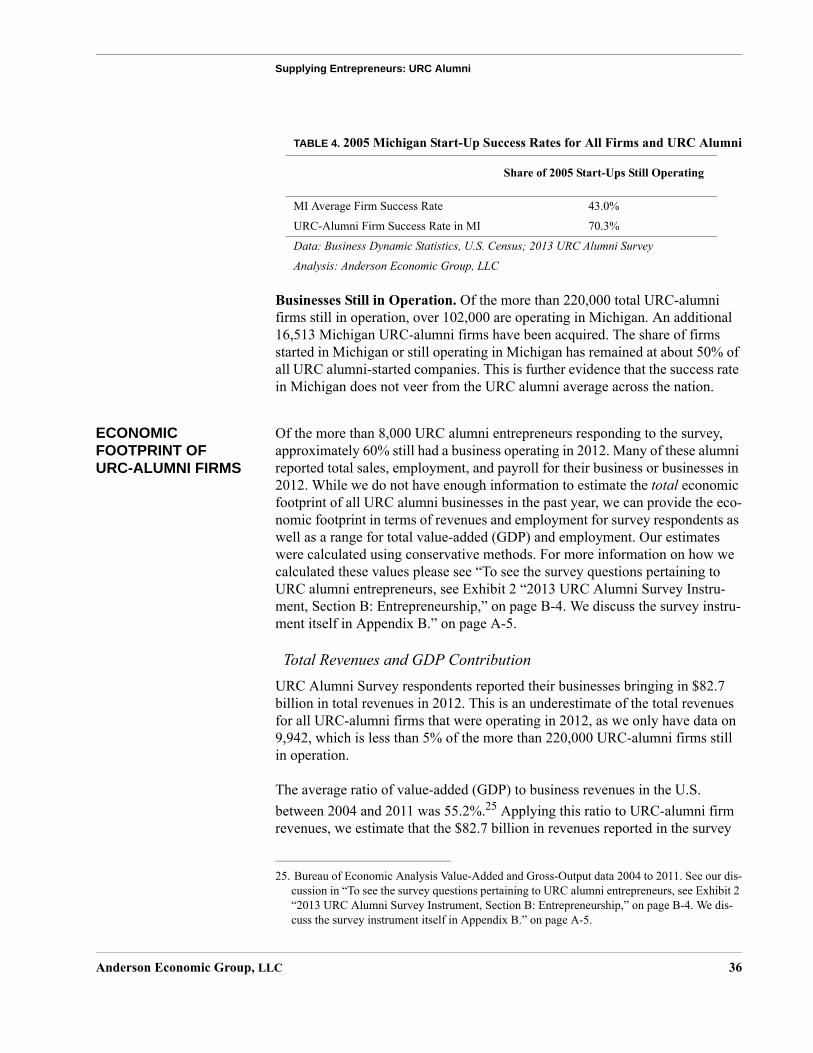
Supplying Entrepreneurs: URC Alumni
Anderson Economic Group, LLC 36
Businesses Still in Operation. Of the more than 220,000 total URC-alumni firms still in operation, over 102,000 are operating in Michigan. An additional 16,513 Michigan URC-alumni firms have been acquired. The share of firms started in Michigan or still operating in Michigan has remained at about 50% of all URC alumni-started companies. This is further evidence that the success rate in Michigan does not veer from the URC alumni average across the nation.
ECONOMIC FOOTPRINT OF URC-ALUMNI FIRMS
Of the more than 8,000 URC alumni entrepreneurs responding to the survey, approximately 60% still had a business operating in 2012. Many of these alumni reported total sales, employment, and payroll for their business or businesses in 2012. While we do not have enough information to estimate the total economic footprint of all URC alumni businesses in the past year, we can provide the eco-nomic footprint in terms of revenues and employment for survey respondents as well as a range for total value-added (GDP) and employment. Our estimates were calculated using conservative methods. For more information on how we calculated these values please see “To see the survey questions pertaining to URC alumni entrepreneurs, see Exhibit 2 “2013 URC Alumni Survey Instru-ment, Section B: Entrepreneurship,” on page B-4. We discuss the survey instru-ment itself in Appendix B.” on page A-5.
Total Revenues and GDP ContributionURC Alumni Survey respondents reported their businesses bringing in $82.7 billion in total revenues in 2012. This is an underestimate of the total revenues for all URC-alumni firms that were operating in 2012, as we only have data on 9,942, which is less than 5% of the more than 220,000 URC-alumni firms still in operation.
The average ratio of value-added (GDP) to business revenues in the U.S. between 2004 and 2011 was 55.2%.25 Applying this ratio to URC-alumni firm revenues, we estimate that the $82.7 billion in revenues reported in the survey
TABLE 4. 2005 Michigan Start-Up Success Rates for All Firms and URC Alumni
Share of 2005 Start-Ups Still Operating
MI Average Firm Success Rate 43.0%
URC-Alumni Firm Success Rate in MI 70.3%
Data: Business Dynamic Statistics, U.S. Census; 2013 URC Alumni Survey
Analysis: Anderson Economic Group, LLC
25. Bureau of Economic Analysis Value-Added and Gross-Output data 2004 to 2011. See our dis-cussion in “To see the survey questions pertaining to URC alumni entrepreneurs, see Exhibit 2 “2013 URC Alumni Survey Instrument, Section B: Entrepreneurship,” on page B-4. We dis-cuss the survey instrument itself in Appendix B.” on page A-5.
Supplying Entrepreneurs: URC Alumni
Anderson Economic Group, LLC 37
would be equivalent to about $45 billion in GDP. This estimate of GDP is equivalent to the economy of Uruguay or Tunisia.26
By carefully considering that the revenues reported in the survey cannot be completely representative of all URC-alumni firms, we provide a range of esti-mates for total revenues and GDP for all URC-alumni firms in 2012. We esti-mate that the more than 220,000 URC-alumni firms that were in operation in 2012 contributed between $370 billion and $480 billion to the world’s GDP. The lower bound ($370 billion) is roughly equivalent to the economy of Thai-land or Colombia. The upper bound ($480 billion) is approximately the size of the economies of Argentina, Belgium, or Taiwan.
Total Revenues in Michigan. We estimate that of the more than 220,000 URC-alumni firms still operating in 2012, more than 102,000 are located in Michigan. Survey respondents reported on 4,462 currently operating business in Michigan. These firms brought in $24.7 billion, or approximately a third of all revenues generated by URC-alumni firms in 2012. This is an underestimate of the total revenues in for Michigan firms as we have revenue data on 4.4% of all URC-alumni firms in Michigan.27
Total EmploymentSurvey respondents indicated employing 1,121,331 people in 2012. This is an underestimate of the total employed for all URC alumni-started firms that were in operation last year because it only represents the firms in the survey. We con-servatively assumed that the survey overrepresents the number of firms with over 1,000 employees and that the total URC alumni business population had a similar share of firms with over 1,000 to the U.S. average. We estimate that the URC-alumni firms operating in 2012 together employed approximately 5.5 mil-lion people. This is roughly equal to the population of Finland.28
Total Employment in Michigan. The URC alumni from the survey, which reported operating more than 4,100 firms in Michigan during 2012, also reported employing 221,513 people. This is an underestimate of the number of people employed by URC-alumni firms in Michigan, as the survey data repre-sents just over 4% of the total alumni firms we estimate to be located in Michi-gan.29
26.International Monetary Fund, “IMF World Economic Outlook (WEO): Hopes, Realities, and Risks,” April 2013.
27.We limited our estimations to a level of detail that did not include the amount of revenue gen-erated by firms within specific geographies.
28.Official estimate from the Population Register Centre, Helsinki, Finland, 2012.29.We limited our estimations to a level of detail that did not include the number of employees by
geographic area.
Providing Tools: The Academic Foundation at the URC Universities
Anderson Economic Group, LLC 38
IV. Providing Tools: The Academic Foundation at the URC Universities
Historically, “entrepreneurism” is a term that has been associated, on an aca-demic level, with business programs. More recently, this association has expanded beyond the degrees of Bachelor of Business Administration (BBA) and Master of Business Administration (MBA), reaching students in disciplines ranging from engineering and computer sciences to art and design, and the lib-eral arts.
We begin this section by discussing how the URC currently supports entrepre-neurship in a big-picture sense; both historically and more recently. The remain-der of the section focuses on the academic role that the URC universities have conventionally played in the entrepreneurial process: exposing students to cut-ting edge research and providing them with the tools to enter the business world. While many of the programs we discuss are described separately, they are often interrelated, and contribute to a larger sense of entrepreneurial com-munity both at the URC universities, as well as throughout the state.
BIG PICTURE: HOW THE URC SUPPORTS ENTREPRENEURSHIP
As shown in “What It Means to Start a Business” on page 9, launching a busi-ness venture consists of many components, many of which are interrelated. Resources at the URC universities address several of these components and the potential challenges that arise as a result of them. Figure 22, “An Illustration of the URC’s Support for the Entrepreneur in the Start-up Process,” on page 39 displays some of the ways that universities can contribute to challenges associ-ated with becoming a successful entrepreneur. Under each of the challenges associated with starting a business, we listed resources that the URC universities make available to entrepreneurs.
At each of the URC universities, they try to provide foundations for business success through traditional curriculum, experiential learning, and hands-on experiences. Teaching entrepreneurs of all types how to scale their businesses helps to fill a need in the market for those wanting to pursue building a bigger business. It also encourages existing ventures to further innovate; efforts to impart these skills are strategically incorporated into university curriculum.
Outside of the classroom, universities provide services such as incubators, fund-ing, mentorship, and networking opportunities in order to facilitate entrepre-neurial success. This section will detail the conventional role played by universities. Many of the other resources and programs available at the universi-ties are discussed in the following section, “Supporting The Entrepreneurial Process: The Evolving Role of the URC Universities” on page 50.
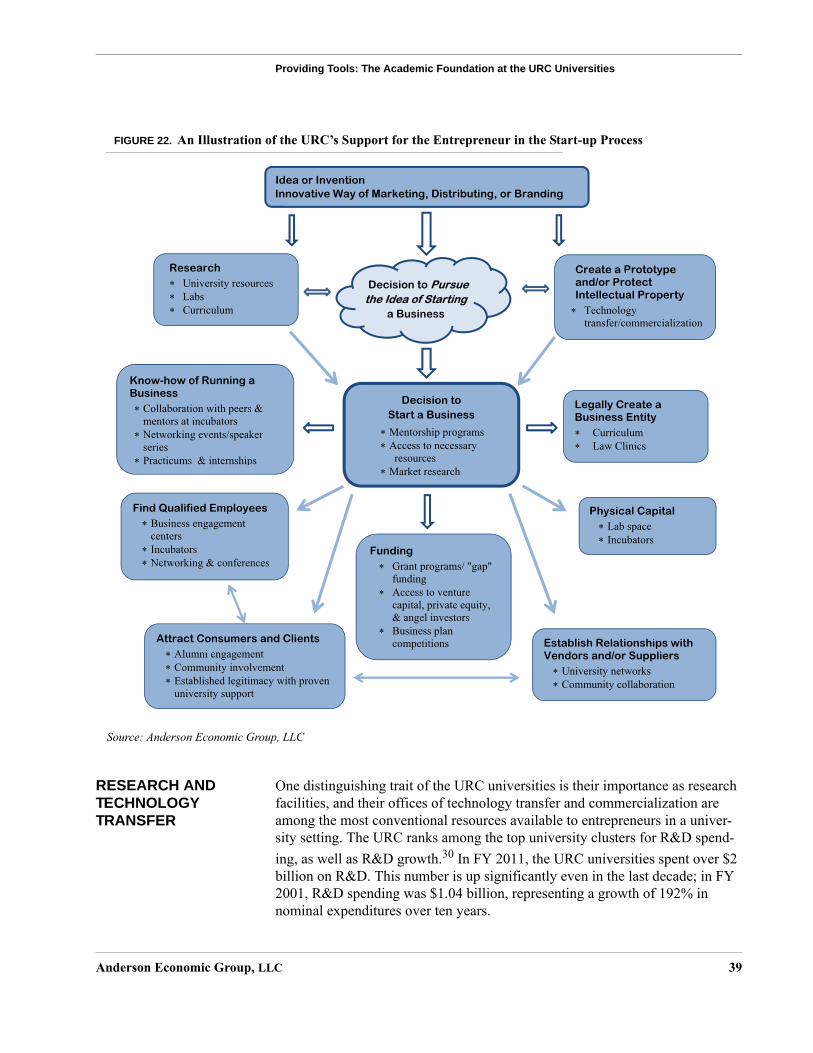
Providing Tools: The Academic Foundation at the URC Universities
Anderson Economic Group, LLC 39
FIGURE 22. An Illustration of the URC’s Support for the Entrepreneur in the Start-up Process
RESEARCH AND TECHNOLOGY TRANSFER
One distinguishing trait of the URC universities is their importance as research facilities, and their offices of technology transfer and commercialization are among the most conventional resources available to entrepreneurs in a univer-sity setting. The URC ranks among the top university clusters for R&D spend-ing, as well as R&D growth.30 In FY 2011, the URC universities spent over $2 billion on R&D. This number is up significantly even in the last decade; in FY 2001, R&D spending was $1.04 billion, representing a growth of 192% in nominal expenditures over ten years.
Idea or Invention Innovative Way of Marketing, Distributing, or Branding
Decision to Start a Business
Mentorship programs Access to necessary resources
Market research
Know-how of Running a Business
Collaboration with peers & mentors at incubators Networking events/speaker series Practicums & internships
Legally Create a Business Entity
CurriculumLaw Clinics
Funding Grant programs/ "gap"funding Access to venture capital, private equity, & angel investors Business plan competitions
Create a Prototype and/or Protect Intellectual Property
Technology transfer/commercialization
Physical Capital Lab space Incubators
Decision to Pursue the Idea of Starting
a Business
Find Qualified Employees Business engagement centers IncubatorsNetworking & conferences
Attract Consumers and Clients Alumni engagement Community involvement Established legitimacy with proven university support
Establish Relationships with Vendors and/or Suppliers
University networks Community collaboration
Research University resources LabsCurriculum
Source: Anderson Economic Group, LLC
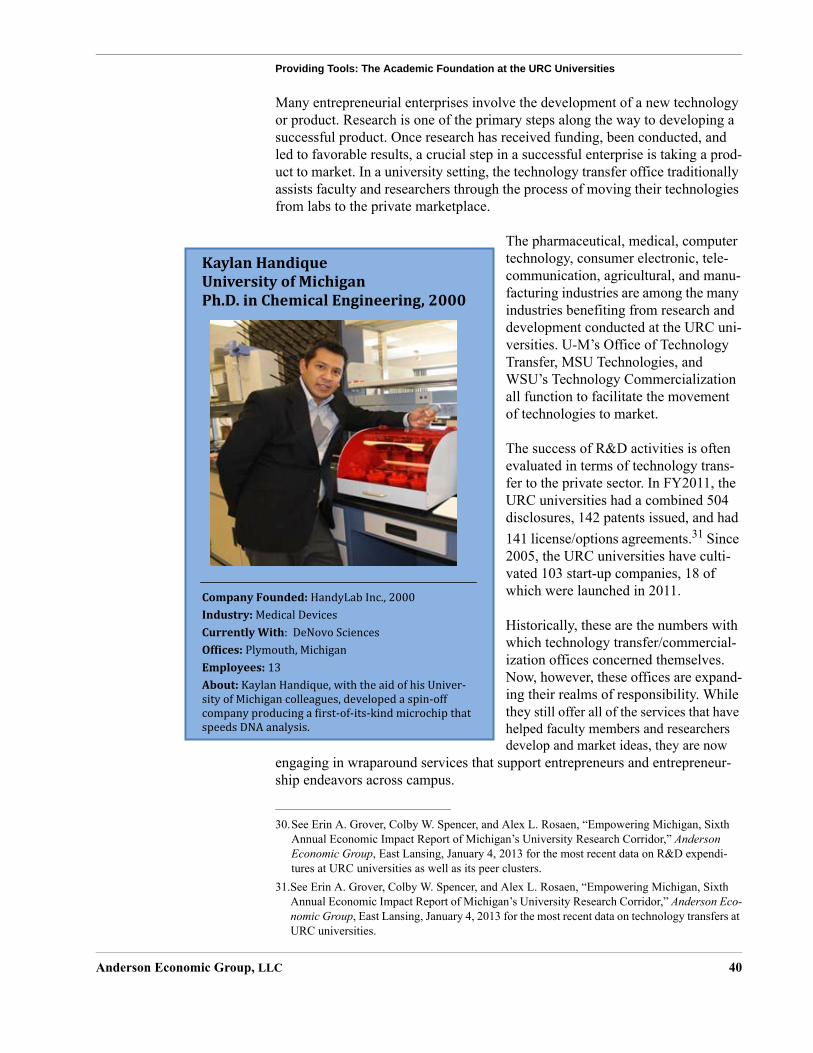
Providing Tools: The Academic Foundation at the URC Universities
Anderson Economic Group, LLC 40
Many entrepreneurial enterprises involve the development of a new technology or product. Research is one of the primary steps along the way to developing a successful product. Once research has received funding, been conducted, and led to favorable results, a crucial step in a successful enterprise is taking a prod-uct to market. In a university setting, the technology transfer office traditionally assists faculty and researchers through the process of moving their technologies from labs to the private marketplace.
The pharmaceutical, medical, computer technology, consumer electronic, tele-communication, agricultural, and manu-facturing industries are among the many industries benefiting from research and development conducted at the URC uni-versities. U-M’s Office of Technology Transfer, MSU Technologies, and WSU’s Technology Commercialization all function to facilitate the movement of technologies to market.
The success of R&D activities is often evaluated in terms of technology trans-fer to the private sector. In FY2011, the URC universities had a combined 504 disclosures, 142 patents issued, and had 141 license/options agreements.31 Since 2005, the URC universities have culti-vated 103 start-up companies, 18 of which were launched in 2011.
Historically, these are the numbers with which technology transfer/commercial-ization offices concerned themselves. Now, however, these offices are expand-ing their realms of responsibility. While they still offer all of the services that have helped faculty members and researchers develop and market ideas, they are now
engaging in wraparound services that support entrepreneurs and entrepreneur-ship endeavors across campus.
30.See Erin A. Grover, Colby W. Spencer, and Alex L. Rosaen, “Empowering Michigan, Sixth Annual Economic Impact Report of Michigan’s University Research Corridor,” Anderson Economic Group, East Lansing, January 4, 2013 for the most recent data on R&D expendi-tures at URC universities as well as its peer clusters.
31.See Erin A. Grover, Colby W. Spencer, and Alex L. Rosaen, “Empowering Michigan, Sixth Annual Economic Impact Report of Michigan’s University Research Corridor,” Anderson Eco-nomic Group, East Lansing, January 4, 2013 for the most recent data on technology transfers at URC universities.
KaylanHandique UniversityofMichigan Ph.D.inChemicalEngineering,2000CompanyFounded:HandyLabInc.,2000Industry:MedicalDevicesCurrentlyWith:DeNovoSciencesOf�ices:Plymouth,MichiganEmployees:13About:KaylanHandique,withtheaidofhisUniver-sityofMichigancolleagues,developedaspin-offcompanyproducinga�irst-of-its-kindmicrochipthatspeedsDNAanalysis.
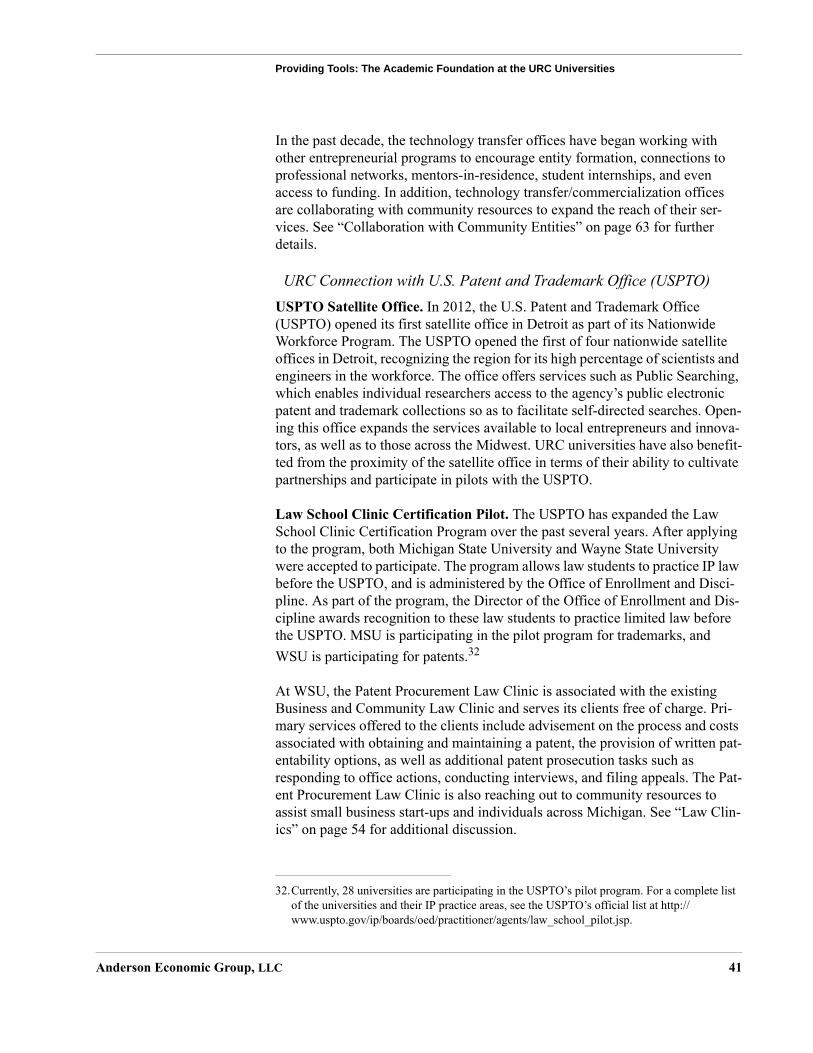
Providing Tools: The Academic Foundation at the URC Universities
Anderson Economic Group, LLC 41
In the past decade, the technology transfer offices have began working with other entrepreneurial programs to encourage entity formation, connections to professional networks, mentors-in-residence, student internships, and even access to funding. In addition, technology transfer/commercialization offices are collaborating with community resources to expand the reach of their ser-vices. See “Collaboration with Community Entities” on page 63 for further details.
URC Connection with U.S. Patent and Trademark Office (USPTO) USPTO Satellite Office. In 2012, the U.S. Patent and Trademark Office (USPTO) opened its first satellite office in Detroit as part of its Nationwide Workforce Program. The USPTO opened the first of four nationwide satellite offices in Detroit, recognizing the region for its high percentage of scientists and engineers in the workforce. The office offers services such as Public Searching, which enables individual researchers access to the agency’s public electronic patent and trademark collections so as to facilitate self-directed searches. Open-ing this office expands the services available to local entrepreneurs and innova-tors, as well as to those across the Midwest. URC universities have also benefit-ted from the proximity of the satellite office in terms of their ability to cultivate partnerships and participate in pilots with the USPTO.
Law School Clinic Certification Pilot. The USPTO has expanded the Law School Clinic Certification Program over the past several years. After applying to the program, both Michigan State University and Wayne State University were accepted to participate. The program allows law students to practice IP law before the USPTO, and is administered by the Office of Enrollment and Disci-pline. As part of the program, the Director of the Office of Enrollment and Dis-cipline awards recognition to these law students to practice limited law before the USPTO. MSU is participating in the pilot program for trademarks, and WSU is participating for patents.32
At WSU, the Patent Procurement Law Clinic is associated with the existing Business and Community Law Clinic and serves its clients free of charge. Pri-mary services offered to the clients include advisement on the process and costs associated with obtaining and maintaining a patent, the provision of written pat-entability options, as well as additional patent prosecution tasks such as responding to office actions, conducting interviews, and filing appeals. The Pat-ent Procurement Law Clinic is also reaching out to community resources to assist small business start-ups and individuals across Michigan. See “Law Clin-ics” on page 54 for additional discussion.
32.Currently, 28 universities are participating in the USPTO’s pilot program. For a complete list of the universities and their IP practice areas, see the USPTO’s official list at http://www.uspto.gov/ip/boards/oed/practitioner/agents/law_school_pilot.jsp.
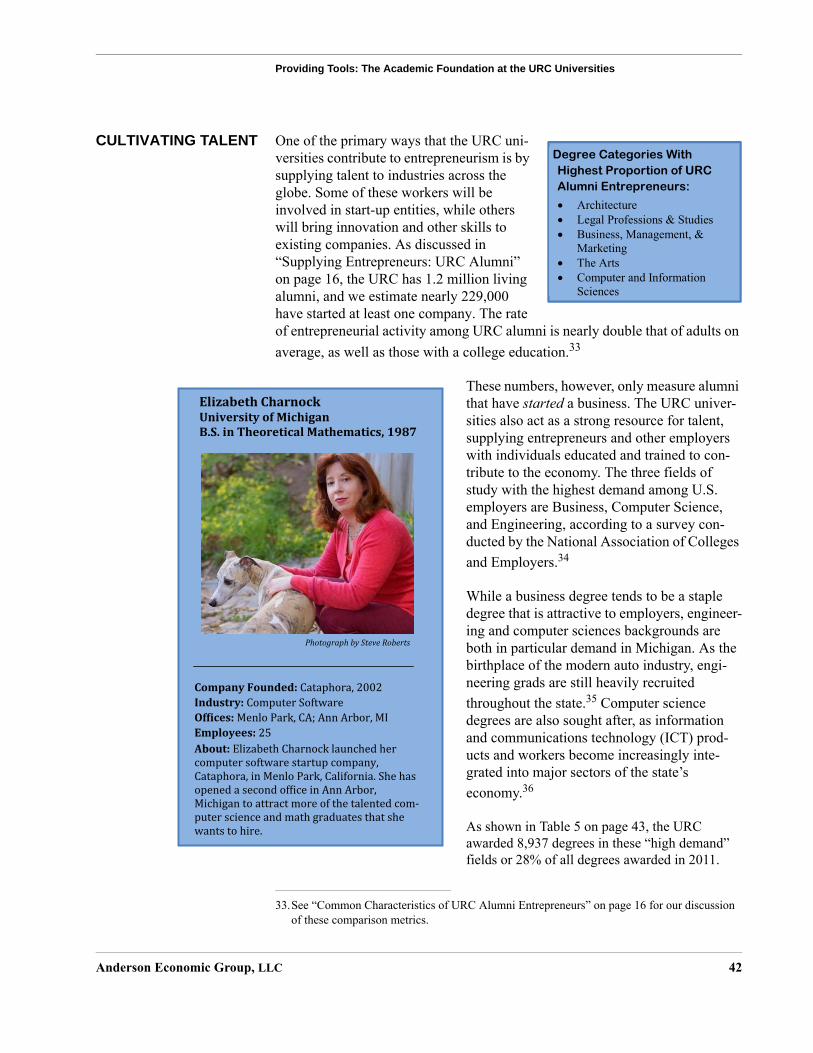
Providing Tools: The Academic Foundation at the URC Universities
Anderson Economic Group, LLC 42
CULTIVATING TALENT One of the primary ways that the URC uni-versities contribute to entrepreneurism is by supplying talent to industries across the globe. Some of these workers will be involved in start-up entities, while others will bring innovation and other skills to existing companies. As discussed in“Supplying Entrepreneurs: URC Alumni” on page 16, the URC has 1.2 million living alumni, and we estimate nearly 229,000 have started at least one company. The rate of entrepreneurial activity among URC alumni is nearly double that of adults on average, as well as those with a college education.33
These numbers, however, only measure alumni that have started a business. The URC univer-sities also act as a strong resource for talent, supplying entrepreneurs and other employers with individuals educated and trained to con-tribute to the economy. The three fields of study with the highest demand among U.S. employers are Business, Computer Science, and Engineering, according to a survey con-ducted by the National Association of Colleges and Employers.34
While a business degree tends to be a staple degree that is attractive to employers, engineer-ing and computer sciences backgrounds are both in particular demand in Michigan. As the birthplace of the modern auto industry, engi-neering grads are still heavily recruited throughout the state.35 Computer science degrees are also sought after, as information and communications technology (ICT) prod-ucts and workers become increasingly inte-grated into major sectors of the state’s economy.36
As shown in Table 5 on page 43, the URC awarded 8,937 degrees in these “high demand” fields or 28% of all degrees awarded in 2011.
33.See “Common Characteristics of URC Alumni Entrepreneurs” on page 16 for our discussion of these comparison metrics.
Degree Categories With Highest Proportion of URC Alumni Entrepreneurs:
� Architecture � Legal Professions & Studies � Business, Management, &
Marketing � The Arts � Computer and Information
Sciences
ElizabethCharnock UniversityofMichigan B.S.inTheoreticalMathematics,1987
CompanyFounded:Cataphora,2002Industry:ComputerSoftwareOf�ices:MenloPark,CA;AnnArbor,MIEmployees:25About:ElizabethCharnocklaunchedhercomputersoftwarestartupcompany,Cataphora,inMenloPark,California.Shehasopenedasecondof�iceinAnnArbor,Michigantoattractmoreofthetalentedcom-puterscienceandmathgraduatesthatshewantstohire.
PhotographbySteveRoberts
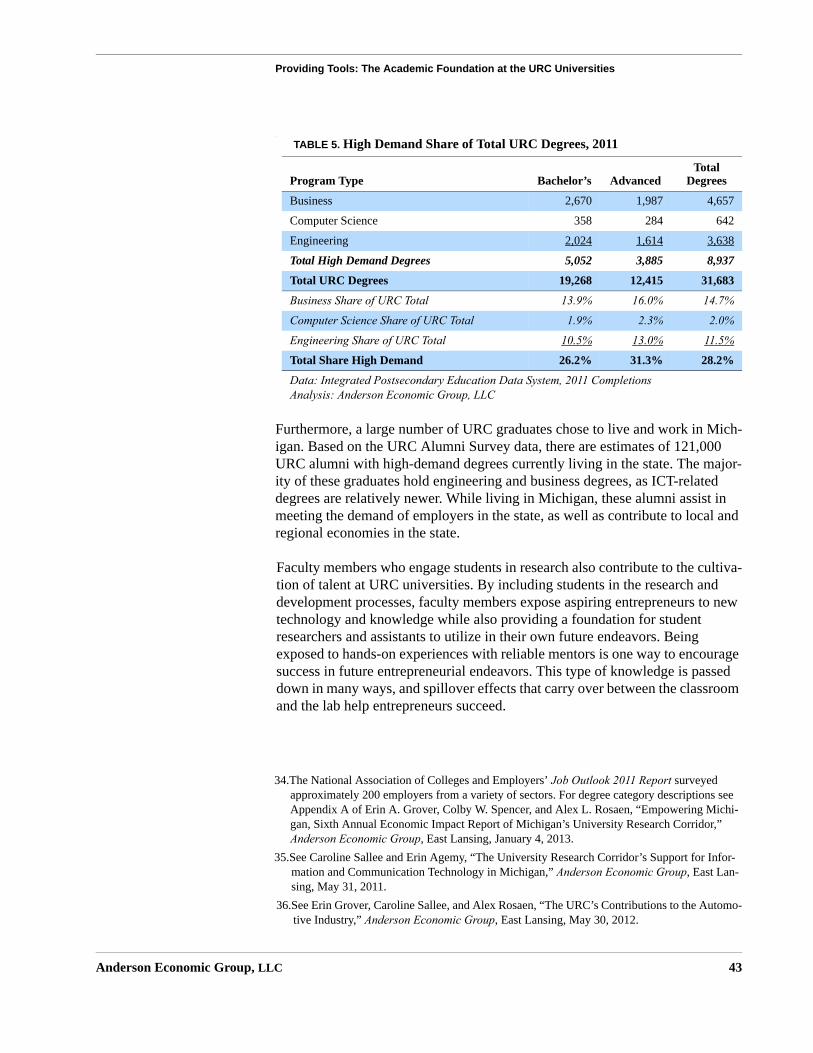
Providing Tools: The Academic Foundation at the URC Universities
Anderson Economic Group, LLC 43
..
Furthermore, a large number of URC graduates chose to live and work in Mich-igan. Based on the URC Alumni Survey data, there are estimates of 121,000 URC alumni with high-demand degrees currently living in the state. The major-ity of these graduates hold engineering and business degrees, as ICT-related degrees are relatively newer. While living in Michigan, these alumni assist in meeting the demand of employers in the state, as well as contribute to local and regional economies in the state.
Faculty members who engage students in research also contribute to the cultiva-tion of talent at URC universities. By including students in the research and development processes, faculty members expose aspiring entrepreneurs to new technology and knowledge while also providing a foundation for student researchers and assistants to utilize in their own future endeavors. Being exposed to hands-on experiences with reliable mentors is one way to encourage success in future entrepreneurial endeavors. This type of knowledge is passed down in many ways, and spillover effects that carry over between the classroom and the lab help entrepreneurs succeed.
34.The National Association of Colleges and Employers’ Job Outlook 2011 Report surveyed approximately 200 employers from a variety of sectors. For degree category descriptions see Appendix A of Erin A. Grover, Colby W. Spencer, and Alex L. Rosaen, “Empowering Michi-gan, Sixth Annual Economic Impact Report of Michigan’s University Research Corridor,” Anderson Economic Group, East Lansing, January 4, 2013.
35.See Caroline Sallee and Erin Agemy, “The University Research Corridor’s Support for Infor-mation and Communication Technology in Michigan,” Anderson Economic Group, East Lan-sing, May 31, 2011.
36.See Erin Grover, Caroline Sallee, and Alex Rosaen, “The URC’s Contributions to the Automo-tive Industry,” Anderson Economic Group, East Lansing, May 30, 2012.
TABLE 5. High Demand Share of Total URC Degrees, 2011
Program Type Bachelor’s AdvancedTotal
Degrees
Business 2,670 1,987 4,657
Computer Science 358 284 642
Engineering 2,024 1,614 3,638
Total High Demand Degrees 5,052 3,885 8,937
Total URC Degrees 19,268 12,415 31,683
Business Share of URC Total 13.9% 16.0% 14.7%
Computer Science Share of URC Total 1.9% 2.3% 2.0%
Engineering Share of URC Total 10.5% 13.0% 11.5%
Total Share High Demand 26.2% 31.3% 28.2%
Data: Integrated Postsecondary Education Data System, 2011 CompletionsAnalysis: Anderson Economic Group, LLC
Providing Tools: The Academic Foundation at the URC Universities
Anderson Economic Group, LLC 44
CURRICULUM The conventional role filled by universities has been to educate students by pro-viding courses that supply either foundational or specialized skills for success in future aspirations in the “real world.” Over the past several years, the role of the URC universities in supporting entrepreneurship has extended beyond the tech-nology transfer office and MBA curriculum. Entrepreneurship programs at the URC universities have been evolving, presenting greater opportunities for stu-dents, faculty, and alumni, as well as offering support to the surrounding com-munities in their entrepreneurial goals.
An argument exists, however, that “entrepreneurs cannot be manufactured; only recognized.”37 While entrepreneurship may require certain personality aspects, the same is true for many career choices. Research by the Kauffman Foundation indicates that 70% of company founders said that university education was important to the success of current businesses.38
Courses in entrepreneurship at the URC universities can take challenges that will be met in the real world of entrepreneurism, and give students tools with which to address these challenges. Courses in entrepreneurism have typically been associated with programs at colleges of business. Programs offered in business school programs range from entrepreneurial management and microfi-nance to independent study projects and law for entrepreneurs. Current curricu-lum however, is being influenced by student demand, expanding beyond the conventional “business only” coursework, and being offered to students not enrolled in business academic programs.
The URC universities are recognizing that the landscape of entrepreneurism is evolving; in addition to expanding the student eligibility for entrepreneurial curriculum, the curriculum itself is also adapting to current entrepreneurship needs to reflect what would be helpful for students. For example, courses are now being offered that address entrepre-neurship in technology, venture capital and private equity, clean technology ven-ture challenges, and social venture funding. Courses are becoming available to students across university departments, as universities look to infuse aspects of entrepreneurism into a greater proportion of the student body.
37.K. Chaharbaghi and R. Willis, as cited in Adcroft, et. al., “Missing the point? Management education and entrepreneurship,” Management Discussion, 2004, Vol. 42, issue 3/4, pp 521-530.
38.Vivek Wadhwa, Raj Aggarwal, Krisztina “Z” Holly, and Alex Salkever, “The Anatomy of an Entrepreneur: Making of a Successful Entrepreneur,” Kauffman Foundation of Entrepreneur-ship, November 2009.
Types of Curricular Options for Entrepreneurs:
Degrees, specializations, and certificates Foundational courses that teach critical business skills Hands-on practicum courses Specialized electives, such as tech-centric entrepreneurship Fellowships, internships
Providing Tools: The Academic Foundation at the URC Universities
Anderson Economic Group, LLC 45
Opportunities have also arisen outside the classroom. Some of these efforts have happened in accordance with the establishment of centers for entrepreneurship, which help to create a “hub” for entrepreneurial resources at the URC universi-ties. Centers for entrepreneurship help to cultivate and facilitate coursework, connections with local businesses, internships (paid and for-credit), and other hands-on experiences for aspiring entrepreneurs. See “Supporting The Entrepre-neurial Process: The Evolving Role of the URC Universities” on page 50 for examples of some of these opportunities at the URC universities. Below we dis-cuss the current curriculum for entrepreneurship at each of the URC universi-ties.
Michigan State University (MSU)At MSU, the Eli Broad College of Business houses much of the curriculum cen-tered on entrepreneurship. The Broad College and the Institute for Entrepre-neurship provide guidance to undergraduate and graduate students on which courses to take. Undergraduates can benefit from specific courses at the Broad College, and the Institute for Entrepreneurship has a list of recommended courses for students at the MBA level who are interested in entrepreneurship.
Some of these classes include specialized electives, such as Retail Entrepreneur-ship, Corporate Entrepreneurship, and Technology Entrepreneurship, which allows for the leveraging of technology to further business ventures. Course-work also includes Entrepreneurship Capstone, which focuses on business development projects, as well as foundational courses such as Law Practice Innovation and Strategic Market Planning and Launch.
Students also have the opportunity to collaborate with faculty and provide con-sulting services to local businesses at the Demmer Center for Business Transfor-mation. Law students can gain experience and training at MSU's Small Business & Nonprofit Law Clinic, which provides legal services to entrepreneurs and businesses across Michigan. See “Law Clinics” on page 54 for further discus-sion. Additionally, MSU Extension offers programs that are specifically geared toward areas such as youth entrepreneurship, agriculture entrepreneurship, and business development.
MSU offers several degree programs associated with entrepreneurship, as well as many courses available to the entire student body. Two of the specific spe-cializations in entrepreneurship are:
• Certificate in Entrepreneurship. Offered by msuENet, this certificate is avail-able to MSU students and community members. This program is an online, two-course series certificate program. These courses develop a foundation of princi-ples and practices for launching a business venture.
• Undergraduate Specialization in Entrepreneurship. This specialization is available to most undergraduate students enrolled in Eli Broad College of Busi-ness, and incorporates experiential assignments, aimed to expose students to
Providing Tools: The Academic Foundation at the URC Universities
Anderson Economic Group, LLC 46
solving real business problems. Entrepreneurship capstone courses, for exam-ple, allow students to work with entrepreneurs to solve problems through all stages of the entrepreneurial process. Additional courses involve skills such as how to leverage technological advances to develop business ideas, and exposure to entrepreneurship law.
University of Michigan (U-M)The University of Michigan offers entrepreneurial curriculum through several departments and ventures, infusing entrepreneurism into many aspects of the university. The Zell Lurie Institute for Entrepreneurial Studies currently offers a range of specific entrepreneurial focus, including entrepreneurial management, independent study projects, and entrepreneurial accounting and finance. The Institute was founded in 1999 at the U-M Business School, but also works with the Medical Center, the College of Literature Science & the Arts, as well as the College of Engineering, facilitating mini-courses that are available for credit to all students.
The College of Engineering, via the Center for Entrepreneurship, also offers entrepreneurship courses on clean tech venture opportunities, patent law, and other special topics, which focus on practical, hands-on experience for aspiring engineers and entrepreneurs. The Zell Entrepreneurship and Law (ZEAL) pro-gram is available to U-M law students, which allows for hands-on training regarding business entity formation, patent law, and other concerns faced by entrepreneurs starting a business. See “Law Clinics” on page 54 for further dis-cussion. In addition to the entrepreneurship courses that are offered, U-M has several structured academic programs:
• Program in Entrepreneurship. Administered by the Center for Entrepreneur-ship (CFE), this nine-credit certificate program is offered to undergraduate and graduate students from all U-M schools and departments in good academic standing. It is recognized by most colleges at U-M, and intends to provide stu-dents with resources to start a company, innovate, and learn about entrepreneur-ship. Courses include core courses, practicums, and electives.
• Certificate of Advanced Studies in Engineering (CASE) in Entrepreneur-ship. This 15-credit program for graduate students and working professionals, provides unique entrepreneurship training. Courses that go toward the credits, in some cases, may come from a broad range of subject matters. This program is administered and awarded by the Interdisciplinary Professional Programs, on behalf of the CFE.
• Master of Entrepreneurship. This degree is offered jointly by the College of Engineering and the Ross School of Business, and is administered by the CFE. The technology-focused one-year intensive program features a business boot camp, a two-semester practicum sequence and a venture launch opportunity, as well as coursework in entrepreneurship. Courses include entrepreneurial owner-ship, IP strategy, ethics, and many other options. Students also interact with the Office of Technology Transfer, industry mentors, and some also have the oppor-
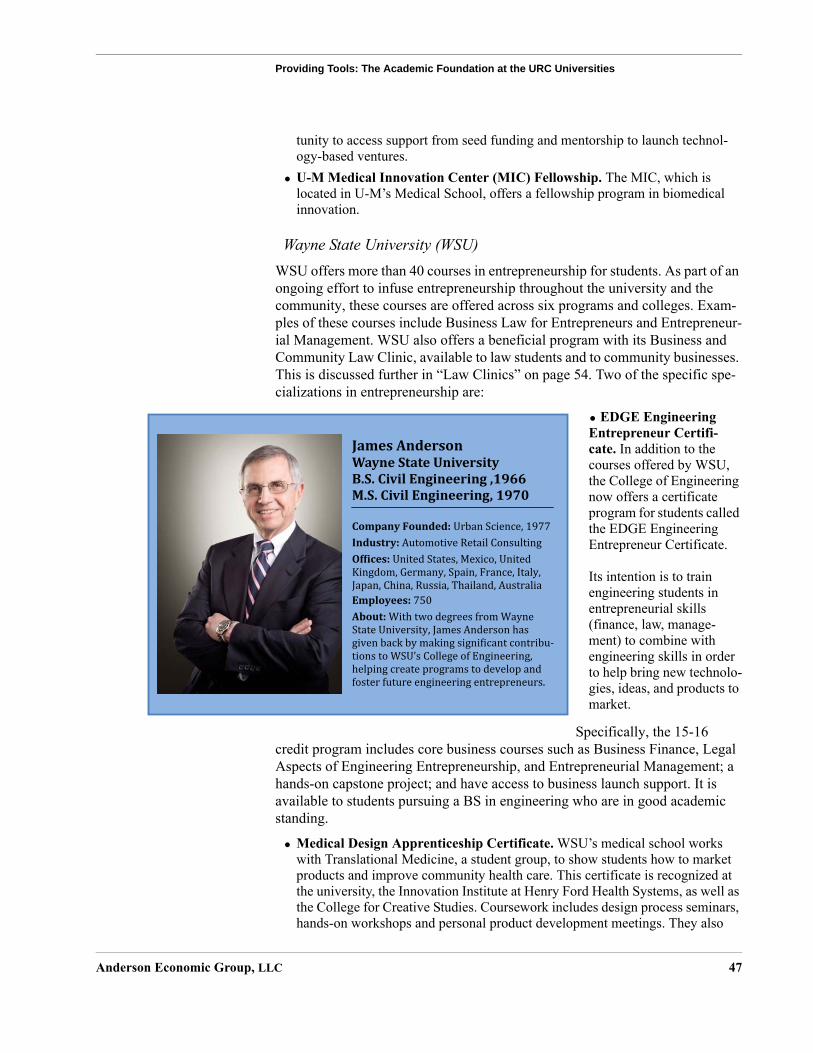
Providing Tools: The Academic Foundation at the URC Universities
Anderson Economic Group, LLC 47
tunity to access support from seed funding and mentorship to launch technol-ogy-based ventures.
• U-M Medical Innovation Center (MIC) Fellowship. The MIC, which is located in U-M’s Medical School, offers a fellowship program in biomedical innovation.
Wayne State University (WSU)WSU offers more than 40 courses in entrepreneurship for students. As part of an ongoing effort to infuse entrepreneurship throughout the university and the community, these courses are offered across six programs and colleges. Exam-ples of these courses include Business Law for Entrepreneurs and Entrepreneur-ial Management. WSU also offers a beneficial program with its Business and Community Law Clinic, available to law students and to community businesses. This is discussed further in “Law Clinics” on page 54. Two of the specific spe-cializations in entrepreneurship are:
• EDGE Engineering Entrepreneur Certifi-cate. In addition to the courses offered by WSU, the College of Engineering now offers a certificate program for students called the EDGE Engineering Entrepreneur Certificate.
Its intention is to train engineering students in entrepreneurial skills (finance, law, manage-ment) to combine with engineering skills in order to help bring new technolo-gies, ideas, and products to market.
Specifically, the 15-16 credit program includes core business courses such as Business Finance, Legal Aspects of Engineering Entrepreneurship, and Entrepreneurial Management; a hands-on capstone project; and have access to business launch support. It is available to students pursuing a BS in engineering who are in good academic standing.
• Medical Design Apprenticeship Certificate. WSU’s medical school works with Translational Medicine, a student group, to show students how to market products and improve community health care. This certificate is recognized at the university, the Innovation Institute at Henry Ford Health Systems, as well as the College for Creative Studies. Coursework includes design process seminars, hands-on workshops and personal product development meetings. They also
JamesAndersonWayneStateUniversityB.S.CivilEngineering,1966M.S.CivilEngineering,1970CompanyFounded:UrbanScience,1977Industry:AutomotiveRetailConsultingOf�ices:UnitedStates,Mexico,UnitedKingdom,Germany,Spain,France,Italy,Japan,China,Russia,Thailand,Australia
Employees:750About:WithtwodegreesfromWayneStateUniversity,JamesAndersonhasgivenbackbymakingsigni�icantcontribu-tionstoWSU’sCollegeofEngineering,helpingcreateprogramstodevelopandfosterfutureengineeringentrepreneurs.
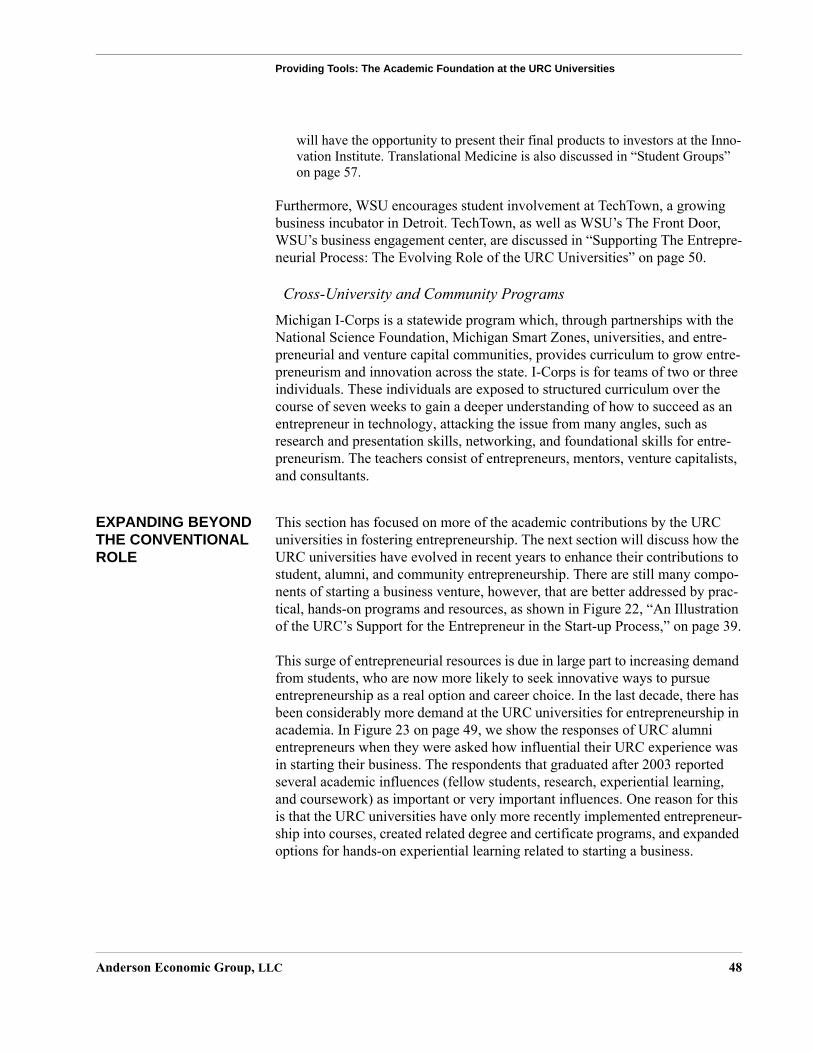
Providing Tools: The Academic Foundation at the URC Universities
Anderson Economic Group, LLC 48
will have the opportunity to present their final products to investors at the Inno-vation Institute. Translational Medicine is also discussed in “Student Groups” on page 57.
Furthermore, WSU encourages student involvement at TechTown, a growing business incubator in Detroit. TechTown, as well as WSU’s The Front Door, WSU’s business engagement center, are discussed in “Supporting The Entrepre-neurial Process: The Evolving Role of the URC Universities” on page 50.
Cross-University and Community ProgramsMichigan I-Corps is a statewide program which, through partnerships with the National Science Foundation, Michigan Smart Zones, universities, and entre-preneurial and venture capital communities, provides curriculum to grow entre-preneurism and innovation across the state. I-Corps is for teams of two or three individuals. These individuals are exposed to structured curriculum over the course of seven weeks to gain a deeper understanding of how to succeed as an entrepreneur in technology, attacking the issue from many angles, such as research and presentation skills, networking, and foundational skills for entre-preneurism. The teachers consist of entrepreneurs, mentors, venture capitalists, and consultants.
EXPANDING BEYOND THE CONVENTIONAL ROLE
This section has focused on more of the academic contributions by the URC universities in fostering entrepreneurship. The next section will discuss how the URC universities have evolved in recent years to enhance their contributions to student, alumni, and community entrepreneurship. There are still many compo-nents of starting a business venture, however, that are better addressed by prac-tical, hands-on programs and resources, as shown in Figure 22, “An Illustration of the URC’s Support for the Entrepreneur in the Start-up Process,” on page 39.
This surge of entrepreneurial resources is due in large part to increasing demand from students, who are now more likely to seek innovative ways to pursue entrepreneurship as a real option and career choice. In the last decade, there has been considerably more demand at the URC universities for entrepreneurship in academia. In Figure 23 on page 49, we show the responses of URC alumni entrepreneurs when they were asked how influential their URC experience was in starting their business. The respondents that graduated after 2003 reported several academic influences (fellow students, research, experiential learning, and coursework) as important or very important influences. One reason for this is that the URC universities have only more recently implemented entrepreneur-ship into courses, created related degree and certificate programs, and expanded options for hands-on experiential learning related to starting a business.
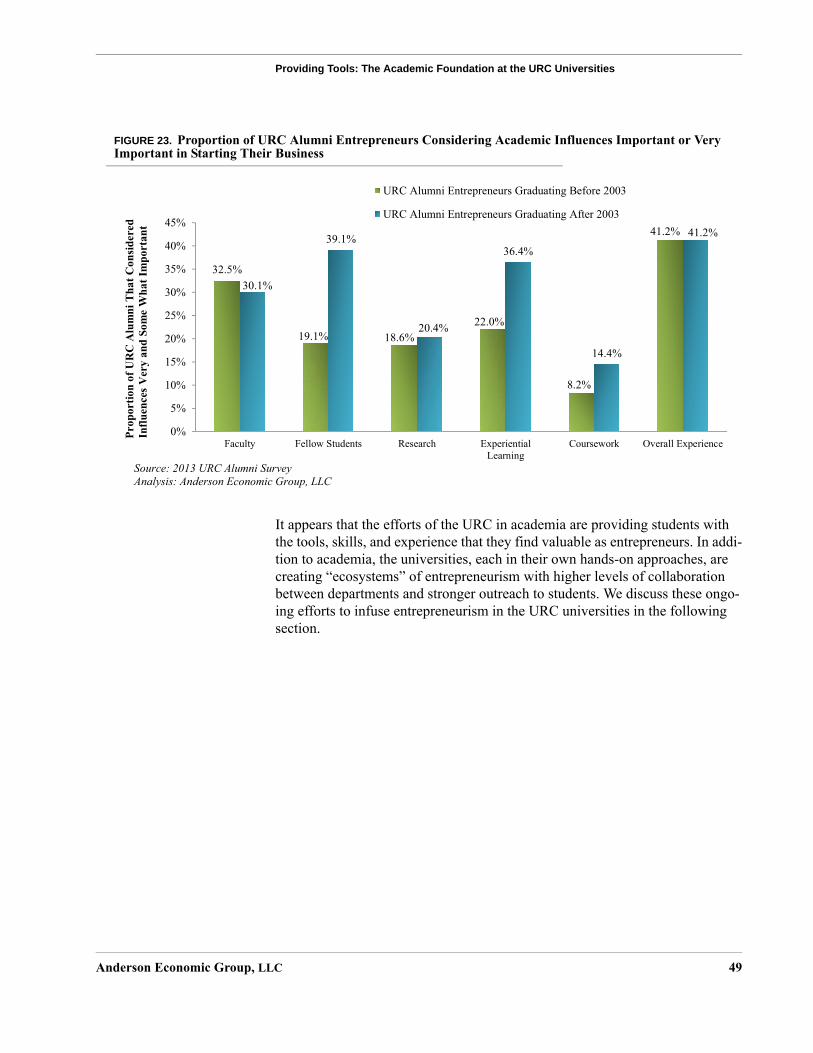
Providing Tools: The Academic Foundation at the URC Universities
Anderson Economic Group, LLC 49
FIGURE 23. Proportion of URC Alumni Entrepreneurs Considering Academic Influences Important or Very Important in Starting Their Business
It appears that the efforts of the URC in academia are providing students with the tools, skills, and experience that they find valuable as entrepreneurs. In addi-tion to academia, the universities, each in their own hands-on approaches, are creating “ecosystems” of entrepreneurism with higher levels of collaboration between departments and stronger outreach to students. We discuss these ongo-ing efforts to infuse entrepreneurism in the URC universities in the following section.
32.5%
19.1% 18.6%22.0%
8.2%
41.2%
30.1%
39.1%
20.4%
36.4%
14.4%
41.2%
0%
5%
10%
15%
20%
25%
30%
35%
40%
45%
Faculty Fellow Students Research ExperientialLearning
Coursework Overall Experience
Prop
ortio
n of
UR
C A
lum
ni T
hat C
onsid
ered
In
fluen
ces
Ver
y an
d So
me
Wha
t Im
port
ant
URC Alumni Entrepreneurs Graduating Before 2003
URC Alumni Entrepreneurs Graduating After 2003
Supporting The Entrepreneurial Process: The Evolving Role of the URC Universities
Anderson Economic Group, LLC 50
V. Supporting The Entrepreneurial Process: The Evolving Role of the URC Universities
The decision and fortitude to become a successful entrepreneur ultimately lies in the hands of the individual; universities, however, can help by providing tools and resources, which may accelerate the process of starting a business, as well as increase chances of success. Any entrepreneur embarking on the journey of launching and maintaining an enterprise could benefit from support. Access to specialized resources can assist entrepreneurs when facing the numerous challenges that accompany starting a business venture. This section lists and describes some of the resources that the URC universities make available for aspiring entrepreneurs, which include current students, alumni, faculty, and in some cases the surrounding community; many of these programs are evolving and developing as part of entrepreneurial “ecosystems” at URC universities.
AN OVERVIEW OF URC PROGRAMS AND RESOURCES AVAILABLE TO ENTREPRENEURS
We provide an overview of some of these programs currently at the URC uni-versities, along with the services offered and who benefits from them in Exhibit 1, “Catalogue of Entrepreneur Programs and Resources at the URC Universities,” on page 51. This catalogue is not intended to be an entirely com-prehensive list of all entrepreneurial programs, resources, or ventures at the URC universities. Not all conferences, speaker series, student groups, or types of funds that are promoted or otherwise supported by the universities are included. However, the 42 programs we listed attempt to provide an overall pic-ture of the major programs offered at each of the universities.
We describe many of these programs individually throughout this section, but there is a significant amount of interconnectivity in the services and missions of each entity. For example, at MSU, Business-CONNECT, Spartan Innovations, and MSU Technologies are all part of the MSU Innovation Center; in turn, The Hatch is a partnership between Spartan Innovations, LEAP, the City of East Lansing, and MSU. Similarly, eCities at U-M Dearborn occurs at iLabs, and the Venture Center is part of U-M Ann Arbor’s Office of Technology Transfer, as well as supported by the Venture Accelerator. Similarly, The Front Door and TechTown share space, and coordinate monthly meetings with WSU’s Tech Transfer office.
Exhibit 1 displays the programs and community partnerships the URC universi-ties have cultivated in order to facilitate collaboration and dispersion of resources, knowledge, and services to those looking to start a business or build upon existing ones. These relations further indicate that entrepreneurship is spreading across disciplines, as well as becoming increasingly ingrained in uni-versity practices. Note the founding years for the programs in Exhibit 1; the vast majority have been created in the last five to seven years. It is likely that the URC universities will continue to evolve their role, as well as these programs in order to better suit the needs of student, faculty, and alumni entrepreneurs.
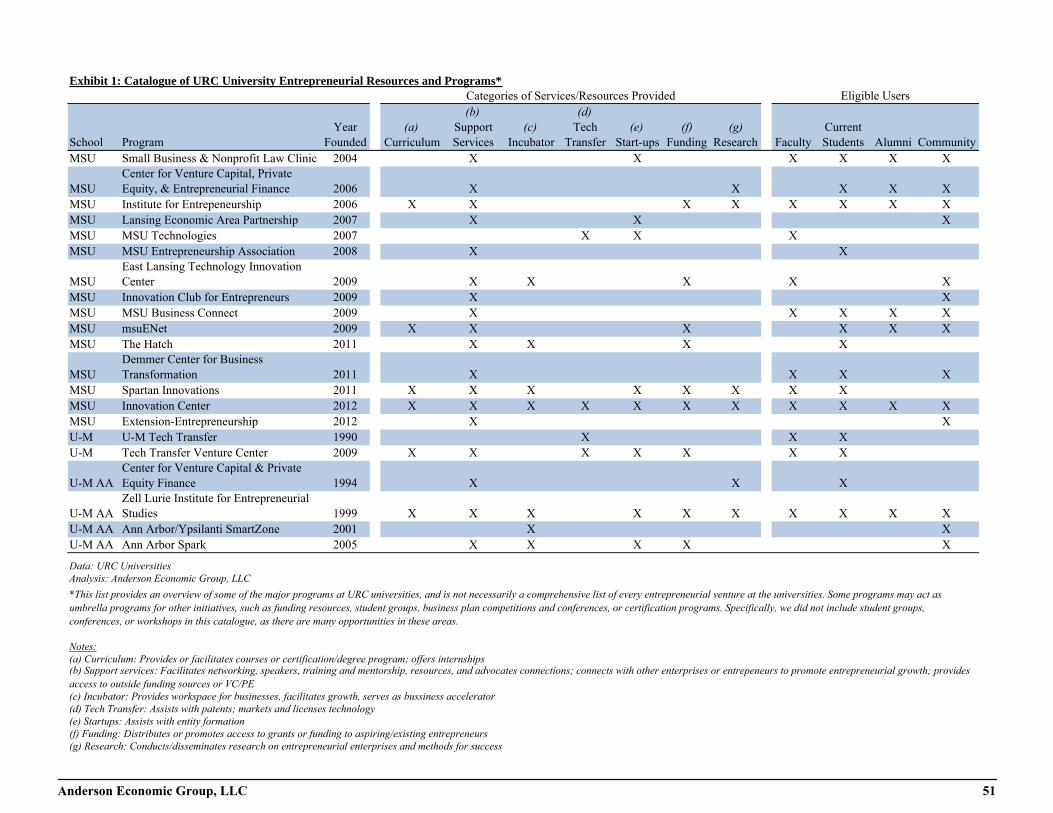
Exhibit 1: Catalogue of URC University Entrepreneurial Resources and Programs*
School ProgramYear
Founded(a)
Curriculum
(b) Support Services
(c) Incubator
(d) Tech
Transfer(e)
Start-ups(f)
Funding(g)
Research FacultyCurrent Students Alumni Community
MSU Small Business & Nonprofit Law Clinic 2004 X X X X X X
MSUCenter for Venture Capital, Private Equity, & Entrepreneurial Finance 2006 X X X X X
MSU Institute for Entrepeneurship 2006 X X X X X X X XMSU Lansing Economic Area Partnership 2007 X X XMSU MSU Technologies 2007 X X XMSU MSU Entrepreneurship Association 2008 X X
MSUEast Lansing Technology Innovation Center 2009 X X X X X
MSU Innovation Club for Entrepreneurs 2009 X XMSU MSU Business Connect 2009 X X X X XMSU msuENet 2009 X X X X X XMSU The Hatch 2011 X X X X
MSUDemmer Center for Business Transformation 2011 X X X X
MSU Spartan Innovations 2011 X X X X X X X XMSU Innovation Center 2012 X X X X X X X X X X XMSU Extension-Entrepreneurship 2012 X XU-M U-M Tech Transfer 1990 X X XU-M Tech Transfer Venture Center 2009 X X X X X X X
U-M AACenter for Venture Capital & Private Equity Finance 1994 X X X
U-M AAZell Lurie Institute for Entrepreneurial Studies 1999 X X X X X X X X X X
U-M AA Ann Arbor/Ypsilanti SmartZone 2001 X XU-M AA Ann Arbor Spark 2005 X X X X X
Data: URC UniversitiesAnalysis: Anderson Economic Group, LLC
Notes:
(f) Funding: Distributes or promotes access to grants or funding to aspiring/existing entrepreneurs(g) Research: Conducts/disseminates research on entrepreneurial enterprises and methods for success
Categories of Services/Resources Provided Eligible Users
*This list provides an overview of some of the major programs at URC universities, and is not necessarily a comprehensive list of every entrepreneurial venture at the universities. Some programs may act as umbrella programs for other initiatives, such as funding resources, student groups, business plan competitions and conferences, or certification programs. Specifically, we did not include student groups, conferences, or workshops in this catalogue, as there are many opportunities in these areas.
(a) Curriculum: Provides or facilitates courses or certification/degree program; offers internships(b) Support services: Facilitates networking, speakers, training and mentorship, resources, and advocates connections; connects with other enterprises or entrepeneurs to promote entrepreneurial growth; provides access to outside funding sources or VC/PE(c) Incubator: Provides workspace for businesses, facilitates growth, serves as bussiness accelerator(d) Tech Transfer: Assists with patents; markets and licenses technology(e) Startups: Assists with entity formation
Anderson Economic Group, LLC 51
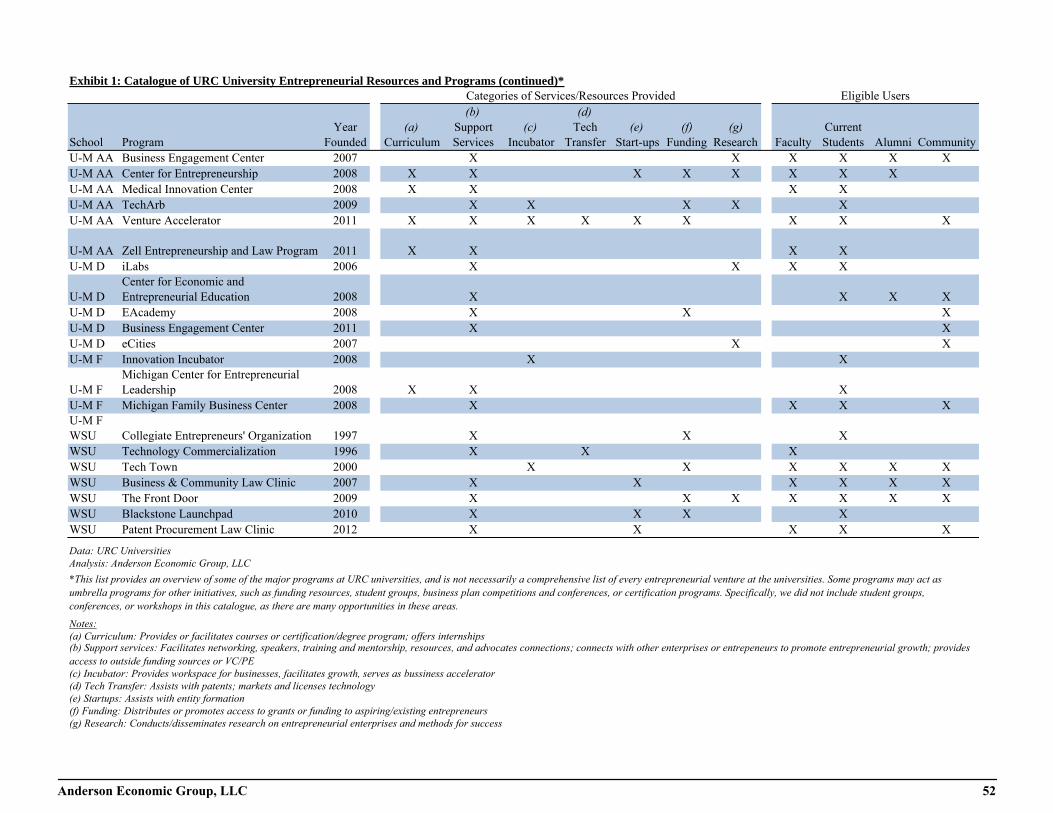
Exhibit 1: Catalogue of URC University Entrepreneurial Resources and Programs (continued)*
School ProgramYear
Founded(a)
Curriculum
(b) Support Services
(c) Incubator
(d) Tech
Transfer(e)
Start-ups(f)
Funding(g)
Research FacultyCurrent Students Alumni Community
U-M AA Business Engagement Center 2007 X X X X X XU-M AA Center for Entrepreneurship 2008 X X X X X X X XU-M AA Medical Innovation Center 2008 X X X XU-M AA TechArb 2009 X X X X XU-M AA Venture Accelerator 2011 X X X X X X X X X
U-M AA Zell Entrepreneurship and Law Program 2011 X X X XU-M D iLabs 2006 X X X X
U-M DCenter for Economic and Entrepreneurial Education 2008 X X X X
U-M D EAcademy 2008 X X XU-M D Business Engagement Center 2011 X XU-M D eCities 2007 X XU-M F Innovation Incubator 2008 X X
U-M FMichigan Center for Entrepreneurial Leadership 2008 X X X
U-M F Michigan Family Business Center 2008 X X X XU-M F WSU Collegiate Entrepreneurs' Organization 1997 X X XWSU Technology Commercialization 1996 X X XWSU Tech Town 2000 X X X X X XWSU Business & Community Law Clinic 2007 X X X X X XWSU The Front Door 2009 X X X X X X XWSU Blackstone Launchpad 2010 X X X XWSU Patent Procurement Law Clinic 2012 X X X X X
Data: URC UniversitiesAnalysis: Anderson Economic Group, LLC
Notes:
(f) Funding: Distributes or promotes access to grants or funding to aspiring/existing entrepreneurs(g) Research: Conducts/disseminates research on entrepreneurial enterprises and methods for success
(d) Tech Transfer: Assists with patents; markets and licenses technology(e) Startups: Assists with entity formation
*This list provides an overview of some of the major programs at URC universities, and is not necessarily a comprehensive list of every entrepreneurial venture at the universities. Some programs may act as umbrella programs for other initiatives, such as funding resources, student groups, business plan competitions and conferences, or certification programs. Specifically, we did not include student groups, conferences, or workshops in this catalogue, as there are many opportunities in these areas.
(a) Curriculum: Provides or facilitates courses or certification/degree program; offers internships(b) Support services: Facilitates networking, speakers, training and mentorship, resources, and advocates connections; connects with other enterprises or entrepeneurs to promote entrepreneurial growth; provides access to outside funding sources or VC/PE(c) Incubator: Provides workspace for businesses, facilitates growth, serves as bussiness accelerator
Categories of Services/Resources Provided Eligible Users
Anderson Economic Group, LLC 52
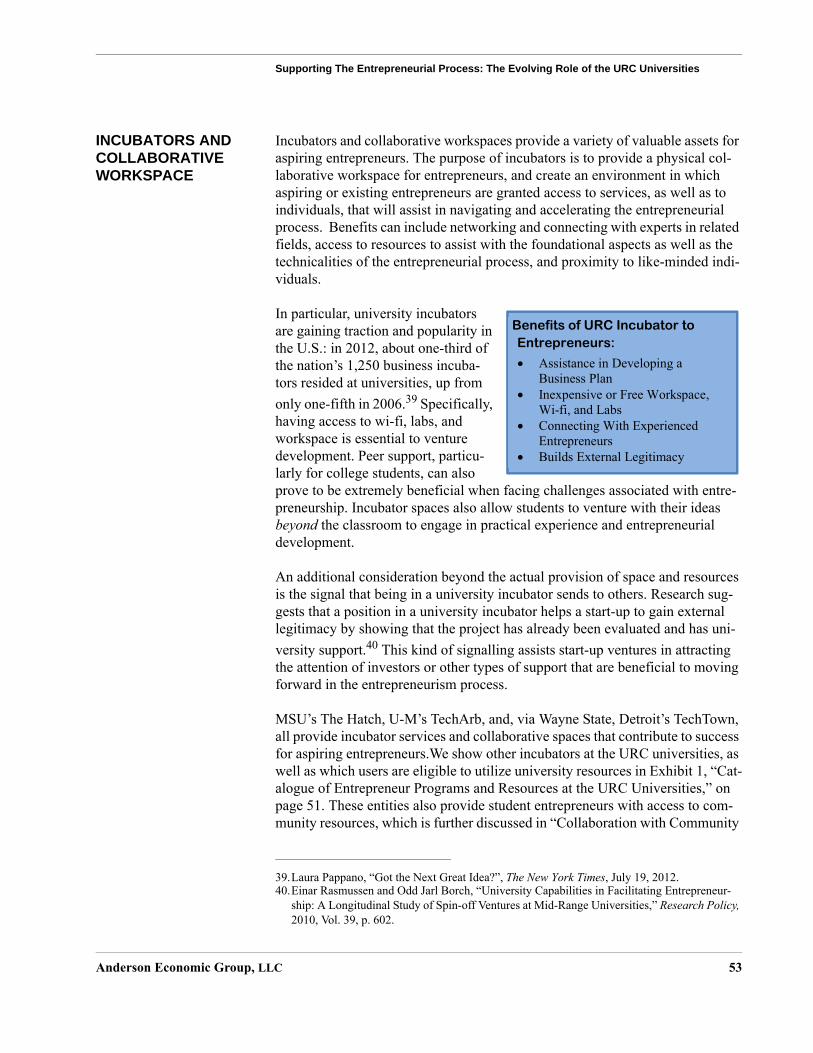
Supporting The Entrepreneurial Process: The Evolving Role of the URC Universities
Anderson Economic Group, LLC 53
INCUBATORS AND COLLABORATIVE WORKSPACE
Incubators and collaborative workspaces provide a variety of valuable assets for aspiring entrepreneurs. The purpose of incubators is to provide a physical col-laborative workspace for entrepreneurs, and create an environment in which aspiring or existing entrepreneurs are granted access to services, as well as to individuals, that will assist in navigating and accelerating the entrepreneurial process. Benefits can include networking and connecting with experts in related fields, access to resources to assist with the foundational aspects as well as the technicalities of the entrepreneurial process, and proximity to like-minded indi-viduals.
In particular, university incubators are gaining traction and popularity in the U.S.: in 2012, about one-third of the nation’s 1,250 business incuba-tors resided at universities, up from only one-fifth in 2006.39 Specifically, having access to wi-fi, labs, and workspace is essential to venture development. Peer support, particu-larly for college students, can also prove to be extremely beneficial when facing challenges associated with entre-preneurship. Incubator spaces also allow students to venture with their ideas beyond the classroom to engage in practical experience and entrepreneurial development.
An additional consideration beyond the actual provision of space and resources is the signal that being in a university incubator sends to others. Research sug-gests that a position in a university incubator helps a start-up to gain external legitimacy by showing that the project has already been evaluated and has uni-versity support.40 This kind of signalling assists start-up ventures in attracting the attention of investors or other types of support that are beneficial to moving forward in the entrepreneurism process.
MSU’s The Hatch, U-M’s TechArb, and, via Wayne State, Detroit’s TechTown, all provide incubator services and collaborative spaces that contribute to success for aspiring entrepreneurs.We show other incubators at the URC universities, as well as which users are eligible to utilize university resources in Exhibit 1, “Cat-alogue of Entrepreneur Programs and Resources at the URC Universities,” on page 51. These entities also provide student entrepreneurs with access to com-munity resources, which is further discussed in “Collaboration with Community
39.Laura Pappano, “Got the Next Great Idea?”, The New York Times, July 19, 2012. 40.Einar Rasmussen and Odd Jarl Borch, “University Capabilities in Facilitating Entrepreneur-
ship: A Longitudinal Study of Spin-off Ventures at Mid-Range Universities,” Research Policy, 2010, Vol. 39, p. 602.
Benefits of URC Incubator to Entrepreneurs:
� Assistance in Developing a Business Plan
� Inexpensive or Free Workspace, Wi-fi, and Labs
� Connecting With Experienced Entrepreneurs
� Builds External Legitimacy
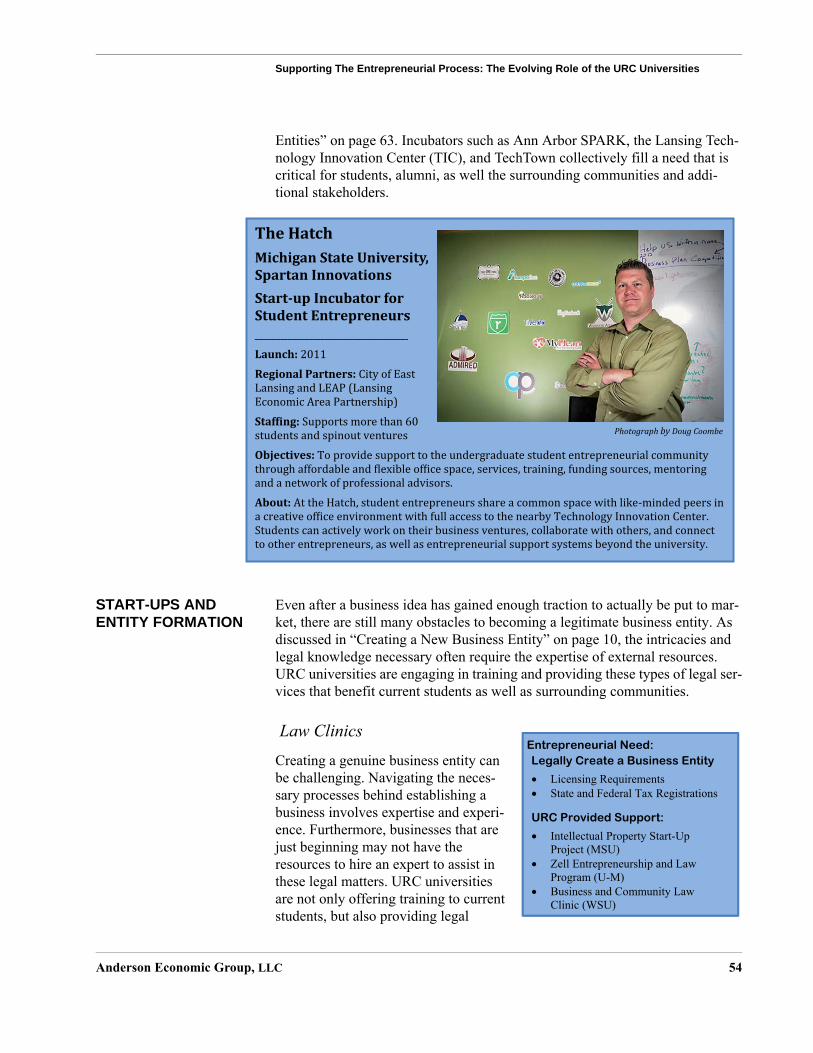
Supporting The Entrepreneurial Process: The Evolving Role of the URC Universities
Anderson Economic Group, LLC 54
Entities” on page 63. Incubators such as Ann Arbor SPARK, the Lansing Tech-nology Innovation Center (TIC), and TechTown collectively fill a need that is critical for students, alumni, as well the surrounding communities and addi-tional stakeholders.
START-UPS AND ENTITY FORMATION
Even after a business idea has gained enough traction to actually be put to mar-ket, there are still many obstacles to becoming a legitimate business entity. As discussed in “Creating a New Business Entity” on page 10, the intricacies and legal knowledge necessary often require the expertise of external resources. URC universities are engaging in training and providing these types of legal ser-vices that benefit current students as well as surrounding communities.
Law Clinics
Creating a genuine business entity can be challenging. Navigating the neces-sary processes behind establishing a business involves expertise and experi-ence. Furthermore, businesses that are just beginning may not have the resources to hire an expert to assist in these legal matters. URC universities are not only offering training to current students, but also providing legal
TheHatch MichiganStateUniversity,SpartanInnovationsStart-upIncubatorforStudentEntrepreneurs __________________________________________
Launch:2011RegionalPartners:CityofEastLansingandLEAP(LansingEconomicAreaPartnership)
Staf�ing:Supportsmorethan60studentsandspinoutventures
Objectives:Toprovidesupporttotheundergraduatestudententrepreneurialcommunitythroughaffordableand�lexibleof�icespace,services,training,fundingsources,mentoringandanetworkofprofessionaladvisors.
About:AttheHatch,studententrepreneursshareacommonspacewithlike-mindedpeersinacreativeof�iceenvironmentwithfullaccesstothenearbyTechnologyInnovationCenter.Studentscanactivelyworkontheirbusinessventures,collaboratewithothers,andconnecttootherentrepreneurs,aswellasentrepreneurialsupportsystemsbeyondtheuniversity.
PhotographbyDougCoombe
Entrepreneurial Need: Legally Create a Business Entity
Licensing Requirements State and Federal Tax Registrations
URC Provided Support:
Intellectual Property Start-Up Project (MSU) Zell Entrepreneurship and Law Program (U-M) Business and Community Law Clinic (WSU)
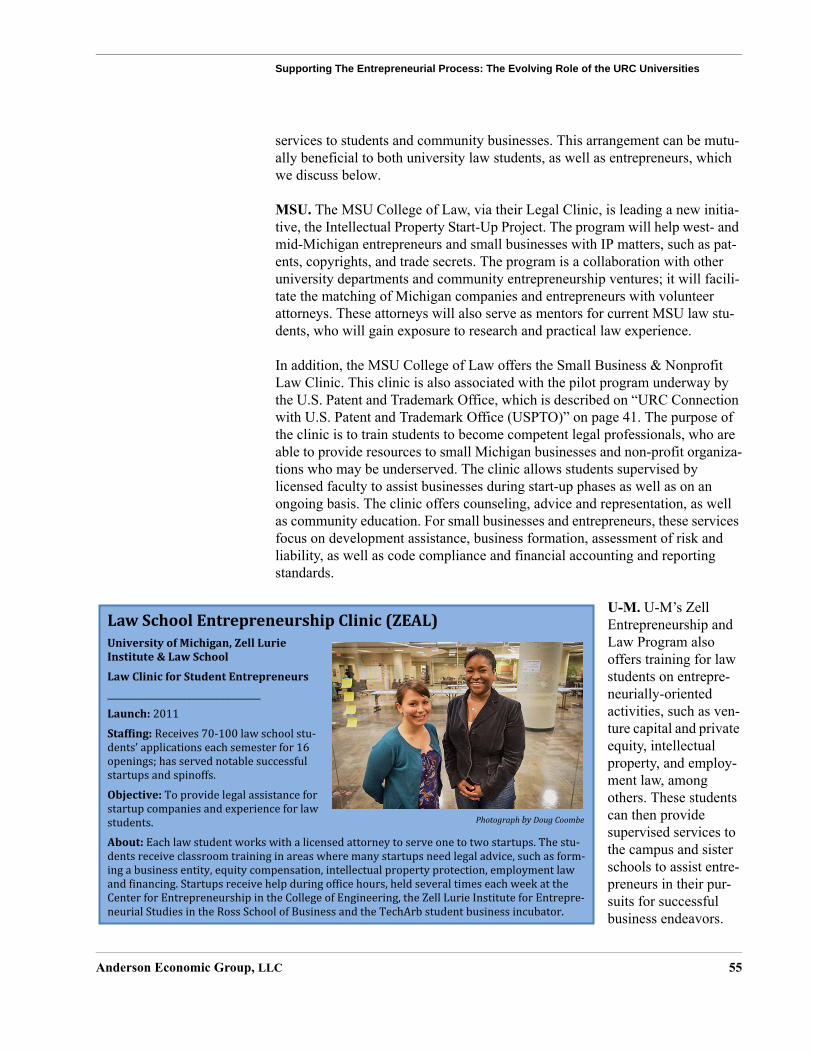
Supporting The Entrepreneurial Process: The Evolving Role of the URC Universities
Anderson Economic Group, LLC 55
services to students and community businesses. This arrangement can be mutu-ally beneficial to both university law students, as well as entrepreneurs, which we discuss below.
MSU. The MSU College of Law, via their Legal Clinic, is leading a new initia-tive, the Intellectual Property Start-Up Project. The program will help west- and mid-Michigan entrepreneurs and small businesses with IP matters, such as pat-ents, copyrights, and trade secrets. The program is a collaboration with other university departments and community entrepreneurship ventures; it will facili-tate the matching of Michigan companies and entrepreneurs with volunteer attorneys. These attorneys will also serve as mentors for current MSU law stu-dents, who will gain exposure to research and practical law experience.
In addition, the MSU College of Law offers the Small Business & Nonprofit Law Clinic. This clinic is also associated with the pilot program underway by the U.S. Patent and Trademark Office, which is described on “URC Connection with U.S. Patent and Trademark Office (USPTO)” on page 41. The purpose of the clinic is to train students to become competent legal professionals, who are able to provide resources to small Michigan businesses and non-profit organiza-tions who may be underserved. The clinic allows students supervised by licensed faculty to assist businesses during start-up phases as well as on an ongoing basis. The clinic offers counseling, advice and representation, as well as community education. For small businesses and entrepreneurs, these services focus on development assistance, business formation, assessment of risk and liability, as well as code compliance and financial accounting and reporting standards.
U-M. U-M’s Zell Entrepreneurship and Law Program also offers training for law students on entrepre-neurially-oriented activities, such as ven-ture capital and private equity, intellectual property, and employ-ment law, among others. These students can then provide supervised services to the campus and sister schools to assist entre-preneurs in their pur-suits for successful business endeavors.
LawSchoolEntrepreneurshipClinic(ZEAL)UniversityofMichigan,ZellLurieInstitute&LawSchool
LawClinicforStudentEntrepreneurs __________________________________________
Launch:2011
Staf�ing:Receives70-100lawschoolstu-dents’applicationseachsemesterfor16openings;hasservednotablesuccessfulstartupsandspinoffs.
Objective:Toprovidelegalassistanceforstartupcompaniesandexperienceforlawstudents.
About:Eachlawstudentworkswithalicensedattorneytoserveonetotwostartups.Thestu-dentsreceiveclassroomtraininginareaswheremanystartupsneedlegaladvice,suchasform-ingabusinessentity,equitycompensation,intellectualpropertyprotection,employmentlawand�inancing.Startupsreceivehelpduringof�icehours,heldseveraltimeseachweekattheCenterforEntrepreneurshipintheCollegeofEngineering,theZellLurieInstituteforEntrepre-neurialStudiesintheRossSchoolofBusinessandtheTechArbstudentbusinessincubator.
PhotographbyDougCoombe
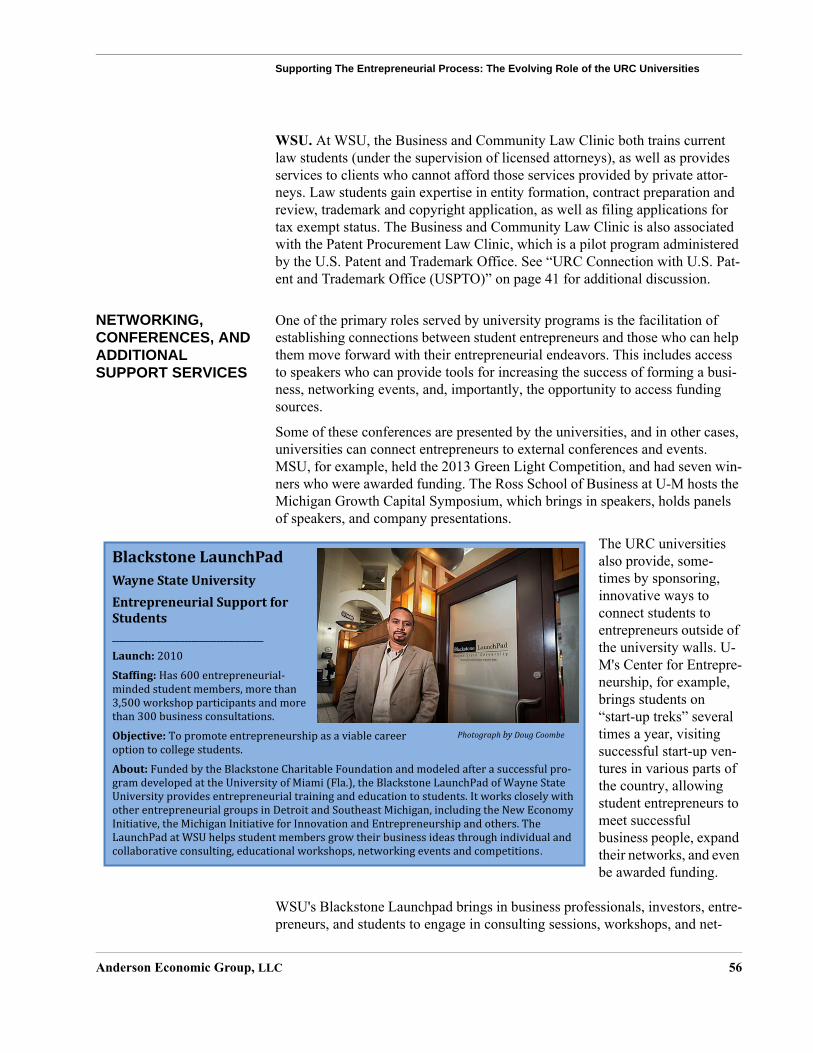
Supporting The Entrepreneurial Process: The Evolving Role of the URC Universities
Anderson Economic Group, LLC 56
WSU. At WSU, the Business and Community Law Clinic both trains current law students (under the supervision of licensed attorneys), as well as provides services to clients who cannot afford those services provided by private attor-neys. Law students gain expertise in entity formation, contract preparation and review, trademark and copyright application, as well as filing applications for tax exempt status. The Business and Community Law Clinic is also associated with the Patent Procurement Law Clinic, which is a pilot program administered by the U.S. Patent and Trademark Office. See “URC Connection with U.S. Pat-ent and Trademark Office (USPTO)” on page 41 for additional discussion.
NETWORKING, CONFERENCES, AND ADDITIONAL SUPPORT SERVICES
One of the primary roles served by university programs is the facilitation of establishing connections between student entrepreneurs and those who can help them move forward with their entrepreneurial endeavors. This includes access to speakers who can provide tools for increasing the success of forming a busi-ness, networking events, and, importantly, the opportunity to access funding sources.
Some of these conferences are presented by the universities, and in other cases, universities can connect entrepreneurs to external conferences and events. MSU, for example, held the 2013 Green Light Competition, and had seven win-ners who were awarded funding. The Ross School of Business at U-M hosts the Michigan Growth Capital Symposium, which brings in speakers, holds panels of speakers, and company presentations.
The URC universities also provide, some-times by sponsoring, innovative ways to connect students to entrepreneurs outside of the university walls. U-M's Center for Entrepre-neurship, for example, brings students on “start-up treks” several times a year, visiting successful start-up ven-tures in various parts of the country, allowing student entrepreneurs to meet successful business people, expand their networks, and even be awarded funding.
WSU's Blackstone Launchpad brings in business professionals, investors, entre-preneurs, and students to engage in consulting sessions, workshops, and net-
BlackstoneLaunchPadWayneStateUniversityEntrepreneurialSupportforStudents__________________________________________
Launch:2010Staf�ing:Has600entrepreneurial-mindedstudentmembers,morethan3,500workshopparticipantsandmorethan300businessconsultations.
Objective:Topromoteentrepreneurshipasaviablecareeroptiontocollegestudents.
About:FundedbytheBlackstoneCharitableFoundationandmodeledafterasuccessfulpro-gramdevelopedattheUniversityofMiami(Fla.),theBlackstoneLaunchPadofWayneStateUniversityprovidesentrepreneurialtrainingandeducationtostudents.ItworkscloselywithotherentrepreneurialgroupsinDetroitandSoutheastMichigan,includingtheNewEconomyInitiative,theMichiganInitiativeforInnovationandEntrepreneurshipandothers.TheLaunchPadatWSUhelpsstudentmembersgrowtheirbusinessideasthroughindividualandcollaborativeconsulting,educationalworkshops,networkingeventsandcompetitions.
PhotographbyDougCoombe
Supporting The Entrepreneurial Process: The Evolving Role of the URC Universities
Anderson Economic Group, LLC 57
working events, all of which contribute to entrepreneurial, and thus economic, success in the region.
Student GroupsThe spread of entrepreneurism at URC universities has been driven in a large way by student interest, with the universities stepping up to fill a need in sup-port services for student entrepreneurs. There are many student initiatives that have taken form at the URC universities. Student entrepreneurs have the ability not only to learn and benefit from university resources, but also to lead and teach other students in the process. These initiatives have taken the form of stu-dent groups, student-led venture funds, and the involvement of student govern-ment in facilitating further development on entrepreneurial programs. Since there are so many opportunities, it is difficult to provide a comprehensive list of student initiatives. This section, however, will provide an example of some of the student initiatives at the URC universities.
MSU. Student organizations such as the China Entrepreneur Network and Engi-neers Without Borders promote innovation and entrepreneurship among MSU students, faculty, and the surrounding community. MSU-EWB, for example, focuses on using technology to benefit the less fortunate through the provision of products that improve community health as well as provide education to their recipients.
U-M. Established entrepreneurial centers, such as U-M’s Zell Lurie Institute and the Center for Entrepreneurship, sponsor and advocate for student groups on campus, such as MPowered, TEDxUofM, and M-Entrepreneurship, among others. Furthermore, the central student government has the Entrepreneurship Commission, which supports and fosters collaboration between entrepreneur-ship organizations at the university. The Entrepreneurs Society at U-M Flint is another example of an academic student organization that helps to foster inno-vation and entrepreneurship among faculty, staff, students, and the community. Additionally, student organizations at U-M Dearborn host a week-long boot camp for high school juniors to learn about entrepreneurship and win scholar-ship money. This initiative, E-Academy, is a partnership between U-M Dear-born, Ford Motor Company Fund and Community Services, and Students in Free Enterprise. For more examples of community partnerships, see “Collabora-tion with Community Entities” on page 63.
WSU. Organizations such as the School of Medicine’s Translational Medicine are dedicated to the development of medically-related entrepreneurial endeav-ors by WSU students. Furthermore, it partners with community entities such as Henry Ford Innovation Institute and the College of Creative Studies to improve health care and patient experiences. Participants in this group have the opportu-nity to present ideas to investors at the Innovation Institute. As discussed in “Curriculum” on page 44, WSU recognizes students who complete a Transla-
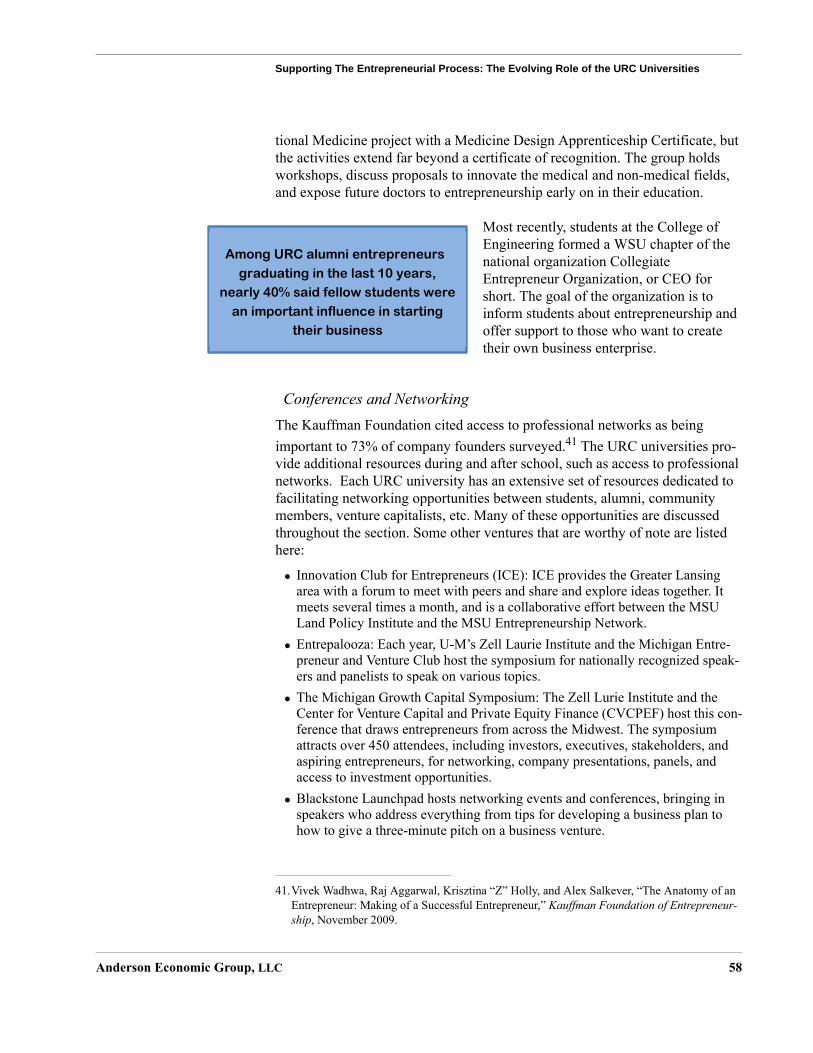
Supporting The Entrepreneurial Process: The Evolving Role of the URC Universities
Anderson Economic Group, LLC 58
tional Medicine project with a Medicine Design Apprenticeship Certificate, but the activities extend far beyond a certificate of recognition. The group holds workshops, discuss proposals to innovate the medical and non-medical fields, and expose future doctors to entrepreneurship early on in their education.
Most recently, students at the College of Engineering formed a WSU chapter of the national organization Collegiate Entrepreneur Organization, or CEO for short. The goal of the organization is to inform students about entrepreneurship and offer support to those who want to create their own business enterprise.
Conferences and NetworkingThe Kauffman Foundation cited access to professional networks as being important to 73% of company founders surveyed.41 The URC universities pro-vide additional resources during and after school, such as access to professional networks. Each URC university has an extensive set of resources dedicated to facilitating networking opportunities between students, alumni, community members, venture capitalists, etc. Many of these opportunities are discussed throughout the section. Some other ventures that are worthy of note are listed here:
• Innovation Club for Entrepreneurs (ICE): ICE provides the Greater Lansing area with a forum to meet with peers and share and explore ideas together. It meets several times a month, and is a collaborative effort between the MSU Land Policy Institute and the MSU Entrepreneurship Network.
• Entrepalooza: Each year, U-M’s Zell Laurie Institute and the Michigan Entre-preneur and Venture Club host the symposium for nationally recognized speak-ers and panelists to speak on various topics.
• The Michigan Growth Capital Symposium: The Zell Lurie Institute and the Center for Venture Capital and Private Equity Finance (CVCPEF) host this con-ference that draws entrepreneurs from across the Midwest. The symposium attracts over 450 attendees, including investors, executives, stakeholders, and aspiring entrepreneurs, for networking, company presentations, panels, and access to investment opportunities.
• Blackstone Launchpad hosts networking events and conferences, bringing in speakers who address everything from tips for developing a business plan to how to give a three-minute pitch on a business venture.
Among URC alumni entrepreneurs graduating in the last 10 years,
nearly 40% said fellow students were an important influence in starting
their business
41.Vivek Wadhwa, Raj Aggarwal, Krisztina “Z” Holly, and Alex Salkever, “The Anatomy of an Entrepreneur: Making of a Successful Entrepreneur,” Kauffman Foundation of Entrepreneur-ship, November 2009.
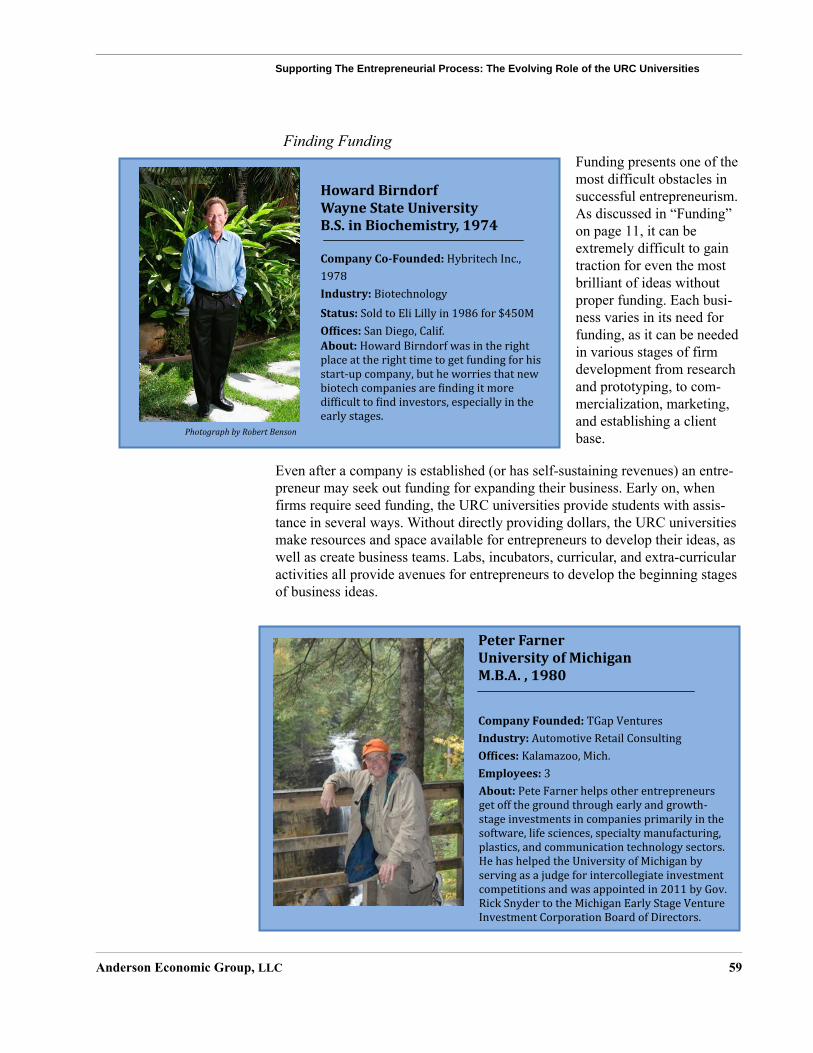
Supporting The Entrepreneurial Process: The Evolving Role of the URC Universities
Anderson Economic Group, LLC 59
Finding FundingFunding presents one of the most difficult obstacles in successful entrepreneurism. As discussed in “Funding” on page 11, it can be extremely difficult to gain traction for even the most brilliant of ideas without proper funding. Each busi-ness varies in its need for funding, as it can be needed in various stages of firm development from research and prototyping, to com-mercialization, marketing, and establishing a client base.
Even after a company is established (or has self-sustaining revenues) an entre-preneur may seek out funding for expanding their business. Early on, when firms require seed funding, the URC universities provide students with assis-tance in several ways. Without directly providing dollars, the URC universities make resources and space available for entrepreneurs to develop their ideas, as well as create business teams. Labs, incubators, curricular, and extra-curricular activities all provide avenues for entrepreneurs to develop the beginning stages of business ideas.
Additionally,
HowardBirndorfWayneStateUniversityB.S.inBiochemistry,1974CompanyCo-Founded:HybritechInc.,1978
Industry:BiotechnologyStatus:SoldtoEliLillyin1986for$450MOf�ices:SanDiego,Calif.About:HowardBirndorfwasintherightplaceattherighttimetogetfundingforhisstart-upcompany,butheworriesthatnewbiotechcompaniesare�indingitmoredif�icultto�indinvestors,especiallyintheearlystages.
PhotographbyRobertBenson
PeterFarnerUniversityofMichiganM.B.A.,1980 CompanyFounded:TGapVenturesIndustry:AutomotiveRetailConsultingOf�ices:Kalamazoo,Mich.Employees:3About:PeteFarnerhelpsotherentrepreneursgetoffthegroundthroughearlyandgrowth-stageinvestmentsincompaniesprimarilyinthesoftware,lifesciences,specialtymanufacturing,plastics,andcommunicationtechnologysectors.HehashelpedtheUniversityofMichiganbyservingasajudgeforintercollegiateinvestmentcompetitionsandwasappointedin2011byGov.RickSnydertotheMichiganEarlyStageVentureInvestmentCorporationBoardofDirectors.
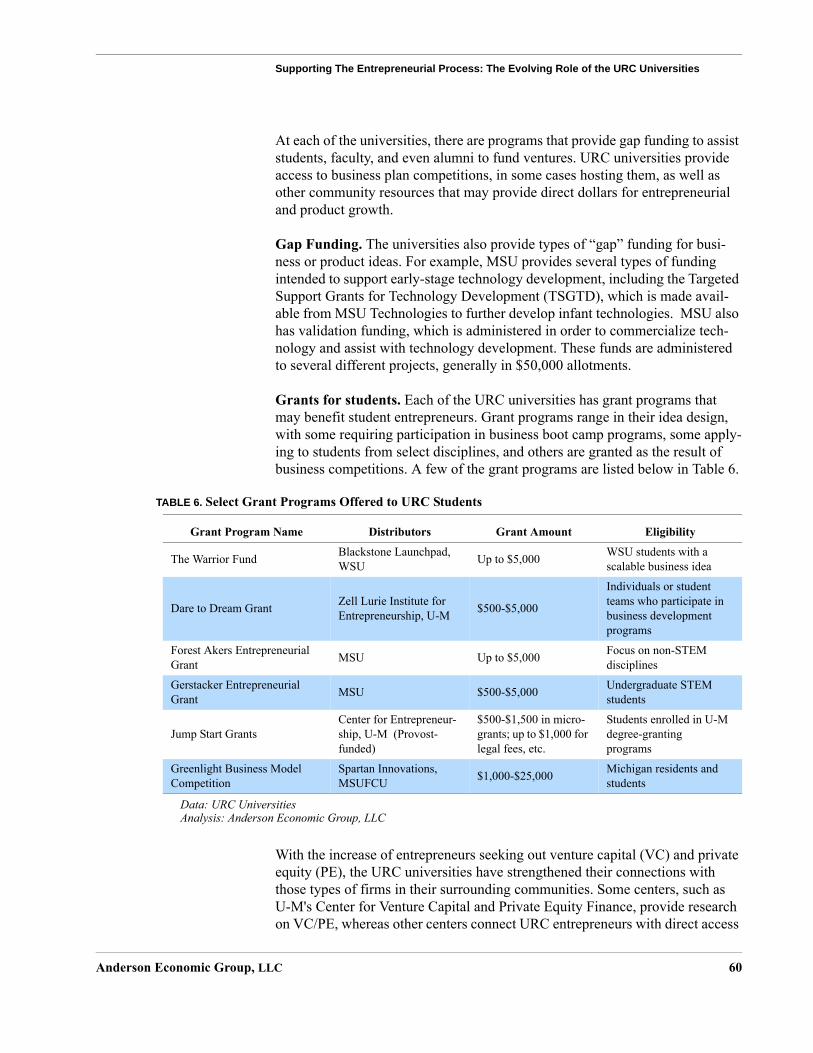
Supporting The Entrepreneurial Process: The Evolving Role of the URC Universities
Anderson Economic Group, LLC 60
At each of the universities, there are programs that provide gap funding to assist students, faculty, and even alumni to fund ventures. URC universities provide access to business plan competitions, in some cases hosting them, as well as other community resources that may provide direct dollars for entrepreneurial and product growth.
Gap Funding. The universities also provide types of “gap” funding for busi-ness or product ideas. For example, MSU provides several types of funding intended to support early-stage technology development, including the Targeted Support Grants for Technology Development (TSGTD), which is made avail-able from MSU Technologies to further develop infant technologies. MSU also has validation funding, which is administered in order to commercialize tech-nology and assist with technology development. These funds are administered to several different projects, generally in $50,000 allotments.
Grants for students. Each of the URC universities has grant programs that may benefit student entrepreneurs. Grant programs range in their idea design, with some requiring participation in business boot camp programs, some apply-ing to students from select disciplines, and others are granted as the result of business competitions. A few of the grant programs are listed below in Table 6.
With the increase of entrepreneurs seeking out venture capital (VC) and private equity (PE), the URC universities have strengthened their connections with those types of firms in their surrounding communities. Some centers, such as U-M's Center for Venture Capital and Private Equity Finance, provide research on VC/PE, whereas other centers connect URC entrepreneurs with direct access
TABLE 6. Select Grant Programs Offered to URC Students
Grant Program Name Distributors Grant Amount Eligibility
The Warrior Fund Blackstone Launchpad, WSU Up to $5,000 WSU students with a
scalable business idea
Dare to Dream Grant Zell Lurie Institute for Entrepreneurship, U-M $500-$5,000
Individuals or student teams who participate in business development programs
Forest Akers Entrepreneurial Grant MSU Up to $5,000 Focus on non-STEM
disciplines
Gerstacker Entrepreneurial Grant MSU $500-$5,000 Undergraduate STEM
students
Jump Start GrantsCenter for Entrepreneur-ship, U-M (Provost-funded)
$500-$1,500 in micro-grants; up to $1,000 for legal fees, etc.
Students enrolled in U-M degree-granting programs
Greenlight Business Model Competition
Spartan Innovations, MSUFCU $1,000-$25,000 Michigan residents and
students
Data: URC UniversitiesAnalysis: Anderson Economic Group, LLC
Supporting The Entrepreneurial Process: The Evolving Role of the URC Universities
Anderson Economic Group, LLC 61
to competitions or companies which award funding to promising business ven-tures.
For example, MSU captive funds provide, at the discretion of a voting board, VC funding for entrepreneurial endeavors. Furthermore, MSU’s Center for Ven-ture Capital, Private Equity, and Entrepreneurial Finance promotes academic and applied research on VC/PE investments, as well as builds mutually benefi-cial relationships VC/PE professionals and MSU or Michigan-based entrepre-neurs.
Each university’s ties with the surrounding community are also useful to assist aspiring entrepreneurs to connect with local angels. Angel investors such as Capital Community Angel Investors in East Lansing and Ann Arbor Angels tend to focus on Michigan-based companies, and the URC universities offer connections to these investing groups.
ENGAGEMENT WITH COMMUNITY ENTREPRENEURS AND RESOURCES
Each of the URC universities is located in a unique community; Ann Arbor, East Lansing, and Detroit have different characteristics demographically and economically, but each contain businesses and resources that are valuable to the local, regional, and state economies. By engaging in community involvement, universities can encourage a relationship in which they can benefit from exter-nal businesses or community ventures, and vice versa. The universities have resources that are critical to economic development in the regions.
Business Engagement CentersPart of the role taken on by entrepreneurial centers at the URC universities is engaging with businesses outside of the universities. Each of the universities has a business engagement center, and offers services to encourage collaboration with local and regional businesses, as well as businesses statewide. While each center provides similar types of services, they each operate in slightly different ways. MSU’s Business Connect, for example, seeks to encourage collaboration with local businesses, offering students and businesses a chance to benefit from each others’ skills. U-M’s Business Engagement Center also seeks to connect businesses to student talent at the university. It extends beyond the reach of entrepreneurial talent, offering services for entrepreneurs and students in terms of matching talent with businesses and it also markets licenses for university technologies. Furthermore, an initiative at U-M Dearborn’s College of Busi-ness, Business of Franchising, seeks to connect franchising opportunities in Metro Detroit with college students as well as recent graduates.
One of the goals of The Front Door at WSU is to fill a gap in research partner-ships between the university and local business. The business engagement office, like the Front Door, is co-located in TechTown, Detroit’s center for entre-preneurial development. Businesses in need of space can rent lab space in the building, thus sharing a space with researchers and aspiring entrepreneurs. The
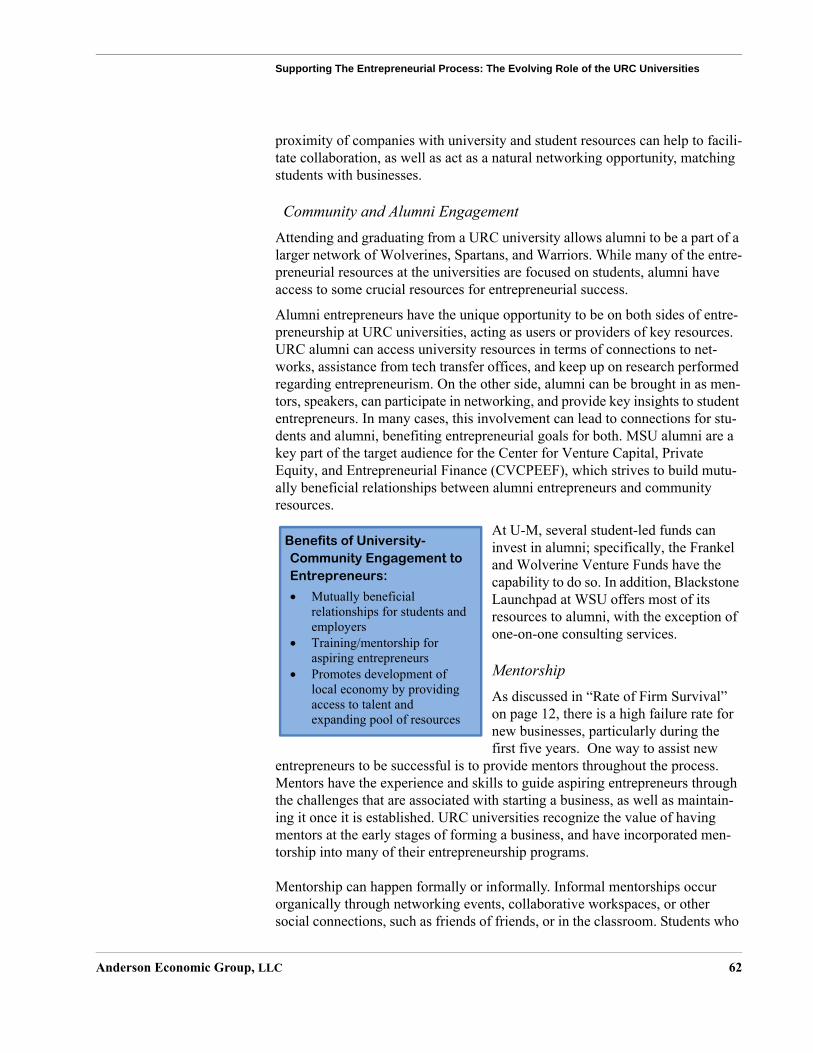
Supporting The Entrepreneurial Process: The Evolving Role of the URC Universities
Anderson Economic Group, LLC 62
proximity of companies with university and student resources can help to facili-tate collaboration, as well as act as a natural networking opportunity, matching students with businesses.
Community and Alumni EngagementAttending and graduating from a URC university allows alumni to be a part of a larger network of Wolverines, Spartans, and Warriors. While many of the entre-preneurial resources at the universities are focused on students, alumni have access to some crucial resources for entrepreneurial success.
Alumni entrepreneurs have the unique opportunity to be on both sides of entre-preneurship at URC universities, acting as users or providers of key resources. URC alumni can access university resources in terms of connections to net-works, assistance from tech transfer offices, and keep up on research performed regarding entrepreneurism. On the other side, alumni can be brought in as men-tors, speakers, can participate in networking, and provide key insights to student entrepreneurs. In many cases, this involvement can lead to connections for stu-dents and alumni, benefiting entrepreneurial goals for both. MSU alumni are a key part of the target audience for the Center for Venture Capital, Private Equity, and Entrepreneurial Finance (CVCPEEF), which strives to build mutu-ally beneficial relationships between alumni entrepreneurs and community resources.
At U-M, several student-led funds can invest in alumni; specifically, the Frankel and Wolverine Venture Funds have the capability to do so. In addition, Blackstone Launchpad at WSU offers most of its resources to alumni, with the exception of one-on-one consulting services.
MentorshipAs discussed in “Rate of Firm Survival” on page 12, there is a high failure rate for new businesses, particularly during the first five years. One way to assist new
entrepreneurs to be successful is to provide mentors throughout the process. Mentors have the experience and skills to guide aspiring entrepreneurs through the challenges that are associated with starting a business, as well as maintain-ing it once it is established. URC universities recognize the value of having mentors at the early stages of forming a business, and have incorporated men-torship into many of their entrepreneurship programs.
Mentorship can happen formally or informally. Informal mentorships occur organically through networking events, collaborative workspaces, or other social connections, such as friends of friends, or in the classroom. Students who
Benefits of University-Community Engagement to Entrepreneurs:
Mutually beneficial relationships for students and employers Training/mentorship for aspiring entrepreneurs Promotes development of local economy by providing access to talent and expanding pool of resources
Supporting The Entrepreneurial Process: The Evolving Role of the URC Universities
Anderson Economic Group, LLC 63
actively engage their professors or take on research projects find a mentor in staff or faculty. Alumni can offer a student a unique opportunity to learn by observing or through casual conversations.
Formal mentorship can be facilitated by a third party in order to benefit one or more people involved in the mentoring process. The URC universities offer sev-eral structured, formal mentorship opportunities through entrepreneurship pro-grams:
• MSU’s Spartan Innovations has a CEO-in-Residence program, which provides leadership and executive management for MSU start-up enterprises throughout the entire venture launch period.
• U-M’s Venture Accelerator provides a mentors-in-residence program, in which seasoned entrepreneurs connect start-ups to useful resources and business part-ners.
• U-M’s TechArb co-managed by the Center for Entrepreneurship and the Zell Lurie Institute for Entrepreneurial Studies, provides mentors for student teams who meet every 1-2 weeks to assist with the entrepreneurial process.
• WSU’s Blackstone Launchpad provides workshops for students in which men-tors come in to speak and teach students essential skills for entrepreneurship.
This list of programs is not comprehensive for the mentorship offerings at URC universities, and students have access to many more sources of expertise along the way, including staff, faculty, local businesses, and other types of available resources.
Collaboration with Community EntitiesUniversities, while an integral part of local economies, still are part of a larger goal of economic development within regions and the state. Each of the commu-nities in which the URC universities are located have external efforts to encour-age local and regional economic growth.
There has been an intentional movement to build partnerships and coordinate efforts to encourage this type of growth. Some of the entities in the surrounding communities include TechTown in Detroit, the Lansing Economic Area Part-nership (LEAP) in East Lansing, and Ann Arbor Spark. Furthermore, these part-nerships are not limited to the areas in the immediate surroundings of the universities.42 We provide some examples of university and community part-nerships below:
42.One example is the MSU Bioeconomy Institute, which conducts research and production, as well as provides incubation, lab space, educational programming, and training in Holland, MI; a significant distance away from MSU’s campus in East Lansing.
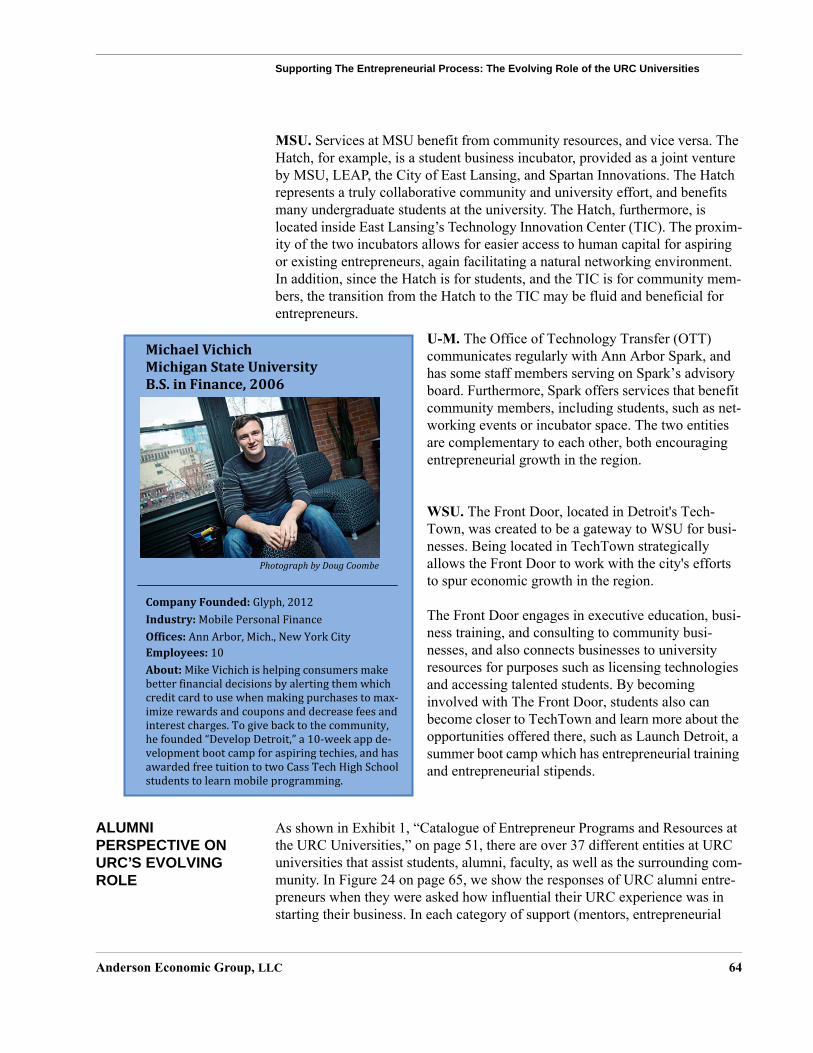
Supporting The Entrepreneurial Process: The Evolving Role of the URC Universities
Anderson Economic Group, LLC 64
MSU. Services at MSU benefit from community resources, and vice versa. The Hatch, for example, is a student business incubator, provided as a joint venture by MSU, LEAP, the City of East Lansing, and Spartan Innovations. The Hatch represents a truly collaborative community and university effort, and benefits many undergraduate students at the university. The Hatch, furthermore, is located inside East Lansing’s Technology Innovation Center (TIC). The proxim-ity of the two incubators allows for easier access to human capital for aspiring or existing entrepreneurs, again facilitating a natural networking environment. In addition, since the Hatch is for students, and the TIC is for community mem-bers, the transition from the Hatch to the TIC may be fluid and beneficial for entrepreneurs.
U-M. The Office of Technology Transfer (OTT) communicates regularly with Ann Arbor Spark, and has some staff members serving on Spark’s advisory board. Furthermore, Spark offers services that benefit community members, including students, such as net-working events or incubator space. The two entities are complementary to each other, both encouraging entrepreneurial growth in the region.
WSU. The Front Door, located in Detroit's Tech-Town, was created to be a gateway to WSU for busi-nesses. Being located in TechTown strategically allows the Front Door to work with the city's efforts to spur economic growth in the region.
The Front Door engages in executive education, busi-ness training, and consulting to community busi-nesses, and also connects businesses to university resources for purposes such as licensing technologies and accessing talented students. By becoming involved with The Front Door, students also can become closer to TechTown and learn more about the opportunities offered there, such as Launch Detroit, a summer boot camp which has entrepreneurial training and entrepreneurial stipends.
ALUMNI PERSPECTIVE ON URC’S EVOLVING ROLE
As shown in Exhibit 1, “Catalogue of Entrepreneur Programs and Resources at the URC Universities,” on page 51, there are over 37 different entities at URC universities that assist students, alumni, faculty, as well as the surrounding com-munity. In Figure 24 on page 65, we show the responses of URC alumni entre-preneurs when they were asked how influential their URC experience was in starting their business. In each category of support (mentors, entrepreneurial
MichaelVichichMichiganStateUniversityB.S.inFinance,2006
CompanyFounded:Glyph,2012Industry:MobilePersonalFinanceOffices:AnnArbor,Mich.,NewYorkCityEmployees:10About:MikeVichichishelpingconsumersmakebetterfinancialdecisionsbyalertingthemwhichcreditcardtousewhenmakingpurchasestomax-imizerewardsandcouponsanddecreasefeesandinterestcharges.Togivebacktothecommunity,hefounded“DevelopDetroit,”a10-weekappde-velopmentbootcampforaspiringtechies,andhasawardedfreetuitiontotwoCassTechHighSchoolstudentstolearnmobileprogramming.
PhotographbyDougCoombe
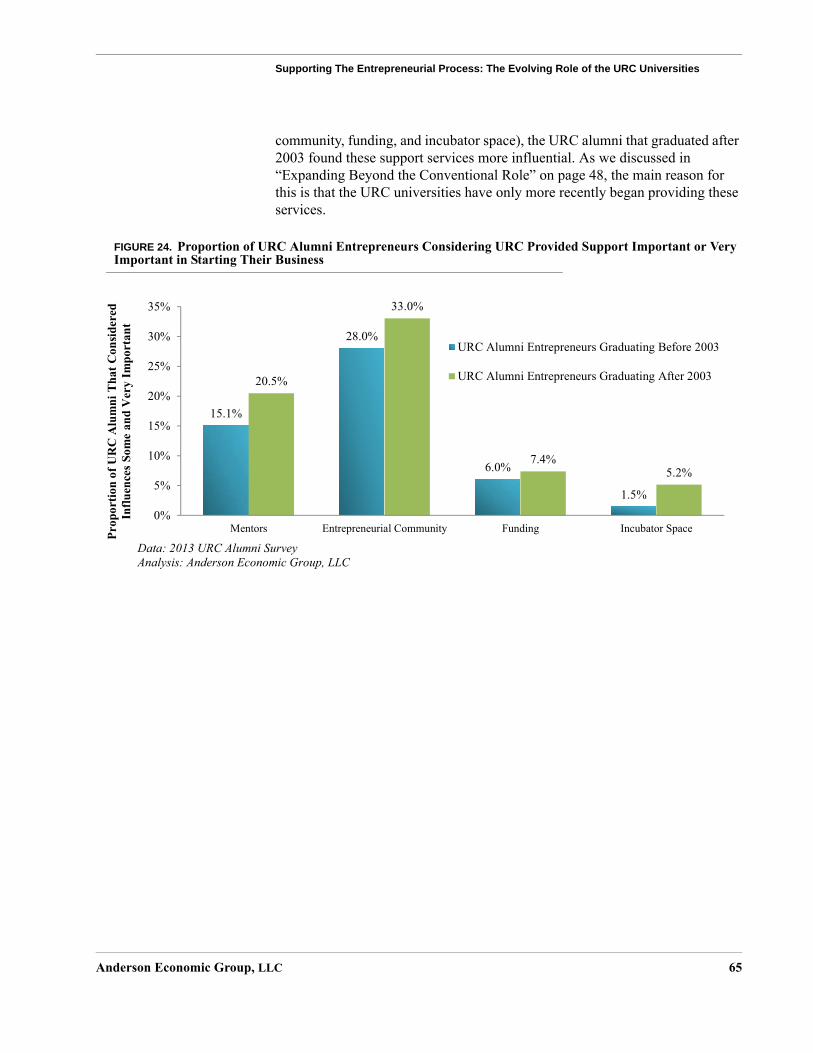
Supporting The Entrepreneurial Process: The Evolving Role of the URC Universities
Anderson Economic Group, LLC 65
community, funding, and incubator space), the URC alumni that graduated after 2003 found these support services more influential. As we discussed in “Expanding Beyond the Conventional Role” on page 48, the main reason for this is that the URC universities have only more recently began providing these services.
FIGURE 24. Proportion of URC Alumni Entrepreneurs Considering URC Provided Support Important or Very Important in Starting Their Business
15.1%
28.0%
6.0%
1.5%
20.5%
33.0%
7.4%5.2%
0%
5%
10%
15%
20%
25%
30%
35%
Mentors Entrepreneurial Community Funding Incubator SpaceProp
ortio
n of
UR
C A
lum
ni T
hat C
onsid
ered
In
fluen
ces
Som
e an
d V
ery
Impo
rtan
t
URC Alumni Entrepreneurs Graduating Before 2003
URC Alumni Entrepreneurs Graduating After 2003
Data: 2013 URC Alumni SurveyAnalysis: Anderson Economic Group, LLC
Anderson Economic Group, LLC A-1
Appendix A. Data and Methodology
In this appendix, we provide additional discussion and detail regarding the methodology followed to complete the analysis described in this report. We begin by discussing the survey methodology of the URC’s “Alumni Impact Sur-vey,” as well as potential sources of biases for key survey questions. We then describe how we used the survey data to make inferences about the URC alumni population as a whole.
SURVEY METHODOLOGY
The University Research Corridor, contracted with an independent survey firm, Survey Sciences Group, LLC (SSG), to administer data collection for an “Alumni Impact Survey.” Prior to releasing the survey, AEG, the URC, and SSG worked together to frame the questions used in the survey of alumni. SSG administered this study and provided AEG with the data, which were used in our analysis. Below in “SSG Data Collection Methodology,” we provide a sum-mary of SSG’s methodology. We then provide a discussion of potential survey biases in Table A-3, “Likely Effects of Sampling, Question, and Issue Biases on Responses to the Survey Question ‘Have you ever founded or co-founded a business?’” on page A-3.
SSG Data Collection MethodologyEach of the three universities provided SSG with alumni lists, which needed to be “cleaned” to remove duplicate email addresses both within schools, and across schools, to prevent multiple invitations going to the same person. For example, if an email address was present in both the Michigan State and Wayne State file, that case was kept in for the university the individual first attended and suppressed from the other.
Pilot Study. A small pilot of the survey was conducted to test response rates, the length of the survey, as well as identify any problem areas of the instrument and the quality of the lists provided to SSG. For this pilot, 400 cases were selected from each list provided. Half of these cases were sent a survey via email and the other half was mailed a paper survey. These cases were selected at random from records without email addresses and at random from cases that had an email address. Cases that did not have an email address were sent an invitation letter via postal mail as the single contact for the pilot.
Data Collection. Data collection began with the distribution of a notification email to all selected alumni. This email was from the three university Presidents in collaboration and detailed the purpose of the study and who was supporting it. There was no link to access the survey in this initial communication.
The notification email was followed two days later by the invitation email. This communication was to the school specific populations and was sent from their respective university President. This communication provided another overview of the study purpose along with a link to access and participate in the survey.
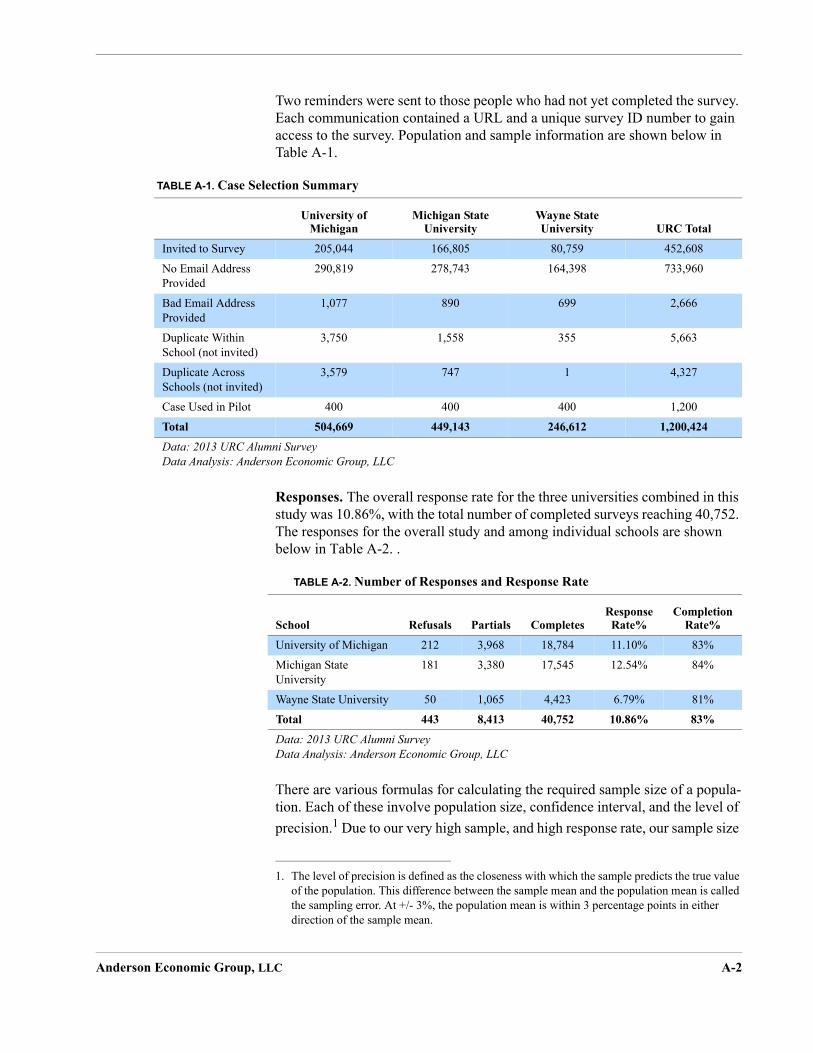
Anderson Economic Group, LLC A-2
Two reminders were sent to those people who had not yet completed the survey. Each communication contained a URL and a unique survey ID number to gain access to the survey. Population and sample information are shown below in Table A-1.
Responses. The overall response rate for the three universities combined in this study was 10.86%, with the total number of completed surveys reaching 40,752. The responses for the overall study and among individual schools are shown below in Table A-2. .
There are various formulas for calculating the required sample size of a popula-tion. Each of these involve population size, confidence interval, and the level of precision.1 Due to our very high sample, and high response rate, our sample size
TABLE A-1. Case Selection Summary
University of Michigan
Michigan State University
Wayne State University URC Total
Invited to Survey 205,044 166,805 80,759 452,608
No Email Address Provided
290,819 278,743 164,398 733,960
Bad Email Address Provided
1,077 890 699 2,666
Duplicate Within School (not invited)
3,750 1,558 355 5,663
Duplicate Across Schools (not invited)
3,579 747 1 4,327
Case Used in Pilot 400 400 400 1,200
Total 504,669 449,143 246,612 1,200,424
Data: 2013 URC Alumni SurveyData Analysis: Anderson Economic Group, LLC
TABLE A-2. Number of Responses and Response Rate
School Refusals Partials CompletesResponse Rate%
Completion Rate%
University of Michigan 212 3,968 18,784 11.10% 83%
Michigan State University
181 3,380 17,545 12.54% 84%
Wayne State University 50 1,065 4,423 6.79% 81%
Total 443 8,413 40,752 10.86% 83%
Data: 2013 URC Alumni SurveyData Analysis: Anderson Economic Group, LLC
1. The level of precision is defined as the closeness with which the sample predicts the true value of the population. This difference between the sample mean and the population mean is called the sampling error. At +/- 3%, the population mean is within 3 percentage points in either direction of the sample mean.
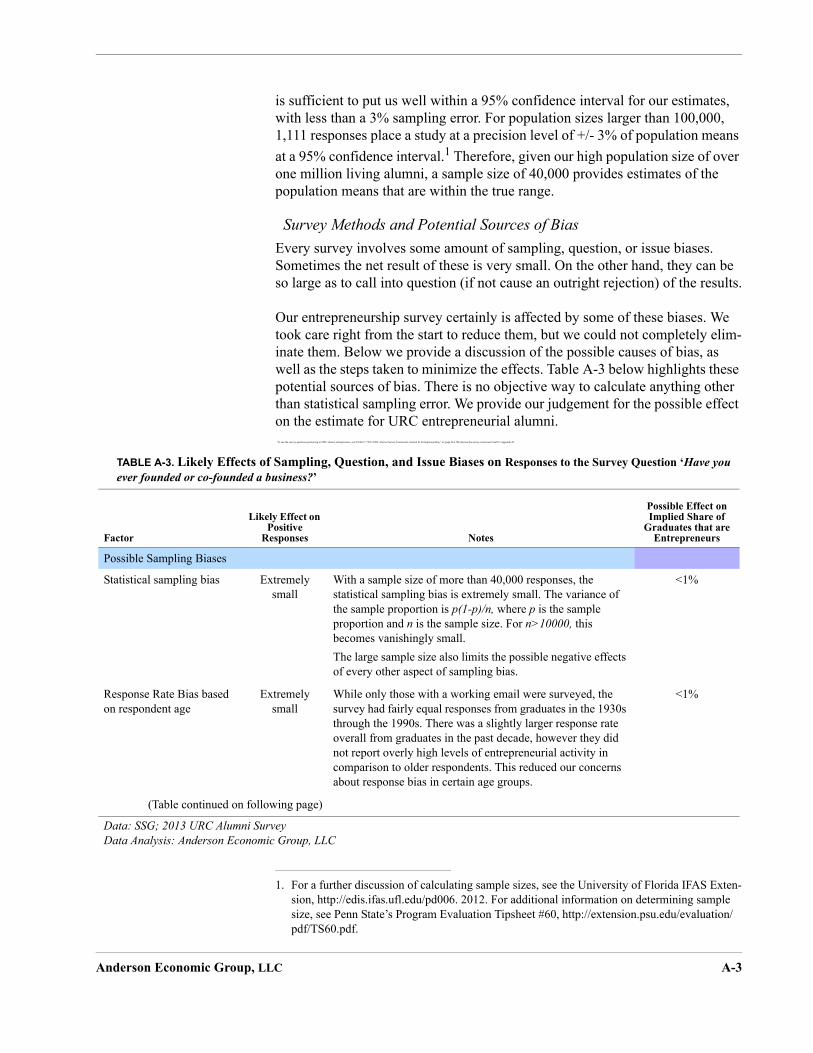
Anderson Economic Group, LLC A-3
is sufficient to put us well within a 95% confidence interval for our estimates, with less than a 3% sampling error. For population sizes larger than 100,000, 1,111 responses place a study at a precision level of +/- 3% of population means at a 95% confidence interval.1 Therefore, given our high population size of over one million living alumni, a sample size of 40,000 provides estimates of the population means that are within the true range.
Survey Methods and Potential Sources of BiasEvery survey involves some amount of sampling, question, or issue biases. Sometimes the net result of these is very small. On the other hand, they can be so large as to call into question (if not cause an outright rejection) of the results.
Our entrepreneurship survey certainly is affected by some of these biases. We took care right from the start to reduce them, but we could not completely elim-inate them. Below we provide a discussion of the possible causes of bias, as well as the steps taken to minimize the effects. Table A-3 below highlights these potential sources of bias. There is no objective way to calculate anything other than statistical sampling error. We provide our judgement for the possible effect on the estimate for URC entrepreneurial alumni. ‘To see the survey questions pertaining to URC alumni entrepreneurs, see Exhibit 2 “2013 URC Alumni Survey Instrument, Section B: Entrepreneurship,” on page B-4. We discuss the survey instrument itself in Appendix B.
1. For a further discussion of calculating sample sizes, see the University of Florida IFAS Exten-sion, http://edis.ifas.ufl.edu/pd006. 2012. For additional information on determining sample size, see Penn State’s Program Evaluation Tipsheet #60, http://extension.psu.edu/evaluation/pdf/TS60.pdf.
TABLE A-3. Likely Effects of Sampling, Question, and Issue Biases on Responses to the Survey Question ‘Have you ever founded or co-founded a business?’
Factor
Likely Effect on Positive
Responses Notes
Possible Effect on Implied Share of
Graduates that are Entrepreneurs
Possible Sampling Biases
Statistical sampling bias Extremely small
With a sample size of more than 40,000 responses, the statistical sampling bias is extremely small. The variance of the sample proportion is p(1-p)/n, where p is the sample proportion and n is the sample size. For n>10000, this becomes vanishingly small.The large sample size also limits the possible negative effects of every other aspect of sampling bias.
<1%
Response Rate Bias based on respondent age
Extremely small
While only those with a working email were surveyed, the survey had fairly equal responses from graduates in the 1930s through the 1990s. There was a slightly larger response rate overall from graduates in the past decade, however they did not report overly high levels of entrepreneurial activity in comparison to older respondents. This reduced our concerns about response bias in certain age groups.
<1%
(Table continued on following page)
Data: SSG; 2013 URC Alumni SurveyData Analysis: Anderson Economic Group, LLC
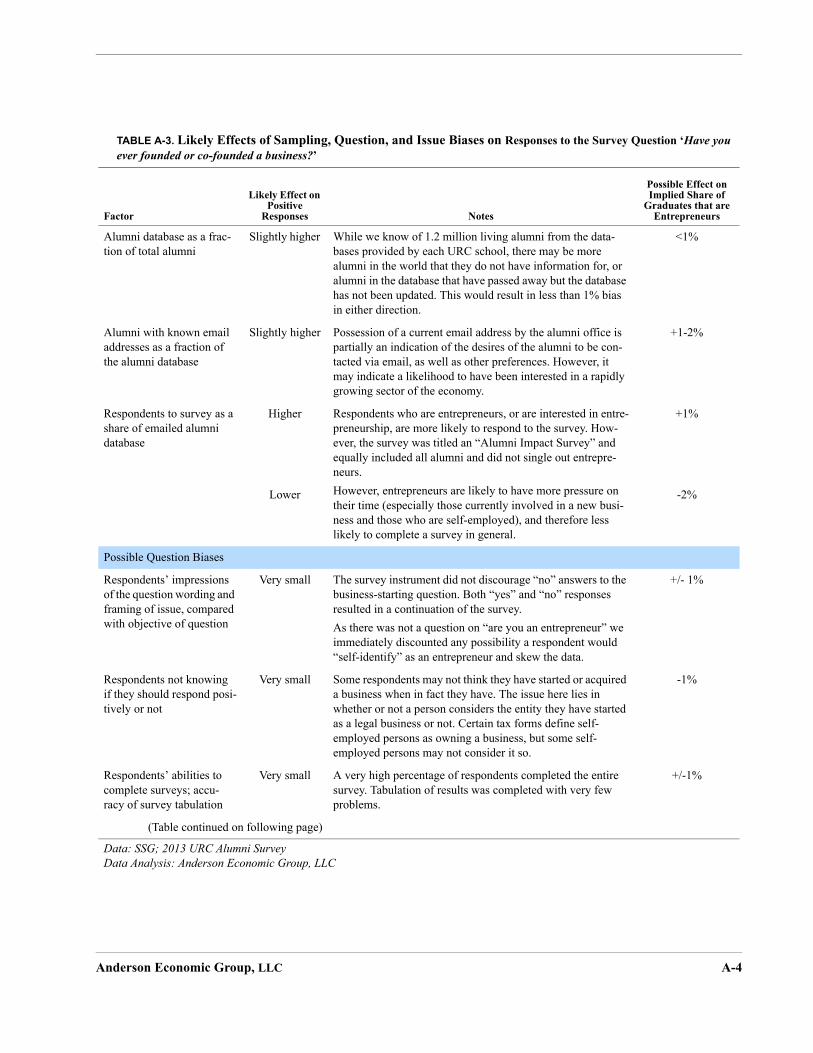
Anderson Economic Group, LLC A-4
Alumni database as a frac-tion of total alumni
Slightly higher While we know of 1.2 million living alumni from the data-bases provided by each URC school, there may be more alumni in the world that they do not have information for, or alumni in the database that have passed away but the database has not been updated. This would result in less than 1% bias in either direction.
<1%
Alumni with known email addresses as a fraction of the alumni database
Slightly higher Possession of a current email address by the alumni office is partially an indication of the desires of the alumni to be con-tacted via email, as well as other preferences. However, it may indicate a likelihood to have been interested in a rapidly growing sector of the economy.
+1-2%
Respondents to survey as a share of emailed alumni database
Higher
Lower
Respondents who are entrepreneurs, or are interested in entre-preneurship, are more likely to respond to the survey. How-ever, the survey was titled an “Alumni Impact Survey” and equally included all alumni and did not single out entrepre-neurs. However, entrepreneurs are likely to have more pressure on their time (especially those currently involved in a new busi-ness and those who are self-employed), and therefore less likely to complete a survey in general.
+1%
-2%
Possible Question Biases
Respondents’ impressions of the question wording and framing of issue, compared with objective of question
Very small The survey instrument did not discourage “no” answers to the business-starting question. Both “yes” and “no” responses resulted in a continuation of the survey. As there was not a question on “are you an entrepreneur” we immediately discounted any possibility a respondent would “self-identify” as an entrepreneur and skew the data.
+/- 1%
Respondents not knowing if they should respond posi-tively or not
Very small Some respondents may not think they have started or acquired a business when in fact they have. The issue here lies in whether or not a person considers the entity they have started as a legal business or not. Certain tax forms define self-employed persons as owning a business, but some self-employed persons may not consider it so.
-1%
Respondents’ abilities to complete surveys; accu-racy of survey tabulation
Very small A very high percentage of respondents completed the entire survey. Tabulation of results was completed with very few problems.
+/-1%
(Table continued on following page)
TABLE A-3. Likely Effects of Sampling, Question, and Issue Biases on Responses to the Survey Question ‘Have you ever founded or co-founded a business?’
Factor
Likely Effect on Positive
Responses Notes
Possible Effect on Implied Share of
Graduates that are Entrepreneurs
Data: SSG; 2013 URC Alumni SurveyData Analysis: Anderson Economic Group, LLC
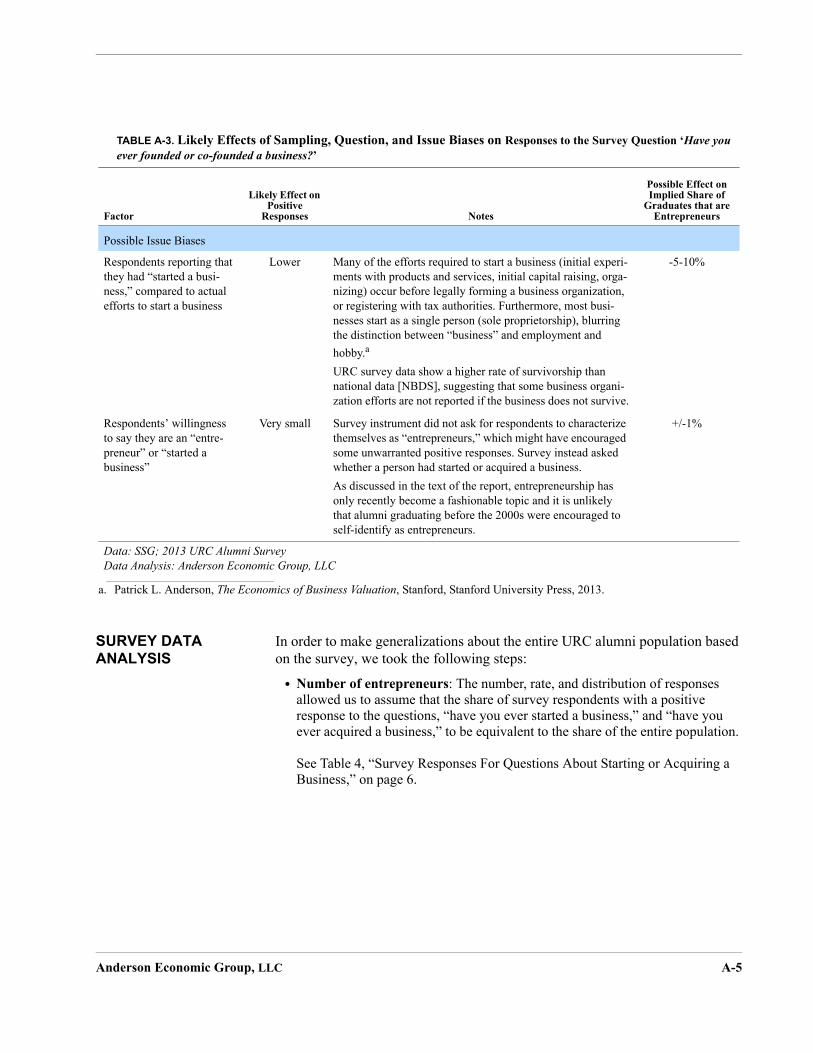
Anderson Economic Group, LLC A-5
SURVEY DATA ANALYSIS
In order to make generalizations about the entire URC alumni population based on the survey, we took the following steps:
• Number of entrepreneurs: The number, rate, and distribution of responses allowed us to assume that the share of survey respondents with a positive response to the questions, “have you ever started a business,” and “have you ever acquired a business,” to be equivalent to the share of the entire population.
See Table 4, “Survey Responses For Questions About Starting or Acquiring a Business,” on page 6.
Possible Issue Biases
Respondents reporting that they had “started a busi-ness,” compared to actual efforts to start a business
Lower Many of the efforts required to start a business (initial experi-ments with products and services, initial capital raising, orga-nizing) occur before legally forming a business organization, or registering with tax authorities. Furthermore, most busi-nesses start as a single person (sole proprietorship), blurring the distinction between “business” and employment and hobby.a
URC survey data show a higher rate of survivorship than national data [NBDS], suggesting that some business organi-zation efforts are not reported if the business does not survive.
-5-10%
Respondents’ willingness to say they are an “entre-preneur” or “started a business”
Very small Survey instrument did not ask for respondents to characterize themselves as “entrepreneurs,” which might have encouraged some unwarranted positive responses. Survey instead asked whether a person had started or acquired a business.As discussed in the text of the report, entrepreneurship has only recently become a fashionable topic and it is unlikely that alumni graduating before the 2000s were encouraged to self-identify as entrepreneurs.
+/-1%
a. Patrick L. Anderson, The Economics of Business Valuation, Stanford, Stanford University Press, 2013.
TABLE A-3. Likely Effects of Sampling, Question, and Issue Biases on Responses to the Survey Question ‘Have you ever founded or co-founded a business?’
Factor
Likely Effect on Positive
Responses Notes
Possible Effect on Implied Share of
Graduates that are Entrepreneurs
Data: SSG; 2013 URC Alumni SurveyData Analysis: Anderson Economic Group, LLC
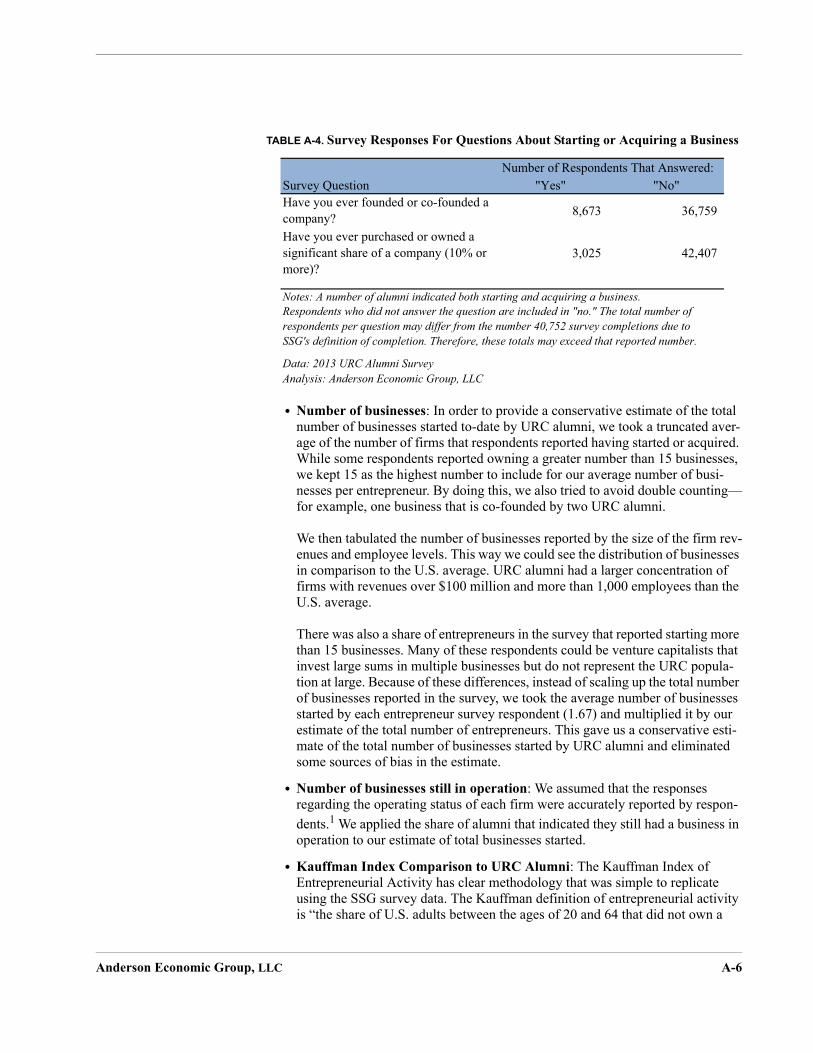
Anderson Economic Group, LLC A-6
TABLE A-4. Survey Responses For Questions About Starting or Acquiring a Business
• Number of businesses: In order to provide a conservative estimate of the total number of businesses started to-date by URC alumni, we took a truncated aver-age of the number of firms that respondents reported having started or acquired. While some respondents reported owning a greater number than 15 businesses, we kept 15 as the highest number to include for our average number of busi-nesses per entrepreneur. By doing this, we also tried to avoid double counting—for example, one business that is co-founded by two URC alumni.
We then tabulated the number of businesses reported by the size of the firm rev-enues and employee levels. This way we could see the distribution of businesses in comparison to the U.S. average. URC alumni had a larger concentration of firms with revenues over $100 million and more than 1,000 employees than the U.S. average.
There was also a share of entrepreneurs in the survey that reported starting more than 15 businesses. Many of these respondents could be venture capitalists that invest large sums in multiple businesses but do not represent the URC popula-tion at large. Because of these differences, instead of scaling up the total number of businesses reported in the survey, we took the average number of businesses started by each entrepreneur survey respondent (1.67) and multiplied it by our estimate of the total number of entrepreneurs. This gave us a conservative esti-mate of the total number of businesses started by URC alumni and eliminated some sources of bias in the estimate.
• Number of businesses still in operation: We assumed that the responses regarding the operating status of each firm were accurately reported by respon-dents.1 We applied the share of alumni that indicated they still had a business in operation to our estimate of total businesses started.
• Kauffman Index Comparison to URC Alumni: The Kauffman Index of Entrepreneurial Activity has clear methodology that was simple to replicate using the SSG survey data. The Kauffman definition of entrepreneurial activity is “the share of U.S. adults between the ages of 20 and 64 that did not own a
Survey Question "Yes" "No"Have you ever founded or co-founded a company? 8,673 36,759
Have you ever purchased or owned a significant share of a company (10% or more)?
3,025 42,407
Data: 2013 URC Alumni Survey Analysis: Anderson Economic Group, LLC
Number of Respondents That Answered:
Notes: A number of alumni indicated both starting and acquiring a business.Respondents who did not answer the question are included in "no." The total number of respondents per question may differ from the number 40,752 survey completions due to SSG's definition of completion. Therefore, these totals may exceed that reported number.
Anderson Economic Group, LLC A-7
business in the previous year, but did own a business in the year they were being polled.”1 The SSG survey gathered data on each respondent’s birth year along with data on the year each of their companies was founded. Using this, we were able to recreate the Kauffman Index for URC alumni.
• Geography of firms and mapping: Survey respondents provided the location of each business started. Using the response rates and share of the entire alumni population we were able to scale up the number of firms opened in general and in Michigan. We organized the information and used a geographic information system (GIS) platform to map the country, state, and city of each business iden-tified by survey respondents.
• Revenues and GDP: Survey respondents were given the opportunity to report revenue for up to 10 firms in the survey. We summed the total of those who reported revenues for the 2012 year, and scaled the value to represent the survey population according to the share of survey respondents that answered the ques-tion. This was necessary as some respondents who started businesses and reported those businesses did not report revenues. We calculated GDP estimates using the 2004-2011 average ratio of value added (GDP) to business revenues.2 In order to scale the GDP values, we took the following conservative approach:
1.Remove all firms that had over $100 million in revenues (for the lower bound) and all firms with over $500 million in revenues (for the upper bound).2.Scale the new totals up based on the share of firms not reported in the sur-vey (approximately 4.5% responded).3.Add the removed revenues to each respective total.4.Multiply each by the GDP/Output ratio for the U.S.
• Total Employment: Survey respondents were given the opportunity to report employment for up to 10 firms in the survey. We summed the total of those who reported the number of workers their firm employed for the 2012 year, and increased the value to represent the survey population according to the share of survey respondents that answered the question. This was necessary as some respondents who started businesses and reported those businesses did not report employment levels. We then took the following steps to estimate total URC-alumni firm employment for 2012:
1. We were unable to confirm survey results and check business existence, employment, or reve-nue levels, as some other studies have. Doing so would have been a massive undertaking and was outside the scope of this project. Rather, we used conservative methodology, so as not to overinflate our estimates.
1. Robert W. Fairlie, “Robert W. Kauffman Index of Entrepreneurial Activity 1996-2011,” Kauff-man Foundation of Entrepreneurship, Santa Cruz, March 2012.
2. Bureau of Economic Analysis Value-Added and Gross-Output data 2004 to 2011. See our dis-cussion in “‘To see the survey questions pertaining to URC alumni entrepreneurs, see Exhibit 2 “2013 URC Alumni Survey Instrument, Section B: Entrepreneurship,” on page B-4. We dis-cuss the survey instrument itself in Appendix B.” on page A-3.
Anderson Economic Group, LLC A-8
1.Scale down the number of firms with over 1,000 employees (0.095% of businesses reported in survey) to match that of the U.S. average (0.09% of all U.S. businesses).
2.Scale up the new total by the share of firms not represented in the survey (approximately 4.5% represented).
3.Add the employment in for firms removed in step 1.4.Add the number of firms with zero employees other than the owner to
capture self-employment.
Anderson Economic Group, LLC B-1
Appendix B. Alumni Survey Instrument
In this appendix, additional detail is provided regarding the survey instrument used to inform this study. As mentioned previously in Appendix A, Anderson Economic Group, LLC collaborated with both The University Research Corri-dor (URC) and an independent survey firm, Survey Sciences Group, LLC (SSG) to formulate a set of questions that would comprise the 2013 URC Alumni Survey. Data from this survey allowed AEG to more accurately assess the URC’s economic contribution via their entrepreneurially-inclined alumni.
OVERVIEW OF SURVEY INSTRUMENT
As described in “Survey Methodology” on page A-1, each survey was accompa-nied by a letter to from a URC university president. See below.
Survey Invitation from University PresidentBelow is a representative letter that each of the URC university presidents sent as an introduction to the survey. Each of the letters was slightly tailored to that university, but each respondent was provided a similar explanation of the sur-vey’s overall purpose:
I am writing to encourage you to participate in an important survey being carried out by the University of Michigan, Michigan State Uni-versity and Wayne State University. Together, our three institutions work as the University Research Corridor (URC), an alliance to help strengthen and diversify the Michigan economy.
As professionals, innovators, entrepreneurs and leaders, [MSU, U-M, WSU] alumni make an enormous impact on the economies of Michi-gan, the United States, and the world. To measure this impact, the URC Alumni Impact Survey is reaching out to nearly 450,000 graduates of U-M, MSU, and WSU to better understand their occupations, indus-tries, entrepreneurial endeavors, and geographies.
This survey also aims to learn from alumni like you how your prepara-tion and experiences at [MSU, U-M, WSU] have influenced your pro-fessional life.
The survey is available online and will take approximately 15 minutes to complete. Please visit: https://ssgresearch.com/survey/....
Your login information is as follows:
Username:
Password:
Survey results will be used to provide industry leaders, academic lead-ers, legislators, media, the general public and alumni with a clearer pic-ture of the role universities play in our economy, within the state and beyond. Findings also will help to strengthen our programs and better
Anderson Economic Group, LLC B-2
prepare [MSU, U-M, WSU] students for the challenges they will face in their careers.
Sections of the Survey The 2013 URC Alumni Survey included four sections:
A. Educational BackgroundThis section asked respondents basic questions about their education, such as graduation date, how many degrees they have earned, and from where. Each respondent was provided a drop down menu to chose from for their major, as well as an “other” category, should their major not fit into the provided cate-gory.
B. EntrepreneurshipThis section asked questions about firms that a respondent has owned and/or acquired such as founding dates, industry, number of employees, and business revenues. The data primarily used by AEG was from this section. We provide the questions included in Exhibit 2 “2013 URC Alumni Survey Instrument, Sec-tion B: Entrepreneurship,” on page B-4.1
C. Career InformationThis section asked respondents basic questions about their current careers, such as their work status (currently employed, retired, etc), and the size and industry of the company at which they are employed. Each respondent was also asked questions about whether their job related to their major, and if skills from their degree translated into significant skills they use at their job.
D. Personal InformationThis section asked respondents basic questions about themselves such as the year they were born, ethnicity, race, where they currently reside, and their household income.
Every survey respondent was provided the opportunity to answer questions in each of these sections. However, how respondents answered the following ques-tions, determined whether they were presented with the questions from Section B or C:
1. Have you ever founded or co-founded a company? (Please note that this question refers to founding status of your company, and includes any level of ownership.)
2. Have you ever purchased or owned a significant share (10% or more) in an existing business? *Please do not include companies listed in the previous question (founded com-panies). This question refers only to those mature companies you purchased or own, but did not found.
1. Note that Exhibit 2 only contains the questions from Section B. This exhibit also has some commands that were used in to create the survey. We left these programming commands in the survey text so that interested readers could see how questions progressed and how the survey determined whether questions pertained to each respondent.
Anderson Economic Group, LLC B-3
If the respondent answered “yes” to either question they were directed to the remaining questions in Section 2. If they answered “no” to both, they were directed to the questions in Section 3. Note that each survey question was not mandatory, which we discuss below.
MandatorinessSSG did not require all questions to be mandotory. Rather all questions were made optional with a soft prompt to the respondent if no answer was provided. Below is text for the Mandatoriness prompt used:
We noticed that you did not answer a question on the previous page. It is important to us that we get a complete set of responses from you. To return to the last question please click "Previous" and select an answer, otherwise click "Next" and you will advance to the next page.
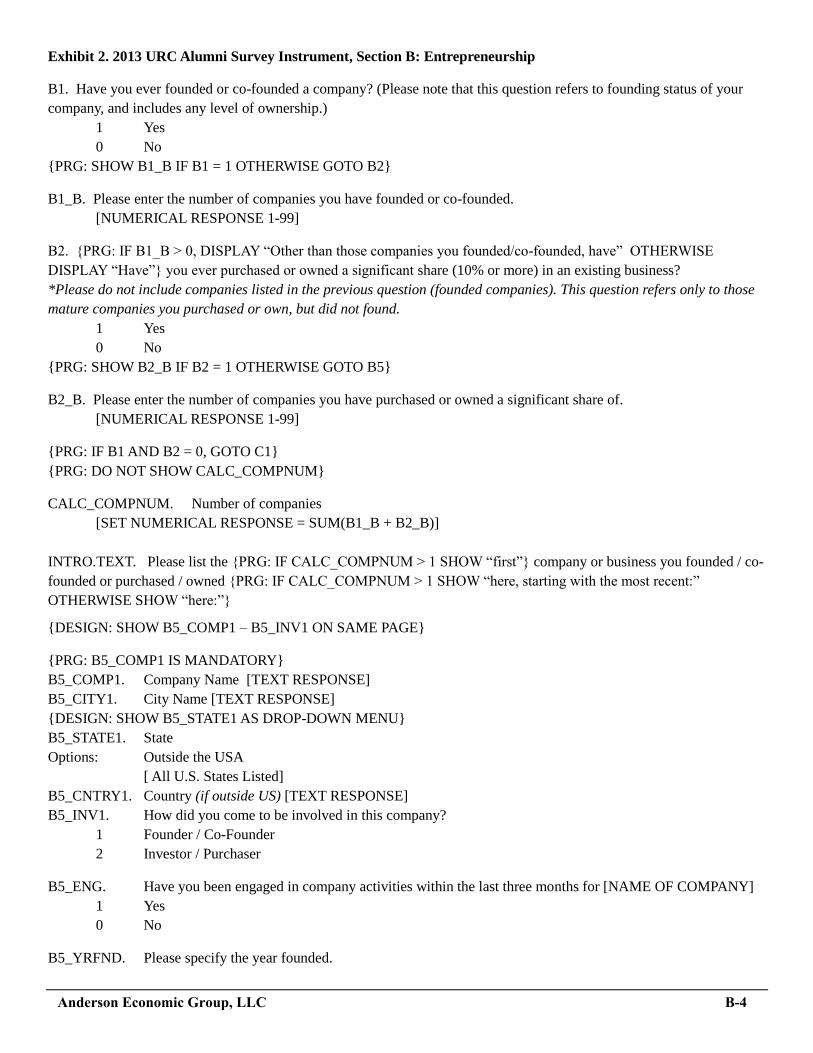
Exhibit 2. 2013 URC Alumni Survey Instrument, Section B: Entrepreneurship
B1. Have you ever founded or co-founded a company? (Please note that this question refers to founding status of your
company, and includes any level of ownership.)
1 Yes
0 No
{PRG: SHOW B1_B IF B1 = 1 OTHERWISE GOTO B2}
B1_B. Please enter the number of companies you have founded or co-founded.
[NUMERICAL RESPONSE 1-99]
B2. {PRG: IF B1_B > 0, DISPLAY “Other than those companies you founded/co-founded, have” OTHERWISE
DISPLAY “Have”} you ever purchased or owned a significant share (10% or more) in an existing business?
*Please do not include companies listed in the previous question (founded companies). This question refers only to those
mature companies you purchased or own, but did not found.
1 Yes
0 No
{PRG: SHOW B2_B IF B2 = 1 OTHERWISE GOTO B5}
B2_B. Please enter the number of companies you have purchased or owned a significant share of.
[NUMERICAL RESPONSE 1-99]
{PRG: IF B1 AND B2 = 0, GOTO C1}
{PRG: DO NOT SHOW CALC_COMPNUM}
CALC_COMPNUM. Number of companies
[SET NUMERICAL RESPONSE = SUM(B1_B + B2_B)]
INTRO.TEXT. Please list the {PRG: IF CALC_COMPNUM > 1 SHOW “first”} company or business you founded / co-
founded or purchased / owned {PRG: IF CALC_COMPNUM > 1 SHOW “here, starting with the most recent:”
OTHERWISE SHOW “here:”}
{DESIGN: SHOW B5_COMP1 – B5_INV1 ON SAME PAGE}
{PRG: B5_COMP1 IS MANDATORY}
B5_COMP1. Company Name [TEXT RESPONSE]
B5_CITY1. City Name [TEXT RESPONSE]
{DESIGN: SHOW B5_STATE1 AS DROP-DOWN MENU}
B5_STATE1. State
Options: Outside the USA
[ All U.S. States Listed]
B5_CNTRY1. Country (if outside US) [TEXT RESPONSE]
B5_INV1. How did you come to be involved in this company?
1 Founder / Co-Founder
2 Investor / Purchaser
B5_ENG. Have you been engaged in company activities within the last three months for [NAME OF COMPANY]
1 Yes
0 No
B5_YRFND. Please specify the year founded.
Anderson Economic Group, LLC B-4
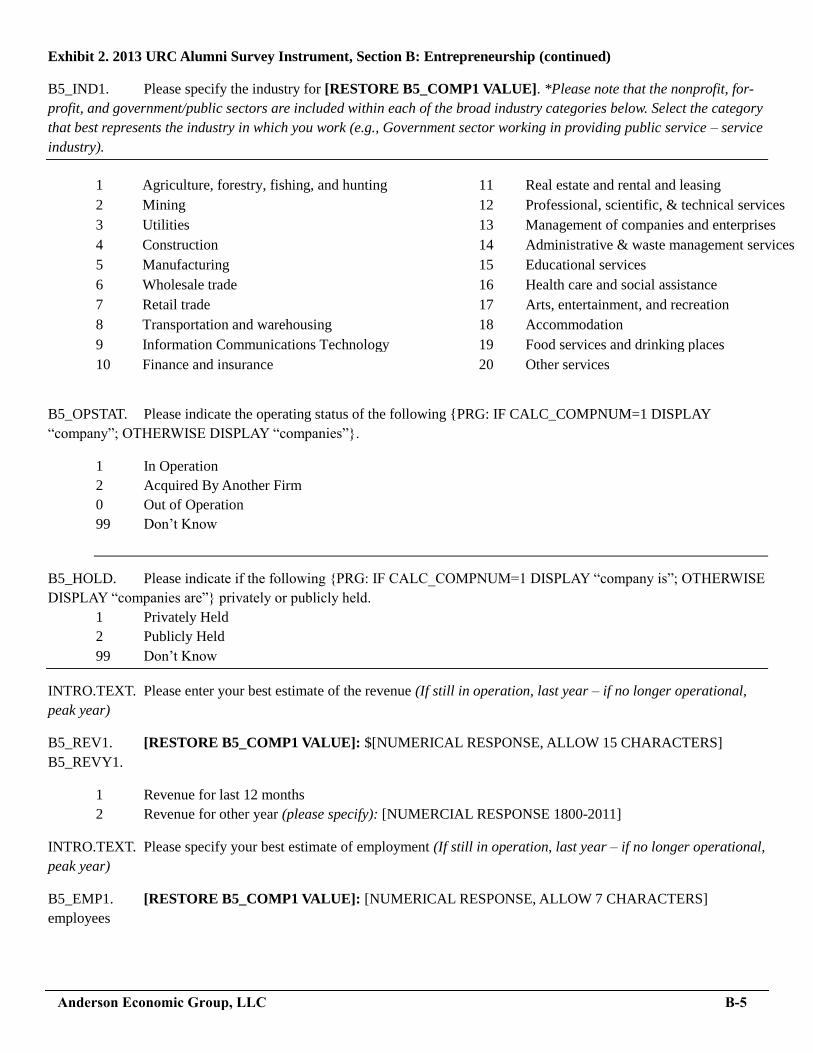
Exhibit 2. 2013 URC Alumni Survey Instrument, Section B: Entrepreneurship (continued)
B5_IND1. Please specify the industry for [RESTORE B5_COMP1 VALUE]. *Please note that the nonprofit, for-
profit, and government/public sectors are included within each of the broad industry categories below. Select the category
that best represents the industry in which you work (e.g., Government sector working in providing public service – service
industry).
1 Agriculture, forestry, fishing, and hunting
2 Mining
3 Utilities
4 Construction
5 Manufacturing
6 Wholesale trade
7 Retail trade
8 Transportation and warehousing
9 Information Communications Technology
10 Finance and insurance
11 Real estate and rental and leasing
12 Professional, scientific, & technical services
13 Management of companies and enterprises
14 Administrative & waste management services
15 Educational services
16 Health care and social assistance
17 Arts, entertainment, and recreation
18 Accommodation
19 Food services and drinking places
20 Other services
B5_OPSTAT. Please indicate the operating status of the following {PRG: IF CALC_COMPNUM=1 DISPLAY
“company”; OTHERWISE DISPLAY “companies”}.
1 In Operation
2 Acquired By Another Firm
0 Out of Operation
99 Don’t Know
B5_HOLD. Please indicate if the following {PRG: IF CALC_COMPNUM=1 DISPLAY “company is”; OTHERWISE
DISPLAY “companies are”} privately or publicly held.
1 Privately Held
2 Publicly Held
99 Don’t Know
INTRO.TEXT. Please enter your best estimate of the revenue (If still in operation, last year – if no longer operational,
peak year)
B5_REV1. [RESTORE B5_COMP1 VALUE]: $[NUMERICAL RESPONSE, ALLOW 15 CHARACTERS]
B5_REVY1.
1 Revenue for last 12 months
2 Revenue for other year (please specify): [NUMERCIAL RESPONSE 1800-2011]
INTRO.TEXT. Please specify your best estimate of employment (If still in operation, last year – if no longer operational,
peak year)
B5_EMP1. [RESTORE B5_COMP1 VALUE]: [NUMERICAL RESPONSE, ALLOW 7 CHARACTERS]
employees
Anderson Economic Group, LLC B-5
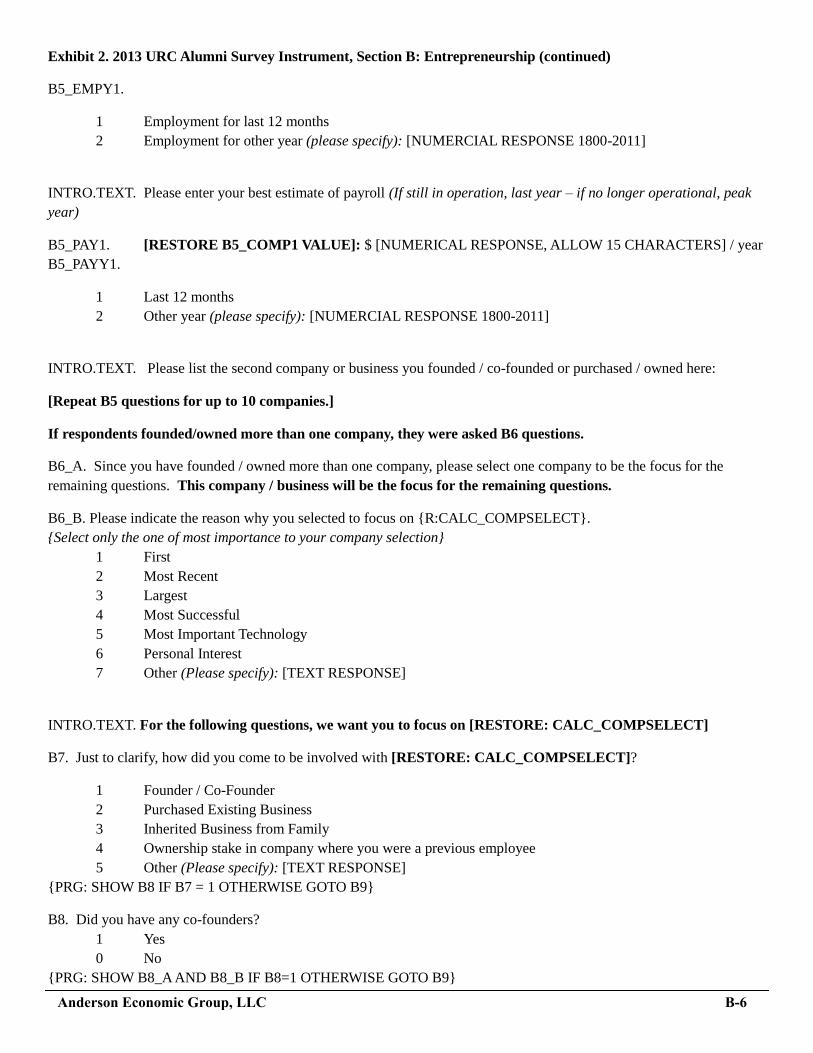
Exhibit 2. 2013 URC Alumni Survey Instrument, Section B: Entrepreneurship (continued)
B5_EMPY1.
1 Employment for last 12 months
2 Employment for other year (please specify): [NUMERCIAL RESPONSE 1800-2011]
INTRO.TEXT. Please enter your best estimate of payroll (If still in operation, last year – if no longer operational, peak
year)
B5_PAY1. [RESTORE B5_COMP1 VALUE]: $ [NUMERICAL RESPONSE, ALLOW 15 CHARACTERS] / year
B5_PAYY1.
1 Last 12 months
2 Other year (please specify): [NUMERCIAL RESPONSE 1800-2011]
INTRO.TEXT. Please list the second company or business you founded / co-founded or purchased / owned here:
[Repeat B5 questions for up to 10 companies.]
If respondents founded/owned more than one company, they were asked B6 questions.
B6_A. Since you have founded / owned more than one company, please select one company to be the focus for the
remaining questions. This company / business will be the focus for the remaining questions.
B6_B. Please indicate the reason why you selected to focus on {R:CALC_COMPSELECT}.
{Select only the one of most importance to your company selection}
1 First
2 Most Recent
3 Largest
4 Most Successful
5 Most Important Technology
6 Personal Interest
7 Other (Please specify): [TEXT RESPONSE]
INTRO.TEXT. For the following questions, we want you to focus on [RESTORE: CALC_COMPSELECT]
B7. Just to clarify, how did you come to be involved with [RESTORE: CALC_COMPSELECT]?
1 Founder / Co-Founder
2 Purchased Existing Business
3 Inherited Business from Family
4 Ownership stake in company where you were a previous employee
5 Other (Please specify): [TEXT RESPONSE]
{PRG: SHOW B8 IF B7 = 1 OTHERWISE GOTO B9}
B8. Did you have any co-founders?
1 Yes
0 No
{PRG: SHOW B8_A AND B8_B IF B8=1 OTHERWISE GOTO B9}
Anderson Economic Group, LLC B-6
Exhibit 2. 2013 URC Alumni Survey Instrument, Section B: Entrepreneurship (continued)
B8_A. Please specify the number of co-founders. [NUMERICAL RESPONSE 0-99]
B8_B. What was / is your relationship to the other co-founder(s)? (Select all that apply)
1 University classmates
2 University faculty
3 University alumni (not classmates)
4 Friends
5 Work colleagues
6 Family
7 Other (Please specify): [TEXT
RESPONSE]
B9. What was the primary source of funding used to support the start of [RESTORE: CALC_COMPSELECT]?
1 Venture Capital
2 Angel Investor
3 Bank Loan
4 Small business loan – government
5 Personal loan from family or friend
6 Personal investment
7 Crowd-funding
8 Other (Please specify): [TEXT RESPONSE]
B10. What other sources of funding did you use to support the start of [RESTORE: CALC_COMPSELECT]? (Select
all that apply)
{PRG: SHOW RESPONSE OPTIONS ONLY IF NOT SELECTED IN B9}
1 Venture Capital
2 Angel Investor
3 Bank Loan
4 Small business loan – government
5 Personal loan from family or friend
6 Personal investment
7 Crowd-funding
8 Other (Please specify): [TEXT RESPONSE]
0 None
B11. Thinking back to your experience at [DISPLAY PRE_3 LABEL], how influential were the following to your
founding or owning of [RESTORE: CALC_COMPSELECT]?
1 A lot of influence
2 Some influence
3 A little influence
0 None
99 Not Applicable
B11_A. Faculty
B11_B. University Mentors
B11_C. Entrepreneurial community outside the
university
B11_D. Fellow Students
B11_E. Research work
B11_F. Experiential Learning (e.g. internships)
B11_G. Funding
B11_H. Incubator space
B11_I. Entrepreneurial course
B11_J. Culture / General Expectations
Anderson Economic Group, LLC B-7
Exhibit 2. 2013 URC Alumni Survey Instrument, Section B: Entrepreneurship (continued)
B12. Outside of [DISPLAY PRE_3 LABEL], how much influence did each of the following aspects of your experience
have on your founding or owning of [RESTORE: CALC_COMPSELECT]?
1 A lot of influence
2 Some influence
3 A little influence
0 None
99 Not Applicable
B12_A. Funding
B12_B. Mentors
B12_C. Work Experience
B12_D. Peer Networks
B12_E. Alumni Network
B12_F. Entrepreneurial Support Infrastructure
B13. Where was [RESTORE: CALC_COMPSELECT] initially founded?
Options: Outside the USA
[ All U.S. States Listed]
{PRG: SHOW B14 IF B13 IF NULL OR NOT EQUAL TO 23}
B14. Since [RESTORE: CALC_COMPSELECT] was founded, has it located an expansion office in Michigan?
1 Yes
0 No
{PRG: SHOW B14_A IF B14=1 OR IF B13=23 OTHERWISE GOTO B14_B}
B14_A. Number of employees located in Michigan. [NUMERICAL RESPONSE 1-999999]
{PRG: SHOW B14_B IF B14=0 OR IS NULL; OTHERWISE GOTO B15}
B14_B. Have you ever considered locating part or all of [RESTORE: CALC_COMPSELECT] in Michigan?
1 Yes
0 No
B15. What factors influenced your decision to locate [RESTORE: CALC_COMPSELECT] where you did?
1 A lot of influence
2 Some influence
3 A little influence
0 None
99 Not Applicable
B15A. Location affiliation (e.g., you grew up there; you attended school or university there; you were employed there)
B15B. Access to talent
B15C. Strength of entrepreneurial ecosystem (e.g., entrepreneurial expertise / mentorship, access to venture capital and
other funding, access to technology / research / licensing opportunities, proximity to intellectual property protection)
B15D. Business Climate (e.g., state and local government assistance; favorable tax climate; favorable regulatory climate;
low-cost land / rental space)
B15E. Operations (e.g., proximity to market; proximity to suppliers; network of contacts; transportation infrastructure)
B15F. Quality of life (e.g., cost of housing; quality of schools; recreation opportunities; arts & culture)
INTRO.TEXT. Information regarding entrepreneurs’ socio-economic background has rarely been considered in studies of
entrepreneurs. The following questions are an effort to address this area.
Anderson Economic Group, LLC B-8
Exhibit 2. 2013 URC Alumni Survey Instrument, Section B: Entrepreneurship (continued)
B16.INTRO. To the best of your recollection, please estimate your…
B16A. High School [NUMERICAL RESPONSE 0.0-4.0]
B16B. College [NUMERICAL RESPONSE 0.0-4.0]
INTRO.TEXT. Please estimate your SAT or ACT scores.
B17A. ACT [NUMERICAL RESPONSE 0-36]
B17B. SAT [NUMERICAL RESPONSE 200-2400]
INTRO.TEXT. Please indicate the highest level of education for your parents.
1 Less than high school diploma
2 HS Diploma
3 Some college, no degree
4 BA
5 Masters / Professional Degree
6 Doctorate
99 Don’t Know / Not Applicable
B18A. Mother
B18B. Father
B19. Please select the category that best describes the level of household income (in today’s dollars) for your family of
origin (parents).
1 Less than $20,000
2 $20,000 - $34,999
3 $35,000 - $49,999
4 $50,000 - $74,999
5 $75,000 - $99,999
6 $100,000 - $149,999
7 $200,000 - $499,999
8 $500,000 or greater
99 Don’t Know
B20. Did you receive any form of financial aid (e.g., merit scholarships, need-based scholarships, grants, loans) to
attend undergraduate school?
1 Yes
0 No
{PRG: SHOW B21 IF B20 = 1 OTHERWISE GOTO C1}
B21. Please select which forms of aid you received. (Please select all that apply)
1 National merit-based scholarship
2 Institutional merit-based scholarship
3 Federal and/or state need-based scholarship
4 Institutional need-based scholarship
5 Pell Grant
6 Stafford Loans
Anderson Economic Group, LLC B-9
Anderson Economic Group, LLC C-1
Appendix C. About the Authors
ANDERSON ECONOMIC GROUP
Anderson Economic Group, LLC is a research and consulting firm specializing in economics, public policy, finance and business valuation, and market and industry analysis. The firm has offices in Chicago, Illinois and East Lansing, Michigan. AEG has conducted economic and fiscal impact studies for private, public, and non-profit clients across the United States.
Since 2007, AEG has completed two annual studies for the University Research Corridor. The first report is an assessment of the URC’s economic impact on the state of Michigan, which is released every fall or winter. The second report is an assessment of how the URC universities contribute to an important economic sector in the state, which is released every spring. For past reports and more information on AEG, visit www.AndersonEconomicGroup.com.
STUDY’S AUTHORS Erin Agemy Grover. Ms. Grover is a Senior Analyst at Anderson Economic Group, working in the Public Policy and Economic Analysis practice area. Ms. Grover’s recent work consists of several economic and fiscal impact analyses of counties and business ventures throughout the U.S.; evaluating policy changes and potential public funding mechanisms; as well as an analysis of the eco-nomic contribution research universities make in Michigan. She also contrib-uted to the book, The Economics of Business Valuation, a 2013 publication of Stanford Press.
Ms. Grover holds a Masters degree in Economics from George Mason Univer-sity and a Bachelors of Science degree in Political Economy from Hillsdale Col-lege.
Colby Spencer Cesaro. Ms. Cesaro is a Senior Analyst at Anderson Economic Group, working in the Public Policy and Economic Analysis; and Market and Industry practice areas. Ms. Cesaro’s background is in econometrics, public pol-icy, local government, urban and social policy, and education.
Ms. Cesaro’s recent work includes several economic impact analyses, including infrastructure projects and business ventures; analysis of state provided business tax incentives; analysis of the economic contribution research universities make in Michigan; benchmarking Michigan’s economy and higher education institu-tions compared to those in other U.S. States; and analysis of how competitive Michigan’s metropolitan areas are for businesses. Ms. Cesaro also works with Geographic Information System (GIS), applying the software to conduct geo-spatial market and policy analyses.
Ms. Cesaro holds a Bachelor of Science in Education from New York Univer-sity and a Master of Public Administration from the School of International and Public Affairs at Columbia University.
Anderson Economic Group, LLC C-2
Samantha Superstine. Ms. Superstine is a Senior Analyst at Anderson Eco-nomic Group, working in the Public Policy and Economic Analysis practice area. Her background is in economic analysis and tax policy, and energy policy and infrastructure development.
Ms. Superstine’s recent work includes economic and fiscal impact analyses of proposed tax policies and business plans, assessing potential modifications to current state budgets and policies, and evaluating and benchmarking economic performance for regions across the nation.
Ms. Superstine holds a Bachelor of Arts degree in economics from the Univer-sity of Michigan. She also attended the University of Chicago, where she earned a Master of Public Policy degree, with honors, from the Harris School of Public Policy.
Patrick L. Anderson. Mr. Anderson founded Anderson Economic Group in 1996, and serves as a Principal and Chief Executive Officer in the company.
Mr. Anderson has taken a leading role in several major public policy initiatives in his home state. He was the author of the 1992 Term Limit Amendment to the Michigan Constitution, and also the author of the 2006 initiated law that repealed the state's 4-decade-old Single Business Tax. His firm's work resulted in a wage increase for Home Help workers in 2006, the creation of a Michigan EITC in 2008, and the repeal of the item pricing law in 2011. Before founding Anderson Economic Group, Mr. Anderson was the deputy budget director for the State of Michigan under Governor John Engler, and Chief of Staff for the Michigan Department of State.
Anderson is a graduate of the University of Michigan, where he earned a Master of Public Policy degree and a Bachelor of Arts degree in political science. He is a member of the National Association for Business Economics and the National Association of Forensic Economists. The Michigan Chamber of Commerce awarded Mr. Anderson its 2006 Leadership Michigan Distinguished Alumni award for his civic and professional accomplishments.