Embed Size (px)
Citation preview
1 Braxton Way Suite 125 Glen Mills, PA 19342
484-840-4300 www.ssrs.com
POLL2 @ssrs_research | 484.840.4300 | www.ssrs.com | 1
OVERVIEW The study was conducted for CNN via telephone by SSRS, an independent research company. Interviews were conducted from March 4-7, 2020 among a sample of 1,211 respondents. The landline total respondents were 443 and there were 768 cell phone respondents. The margin of sampling error for total respondents is +/- 3.3 at the 95% confidence level. The design effect is 1.37. More information about SSRS can be obtained by visiting www.ssrs.com. Unless otherwise noted, results beginning with the March 31-April 2, 2006 survey and ending with the April 22-25, 2017 survey are from surveys conducted by ORC International. Results before March 31, 2006 are from surveys conducted by Gallup. Question text noted in parentheses was rotated or randomized. Values less than 0.5 percent are indicated by an asterisk (*).
NOTE ABOUT CROSSTABS Interviews were conducted among a representative sample of the adult population, age 18 or older, of the United States. Members of demographic groups not shown in the published crosstabs are represented in the results for each question in the poll. Crosstabs on the pages that follow only include results for subgroups with a minimum n=125 unweighted cases. Results for subgroups with fewer than n=125 unweighted cases are not displayed and instead are denoted with "SN" because samples of that size carry larger margins of sampling error and can be too small to be projectable with confidence to their true values in the population.
EMBARGOED FOR RELEASE: Monday, March 9 at 4:00 p.m.
1 Braxton Way Suite 125 Glen Mills, PA 19342
484-840-4300 www.ssrs.com
POLL2 @ssrs_research | 484.840.4300 | www.ssrs.com | 2
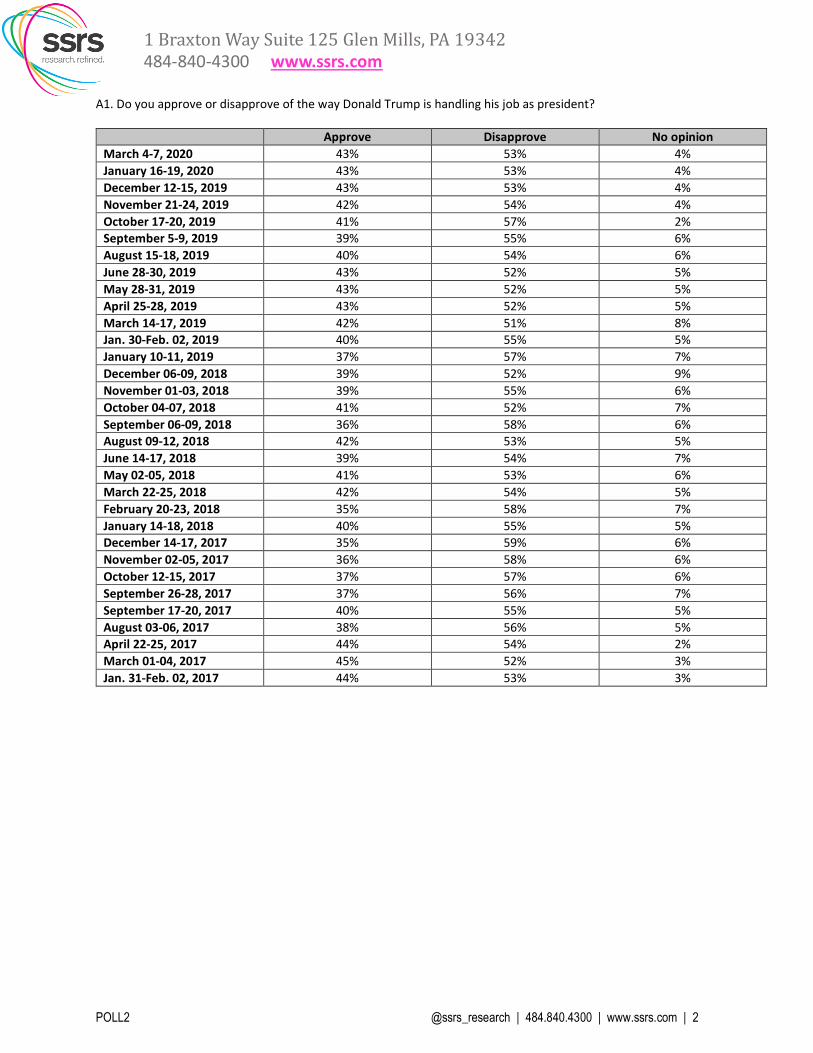
A1. Do you approve or disapprove of the way Donald Trump is handling his job as president?
Approve Disapprove No opinion
March 4-7, 2020 43% 53% 4%
January 16-19, 2020 43% 53% 4%
December 12-15, 2019 43% 53% 4%
November 21-24, 2019 42% 54% 4%
October 17-20, 2019 41% 57% 2% September 5-9, 2019 39% 55% 6%
August 15-18, 2019 40% 54% 6%
June 28-30, 2019 43% 52% 5%
May 28-31, 2019 43% 52% 5%
April 25-28, 2019 43% 52% 5%
March 14-17, 2019 42% 51% 8% Jan. 30-Feb. 02, 2019 40% 55% 5%
January 10-11, 2019 37% 57% 7%
December 06-09, 2018 39% 52% 9%
November 01-03, 2018 39% 55% 6%
October 04-07, 2018 41% 52% 7%
September 06-09, 2018 36% 58% 6% August 09-12, 2018 42% 53% 5%
June 14-17, 2018 39% 54% 7%
May 02-05, 2018 41% 53% 6%
March 22-25, 2018 42% 54% 5%
February 20-23, 2018 35% 58% 7%
January 14-18, 2018 40% 55% 5% December 14-17, 2017 35% 59% 6%
November 02-05, 2017 36% 58% 6%
October 12-15, 2017 37% 57% 6%
September 26-28, 2017 37% 56% 7%
September 17-20, 2017 40% 55% 5%
August 03-06, 2017 38% 56% 5% April 22-25, 2017 44% 54% 2%
March 01-04, 2017 45% 52% 3%
Jan. 31-Feb. 02, 2017 44% 53% 3%
1 Braxton Way Suite 125 Glen Mills, PA 19342
484-840-4300 www.ssrs.com
POLL2 @ssrs_research | 484.840.4300 | www.ssrs.com | 3
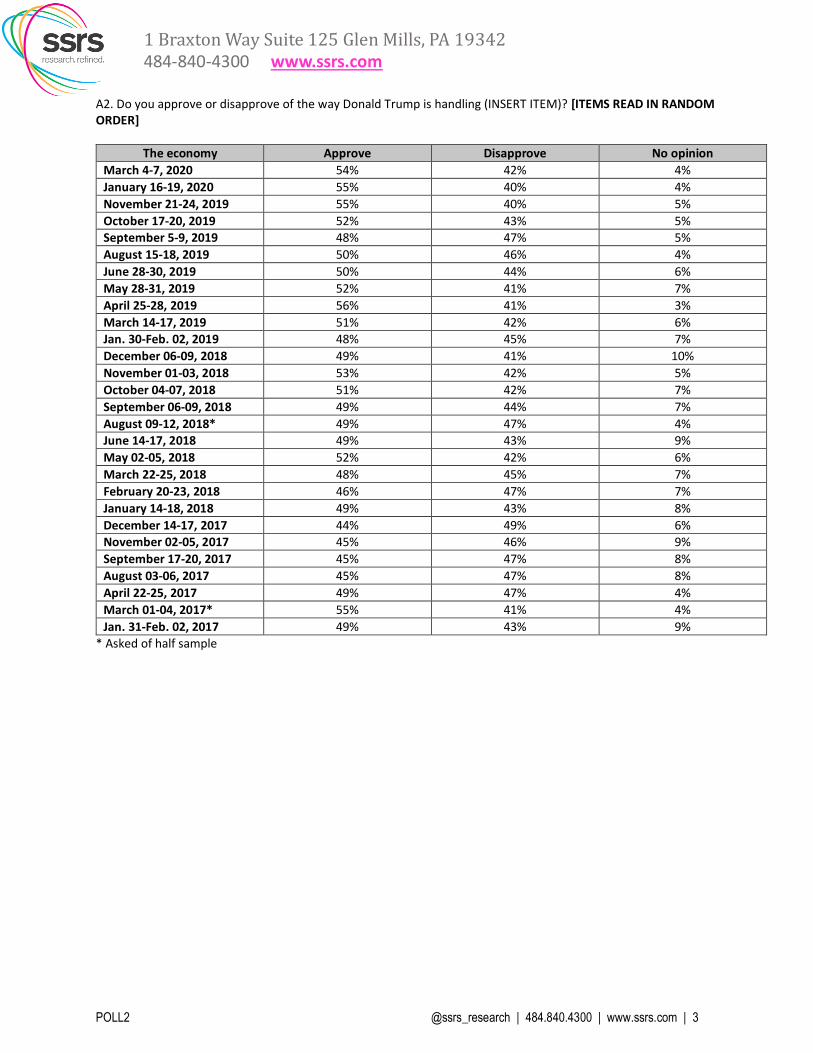
A2. Do you approve or disapprove of the way Donald Trump is handling (INSERT ITEM)? [ITEMS READ IN RANDOM ORDER]
The economy Approve Disapprove No opinion
March 4-7, 2020 54% 42% 4%
January 16-19, 2020 55% 40% 4%
November 21-24, 2019 55% 40% 5%
October 17-20, 2019 52% 43% 5% September 5-9, 2019 48% 47% 5%
August 15-18, 2019 50% 46% 4%
June 28-30, 2019 50% 44% 6%
May 28-31, 2019 52% 41% 7%
April 25-28, 2019 56% 41% 3%
March 14-17, 2019 51% 42% 6% Jan. 30-Feb. 02, 2019 48% 45% 7%
December 06-09, 2018 49% 41% 10%
November 01-03, 2018 53% 42% 5%
October 04-07, 2018 51% 42% 7%
September 06-09, 2018 49% 44% 7%
August 09-12, 2018* 49% 47% 4% June 14-17, 2018 49% 43% 9%
May 02-05, 2018 52% 42% 6%
March 22-25, 2018 48% 45% 7%
February 20-23, 2018 46% 47% 7%
January 14-18, 2018 49% 43% 8%
December 14-17, 2017 44% 49% 6% November 02-05, 2017 45% 46% 9%
September 17-20, 2017 45% 47% 8%
August 03-06, 2017 45% 47% 8%
April 22-25, 2017 49% 47% 4%
March 01-04, 2017* 55% 41% 4%
Jan. 31-Feb. 02, 2017 49% 43% 9% * Asked of half sample
1 Braxton Way Suite 125 Glen Mills, PA 19342
484-840-4300 www.ssrs.com
POLL2 @ssrs_research | 484.840.4300 | www.ssrs.com | 4
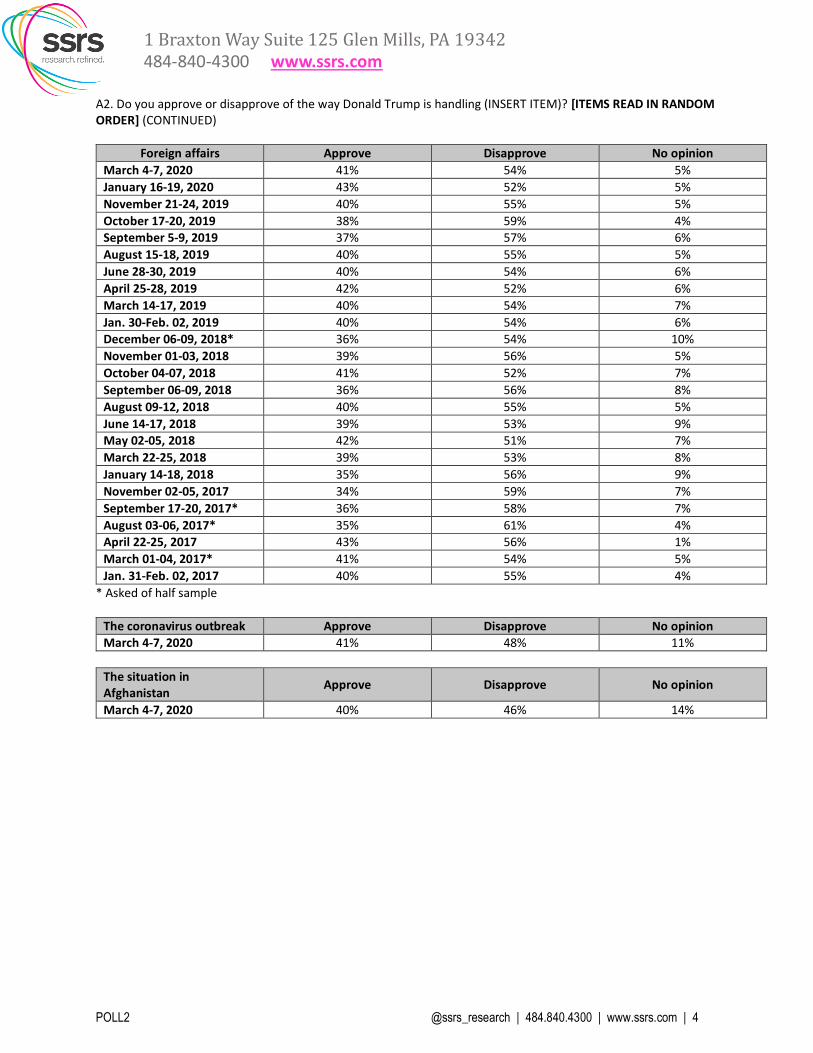
A2. Do you approve or disapprove of the way Donald Trump is handling (INSERT ITEM)? [ITEMS READ IN RANDOM ORDER] (CONTINUED)
Foreign affairs Approve Disapprove No opinion
March 4-7, 2020 41% 54% 5%
January 16-19, 2020 43% 52% 5%
November 21-24, 2019 40% 55% 5%
October 17-20, 2019 38% 59% 4% September 5-9, 2019 37% 57% 6%
August 15-18, 2019 40% 55% 5%
June 28-30, 2019 40% 54% 6%
April 25-28, 2019 42% 52% 6%
March 14-17, 2019 40% 54% 7%
Jan. 30-Feb. 02, 2019 40% 54% 6% December 06-09, 2018* 36% 54% 10%
November 01-03, 2018 39% 56% 5%
October 04-07, 2018 41% 52% 7%
September 06-09, 2018 36% 56% 8%
August 09-12, 2018 40% 55% 5%
June 14-17, 2018 39% 53% 9% May 02-05, 2018 42% 51% 7%
March 22-25, 2018 39% 53% 8%
January 14-18, 2018 35% 56% 9%
November 02-05, 2017 34% 59% 7%
September 17-20, 2017* 36% 58% 7%
August 03-06, 2017* 35% 61% 4% April 22-25, 2017 43% 56% 1%
March 01-04, 2017* 41% 54% 5%
Jan. 31-Feb. 02, 2017 40% 55% 4%
* Asked of half sample
The coronavirus outbreak Approve Disapprove No opinion March 4-7, 2020 41% 48% 11%
The situation in Afghanistan
Approve Disapprove No opinion
March 4-7, 2020 40% 46% 14%
1 Braxton Way Suite 125 Glen Mills, PA 19342
484-840-4300 www.ssrs.com
POLL2 @ssrs_research | 484.840.4300 | www.ssrs.com | 5
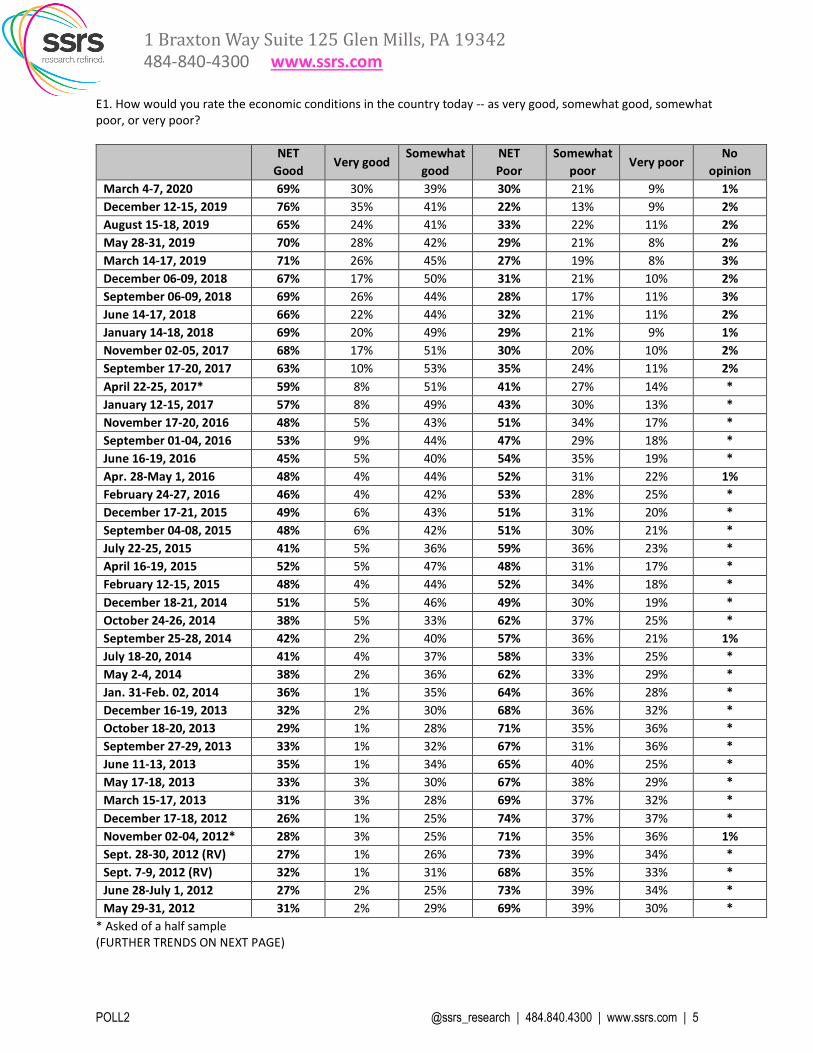
E1. How would you rate the economic conditions in the country today -- as very good, somewhat good, somewhat poor, or very poor?
NET
Good Very good
Somewhat
good
NET
Poor
Somewhat
poor Very poor
No
opinion
March 4-7, 2020 69% 30% 39% 30% 21% 9% 1%
December 12-15, 2019 76% 35% 41% 22% 13% 9% 2%
August 15-18, 2019 65% 24% 41% 33% 22% 11% 2%
May 28-31, 2019 70% 28% 42% 29% 21% 8% 2%
March 14-17, 2019 71% 26% 45% 27% 19% 8% 3%
December 06-09, 2018 67% 17% 50% 31% 21% 10% 2%
September 06-09, 2018 69% 26% 44% 28% 17% 11% 3%
June 14-17, 2018 66% 22% 44% 32% 21% 11% 2%
January 14-18, 2018 69% 20% 49% 29% 21% 9% 1%
November 02-05, 2017 68% 17% 51% 30% 20% 10% 2%
September 17-20, 2017 63% 10% 53% 35% 24% 11% 2%
April 22-25, 2017* 59% 8% 51% 41% 27% 14% *
January 12-15, 2017 57% 8% 49% 43% 30% 13% *
November 17-20, 2016 48% 5% 43% 51% 34% 17% *
September 01-04, 2016 53% 9% 44% 47% 29% 18% *
June 16-19, 2016 45% 5% 40% 54% 35% 19% *
Apr. 28-May 1, 2016 48% 4% 44% 52% 31% 22% 1%
February 24-27, 2016 46% 4% 42% 53% 28% 25% *
December 17-21, 2015 49% 6% 43% 51% 31% 20% *
September 04-08, 2015 48% 6% 42% 51% 30% 21% *
July 22-25, 2015 41% 5% 36% 59% 36% 23% *
April 16-19, 2015 52% 5% 47% 48% 31% 17% *
February 12-15, 2015 48% 4% 44% 52% 34% 18% *
December 18-21, 2014 51% 5% 46% 49% 30% 19% *
October 24-26, 2014 38% 5% 33% 62% 37% 25% *
September 25-28, 2014 42% 2% 40% 57% 36% 21% 1%
July 18-20, 2014 41% 4% 37% 58% 33% 25% *
May 2-4, 2014 38% 2% 36% 62% 33% 29% *
Jan. 31-Feb. 02, 2014 36% 1% 35% 64% 36% 28% *
December 16-19, 2013 32% 2% 30% 68% 36% 32% *
October 18-20, 2013 29% 1% 28% 71% 35% 36% *
September 27-29, 2013 33% 1% 32% 67% 31% 36% *
June 11-13, 2013 35% 1% 34% 65% 40% 25% *
May 17-18, 2013 33% 3% 30% 67% 38% 29% *
March 15-17, 2013 31% 3% 28% 69% 37% 32% *
December 17-18, 2012 26% 1% 25% 74% 37% 37% *
November 02-04, 2012* 28% 3% 25% 71% 35% 36% 1%
Sept. 28-30, 2012 (RV) 27% 1% 26% 73% 39% 34% *
Sept. 7-9, 2012 (RV) 32% 1% 31% 68% 35% 33% *
June 28-July 1, 2012 27% 2% 25% 73% 39% 34% *
May 29-31, 2012 31% 2% 29% 69% 39% 30% *
* Asked of a half sample (FURTHER TRENDS ON NEXT PAGE)
1 Braxton Way Suite 125 Glen Mills, PA 19342
484-840-4300 www.ssrs.com
POLL2 @ssrs_research | 484.840.4300 | www.ssrs.com | 6
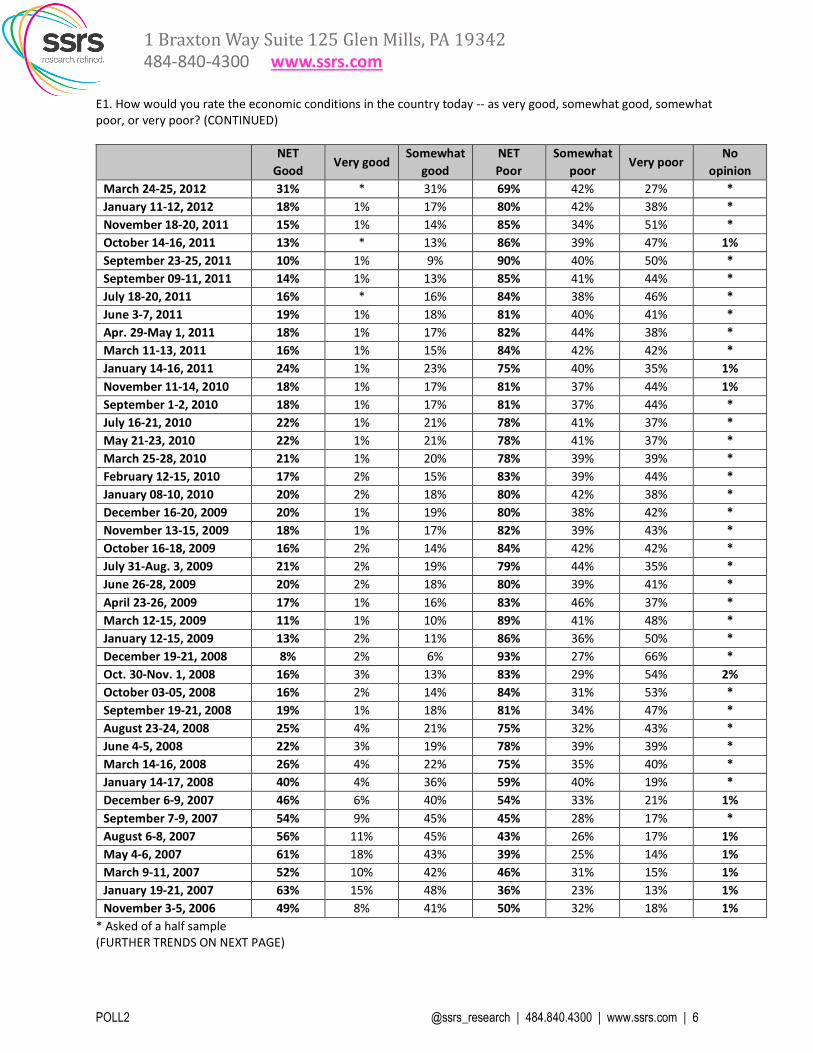
E1. How would you rate the economic conditions in the country today -- as very good, somewhat good, somewhat poor, or very poor? (CONTINUED)
NET
Good Very good
Somewhat
good
NET
Poor
Somewhat
poor Very poor
No
opinion
March 24-25, 2012 31% * 31% 69% 42% 27% *
January 11-12, 2012 18% 1% 17% 80% 42% 38% *
November 18-20, 2011 15% 1% 14% 85% 34% 51% *
October 14-16, 2011 13% * 13% 86% 39% 47% 1%
September 23-25, 2011 10% 1% 9% 90% 40% 50% *
September 09-11, 2011 14% 1% 13% 85% 41% 44% *
July 18-20, 2011 16% * 16% 84% 38% 46% *
June 3-7, 2011 19% 1% 18% 81% 40% 41% *
Apr. 29-May 1, 2011 18% 1% 17% 82% 44% 38% *
March 11-13, 2011 16% 1% 15% 84% 42% 42% *
January 14-16, 2011 24% 1% 23% 75% 40% 35% 1%
November 11-14, 2010 18% 1% 17% 81% 37% 44% 1%
September 1-2, 2010 18% 1% 17% 81% 37% 44% *
July 16-21, 2010 22% 1% 21% 78% 41% 37% *
May 21-23, 2010 22% 1% 21% 78% 41% 37% *
March 25-28, 2010 21% 1% 20% 78% 39% 39% *
February 12-15, 2010 17% 2% 15% 83% 39% 44% *
January 08-10, 2010 20% 2% 18% 80% 42% 38% *
December 16-20, 2009 20% 1% 19% 80% 38% 42% *
November 13-15, 2009 18% 1% 17% 82% 39% 43% *
October 16-18, 2009 16% 2% 14% 84% 42% 42% *
July 31-Aug. 3, 2009 21% 2% 19% 79% 44% 35% *
June 26-28, 2009 20% 2% 18% 80% 39% 41% *
April 23-26, 2009 17% 1% 16% 83% 46% 37% *
March 12-15, 2009 11% 1% 10% 89% 41% 48% *
January 12-15, 2009 13% 2% 11% 86% 36% 50% *
December 19-21, 2008 8% 2% 6% 93% 27% 66% *
Oct. 30-Nov. 1, 2008 16% 3% 13% 83% 29% 54% 2%
October 03-05, 2008 16% 2% 14% 84% 31% 53% *
September 19-21, 2008 19% 1% 18% 81% 34% 47% *
August 23-24, 2008 25% 4% 21% 75% 32% 43% *
June 4-5, 2008 22% 3% 19% 78% 39% 39% *
March 14-16, 2008 26% 4% 22% 75% 35% 40% *
January 14-17, 2008 40% 4% 36% 59% 40% 19% *
December 6-9, 2007 46% 6% 40% 54% 33% 21% 1%
September 7-9, 2007 54% 9% 45% 45% 28% 17% *
August 6-8, 2007 56% 11% 45% 43% 26% 17% 1%
May 4-6, 2007 61% 18% 43% 39% 25% 14% 1%
March 9-11, 2007 52% 10% 42% 46% 31% 15% 1%
January 19-21, 2007 63% 15% 48% 36% 23% 13% 1%
November 3-5, 2006 49% 8% 41% 50% 32% 18% 1%
* Asked of a half sample (FURTHER TRENDS ON NEXT PAGE)
1 Braxton Way Suite 125 Glen Mills, PA 19342
484-840-4300 www.ssrs.com
POLL2 @ssrs_research | 484.840.4300 | www.ssrs.com | 7
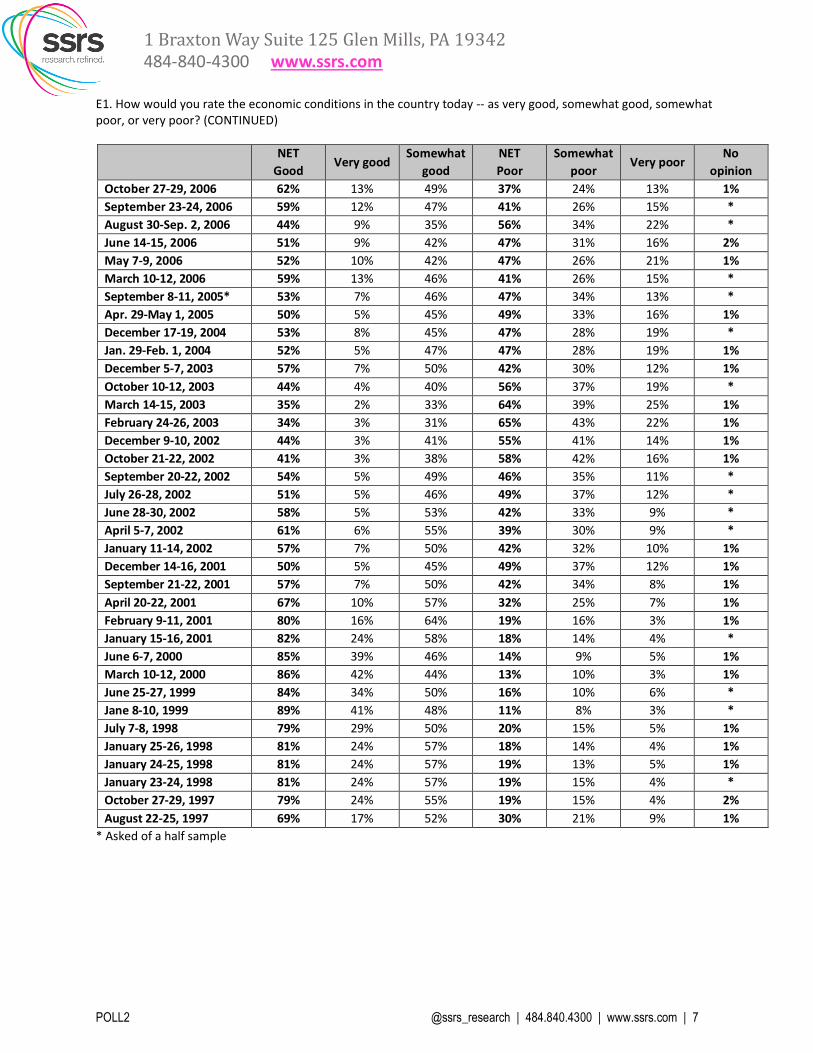
E1. How would you rate the economic conditions in the country today -- as very good, somewhat good, somewhat poor, or very poor? (CONTINUED)
NET
Good Very good
Somewhat
good
NET
Poor
Somewhat
poor Very poor
No
opinion
October 27-29, 2006 62% 13% 49% 37% 24% 13% 1%
September 23-24, 2006 59% 12% 47% 41% 26% 15% *
August 30-Sep. 2, 2006 44% 9% 35% 56% 34% 22% *
June 14-15, 2006 51% 9% 42% 47% 31% 16% 2%
May 7-9, 2006 52% 10% 42% 47% 26% 21% 1%
March 10-12, 2006 59% 13% 46% 41% 26% 15% *
September 8-11, 2005* 53% 7% 46% 47% 34% 13% *
Apr. 29-May 1, 2005 50% 5% 45% 49% 33% 16% 1%
December 17-19, 2004 53% 8% 45% 47% 28% 19% *
Jan. 29-Feb. 1, 2004 52% 5% 47% 47% 28% 19% 1%
December 5-7, 2003 57% 7% 50% 42% 30% 12% 1%
October 10-12, 2003 44% 4% 40% 56% 37% 19% *
March 14-15, 2003 35% 2% 33% 64% 39% 25% 1%
February 24-26, 2003 34% 3% 31% 65% 43% 22% 1%
December 9-10, 2002 44% 3% 41% 55% 41% 14% 1%
October 21-22, 2002 41% 3% 38% 58% 42% 16% 1%
September 20-22, 2002 54% 5% 49% 46% 35% 11% *
July 26-28, 2002 51% 5% 46% 49% 37% 12% *
June 28-30, 2002 58% 5% 53% 42% 33% 9% *
April 5-7, 2002 61% 6% 55% 39% 30% 9% *
January 11-14, 2002 57% 7% 50% 42% 32% 10% 1%
December 14-16, 2001 50% 5% 45% 49% 37% 12% 1%
September 21-22, 2001 57% 7% 50% 42% 34% 8% 1%
April 20-22, 2001 67% 10% 57% 32% 25% 7% 1%
February 9-11, 2001 80% 16% 64% 19% 16% 3% 1%
January 15-16, 2001 82% 24% 58% 18% 14% 4% *
June 6-7, 2000 85% 39% 46% 14% 9% 5% 1%
March 10-12, 2000 86% 42% 44% 13% 10% 3% 1%
June 25-27, 1999 84% 34% 50% 16% 10% 6% *
Jane 8-10, 1999 89% 41% 48% 11% 8% 3% *
July 7-8, 1998 79% 29% 50% 20% 15% 5% 1%
January 25-26, 1998 81% 24% 57% 18% 14% 4% 1%
January 24-25, 1998 81% 24% 57% 19% 13% 5% 1%
January 23-24, 1998 81% 24% 57% 19% 15% 4% *
October 27-29, 1997 79% 24% 55% 19% 15% 4% 2%
August 22-25, 1997 69% 17% 52% 30% 21% 9% 1%
* Asked of a half sample
1 Braxton Way Suite 125 Glen Mills, PA 19342
484-840-4300 www.ssrs.com
POLL2 @ssrs_research | 484.840.4300 | www.ssrs.com | 8
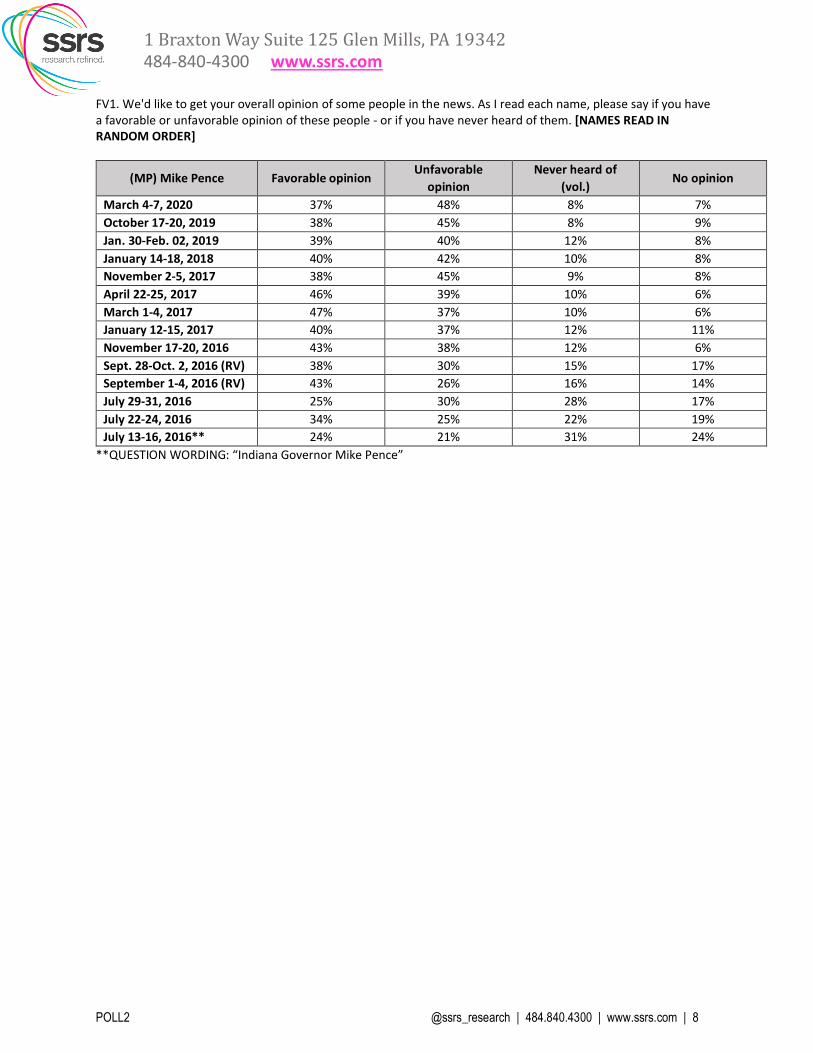
FV1. We'd like to get your overall opinion of some people in the news. As I read each name, please say if you have a favorable or unfavorable opinion of these people - or if you have never heard of them. [NAMES READ IN RANDOM ORDER]
(MP) Mike Pence Favorable opinion Unfavorable
opinion
Never heard of
(vol.) No opinion
March 4-7, 2020 37% 48% 8% 7%
October 17-20, 2019 38% 45% 8% 9%
Jan. 30-Feb. 02, 2019 39% 40% 12% 8%
January 14-18, 2018 40% 42% 10% 8%
November 2-5, 2017 38% 45% 9% 8%
April 22-25, 2017 46% 39% 10% 6%
March 1-4, 2017 47% 37% 10% 6%
January 12-15, 2017 40% 37% 12% 11%
November 17-20, 2016 43% 38% 12% 6%
Sept. 28-Oct. 2, 2016 (RV) 38% 30% 15% 17%
September 1-4, 2016 (RV) 43% 26% 16% 14%
July 29-31, 2016 25% 30% 28% 17%
July 22-24, 2016 34% 25% 22% 19%
July 13-16, 2016** 24% 21% 31% 24%
**QUESTION WORDING: “Indiana Governor Mike Pence”
1 Braxton Way Suite 125 Glen Mills, PA 19342
484-840-4300 www.ssrs.com
POLL2 @ssrs_research | 484.840.4300 | www.ssrs.com | 9
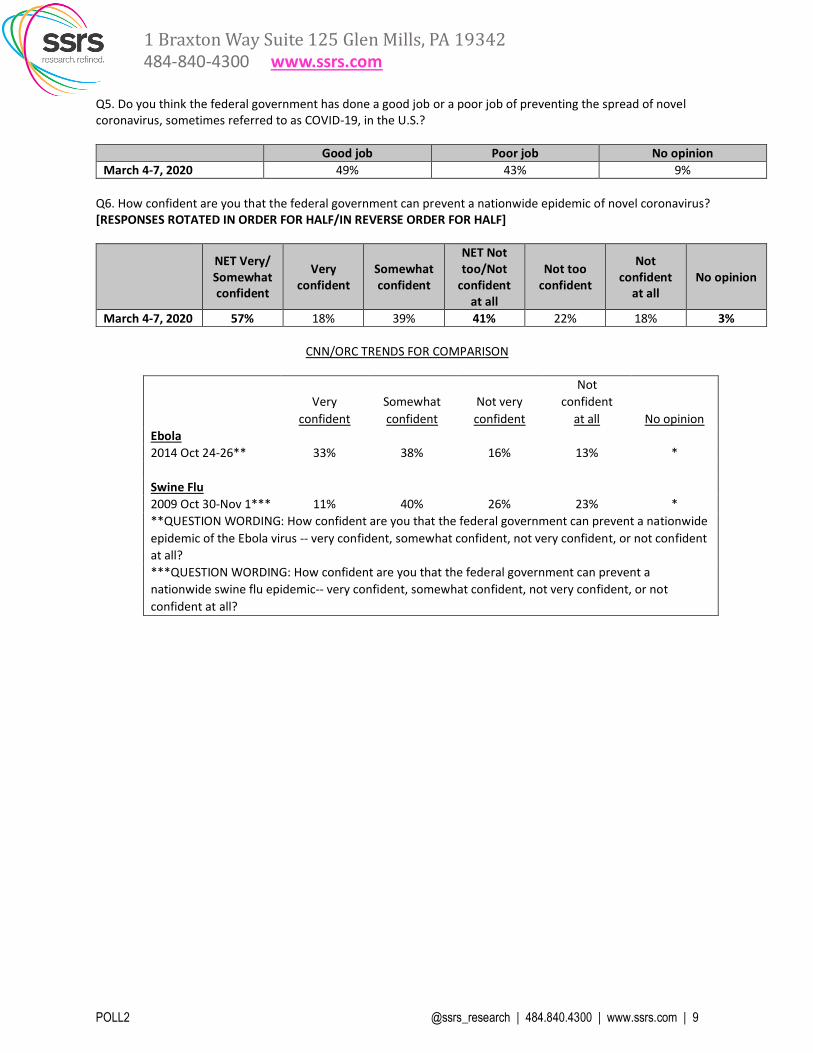
Q5. Do you think the federal government has done a good job or a poor job of preventing the spread of novel coronavirus, sometimes referred to as COVID-19, in the U.S.?
Good job Poor job No opinion
March 4-7, 2020 49% 43% 9%
Q6. How confident are you that the federal government can prevent a nationwide epidemic of novel coronavirus? [RESPONSES ROTATED IN ORDER FOR HALF/IN REVERSE ORDER FOR HALF]
NET Very/ Somewhat confident
Very confident
Somewhat confident
NET Not too/Not
confident at all
Not too confident
Not confident
at all No opinion
March 4-7, 2020 57% 18% 39% 41% 22% 18% 3%
CNN/ORC TRENDS FOR COMPARISON
Very
confident
Somewhat
confident
Not very
confident
Not
confident
at all No opinion
Ebola
2014 Oct 24-26** 33% 38% 16% 13% *
Swine Flu
2009 Oct 30-Nov 1*** 11% 40% 26% 23% *
**QUESTION WORDING: How confident are you that the federal government can prevent a nationwide
epidemic of the Ebola virus -- very confident, somewhat confident, not very confident, or not confident
at all?
***QUESTION WORDING: How confident are you that the federal government can prevent a
nationwide swine flu epidemic-- very confident, somewhat confident, not very confident, or not
confident at all?
1 Braxton Way Suite 125 Glen Mills, PA 19342
484-840-4300 www.ssrs.com
POLL2 @ssrs_research | 484.840.4300 | www.ssrs.com | 10
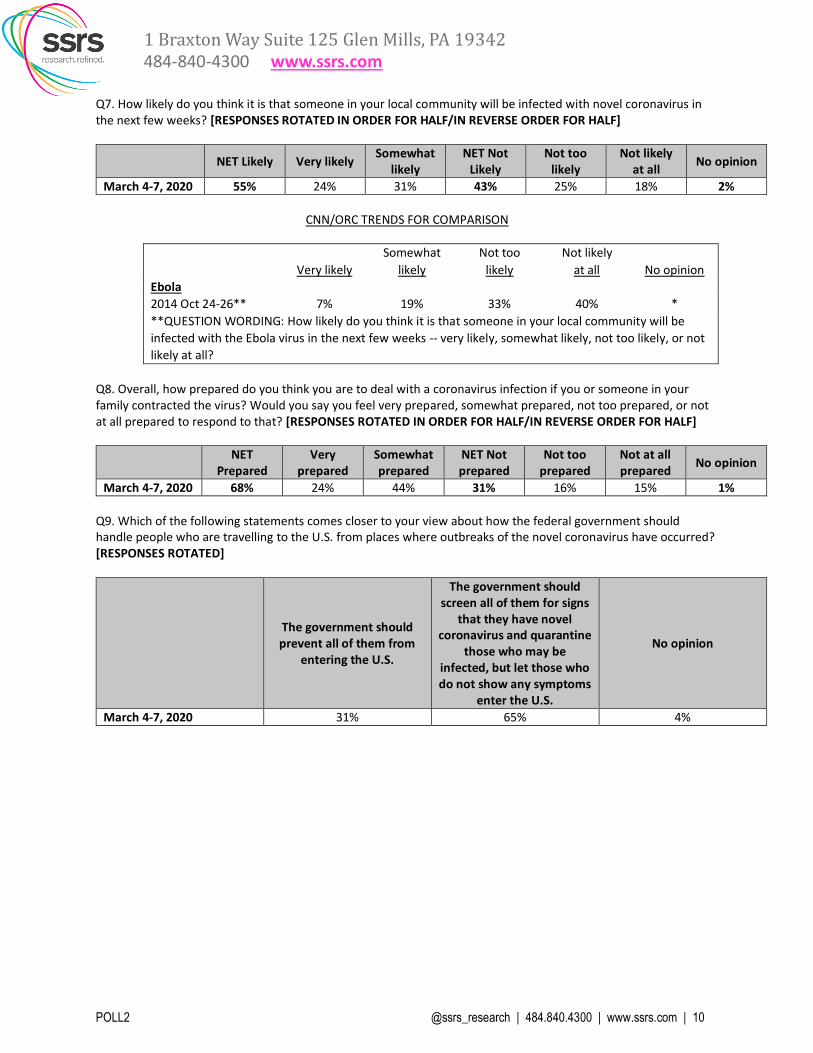
Q7. How likely do you think it is that someone in your local community will be infected with novel coronavirus in the next few weeks? [RESPONSES ROTATED IN ORDER FOR HALF/IN REVERSE ORDER FOR HALF]
NET Likely Very likely
Somewhat likely
NET Not Likely
Not too likely
Not likely at all
No opinion
March 4-7, 2020 55% 24% 31% 43% 25% 18% 2%
CNN/ORC TRENDS FOR COMPARISON
Very likely
Somewhat
likely
Not too
likely
Not likely
at all No opinion
Ebola
2014 Oct 24-26** 7% 19% 33% 40% *
**QUESTION WORDING: How likely do you think it is that someone in your local community will be
infected with the Ebola virus in the next few weeks -- very likely, somewhat likely, not too likely, or not
likely at all?
Q8. Overall, how prepared do you think you are to deal with a coronavirus infection if you or someone in your family contracted the virus? Would you say you feel very prepared, somewhat prepared, not too prepared, or not at all prepared to respond to that? [RESPONSES ROTATED IN ORDER FOR HALF/IN REVERSE ORDER FOR HALF]
NET Prepared
Very prepared
Somewhat prepared
NET Not prepared
Not too prepared
Not at all prepared
No opinion
March 4-7, 2020 68% 24% 44% 31% 16% 15% 1%
Q9. Which of the following statements comes closer to your view about how the federal government should handle people who are travelling to the U.S. from places where outbreaks of the novel coronavirus have occurred? [RESPONSES ROTATED]
The government should prevent all of them from
entering the U.S.
The government should screen all of them for signs
that they have novel coronavirus and quarantine
those who may be infected, but let those who do not show any symptoms
enter the U.S.
No opinion
March 4-7, 2020 31% 65% 4%
1 Braxton Way Suite 125 Glen Mills, PA 19342
484-840-4300 www.ssrs.com
POLL2 @ssrs_research | 484.840.4300 | www.ssrs.com | 11
MORE ON METHODOLOGY A total of 1,211 adults, including an oversample of 206 adults living in 15 battleground states: Arizona, Colorado, Florida, Georgia, Maine, Michigan, Minnesota, Nevada, New Hampshire, New Mexico, North Carolina, Ohio, Pennsylvania, Virginia, and Wisconsin, were interviewed by telephone nationwide by live interviewers calling both landline and cell phones. Oversampled states have been weighted to represent their proper share of the adult population. Interviews were conducted in English and Spanish. Among the entire sample, 34% described themselves as Democrats, 29% described themselves as Republicans, and 37% described themselves as independents or members of another party. All respondents were asked questions concerning basic demographics, and the entire sample was weighted to reflect national Census figures for gender, race, age, education, region of country, and telephone usage. Results for the full sample have a margin of sampling error of +/- 3.3 percentage points. For the sample of 1,084 registered voters, it is +/- 3.5 percentage points. For the subset of 540 Democrats and Democratic-leaning independents who are registered to vote, it is +/- 5.0 percentage points. For the subset of 573 adults living in the 15 battleground states, it is +/- 5.0 percentage points. Interviews were conducted among a representative sample of the adult population, age 18 or older, of the United States. Members of demographic groups not shown in the published crosstabs are represented in the results for each question in the poll. Crosstabs on the pages that follow only include results for subgroups with a minimum n=125 unweighted cases. Results for subgroups with fewer than n=125 unweighted cases are not displayed and instead are denoted with "SN" because samples of that size carry larger margins of sampling error and can be too small to be projectable with confidence to their true values in the population.

1 Braxton Way Suite 125 Glen Mills, PA 19342
484-840-4300 www.ssrs.com
POLL2 @ssrs_research | 484.840.4300 | www.ssrs.com | 12
CNN/SSRS Poll -- March 04, 2020 to March 07, 2020
TABLE 001
Question A1
A1. Do you approve or disapprove of the way Donald Trump is handling his job as president?
Base: Total Respondents
Trump Trump
Non- ap- disap
Total Men Women White white prove prove
===== ===== ===== ===== ===== ===== =====
Approve 43% 51% 35% 52% 25% 100% 0%
Disapprove 53% 46% 60% 44% 69% 0% 100%
Don't know/Undecided/Refused 4% 3% 5% 3% 6% 0% 0%
Sampling Error (+/-) 3.3 4.3 5.0 3.9 5.9 4.9 4.6
Total 18-34 35-49 50-64 65+ <45 45+
===== ===== ===== ===== ===== ===== =====
Approve 43% 29% 51% 52% 42% 36% 49%
Disapprove 53% 68% 44% 43% 56% 60% 48%
Don't know/Undecided/Refused 4% 4% 5% 5% 3% 5% 4%
Sampling Error (+/-) 3.3 6.8 7.4 6.2 5.5 5.4 4.0
Non- White White
coll. Coll. non- coll.
Total <$50K $50K+ grad grad. coll. grad.
===== ===== ===== ===== ===== ===== =====
Approve 43% 37% 47% 45% 37% 60% 40%
Disapprove 53% 58% 50% 50% 59% 37% 57%
Don't know/Undecided/Refused 4% 5% 3% 4% 4% 3% 3%
Sampling Error (+/-) 3.3 5.6 4.3 4.3 5.0 5.3 5.8
Indep Con
Demo- endnt Repub Lib- Mode- serva
Total crat Other lican eral rate tive
===== ===== ===== ===== ===== ===== =====
Approve 43% 7% 37% 90% 10% 33% 77%
Disapprove 53% 91% 56% 8% 88% 61% 20%
Don't know/Undecided/Refused 4% 2% 7% 2% 2% 7% 2%
Sampling Error (+/-) 3.3 5.7 5.6 6.0 6.8 5.3 5.6
RV: RV: RV:
Lean Lean Extr. Very Less
Demo- Repub Reg. Enthu Enthu Enthu
Total crat lican voter Pres Pres Pres
===== ===== ===== ===== ===== ===== =====
Approve 43% 8% 87% 45% 53% 47% 33%
Disapprove 53% 89% 10% 52% 46% 50% 61%
Don't know/Undecided/Refused 4% 3% 3% 3% 1% 2% 6%
Sampling Error (+/-) 3.3 4.7 4.9 3.5 5.4 6.5 6.2
1 Braxton Way Suite 125 Glen Mills, PA 19342
484-840-4300 www.ssrs.com
POLL2 @ssrs_research | 484.840.4300 | www.ssrs.com | 13
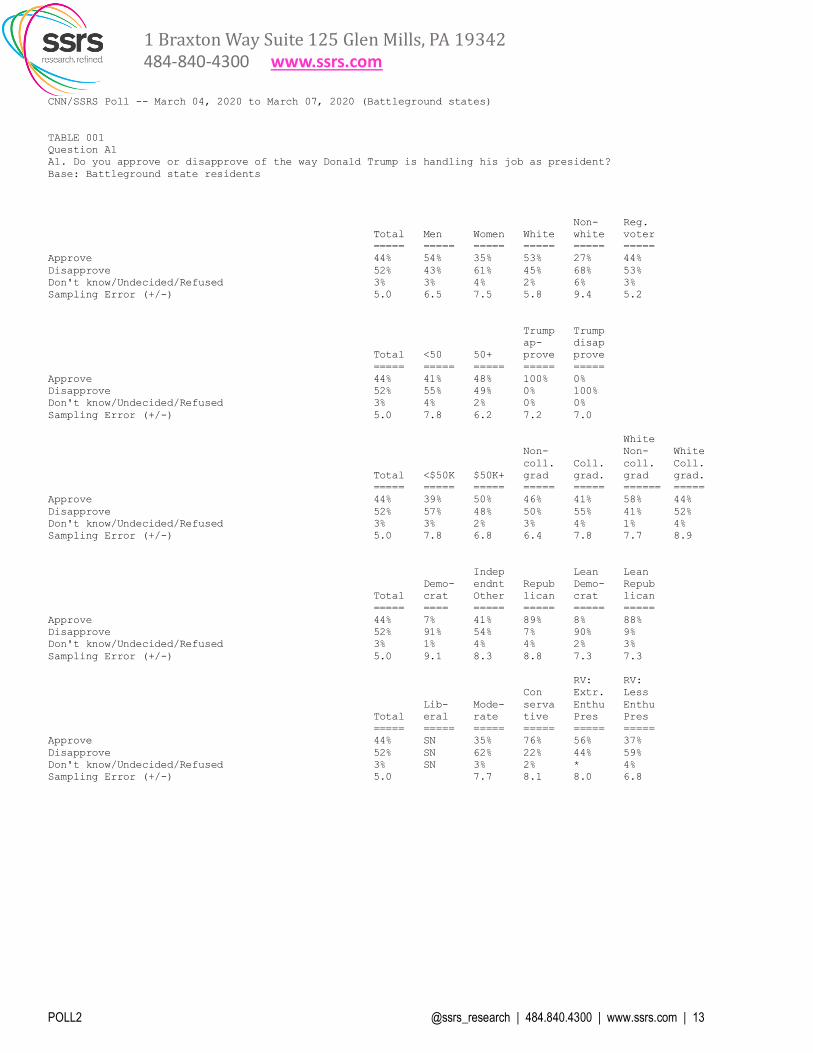
CNN/SSRS Poll -- March 04, 2020 to March 07, 2020 (Battleground states)
TABLE 001
Question A1
A1. Do you approve or disapprove of the way Donald Trump is handling his job as president?
Base: Battleground state residents
Non- Reg.
Total Men Women White white voter
===== ===== ===== ===== ===== =====
Approve 44% 54% 35% 53% 27% 44%
Disapprove 52% 43% 61% 45% 68% 53%
Don't know/Undecided/Refused 3% 3% 4% 2% 6% 3%
Sampling Error (+/-) 5.0 6.5 7.5 5.8 9.4 5.2
Trump Trump
ap- disap
Total <50 50+ prove prove
===== ===== ===== ===== =====
Approve 44% 41% 48% 100% 0%
Disapprove 52% 55% 49% 0% 100%
Don't know/Undecided/Refused 3% 4% 2% 0% 0%
Sampling Error (+/-) 5.0 7.8 6.2 7.2 7.0
White
Non- Non- White
coll. Coll. coll. Coll.
Total <$50K $50K+ grad grad. grad grad.
===== ===== ===== ===== ===== ====== =====
Approve 44% 39% 50% 46% 41% 58% 44%
Disapprove 52% 57% 48% 50% 55% 41% 52%
Don't know/Undecided/Refused 3% 3% 2% 3% 4% 1% 4%
Sampling Error (+/-) 5.0 7.8 6.8 6.4 7.8 7.7 8.9
Indep Lean Lean
Demo- endnt Repub Demo- Repub
Total crat Other lican crat lican
===== ==== ===== ===== ===== =====
Approve 44% 7% 41% 89% 8% 88%
Disapprove 52% 91% 54% 7% 90% 9%
Don't know/Undecided/Refused 3% 1% 4% 4% 2% 3%
Sampling Error (+/-) 5.0 9.1 8.3 8.8 7.3 7.3
RV: RV:
Con Extr. Less
Lib- Mode- serva Enthu Enthu
Total eral rate tive Pres Pres
===== ===== ===== ===== ===== =====
Approve 44% SN 35% 76% 56% 37%
Disapprove 52% SN 62% 22% 44% 59%
Don't know/Undecided/Refused 3% SN 3% 2% * 4%
Sampling Error (+/-) 5.0 7.7 8.1 8.0 6.8
1 Braxton Way Suite 125 Glen Mills, PA 19342
484-840-4300 www.ssrs.com
POLL2 @ssrs_research | 484.840.4300 | www.ssrs.com | 14
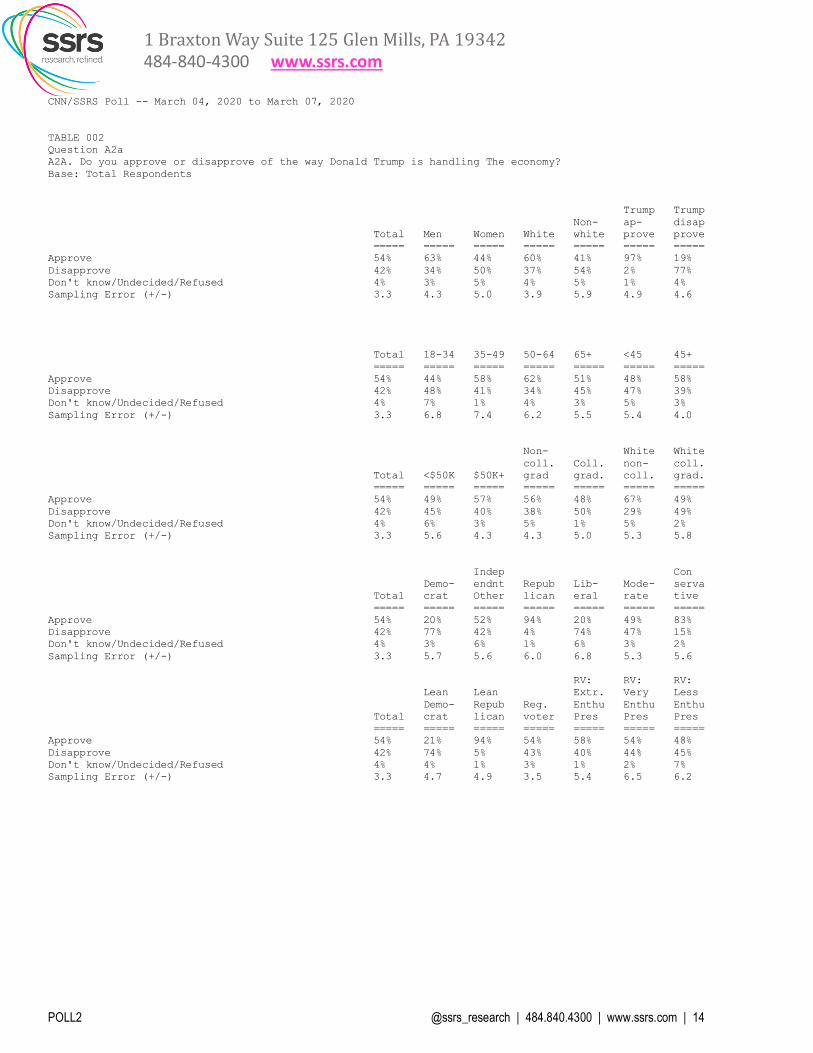
CNN/SSRS Poll -- March 04, 2020 to March 07, 2020
TABLE 002
Question A2a
A2A. Do you approve or disapprove of the way Donald Trump is handling The economy?
Base: Total Respondents
Trump Trump
Non- ap- disap
Total Men Women White white prove prove
===== ===== ===== ===== ===== ===== =====
Approve 54% 63% 44% 60% 41% 97% 19%
Disapprove 42% 34% 50% 37% 54% 2% 77%
Don't know/Undecided/Refused 4% 3% 5% 4% 5% 1% 4%
Sampling Error (+/-) 3.3 4.3 5.0 3.9 5.9 4.9 4.6
Total 18-34 35-49 50-64 65+ <45 45+
===== ===== ===== ===== ===== ===== =====
Approve 54% 44% 58% 62% 51% 48% 58%
Disapprove 42% 48% 41% 34% 45% 47% 39%
Don't know/Undecided/Refused 4% 7% 1% 4% 3% 5% 3%
Sampling Error (+/-) 3.3 6.8 7.4 6.2 5.5 5.4 4.0
Non- White White
coll. Coll. non- coll.
Total <$50K $50K+ grad grad. coll. grad.
===== ===== ===== ===== ===== ===== =====
Approve 54% 49% 57% 56% 48% 67% 49%
Disapprove 42% 45% 40% 38% 50% 29% 49%
Don't know/Undecided/Refused 4% 6% 3% 5% 1% 5% 2%
Sampling Error (+/-) 3.3 5.6 4.3 4.3 5.0 5.3 5.8
Indep Con
Demo- endnt Repub Lib- Mode- serva
Total crat Other lican eral rate tive
===== ===== ===== ===== ===== ===== =====
Approve 54% 20% 52% 94% 20% 49% 83%
Disapprove 42% 77% 42% 4% 74% 47% 15%
Don't know/Undecided/Refused 4% 3% 6% 1% 6% 3% 2%
Sampling Error (+/-) 3.3 5.7 5.6 6.0 6.8 5.3 5.6
RV: RV: RV:
Lean Lean Extr. Very Less
Demo- Repub Reg. Enthu Enthu Enthu
Total crat lican voter Pres Pres Pres
===== ===== ===== ===== ===== ===== =====
Approve 54% 21% 94% 54% 58% 54% 48%
Disapprove 42% 74% 5% 43% 40% 44% 45%
Don't know/Undecided/Refused 4% 4% 1% 3% 1% 2% 7%
Sampling Error (+/-) 3.3 4.7 4.9 3.5 5.4 6.5 6.2

1 Braxton Way Suite 125 Glen Mills, PA 19342
484-840-4300 www.ssrs.com
POLL2 @ssrs_research | 484.840.4300 | www.ssrs.com | 15
CNN/SSRS Poll -- March 04, 2020 to March 07, 2020 (Battleground states)
TABLE 002
Question A2a
A2A. Do you approve or disapprove of the way Donald Trump is handling The economy?
Base: Battleground state residents
Non- Reg.
Total Men Women White white voter
===== ===== ===== ===== ===== =====
Approve 54% 66% 43% 60% 41% 54%
Disapprove 43% 31% 54% 37% 55% 44%
Don't know/Undecided/Refused 3% 4% 3% 3% 4% 2%
Sampling Error (+/-) 5.0 6.5 7.5 5.8 9.4 5.2
Trump Trump
ap- disap
Total <50 50+ prove prove
===== ===== ===== ===== =====
Approve 54% 52% 57% 94% 19%
Disapprove 43% 45% 40% 3% 78%
Don't know/Undecided/Refused 3% 3% 3% 2% 3%
Sampling Error (+/-) 5.0 7.8 6.2 7.2 7.0
White
Non- Non- White
coll. Coll. coll. Coll.
Total <$50K $50K+ grad grad. grad grad.
===== ===== ===== ===== ===== ====== =====
Approve 54% 47% 62% 55% 54% 62% 56%
Disapprove 43% 48% 37% 41% 46% 33% 44%
Don't know/Undecided/Refused 3% 5% 1% 5% * 5% 0%
Sampling Error (+/-) 5.0 7.8 6.8 6.4 7.8 7.7 8.9
Indep Lean Lean
Demo- endnt Repub Demo- Repub
Total crat Other lican crat lican
===== ==== ===== ===== ===== =====
Approve 54% 19% 52% 94% 21% 93%
Disapprove 43% 79% 42% 4% 76% 5%
Don't know/Undecided/Refused 3% 1% 6% 2% 2% 2%
Sampling Error (+/-) 5.0 9.1 8.3 8.8 7.3 7.3
RV: RV:
Con Extr. Less
Lib- Mode- serva Enthu Enthu
Total eral rate tive Pres Pres
===== ===== ===== ===== ===== =====
Approve 54% SN 49% 80% 60% 50%
Disapprove 43% SN 48% 18% 39% 47%
Don't know/Undecided/Refused 3% SN 3% 2% 1% 3%
Sampling Error (+/-) 5.0 7.7 8.1 8.0 6.8

1 Braxton Way Suite 125 Glen Mills, PA 19342
484-840-4300 www.ssrs.com
POLL2 @ssrs_research | 484.840.4300 | www.ssrs.com | 16
CNN/SSRS Poll -- March 04, 2020 to March 07, 2020
TABLE 003
Question A2f
A2F. Do you approve or disapprove of the way Donald Trump is handling Foreign affairs?
Base: Total Respondents
Trump Trump
Non- ap- disap
Total Men Women White white prove prove
===== ===== ===== ===== ===== ===== =====
Approve 41% 50% 32% 51% 23% 88% 5%
Disapprove 54% 45% 62% 45% 69% 8% 92%
Don't know/Undecided/Refused 5% 5% 6% 4% 8% 4% 3%
Sampling Error (+/-) 3.3 4.3 5.0 3.9 5.9 4.9 4.6
Total 18-34 35-49 50-64 65+ <45 45+
===== ===== ===== ===== ===== ===== =====
Approve 41% 26% 49% 50% 42% 33% 47%
Disapprove 54% 66% 45% 45% 56% 59% 49%
Don't know/Undecided/Refused 5% 8% 5% 5% 2% 8% 4%
Sampling Error (+/-) 3.3 6.8 7.4 6.2 5.5 5.4 4.0
Non- White White
coll. Coll. non- coll.
Total <$50K $50K+ grad grad. coll. grad.
===== ===== ===== ===== ===== ===== =====
Approve 41% 36% 45% 43% 36% 58% 39%
Disapprove 54% 56% 52% 50% 61% 37% 59%
Don't know/Undecided/Refused 5% 8% 3% 7% 3% 5% 2%
Sampling Error (+/-) 3.3 5.6 4.3 4.3 5.0 5.3 5.8
Indep Con
Demo- endnt Repub Lib- Mode- serva
Total crat Other lican eral rate tive
===== ===== ===== ===== ===== ===== =====
Approve 41% 8% 35% 87% 11% 31% 73%
Disapprove 54% 90% 55% 10% 86% 63% 22%
Don't know/Undecided/Refused 5% 2% 9% 4% 3% 6% 4%
Sampling Error (+/-) 3.3 5.7 5.6 6.0 6.8 5.3 5.6
RV: RV: RV:
Lean Lean Extr. Very Less
Demo- Repub Reg. Enthu Enthu Enthu
Total crat lican voter Pres Pres Pres
===== ===== ===== ===== ===== ===== =====
Approve 41% 8% 83% 42% 52% 46% 26%
Disapprove 54% 88% 14% 54% 46% 51% 66%
Don't know/Undecided/Refused 5% 4% 4% 4% 1% 3% 8%
Sampling Error (+/-) 3.3 4.7 4.9 3.5 5.4 6.5 6.2
1 Braxton Way Suite 125 Glen Mills, PA 19342
484-840-4300 www.ssrs.com
POLL2 @ssrs_research | 484.840.4300 | www.ssrs.com | 17
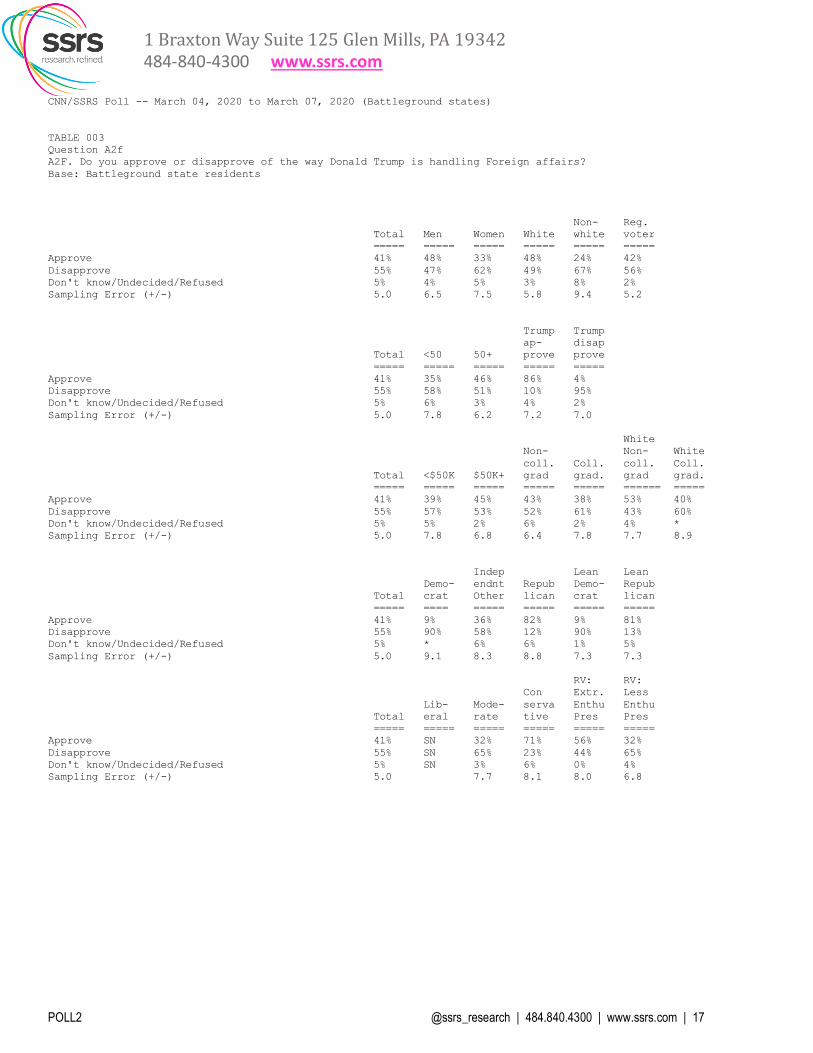
CNN/SSRS Poll -- March 04, 2020 to March 07, 2020 (Battleground states)
TABLE 003
Question A2f
A2F. Do you approve or disapprove of the way Donald Trump is handling Foreign affairs?
Base: Battleground state residents
Non- Reg.
Total Men Women White white voter
===== ===== ===== ===== ===== =====
Approve 41% 48% 33% 48% 24% 42%
Disapprove 55% 47% 62% 49% 67% 56%
Don't know/Undecided/Refused 5% 4% 5% 3% 8% 2%
Sampling Error (+/-) 5.0 6.5 7.5 5.8 9.4 5.2
Trump Trump
ap- disap
Total <50 50+ prove prove
===== ===== ===== ===== =====
Approve 41% 35% 46% 86% 4%
Disapprove 55% 58% 51% 10% 95%
Don't know/Undecided/Refused 5% 6% 3% 4% 2%
Sampling Error (+/-) 5.0 7.8 6.2 7.2 7.0
White
Non- Non- White
coll. Coll. coll. Coll.
Total <$50K $50K+ grad grad. grad grad.
===== ===== ===== ===== ===== ====== =====
Approve 41% 39% 45% 43% 38% 53% 40%
Disapprove 55% 57% 53% 52% 61% 43% 60%
Don't know/Undecided/Refused 5% 5% 2% 6% 2% 4% *
Sampling Error (+/-) 5.0 7.8 6.8 6.4 7.8 7.7 8.9
Indep Lean Lean
Demo- endnt Repub Demo- Repub
Total crat Other lican crat lican
===== ==== ===== ===== ===== =====
Approve 41% 9% 36% 82% 9% 81%
Disapprove 55% 90% 58% 12% 90% 13%
Don't know/Undecided/Refused 5% * 6% 6% 1% 5%
Sampling Error (+/-) 5.0 9.1 8.3 8.8 7.3 7.3
RV: RV:
Con Extr. Less
Lib- Mode- serva Enthu Enthu
Total eral rate tive Pres Pres
===== ===== ===== ===== ===== =====
Approve 41% SN 32% 71% 56% 32%
Disapprove 55% SN 65% 23% 44% 65%
Don't know/Undecided/Refused 5% SN 3% 6% 0% 4%
Sampling Error (+/-) 5.0 7.7 8.1 8.0 6.8
1 Braxton Way Suite 125 Glen Mills, PA 19342
484-840-4300 www.ssrs.com
POLL2 @ssrs_research | 484.840.4300 | www.ssrs.com | 18
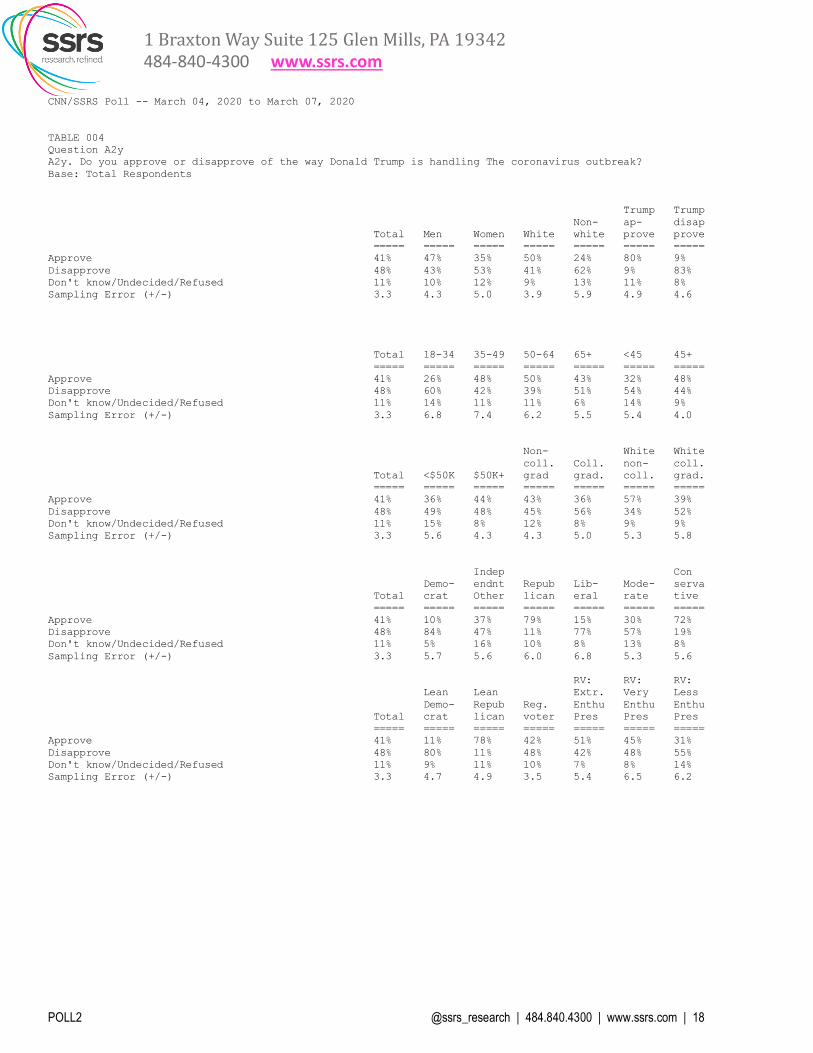
CNN/SSRS Poll -- March 04, 2020 to March 07, 2020
TABLE 004
Question A2y
A2y. Do you approve or disapprove of the way Donald Trump is handling The coronavirus outbreak?
Base: Total Respondents
Trump Trump
Non- ap- disap
Total Men Women White white prove prove
===== ===== ===== ===== ===== ===== =====
Approve 41% 47% 35% 50% 24% 80% 9%
Disapprove 48% 43% 53% 41% 62% 9% 83%
Don't know/Undecided/Refused 11% 10% 12% 9% 13% 11% 8%
Sampling Error (+/-) 3.3 4.3 5.0 3.9 5.9 4.9 4.6
Total 18-34 35-49 50-64 65+ <45 45+
===== ===== ===== ===== ===== ===== =====
Approve 41% 26% 48% 50% 43% 32% 48%
Disapprove 48% 60% 42% 39% 51% 54% 44%
Don't know/Undecided/Refused 11% 14% 11% 11% 6% 14% 9%
Sampling Error (+/-) 3.3 6.8 7.4 6.2 5.5 5.4 4.0
Non- White White
coll. Coll. non- coll.
Total <$50K $50K+ grad grad. coll. grad.
===== ===== ===== ===== ===== ===== =====
Approve 41% 36% 44% 43% 36% 57% 39%
Disapprove 48% 49% 48% 45% 56% 34% 52%
Don't know/Undecided/Refused 11% 15% 8% 12% 8% 9% 9%
Sampling Error (+/-) 3.3 5.6 4.3 4.3 5.0 5.3 5.8
Indep Con
Demo- endnt Repub Lib- Mode- serva
Total crat Other lican eral rate tive
===== ===== ===== ===== ===== ===== =====
Approve 41% 10% 37% 79% 15% 30% 72%
Disapprove 48% 84% 47% 11% 77% 57% 19%
Don't know/Undecided/Refused 11% 5% 16% 10% 8% 13% 8%
Sampling Error (+/-) 3.3 5.7 5.6 6.0 6.8 5.3 5.6
RV: RV: RV:
Lean Lean Extr. Very Less
Demo- Repub Reg. Enthu Enthu Enthu
Total crat lican voter Pres Pres Pres
===== ===== ===== ===== ===== ===== =====
Approve 41% 11% 78% 42% 51% 45% 31%
Disapprove 48% 80% 11% 48% 42% 48% 55%
Don't know/Undecided/Refused 11% 9% 11% 10% 7% 8% 14%
Sampling Error (+/-) 3.3 4.7 4.9 3.5 5.4 6.5 6.2

1 Braxton Way Suite 125 Glen Mills, PA 19342
484-840-4300 www.ssrs.com
POLL2 @ssrs_research | 484.840.4300 | www.ssrs.com | 19
CNN/SSRS Poll -- March 04, 2020 to March 07, 2020 (Battleground states)
TABLE 004
Question A2y
A2y. Do you approve or disapprove of the way Donald Trump is handling The coronavirus outbreak?
Base: Battleground state residents
Non- Reg.
Total Men Women White white voter
===== ===== ===== ===== ===== =====
Approve 41% 48% 34% 50% 23% 43%
Disapprove 49% 44% 54% 41% 67% 50%
Don't know/Undecided/Refused 10% 8% 12% 9% 10% 8%
Sampling Error (+/-) 5.0 6.5 7.5 5.8 9.4 5.2
Trump Trump
ap- disap
Total <50 50+ prove prove
===== ===== ===== ===== =====
Approve 41% 37% 45% 79% 9%
Disapprove 49% 51% 47% 11% 84%
Don't know/Undecided/Refused 10% 12% 8% 10% 7%
Sampling Error (+/-) 5.0 7.8 6.2 7.2 7.0
White
Non- Non- White
coll. Coll. coll. Coll.
Total <$50K $50K+ grad grad. grad grad.
===== ===== ===== ===== ===== ====== =====
Approve 41% 36% 48% 42% 40% 55% 42%
Disapprove 49% 52% 46% 47% 52% 36% 49%
Don't know/Undecided/Refused 10% 12% 6% 11% 8% 9% 8%
Sampling Error (+/-) 5.0 7.8 6.8 6.4 7.8 7.7 8.9
Indep Lean Lean
Demo- endnt Repub Demo- Repub
Total crat Other lican crat lican
===== ==== ===== ===== ===== =====
Approve 41% 10% 37% 80% 10% 79%
Disapprove 49% 87% 48% 11% 84% 11%
Don't know/Undecided/Refused 10% 3% 15% 9% 6% 10%
Sampling Error (+/-) 5.0 9.1 8.3 8.8 7.3 7.3
RV: RV:
Con Extr. Less
Lib- Mode- serva Enthu Enthu
Total eral rate tive Pres Pres
===== ===== ===== ===== ===== =====
Approve 41% SN 33% 69% 56% 34%
Disapprove 49% SN 56% 23% 39% 56%
Don't know/Undecided/Refused 10% SN 11% 8% 5% 10%
Sampling Error (+/-) 5.0 7.7 8.1 8.0 6.8

1 Braxton Way Suite 125 Glen Mills, PA 19342
484-840-4300 www.ssrs.com
POLL2 @ssrs_research | 484.840.4300 | www.ssrs.com | 20
CNN/SSRS Poll -- March 04, 2020 to March 07, 2020
TABLE 005
Question A2z
A2z. Do you approve or disapprove of the way Donald Trump is handling The situation in Afghanistan?
Base: Total Respondents
Trump Trump
Non- ap- disap
Total Men Women White white prove prove
===== ===== ===== ===== ===== ===== =====
Approve 40% 50% 31% 50% 22% 80% 10%
Disapprove 46% 38% 53% 38% 61% 9% 77%
Don't know/Undecided/Refused 14% 13% 16% 12% 17% 11% 13%
Sampling Error (+/-) 3.3 4.3 5.0 3.9 5.9 4.9 4.6
Total 18-34 35-49 50-64 65+ <45 45+
===== ===== ===== ===== ===== ===== =====
Approve 40% 26% 46% 49% 40% 33% 46%
Disapprove 46% 56% 39% 38% 49% 50% 42%
Don't know/Undecided/Refused 14% 18% 15% 12% 11% 17% 12%
Sampling Error (+/-) 3.3 6.8 7.4 6.2 5.5 5.4 4.0
Non- White White
coll. Coll. non- coll.
Total <$50K $50K+ grad grad. coll. grad.
===== ===== ===== ===== ===== ===== =====
Approve 40% 33% 46% 41% 38% 55% 41%
Disapprove 46% 50% 43% 43% 52% 31% 49%
Don't know/Undecided/Refused 14% 17% 11% 16% 11% 14% 10%
Sampling Error (+/-) 3.3 5.6 4.3 4.3 5.0 5.3 5.8
Indep Con
Demo- endnt Repub Lib- Mode- serva
Total crat Other lican eral rate tive
===== ===== ===== ===== ===== ===== =====
Approve 40% 10% 34% 81% 13% 31% 69%
Disapprove 46% 78% 46% 9% 71% 52% 22%
Don't know/Undecided/Refused 14% 12% 20% 9% 15% 17% 9%
Sampling Error (+/-) 3.3 5.7 5.6 6.0 6.8 5.3 5.6
RV: RV: RV:
Lean Lean Extr. Very Less
Demo- Repub Reg. Enthu Enthu Enthu
Total crat lican voter Pres Pres Pres
===== ===== ===== ===== ===== ===== =====
Approve 40% 11% 77% 42% 49% 44% 31%
Disapprove 46% 74% 12% 46% 42% 44% 52%
Don't know/Undecided/Refused 14% 14% 11% 13% 10% 11% 17%
Sampling Error (+/-) 3.3 4.7 4.9 3.5 5.4 6.5 6.2
1 Braxton Way Suite 125 Glen Mills, PA 19342
484-840-4300 www.ssrs.com
POLL2 @ssrs_research | 484.840.4300 | www.ssrs.com | 21
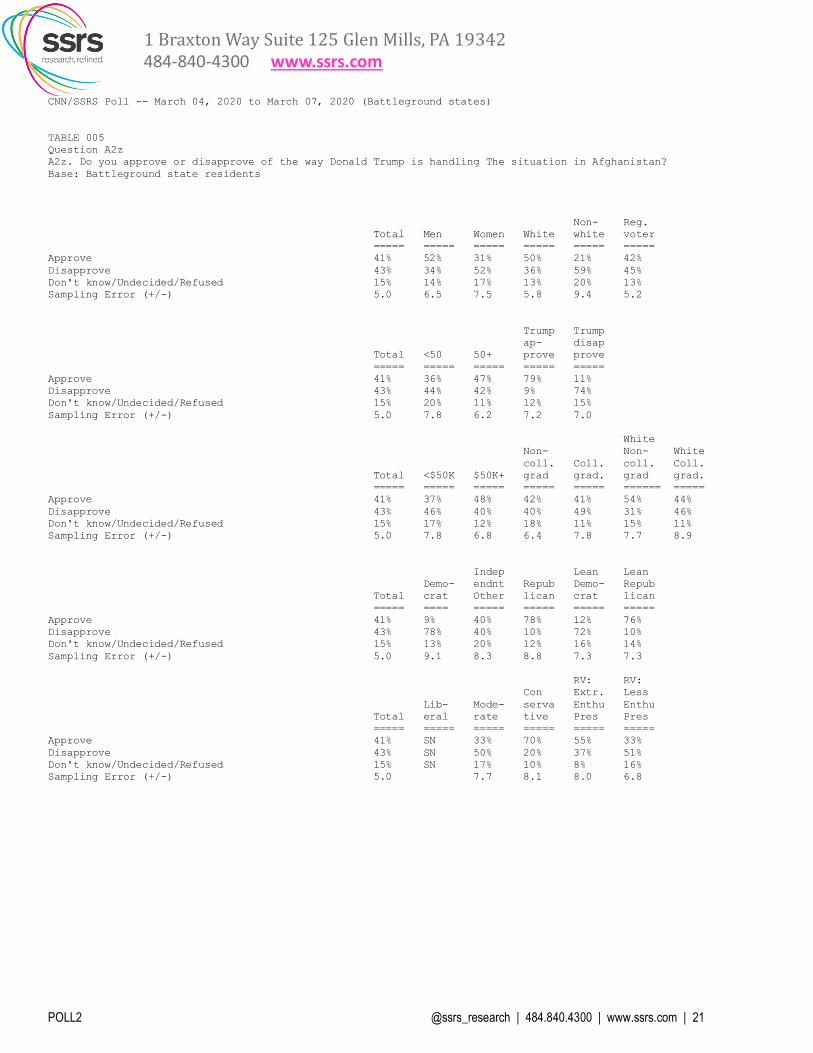
CNN/SSRS Poll -- March 04, 2020 to March 07, 2020 (Battleground states)
TABLE 005
Question A2z
A2z. Do you approve or disapprove of the way Donald Trump is handling The situation in Afghanistan?
Base: Battleground state residents
Non- Reg.
Total Men Women White white voter
===== ===== ===== ===== ===== =====
Approve 41% 52% 31% 50% 21% 42%
Disapprove 43% 34% 52% 36% 59% 45%
Don't know/Undecided/Refused 15% 14% 17% 13% 20% 13%
Sampling Error (+/-) 5.0 6.5 7.5 5.8 9.4 5.2
Trump Trump
ap- disap
Total <50 50+ prove prove
===== ===== ===== ===== =====
Approve 41% 36% 47% 79% 11%
Disapprove 43% 44% 42% 9% 74%
Don't know/Undecided/Refused 15% 20% 11% 12% 15%
Sampling Error (+/-) 5.0 7.8 6.2 7.2 7.0
White
Non- Non- White
coll. Coll. coll. Coll.
Total <$50K $50K+ grad grad. grad grad.
===== ===== ===== ===== ===== ====== =====
Approve 41% 37% 48% 42% 41% 54% 44%
Disapprove 43% 46% 40% 40% 49% 31% 46%
Don't know/Undecided/Refused 15% 17% 12% 18% 11% 15% 11%
Sampling Error (+/-) 5.0 7.8 6.8 6.4 7.8 7.7 8.9
Indep Lean Lean
Demo- endnt Repub Demo- Repub
Total crat Other lican crat lican
===== ==== ===== ===== ===== =====
Approve 41% 9% 40% 78% 12% 76%
Disapprove 43% 78% 40% 10% 72% 10%
Don't know/Undecided/Refused 15% 13% 20% 12% 16% 14%
Sampling Error (+/-) 5.0 9.1 8.3 8.8 7.3 7.3
RV: RV:
Con Extr. Less
Lib- Mode- serva Enthu Enthu
Total eral rate tive Pres Pres
===== ===== ===== ===== ===== =====
Approve 41% SN 33% 70% 55% 33%
Disapprove 43% SN 50% 20% 37% 51%
Don't know/Undecided/Refused 15% SN 17% 10% 8% 16%
Sampling Error (+/-) 5.0 7.7 8.1 8.0 6.8
1 Braxton Way Suite 125 Glen Mills, PA 19342
484-840-4300 www.ssrs.com
POLL2 @ssrs_research | 484.840.4300 | www.ssrs.com | 22
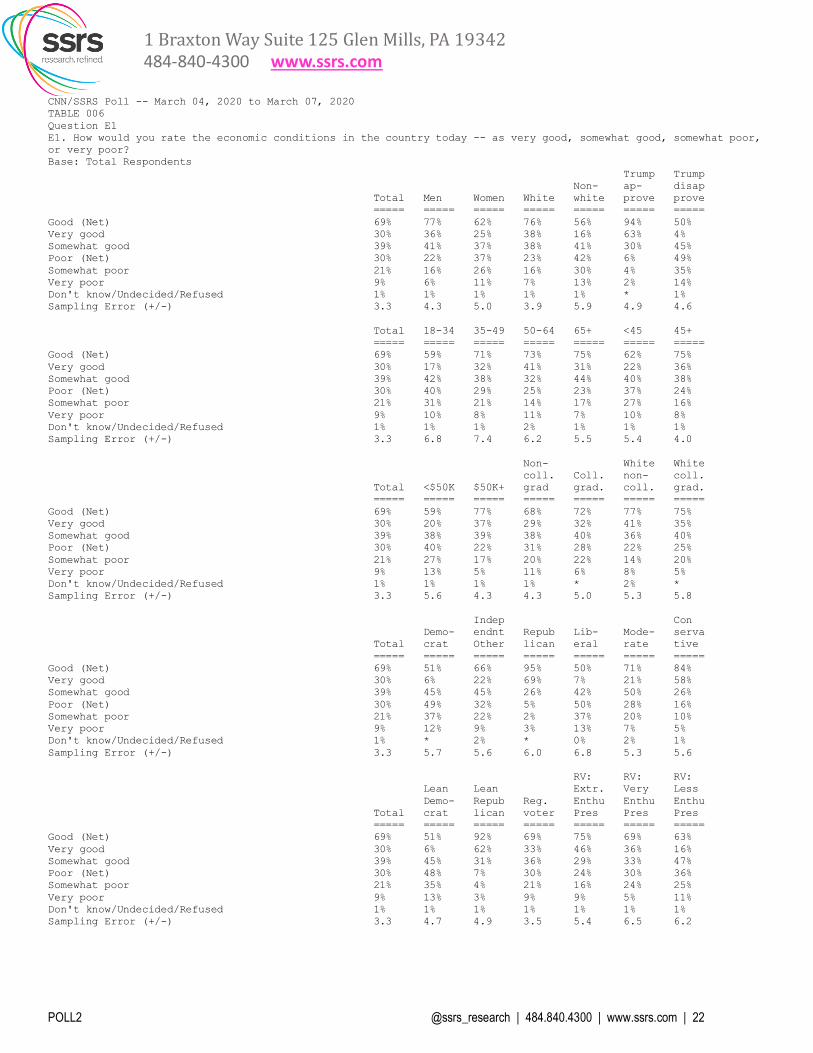
CNN/SSRS Poll -- March 04, 2020 to March 07, 2020
TABLE 006
Question E1
E1. How would you rate the economic conditions in the country today -- as very good, somewhat good, somewhat poor,
or very poor?
Base: Total Respondents
Trump Trump
Non- ap- disap
Total Men Women White white prove prove
===== ===== ===== ===== ===== ===== =====
Good (Net) 69% 77% 62% 76% 56% 94% 50%
Very good 30% 36% 25% 38% 16% 63% 4%
Somewhat good 39% 41% 37% 38% 41% 30% 45%
Poor (Net) 30% 22% 37% 23% 42% 6% 49%
Somewhat poor 21% 16% 26% 16% 30% 4% 35%
Very poor 9% 6% 11% 7% 13% 2% 14%
Don't know/Undecided/Refused 1% 1% 1% 1% 1% * 1%
Sampling Error (+/-) 3.3 4.3 5.0 3.9 5.9 4.9 4.6
Total 18-34 35-49 50-64 65+ <45 45+
===== ===== ===== ===== ===== ===== =====
Good (Net) 69% 59% 71% 73% 75% 62% 75%
Very good 30% 17% 32% 41% 31% 22% 36%
Somewhat good 39% 42% 38% 32% 44% 40% 38%
Poor (Net) 30% 40% 29% 25% 23% 37% 24%
Somewhat poor 21% 31% 21% 14% 17% 27% 16%
Very poor 9% 10% 8% 11% 7% 10% 8%
Don't know/Undecided/Refused 1% 1% 1% 2% 1% 1% 1%
Sampling Error (+/-) 3.3 6.8 7.4 6.2 5.5 5.4 4.0
Non- White White
coll. Coll. non- coll.
Total <$50K $50K+ grad grad. coll. grad.
===== ===== ===== ===== ===== ===== =====
Good (Net) 69% 59% 77% 68% 72% 77% 75%
Very good 30% 20% 37% 29% 32% 41% 35%
Somewhat good 39% 38% 39% 38% 40% 36% 40%
Poor (Net) 30% 40% 22% 31% 28% 22% 25%
Somewhat poor 21% 27% 17% 20% 22% 14% 20%
Very poor 9% 13% 5% 11% 6% 8% 5%
Don't know/Undecided/Refused 1% 1% 1% 1% * 2% *
Sampling Error (+/-) 3.3 5.6 4.3 4.3 5.0 5.3 5.8
Indep Con
Demo- endnt Repub Lib- Mode- serva
Total crat Other lican eral rate tive
===== ===== ===== ===== ===== ===== =====
Good (Net) 69% 51% 66% 95% 50% 71% 84%
Very good 30% 6% 22% 69% 7% 21% 58%
Somewhat good 39% 45% 45% 26% 42% 50% 26%
Poor (Net) 30% 49% 32% 5% 50% 28% 16%
Somewhat poor 21% 37% 22% 2% 37% 20% 10%
Very poor 9% 12% 9% 3% 13% 7% 5%
Don't know/Undecided/Refused 1% * 2% * 0% 2% 1%
Sampling Error (+/-) 3.3 5.7 5.6 6.0 6.8 5.3 5.6
RV: RV: RV:
Lean Lean Extr. Very Less
Demo- Repub Reg. Enthu Enthu Enthu
Total crat lican voter Pres Pres Pres
===== ===== ===== ===== ===== ===== =====
Good (Net) 69% 51% 92% 69% 75% 69% 63%
Very good 30% 6% 62% 33% 46% 36% 16%
Somewhat good 39% 45% 31% 36% 29% 33% 47%
Poor (Net) 30% 48% 7% 30% 24% 30% 36%
Somewhat poor 21% 35% 4% 21% 16% 24% 25%
Very poor 9% 13% 3% 9% 9% 5% 11%
Don't know/Undecided/Refused 1% 1% 1% 1% 1% 1% 1%
Sampling Error (+/-) 3.3 4.7 4.9 3.5 5.4 6.5 6.2
1 Braxton Way Suite 125 Glen Mills, PA 19342
484-840-4300 www.ssrs.com
POLL2 @ssrs_research | 484.840.4300 | www.ssrs.com | 23
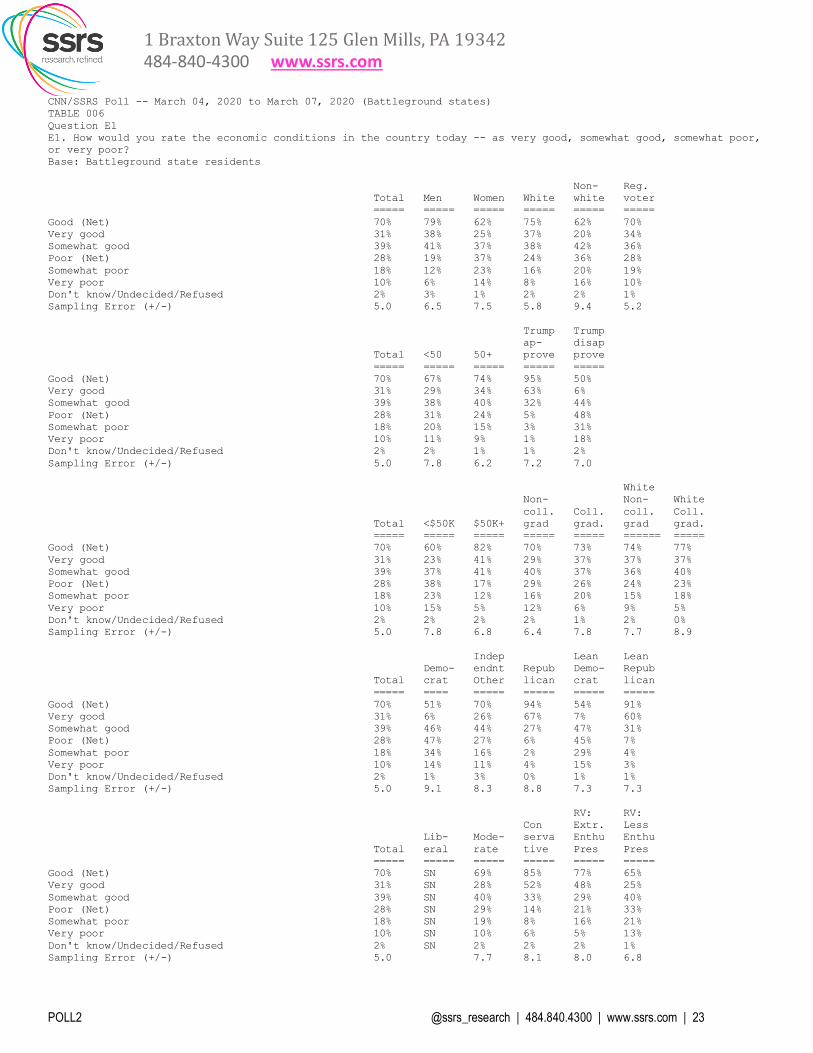
CNN/SSRS Poll -- March 04, 2020 to March 07, 2020 (Battleground states)
TABLE 006
Question E1
E1. How would you rate the economic conditions in the country today -- as very good, somewhat good, somewhat poor,
or very poor?
Base: Battleground state residents
Non- Reg.
Total Men Women White white voter
===== ===== ===== ===== ===== =====
Good (Net) 70% 79% 62% 75% 62% 70%
Very good 31% 38% 25% 37% 20% 34%
Somewhat good 39% 41% 37% 38% 42% 36%
Poor (Net) 28% 19% 37% 24% 36% 28%
Somewhat poor 18% 12% 23% 16% 20% 19%
Very poor 10% 6% 14% 8% 16% 10%
Don't know/Undecided/Refused 2% 3% 1% 2% 2% 1%
Sampling Error (+/-) 5.0 6.5 7.5 5.8 9.4 5.2
Trump Trump
ap- disap
Total <50 50+ prove prove
===== ===== ===== ===== =====
Good (Net) 70% 67% 74% 95% 50%
Very good 31% 29% 34% 63% 6%
Somewhat good 39% 38% 40% 32% 44%
Poor (Net) 28% 31% 24% 5% 48%
Somewhat poor 18% 20% 15% 3% 31%
Very poor 10% 11% 9% 1% 18%
Don't know/Undecided/Refused 2% 2% 1% 1% 2%
Sampling Error (+/-) 5.0 7.8 6.2 7.2 7.0
White
Non- Non- White
coll. Coll. coll. Coll.
Total <$50K $50K+ grad grad. grad grad.
===== ===== ===== ===== ===== ====== =====
Good (Net) 70% 60% 82% 70% 73% 74% 77%
Very good 31% 23% 41% 29% 37% 37% 37%
Somewhat good 39% 37% 41% 40% 37% 36% 40%
Poor (Net) 28% 38% 17% 29% 26% 24% 23%
Somewhat poor 18% 23% 12% 16% 20% 15% 18%
Very poor 10% 15% 5% 12% 6% 9% 5%
Don't know/Undecided/Refused 2% 2% 2% 2% 1% 2% 0%
Sampling Error (+/-) 5.0 7.8 6.8 6.4 7.8 7.7 8.9
Indep Lean Lean
Demo- endnt Repub Demo- Repub
Total crat Other lican crat lican
===== ==== ===== ===== ===== =====
Good (Net) 70% 51% 70% 94% 54% 91%
Very good 31% 6% 26% 67% 7% 60%
Somewhat good 39% 46% 44% 27% 47% 31%
Poor (Net) 28% 47% 27% 6% 45% 7%
Somewhat poor 18% 34% 16% 2% 29% 4%
Very poor 10% 14% 11% 4% 15% 3%
Don't know/Undecided/Refused 2% 1% 3% 0% 1% 1%
Sampling Error (+/-) 5.0 9.1 8.3 8.8 7.3 7.3
RV: RV:
Con Extr. Less
Lib- Mode- serva Enthu Enthu
Total eral rate tive Pres Pres
===== ===== ===== ===== ===== =====
Good (Net) 70% SN 69% 85% 77% 65%
Very good 31% SN 28% 52% 48% 25%
Somewhat good 39% SN 40% 33% 29% 40%
Poor (Net) 28% SN 29% 14% 21% 33%
Somewhat poor 18% SN 19% 8% 16% 21%
Very poor 10% SN 10% 6% 5% 13%
Don't know/Undecided/Refused 2% SN 2% 2% 2% 1%
Sampling Error (+/-) 5.0 7.7 8.1 8.0 6.8
1 Braxton Way Suite 125 Glen Mills, PA 19342
484-840-4300 www.ssrs.com
POLL2 @ssrs_research | 484.840.4300 | www.ssrs.com | 24
CNN/SSRS Poll -- March 04, 2020 to March 07, 2020
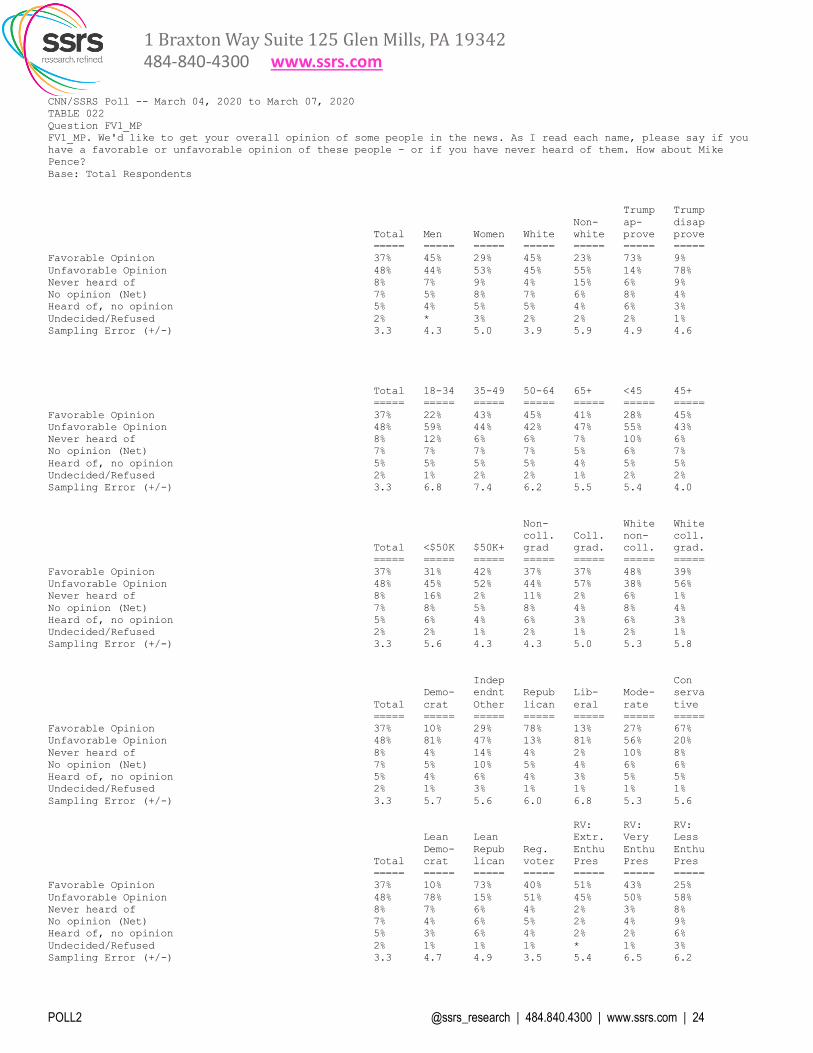
TABLE 022
Question FV1_MP
FV1_MP. We'd like to get your overall opinion of some people in the news. As I read each name, please say if you
have a favorable or unfavorable opinion of these people - or if you have never heard of them. How about Mike
Pence?
Base: Total Respondents
Trump Trump
Non- ap- disap
Total Men Women White white prove prove
===== ===== ===== ===== ===== ===== =====
Favorable Opinion 37% 45% 29% 45% 23% 73% 9%
Unfavorable Opinion 48% 44% 53% 45% 55% 14% 78%
Never heard of 8% 7% 9% 4% 15% 6% 9%
No opinion (Net) 7% 5% 8% 7% 6% 8% 4%
Heard of, no opinion 5% 4% 5% 5% 4% 6% 3%
Undecided/Refused 2% * 3% 2% 2% 2% 1%
Sampling Error (+/-) 3.3 4.3 5.0 3.9 5.9 4.9 4.6
Total 18-34 35-49 50-64 65+ <45 45+
===== ===== ===== ===== ===== ===== =====
Favorable Opinion 37% 22% 43% 45% 41% 28% 45%
Unfavorable Opinion 48% 59% 44% 42% 47% 55% 43%
Never heard of 8% 12% 6% 6% 7% 10% 6%
No opinion (Net) 7% 7% 7% 7% 5% 6% 7%
Heard of, no opinion 5% 5% 5% 5% 4% 5% 5%
Undecided/Refused 2% 1% 2% 2% 1% 2% 2%
Sampling Error (+/-) 3.3 6.8 7.4 6.2 5.5 5.4 4.0
Non- White White
coll. Coll. non- coll.
Total <$50K $50K+ grad grad. coll. grad.
===== ===== ===== ===== ===== ===== =====
Favorable Opinion 37% 31% 42% 37% 37% 48% 39%
Unfavorable Opinion 48% 45% 52% 44% 57% 38% 56%
Never heard of 8% 16% 2% 11% 2% 6% 1%
No opinion (Net) 7% 8% 5% 8% 4% 8% 4%
Heard of, no opinion 5% 6% 4% 6% 3% 6% 3%
Undecided/Refused 2% 2% 1% 2% 1% 2% 1%
Sampling Error (+/-) 3.3 5.6 4.3 4.3 5.0 5.3 5.8
Indep Con
Demo- endnt Repub Lib- Mode- serva
Total crat Other lican eral rate tive
===== ===== ===== ===== ===== ===== =====
Favorable Opinion 37% 10% 29% 78% 13% 27% 67%
Unfavorable Opinion 48% 81% 47% 13% 81% 56% 20%
Never heard of 8% 4% 14% 4% 2% 10% 8%
No opinion (Net) 7% 5% 10% 5% 4% 6% 6%
Heard of, no opinion 5% 4% 6% 4% 3% 5% 5%
Undecided/Refused 2% 1% 3% 1% 1% 1% 1%
Sampling Error (+/-) 3.3 5.7 5.6 6.0 6.8 5.3 5.6
RV: RV: RV:
Lean Lean Extr. Very Less
Demo- Repub Reg. Enthu Enthu Enthu
Total crat lican voter Pres Pres Pres
===== ===== ===== ===== ===== ===== =====
Favorable Opinion 37% 10% 73% 40% 51% 43% 25%
Unfavorable Opinion 48% 78% 15% 51% 45% 50% 58%
Never heard of 8% 7% 6% 4% 2% 3% 8%
No opinion (Net) 7% 4% 6% 5% 2% 4% 9%
Heard of, no opinion 5% 3% 6% 4% 2% 2% 6%
Undecided/Refused 2% 1% 1% 1% * 1% 3%
Sampling Error (+/-) 3.3 4.7 4.9 3.5 5.4 6.5 6.2
1 Braxton Way Suite 125 Glen Mills, PA 19342
484-840-4300 www.ssrs.com
POLL2 @ssrs_research | 484.840.4300 | www.ssrs.com | 25
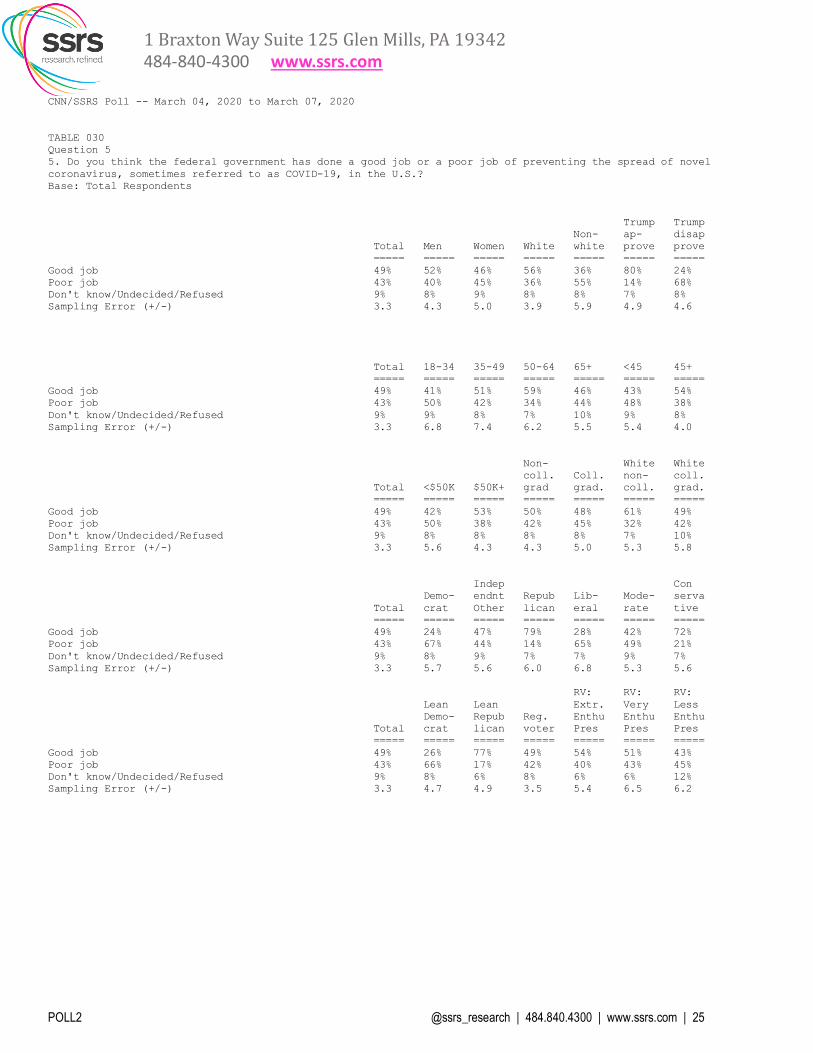
CNN/SSRS Poll -- March 04, 2020 to March 07, 2020
TABLE 030
Question 5
5. Do you think the federal government has done a good job or a poor job of preventing the spread of novel
coronavirus, sometimes referred to as COVID-19, in the U.S.?
Base: Total Respondents
Trump Trump
Non- ap- disap
Total Men Women White white prove prove
===== ===== ===== ===== ===== ===== =====
Good job 49% 52% 46% 56% 36% 80% 24%
Poor job 43% 40% 45% 36% 55% 14% 68%
Don't know/Undecided/Refused 9% 8% 9% 8% 8% 7% 8%
Sampling Error (+/-) 3.3 4.3 5.0 3.9 5.9 4.9 4.6
Total 18-34 35-49 50-64 65+ <45 45+
===== ===== ===== ===== ===== ===== =====
Good job 49% 41% 51% 59% 46% 43% 54%
Poor job 43% 50% 42% 34% 44% 48% 38%
Don't know/Undecided/Refused 9% 9% 8% 7% 10% 9% 8%
Sampling Error (+/-) 3.3 6.8 7.4 6.2 5.5 5.4 4.0
Non- White White
coll. Coll. non- coll.
Total <$50K $50K+ grad grad. coll. grad.
===== ===== ===== ===== ===== ===== =====
Good job 49% 42% 53% 50% 48% 61% 49%
Poor job 43% 50% 38% 42% 45% 32% 42%
Don't know/Undecided/Refused 9% 8% 8% 8% 8% 7% 10%
Sampling Error (+/-) 3.3 5.6 4.3 4.3 5.0 5.3 5.8
Indep Con
Demo- endnt Repub Lib- Mode- serva
Total crat Other lican eral rate tive
===== ===== ===== ===== ===== ===== =====
Good job 49% 24% 47% 79% 28% 42% 72%
Poor job 43% 67% 44% 14% 65% 49% 21%
Don't know/Undecided/Refused 9% 8% 9% 7% 7% 9% 7%
Sampling Error (+/-) 3.3 5.7 5.6 6.0 6.8 5.3 5.6
RV: RV: RV:
Lean Lean Extr. Very Less
Demo- Repub Reg. Enthu Enthu Enthu
Total crat lican voter Pres Pres Pres
===== ===== ===== ===== ===== ===== =====
Good job 49% 26% 77% 49% 54% 51% 43%
Poor job 43% 66% 17% 42% 40% 43% 45%
Don't know/Undecided/Refused 9% 8% 6% 8% 6% 6% 12%
Sampling Error (+/-) 3.3 4.7 4.9 3.5 5.4 6.5 6.2
1 Braxton Way Suite 125 Glen Mills, PA 19342
484-840-4300 www.ssrs.com
POLL2 @ssrs_research | 484.840.4300 | www.ssrs.com | 26
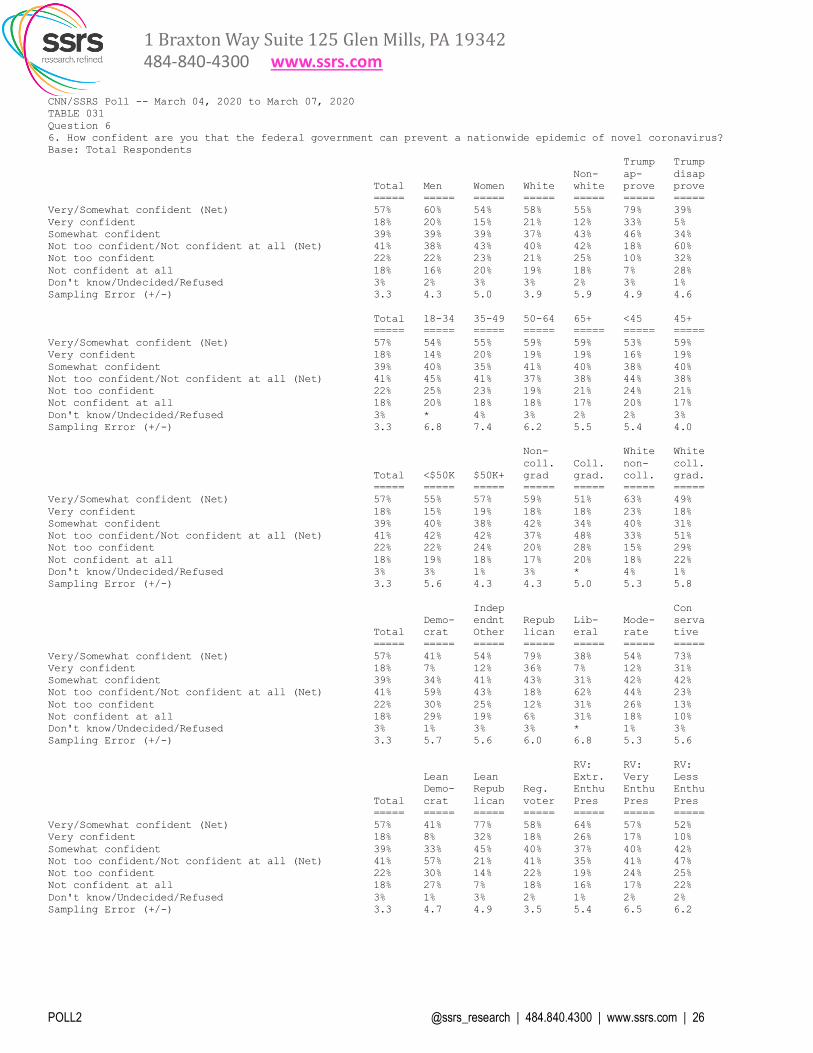
CNN/SSRS Poll -- March 04, 2020 to March 07, 2020
TABLE 031
Question 6
6. How confident are you that the federal government can prevent a nationwide epidemic of novel coronavirus?
Base: Total Respondents
Trump Trump
Non- ap- disap
Total Men Women White white prove prove
===== ===== ===== ===== ===== ===== =====
Very/Somewhat confident (Net) 57% 60% 54% 58% 55% 79% 39%
Very confident 18% 20% 15% 21% 12% 33% 5%
Somewhat confident 39% 39% 39% 37% 43% 46% 34%
Not too confident/Not confident at all (Net) 41% 38% 43% 40% 42% 18% 60%
Not too confident 22% 22% 23% 21% 25% 10% 32%
Not confident at all 18% 16% 20% 19% 18% 7% 28%
Don't know/Undecided/Refused 3% 2% 3% 3% 2% 3% 1%
Sampling Error (+/-) 3.3 4.3 5.0 3.9 5.9 4.9 4.6
Total 18-34 35-49 50-64 65+ <45 45+
===== ===== ===== ===== ===== ===== =====
Very/Somewhat confident (Net) 57% 54% 55% 59% 59% 53% 59%
Very confident 18% 14% 20% 19% 19% 16% 19%
Somewhat confident 39% 40% 35% 41% 40% 38% 40%
Not too confident/Not confident at all (Net) 41% 45% 41% 37% 38% 44% 38%
Not too confident 22% 25% 23% 19% 21% 24% 21%
Not confident at all 18% 20% 18% 18% 17% 20% 17%
Don't know/Undecided/Refused 3% * 4% 3% 2% 2% 3%
Sampling Error (+/-) 3.3 6.8 7.4 6.2 5.5 5.4 4.0
Non- White White
coll. Coll. non- coll.
Total <$50K $50K+ grad grad. coll. grad.
===== ===== ===== ===== ===== ===== =====
Very/Somewhat confident (Net) 57% 55% 57% 59% 51% 63% 49%
Very confident 18% 15% 19% 18% 18% 23% 18%
Somewhat confident 39% 40% 38% 42% 34% 40% 31%
Not too confident/Not confident at all (Net) 41% 42% 42% 37% 48% 33% 51%
Not too confident 22% 22% 24% 20% 28% 15% 29%
Not confident at all 18% 19% 18% 17% 20% 18% 22%
Don't know/Undecided/Refused 3% 3% 1% 3% * 4% 1%
Sampling Error (+/-) 3.3 5.6 4.3 4.3 5.0 5.3 5.8
Indep Con
Demo- endnt Repub Lib- Mode- serva
Total crat Other lican eral rate tive
===== ===== ===== ===== ===== ===== =====
Very/Somewhat confident (Net) 57% 41% 54% 79% 38% 54% 73%
Very confident 18% 7% 12% 36% 7% 12% 31%
Somewhat confident 39% 34% 41% 43% 31% 42% 42%
Not too confident/Not confident at all (Net) 41% 59% 43% 18% 62% 44% 23%
Not too confident 22% 30% 25% 12% 31% 26% 13%
Not confident at all 18% 29% 19% 6% 31% 18% 10%
Don't know/Undecided/Refused 3% 1% 3% 3% * 1% 3%
Sampling Error (+/-) 3.3 5.7 5.6 6.0 6.8 5.3 5.6
RV: RV: RV:
Lean Lean Extr. Very Less
Demo- Repub Reg. Enthu Enthu Enthu
Total crat lican voter Pres Pres Pres
===== ===== ===== ===== ===== ===== =====
Very/Somewhat confident (Net) 57% 41% 77% 58% 64% 57% 52%
Very confident 18% 8% 32% 18% 26% 17% 10%
Somewhat confident 39% 33% 45% 40% 37% 40% 42%
Not too confident/Not confident at all (Net) 41% 57% 21% 41% 35% 41% 47%
Not too confident 22% 30% 14% 22% 19% 24% 25%
Not confident at all 18% 27% 7% 18% 16% 17% 22%
Don't know/Undecided/Refused 3% 1% 3% 2% 1% 2% 2%
Sampling Error (+/-) 3.3 4.7 4.9 3.5 5.4 6.5 6.2
1 Braxton Way Suite 125 Glen Mills, PA 19342
484-840-4300 www.ssrs.com
POLL2 @ssrs_research | 484.840.4300 | www.ssrs.com | 27
CNN/SSRS Poll -- March 04, 2020 to March 07, 2020
TABLE 032
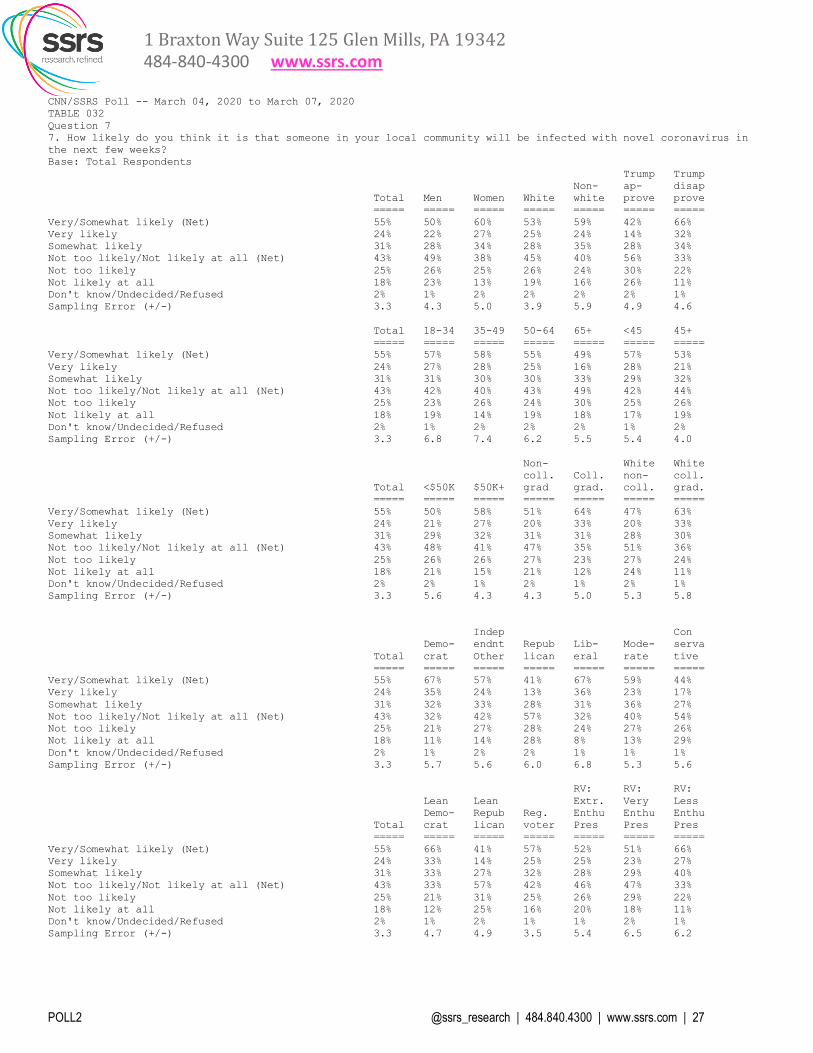
Question 7
7. How likely do you think it is that someone in your local community will be infected with novel coronavirus in
the next few weeks?
Base: Total Respondents
Trump Trump
Non- ap- disap
Total Men Women White white prove prove
===== ===== ===== ===== ===== ===== =====
Very/Somewhat likely (Net) 55% 50% 60% 53% 59% 42% 66%
Very likely 24% 22% 27% 25% 24% 14% 32%
Somewhat likely 31% 28% 34% 28% 35% 28% 34%
Not too likely/Not likely at all (Net) 43% 49% 38% 45% 40% 56% 33%
Not too likely 25% 26% 25% 26% 24% 30% 22%
Not likely at all 18% 23% 13% 19% 16% 26% 11%
Don't know/Undecided/Refused 2% 1% 2% 2% 2% 2% 1%
Sampling Error (+/-) 3.3 4.3 5.0 3.9 5.9 4.9 4.6
Total 18-34 35-49 50-64 65+ <45 45+
===== ===== ===== ===== ===== ===== =====
Very/Somewhat likely (Net) 55% 57% 58% 55% 49% 57% 53%
Very likely 24% 27% 28% 25% 16% 28% 21%
Somewhat likely 31% 31% 30% 30% 33% 29% 32%
Not too likely/Not likely at all (Net) 43% 42% 40% 43% 49% 42% 44%
Not too likely 25% 23% 26% 24% 30% 25% 26%
Not likely at all 18% 19% 14% 19% 18% 17% 19%
Don't know/Undecided/Refused 2% 1% 2% 2% 2% 1% 2%
Sampling Error (+/-) 3.3 6.8 7.4 6.2 5.5 5.4 4.0
Non- White White
coll. Coll. non- coll.
Total <$50K $50K+ grad grad. coll. grad.
===== ===== ===== ===== ===== ===== =====
Very/Somewhat likely (Net) 55% 50% 58% 51% 64% 47% 63%
Very likely 24% 21% 27% 20% 33% 20% 33%
Somewhat likely 31% 29% 32% 31% 31% 28% 30%
Not too likely/Not likely at all (Net) 43% 48% 41% 47% 35% 51% 36%
Not too likely 25% 26% 26% 27% 23% 27% 24%
Not likely at all 18% 21% 15% 21% 12% 24% 11%
Don't know/Undecided/Refused 2% 2% 1% 2% 1% 2% 1%
Sampling Error (+/-) 3.3 5.6 4.3 4.3 5.0 5.3 5.8
Indep Con
Demo- endnt Repub Lib- Mode- serva
Total crat Other lican eral rate tive
===== ===== ===== ===== ===== ===== =====
Very/Somewhat likely (Net) 55% 67% 57% 41% 67% 59% 44%
Very likely 24% 35% 24% 13% 36% 23% 17%
Somewhat likely 31% 32% 33% 28% 31% 36% 27%
Not too likely/Not likely at all (Net) 43% 32% 42% 57% 32% 40% 54%
Not too likely 25% 21% 27% 28% 24% 27% 26%
Not likely at all 18% 11% 14% 28% 8% 13% 29%
Don't know/Undecided/Refused 2% 1% 2% 2% 1% 1% 1%
Sampling Error (+/-) 3.3 5.7 5.6 6.0 6.8 5.3 5.6
RV: RV: RV:
Lean Lean Extr. Very Less
Demo- Repub Reg. Enthu Enthu Enthu
Total crat lican voter Pres Pres Pres
===== ===== ===== ===== ===== ===== =====
Very/Somewhat likely (Net) 55% 66% 41% 57% 52% 51% 66%
Very likely 24% 33% 14% 25% 25% 23% 27%
Somewhat likely 31% 33% 27% 32% 28% 29% 40%
Not too likely/Not likely at all (Net) 43% 33% 57% 42% 46% 47% 33%
Not too likely 25% 21% 31% 25% 26% 29% 22%
Not likely at all 18% 12% 25% 16% 20% 18% 11%
Don't know/Undecided/Refused 2% 1% 2% 1% 1% 2% 1%
Sampling Error (+/-) 3.3 4.7 4.9 3.5 5.4 6.5 6.2
1 Braxton Way Suite 125 Glen Mills, PA 19342
484-840-4300 www.ssrs.com
POLL2 @ssrs_research | 484.840.4300 | www.ssrs.com | 28
CNN/SSRS Poll -- March 04, 2020 to March 07, 2020
TABLE 033
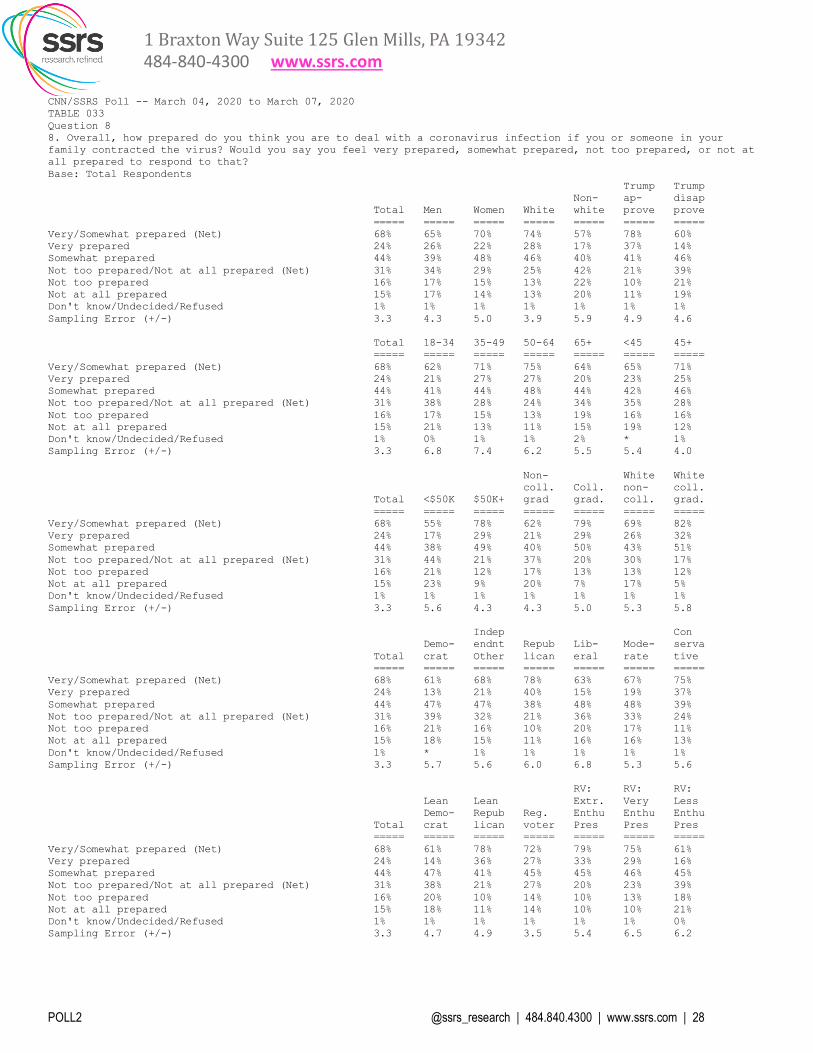
Question 8
8. Overall, how prepared do you think you are to deal with a coronavirus infection if you or someone in your
family contracted the virus? Would you say you feel very prepared, somewhat prepared, not too prepared, or not at
all prepared to respond to that?
Base: Total Respondents
Trump Trump
Non- ap- disap
Total Men Women White white prove prove
===== ===== ===== ===== ===== ===== =====
Very/Somewhat prepared (Net) 68% 65% 70% 74% 57% 78% 60%
Very prepared 24% 26% 22% 28% 17% 37% 14%
Somewhat prepared 44% 39% 48% 46% 40% 41% 46%
Not too prepared/Not at all prepared (Net) 31% 34% 29% 25% 42% 21% 39%
Not too prepared 16% 17% 15% 13% 22% 10% 21%
Not at all prepared 15% 17% 14% 13% 20% 11% 19%
Don't know/Undecided/Refused 1% 1% 1% 1% 1% 1% 1%
Sampling Error (+/-) 3.3 4.3 5.0 3.9 5.9 4.9 4.6
Total 18-34 35-49 50-64 65+ <45 45+
===== ===== ===== ===== ===== ===== =====
Very/Somewhat prepared (Net) 68% 62% 71% 75% 64% 65% 71%
Very prepared 24% 21% 27% 27% 20% 23% 25%
Somewhat prepared 44% 41% 44% 48% 44% 42% 46%
Not too prepared/Not at all prepared (Net) 31% 38% 28% 24% 34% 35% 28%
Not too prepared 16% 17% 15% 13% 19% 16% 16%
Not at all prepared 15% 21% 13% 11% 15% 19% 12%
Don't know/Undecided/Refused 1% 0% 1% 1% 2% * 1%
Sampling Error (+/-) 3.3 6.8 7.4 6.2 5.5 5.4 4.0
Non- White White
coll. Coll. non- coll.
Total <$50K $50K+ grad grad. coll. grad.
===== ===== ===== ===== ===== ===== =====
Very/Somewhat prepared (Net) 68% 55% 78% 62% 79% 69% 82%
Very prepared 24% 17% 29% 21% 29% 26% 32%
Somewhat prepared 44% 38% 49% 40% 50% 43% 51%
Not too prepared/Not at all prepared (Net) 31% 44% 21% 37% 20% 30% 17%
Not too prepared 16% 21% 12% 17% 13% 13% 12%
Not at all prepared 15% 23% 9% 20% 7% 17% 5%
Don't know/Undecided/Refused 1% 1% 1% 1% 1% 1% 1%
Sampling Error (+/-) 3.3 5.6 4.3 4.3 5.0 5.3 5.8
Indep Con
Demo- endnt Repub Lib- Mode- serva
Total crat Other lican eral rate tive
===== ===== ===== ===== ===== ===== =====
Very/Somewhat prepared (Net) 68% 61% 68% 78% 63% 67% 75%
Very prepared 24% 13% 21% 40% 15% 19% 37%
Somewhat prepared 44% 47% 47% 38% 48% 48% 39%
Not too prepared/Not at all prepared (Net) 31% 39% 32% 21% 36% 33% 24%
Not too prepared 16% 21% 16% 10% 20% 17% 11%
Not at all prepared 15% 18% 15% 11% 16% 16% 13%
Don't know/Undecided/Refused 1% * 1% 1% 1% 1% 1%
Sampling Error (+/-) 3.3 5.7 5.6 6.0 6.8 5.3 5.6
RV: RV: RV:
Lean Lean Extr. Very Less
Demo- Repub Reg. Enthu Enthu Enthu
Total crat lican voter Pres Pres Pres
===== ===== ===== ===== ===== ===== =====
Very/Somewhat prepared (Net) 68% 61% 78% 72% 79% 75% 61%
Very prepared 24% 14% 36% 27% 33% 29% 16%
Somewhat prepared 44% 47% 41% 45% 45% 46% 45%
Not too prepared/Not at all prepared (Net) 31% 38% 21% 27% 20% 23% 39%
Not too prepared 16% 20% 10% 14% 10% 13% 18%
Not at all prepared 15% 18% 11% 14% 10% 10% 21%
Don't know/Undecided/Refused 1% 1% 1% 1% 1% 1% 0%
Sampling Error (+/-) 3.3 4.7 4.9 3.5 5.4 6.5 6.2
1 Braxton Way Suite 125 Glen Mills, PA 19342
484-840-4300 www.ssrs.com
POLL2 @ssrs_research | 484.840.4300 | www.ssrs.com | 29
CNN/SSRS Poll -- March 04, 2020 to March 07, 2020
TABLE 034
Question 9
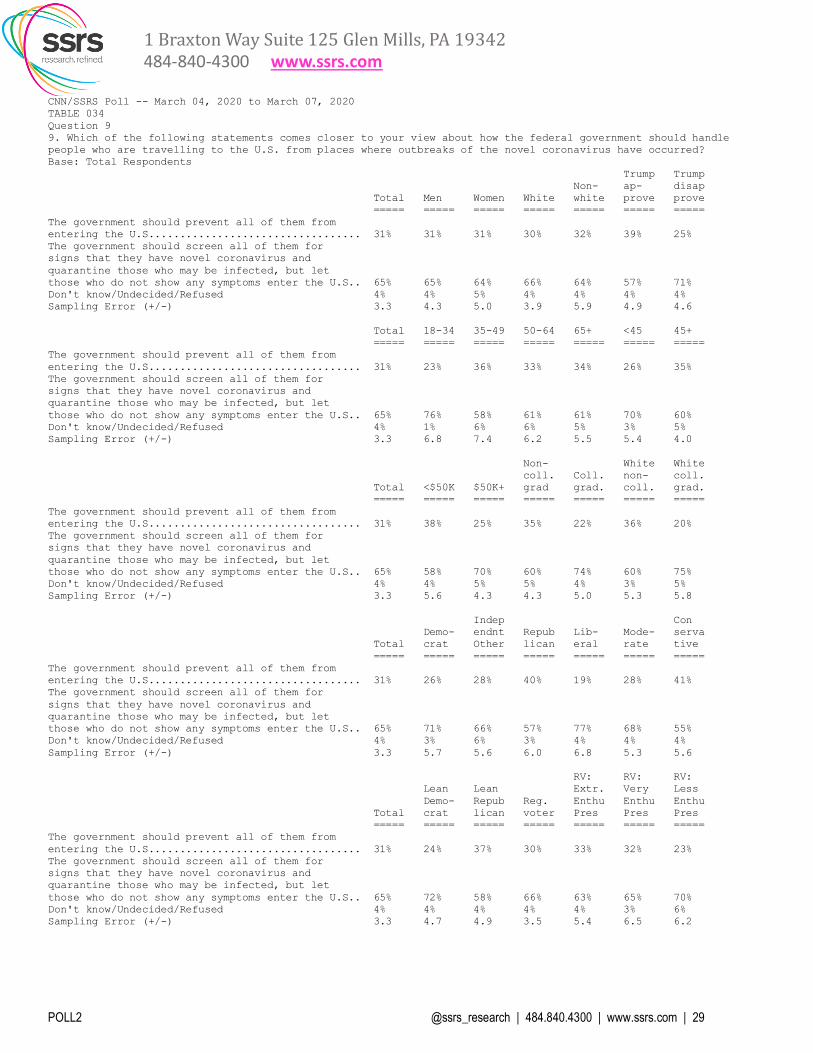
9. Which of the following statements comes closer to your view about how the federal government should handle
people who are travelling to the U.S. from places where outbreaks of the novel coronavirus have occurred?
Base: Total Respondents
Trump Trump
Non- ap- disap
Total Men Women White white prove prove
===== ===== ===== ===== ===== ===== =====
The government should prevent all of them from
entering the U.S.................................. 31% 31% 31% 30% 32% 39% 25%
The government should screen all of them for
signs that they have novel coronavirus and
quarantine those who may be infected, but let
those who do not show any symptoms enter the U.S.. 65% 65% 64% 66% 64% 57% 71%
Don't know/Undecided/Refused 4% 4% 5% 4% 4% 4% 4%
Sampling Error (+/-) 3.3 4.3 5.0 3.9 5.9 4.9 4.6
Total 18-34 35-49 50-64 65+ <45 45+
===== ===== ===== ===== ===== ===== =====
The government should prevent all of them from
entering the U.S.................................. 31% 23% 36% 33% 34% 26% 35%
The government should screen all of them for
signs that they have novel coronavirus and
quarantine those who may be infected, but let
those who do not show any symptoms enter the U.S.. 65% 76% 58% 61% 61% 70% 60%
Don't know/Undecided/Refused 4% 1% 6% 6% 5% 3% 5%
Sampling Error (+/-) 3.3 6.8 7.4 6.2 5.5 5.4 4.0
Non- White White
coll. Coll. non- coll.
Total <$50K $50K+ grad grad. coll. grad.
===== ===== ===== ===== ===== ===== =====
The government should prevent all of them from
entering the U.S.................................. 31% 38% 25% 35% 22% 36% 20%
The government should screen all of them for
signs that they have novel coronavirus and
quarantine those who may be infected, but let
those who do not show any symptoms enter the U.S.. 65% 58% 70% 60% 74% 60% 75%
Don't know/Undecided/Refused 4% 4% 5% 5% 4% 3% 5%
Sampling Error (+/-) 3.3 5.6 4.3 4.3 5.0 5.3 5.8
Indep Con
Demo- endnt Repub Lib- Mode- serva
Total crat Other lican eral rate tive
===== ===== ===== ===== ===== ===== =====
The government should prevent all of them from
entering the U.S.................................. 31% 26% 28% 40% 19% 28% 41%
The government should screen all of them for
signs that they have novel coronavirus and
quarantine those who may be infected, but let
those who do not show any symptoms enter the U.S.. 65% 71% 66% 57% 77% 68% 55%
Don't know/Undecided/Refused 4% 3% 6% 3% 4% 4% 4%
Sampling Error (+/-) 3.3 5.7 5.6 6.0 6.8 5.3 5.6
RV: RV: RV:
Lean Lean Extr. Very Less
Demo- Repub Reg. Enthu Enthu Enthu
Total crat lican voter Pres Pres Pres
===== ===== ===== ===== ===== ===== =====
The government should prevent all of them from
entering the U.S.................................. 31% 24% 37% 30% 33% 32% 23%
The government should screen all of them for
signs that they have novel coronavirus and
quarantine those who may be infected, but let
those who do not show any symptoms enter the U.S.. 65% 72% 58% 66% 63% 65% 70%
Don't know/Undecided/Refused 4% 4% 4% 4% 4% 3% 6%
Sampling Error (+/-) 3.3 4.7 4.9 3.5 5.4 6.5 6.2