Embed Size (px)
Citation preview
@ssrs_solutions | 484.840.4300 | www.ssrs.com | 1
CNN January 2018
The study was conducted for CNN via telephone by SSRS, an independent research company. Interviews were conducted from January 14, 2017 – January 18, 2018 among a sample of 1,005 respondents, no interviewing took place on January 16th due to weather conditions at the call center locations. The landline total respondents were
404 and there were 601 of cell phone respondents. The margin of sampling error for total respondents is +/-3.7 at the 95% confidence level. The design effect is 1.4. More information about SSRS can be obtained by visiting
www.ssrs.com. Unless otherwise noted, results beginning with the March 31-April 2, 2006 survey and ending with the April 22-25, 2017 survey are from surveys conducted by ORC International. Results before March 31, 2006 are
from surveys conducted by Gallup.
EMBARGOED FOR RELEASE: Friday, January 19 at 4:00 p.m.
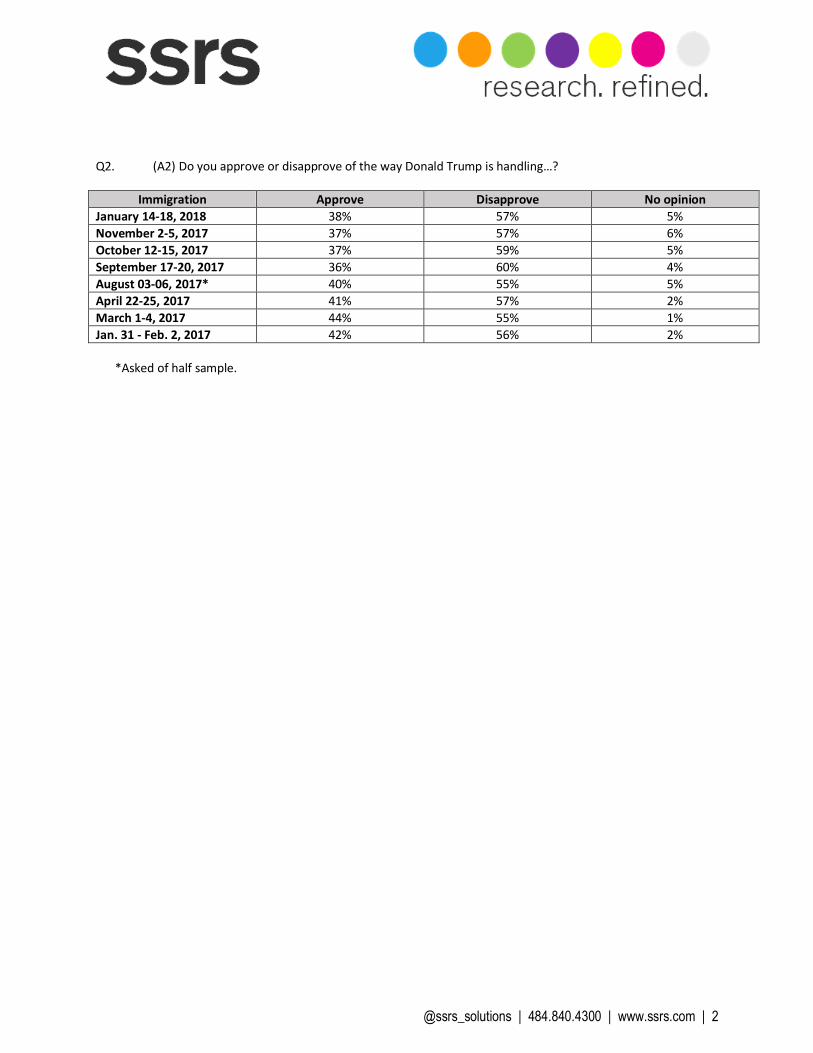
Q1. (A1) Do you approve or disapprove of the way Donald Trump is handling his job as president?
Approve Disapprove No opinion January 14-18, 2018 40% 55% 5% December 14-17, 2017 35% 59% 6% November 2-5, 2017 36% 58% 6% October 12-15, 2017 37% 57% 6% September 26-28, 2017 37% 56% 7% September 17-20, 2017 40% 55% 5% August 03-06, 2017 38% 56% 5% April 22-25, 2017 44% 54% 2% March 1-4, 2017 45% 52% 3% Jan. 31-Feb. 2, 2017 44% 53% 3%
@ssrs_solutions | 484.840.4300 | www.ssrs.com | 2
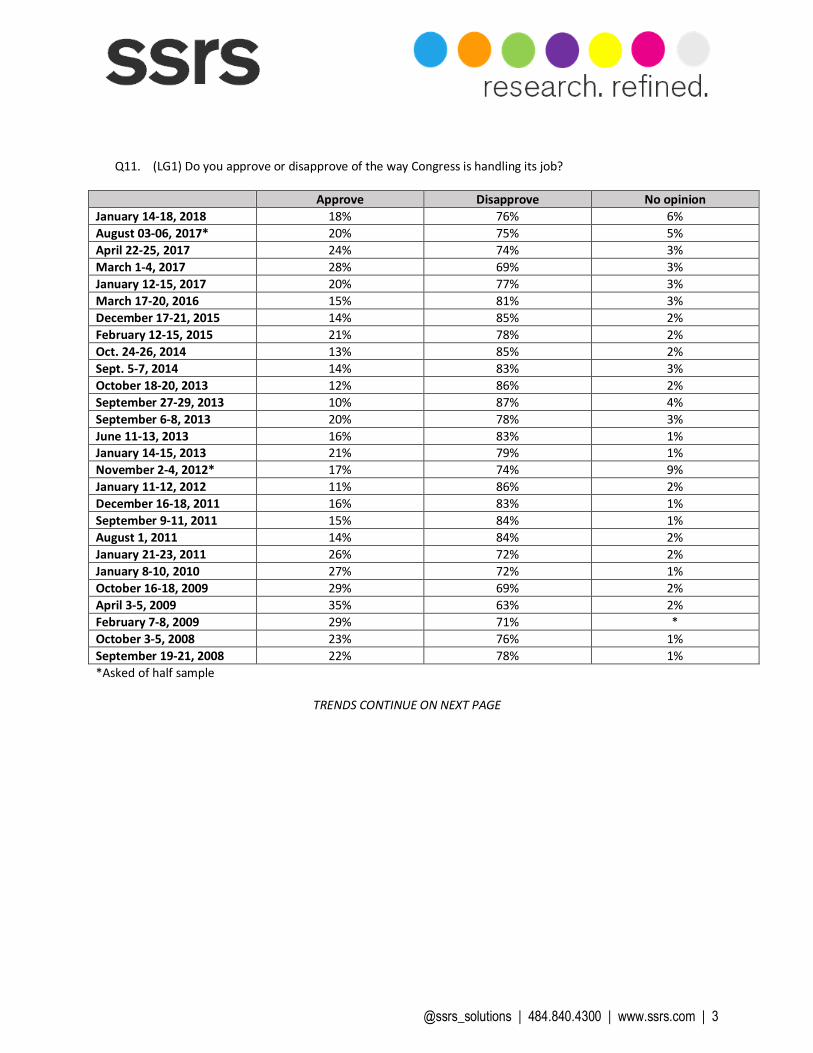
Q2. (A2) Do you approve or disapprove of the way Donald Trump is handling…?
Immigration Approve Disapprove No opinion January 14-18, 2018 38% 57% 5% November 2-5, 2017 37% 57% 6% October 12-15, 2017 37% 59% 5% September 17-20, 2017 36% 60% 4% August 03-06, 2017* 40% 55% 5% April 22-25, 2017 41% 57% 2% March 1-4, 2017 44% 55% 1% Jan. 31 - Feb. 2, 2017 42% 56% 2% *Asked of half sample.
@ssrs_solutions | 484.840.4300 | www.ssrs.com | 3
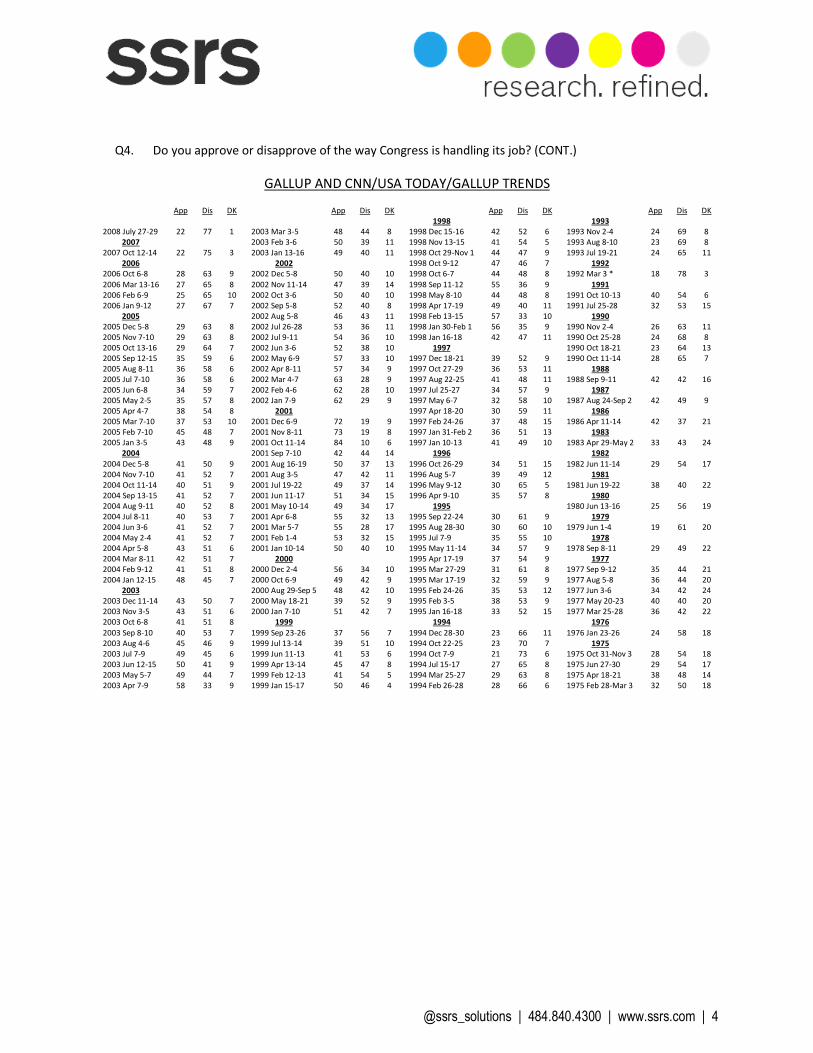
Q11. (LG1) Do you approve or disapprove of the way Congress is handling its job?
Approve Disapprove No opinion January 14-18, 2018 18% 76% 6% August 03-06, 2017* 20% 75% 5% April 22-25, 2017 24% 74% 3% March 1-4, 2017 28% 69% 3% January 12-15, 2017 20% 77% 3% March 17-20, 2016 15% 81% 3% December 17-21, 2015 14% 85% 2% February 12-15, 2015 21% 78% 2% Oct. 24-26, 2014 13% 85% 2% Sept. 5-7, 2014 14% 83% 3% October 18-20, 2013 12% 86% 2% September 27-29, 2013 10% 87% 4% September 6-8, 2013 20% 78% 3% June 11-13, 2013 16% 83% 1% January 14-15, 2013 21% 79% 1% November 2-4, 2012* 17% 74% 9% January 11-12, 2012 11% 86% 2% December 16-18, 2011 16% 83% 1% September 9-11, 2011 15% 84% 1% August 1, 2011 14% 84% 2% January 21-23, 2011 26% 72% 2% January 8-10, 2010 27% 72% 1% October 16-18, 2009 29% 69% 2% April 3-5, 2009 35% 63% 2% February 7-8, 2009 29% 71% * October 3-5, 2008 23% 76% 1% September 19-21, 2008 22% 78% 1% *Asked of half sample
TRENDS CONTINUE ON NEXT PAGE
@ssrs_solutions | 484.840.4300 | www.ssrs.com | 4
Q4. Do you approve or disapprove of the way Congress is handling its job? (CONT.)
GALLUP AND CNN/USA TODAY/GALLUP TRENDS
App Dis DK App Dis DK App Dis DK App Dis DK 1998 1993
2008 July 27-29 22 77 1 2003 Mar 3-5 48 44 8 1998 Dec 15-16 42 52 6 1993 Nov 2-4 24 69 8 2007 2003 Feb 3-6 50 39 11 1998 Nov 13-15 41 54 5 1993 Aug 8-10 23 69 8
2007 Oct 12-14 22 75 3 2003 Jan 13-16 49 40 11 1998 Oct 29-Nov 1 44 47 9 1993 Jul 19-21 24 65 11 2006 2002 1998 Oct 9-12 47 46 7 1992
2006 Oct 6-8 28 63 9 2002 Dec 5-8 50 40 10 1998 Oct 6-7 44 48 8 1992 Mar 3 * 18 78 3 2006 Mar 13-16 27 65 8 2002 Nov 11-14 47 39 14 1998 Sep 11-12 55 36 9 1991 2006 Feb 6-9 25 65 10 2002 Oct 3-6 50 40 10 1998 May 8-10 44 48 8 1991 Oct 10-13 40 54 6 2006 Jan 9-12 27 67 7 2002 Sep 5-8 52 40 8 1998 Apr 17-19 49 40 11 1991 Jul 25-28 32 53 15
2005 2002 Aug 5-8 46 43 11 1998 Feb 13-15 57 33 10 1990 2005 Dec 5-8 29 63 8 2002 Jul 26-28 53 36 11 1998 Jan 30-Feb 1 56 35 9 1990 Nov 2-4 26 63 11 2005 Nov 7-10 29 63 8 2002 Jul 9-11 54 36 10 1998 Jan 16-18 42 47 11 1990 Oct 25-28 24 68 8 2005 Oct 13-16 29 64 7 2002 Jun 3-6 52 38 10 1997 1990 Oct 18-21 23 64 13 2005 Sep 12-15 35 59 6 2002 May 6-9 57 33 10 1997 Dec 18-21 39 52 9 1990 Oct 11-14 28 65 7 2005 Aug 8-11 36 58 6 2002 Apr 8-11 57 34 9 1997 Oct 27-29 36 53 11 1988 2005 Jul 7-10 36 58 6 2002 Mar 4-7 63 28 9 1997 Aug 22-25 41 48 11 1988 Sep 9-11 42 42 16 2005 Jun 6-8 34 59 7 2002 Feb 4-6 62 28 10 1997 Jul 25-27 34 57 9 1987 2005 May 2-5 35 57 8 2002 Jan 7-9 62 29 9 1997 May 6-7 32 58 10 1987 Aug 24-Sep 2 42 49 9 2005 Apr 4-7 38 54 8 2001 1997 Apr 18-20 30 59 11 1986 2005 Mar 7-10 37 53 10 2001 Dec 6-9 72 19 9 1997 Feb 24-26 37 48 15 1986 Apr 11-14 42 37 21 2005 Feb 7-10 45 48 7 2001 Nov 8-11 73 19 8 1997 Jan 31-Feb 2 36 51 13 1983 2005 Jan 3-5 43 48 9 2001 Oct 11-14 84 10 6 1997 Jan 10-13 41 49 10 1983 Apr 29-May 2 33 43 24
2004 2001 Sep 7-10 42 44 14 1996 1982 2004 Dec 5-8 41 50 9 2001 Aug 16-19 50 37 13 1996 Oct 26-29 34 51 15 1982 Jun 11-14 29 54 17 2004 Nov 7-10 41 52 7 2001 Aug 3-5 47 42 11 1996 Aug 5-7 39 49 12 1981 2004 Oct 11-14 40 51 9 2001 Jul 19-22 49 37 14 1996 May 9-12 30 65 5 1981 Jun 19-22 38 40 22 2004 Sep 13-15 41 52 7 2001 Jun 11-17 51 34 15 1996 Apr 9-10 35 57 8 1980 2004 Aug 9-11 40 52 8 2001 May 10-14 49 34 17 1995 1980 Jun 13-16 25 56 19 2004 Jul 8-11 40 53 7 2001 Apr 6-8 55 32 13 1995 Sep 22-24 30 61 9 1979 2004 Jun 3-6 41 52 7 2001 Mar 5-7 55 28 17 1995 Aug 28-30 30 60 10 1979 Jun 1-4 19 61 20 2004 May 2-4 41 52 7 2001 Feb 1-4 53 32 15 1995 Jul 7-9 35 55 10 1978 2004 Apr 5-8 43 51 6 2001 Jan 10-14 50 40 10 1995 May 11-14 34 57 9 1978 Sep 8-11 29 49 22 2004 Mar 8-11 42 51 7 2000 1995 Apr 17-19 37 54 9 1977 2004 Feb 9-12 41 51 8 2000 Dec 2-4 56 34 10 1995 Mar 27-29 31 61 8 1977 Sep 9-12 35 44 21 2004 Jan 12-15 48 45 7 2000 Oct 6-9 49 42 9 1995 Mar 17-19 32 59 9 1977 Aug 5-8 36 44 20
2003 2000 Aug 29-Sep 5 48 42 10 1995 Feb 24-26 35 53 12 1977 Jun 3-6 34 42 24 2003 Dec 11-14 43 50 7 2000 May 18-21 39 52 9 1995 Feb 3-5 38 53 9 1977 May 20-23 40 40 20 2003 Nov 3-5 43 51 6 2000 Jan 7-10 51 42 7 1995 Jan 16-18 33 52 15 1977 Mar 25-28 36 42 22 2003 Oct 6-8 41 51 8 1999 1994 1976 2003 Sep 8-10 40 53 7 1999 Sep 23-26 37 56 7 1994 Dec 28-30 23 66 11 1976 Jan 23-26 24 58 18 2003 Aug 4-6 45 46 9 1999 Jul 13-14 39 51 10 1994 Oct 22-25 23 70 7 1975 2003 Jul 7-9 49 45 6 1999 Jun 11-13 41 53 6 1994 Oct 7-9 21 73 6 1975 Oct 31-Nov 3 28 54 18 2003 Jun 12-15 50 41 9 1999 Apr 13-14 45 47 8 1994 Jul 15-17 27 65 8 1975 Jun 27-30 29 54 17 2003 May 5-7 49 44 7 1999 Feb 12-13 41 54 5 1994 Mar 25-27 29 63 8 1975 Apr 18-21 38 48 14 2003 Apr 7-9 58 33 9 1999 Jan 15-17 50 46 4 1994 Feb 26-28 28 66 6 1975 Feb 28-Mar 3 32 50 18
@ssrs_solutions | 484.840.4300 | www.ssrs.com | 5
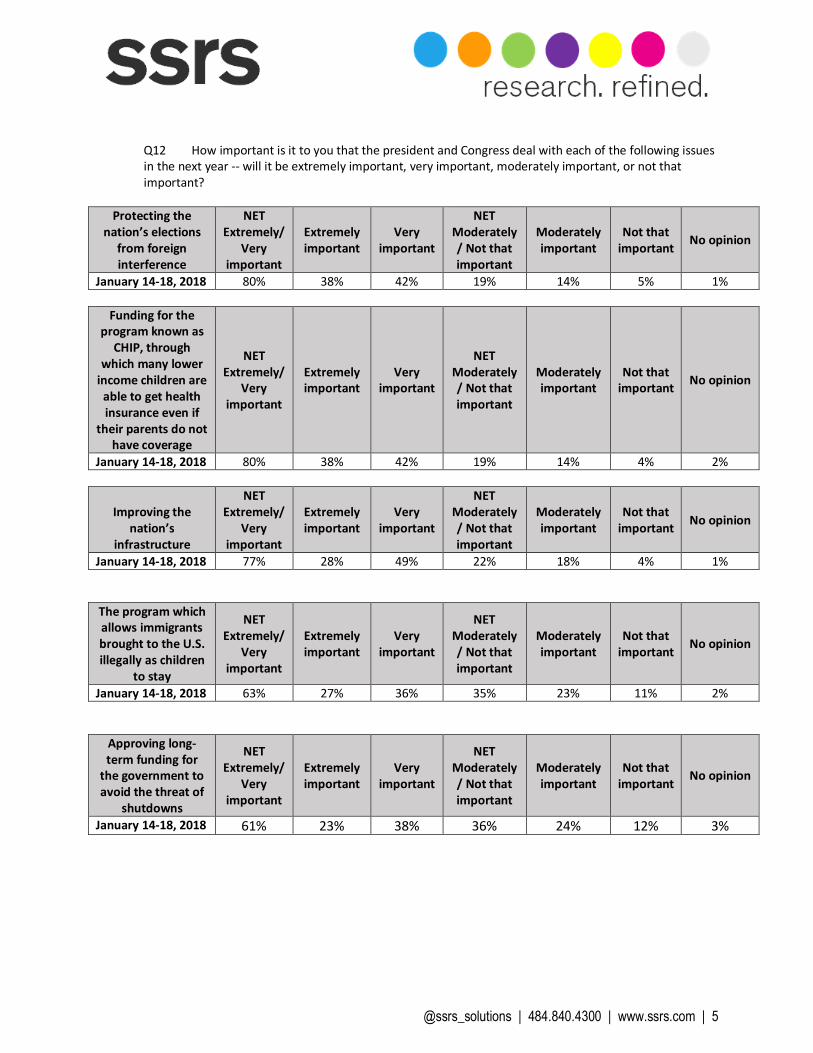
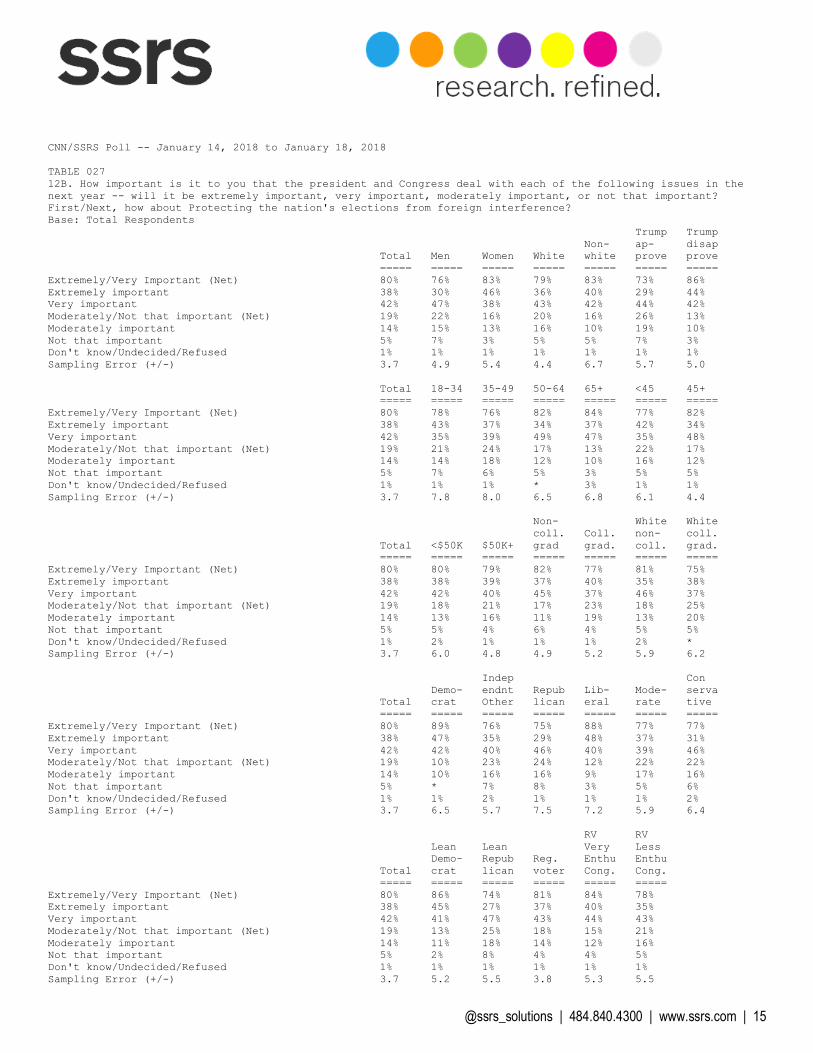
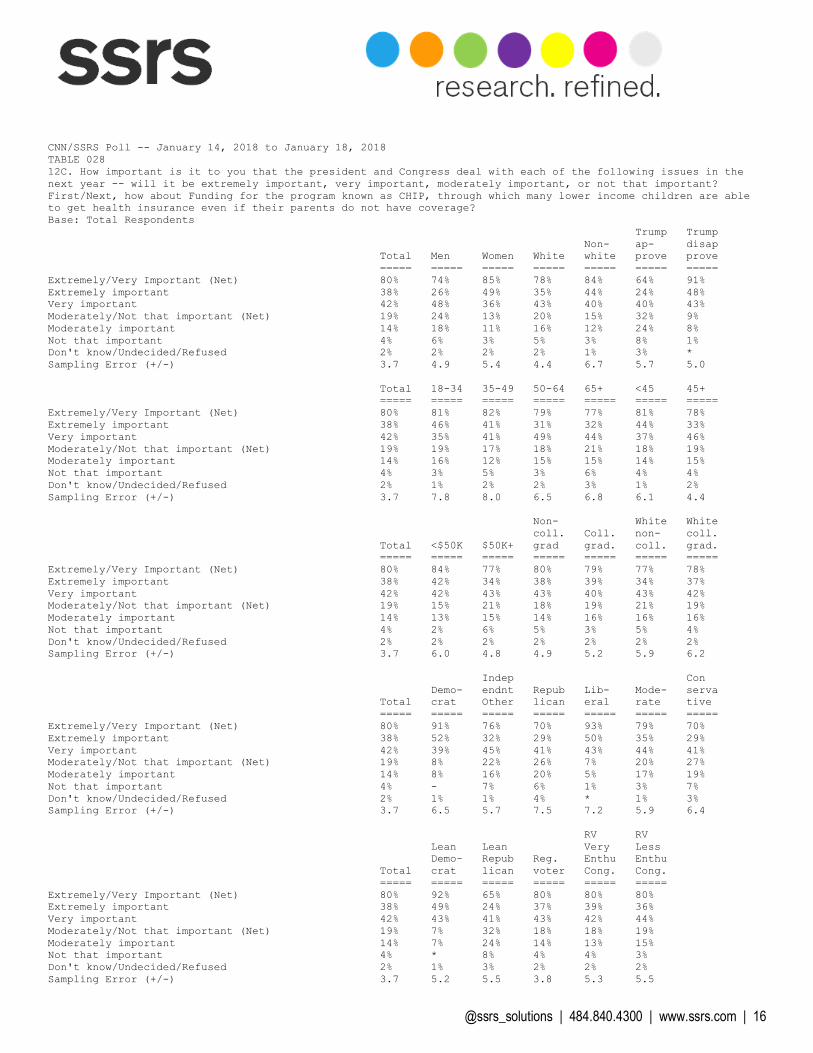
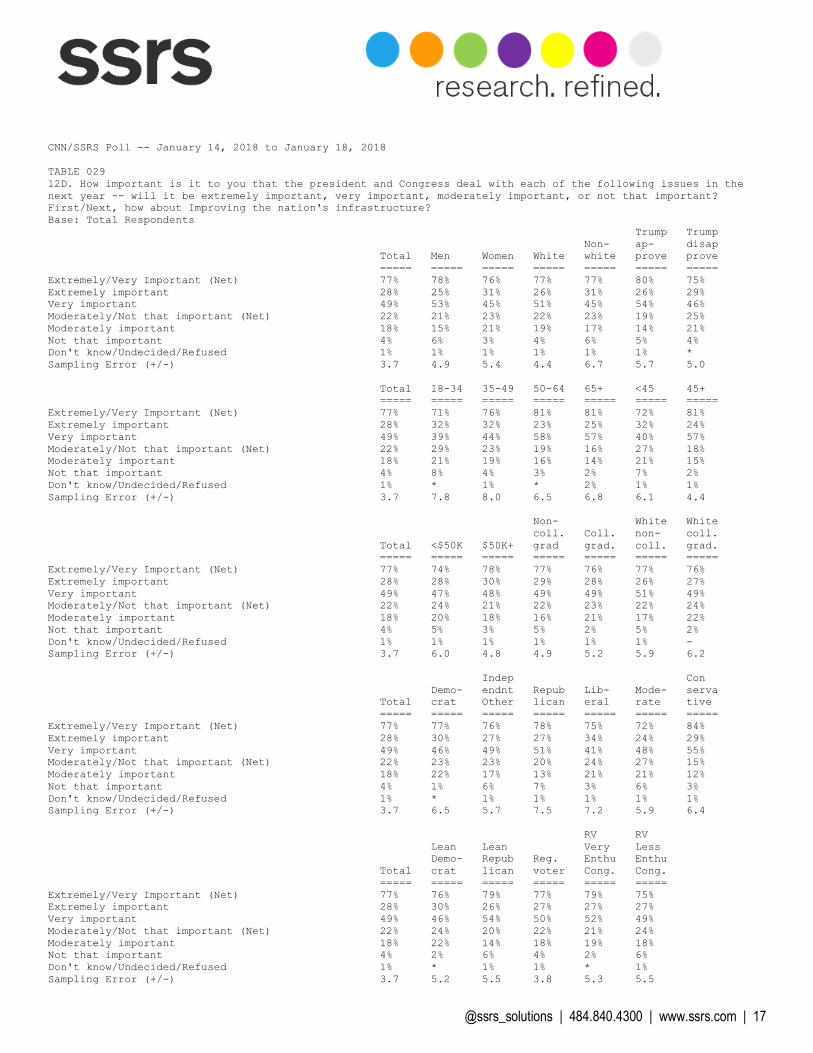
Q12 How important is it to you that the president and Congress deal with each of the following issues in the next year -- will it be extremely important, very important, moderately important, or not that important?
Protecting the
nation’s elections from foreign interference
NET Extremely/
Very important
Extremely important
Very important
NET Moderately/ Not that important
Moderately important
Not that important No opinion
January 14-18, 2018 80% 38% 42% 19% 14% 5% 1%
Funding for the program known as
CHIP, through which many lower
income children are able to get health insurance even if
their parents do not have coverage
NET Extremely/
Very important
Extremely important
Very important
NET Moderately/ Not that important
Moderately important
Not that important No opinion
January 14-18, 2018 80% 38% 42% 19% 14% 4% 2%
Improving the nation’s
infrastructure
NET Extremely/
Very important
Extremely important
Very important
NET Moderately/ Not that important
Moderately important
Not that important No opinion
January 14-18, 2018 77% 28% 49% 22% 18% 4% 1% The program which allows immigrants brought to the U.S. illegally as children
to stay
NET Extremely/
Very important
Extremely important
Very important
NET Moderately/ Not that important
Moderately important
Not that important No opinion
January 14-18, 2018 63% 27% 36% 35% 23% 11% 2%
Approving long-term funding for
the government to avoid the threat of
shutdowns
NET Extremely/
Very important
Extremely important
Very important
NET Moderately/ Not that important
Moderately important
Not that important No opinion
January 14-18, 2018 61% 23% 38% 36% 24% 12% 3%
@ssrs_solutions | 484.840.4300 | www.ssrs.com | 6
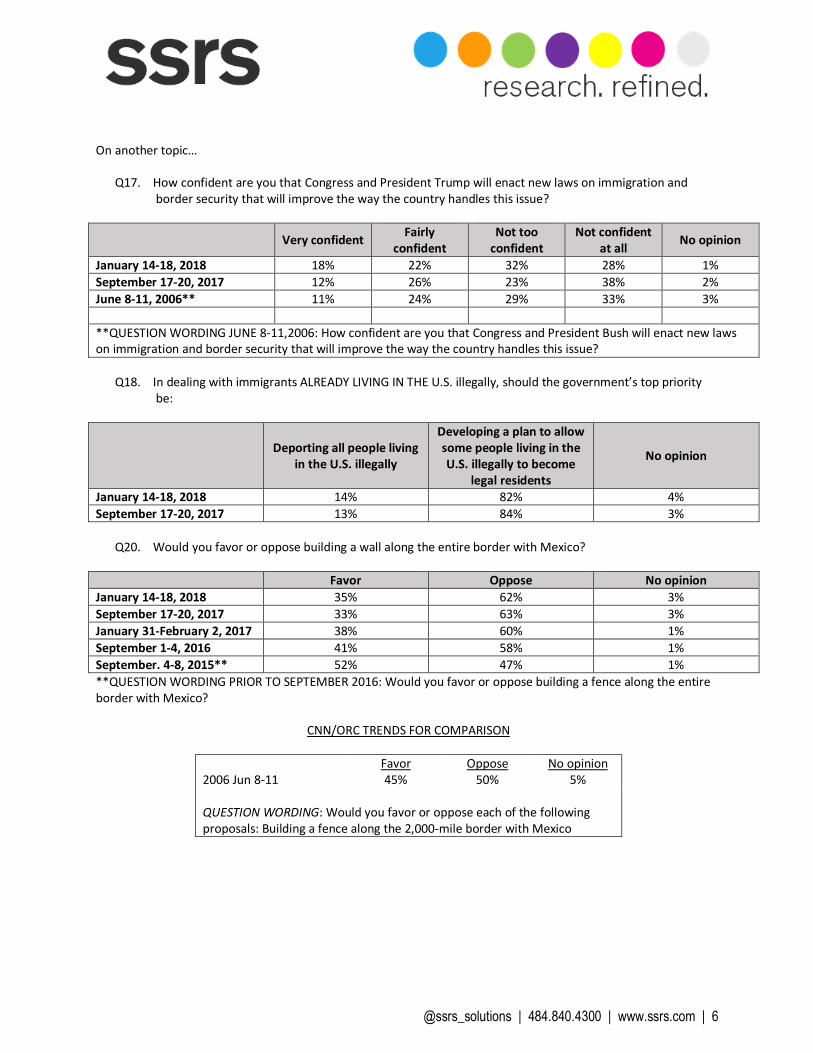
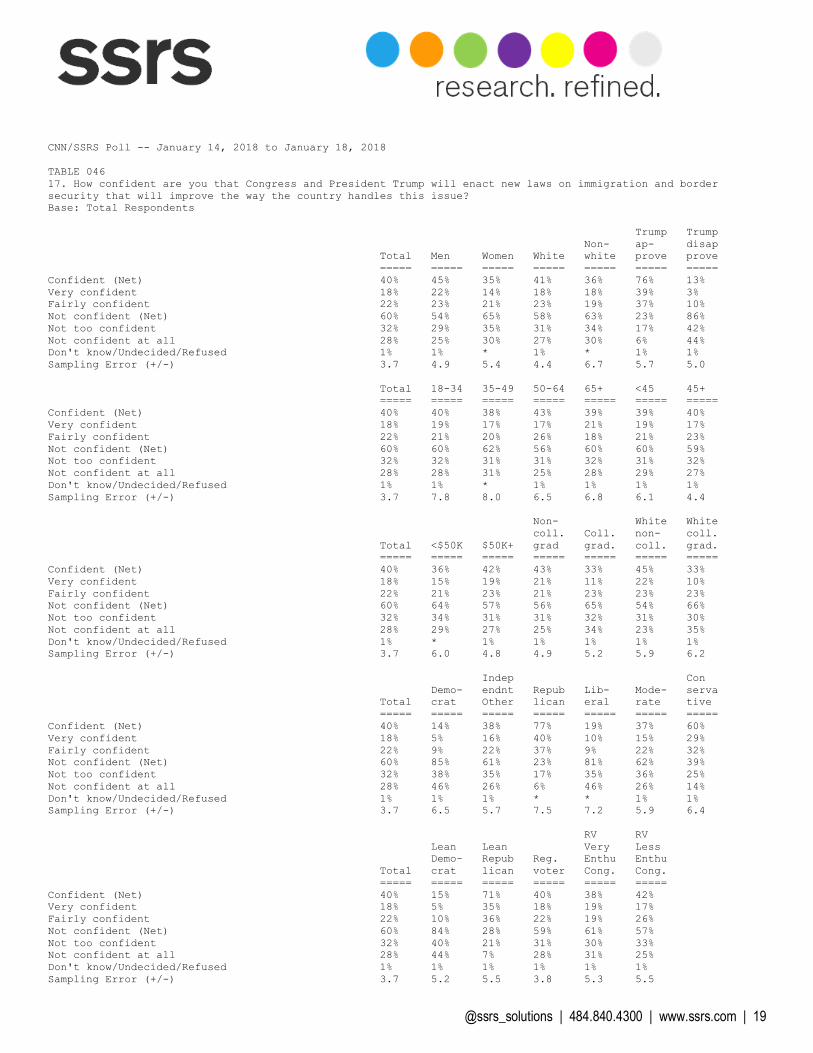
On another topic… Q17. How confident are you that Congress and President Trump will enact new laws on immigration and
border security that will improve the way the country handles this issue?
Very confident Fairly confident
Not too confident
Not confident at all No opinion
January 14-18, 2018 18% 22% 32% 28% 1% September 17-20, 2017 12% 26% 23% 38% 2% June 8-11, 2006** 11% 24% 29% 33% 3% **QUESTION WORDING JUNE 8-11,2006: How confident are you that Congress and President Bush will enact new laws on immigration and border security that will improve the way the country handles this issue? Q18. In dealing with immigrants ALREADY LIVING IN THE U.S. illegally, should the government’s top priority
be:
Deporting all people living in the U.S. illegally
Developing a plan to allow some people living in the U.S. illegally to become
legal residents
No opinion
January 14-18, 2018 14% 82% 4% September 17-20, 2017 13% 84% 3% Q20. Would you favor or oppose building a wall along the entire border with Mexico?
Favor Oppose No opinion January 14-18, 2018 35% 62% 3% September 17-20, 2017 33% 63% 3% January 31-February 2, 2017 38% 60% 1% September 1-4, 2016 41% 58% 1% September. 4-8, 2015** 52% 47% 1% **QUESTION WORDING PRIOR TO SEPTEMBER 2016: Would you favor or oppose building a fence along the entire border with Mexico?
CNN/ORC TRENDS FOR COMPARISON Favor Oppose No opinion 2006 Jun 8-11 45% 50% 5% QUESTION WORDING: Would you favor or oppose each of the following proposals: Building a fence along the 2,000-mile border with Mexico
@ssrs_solutions | 484.840.4300 | www.ssrs.com | 7
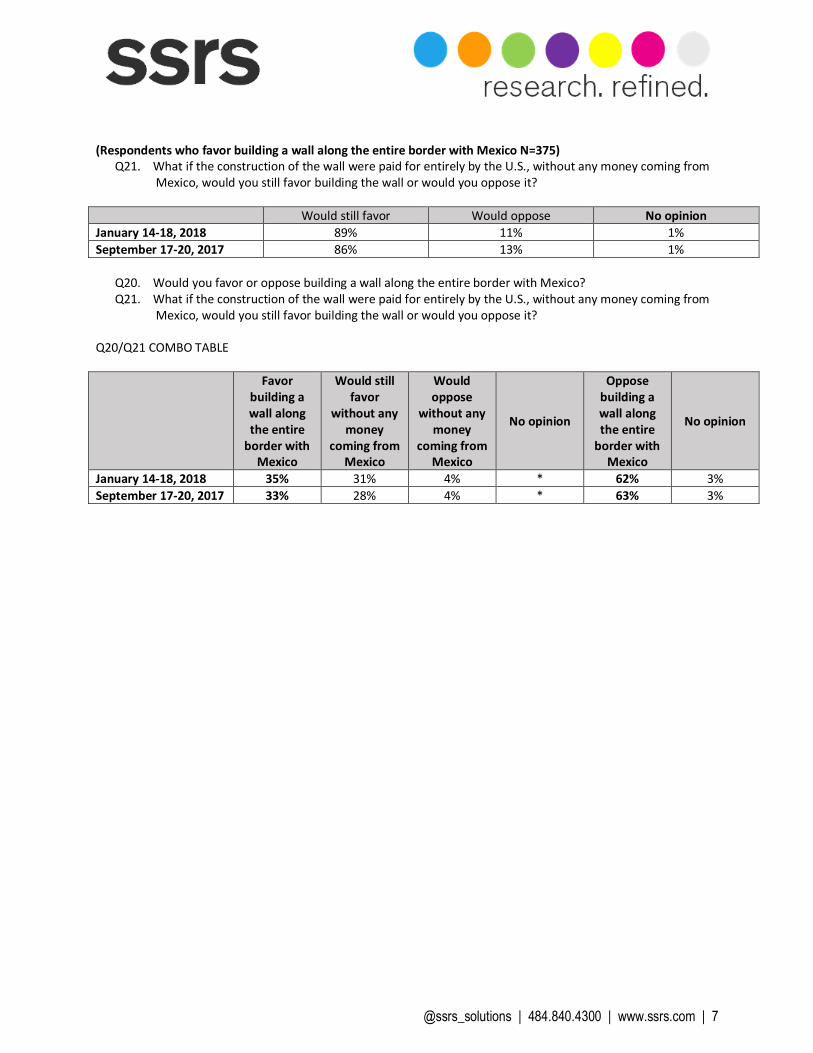
(Respondents who favor building a wall along the entire border with Mexico N=375) Q21. What if the construction of the wall were paid for entirely by the U.S., without any money coming from
Mexico, would you still favor building the wall or would you oppose it?
Would still favor Would oppose No opinion January 14-18, 2018 89% 11% 1% September 17-20, 2017 86% 13% 1% Q20. Would you favor or oppose building a wall along the entire border with Mexico? Q21. What if the construction of the wall were paid for entirely by the U.S., without any money coming from
Mexico, would you still favor building the wall or would you oppose it? Q20/Q21 COMBO TABLE
Favor building a wall along the entire
border with Mexico
Would still favor
without any money
coming from Mexico
Would oppose
without any money
coming from Mexico
No opinion
Oppose building a wall along the entire
border with Mexico
No opinion
January 14-18, 2018 35% 31% 4% * 62% 3% September 17-20, 2017 33% 28% 4% * 63% 3%
@ssrs_solutions | 484.840.4300 | www.ssrs.com | 8
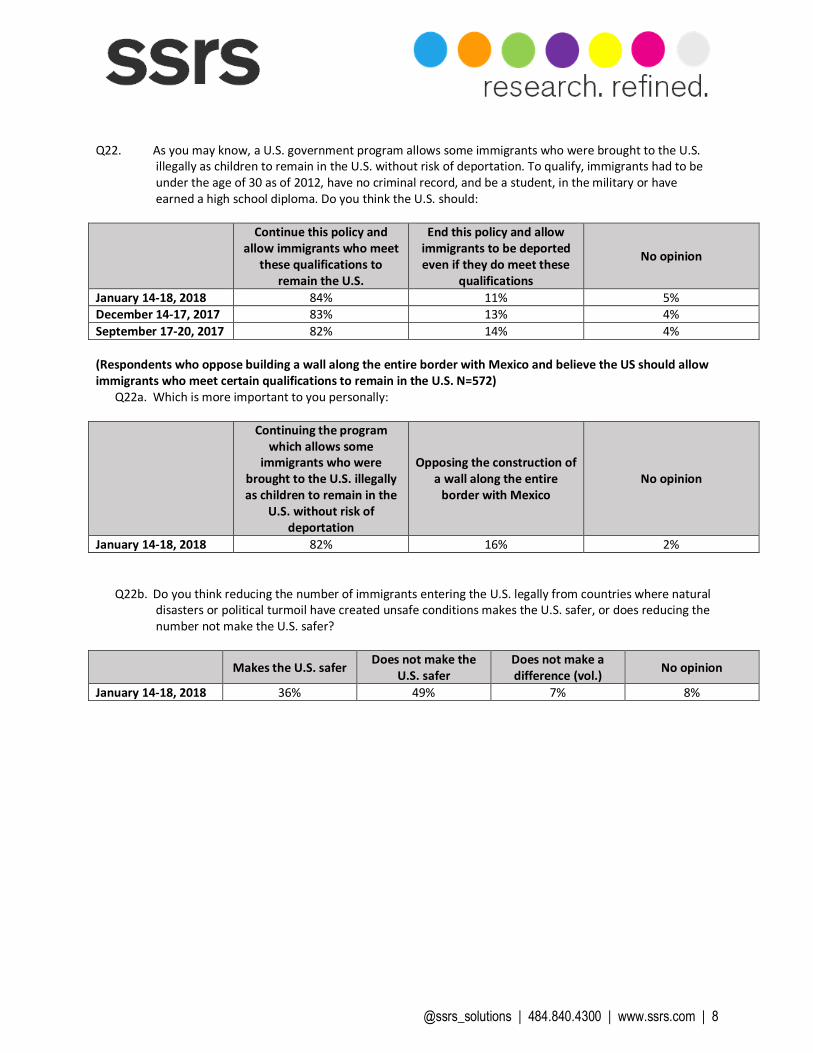
Q22. As you may know, a U.S. government program allows some immigrants who were brought to the U.S. illegally as children to remain in the U.S. without risk of deportation. To qualify, immigrants had to be under the age of 30 as of 2012, have no criminal record, and be a student, in the military or have earned a high school diploma. Do you think the U.S. should:
Continue this policy and allow immigrants who meet
these qualifications to remain the U.S.
End this policy and allow immigrants to be deported even if they do meet these
qualifications
No opinion
January 14-18, 2018 84% 11% 5% December 14-17, 2017 83% 13% 4% September 17-20, 2017 82% 14% 4% (Respondents who oppose building a wall along the entire border with Mexico and believe the US should allow immigrants who meet certain qualifications to remain in the U.S. N=572) Q22a. Which is more important to you personally:
Continuing the program which allows some
immigrants who were brought to the U.S. illegally as children to remain in the
U.S. without risk of deportation
Opposing the construction of a wall along the entire
border with Mexico No opinion
January 14-18, 2018 82% 16% 2% Q22b. Do you think reducing the number of immigrants entering the U.S. legally from countries where natural
disasters or political turmoil have created unsafe conditions makes the U.S. safer, or does reducing the number not make the U.S. safer?
Makes the U.S. safer Does not make the U.S. safer
Does not make a difference (vol.) No opinion
January 14-18, 2018 36% 49% 7% 8%
@ssrs_solutions | 484.840.4300 | www.ssrs.com | 9
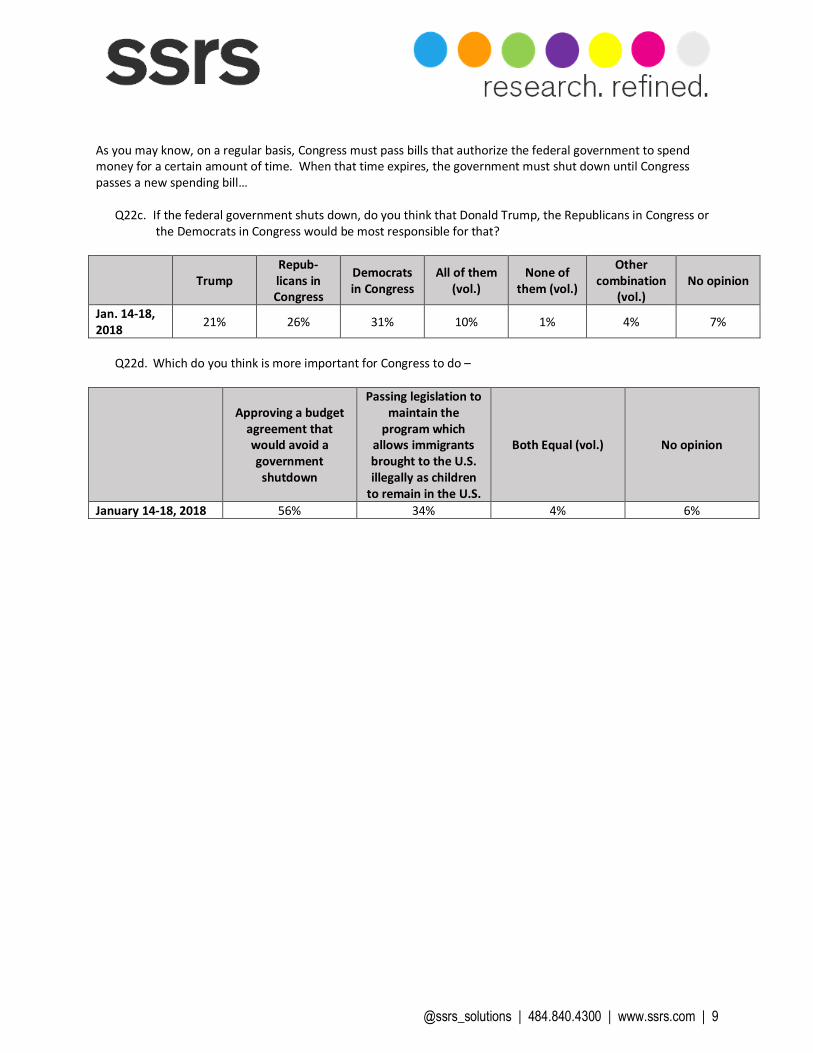
As you may know, on a regular basis, Congress must pass bills that authorize the federal government to spend money for a certain amount of time. When that time expires, the government must shut down until Congress passes a new spending bill… Q22c. If the federal government shuts down, do you think that Donald Trump, the Republicans in Congress or
the Democrats in Congress would be most responsible for that?
Trump
Repub- licans in Congress
Democrats in Congress
All of them (vol.)
None of them (vol.)
Other combination
(vol.) No opinion
Jan. 14-18, 2018 21% 26% 31% 10% 1% 4% 7%
Q22d. Which do you think is more important for Congress to do –
Approving a budget agreement that would avoid a government
shutdown
Passing legislation to maintain the
program which allows immigrants brought to the U.S. illegally as children
to remain in the U.S.
Both Equal (vol.) No opinion
January 14-18, 2018 56% 34% 4% 6%
@ssrs_solutions | 484.840.4300 | www.ssrs.com | 10
MORE ON METHODOLOGY
A total of 1,005 adults were interviewed by telephone nationwide by live interviewers calling both landline and cell phones. Interviews were conducted in English and Spanish. Interviews were conducted Janurary 14-18, 2018, however no interviews were conducted on Janruary 16th due to weather conditions at call center locations. Among the entire sample, 33% described themselves as Democrats, 24% described themselves as Republicans, and 43% described themselves as independents or members of another party. All respondents were asked questions concerning basic demographics, and the entire sample was weighted to reflect national Census figures for gender, race, age, education, region of country, and telephone usage. Results for the full sample have a margin of sampling error of +/-3.7 percentage points. For the sample of 913 registered voters, it is +/-3.8 percentage points. Crosstabs on the following pages only include results for subgroups with enough unweighted cases to produce a sampling error of +/-8.5 percentage points or less once adjusted for design effect. Some subgroups represent too small a share of the national population to produce crosstabs with an acceptable sampling error. Interviews were conducted among these subgroups, but results for groups with a design-effect adjusted sampling error larger than +/-8.5 percentage points are not displayed and instead are denoted with "N/A".
@ssrs_solutions | 484.840.4300 | www.ssrs.com | 11
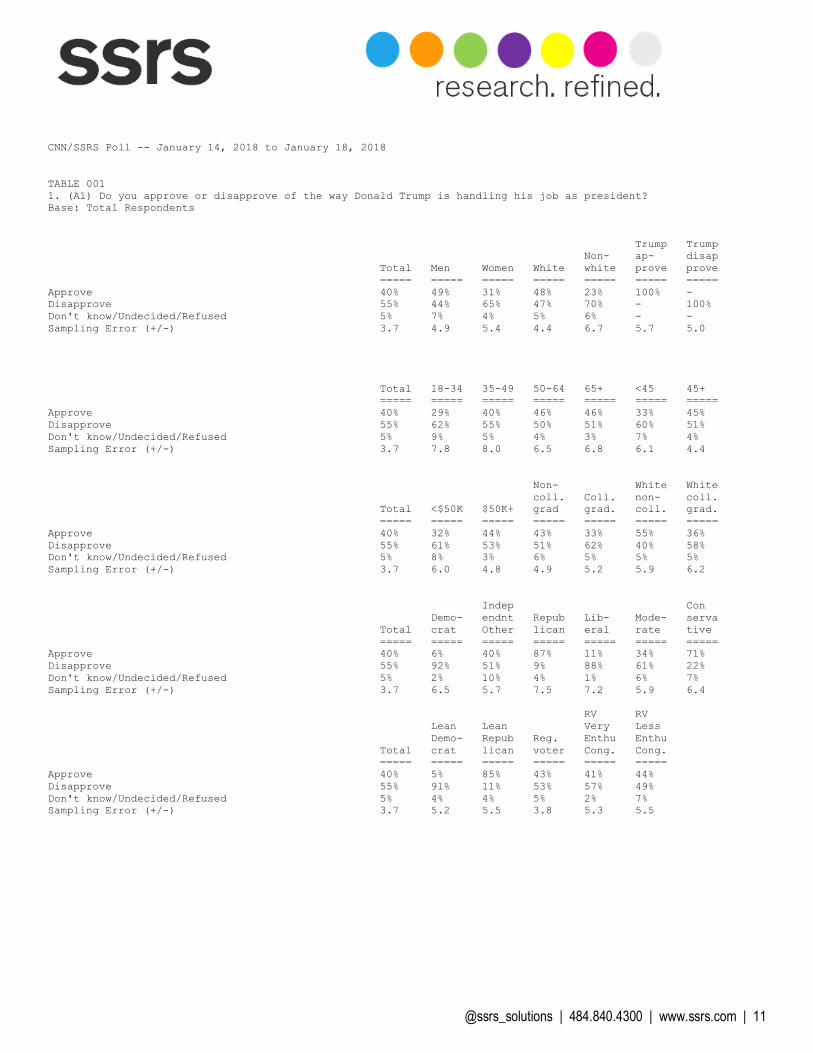
CNN/SSRS Poll -- January 14, 2018 to January 18, 2018 TABLE 001 1. (A1) Do you approve or disapprove of the way Donald Trump is handling his job as president? Base: Total Respondents Trump Trump Non- ap- disap Total Men Women White white prove prove ===== ===== ===== ===== ===== ===== ===== Approve 40% 49% 31% 48% 23% 100% - Disapprove 55% 44% 65% 47% 70% - 100% Don't know/Undecided/Refused 5% 7% 4% 5% 6% - - Sampling Error (+/-) 3.7 4.9 5.4 4.4 6.7 5.7 5.0 Total 18-34 35-49 50-64 65+ <45 45+ ===== ===== ===== ===== ===== ===== ===== Approve 40% 29% 40% 46% 46% 33% 45% Disapprove 55% 62% 55% 50% 51% 60% 51% Don't know/Undecided/Refused 5% 9% 5% 4% 3% 7% 4% Sampling Error (+/-) 3.7 7.8 8.0 6.5 6.8 6.1 4.4 Non- White White coll. Coll. non- coll. Total <$50K $50K+ grad grad. coll. grad. ===== ===== ===== ===== ===== ===== ===== Approve 40% 32% 44% 43% 33% 55% 36% Disapprove 55% 61% 53% 51% 62% 40% 58% Don't know/Undecided/Refused 5% 8% 3% 6% 5% 5% 5% Sampling Error (+/-) 3.7 6.0 4.8 4.9 5.2 5.9 6.2 Indep Con Demo- endnt Repub Lib- Mode- serva Total crat Other lican eral rate tive ===== ===== ===== ===== ===== ===== ===== Approve 40% 6% 40% 87% 11% 34% 71% Disapprove 55% 92% 51% 9% 88% 61% 22% Don't know/Undecided/Refused 5% 2% 10% 4% 1% 6% 7% Sampling Error (+/-) 3.7 6.5 5.7 7.5 7.2 5.9 6.4 RV RV Lean Lean Very Less Demo- Repub Reg. Enthu Enthu Total crat lican voter Cong. Cong. ===== ===== ===== ===== ===== ===== Approve 40% 5% 85% 43% 41% 44% Disapprove 55% 91% 11% 53% 57% 49% Don't know/Undecided/Refused 5% 4% 4% 5% 2% 7% Sampling Error (+/-) 3.7 5.2 5.5 3.8 5.3 5.5

@ssrs_solutions | 484.840.4300 | www.ssrs.com | 12
CNN/SSRS Poll -- January 14, 2018 to January 18, 2018 TABLE 006 2E. (A2e) Do you approve or disapprove of the way Donald Trump is handling Immigration? Base: Total Respondents Trump Trump Non- ap- disap Total Men Women White white prove prove ===== ===== ===== ===== ===== ===== ===== Approve 38% 46% 29% 46% 21% 86% 3% Disapprove 57% 47% 67% 50% 71% 8% 95% Don't know/Undecided/Refused 5% 7% 4% 4% 7% 5% 2% Sampling Error (+/-) 3.7 4.9 5.4 4.4 6.7 5.7 5.0 Total 18-34 35-49 50-64 65+ <45 45+ ===== ===== ===== ===== ===== ===== ===== Approve 38% 27% 43% 40% 42% 33% 41% Disapprove 57% 65% 55% 54% 52% 61% 54% Don't know/Undecided/Refused 5% 8% 2% 6% 5% 6% 5% Sampling Error (+/-) 3.7 7.8 8.0 6.5 6.8 6.1 4.4 Non- White White coll. Coll. non- coll. Total <$50K $50K+ grad grad. coll. grad. ===== ===== ===== ===== ===== ===== ===== Approve 38% 30% 41% 40% 34% 50% 39% Disapprove 57% 64% 54% 53% 63% 44% 60% Don't know/Undecided/Refused 5% 5% 4% 7% 2% 6% 1% Sampling Error (+/-) 3.7 6.0 4.8 4.9 5.2 5.9 6.2 Indep Con Demo- endnt Repub Lib- Mode- serva Total crat Other lican eral rate tive ===== ===== ===== ===== ===== ===== ===== Approve 38% 6% 39% 81% 9% 32% 69% Disapprove 57% 93% 52% 14% 89% 62% 27% Don't know/Undecided/Refused 5% 1% 8% 5% 3% 6% 5% Sampling Error (+/-) 3.7 6.5 5.7 7.5 7.2 5.9 6.4 RV RV Lean Lean Very Less Demo- Repub Reg. Enthu Enthu Total crat lican voter Cong. Cong. ===== ===== ===== ===== ===== ===== Approve 38% 7% 79% 41% 40% 42% Disapprove 57% 90% 15% 54% 58% 51% Don't know/Undecided/Refused 5% 3% 6% 5% 2% 7% Sampling Error (+/-) 3.7 5.2 5.5 3.8 5.3 5.5
@ssrs_solutions | 484.840.4300 | www.ssrs.com | 13
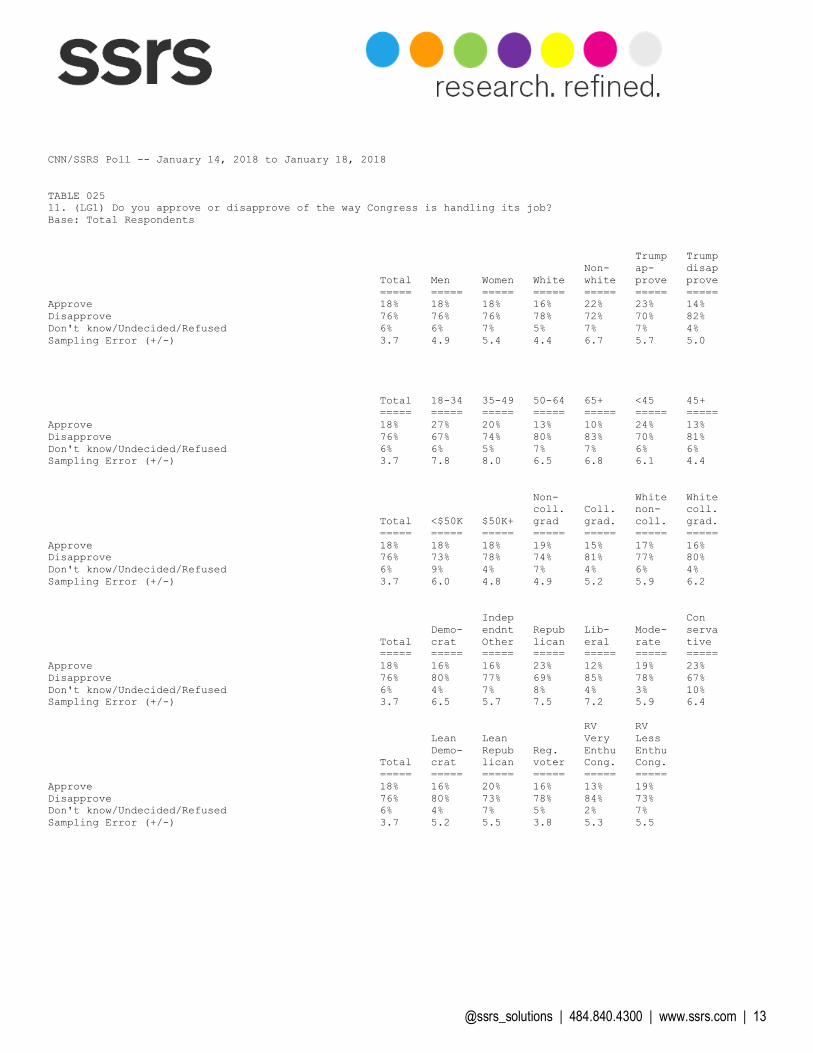
CNN/SSRS Poll -- January 14, 2018 to January 18, 2018 TABLE 025 11. (LG1) Do you approve or disapprove of the way Congress is handling its job? Base: Total Respondents Trump Trump Non- ap- disap Total Men Women White white prove prove ===== ===== ===== ===== ===== ===== ===== Approve 18% 18% 18% 16% 22% 23% 14% Disapprove 76% 76% 76% 78% 72% 70% 82% Don't know/Undecided/Refused 6% 6% 7% 5% 7% 7% 4% Sampling Error (+/-) 3.7 4.9 5.4 4.4 6.7 5.7 5.0 Total 18-34 35-49 50-64 65+ <45 45+ ===== ===== ===== ===== ===== ===== ===== Approve 18% 27% 20% 13% 10% 24% 13% Disapprove 76% 67% 74% 80% 83% 70% 81% Don't know/Undecided/Refused 6% 6% 5% 7% 7% 6% 6% Sampling Error (+/-) 3.7 7.8 8.0 6.5 6.8 6.1 4.4 Non- White White coll. Coll. non- coll. Total <$50K $50K+ grad grad. coll. grad. ===== ===== ===== ===== ===== ===== ===== Approve 18% 18% 18% 19% 15% 17% 16% Disapprove 76% 73% 78% 74% 81% 77% 80% Don't know/Undecided/Refused 6% 9% 4% 7% 4% 6% 4% Sampling Error (+/-) 3.7 6.0 4.8 4.9 5.2 5.9 6.2 Indep Con Demo- endnt Repub Lib- Mode- serva Total crat Other lican eral rate tive ===== ===== ===== ===== ===== ===== ===== Approve 18% 16% 16% 23% 12% 19% 23% Disapprove 76% 80% 77% 69% 85% 78% 67% Don't know/Undecided/Refused 6% 4% 7% 8% 4% 3% 10% Sampling Error (+/-) 3.7 6.5 5.7 7.5 7.2 5.9 6.4 RV RV Lean Lean Very Less Demo- Repub Reg. Enthu Enthu Total crat lican voter Cong. Cong. ===== ===== ===== ===== ===== ===== Approve 18% 16% 20% 16% 13% 19% Disapprove 76% 80% 73% 78% 84% 73% Don't know/Undecided/Refused 6% 4% 7% 5% 2% 7% Sampling Error (+/-) 3.7 5.2 5.5 3.8 5.3 5.5

@ssrs_solutions | 484.840.4300 | www.ssrs.com | 14
CNN/SSRS Poll -- January 14, 2018 to January 18, 2018 TABLE 026 12A. How important is it to you that the president and Congress deal with each of the following issues in the next year -- will it be extremely important, very important, moderately important, or not that important? First/Next, how about The program which allows immigrants brought to the U.S. illegally as children to stay? Base: Total Respondents Trump Trump Non- ap- disap Total Men Women White white prove prove ===== ===== ===== ===== ===== ===== ===== Extremely/Very Important (Net) 63% 57% 69% 60% 69% 44% 78% Extremely important 27% 22% 33% 24% 33% 15% 36% Very important 36% 35% 37% 36% 36% 29% 43% Moderately/Not that important (Net) 35% 41% 28% 38% 29% 53% 21% Moderately important 23% 25% 22% 26% 20% 32% 17% Not that important 11% 16% 6% 12% 9% 21% 4% Don't know/Undecided/Refused 2% 2% 3% 3% 1% 4% 1% Sampling Error (+/-) 3.7 4.9 5.4 4.4 6.7 5.7 5.0 Total 18-34 35-49 50-64 65+ <45 45+ ===== ===== ===== ===== ===== ===== ===== Extremely/Very Important (Net) 63% 61% 64% 62% 66% 61% 65% Extremely important 27% 33% 27% 22% 28% 30% 25% Very important 36% 29% 37% 40% 39% 31% 40% Moderately/Not that important (Net) 35% 38% 33% 37% 29% 37% 33% Moderately important 23% 25% 21% 26% 21% 24% 23% Not that important 11% 13% 12% 11% 7% 13% 10% Don't know/Undecided/Refused 2% 1% 3% 1% 5% 2% 2% Sampling Error (+/-) 3.7 7.8 8.0 6.5 6.8 6.1 4.4 Non- White White coll. Coll. non- coll. Total <$50K $50K+ grad grad. coll. grad. ===== ===== ===== ===== ===== ===== ===== Extremely/Very Important (Net) 63% 68% 60% 61% 67% 57% 66% Extremely important 27% 31% 26% 27% 28% 23% 25% Very important 36% 37% 35% 34% 39% 33% 41% Moderately/Not that important (Net) 35% 30% 37% 37% 31% 40% 33% Moderately important 23% 22% 25% 24% 24% 27% 25% Not that important 11% 8% 13% 13% 7% 14% 8% Don't know/Undecided/Refused 2% 2% 2% 2% 2% 3% 2% Sampling Error (+/-) 3.7 6.0 4.8 4.9 5.2 5.9 6.2 Indep Con Demo- endnt Repub Lib- Mode- serva Total crat Other lican eral rate tive ===== ===== ===== ===== ===== ===== ===== Extremely/Very Important (Net) 63% 80% 61% 45% 75% 62% 55% Extremely important 27% 38% 25% 15% 40% 23% 20% Very important 36% 42% 36% 29% 35% 38% 35% Moderately/Not that important (Net) 35% 19% 36% 52% 24% 36% 41% Moderately important 23% 15% 23% 33% 19% 26% 26% Not that important 11% 4% 13% 19% 6% 11% 16% Don't know/Undecided/Refused 2% * 3% 3% 1% 2% 3% Sampling Error (+/-) 3.7 6.5 5.7 7.5 7.2 5.9 6.4 Lean Lean Very Less Demo- Repub Reg. Enthu Enthu Total crat lican voter Cong. Cong. ===== ===== ===== ===== ===== ===== Extremely/Very Important (Net) 63% 79% 44% 62% 71% 55% Extremely important 27% 36% 15% 26% 28% 24% Very important 36% 43% 29% 36% 43% 31% Moderately/Not that important (Net) 35% 20% 52% 35% 27% 43% Moderately important 23% 16% 33% 24% 17% 31% Not that important 11% 4% 19% 11% 10% 12% Don't know/Undecided/Refused 2% 1% 4% 2% 2% 2% Sampling Error (+/-) 3.7 5.2 5.5 3.8 5.3 5.5
@ssrs_solutions | 484.840.4300 | www.ssrs.com | 15
CNN/SSRS Poll -- January 14, 2018 to January 18, 2018 TABLE 027 12B. How important is it to you that the president and Congress deal with each of the following issues in the next year -- will it be extremely important, very important, moderately important, or not that important? First/Next, how about Protecting the nation's elections from foreign interference? Base: Total Respondents Trump Trump Non- ap- disap Total Men Women White white prove prove ===== ===== ===== ===== ===== ===== ===== Extremely/Very Important (Net) 80% 76% 83% 79% 83% 73% 86% Extremely important 38% 30% 46% 36% 40% 29% 44% Very important 42% 47% 38% 43% 42% 44% 42% Moderately/Not that important (Net) 19% 22% 16% 20% 16% 26% 13% Moderately important 14% 15% 13% 16% 10% 19% 10% Not that important 5% 7% 3% 5% 5% 7% 3% Don't know/Undecided/Refused 1% 1% 1% 1% 1% 1% 1% Sampling Error (+/-) 3.7 4.9 5.4 4.4 6.7 5.7 5.0 Total 18-34 35-49 50-64 65+ <45 45+ ===== ===== ===== ===== ===== ===== ===== Extremely/Very Important (Net) 80% 78% 76% 82% 84% 77% 82% Extremely important 38% 43% 37% 34% 37% 42% 34% Very important 42% 35% 39% 49% 47% 35% 48% Moderately/Not that important (Net) 19% 21% 24% 17% 13% 22% 17% Moderately important 14% 14% 18% 12% 10% 16% 12% Not that important 5% 7% 6% 5% 3% 5% 5% Don't know/Undecided/Refused 1% 1% 1% * 3% 1% 1% Sampling Error (+/-) 3.7 7.8 8.0 6.5 6.8 6.1 4.4 Non- White White coll. Coll. non- coll. Total <$50K $50K+ grad grad. coll. grad. ===== ===== ===== ===== ===== ===== ===== Extremely/Very Important (Net) 80% 80% 79% 82% 77% 81% 75% Extremely important 38% 38% 39% 37% 40% 35% 38% Very important 42% 42% 40% 45% 37% 46% 37% Moderately/Not that important (Net) 19% 18% 21% 17% 23% 18% 25% Moderately important 14% 13% 16% 11% 19% 13% 20% Not that important 5% 5% 4% 6% 4% 5% 5% Don't know/Undecided/Refused 1% 2% 1% 1% 1% 2% * Sampling Error (+/-) 3.7 6.0 4.8 4.9 5.2 5.9 6.2 Indep Con Demo- endnt Repub Lib- Mode- serva Total crat Other lican eral rate tive ===== ===== ===== ===== ===== ===== ===== Extremely/Very Important (Net) 80% 89% 76% 75% 88% 77% 77% Extremely important 38% 47% 35% 29% 48% 37% 31% Very important 42% 42% 40% 46% 40% 39% 46% Moderately/Not that important (Net) 19% 10% 23% 24% 12% 22% 22% Moderately important 14% 10% 16% 16% 9% 17% 16% Not that important 5% * 7% 8% 3% 5% 6% Don't know/Undecided/Refused 1% 1% 2% 1% 1% 1% 2% Sampling Error (+/-) 3.7 6.5 5.7 7.5 7.2 5.9 6.4 RV RV Lean Lean Very Less Demo- Repub Reg. Enthu Enthu Total crat lican voter Cong. Cong. ===== ===== ===== ===== ===== ===== Extremely/Very Important (Net) 80% 86% 74% 81% 84% 78% Extremely important 38% 45% 27% 37% 40% 35% Very important 42% 41% 47% 43% 44% 43% Moderately/Not that important (Net) 19% 13% 25% 18% 15% 21% Moderately important 14% 11% 18% 14% 12% 16% Not that important 5% 2% 8% 4% 4% 5% Don't know/Undecided/Refused 1% 1% 1% 1% 1% 1% Sampling Error (+/-) 3.7 5.2 5.5 3.8 5.3 5.5
@ssrs_solutions | 484.840.4300 | www.ssrs.com | 16
CNN/SSRS Poll -- January 14, 2018 to January 18, 2018 TABLE 028 12C. How important is it to you that the president and Congress deal with each of the following issues in the next year -- will it be extremely important, very important, moderately important, or not that important? First/Next, how about Funding for the program known as CHIP, through which many lower income children are able to get health insurance even if their parents do not have coverage? Base: Total Respondents Trump Trump Non- ap- disap Total Men Women White white prove prove ===== ===== ===== ===== ===== ===== ===== Extremely/Very Important (Net) 80% 74% 85% 78% 84% 64% 91% Extremely important 38% 26% 49% 35% 44% 24% 48% Very important 42% 48% 36% 43% 40% 40% 43% Moderately/Not that important (Net) 19% 24% 13% 20% 15% 32% 9% Moderately important 14% 18% 11% 16% 12% 24% 8% Not that important 4% 6% 3% 5% 3% 8% 1% Don't know/Undecided/Refused 2% 2% 2% 2% 1% 3% * Sampling Error (+/-) 3.7 4.9 5.4 4.4 6.7 5.7 5.0 Total 18-34 35-49 50-64 65+ <45 45+ ===== ===== ===== ===== ===== ===== ===== Extremely/Very Important (Net) 80% 81% 82% 79% 77% 81% 78% Extremely important 38% 46% 41% 31% 32% 44% 33% Very important 42% 35% 41% 49% 44% 37% 46% Moderately/Not that important (Net) 19% 19% 17% 18% 21% 18% 19% Moderately important 14% 16% 12% 15% 15% 14% 15% Not that important 4% 3% 5% 3% 6% 4% 4% Don't know/Undecided/Refused 2% 1% 2% 2% 3% 1% 2% Sampling Error (+/-) 3.7 7.8 8.0 6.5 6.8 6.1 4.4 Non- White White coll. Coll. non- coll. Total <$50K $50K+ grad grad. coll. grad. ===== ===== ===== ===== ===== ===== ===== Extremely/Very Important (Net) 80% 84% 77% 80% 79% 77% 78% Extremely important 38% 42% 34% 38% 39% 34% 37% Very important 42% 42% 43% 43% 40% 43% 42% Moderately/Not that important (Net) 19% 15% 21% 18% 19% 21% 19% Moderately important 14% 13% 15% 14% 16% 16% 16% Not that important 4% 2% 6% 5% 3% 5% 4% Don't know/Undecided/Refused 2% 2% 2% 2% 2% 2% 2% Sampling Error (+/-) 3.7 6.0 4.8 4.9 5.2 5.9 6.2 Indep Con Demo- endnt Repub Lib- Mode- serva Total crat Other lican eral rate tive ===== ===== ===== ===== ===== ===== ===== Extremely/Very Important (Net) 80% 91% 76% 70% 93% 79% 70% Extremely important 38% 52% 32% 29% 50% 35% 29% Very important 42% 39% 45% 41% 43% 44% 41% Moderately/Not that important (Net) 19% 8% 22% 26% 7% 20% 27% Moderately important 14% 8% 16% 20% 5% 17% 19% Not that important 4% - 7% 6% 1% 3% 7% Don't know/Undecided/Refused 2% 1% 1% 4% * 1% 3% Sampling Error (+/-) 3.7 6.5 5.7 7.5 7.2 5.9 6.4 RV RV Lean Lean Very Less Demo- Repub Reg. Enthu Enthu Total crat lican voter Cong. Cong. ===== ===== ===== ===== ===== ===== Extremely/Very Important (Net) 80% 92% 65% 80% 80% 80% Extremely important 38% 49% 24% 37% 39% 36% Very important 42% 43% 41% 43% 42% 44% Moderately/Not that important (Net) 19% 7% 32% 18% 18% 19% Moderately important 14% 7% 24% 14% 13% 15% Not that important 4% * 8% 4% 4% 3% Don't know/Undecided/Refused 2% 1% 3% 2% 2% 2% Sampling Error (+/-) 3.7 5.2 5.5 3.8 5.3 5.5
@ssrs_solutions | 484.840.4300 | www.ssrs.com | 17
CNN/SSRS Poll -- January 14, 2018 to January 18, 2018 TABLE 029 12D. How important is it to you that the president and Congress deal with each of the following issues in the next year -- will it be extremely important, very important, moderately important, or not that important? First/Next, how about Improving the nation's infrastructure? Base: Total Respondents Trump Trump Non- ap- disap Total Men Women White white prove prove ===== ===== ===== ===== ===== ===== ===== Extremely/Very Important (Net) 77% 78% 76% 77% 77% 80% 75% Extremely important 28% 25% 31% 26% 31% 26% 29% Very important 49% 53% 45% 51% 45% 54% 46% Moderately/Not that important (Net) 22% 21% 23% 22% 23% 19% 25% Moderately important 18% 15% 21% 19% 17% 14% 21% Not that important 4% 6% 3% 4% 6% 5% 4% Don't know/Undecided/Refused 1% 1% 1% 1% 1% 1% * Sampling Error (+/-) 3.7 4.9 5.4 4.4 6.7 5.7 5.0 Total 18-34 35-49 50-64 65+ <45 45+ ===== ===== ===== ===== ===== ===== ===== Extremely/Very Important (Net) 77% 71% 76% 81% 81% 72% 81% Extremely important 28% 32% 32% 23% 25% 32% 24% Very important 49% 39% 44% 58% 57% 40% 57% Moderately/Not that important (Net) 22% 29% 23% 19% 16% 27% 18% Moderately important 18% 21% 19% 16% 14% 21% 15% Not that important 4% 8% 4% 3% 2% 7% 2% Don't know/Undecided/Refused 1% * 1% * 2% 1% 1% Sampling Error (+/-) 3.7 7.8 8.0 6.5 6.8 6.1 4.4 Non- White White coll. Coll. non- coll. Total <$50K $50K+ grad grad. coll. grad. ===== ===== ===== ===== ===== ===== ===== Extremely/Very Important (Net) 77% 74% 78% 77% 76% 77% 76% Extremely important 28% 28% 30% 29% 28% 26% 27% Very important 49% 47% 48% 49% 49% 51% 49% Moderately/Not that important (Net) 22% 24% 21% 22% 23% 22% 24% Moderately important 18% 20% 18% 16% 21% 17% 22% Not that important 4% 5% 3% 5% 2% 5% 2% Don't know/Undecided/Refused 1% 1% 1% 1% 1% 1% - Sampling Error (+/-) 3.7 6.0 4.8 4.9 5.2 5.9 6.2 Indep Con Demo- endnt Repub Lib- Mode- serva Total crat Other lican eral rate tive ===== ===== ===== ===== ===== ===== ===== Extremely/Very Important (Net) 77% 77% 76% 78% 75% 72% 84% Extremely important 28% 30% 27% 27% 34% 24% 29% Very important 49% 46% 49% 51% 41% 48% 55% Moderately/Not that important (Net) 22% 23% 23% 20% 24% 27% 15% Moderately important 18% 22% 17% 13% 21% 21% 12% Not that important 4% 1% 6% 7% 3% 6% 3% Don't know/Undecided/Refused 1% * 1% 1% 1% 1% 1% Sampling Error (+/-) 3.7 6.5 5.7 7.5 7.2 5.9 6.4 RV RV Lean Lean Very Less Demo- Repub Reg. Enthu Enthu Total crat lican voter Cong. Cong. ===== ===== ===== ===== ===== ===== Extremely/Very Important (Net) 77% 76% 79% 77% 79% 75% Extremely important 28% 30% 26% 27% 27% 27% Very important 49% 46% 54% 50% 52% 49% Moderately/Not that important (Net) 22% 24% 20% 22% 21% 24% Moderately important 18% 22% 14% 18% 19% 18% Not that important 4% 2% 6% 4% 2% 6% Don't know/Undecided/Refused 1% * 1% 1% * 1% Sampling Error (+/-) 3.7 5.2 5.5 3.8 5.3 5.5

@ssrs_solutions | 484.840.4300 | www.ssrs.com | 18
CNN/SSRS Poll -- January 14, 2018 to January 18, 2018 TABLE 030 12E. How important is it to you that the president and Congress deal with each of the following issues in the next year -- will it be extremely important, very important, moderately important, or not that important? First/Next, how about Approving long-term funding for the government to avoid the threat of shutdowns? Base: Total Respondents Trump Trump Non- ap- disap Total Men Women White white prove prove ===== ===== ===== ===== ===== ===== ===== Extremely/Very Important (Net) 61% 60% 62% 60% 62% 55% 65% Extremely important 23% 21% 25% 22% 25% 22% 25% Very important 38% 38% 37% 38% 37% 34% 40% Moderately/Not that important (Net) 36% 37% 35% 38% 34% 41% 33% Moderately important 24% 23% 25% 26% 21% 25% 24% Not that important 12% 14% 10% 12% 14% 16% 9% Don't know/Undecided/Refused 3% 3% 3% 2% 4% 4% 2% Sampling Error (+/-) 3.7 4.9 5.4 4.4 6.7 5.7 5.0 Total 18-34 35-49 50-64 65+ <45 45+ ===== ===== ===== ===== ===== ===== ===== Extremely/Very Important (Net) 61% 55% 54% 65% 70% 55% 66% Extremely important 23% 22% 24% 23% 25% 24% 23% Very important 38% 33% 30% 43% 44% 31% 43% Moderately/Not that important (Net) 36% 40% 45% 33% 27% 42% 32% Moderately important 24% 25% 33% 21% 18% 28% 21% Not that important 12% 15% 12% 12% 9% 14% 11% Don't know/Undecided/Refused 3% 4% 1% 2% 4% 3% 2% Sampling Error (+/-) 3.7 7.8 8.0 6.5 6.8 6.1 4.4 Non- White White coll. Coll. non- coll. Total <$50K $50K+ grad grad. coll. grad. ===== ===== ===== ===== ===== ===== ===== Extremely/Very Important (Net) 61% 62% 60% 61% 61% 59% 63% Extremely important 23% 25% 22% 23% 23% 21% 24% Very important 38% 37% 39% 37% 39% 37% 39% Moderately/Not that important (Net) 36% 34% 39% 36% 36% 39% 36% Moderately important 24% 23% 27% 23% 27% 26% 26% Not that important 12% 11% 12% 13% 9% 12% 10% Don't know/Undecided/Refused 3% 4% 1% 3% 2% 2% 1% Sampling Error (+/-) 3.7 6.0 4.8 4.9 5.2 5.9 6.2 Indep Con Demo- endnt Repub Lib- Mode- serva Total crat Other lican eral rate tive ===== ===== ===== ===== ===== ===== ===== Extremely/Very Important (Net) 61% 67% 56% 60% 60% 59% 62% Extremely important 23% 26% 21% 23% 22% 25% 22% Very important 38% 42% 36% 36% 38% 34% 40% Moderately/Not that important (Net) 36% 31% 41% 37% 38% 39% 35% Moderately important 24% 24% 26% 23% 29% 25% 21% Not that important 12% 7% 15% 14% 8% 14% 14% Don't know/Undecided/Refused 3% 2% 3% 4% 2% 2% 3% Sampling Error (+/-) 3.7 6.5 5.7 7.5 7.2 5.9 6.4 RV RV Lean Lean Very Less Demo- Repub Reg. Enthu Enthu Total crat lican voter Cong. Cong. ===== ===== ===== ===== ===== ===== Extremely/Very Important (Net) 61% 66% 56% 60% 65% 56% Extremely important 23% 25% 19% 23% 23% 22% Very important 38% 40% 36% 38% 42% 34% Moderately/Not that important (Net) 36% 32% 42% 37% 32% 42% Moderately important 24% 25% 24% 25% 23% 27% Not that important 12% 7% 17% 12% 9% 15% Don't know/Undecided/Refused 3% 2% 3% 2% 3% 2% Sampling Error (+/-) 3.7 5.2 5.5 3.8 5.3 5.5
@ssrs_solutions | 484.840.4300 | www.ssrs.com | 19
CNN/SSRS Poll -- January 14, 2018 to January 18, 2018 TABLE 046 17. How confident are you that Congress and President Trump will enact new laws on immigration and border security that will improve the way the country handles this issue? Base: Total Respondents Trump Trump Non- ap- disap Total Men Women White white prove prove ===== ===== ===== ===== ===== ===== ===== Confident (Net) 40% 45% 35% 41% 36% 76% 13% Very confident 18% 22% 14% 18% 18% 39% 3% Fairly confident 22% 23% 21% 23% 19% 37% 10% Not confident (Net) 60% 54% 65% 58% 63% 23% 86% Not too confident 32% 29% 35% 31% 34% 17% 42% Not confident at all 28% 25% 30% 27% 30% 6% 44% Don't know/Undecided/Refused 1% 1% * 1% * 1% 1% Sampling Error (+/-) 3.7 4.9 5.4 4.4 6.7 5.7 5.0 Total 18-34 35-49 50-64 65+ <45 45+ ===== ===== ===== ===== ===== ===== ===== Confident (Net) 40% 40% 38% 43% 39% 39% 40% Very confident 18% 19% 17% 17% 21% 19% 17% Fairly confident 22% 21% 20% 26% 18% 21% 23% Not confident (Net) 60% 60% 62% 56% 60% 60% 59% Not too confident 32% 32% 31% 31% 32% 31% 32% Not confident at all 28% 28% 31% 25% 28% 29% 27% Don't know/Undecided/Refused 1% 1% * 1% 1% 1% 1% Sampling Error (+/-) 3.7 7.8 8.0 6.5 6.8 6.1 4.4 Non- White White coll. Coll. non- coll. Total <$50K $50K+ grad grad. coll. grad. ===== ===== ===== ===== ===== ===== ===== Confident (Net) 40% 36% 42% 43% 33% 45% 33% Very confident 18% 15% 19% 21% 11% 22% 10% Fairly confident 22% 21% 23% 21% 23% 23% 23% Not confident (Net) 60% 64% 57% 56% 65% 54% 66% Not too confident 32% 34% 31% 31% 32% 31% 30% Not confident at all 28% 29% 27% 25% 34% 23% 35% Don't know/Undecided/Refused 1% * 1% 1% 1% 1% 1% Sampling Error (+/-) 3.7 6.0 4.8 4.9 5.2 5.9 6.2 Indep Con Demo- endnt Repub Lib- Mode- serva Total crat Other lican eral rate tive ===== ===== ===== ===== ===== ===== ===== Confident (Net) 40% 14% 38% 77% 19% 37% 60% Very confident 18% 5% 16% 40% 10% 15% 29% Fairly confident 22% 9% 22% 37% 9% 22% 32% Not confident (Net) 60% 85% 61% 23% 81% 62% 39% Not too confident 32% 38% 35% 17% 35% 36% 25% Not confident at all 28% 46% 26% 6% 46% 26% 14% Don't know/Undecided/Refused 1% 1% 1% * * 1% 1% Sampling Error (+/-) 3.7 6.5 5.7 7.5 7.2 5.9 6.4 RV RV Lean Lean Very Less Demo- Repub Reg. Enthu Enthu Total crat lican voter Cong. Cong. ===== ===== ===== ===== ===== ===== Confident (Net) 40% 15% 71% 40% 38% 42% Very confident 18% 5% 35% 18% 19% 17% Fairly confident 22% 10% 36% 22% 19% 26% Not confident (Net) 60% 84% 28% 59% 61% 57% Not too confident 32% 40% 21% 31% 30% 33% Not confident at all 28% 44% 7% 28% 31% 25% Don't know/Undecided/Refused 1% 1% 1% 1% 1% 1% Sampling Error (+/-) 3.7 5.2 5.5 3.8 5.3 5.5
@ssrs_solutions | 484.840.4300 | www.ssrs.com | 20
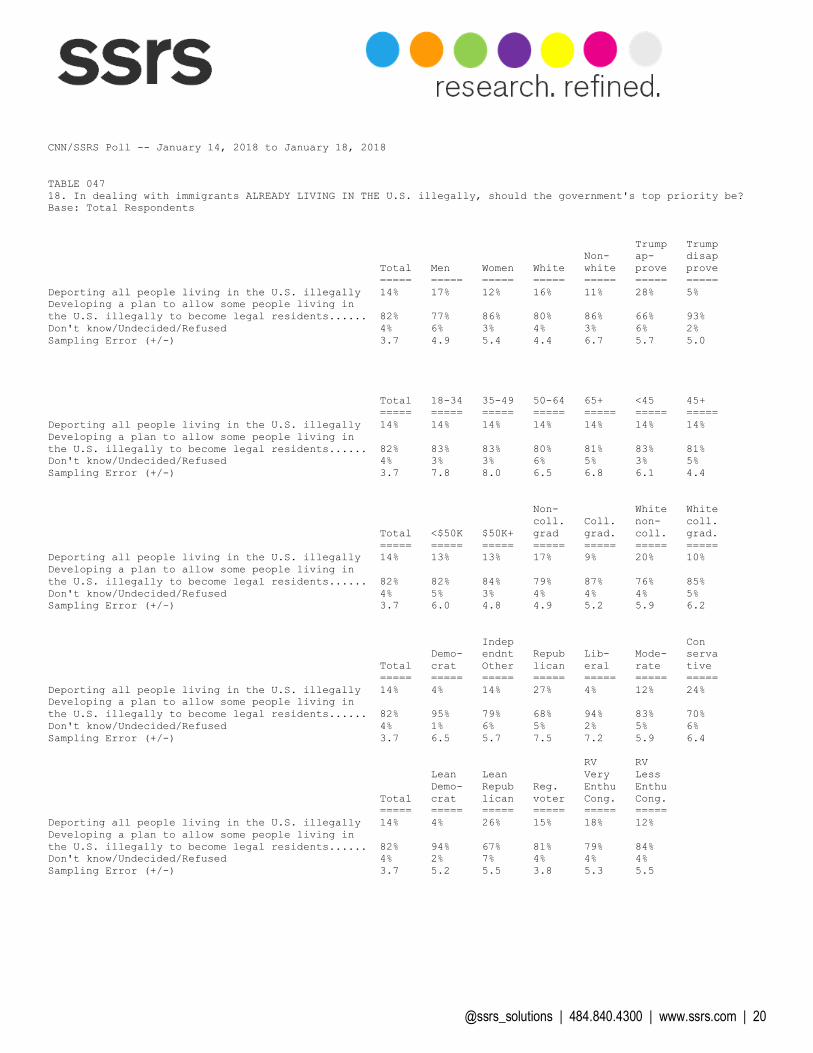
CNN/SSRS Poll -- January 14, 2018 to January 18, 2018 TABLE 047 18. In dealing with immigrants ALREADY LIVING IN THE U.S. illegally, should the government's top priority be? Base: Total Respondents Trump Trump Non- ap- disap Total Men Women White white prove prove ===== ===== ===== ===== ===== ===== ===== Deporting all people living in the U.S. illegally 14% 17% 12% 16% 11% 28% 5% Developing a plan to allow some people living in the U.S. illegally to become legal residents...... 82% 77% 86% 80% 86% 66% 93% Don't know/Undecided/Refused 4% 6% 3% 4% 3% 6% 2% Sampling Error (+/-) 3.7 4.9 5.4 4.4 6.7 5.7 5.0 Total 18-34 35-49 50-64 65+ <45 45+ ===== ===== ===== ===== ===== ===== ===== Deporting all people living in the U.S. illegally 14% 14% 14% 14% 14% 14% 14% Developing a plan to allow some people living in the U.S. illegally to become legal residents...... 82% 83% 83% 80% 81% 83% 81% Don't know/Undecided/Refused 4% 3% 3% 6% 5% 3% 5% Sampling Error (+/-) 3.7 7.8 8.0 6.5 6.8 6.1 4.4 Non- White White coll. Coll. non- coll. Total <$50K $50K+ grad grad. coll. grad. ===== ===== ===== ===== ===== ===== ===== Deporting all people living in the U.S. illegally 14% 13% 13% 17% 9% 20% 10% Developing a plan to allow some people living in the U.S. illegally to become legal residents...... 82% 82% 84% 79% 87% 76% 85% Don't know/Undecided/Refused 4% 5% 3% 4% 4% 4% 5% Sampling Error (+/-) 3.7 6.0 4.8 4.9 5.2 5.9 6.2 Indep Con Demo- endnt Repub Lib- Mode- serva Total crat Other lican eral rate tive ===== ===== ===== ===== ===== ===== ===== Deporting all people living in the U.S. illegally 14% 4% 14% 27% 4% 12% 24% Developing a plan to allow some people living in the U.S. illegally to become legal residents...... 82% 95% 79% 68% 94% 83% 70% Don't know/Undecided/Refused 4% 1% 6% 5% 2% 5% 6% Sampling Error (+/-) 3.7 6.5 5.7 7.5 7.2 5.9 6.4 RV RV Lean Lean Very Less Demo- Repub Reg. Enthu Enthu Total crat lican voter Cong. Cong. ===== ===== ===== ===== ===== ===== Deporting all people living in the U.S. illegally 14% 4% 26% 15% 18% 12% Developing a plan to allow some people living in the U.S. illegally to become legal residents...... 82% 94% 67% 81% 79% 84% Don't know/Undecided/Refused 4% 2% 7% 4% 4% 4% Sampling Error (+/-) 3.7 5.2 5.5 3.8 5.3 5.5
@ssrs_solutions | 484.840.4300 | www.ssrs.com | 21
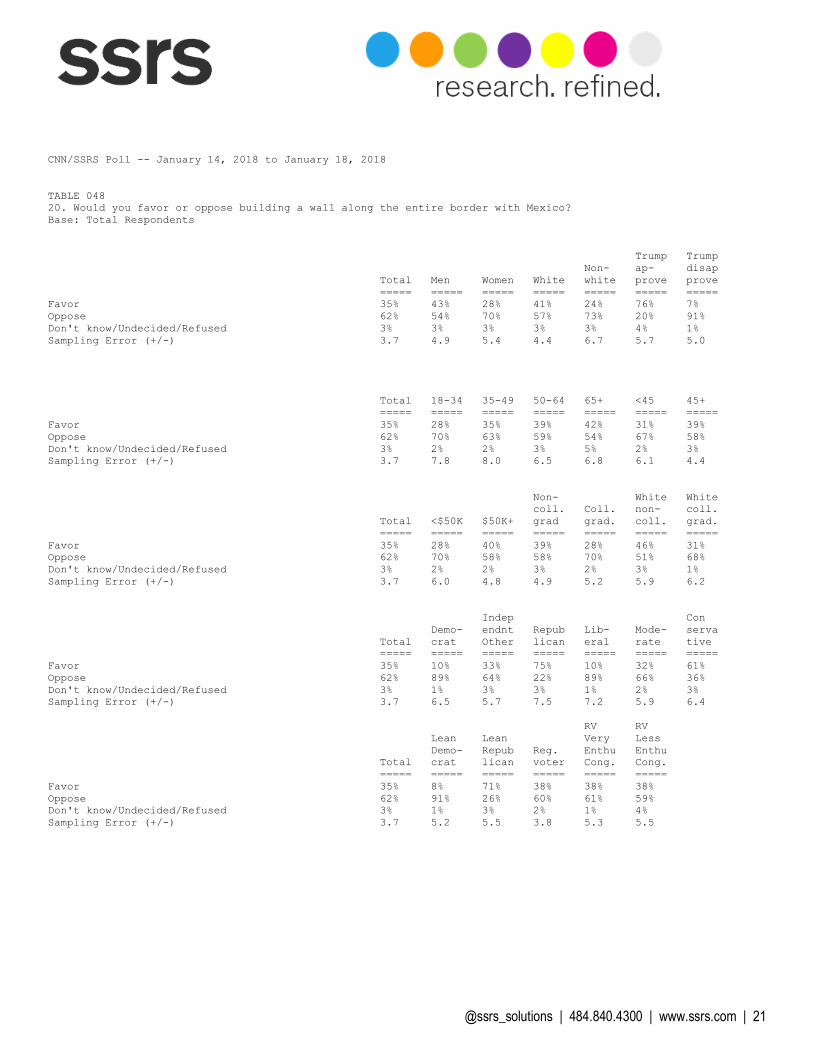
CNN/SSRS Poll -- January 14, 2018 to January 18, 2018 TABLE 048 20. Would you favor or oppose building a wall along the entire border with Mexico? Base: Total Respondents Trump Trump Non- ap- disap Total Men Women White white prove prove ===== ===== ===== ===== ===== ===== ===== Favor 35% 43% 28% 41% 24% 76% 7% Oppose 62% 54% 70% 57% 73% 20% 91% Don't know/Undecided/Refused 3% 3% 3% 3% 3% 4% 1% Sampling Error (+/-) 3.7 4.9 5.4 4.4 6.7 5.7 5.0 Total 18-34 35-49 50-64 65+ <45 45+ ===== ===== ===== ===== ===== ===== ===== Favor 35% 28% 35% 39% 42% 31% 39% Oppose 62% 70% 63% 59% 54% 67% 58% Don't know/Undecided/Refused 3% 2% 2% 3% 5% 2% 3% Sampling Error (+/-) 3.7 7.8 8.0 6.5 6.8 6.1 4.4 Non- White White coll. Coll. non- coll. Total <$50K $50K+ grad grad. coll. grad. ===== ===== ===== ===== ===== ===== ===== Favor 35% 28% 40% 39% 28% 46% 31% Oppose 62% 70% 58% 58% 70% 51% 68% Don't know/Undecided/Refused 3% 2% 2% 3% 2% 3% 1% Sampling Error (+/-) 3.7 6.0 4.8 4.9 5.2 5.9 6.2 Indep Con Demo- endnt Repub Lib- Mode- serva Total crat Other lican eral rate tive ===== ===== ===== ===== ===== ===== ===== Favor 35% 10% 33% 75% 10% 32% 61% Oppose 62% 89% 64% 22% 89% 66% 36% Don't know/Undecided/Refused 3% 1% 3% 3% 1% 2% 3% Sampling Error (+/-) 3.7 6.5 5.7 7.5 7.2 5.9 6.4 RV RV Lean Lean Very Less Demo- Repub Reg. Enthu Enthu Total crat lican voter Cong. Cong. ===== ===== ===== ===== ===== ===== Favor 35% 8% 71% 38% 38% 38% Oppose 62% 91% 26% 60% 61% 59% Don't know/Undecided/Refused 3% 1% 3% 2% 1% 4% Sampling Error (+/-) 3.7 5.2 5.5 3.8 5.3 5.5
@ssrs_solutions | 484.840.4300 | www.ssrs.com | 22
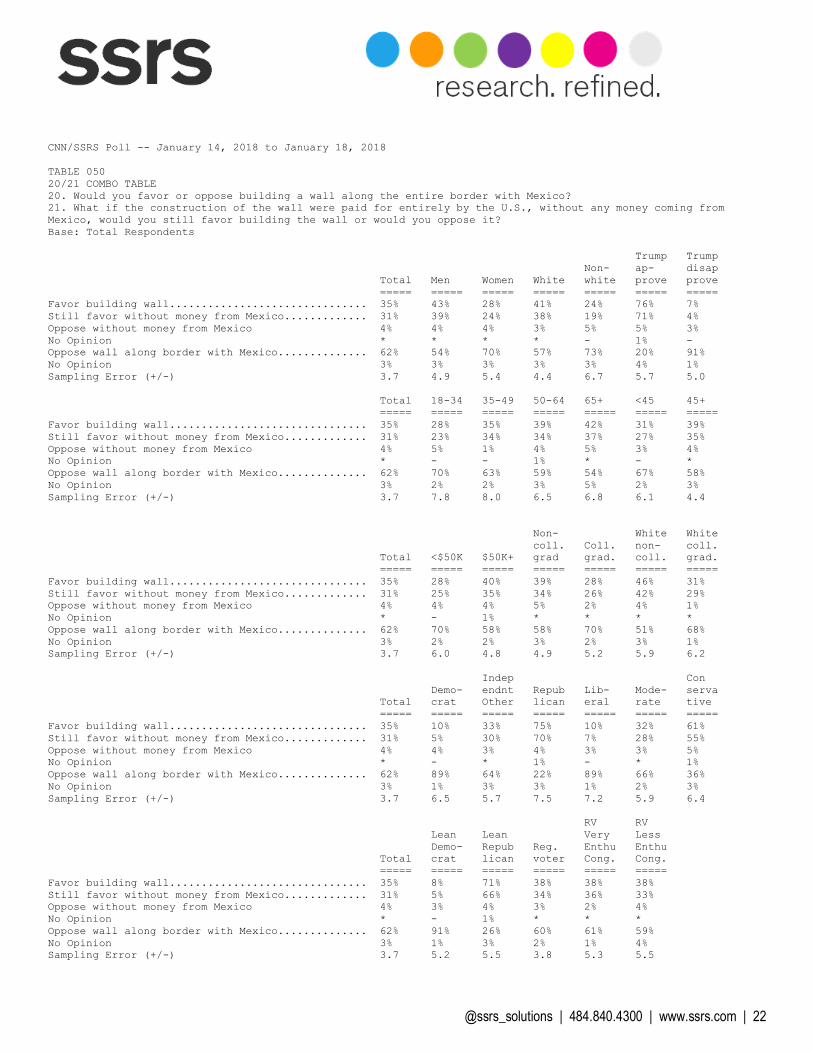
CNN/SSRS Poll -- January 14, 2018 to January 18, 2018 TABLE 050 20/21 COMBO TABLE 20. Would you favor or oppose building a wall along the entire border with Mexico? 21. What if the construction of the wall were paid for entirely by the U.S., without any money coming from Mexico, would you still favor building the wall or would you oppose it? Base: Total Respondents Trump Trump Non- ap- disap Total Men Women White white prove prove ===== ===== ===== ===== ===== ===== ===== Favor building wall............................... 35% 43% 28% 41% 24% 76% 7% Still favor without money from Mexico............. 31% 39% 24% 38% 19% 71% 4% Oppose without money from Mexico 4% 4% 4% 3% 5% 5% 3% No Opinion * * * * - 1% - Oppose wall along border with Mexico.............. 62% 54% 70% 57% 73% 20% 91% No Opinion 3% 3% 3% 3% 3% 4% 1% Sampling Error (+/-) 3.7 4.9 5.4 4.4 6.7 5.7 5.0 Total 18-34 35-49 50-64 65+ <45 45+ ===== ===== ===== ===== ===== ===== ===== Favor building wall............................... 35% 28% 35% 39% 42% 31% 39% Still favor without money from Mexico............. 31% 23% 34% 34% 37% 27% 35% Oppose without money from Mexico 4% 5% 1% 4% 5% 3% 4% No Opinion * - - 1% * - * Oppose wall along border with Mexico.............. 62% 70% 63% 59% 54% 67% 58% No Opinion 3% 2% 2% 3% 5% 2% 3% Sampling Error (+/-) 3.7 7.8 8.0 6.5 6.8 6.1 4.4 Non- White White coll. Coll. non- coll. Total <$50K $50K+ grad grad. coll. grad. ===== ===== ===== ===== ===== ===== ===== Favor building wall............................... 35% 28% 40% 39% 28% 46% 31% Still favor without money from Mexico............. 31% 25% 35% 34% 26% 42% 29% Oppose without money from Mexico 4% 4% 4% 5% 2% 4% 1% No Opinion * - 1% * * * * Oppose wall along border with Mexico.............. 62% 70% 58% 58% 70% 51% 68% No Opinion 3% 2% 2% 3% 2% 3% 1% Sampling Error (+/-) 3.7 6.0 4.8 4.9 5.2 5.9 6.2 Indep Con Demo- endnt Repub Lib- Mode- serva Total crat Other lican eral rate tive ===== ===== ===== ===== ===== ===== ===== Favor building wall............................... 35% 10% 33% 75% 10% 32% 61% Still favor without money from Mexico............. 31% 5% 30% 70% 7% 28% 55% Oppose without money from Mexico 4% 4% 3% 4% 3% 3% 5% No Opinion * - * 1% - * 1% Oppose wall along border with Mexico.............. 62% 89% 64% 22% 89% 66% 36% No Opinion 3% 1% 3% 3% 1% 2% 3% Sampling Error (+/-) 3.7 6.5 5.7 7.5 7.2 5.9 6.4 RV RV Lean Lean Very Less Demo- Repub Reg. Enthu Enthu Total crat lican voter Cong. Cong. ===== ===== ===== ===== ===== ===== Favor building wall............................... 35% 8% 71% 38% 38% 38% Still favor without money from Mexico............. 31% 5% 66% 34% 36% 33% Oppose without money from Mexico 4% 3% 4% 3% 2% 4% No Opinion * - 1% * * * Oppose wall along border with Mexico.............. 62% 91% 26% 60% 61% 59% No Opinion 3% 1% 3% 2% 1% 4% Sampling Error (+/-) 3.7 5.2 5.5 3.8 5.3 5.5
@ssrs_solutions | 484.840.4300 | www.ssrs.com | 23
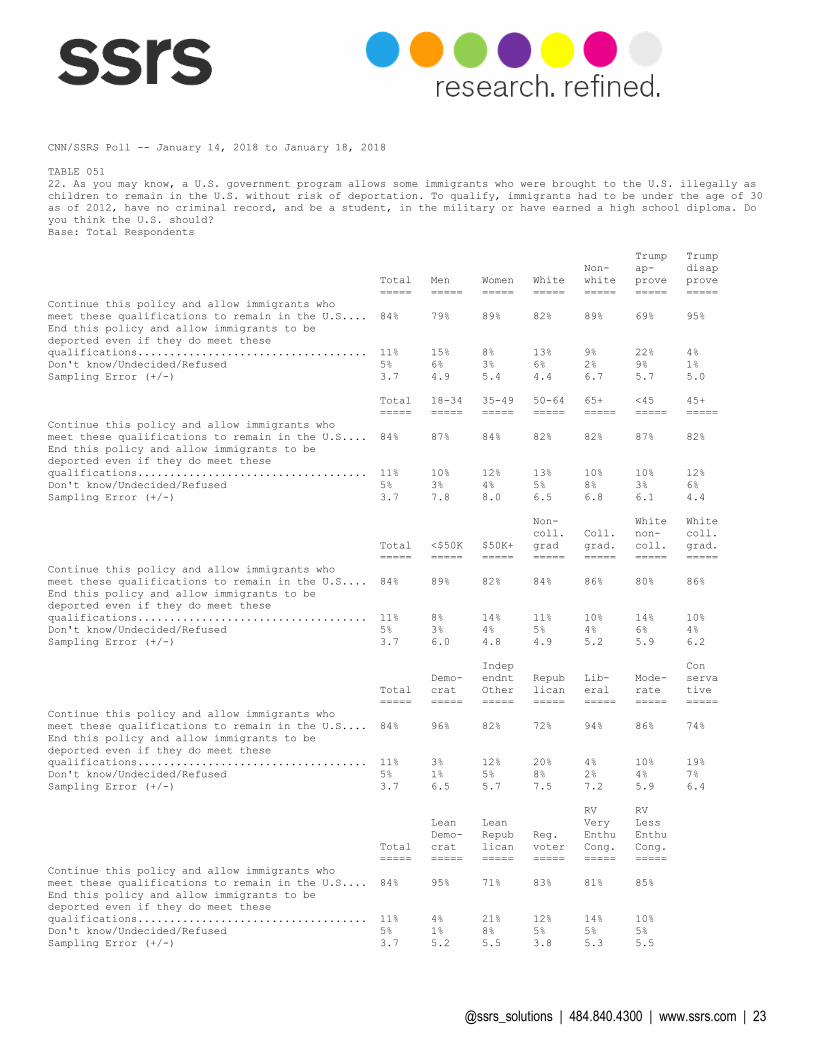
CNN/SSRS Poll -- January 14, 2018 to January 18, 2018 TABLE 051 22. As you may know, a U.S. government program allows some immigrants who were brought to the U.S. illegally as children to remain in the U.S. without risk of deportation. To qualify, immigrants had to be under the age of 30 as of 2012, have no criminal record, and be a student, in the military or have earned a high school diploma. Do you think the U.S. should? Base: Total Respondents Trump Trump Non- ap- disap Total Men Women White white prove prove ===== ===== ===== ===== ===== ===== ===== Continue this policy and allow immigrants who meet these qualifications to remain in the U.S.... 84% 79% 89% 82% 89% 69% 95% End this policy and allow immigrants to be deported even if they do meet these qualifications.................................... 11% 15% 8% 13% 9% 22% 4% Don't know/Undecided/Refused 5% 6% 3% 6% 2% 9% 1% Sampling Error (+/-) 3.7 4.9 5.4 4.4 6.7 5.7 5.0 Total 18-34 35-49 50-64 65+ <45 45+ ===== ===== ===== ===== ===== ===== ===== Continue this policy and allow immigrants who meet these qualifications to remain in the U.S.... 84% 87% 84% 82% 82% 87% 82% End this policy and allow immigrants to be deported even if they do meet these qualifications.................................... 11% 10% 12% 13% 10% 10% 12% Don't know/Undecided/Refused 5% 3% 4% 5% 8% 3% 6% Sampling Error (+/-) 3.7 7.8 8.0 6.5 6.8 6.1 4.4 Non- White White coll. Coll. non- coll. Total <$50K $50K+ grad grad. coll. grad. ===== ===== ===== ===== ===== ===== ===== Continue this policy and allow immigrants who meet these qualifications to remain in the U.S.... 84% 89% 82% 84% 86% 80% 86% End this policy and allow immigrants to be deported even if they do meet these qualifications.................................... 11% 8% 14% 11% 10% 14% 10% Don't know/Undecided/Refused 5% 3% 4% 5% 4% 6% 4% Sampling Error (+/-) 3.7 6.0 4.8 4.9 5.2 5.9 6.2 Indep Con Demo- endnt Repub Lib- Mode- serva Total crat Other lican eral rate tive ===== ===== ===== ===== ===== ===== ===== Continue this policy and allow immigrants who meet these qualifications to remain in the U.S.... 84% 96% 82% 72% 94% 86% 74% End this policy and allow immigrants to be deported even if they do meet these qualifications.................................... 11% 3% 12% 20% 4% 10% 19% Don't know/Undecided/Refused 5% 1% 5% 8% 2% 4% 7% Sampling Error (+/-) 3.7 6.5 5.7 7.5 7.2 5.9 6.4 RV RV Lean Lean Very Less Demo- Repub Reg. Enthu Enthu Total crat lican voter Cong. Cong. ===== ===== ===== ===== ===== ===== Continue this policy and allow immigrants who meet these qualifications to remain in the U.S.... 84% 95% 71% 83% 81% 85% End this policy and allow immigrants to be deported even if they do meet these qualifications.................................... 11% 4% 21% 12% 14% 10% Don't know/Undecided/Refused 5% 1% 8% 5% 5% 5% Sampling Error (+/-) 3.7 5.2 5.5 3.8 5.3 5.5
@ssrs_solutions | 484.840.4300 | www.ssrs.com | 24
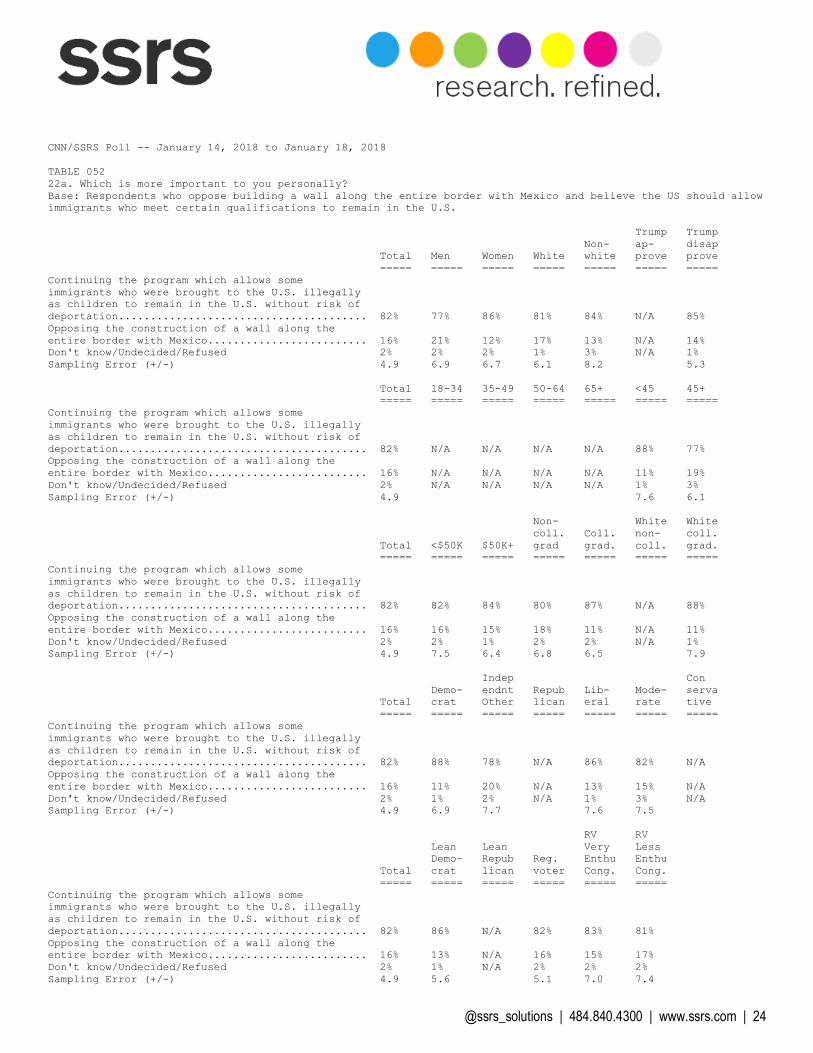
CNN/SSRS Poll -- January 14, 2018 to January 18, 2018 TABLE 052 22a. Which is more important to you personally? Base: Respondents who oppose building a wall along the entire border with Mexico and believe the US should allow immigrants who meet certain qualifications to remain in the U.S. Trump Trump Non- ap- disap Total Men Women White white prove prove ===== ===== ===== ===== ===== ===== ===== Continuing the program which allows some immigrants who were brought to the U.S. illegally as children to remain in the U.S. without risk of deportation....................................... 82% 77% 86% 81% 84% N/A 85% Opposing the construction of a wall along the entire border with Mexico......................... 16% 21% 12% 17% 13% N/A 14% Don't know/Undecided/Refused 2% 2% 2% 1% 3% N/A 1% Sampling Error (+/-) 4.9 6.9 6.7 6.1 8.2 5.3 Total 18-34 35-49 50-64 65+ <45 45+ ===== ===== ===== ===== ===== ===== ===== Continuing the program which allows some immigrants who were brought to the U.S. illegally as children to remain in the U.S. without risk of deportation....................................... 82% N/A N/A N/A N/A 88% 77% Opposing the construction of a wall along the entire border with Mexico......................... 16% N/A N/A N/A N/A 11% 19% Don't know/Undecided/Refused 2% N/A N/A N/A N/A 1% 3% Sampling Error (+/-) 4.9 7.6 6.1 Non- White White coll. Coll. non- coll. Total <$50K $50K+ grad grad. coll. grad. ===== ===== ===== ===== ===== ===== ===== Continuing the program which allows some immigrants who were brought to the U.S. illegally as children to remain in the U.S. without risk of deportation....................................... 82% 82% 84% 80% 87% N/A 88% Opposing the construction of a wall along the entire border with Mexico......................... 16% 16% 15% 18% 11% N/A 11% Don't know/Undecided/Refused 2% 2% 1% 2% 2% N/A 1% Sampling Error (+/-) 4.9 7.5 6.4 6.8 6.5 7.9 Indep Con Demo- endnt Repub Lib- Mode- serva Total crat Other lican eral rate tive ===== ===== ===== ===== ===== ===== ===== Continuing the program which allows some immigrants who were brought to the U.S. illegally as children to remain in the U.S. without risk of deportation....................................... 82% 88% 78% N/A 86% 82% N/A Opposing the construction of a wall along the entire border with Mexico......................... 16% 11% 20% N/A 13% 15% N/A Don't know/Undecided/Refused 2% 1% 2% N/A 1% 3% N/A Sampling Error (+/-) 4.9 6.9 7.7 7.6 7.5 RV RV Lean Lean Very Less Demo- Repub Reg. Enthu Enthu Total crat lican voter Cong. Cong. ===== ===== ===== ===== ===== ===== Continuing the program which allows some immigrants who were brought to the U.S. illegally as children to remain in the U.S. without risk of deportation....................................... 82% 86% N/A 82% 83% 81% Opposing the construction of a wall along the entire border with Mexico......................... 16% 13% N/A 16% 15% 17% Don't know/Undecided/Refused 2% 1% N/A 2% 2% 2% Sampling Error (+/-) 4.9 5.6 5.1 7.0 7.4
@ssrs_solutions | 484.840.4300 | www.ssrs.com | 25
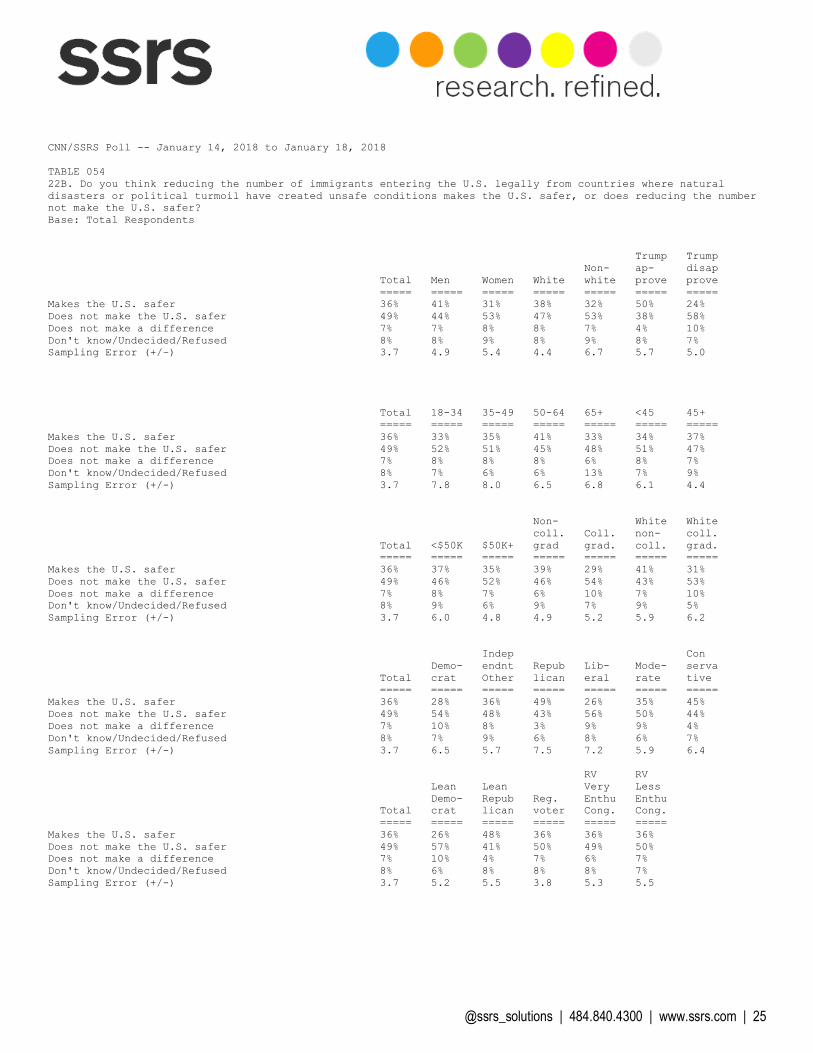
CNN/SSRS Poll -- January 14, 2018 to January 18, 2018 TABLE 054 22B. Do you think reducing the number of immigrants entering the U.S. legally from countries where natural disasters or political turmoil have created unsafe conditions makes the U.S. safer, or does reducing the number not make the U.S. safer? Base: Total Respondents Trump Trump Non- ap- disap Total Men Women White white prove prove ===== ===== ===== ===== ===== ===== ===== Makes the U.S. safer 36% 41% 31% 38% 32% 50% 24% Does not make the U.S. safer 49% 44% 53% 47% 53% 38% 58% Does not make a difference 7% 7% 8% 8% 7% 4% 10% Don't know/Undecided/Refused 8% 8% 9% 8% 9% 8% 7% Sampling Error (+/-) 3.7 4.9 5.4 4.4 6.7 5.7 5.0 Total 18-34 35-49 50-64 65+ <45 45+ ===== ===== ===== ===== ===== ===== ===== Makes the U.S. safer 36% 33% 35% 41% 33% 34% 37% Does not make the U.S. safer 49% 52% 51% 45% 48% 51% 47% Does not make a difference 7% 8% 8% 8% 6% 8% 7% Don't know/Undecided/Refused 8% 7% 6% 6% 13% 7% 9% Sampling Error (+/-) 3.7 7.8 8.0 6.5 6.8 6.1 4.4 Non- White White coll. Coll. non- coll. Total <$50K $50K+ grad grad. coll. grad. ===== ===== ===== ===== ===== ===== ===== Makes the U.S. safer 36% 37% 35% 39% 29% 41% 31% Does not make the U.S. safer 49% 46% 52% 46% 54% 43% 53% Does not make a difference 7% 8% 7% 6% 10% 7% 10% Don't know/Undecided/Refused 8% 9% 6% 9% 7% 9% 5% Sampling Error (+/-) 3.7 6.0 4.8 4.9 5.2 5.9 6.2 Indep Con Demo- endnt Repub Lib- Mode- serva Total crat Other lican eral rate tive ===== ===== ===== ===== ===== ===== ===== Makes the U.S. safer 36% 28% 36% 49% 26% 35% 45% Does not make the U.S. safer 49% 54% 48% 43% 56% 50% 44% Does not make a difference 7% 10% 8% 3% 9% 9% 4% Don't know/Undecided/Refused 8% 7% 9% 6% 8% 6% 7% Sampling Error (+/-) 3.7 6.5 5.7 7.5 7.2 5.9 6.4 RV RV Lean Lean Very Less Demo- Repub Reg. Enthu Enthu Total crat lican voter Cong. Cong. ===== ===== ===== ===== ===== ===== Makes the U.S. safer 36% 26% 48% 36% 36% 36% Does not make the U.S. safer 49% 57% 41% 50% 49% 50% Does not make a difference 7% 10% 4% 7% 6% 7% Don't know/Undecided/Refused 8% 6% 8% 8% 8% 7% Sampling Error (+/-) 3.7 5.2 5.5 3.8 5.3 5.5
@ssrs_solutions | 484.840.4300 | www.ssrs.com | 26
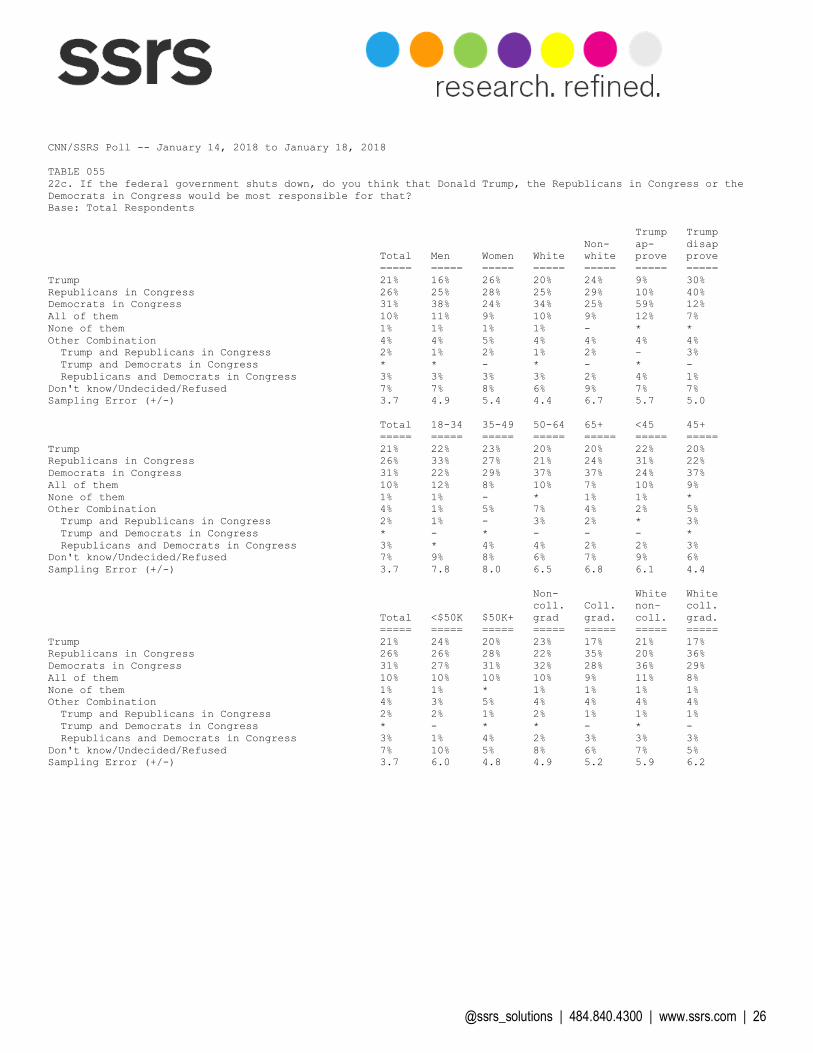
CNN/SSRS Poll -- January 14, 2018 to January 18, 2018 TABLE 055 22c. If the federal government shuts down, do you think that Donald Trump, the Republicans in Congress or the Democrats in Congress would be most responsible for that? Base: Total Respondents Trump Trump Non- ap- disap Total Men Women White white prove prove ===== ===== ===== ===== ===== ===== ===== Trump 21% 16% 26% 20% 24% 9% 30% Republicans in Congress 26% 25% 28% 25% 29% 10% 40% Democrats in Congress 31% 38% 24% 34% 25% 59% 12% All of them 10% 11% 9% 10% 9% 12% 7% None of them 1% 1% 1% 1% - * * Other Combination 4% 4% 5% 4% 4% 4% 4% Trump and Republicans in Congress 2% 1% 2% 1% 2% - 3% Trump and Democrats in Congress * * - * - * - Republicans and Democrats in Congress 3% 3% 3% 3% 2% 4% 1% Don't know/Undecided/Refused 7% 7% 8% 6% 9% 7% 7% Sampling Error (+/-) 3.7 4.9 5.4 4.4 6.7 5.7 5.0 Total 18-34 35-49 50-64 65+ <45 45+ ===== ===== ===== ===== ===== ===== ===== Trump 21% 22% 23% 20% 20% 22% 20% Republicans in Congress 26% 33% 27% 21% 24% 31% 22% Democrats in Congress 31% 22% 29% 37% 37% 24% 37% All of them 10% 12% 8% 10% 7% 10% 9% None of them 1% 1% - * 1% 1% * Other Combination 4% 1% 5% 7% 4% 2% 5% Trump and Republicans in Congress 2% 1% - 3% 2% * 3% Trump and Democrats in Congress * - * - - - * Republicans and Democrats in Congress 3% * 4% 4% 2% 2% 3% Don't know/Undecided/Refused 7% 9% 8% 6% 7% 9% 6% Sampling Error (+/-) 3.7 7.8 8.0 6.5 6.8 6.1 4.4 Non- White White coll. Coll. non- coll. Total <$50K $50K+ grad grad. coll. grad. ===== ===== ===== ===== ===== ===== ===== Trump 21% 24% 20% 23% 17% 21% 17% Republicans in Congress 26% 26% 28% 22% 35% 20% 36% Democrats in Congress 31% 27% 31% 32% 28% 36% 29% All of them 10% 10% 10% 10% 9% 11% 8% None of them 1% 1% * 1% 1% 1% 1% Other Combination 4% 3% 5% 4% 4% 4% 4% Trump and Republicans in Congress 2% 2% 1% 2% 1% 1% 1% Trump and Democrats in Congress * - * * - * - Republicans and Democrats in Congress 3% 1% 4% 2% 3% 3% 3% Don't know/Undecided/Refused 7% 10% 5% 8% 6% 7% 5% Sampling Error (+/-) 3.7 6.0 4.8 4.9 5.2 5.9 6.2
@ssrs_solutions | 484.840.4300 | www.ssrs.com | 27
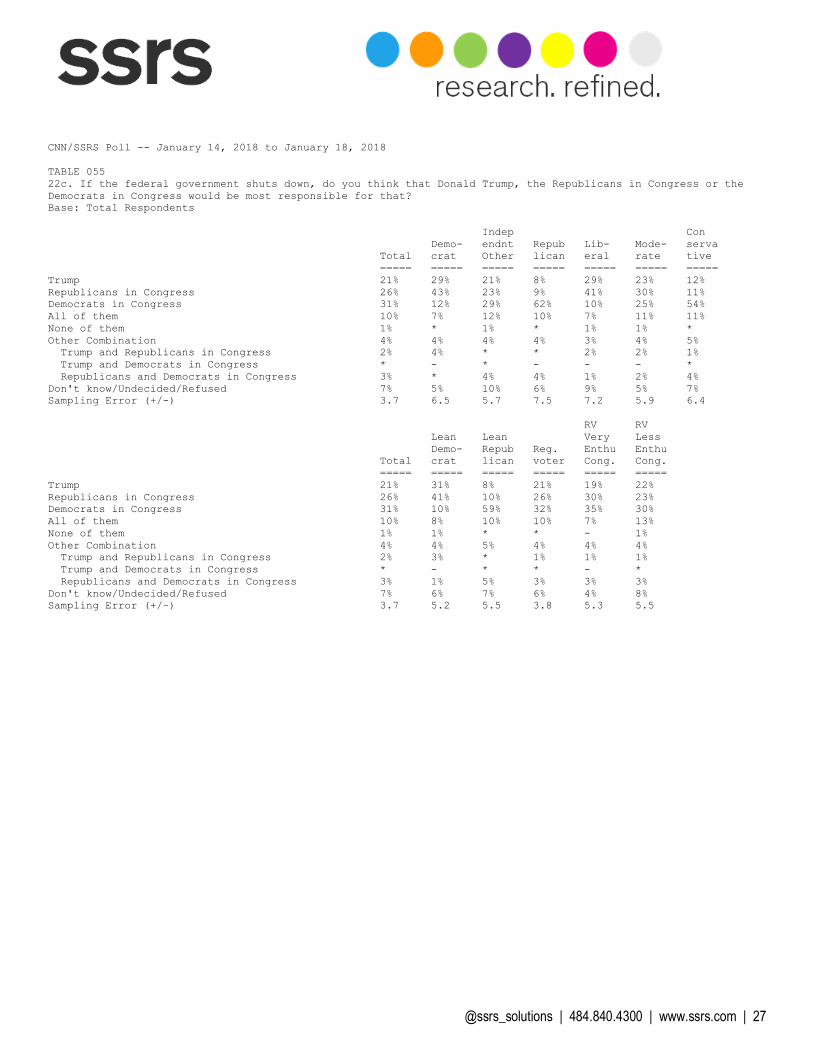
CNN/SSRS Poll -- January 14, 2018 to January 18, 2018 TABLE 055 22c. If the federal government shuts down, do you think that Donald Trump, the Republicans in Congress or the Democrats in Congress would be most responsible for that? Base: Total Respondents Indep Con Demo- endnt Repub Lib- Mode- serva Total crat Other lican eral rate tive ===== ===== ===== ===== ===== ===== ===== Trump 21% 29% 21% 8% 29% 23% 12% Republicans in Congress 26% 43% 23% 9% 41% 30% 11% Democrats in Congress 31% 12% 29% 62% 10% 25% 54% All of them 10% 7% 12% 10% 7% 11% 11% None of them 1% * 1% * 1% 1% * Other Combination 4% 4% 4% 4% 3% 4% 5% Trump and Republicans in Congress 2% 4% * * 2% 2% 1% Trump and Democrats in Congress * - * - - - * Republicans and Democrats in Congress 3% * 4% 4% 1% 2% 4% Don't know/Undecided/Refused 7% 5% 10% 6% 9% 5% 7% Sampling Error (+/-) 3.7 6.5 5.7 7.5 7.2 5.9 6.4 RV RV Lean Lean Very Less Demo- Repub Reg. Enthu Enthu Total crat lican voter Cong. Cong. ===== ===== ===== ===== ===== ===== Trump 21% 31% 8% 21% 19% 22% Republicans in Congress 26% 41% 10% 26% 30% 23% Democrats in Congress 31% 10% 59% 32% 35% 30% All of them 10% 8% 10% 10% 7% 13% None of them 1% 1% * * - 1% Other Combination 4% 4% 5% 4% 4% 4% Trump and Republicans in Congress 2% 3% * 1% 1% 1% Trump and Democrats in Congress * - * * - * Republicans and Democrats in Congress 3% 1% 5% 3% 3% 3% Don't know/Undecided/Refused 7% 6% 7% 6% 4% 8% Sampling Error (+/-) 3.7 5.2 5.5 3.8 5.3 5.5
@ssrs_solutions | 484.840.4300 | www.ssrs.com | 28
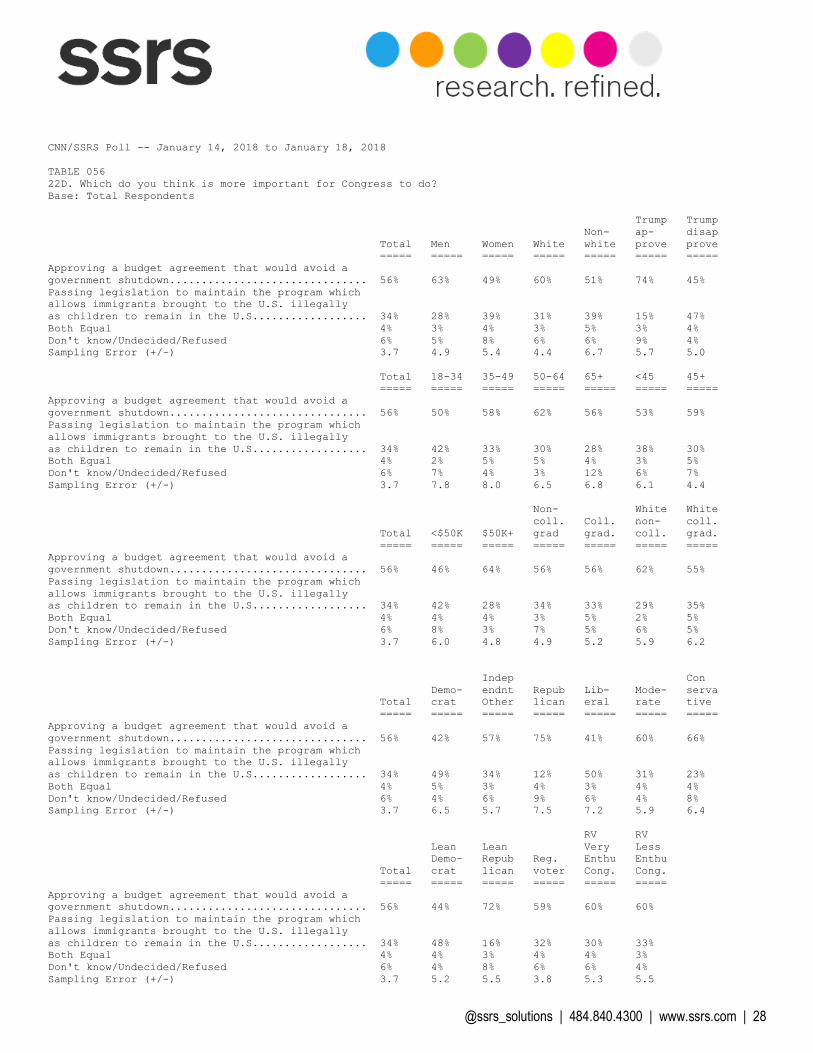
CNN/SSRS Poll -- January 14, 2018 to January 18, 2018 TABLE 056 22D. Which do you think is more important for Congress to do? Base: Total Respondents Trump Trump Non- ap- disap Total Men Women White white prove prove ===== ===== ===== ===== ===== ===== ===== Approving a budget agreement that would avoid a government shutdown............................... 56% 63% 49% 60% 51% 74% 45% Passing legislation to maintain the program which allows immigrants brought to the U.S. illegally as children to remain in the U.S.................. 34% 28% 39% 31% 39% 15% 47% Both Equal 4% 3% 4% 3% 5% 3% 4% Don't know/Undecided/Refused 6% 5% 8% 6% 6% 9% 4% Sampling Error (+/-) 3.7 4.9 5.4 4.4 6.7 5.7 5.0 Total 18-34 35-49 50-64 65+ <45 45+ ===== ===== ===== ===== ===== ===== ===== Approving a budget agreement that would avoid a government shutdown............................... 56% 50% 58% 62% 56% 53% 59% Passing legislation to maintain the program which allows immigrants brought to the U.S. illegally as children to remain in the U.S.................. 34% 42% 33% 30% 28% 38% 30% Both Equal 4% 2% 5% 5% 4% 3% 5% Don't know/Undecided/Refused 6% 7% 4% 3% 12% 6% 7% Sampling Error (+/-) 3.7 7.8 8.0 6.5 6.8 6.1 4.4 Non- White White coll. Coll. non- coll. Total <$50K $50K+ grad grad. coll. grad. ===== ===== ===== ===== ===== ===== ===== Approving a budget agreement that would avoid a government shutdown............................... 56% 46% 64% 56% 56% 62% 55% Passing legislation to maintain the program which allows immigrants brought to the U.S. illegally as children to remain in the U.S.................. 34% 42% 28% 34% 33% 29% 35% Both Equal 4% 4% 4% 3% 5% 2% 5% Don't know/Undecided/Refused 6% 8% 3% 7% 5% 6% 5% Sampling Error (+/-) 3.7 6.0 4.8 4.9 5.2 5.9 6.2 Indep Con Demo- endnt Repub Lib- Mode- serva Total crat Other lican eral rate tive ===== ===== ===== ===== ===== ===== ===== Approving a budget agreement that would avoid a government shutdown............................... 56% 42% 57% 75% 41% 60% 66% Passing legislation to maintain the program which allows immigrants brought to the U.S. illegally as children to remain in the U.S.................. 34% 49% 34% 12% 50% 31% 23% Both Equal 4% 5% 3% 4% 3% 4% 4% Don't know/Undecided/Refused 6% 4% 6% 9% 6% 4% 8% Sampling Error (+/-) 3.7 6.5 5.7 7.5 7.2 5.9 6.4 RV RV Lean Lean Very Less Demo- Repub Reg. Enthu Enthu Total crat lican voter Cong. Cong. ===== ===== ===== ===== ===== ===== Approving a budget agreement that would avoid a government shutdown............................... 56% 44% 72% 59% 60% 60% Passing legislation to maintain the program which allows immigrants brought to the U.S. illegally as children to remain in the U.S.................. 34% 48% 16% 32% 30% 33% Both Equal 4% 4% 3% 4% 4% 3% Don't know/Undecided/Refused 6% 4% 8% 6% 6% 4% Sampling Error (+/-) 3.7 5.2 5.5 3.8 5.3 5.5