Embed Size (px)
Citation preview
EMBARGO: NOT FOR PUBLICATION UNTIL1000 GMT 2 MAY 2002
ANNUAL REPORT 2002 – Chapter II – World Trade Developments
1. Main features
The widely expected slowdown in the expansion of world output and trade turned out to bemuch stronger than most observers had projected at the beginning of the year 2001. Global outputincreased only marginally and world trade decreased somewhat, both developments in sharp contrastto the preceding year when both trade and output expanded at record rates.
Quarterly year-to-year changes illustrate the severity of the downturn in the course of the yearfar better than the average annual changes in global trade and output. Output of the OECD countriesstagnated at its preceding year's level in the fourth quarter and for trade in goods and services acontraction of 7% could be observed in the final quarter.
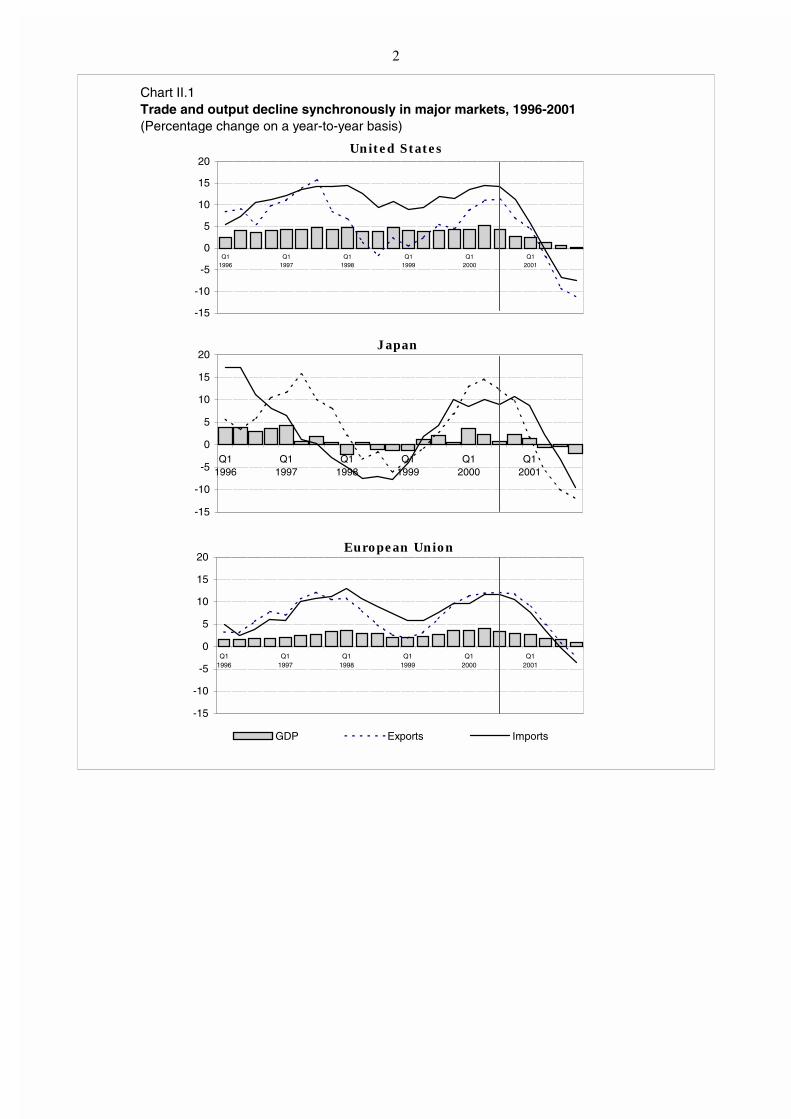
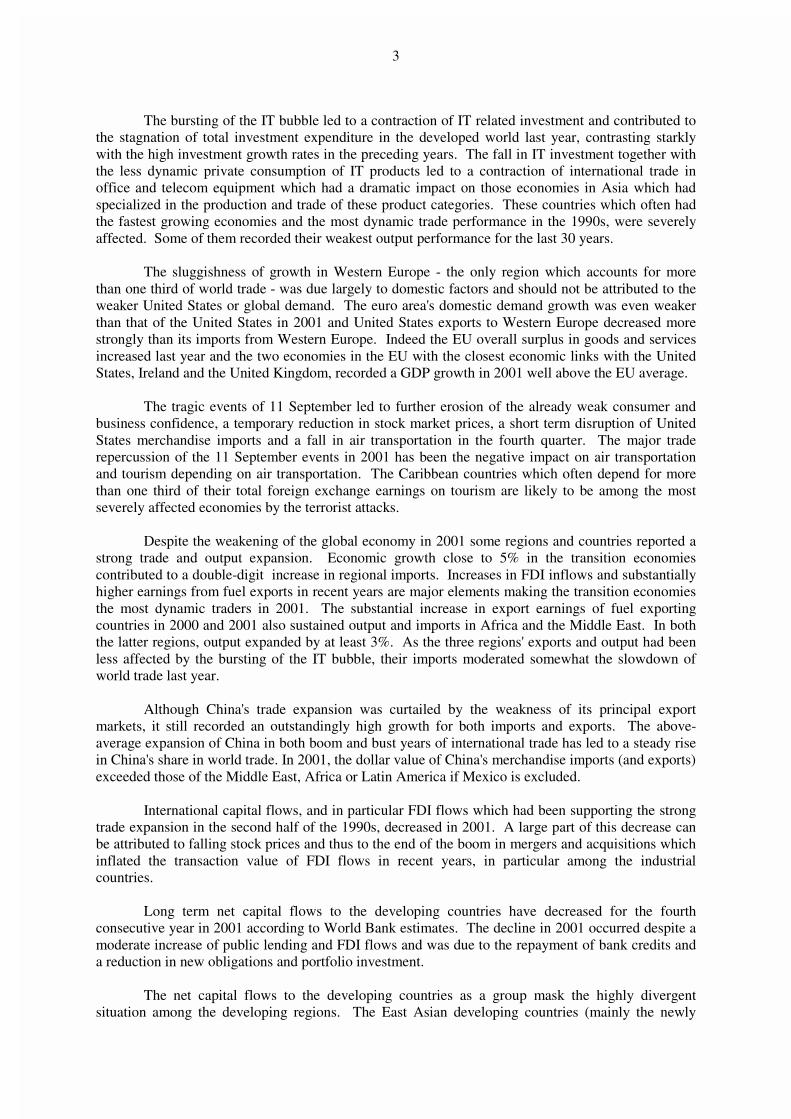
A salient feature of the recent weakening in global economic activity was the almostsimultaneous slowdown in the three major economies from the third quarter 2000 onwards. Contraryto the trade developments between the first quarters of 1998 and 2000 when United States andEuropean Union imports continued to expand rapidly despite a marked slowdown in their exports,fostering thereby the Asian recovery, their export and import growth have decelerated almost inparallel since the autumn of 2000. Imports of Japan started to slow somewhat later than in the othertwo markets but decreased as steeply as in the United States in the second half of 2001.
Three factors played a role in the steeper than expected slowdown: the bursting of the globalIT bubble; the sluggishness of Western Europe's activity; and, to a much lesser extent, the events of11 September.
2
United States
-15
-10
-5
0
5
10
15
20
Q11996
Q11997
Q11998
Q11999
Q12000
Q12001
Japan
-15
-10
-5
0
5
10
15
20
Q11996
Q11997
Q11998
Q11999
Q12000
Q12001
European Union
-15
-10
-5
0
5
10
15
20
Q11996
Q11997
Q11998
Q11999
Q12000
Q12001
GDP Exports Imports
Chart II.1 Trade and output decline synchronously in major markets, 1996-2001(Percentage change on a year-to-year basis)
3
The bursting of the IT bubble led to a contraction of IT related investment and contributed tothe stagnation of total investment expenditure in the developed world last year, contrasting starklywith the high investment growth rates in the preceding years. The fall in IT investment together withthe less dynamic private consumption of IT products led to a contraction of international trade inoffice and telecom equipment which had a dramatic impact on those economies in Asia which hadspecialized in the production and trade of these product categories. These countries which often hadthe fastest growing economies and the most dynamic trade performance in the 1990s, were severelyaffected. Some of them recorded their weakest output performance for the last 30 years.
The sluggishness of growth in Western Europe - the only region which accounts for morethan one third of world trade - was due largely to domestic factors and should not be attributed to theweaker United States or global demand. The euro area's domestic demand growth was even weakerthan that of the United States in 2001 and United States exports to Western Europe decreased morestrongly than its imports from Western Europe. Indeed the EU overall surplus in goods and servicesincreased last year and the two economies in the EU with the closest economic links with the UnitedStates, Ireland and the United Kingdom, recorded a GDP growth in 2001 well above the EU average.
The tragic events of 11 September led to further erosion of the already weak consumer andbusiness confidence, a temporary reduction in stock market prices, a short term disruption of UnitedStates merchandise imports and a fall in air transportation in the fourth quarter. The major traderepercussion of the 11 September events in 2001 has been the negative impact on air transportationand tourism depending on air transportation. The Caribbean countries which often depend for morethan one third of their total foreign exchange earnings on tourism are likely to be among the mostseverely affected economies by the terrorist attacks.
Despite the weakening of the global economy in 2001 some regions and countries reported astrong trade and output expansion. Economic growth close to 5% in the transition economiescontributed to a double-digit increase in regional imports. Increases in FDI inflows and substantiallyhigher earnings from fuel exports in recent years are major elements making the transition economiesthe most dynamic traders in 2001. The substantial increase in export earnings of fuel exportingcountries in 2000 and 2001 also sustained output and imports in Africa and the Middle East. In boththe latter regions, output expanded by at least 3%. As the three regions' exports and output had beenless affected by the bursting of the IT bubble, their imports moderated somewhat the slowdown ofworld trade last year.
Although China's trade expansion was curtailed by the weakness of its principal exportmarkets, it still recorded an outstandingly high growth for both imports and exports. The above-average expansion of China in both boom and bust years of international trade has led to a steady risein China's share in world trade. In 2001, the dollar value of China's merchandise imports (and exports)exceeded those of the Middle East, Africa or Latin America if Mexico is excluded.
International capital flows, and in particular FDI flows which had been supporting the strongtrade expansion in the second half of the 1990s, decreased in 2001. A large part of this decrease canbe attributed to falling stock prices and thus to the end of the boom in mergers and acquisitions whichinflated the transaction value of FDI flows in recent years, in particular among the industrialcountries.
Long term net capital flows to the developing countries have decreased for the fourthconsecutive year in 2001 according to World Bank estimates. The decline in 2001 occurred despite amoderate increase of public lending and FDI flows and was due to the repayment of bank credits anda reduction in new obligations and portfolio investment.
The net capital flows to the developing countries as a group mask the highly divergentsituation among the developing regions. The East Asian developing countries (mainly the newly

4
industrialized economies and China) have recorded since 1998 a large current account surplus whichexceeds the current account deficits of Latin America, Africa and that of South Asia. Indeed, the netsavings of Japan and those of developing East Asia are the principal source of financing for the twomajor deficit regions which are the United States and Latin America.
The attraction of the United States for investors was again strong enough to finance theUnited States current account deficit which remained in excess of US dollar 400 billion and to pushup the US dollar which appreciated further on an inflation adjusted, trade weighted basis in 2001.Since 1995, the real effective exchange rate of the United States currency has appreciated by morethan one third.
It is this general appreciation of the US dollar which, together with moderate domesticinflation rates, has lead to falling dollar prices in international trade. Since 1996, the prices ofmanufactured goods exchanged internationally decreased each year and remained in 2001 more than aquarter below their level in 1995. For non-fuel commodity prices the cumulative decline is similar tothat of manufactured goods and almost as steady over the last six years. Prices for oil, however,recorded large year-to-year variations over the last six years and despite their decline in 2001averaged more than 40% above their 1995 level. The strength of oil prices in the last three years is amajor element in the strong GDP growth and import expansion of oil exporting regions and countriesin 2001. Another feature was that global import demand for oil and other fuels did not decreasesignificantly. In particular, United States imports of oil continued to increase in real terms in 2001.
The successful launching of the Doha agenda after the events of 11 September and theacceptance of the Ministerial Conference of four new members sent out a clear signal that themultilateral trading system is fully operational, that the removal of trade barriers will continue, thatmember countries want to make their economies more open and international trade be governed bymultilaterally agreed rules. While Doha helped to re-establish the battered consumer and businessconfidence, it could have little immediate impact on current trade flows as economic agents need timeto adjust to the new opportunities. On the other hand, the more limited undertakings by the industrialcountries to provide duty-free, quota-free access to all or most LDCs through the "Everything butArms" initiative of the EU or the United States-African Growth and Opportunity Act (AGOA) wouldhave supported exports of individual countries already in 2001, although at present it is still too earlyto make an objective analysis of the full impact of these trade policy initiatives. However, it isencouraging to observe that some of the African countries, beneficiaries of the AGOA, recordedsubstantially higher exports to the United States than in the preceding year, despite faltering UnitedStates demand and a contraction of overall United States imports.
2. Merchandise trade and output developments
The contrast in the developments of world output and trade between the years 2001 and 2000could hardly be more striking. In 2001, the lowest growth in output in more than two decades and adecrease in trade flows represented a major reversal from the year 2000, which recorded the highesttrade and output growth of the last ten years. In 2000, output growth was strong not only globally butalso in all major geographic regions, while in 2001 large regional differences in trade and outputgrowth prevailed.
5
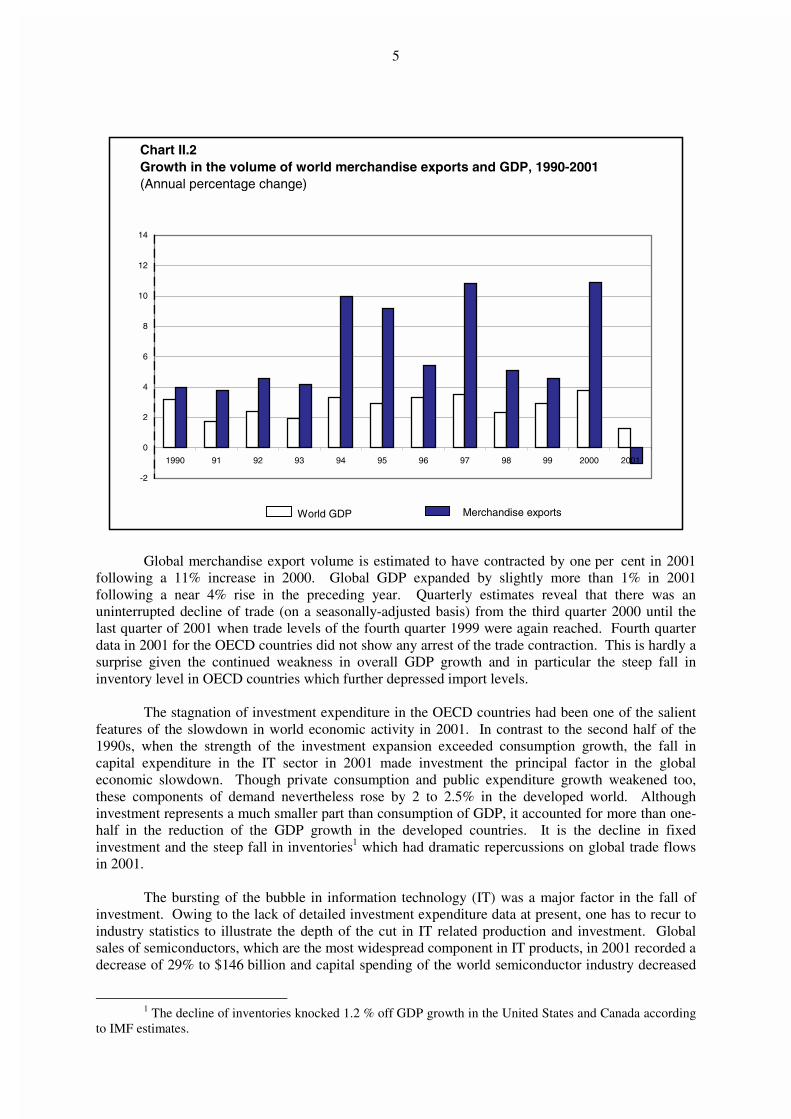
Global merchandise export volume is estimated to have contracted by one per cent in 2001following a 11% increase in 2000. Global GDP expanded by slightly more than 1% in 2001following a near 4% rise in the preceding year. Quarterly estimates reveal that there was anuninterrupted decline of trade (on a seasonally-adjusted basis) from the third quarter 2000 until thelast quarter of 2001 when trade levels of the fourth quarter 1999 were again reached. Fourth quarterdata in 2001 for the OECD countries did not show any arrest of the trade contraction. This is hardly asurprise given the continued weakness in overall GDP growth and in particular the steep fall ininventory level in OECD countries which further depressed import levels.
The stagnation of investment expenditure in the OECD countries had been one of the salientfeatures of the slowdown in world economic activity in 2001. In contrast to the second half of the1990s, when the strength of the investment expansion exceeded consumption growth, the fall incapital expenditure in the IT sector in 2001 made investment the principal factor in the globaleconomic slowdown. Though private consumption and public expenditure growth weakened too,these components of demand nevertheless rose by 2 to 2.5% in the developed world. Althoughinvestment represents a much smaller part than consumption of GDP, it accounted for more than one-half in the reduction of the GDP growth in the developed countries. It is the decline in fixedinvestment and the steep fall in inventories1 which had dramatic repercussions on global trade flowsin 2001.
The bursting of the bubble in information technology (IT) was a major factor in the fall ofinvestment. Owing to the lack of detailed investment expenditure data at present, one has to recur toindustry statistics to illustrate the depth of the cut in IT related production and investment. Globalsales of semiconductors, which are the most widespread component in IT products, in 2001 recorded adecrease of 29% to $146 billion and capital spending of the world semiconductor industry decreased
1 The decline of inventories knocked 1.2 % off GDP growth in the United States and Canada according
to IMF estimates.
-2
0
2
4
6
8
10
12
14
1990 91 92 93 94 95 96 97 98 99 2000 2001
Chart II.2Growth in the volume of world merchandise exports and GDP, 1990-2001(Annual percentage change)
Merchandise exports World GDP

6
at a similar rate. World wide shipments of personal computers totaled 128 million units, a 4.6%decline from the previous year, the first year since 1985 in which PC sales decreased. Mobile phonesales dropped by 3% in 2001 to nearly 400 million units after more than doubling in the twopreceding years.2
As the importance of IT investment and trade differs significantly among major regions theimpact of the downturn in the information and telecom sector was felt more strongly in the output andtrade growth of North America, Asia and Western Europe than in other regions. These developmentsare a factor which contributed prominently to the sluggish overall trade and output growth of NorthAmerica and Asia, the regions which benefited most in the recent past from the boom in IT industries.
North America's merchandise export volume recorded the strongest regional decline in 2001at 5%. Somewhat surprisingly, the export decrease was larger than that of imports. Several factorshave contributed to this outcome: first economic growth among North America's major tradingpartners in Latin America, Asia and Western Europe was also weak and the strength of the US dollarhas cost United States goods market shares at home and abroad. Automotive products recorded adecline in import volumes of 3% but exports in this category decreased by 7.5%. Imports ofconsumer goods still rose by 1.5% and that of petroleum by 4% while the corresponding exportsdecreased.
2 World Semiconductor Trade Statistics, Direct Communication; Gartner, Press Releases dated 7
January, 29 January 2002 and 7 March 2002.
Chart II.3 Real GDP growth by region in 2000 and 2001(Annual percentage change)
0 1 2 3 4 5 6 7
Transition Economies
Africa
Middle East
Western Europe
Asia
North America
Latin America
2001
2000
7
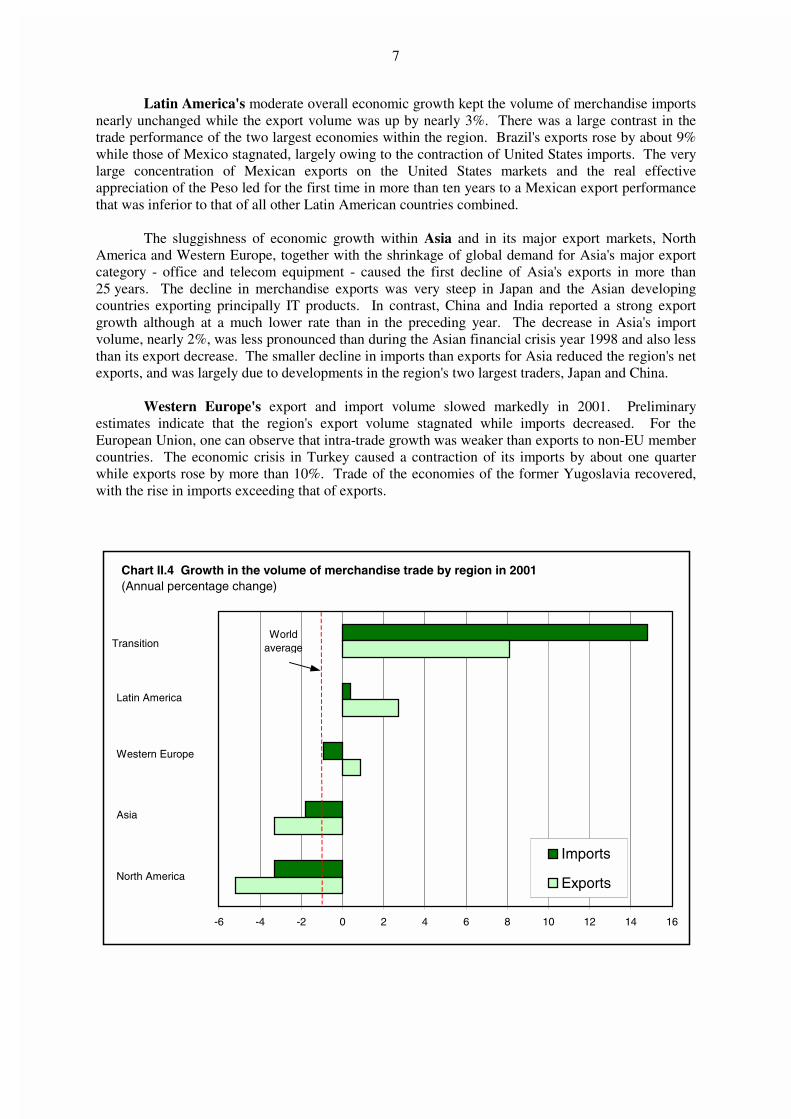
Latin America's moderate overall economic growth kept the volume of merchandise importsnearly unchanged while the export volume was up by nearly 3%. There was a large contrast in thetrade performance of the two largest economies within the region. Brazil's exports rose by about 9%while those of Mexico stagnated, largely owing to the contraction of United States imports. The verylarge concentration of Mexican exports on the United States markets and the real effectiveappreciation of the Peso led for the first time in more than ten years to a Mexican export performancethat was inferior to that of all other Latin American countries combined.
The sluggishness of economic growth within Asia and in its major export markets, NorthAmerica and Western Europe, together with the shrinkage of global demand for Asia's major exportcategory - office and telecom equipment - caused the first decline of Asia's exports in more than25 years. The decline in merchandise exports was very steep in Japan and the Asian developingcountries exporting principally IT products. In contrast, China and India reported a strong exportgrowth although at a much lower rate than in the preceding year. The decrease in Asia's importvolume, nearly 2%, was less pronounced than during the Asian financial crisis year 1998 and also lessthan its export decrease. The smaller decline in imports than exports for Asia reduced the region's netexports, and was largely due to developments in the region's two largest traders, Japan and China.
Western Europe's export and import volume slowed markedly in 2001. Preliminaryestimates indicate that the region's export volume stagnated while imports decreased. For theEuropean Union, one can observe that intra-trade growth was weaker than exports to non-EU membercountries. The economic crisis in Turkey caused a contraction of its imports by about one quarterwhile exports rose by more than 10%. Trade of the economies of the former Yugoslavia recovered,with the rise in imports exceeding that of exports.
Chart II.4 Growth in the volume of merchandise trade by region in 2001(Annual percentage change)
-6 -4 -2 0 2 4 6 8 10 12 14 16
Imports
Exports
Transition
Latin America
Western Europe
Asia
North America
World average
8
Volume data for the trade of Africa and the Middle East are rather fragile as only a fewcountries in these regions provide the necessary information, and reported prices for their majorexport commodities or international export markets might not always reflect adequately the actualexport price developments. According to rough estimates prepared by the Secretariat, it appears thattheir trade expansion in 2001 was less dynamic than in 2000 but decelerated far less than world tradeand remained positive, with import growth exceeding that of exports.
The transition economies' rapid trade expansion was strikingly different from thesluggishness of world trade in 2001. Merchandise export volume growth is estimated to haveexpanded by about 8% and import growth of about 15% was almost unchanged from the precedingyear. Import growth was close to 20% for the fuel exporting Russian Federation, Kazakhstan andAzerbaijan. Imports into Poland, which reported the largest merchandise import value among thetransition economies in 2000, registered only a moderate increase. Foreign direct investment inflowshave most likely also contributed to the strength of imports of the transition economies.
3. Trade developments in value terms
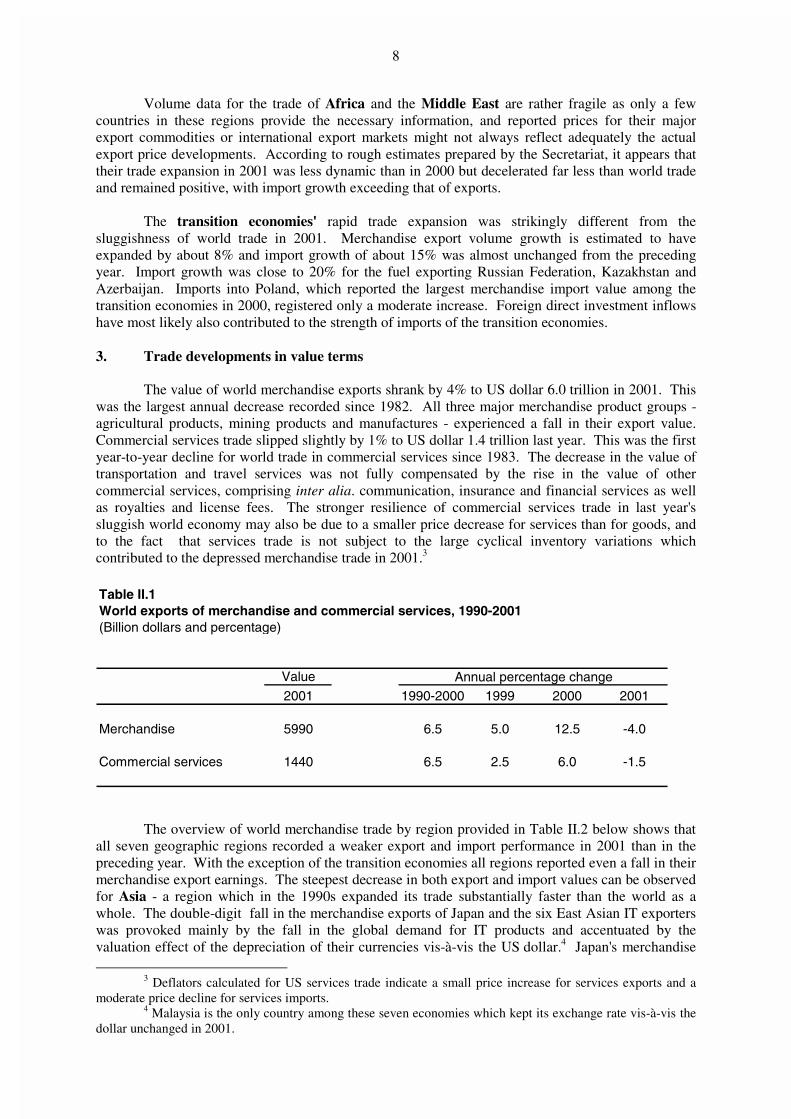
The value of world merchandise exports shrank by 4% to US dollar 6.0 trillion in 2001. Thiswas the largest annual decrease recorded since 1982. All three major merchandise product groups -agricultural products, mining products and manufactures - experienced a fall in their export value.Commercial services trade slipped slightly by 1% to US dollar 1.4 trillion last year. This was the firstyear-to-year decline for world trade in commercial services since 1983. The decrease in the value oftransportation and travel services was not fully compensated by the rise in the value of othercommercial services, comprising inter alia. communication, insurance and financial services as wellas royalties and license fees. The stronger resilience of commercial services trade in last year'ssluggish world economy may also be due to a smaller price decrease for services than for goods, andto the fact that services trade is not subject to the large cyclical inventory variations whichcontributed to the depressed merchandise trade in 2001.3
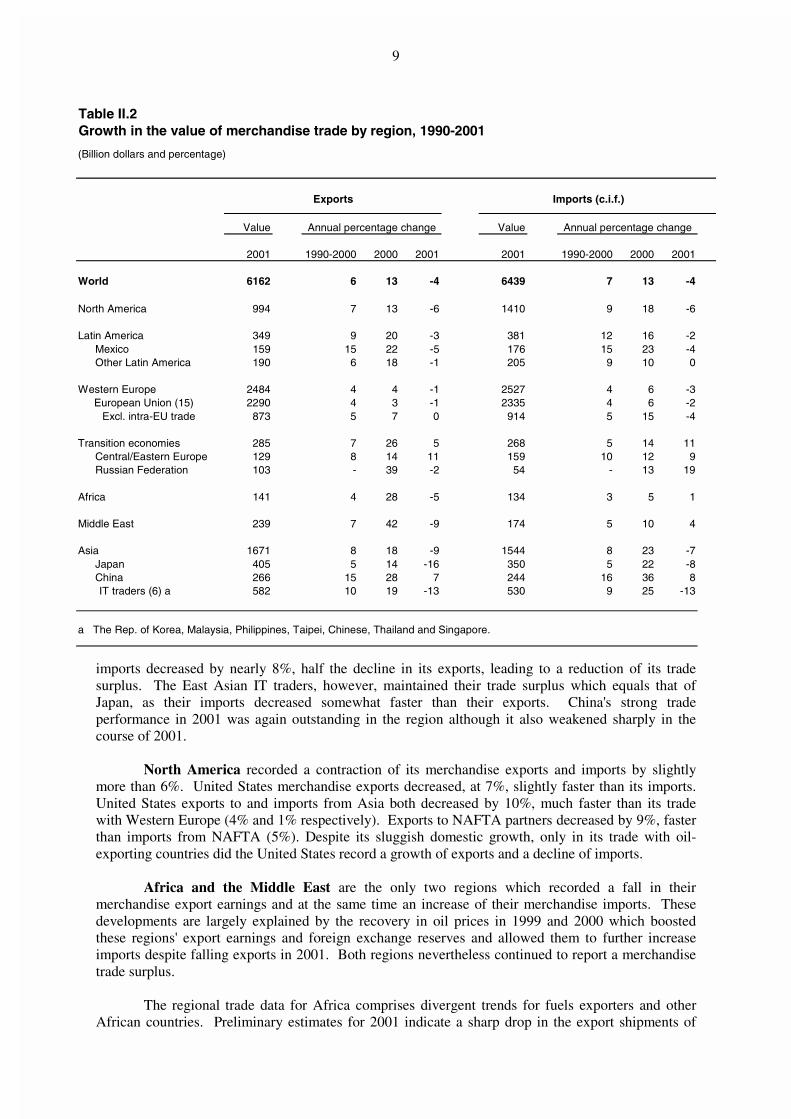
The overview of world merchandise trade by region provided in Table II.2 below shows thatall seven geographic regions recorded a weaker export and import performance in 2001 than in thepreceding year. With the exception of the transition economies all regions reported even a fall in theirmerchandise export earnings. The steepest decrease in both export and import values can be observedfor Asia - a region which in the 1990s expanded its trade substantially faster than the world as awhole. The double-digit fall in the merchandise exports of Japan and the six East Asian IT exporterswas provoked mainly by the fall in the global demand for IT products and accentuated by thevaluation effect of the depreciation of their currencies vis-à-vis the US dollar.4 Japan's merchandise
3 Deflators calculated for US services trade indicate a small price increase for services exports and amoderate price decline for services imports.
4 Malaysia is the only country among these seven economies which kept its exchange rate vis-à-vis thedollar unchanged in 2001.
Table II.1World exports of merchandise and commercial services, 1990-2001(Billion dollars and percentage)
Value
2001 1990-2000 1999 2000 2001
Merchandise 5990 6.5 5.0 12.5 -4.0
Commercial services 1440 6.5 2.5 6.0 -1.5
Annual percentage change
9
imports decreased by nearly 8%, half the decline in its exports, leading to a reduction of its tradesurplus. The East Asian IT traders, however, maintained their trade surplus which equals that ofJapan, as their imports decreased somewhat faster than their exports. China's strong tradeperformance in 2001 was again outstanding in the region although it also weakened sharply in thecourse of 2001.
North America recorded a contraction of its merchandise exports and imports by slightlymore than 6%. United States merchandise exports decreased, at 7%, slightly faster than its imports.United States exports to and imports from Asia both decreased by 10%, much faster than its tradewith Western Europe (4% and 1% respectively). Exports to NAFTA partners decreased by 9%, fasterthan imports from NAFTA (5%). Despite its sluggish domestic growth, only in its trade with oil-exporting countries did the United States record a growth of exports and a decline of imports.
Africa and the Middle East are the only two regions which recorded a fall in theirmerchandise export earnings and at the same time an increase of their merchandise imports. Thesedevelopments are largely explained by the recovery in oil prices in 1999 and 2000 which boostedthese regions' export earnings and foreign exchange reserves and allowed them to further increaseimports despite falling exports in 2001. Both regions nevertheless continued to report a merchandisetrade surplus.
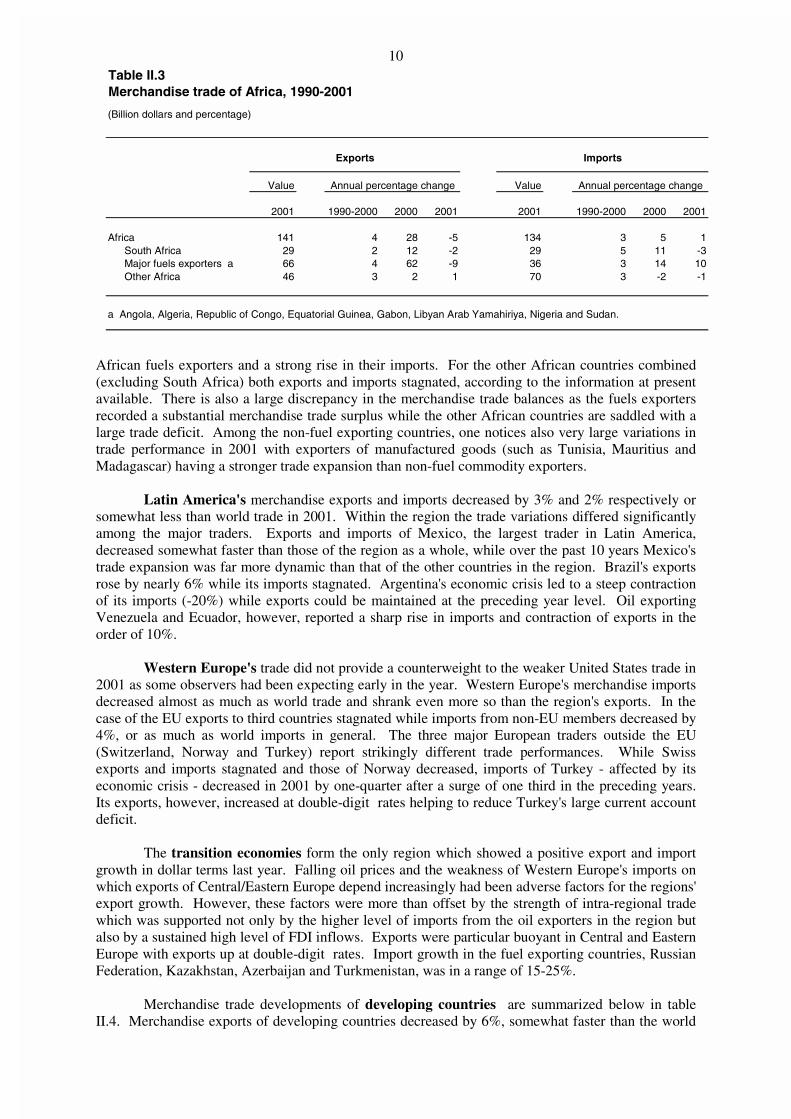
The regional trade data for Africa comprises divergent trends for fuels exporters and otherAfrican countries. Preliminary estimates for 2001 indicate a sharp drop in the export shipments of
Table II.2Growth in the value of merchandise trade by region, 1990-2001
(Billion dollars and percentage)
Value Value
2001 1990-2000 2000 2001 2001 1990-2000 2000 2001
World 6162 6 13 -4 6439 7 13 -4
North America 994 7 13 -6 1410 9 18 -6
Latin America 349 9 20 -3 381 12 16 -2 Mexico 159 15 22 -5 176 15 23 -4 Other Latin America 190 6 18 -1 205 9 10 0
Western Europe 2484 4 4 -1 2527 4 6 -3European Union (15) 2290 4 3 -1 2335 4 6 -2
Excl. intra-EU trade 873 5 7 0 914 5 15 -4
Transition economies 285 7 26 5 268 5 14 11 Central/Eastern Europe 129 8 14 11 159 10 12 9 Russian Federation 103 - 39 -2 54 - 13 19
Africa 141 4 28 -5 134 3 5 1
Middle East 239 7 42 -9 174 5 10 4
Asia 1671 8 18 -9 1544 8 23 -7 Japan 405 5 14 -16 350 5 22 -8 China 266 15 28 7 244 16 36 8
IT traders (6) a 582 10 19 -13 530 9 25 -13
a The Rep. of Korea, Malaysia, Philippines, Taipei, Chinese, Thailand and Singapore.
Exports Imports (c.i.f.)
Annual percentage change Annual percentage change
10
African fuels exporters and a strong rise in their imports. For the other African countries combined(excluding South Africa) both exports and imports stagnated, according to the information at presentavailable. There is also a large discrepancy in the merchandise trade balances as the fuels exportersrecorded a substantial merchandise trade surplus while the other African countries are saddled with alarge trade deficit. Among the non-fuel exporting countries, one notices also very large variations intrade performance in 2001 with exporters of manufactured goods (such as Tunisia, Mauritius andMadagascar) having a stronger trade expansion than non-fuel commodity exporters.
Latin America's merchandise exports and imports decreased by 3% and 2% respectively orsomewhat less than world trade in 2001. Within the region the trade variations differed significantlyamong the major traders. Exports and imports of Mexico, the largest trader in Latin America,decreased somewhat faster than those of the region as a whole, while over the past 10 years Mexico'strade expansion was far more dynamic than that of the other countries in the region. Brazil's exportsrose by nearly 6% while its imports stagnated. Argentina's economic crisis led to a steep contractionof its imports (-20%) while exports could be maintained at the preceding year level. Oil exportingVenezuela and Ecuador, however, reported a sharp rise in imports and contraction of exports in theorder of 10%.
Western Europe's trade did not provide a counterweight to the weaker United States trade in2001 as some observers had been expecting early in the year. Western Europe's merchandise importsdecreased almost as much as world trade and shrank even more so than the region's exports. In thecase of the EU exports to third countries stagnated while imports from non-EU members decreased by4%, or as much as world imports in general. The three major European traders outside the EU(Switzerland, Norway and Turkey) report strikingly different trade performances. While Swissexports and imports stagnated and those of Norway decreased, imports of Turkey - affected by itseconomic crisis - decreased in 2001 by one-quarter after a surge of one third in the preceding years.Its exports, however, increased at double-digit rates helping to reduce Turkey's large current accountdeficit.
The transition economies form the only region which showed a positive export and importgrowth in dollar terms last year. Falling oil prices and the weakness of Western Europe's imports onwhich exports of Central/Eastern Europe depend increasingly had been adverse factors for the regions'export growth. However, these factors were more than offset by the strength of intra-regional tradewhich was supported not only by the higher level of imports from the oil exporters in the region butalso by a sustained high level of FDI inflows. Exports were particular buoyant in Central and EasternEurope with exports up at double-digit rates. Import growth in the fuel exporting countries, RussianFederation, Kazakhstan, Azerbaijan and Turkmenistan, was in a range of 15-25%.
Merchandise trade developments of developing countries are summarized below in tableII.4. Merchandise exports of developing countries decreased by 6%, somewhat faster than the world
Table II.3Merchandise trade of Africa, 1990-2001
(Billion dollars and percentage)
Value Value
2001 1990-2000 2000 2001 2001 1990-2000 2000 2001
Africa 141 4 28 -5 134 3 5 1 South Africa 29 2 12 -2 29 5 11 -3 Major fuels exporters a 66 4 62 -9 36 3 14 10 Other Africa 46 3 2 1 70 3 -2 -1
a Angola, Algeria, Republic of Congo, Equatorial Guinea, Gabon, Libyan Arab Yamahiriya, Nigeria and Sudan.
Exports Imports
Annual percentage change Annual percentage change

11
average in 2001, largely due to the marked contraction of shipments from the East Asian traders of ITproducts and that of oil exporting developing countries. Among the other developing countries China,Brazil and India recorded an increase in their exports while those of Hong Kong, China and Mexicodecreased. The share of the developing countries in world merchandise exports decreased slightlyfrom their peak level of nearly 30% in 2001.
Merchandise imports of the developing countries as a group declined by about the same rateas world trade. A further rise of the imports of the oil exporting developing countries and of Chinacontrasted with the steep decline in imports of the East Asian traders of information technologyproducts. Among the other major developing economies, import decreases are reported for HongKong, China; Mexico and India while those of Brazil stagnated.
For the least developed countries tentative estimates based on incomplete information pointto a stagnation of their exports and imports in 2001. Given the importance of fuels in exports of theLDCs, this outcome, if confirmed by the actual numbers, implies an increase in real terms and for thethird year in a row a faster export growth than for the world.
Although developing countries exports decreased faster than imports, they still recorded anoverall merchandise trade surplus in 2001. The aggregate surplus of developing countries is thecombination of the surpluses of the IT traders, the oil-exporters and China and a deficit for theremaining developing countries.
Commercial services trade
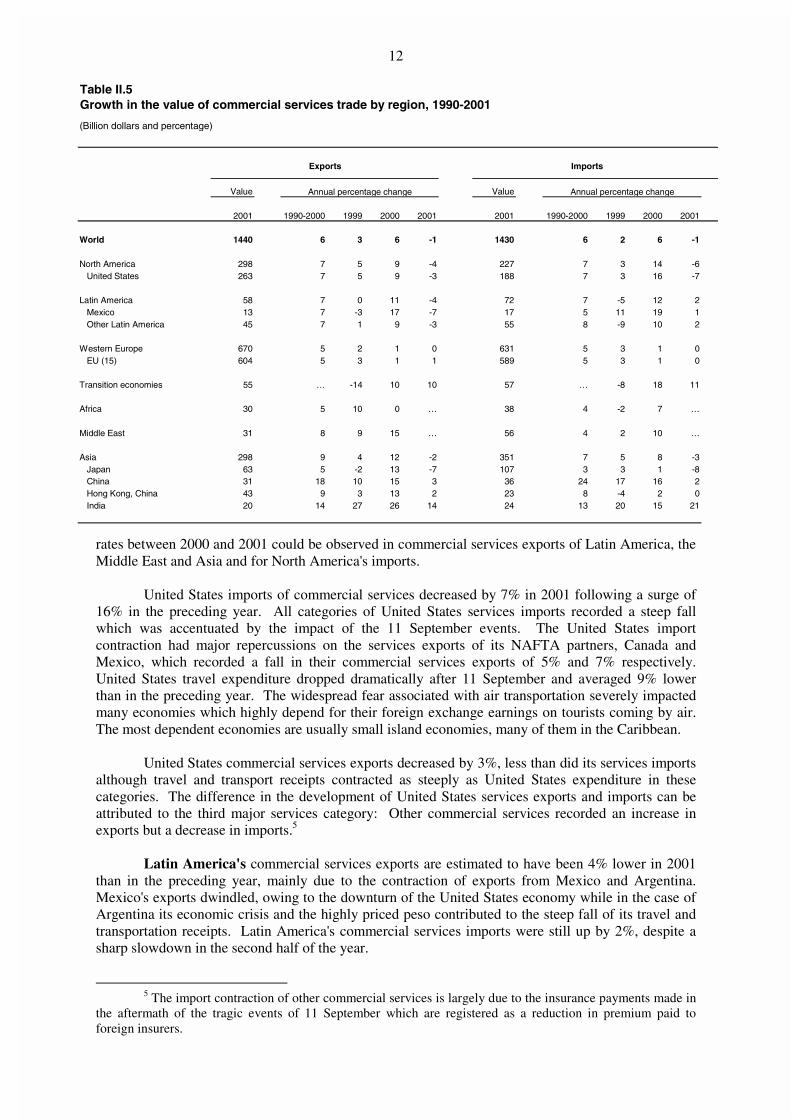
World trade in commercial services is estimated to have decreased by 1% to US dollar 1.44trillion in 2001. This first decline of world commercial services exports since 1983 affected allservices categories and all the major regions. According to the preliminary data available, it isestimated that the receipts from travel and transportation services decreased by three and 2%respectively. Exports of the largest services category (including communication, insurance, financialservices and royalties and license fees) stagnated in 2001.
The impact of the slowdown in commercial services trade differed largely among the majorregions. Most of them reported a decline in exports and imports. The sharpest deceleration in growth
Table II.4Merchandise trade of developing countries, 1990-2001
(Billion dollars and percentage)
Value Value
2001 1990-2000 2000 2001 2001 1990-2000 2000 2001
Developing countries 1991 9 23 -6 1850 9 20 -5 Oil exporters 350 7 46 -9 198 4 15 7 Non-oil exporters 1590 10 19 -5 1653 10 21 -6 IT traders (6) a 568 9 19 -13 530 9 25 -14 Other dev. economies 1022 11 19 0 1123 10 18 -2 China 266 15 28 7 244 16 36 8 Hong Kong, China 191 9 16 -6 202 10 18 -6 Mexico 159 15 22 -5 176 15 23 -4 Brazil 58 6 15 6 58 10 13 0 India 44 9 19 4 51 8 10 -2
a The Rep. of Korea, Malaysia, Philippines, Taipei, Chinese, Thailand and Singapore.
Exports Imports (c.i.f.)
Annual percentage change Annual percentage change
12
rates between 2000 and 2001 could be observed in commercial services exports of Latin America, theMiddle East and Asia and for North America's imports.
United States imports of commercial services decreased by 7% in 2001 following a surge of16% in the preceding year. All categories of United States services imports recorded a steep fallwhich was accentuated by the impact of the 11 September events. The United States importcontraction had major repercussions on the services exports of its NAFTA partners, Canada andMexico, which recorded a fall in their commercial services exports of 5% and 7% respectively.United States travel expenditure dropped dramatically after 11 September and averaged 9% lowerthan in the preceding year. The widespread fear associated with air transportation severely impactedmany economies which highly depend for their foreign exchange earnings on tourists coming by air.The most dependent economies are usually small island economies, many of them in the Caribbean.
United States commercial services exports decreased by 3%, less than did its services importsalthough travel and transport receipts contracted as steeply as United States expenditure in thesecategories. The difference in the development of United States services exports and imports can beattributed to the third major services category: Other commercial services recorded an increase inexports but a decrease in imports.5
Latin America's commercial services exports are estimated to have been 4% lower in 2001than in the preceding year, mainly due to the contraction of exports from Mexico and Argentina.Mexico's exports dwindled, owing to the downturn of the United States economy while in the case ofArgentina its economic crisis and the highly priced peso contributed to the steep fall of its travel andtransportation receipts. Latin America's commercial services imports were still up by 2%, despite asharp slowdown in the second half of the year.
5 The import contraction of other commercial services is largely due to the insurance payments made in
the aftermath of the tragic events of 11 September which are registered as a reduction in premium paid toforeign insurers.
Table II.5Growth in the value of commercial services trade by region, 1990-2001
(Billion dollars and percentage)
Value Value
2001 1990-2000 1999 2000 2001 2001 1990-2000 1999 2000 2001
World 1440 6 3 6 -1 1430 6 2 6 -1
North America 298 7 5 9 -4 227 7 3 14 -6United States 263 7 5 9 -3 188 7 3 16 -7
Latin America 58 7 0 11 -4 72 7 -5 12 2Mexico 13 7 -3 17 -7 17 5 11 19 1Other Latin America 45 7 1 9 -3 55 8 -9 10 2
Western Europe 670 5 2 1 0 631 5 3 1 0EU (15) 604 5 3 1 1 589 5 3 1 0
Transition economies 55 … -14 10 10 57 … -8 18 11
Africa 30 5 10 0 … 38 4 -2 7 …
Middle East 31 8 9 15 … 56 4 2 10 …
Asia 298 9 4 12 -2 351 7 5 8 -3Japan 63 5 -2 13 -7 107 3 3 1 -8China 31 18 10 15 3 36 24 17 16 2Hong Kong, China 43 9 3 13 2 23 8 -4 2 0India 20 14 27 26 14 24 13 20 15 21
Exports Imports
Annual percentage change Annual percentage change
13
Asia's exports and imports of commercial services decreased again only three years after thesevere contraction during the Asian financial crisis. Indeed, Asia's commercial services tradeaveraged in 2001 below its 1997 level. Sluggish overall economic and merchandise trade growth inAsia and in particular in Japan, together with exchange rate changes, contributed to the region'scommercial services trade decline. The downturn was particularly pronounced for Japan andAustralia. China, Hong Kong, China and India, however, recorded higher commercial servicesexports receipts than in the preceding year. In the case of India, a very sharp growth for services(exports and imports) is reported in the category of other commercial services.
The scant information available for services trade of Africa and the Middle East point to acontraction of both exports and imports in 2001. Egypt and South Africa, which combined accountedfor more than 45% of African commercial services exports in 2000, both report a decrease in theirexports and imports in 2001. Israel, by far the largest exporter in the Middle East, recorded a steepfall in its services exports - due to sharply lower earnings from tourism.
Western Europe's services trade stagnated in 2001 following a small increase in thepreceding year. Measured in euro terms the deceleration in 2001 is considerably more pronounced asthe dollar appreciation vis-à-vis the euro was far less in 2001 than in 2000. Within Western Europemarked differences in the trade performance could be observed between the three largest traders(United Kingdom, Germany and France) which reported a fall in their exports and imports, and Italyand Spain which experienced a marked increase in both exports and imports. Ireland continued toreport by far the most dynamic services trade in Western Europe, concentrated on its othercommercial services trade.
The transition economies' commercial services trade continued to expand stronglybenefiting from the region's high economic growth. Both exports and imports expanded by almost10% in 2001. The expansion of services trade was strong across all sectors. On a country level,above average export growth has been observed for Poland, Hungary and the Slovak Republic whileimports were buoyant in the Russian Federation, Ukraine and Hungary.6
4. Trade outlook
Information available at the time of writing (end March 2002) indicates that the decelerationof United States demand was arrested and might have started to pick up in recent months. In WesternEurope data on business confidence and order income point to an improvement in the business climatewhich should lead to a gradual recovery of investment and a more vigorous consumption growth inthe course of the year. In Asia, the growth prospects for Japan are still considered to be bleak for2002 while a number of other Asian countries, including the Republic of Korea, report a strengtheningof consumer and investment expenditure. Global economic activity is expected to pick up in the firsthalf also due to the rebuilding of depleted inventories and is expected to gain more momentum in thesecond half of the year. Despite an acceleration of output growth in the course of the year, theprojected annual GDP growth is unlikely to be larger than in 2001. According to the IMF, WorldEconomic Outlook Projections (March 2002) world GDP growth is expected to be 2.5% in 2002,unchanged from 2001.7
World merchandise trade is expected to expand only marginally on a year-to-year basisdespite a projected increase of 6% between the fourth quarter of 2001 and that of 2002. Given thelow trade level in the fourth quarter of 2001 it would take a steady increase of 5% at annual rates fromthe first quarter onwards for trade to recover to the average level of 2001.8 A strong rebound in tradeis not the most likely outcome given the moderate output gains in major markets and today's more
6 Commercial services trade data by country are reported in Appendix Table II.3.7 Estimate based by using PPP weights. Using GDP measured at 1995 market exchange rates would
result in a world GDP growth of 1.4 % respectively in both years.8 The volume of world trade in the fourth quarter of 2001 is estimated to have been six % lower than in
the preceding year.

14
sober prospects for the IT industries.9 It is the projected lower growth of the IT industries whichmight lead in the coming years to a smaller excess of trade over output growth than was observed inthe second half of the 1990s.
5. Commodity Prices and Export Earnings of Developing Countries
Commodity price fluctuations have been again quite considerable in 2001, with the number ofprimary products recording a price decrease exceeding by far those which recorded a price increase.However, a number of primary products recorded double-digit increases for highly diverging reasonswith the result that the yearly average of non-fuel commodity prices decrease of 5% masks widevariations. The sluggishness of global manufacturing output10 contributed to the weakness of pricesfor industrial inputs, in particular non-ferrous metals. Prices for copper, the most important non-ferrous metal exported by developing countries, recorded a double-digit decrease in 2001 to a sevenyear low. Prices for some tropical beverages suffered from a market situation in which a strongextension of the area planted and good harvests increased the supply well above global demandgrowth. Coffee prices slumped by nearly 30% reaching their lowest level in 30 years. Cotton pricesdropped by nearly 20% affecting strongly the overall export earnings of Benin, Chad, Mali andBurkina Faso. By contrast, banana prices recorded an increase of nearly 40% (largely due tounfavourable weather conditions and plant diseases in Ecuador and Central America which lead to afall in output) and those of cocoa beans of 20%. The widespread animal diseases in Western Europewhich led to a fall in West European output and consumption, was a major factor in the year to yearincrease in prices of lamb and beef on international markets, reflecting a (health) security premium.Spot crude oil prices dropped by 14%. Prices for manufactured goods are estimated to have decreasedby two percent. Overall, in 2001, non-fuel commodity prices were on average 14% below their levelin 1990, about the same decrease observed for manufactured goods over the same period. Crude oilprices remained on average 6% above their level in 1990.11
9 Projections made by industry sources for the year 2002 include a stagnation of a global sales of
mobile phones and a moderate increase of PC sales.10 The industrial production in OECD countries decreased by 2.5 % in 2001.11 Prices for primary commodities are taken from IMF, International Financial Statistics, February
2002.

15
Commodity price developments have in the past determined the bulk of foreign exchangeearnings of the developing countries. Consequently, the high price volatility of commodities, theirdependence on the industrial countries business cycles (for both volume and prices), the vagaries ofthe weather and the long-term trend of falling relative prices over many decades of many primaryproducts have provoked questions about the benefits for developing countries' participation ininternational trade. Although the four elements shaping the commodity price trends have not changedmuch over the last decades, the importance of commodity prices to the export earnings of developingcountries as a group has changed dramatically.12 This profound change in the role of commodities indeveloping countries' exports is not always fully perceived in the public debate, which is often limitedto the observation of short-term developments. If one takes a longer term perspective of severaldecades, the progress made by the developing countries as a group in diversifying their exportstructure by expanding the list of their export items and by adding manufactured goods is remarkable.
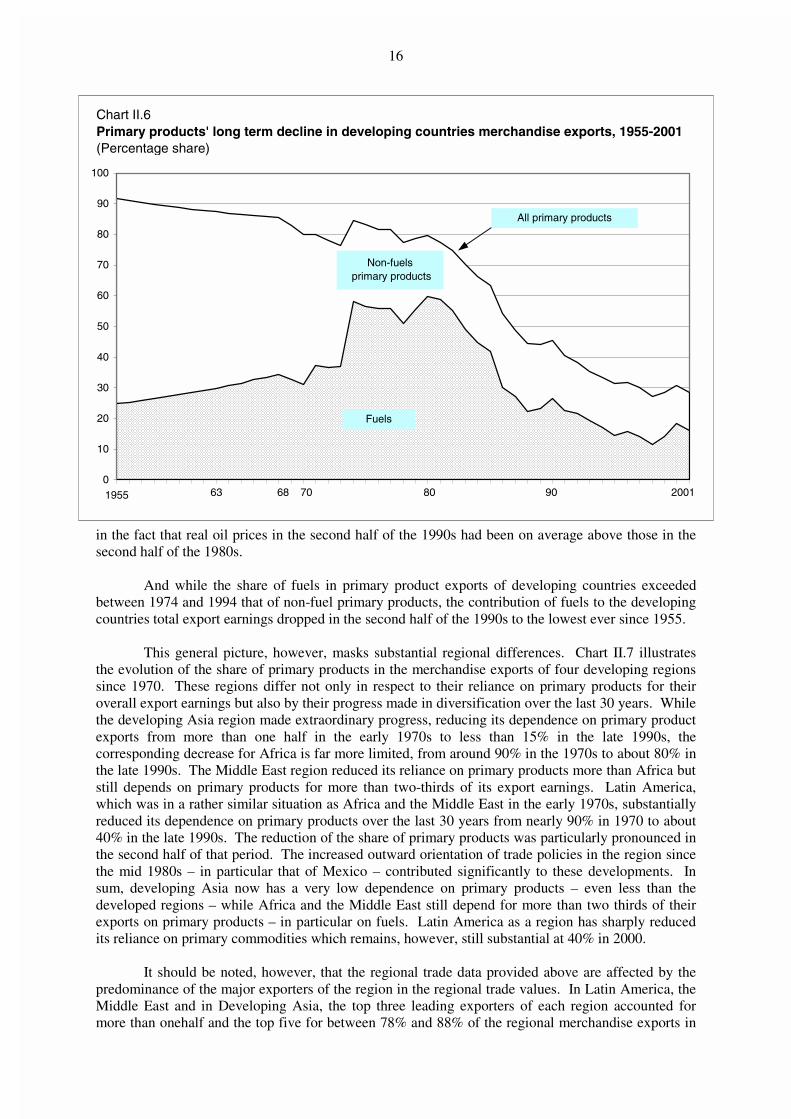
Chart II.6 shows the dramatic long-term decline of the share of primary products in themerchandise exports of the group of developing countries over the last 45 years. In 1955, primaryproducts accounted for more than 90% of export earnings in developing countries, a share which fellbelow 30% at the end of the 1990s. There was a rather steady trend decline between 1955 and theearly 1980s but since the mid-1980s the decline accelerated sharply. A part of this change can beattributed to the changing fortunes of the fuels markets. The share of fuels in developing countriestotal merchandise exports rose quite steadily in the 50s and 60s and accounted between 1974 and1982 for more than one half of developing countries exports. With sharply lower oil prices since1986, the weight of fuels in developing countries exports eroded sharply. However, the dynamism ofworld trade in manufactures - in particular that of office and telecom equipment - is an even moreimportant factor in this outcome. Evidence for this can be found in the steadily shrinking share ofnon-fuel primary products (agricultural products and non-ferrous metals) in developing countriesexports which was reduced by nearly one half to 12% between the mid-1980s and the late 1990s and
12It is questionable that the relative strength of non-fuel commodity prices compared to those of
manufactures in the 1990s, and the somewhat lesser price variation in the 1990s compared to the previous twodecades, can be maintained.
40
50
60
70
80
90
100
110
120
130
1990 91 92 93 94 95 96 97 98 99 2000 2001
Chart II.5 Price developments in international trade, 1990-2001 (Indices, 1990=100)
a Un it va lue index.S ourc es : IM F, In te rna tiona l F inancia l Sta tis tic s and W TO S ecre ta ria t estim ates.
N on-fue l p r im ary com m odities
M anufactu res a
C rude pe tro leum
16
in the fact that real oil prices in the second half of the 1990s had been on average above those in thesecond half of the 1980s.
And while the share of fuels in primary product exports of developing countries exceededbetween 1974 and 1994 that of non-fuel primary products, the contribution of fuels to the developingcountries total export earnings dropped in the second half of the 1990s to the lowest ever since 1955.
This general picture, however, masks substantial regional differences. Chart II.7 illustratesthe evolution of the share of primary products in the merchandise exports of four developing regionssince 1970. These regions differ not only in respect to their reliance on primary products for theiroverall export earnings but also by their progress made in diversification over the last 30 years. Whilethe developing Asia region made extraordinary progress, reducing its dependence on primary productexports from more than one half in the early 1970s to less than 15% in the late 1990s, thecorresponding decrease for Africa is far more limited, from around 90% in the 1970s to about 80% inthe late 1990s. The Middle East region reduced its reliance on primary products more than Africa butstill depends on primary products for more than two-thirds of its export earnings. Latin America,which was in a rather similar situation as Africa and the Middle East in the early 1970s, substantiallyreduced its dependence on primary products over the last 30 years from nearly 90% in 1970 to about40% in the late 1990s. The reduction of the share of primary products was particularly pronounced inthe second half of that period. The increased outward orientation of trade policies in the region sincethe mid 1980s – in particular that of Mexico – contributed significantly to these developments. Insum, developing Asia now has a very low dependence on primary products – even less than thedeveloped regions – while Africa and the Middle East still depend for more than two thirds of theirexports on primary products – in particular on fuels. Latin America as a region has sharply reducedits reliance on primary commodities which remains, however, still substantial at 40% in 2000.
It should be noted, however, that the regional trade data provided above are affected by thepredominance of the major exporters of the region in the regional trade values. In Latin America, theMiddle East and in Developing Asia, the top three leading exporters of each region accounted formore than onehalf and the top five for between 78% and 88% of the regional merchandise exports in
0
10
20
30
40
50
60
70
80
90
100
1955
Non-fuels primary products
Fuels
All primary products
68 63 70 80 90 2001
Chart II.6Primary products' long term decline in developing countries merchandise exports, 1955-2001(Percentage share)

17
2000. In Africa (including South Africa), the country concentration of the regional exports is lesspronounced than in the other three developing regions although 3 (5) countries accounted for nearlyone half (nearly two-thirds) of the region's overall exports in 2000. Due to this important countryconcentration of regional merchandise exports, it is thus useful also to review the shift from primaryproduct to manufacturing exports at the country level.
In the late 1960s, the large majority of the developing countries were predominantly exportersof primary products (103 out of 111) i.e. with exports of primary products exceeding one-half of theirmerchandise exports. In the late 1990s, the exporters of manufactured goods among the developingcountries are still out-numbered by the primary product exporters. This observation holds true in alldeveloping regions with the noticeable exception of Asia.
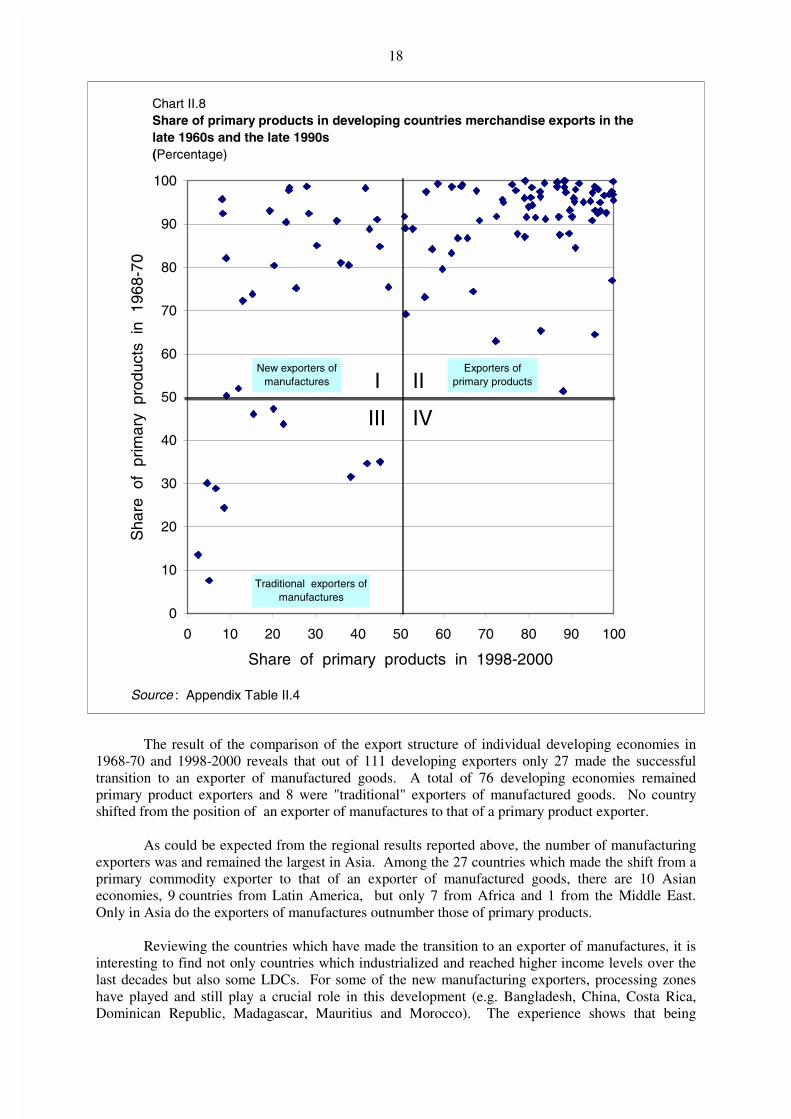
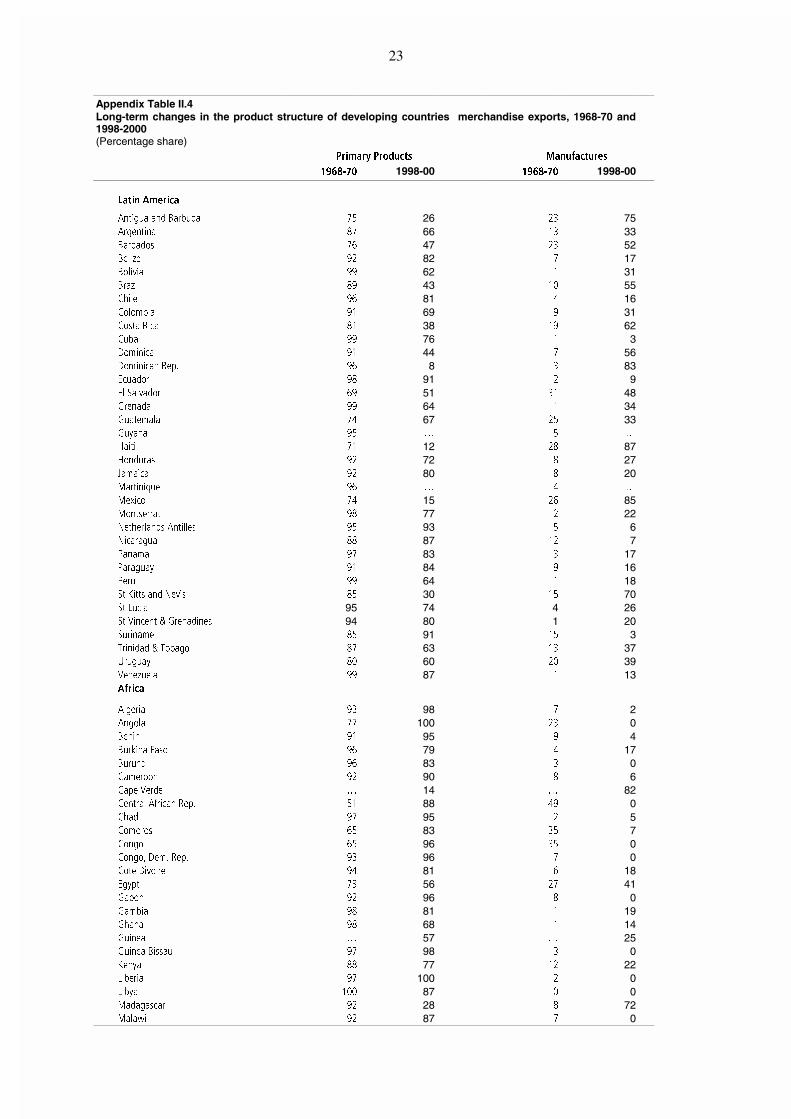
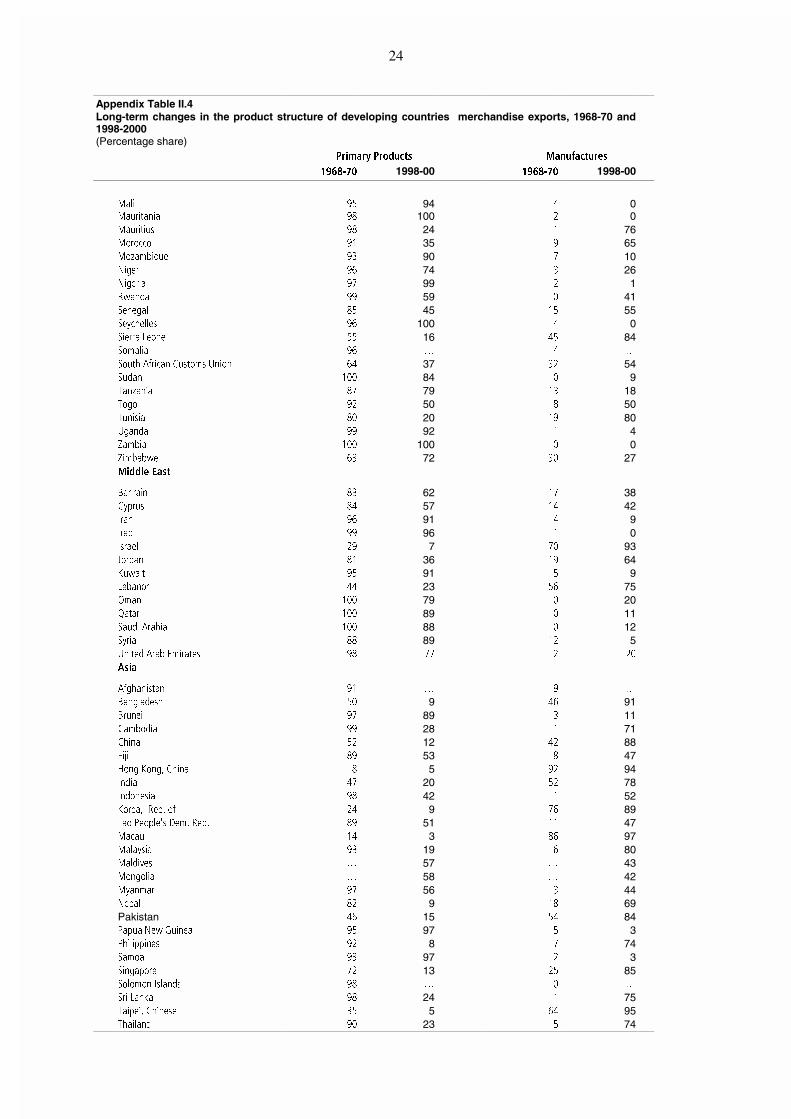
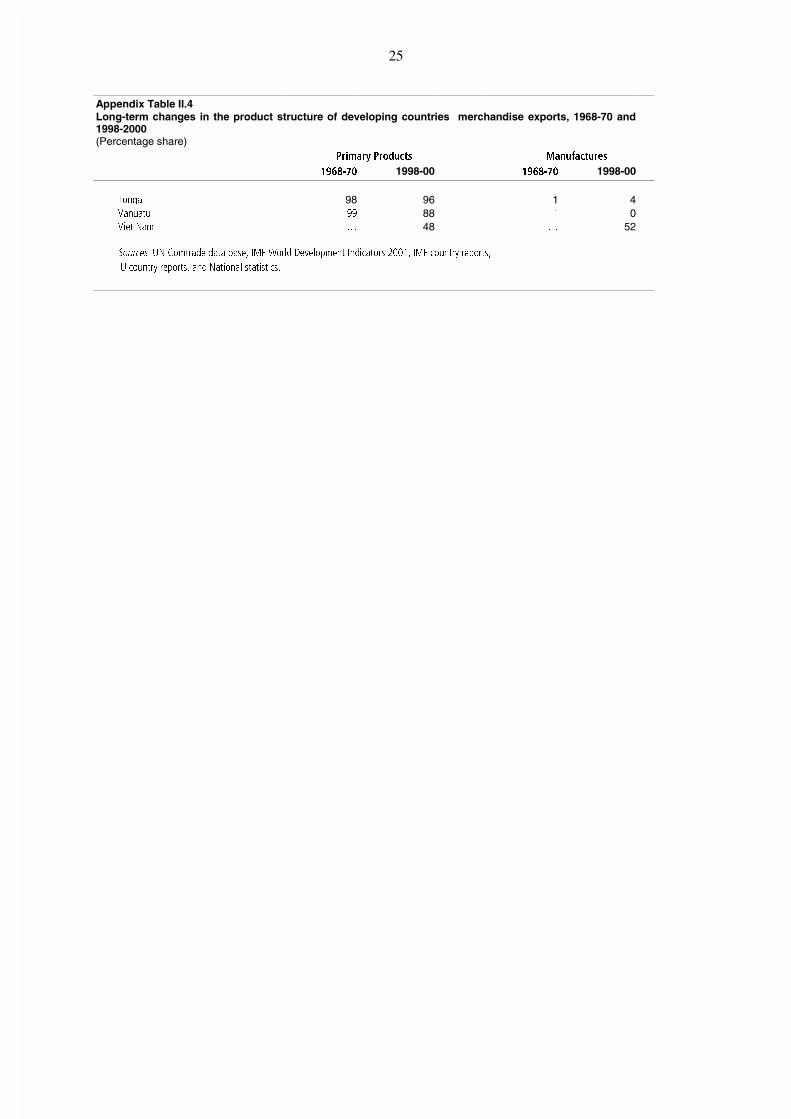
Chart II.8 presents information on the share of primary products in merchandise exports for111 developing countries for which information is available on their export structure for both the late1960s and the late 1990s. (Appendix Table II.4 reports the trade structure of 120 developingeconomies. Changes in boundaries as well as lack of data limited the number to 111 economies withobservations available in both periods.) The share of primary products in the late 1960s is providedon the vertical axis while the corresponding share of the late 1990s is given on the horizontal axis.Consequently, in quadrant I, all countries are grouped which had on average a share of primaryproducts in excess of 50% in 1968-70 and below 50% in 1998-2000, i.e. those economies whichrecorded a shift from being an exporter of primary commodities to that of an exporter ofmanufactures. Data in quadrant II of the chart comprises all those countries which had been primaryproduct exporters at the beginning and the end of the observation period. Quadrant III comprises thecountries which had been exporters of manufactures in the late 1960s and in the late 1990s and whichcan be described as "traditional" exporters of manufactures. Quadrant IV contains no data as there isno observation for a country which was an exporter of manufactures in the late 1960s and became anexporter of primary products in the late 1990s.
0
10
20
30
40
50
60
70
80
90
100
1970 1980 1990 2000
Africa
Middle East
Latin America
Developing Economies
Developing Asia
Chart II.7 Share of primary products in merchandise exports of developing regions, 1970-2001
18
The result of the comparison of the export structure of individual developing economies in1968-70 and 1998-2000 reveals that out of 111 developing exporters only 27 made the successfultransition to an exporter of manufactured goods. A total of 76 developing economies remainedprimary product exporters and 8 were "traditional" exporters of manufactured goods. No countryshifted from the position of an exporter of manufactures to that of a primary product exporter.
As could be expected from the regional results reported above, the number of manufacturingexporters was and remained the largest in Asia. Among the 27 countries which made the shift from aprimary commodity exporter to that of an exporter of manufactured goods, there are 10 Asianeconomies, 9 countries from Latin America, but only 7 from Africa and 1 from the Middle East.Only in Asia do the exporters of manufactures outnumber those of primary products.
Reviewing the countries which have made the transition to an exporter of manufactures, it isinteresting to find not only countries which industrialized and reached higher income levels over thelast decades but also some LDCs. For some of the new manufacturing exporters, processing zoneshave played and still play a crucial role in this development (e.g. Bangladesh, China, Costa Rica,Dominican Republic, Madagascar, Mauritius and Morocco). The experience shows that being
Chart II.8Share of primary products in developing countries merchandise exports in the late 1960s and the late 1990s(Percentage)
0
10
20
30
40
50
60
70
80
90
100
0 10 20 30 40 50 60 70 80 90 100
Share of primary products in 1998-2000
Sha
re o
f pr
imar
y p
rodu
cts
in 1
968-
70
New exporters of manufactures
Traditional exporters ofmanufactures
Exporters of primary products
Source : Appendix Table II.4
I
III
II
IV

19
landlocked, small or least developed does not necessarily imply that it is impossible to become anexporter of manufactures (e.g. Nepal , Mauritius and Bangladesh).
Admittedly the 50% primary-product share used as a yardstick is a rather crude measure forthe change in developing countries export structure. However, the data assembled also indicate thatout of the 76 developing economies which were still primary product exporters in the late 1990s, 58managed to reduce their dependence on primary products and 24 did so sharply (i.e. with a share ofprimary products lowered by at least 20 percentage points over the 30-year period).
The data assembled above leads to the following conclusion: while the developing countriesas a group have sharply reduced their dependence on primary products, this shift is uneven betweenthe developing regions and even more so among individual economies. Considerable progress hasbeen made not only on the aggregate value of developing-country exports but also on a populationweighted basis.13 For about two-thirds of the developing economies, however, commodity pricesremain a major determinant of their annual merchandise export earnings as they still export moreprimary products than manufactures. The poor prospects for recovery in real commodity prices14 andthe projected moderate demand growth for primary products relative to that of manufactures continueto call for a long-term development strategy in most developing countries to reduce their highdependence on primary commodity export earnings.15 This long-term strategy is not in conflict withcurrent efforts undertaken to improve the market access for agricultural products. Indeed, the need forthe liberalization of market access for agricultural products is highlighted by the fact that at presentthe majority of the developing country exporter of primary products depend for more than one-half oftheir merchandise export earnings on agricultural products.
13The 35 developing-economy exporters of manufactured goods (8 traditional and 27 new) account for
more than three quarters of the total population of all developing countries in the late 1990s. Excluding the twomost populous countries, China and India, the remaining 33 developing exporters of manufactured goodsrepresent still more than one-half of the population living in the developing world.
14 World Bank, Global Economic Prospects and the Developing Countries, 2002 p.229-231.15 S. Page and A. Hewitt, World Commodity Prices: Still a problem for developing countries?,
Overseas Development Institute, 2001.
20
Appendix
Table
II.1
Leadingexp
orters
andim
porters
ofmerchandisetradein
2001
(Billiondolla
rsandpercentage)
Expo
rters
Value
Share
Ann
ualp
ercentag
echan
geIm
porters
Value
Share
Ann
ualp
ercentag
echan
ge
1990
-200
020
0020
0119
90-200
020
0020
01
UnitedStates
730.9
11.9
711
-7UnitedStates
1180
.518
.39
19-6
German
y56
9.6
9.2
32
3German
y49
3.0
7.7
35
-1
Japa
n40
4.7
6.6
514
-16
Japa
n35
0.1
5.4
522
-8
Fran
ce31
9.5
5.2
40
-2UnitedKingd
om33
2.5
5.2
46
-3
UnitedKingd
om27
3.5
4.4
45
-4Fran
ce32
2.9
5.0
46
-3
China
266.2
4.3
1528
7China
243.6
3.8
1636
8
Can
ada
262.2
4.3
816
-5Italy
233.7
3.6
37
-1
Italy
241.3
3.9
31
2Can
ada
228.3
3.5
711
-7
Nethe
rland
s22
9.8
3.7
67
-1Nethe
rland
s20
7.9
3.2
66
-5
Hon
gKon
g,China
190.7
3.1
916
-6Hon
gKon
g,China
202.3
3.1
1018
-6
domestic
expo
rts
20.0
0.3
-25
-15
retained
impo
rtsa
31.5
0.5
122
-10
re-exports
170.7
2.8
1318
-5
Belgium
179.9
2.9
-3
-3Mexico
176.2
2.7
1523
-4
Mexico
158.5
2.6
1522
-5Belgium
169.0
2.6
-5
-2
Korea,R
ep.o
f15
0.7
2.4
1020
-13
Spain
144.5
2.2
615
-7
Taipei,C
hine
se12
2.9
2.0
822
-17
Korea,R
ep.o
f14
1.1
2.2
934
-12
Sing
apore
121.7
2.0
1020
-12
Sing
apore
116.0
1.8
821
-14
domestic
expo
rts
66.1
1.1
915
-16
retained
impo
rtsa
60.4
0.9
616
-20
re-exports
55.6
0.9
1328
-6Taipei,C
hine
se10
7.2
1.7
1026
-23
Spain
110.8
1.8
810
-4Sw
itzerland
84.1
1.3
25
1
Russian
Fed.
103.2
1.7
-39
-2Malaysia
74.4
1.2
1127
-10
Malaysia
88.5
1.4
1316
-10
Austria
73.9
1.1
42
2
Irelan
d83
.41.4
138
8Australia
63.9
1.0
63
-11
Switzerland
82.1
1.3
32
1
Swed
en75
.21.2
43
-14
Swed
en62
.51.0
36
-14
Austria
70.3
1.1
53
4Th
ailand
60.2
0.9
623
-3
Saud
iArabia
68.2
1.1
653
-12
Brazil
58.3
0.9
1013
0
Thailand
64.2
1.0
1218
-7Russian
Fed.
53.5
0.8
-13
19
Australia
63.4
1.0
514
-1Irelan
d50
.90.8
99
0
Brazil
58.2
0.9
615
6India
50.5
0.8
810
-2
Norway
57.9
0.9
632
-3Po
land
50.0
0.8
167
2
Indo
nesia
56.7
0.9
928
-9Den
mark
45.6
0.7
30
0
Den
mark
51.8
0.8
32
1Tu
rkey
40.5
0.6
934
-26
India
43.9
0.7
919
4Po
rtug
al37
.70.6
50
-6
Totalo
fab
ove
b52
99.8
86.0
--
-To
talo
fab
ove
b54
54.5
84.7
--
-
World
b6162.4
100.0
613
-4World
b6438.8
100.0
713
-4
aRetained
importsaredefined
asim
portsless
re-exp
orts.
bIncludes
significan
tre-exp
ortsorim
portsforre-exp
ort.
21
Appendix
Table
II.2
Leadingexp
orters
andim
porters
ofmerchandisetrade(excludingEU
intra-trade)in
2001
(Billiondolla
rsandpercentage)
Expo
rters
Value
Share
Ann
ualp
ercentag
echan
geIm
porters
Value
Share
Ann
ualp
ercentag
echan
ge
1990
-200
020
0020
0119
90-200
020
0020
01
Europe
anUnion
(15)
872.5
18.4
57
0UnitedStates
1180
.523
.59
19-6
UnitedStates
730.9
15.4
711
-7Eu
rope
anUnion
(15)
914.0
18.2
515
-4
Japa
n40
4.7
8.5
514
-16
Japa
n35
0.1
7.0
522
-8
China
266.2
5.6
1528
7China
243.6
4.9
1636
8
Can
ada
262.2
5.5
816
-5Can
ada
228.3
4.5
711
-7
Hon
gKon
g,China
190.7
4.0
916
-6Hon
gKon
g,China
202.3
4.0
1018
-6
domestic
expo
rts
20.0
0.4
-25
-15
retained
impo
rtsa
31.5
0.6
122
-10
re-exports
170.7
3.6
1318
-5Mexico
176.2
3.5
1523
-4
Mexico
158.5
3.3
1522
-5Korea,R
ep.o
f14
1.1
2.8
934
-12
Korea,R
ep.o
f15
0.7
3.2
1020
-13
Sing
apore
116.0
2.3
821
-14
Taipei,C
hine
se12
2.9
2.6
822
-17
retained
impo
rtsa
60.4
1.2
616
-20
Sing
apore
121.7
2.6
1020
-12
Taipei,C
hine
se10
7.2
2.1
1026
-23
domestic
expo
rts
66.1
1.4
915
-16
re-exports
55.6
1.2
1328
-6
Russian
Fed.
103.2
2.2
-39
-2Sw
itzerland
84.1
1.7
25
1
Malaysia
88.5
1.9
1316
-10
Malaysia
74.4
1.5
1127
-10
Switzerland
82.1
1.7
32
1Australia
63.9
1.3
63
-11
Saud
iArabia
68.2
1.4
653
-12
Thailand
60.2
1.2
623
-3
Thailand
64.2
1.4
1218
-7Brazil
58.3
1.2
1013
0
Australia
63.4
1.3
514
-1Russian
Fed.
53.5
1.1
-13
19
Brazil
58.2
1.2
615
6India
50.5
1.0
810
-2
Norway
57.9
1.2
632
-3Po
land
50.0
1.0
167
2
Indo
nesia
56.7
1.2
928
-9Tu
rkey
40.5
0.8
934
-26
India
43.9
0.9
919
4UnitedArabEm
irates
36.6
0.7
113
12
UnitedArabEm
irates
42.9
0.9
828
-2Czech
Rep
.36
.50.7
-14
14
Poland
35.5
0.7
815
12Israel
35.1
0.7
914
-7
Philipp
ines
33.6
0.7
179
-16
Hun
gary
33.9
0.7
1215
6
Czech
Rep
.33
.40.7
-10
15Norway
32.4
0.6
21
-6
Turkey
31.2
0.7
84
12Saud
iArabia
32.1
0.6
28
6
Hun
gary
30.8
0.6
912
10Ph
ilipp
ines
31.4
0.6
104
-7
SouthAfrica
29.3
0.6
312
-2Indo
nesia
31.2
0.6
440
-7
Israel
29.0
0.6
1022
-8So
uthAfrica
28.7
0.6
511
-3
Ven
ezue
la28
.60.6
658
-10
Argen
tina
20.3
0.4
20-1
-19
Argen
tina
26.7
0.6
813
1Ven
ezue
la18
.80.4
815
16
Totalo
fab
ove
b42
88.2
90.4
--
-To
talo
fab
ove
b45
31.4
90.3
--
-
World(excl.intra-EUtrade)b
4745.0
100.0
717
-5World(excl.intra-EUtrade)b
5017.3
100.0
717
-5
aRetainedim
portsare
definedasim
portsless
re-exp
orts.
bIncludessignificantre-exp
ortsorim
portsfo
rre-exp
ort.

22
Appendix
Table
II.3
Leadingexp
orters
andim
porters
ofco
mmercialservices
in2001
(Billiondolla
rsandpercentage)
Expo
rters
Value
Share
Ann
ualp
ercentag
echan
geIm
porters
Value
Share
Ann
ualp
ercentag
echan
ge
1990
-200
020
0020
0119
90-200
020
0020
01
UnitedStates
262.9
18.3
79
-3UnitedStates
187.6
13.1
716
-7
UnitedKingd
om10
8.3
7.5
83
-6German
y12
8.5
9.0
5-3
-3
German
y79
.85.5
5-3
-1Japa
n10
6.7
7.5
31
-8
Fran
ce79
.05.5
2-1
-3UnitedKingd
om88
.56.2
82
-5
Japa
n63
.34.4
513
-7Fran
ce60
.04.2
2-3
-2
Italy
59.5
4.1
1-4
7Italy
58.5
4.1
2-2
6
Spain
56.7
3.9
70
7Nethe
rland
s52
.33.7
63
1
Nethe
rland
s50
.93.5
6-2
-1Can
ada
39.6
2.8
47
-4
Hon
gKon
g,China
43.0
3.0
913
2Belgium
-Luxem
bourg
38.9
2.7
55
2
Belgium
-Luxem
bourg
42.6
3.0
65
0China
36.4
2.5
2416
2
Can
ada
34.7
2.4
77
-5Irelan
d33
.62.4
198
17
China
31.0
2.2
1815
3Korea,R
ep.o
f32
.62.3
1323
-1
Austria
30.0
2.1
3-3
0Sp
ain
32.2
2.3
72
5
Korea,R
ep.o
f28
.42.0
1212
-2Austria
29.0
2.0
8-1
0
Sing
apore
26.4
1.8
813
-2India
23.7
1.7
1315
21
Switzerland
25.9
1.8
40
-1Taipei,C
hine
se23
.61.7
610
-8
Den
mark
22.8
1.6
521
12Hon
gKon
g,China
22.9
1.6
82
0
Swed
en20
.81.4
42
4Sw
eden
22.7
1.6
34
-3
Taipei,C
hine
se20
.81.4
1118
3Russian
Fed.
20.5
1.4
430
18
India
20.1
1.4
1426
14Sing
apore
20.0
1.4
1013
-6
Greece
19.7
1.4
1117
3Den
mark
19.0
1.3
618
6
Irelan
d19
.21.3
188
15UnitedArabEm
irates
18.3
1.3
10�
�
Australia
15.9
1.1
65
-11
Mexico
17.0
1.2
519
1
Norway
15.6
1.1
28
4Australia
16.4
1.1
3-2
-7
Turkey
14.8
1.0
919
-23
Malaysia
16.3
1.1
1213
-2
Malaysia
13.6
0.9
1415
0Th
ailand
15.9
1.1
1014
4
Thailand
12.8
0.9
8-5
-7Brazil
15.8
1.1
919
0
Mexico
12.6
0.9
717
-7Sw
itzerland
15.5
1.1
3-1
1
Poland
12.0
0.8
1225
16Norway
15.1
1.1
2-1
4
Israel
11.3
0.8
1232
-21
Indo
nesia
14.4
1.0
1030
�
Totalo
fab
ove
1254
.087
.2-
--
Totalo
fab
ove
1221
.685
.3-
--
World
1440.0
100.0
66
-1World
1430.0
100.0
66
-1
Note:Figuresforanumber
ofco
untriesan
dterritories
hav
ebee
nestimated
bytheSe
cretariat.Annual
perce
ntagech
anges
andrankingsareaffected
byco
ntinuitybreak
s
intheseries
foralargenumber
ofec
onomies.
23
Appendix Table II.4Long-term changes in the product structure of developing countries merchandise exports, 1968-70 and1998-2000(Percentage share)
Primary Products Manufactures
1968-70 1998-00 1968-70 1998-00
Latin America
Antigua and Barbuda 75 26 23 75Argentina 87 66 13 33Barbados 76 47 23 52Belize 92 82 7 17Bolivia 99 62 1 31Brazil 89 43 10 55Chile 96 81 4 16Colombia 91 69 9 31Costa Rica 81 38 19 62Cuba 99 76 1 3Dominica 91 44 7 56Dominican Rep. 96 8 3 83Ecuador 98 91 2 9El Salvador 69 51 31 48Grenada 99 64 1 34Guatemala 74 67 25 33Guyana 95 � 5 �
Haiti 71 12 28 87Honduras 92 72 8 27Jamaica 92 80 8 20Martinique 96 � 4 �
Mexico 74 15 26 85Montserrat 98 77 2 22Netherlands Antilles 95 93 5 6Nicaragua 88 87 12 7Panama 97 83 3 17Paraguay 91 84 9 16Peru 99 64 1 18St.Kitts and Nevis 85 30 15 70St.Lucia 95 74 4 26St.Vincent & Grenadines 94 80 1 20Suriname 85 91 15 3Trinidad & Tobago 87 63 13 37Uruguay 80 60 20 39Venezuela 99 87 1 13Africa
Algeria 93 98 7 2Angola 77 100 23 0Benin 91 95 9 4Burkina Faso 96 79 4 17Burundi 96 83 3 0Cameroon 92 90 8 6Cape Verde � 14 � 82Central African Rep. 51 88 49 0Chad 97 95 2 5Comoros 65 83 35 7Congo 65 96 35 0Congo, Dem. Rep. 93 96 7 0Cote Divoire 94 81 6 18Egypt 73 56 27 41Gabon 92 96 8 0Gambia 98 81 1 19Ghana 98 68 1 14Guinea � 57 � 25Guinea Bissau 97 98 3 0Kenya 88 77 12 22Liberia 97 100 2 0Libya 100 87 0 0Madagascar 92 28 8 72Malawi 92 87 7 0
24
Appendix Table II.4Long-term changes in the product structure of developing countries merchandise exports, 1968-70 and1998-2000(Percentage share)
Primary Products Manufactures
1968-70 1998-00 1968-70 1998-00
Mali 95 94 4 0Mauritania 98 100 2 0Mauritius 98 24 1 76Morocco 91 35 9 65Mozambique 93 90 7 10Niger 96 74 3 26Nigeria 97 99 2 1Rwanda 99 59 0 41Senegal 85 45 15 55Seychelles 96 100 4 0Sierra Leone 55 16 45 84Somalia 96 � 4 �
South African Customs Union 64 37 32 54Sudan 100 84 0 9Tanzania 87 79 13 18Togo 92 50 8 50Tunisia 80 20 19 80Uganda 99 92 1 4Zambia 100 100 0 0Zimbabwe 63 72 30 27Middle East
Bahrain 83 62 17 38Cyprus 84 57 14 42Iran 96 91 4 9Iraq 99 96 1 0Israel 29 7 70 93Jordan 81 36 19 64Kuwait 95 91 5 9Lebanon 44 23 56 75Oman 100 79 0 20Qatar 100 89 0 11Saudi Arabia 100 88 0 12Syria 88 89 12 5United Arab Emirates 98 77 2 20
Asia
Afghanistan 91 � 9 �
Bangladesh 50 9 46 91Brunei 97 89 3 11Cambodia 99 28 1 71China 52 12 42 88Fiji 89 53 8 47Hong Kong, China 8 5 92 94India 47 20 52 78Indonesia 98 42 1 52Korea, Rep. of 24 9 76 89Lao People's Dem. Rep. 89 51 11 47Macau 14 3 86 97Malaysia 93 19 6 80Maldives � 57 � 43Mongolia � 58 � 42Myanmar 97 56 3 44Nepal 82 9 18 69Pakistan 46 15 54 84Papua New Guinea 95 97 5 3Philippines 92 8 7 74Samoa 93 97 2 3Singapore 72 13 25 85Solomon Islands 98 � 0 �
Sri Lanka 98 24 1 75Taipei, Chinese 35 5 64 95Thailand 90 23 5 74
25
Appendix Table II.4Long-term changes in the product structure of developing countries merchandise exports, 1968-70 and1998-2000(Percentage share)
Primary Products Manufactures
1968-70 1998-00 1968-70 1998-00
Tonga 98 96 1 4Vanuatu 99 88 1 0Viet Nam � 48 � 52
Sources: UN Comtrade data base, IMF World Development Indicators 2001, IMF country reports,
IU country reports, and National statistics.