Embed Size (px)
Citation preview
2016-17 School Accountability Report Card for Elsinore High School Page 1 of 14
Elsinore High School
21800 Canyon Drive • Wildomar, CA 92595 • (951) 253-7200 • Grades 9-12 Sarah Arredondo & Robbin Hamilton, Principal
[email protected] or [email protected] http://ehs.leusd.k12.ca.us
2016-17 School Accountability Report Card
Published During the 2017-18 School Year
Lake Elsinore Unified School District
545 Chaney St. Lake Elsinore, CA 92530
(951) 253-7000 www.leusd.k12.ca.us
District Governing Board
Stan Crippen, Trustee Area 1
Susan E. Scott, Trustee Area 2
Heidi Matthies Dodd, Trustee Area 3
Juan I. Saucedo, Trustee Area 4
Steven L. Wood, Trustee Area 5
District Administration
Dr. Doug Kimberly Superintendent
Dr. Gregory J. Bowers Assistant Superintendent
Dr. Alain Guevara Assistant Superintendent
Dr. Kip Meyer Assistant Superintendent
Arleen Sanchez Chief Business Officer
Tracy Sepulveda Assistant Superintendent
Sam Wensel Executive Director
---- ----
Superintendent’s message LEUSD is well positioned for the 2018 school year! The collaboration between voters, parents, teachers and staff has resulted in student achievement growth, improved facilities and playing fields under Measure V, and new instructional technology for classrooms.Under our state accountability system, the Fall 2017 update to the California School Dashboard was recently released. The Dashboard provides teachers and principals with valuable performance data that is examined weekly during their PLC collaboration time, and used to guide instruction. The current Dashboard shows LEUSD schools are making progress.LEUSD improved in several areas, though English Language Arts and Math growth indicators are little changed from a year ago, a trend statewide. The Dashboard is powered by six state indicators and four local indicators, along with a variety of custom reports by which to compare schools, districts, and student subgroups. Dashboard color codes reflect status and change to depict achievement growth ranging from Red (lowest) to Blue (highest).LEUSD performance highlights:SUSPENSION RATES—by lowering suspensions, results for the 'Suspension' indicator have IMPROVED from orange to yellow, changing from a high suspension rating to a medium suspension rating.‘EL’ PROGRESS—English Learners IMPROVED from yellow to green, changing from 'Medium' to 'High' as a result of an additional 3.1% students making progress towards English proficiency.GRADUATION RATE—this indicator has IMPROVED from green to blue. The District continues to have a 'High' rating due to an increase in graduating students of 1.5%.COLLEGE/CAREER PREPAREDNESS—growing College & Career Preparedness is an area for increased attention. The CA School Dashboard shows 35.2% of LEUSD graduates as being 'Prepared.” The State will not have a color indicator for College & Career Preparedness until 2018, but notably, LEUSD 11th grade students' ELA and Mathematics scaled scores increased in both areas respectively by 0.3 points and 4.2 points, a positive college readiness indicator.CHRONIC ABSENTEEISM—for the first time, the CA Schools Dashboard includes District and school Chronic Absenteeism rates, though a Chronic Absenteeism color indicator does not appear on the Fall 2017 report. District wide, LEUSD’s Chronically Absent statistic is 12.8%.LEUSD met all local indicators for implementing state standards, providing safe school facilities, adequate books and instructional materials, as well as meeting indicators for school climate, and student and parent engagement. View how LEUSD is performing at www.caschooldashboard.org.These are positive indicators, so let’s be mindful of the many positive accomplishments of 2017 to help set the bar high for 2018.Sincerely,Dr. Doug Kimberly,Superintendent Principal's message It is with great pleasure and excitement that we take the lead at Elsinore High School as a Co-Principal team. We are humbled and honored to lead a school with such a rich tradition that has produced so many outstanding students. Elsinore high has a heartfelt culture of Tradition, Caring and Respect. The staff at Elsinore High is a dedicated group of professionals to work very hard to support all of our students. We have both dedicated our careers to education. Between us we have 38 years experience in education as, teachers, assistant principals, program specialist, associate principals, principal and now co-principals. We have had experience in Common Core Standards, Curriculum and Instruction, CTE, AVID, Special Education, LCAP and PBIS. WE look forward to using our experiences in education to lead and move Elsinore High forward. We are elated to bring our skills together as educational leaders to work to ensure student success. Along with the staff we will continue the legacy of success established by building strong relationships with students. Our goal this year is to continue building relationships, focus on our school systems and continue to implement the Common Core Standards.
2016-17 School Accountability Report Card for Elsinore High School Page 2 of 14
One of the most important components of a great school is the partnership between the school and the parents. The team that works together for the best interest of our students will find the greatest success. Please stay involved at the high school level. There are many opportunities for parents to become involved included PTSA, School Site Council, attending sporting events and student performances. This year our motto is, “We Believe We Will Achieve.” We plan to provide educational experiences that are rigorous, relevant and engaging for all students. We look forward to an outstanding school year 2017-18. Go Tigers! Mrs. Arredondo & Mrs. Hamilton Co-Principals Elsinore High School The mission of Elsinore High School is to ensure an environment where students feel safe and successful, grow academically and socially, and develop basic and lifelong skills which prepare them for the 21st century
About the SARC By February 1 of each year, every school in California is required by state law to publish a School Accountability Report Card (SARC). The SARC contains information about the condition and performance of each California public school. Under the Local Control Funding Formula (LCFF) all local educational agencies (LEAs) are required to prepare a Local Control and Accountability Plan (LCAP), which describes how they intend to meet annual school-specific goals for all pupils, with specific activities to address state and local priorities. Additionally, data reported in an LCAP is to be consistent with data reported in the SARC. • For more information about SARC requirements, see the California
Department of Education (CDE) SARC Web page at http://www.cde.ca.gov/ta/ac/sa/.
• For more information about the LCFF or LCAP, see the CDE LCFF Web page at http://www.cde.ca.gov/fg/aa/lc/.
• For additional information about the school, parents/guardians and community members should contact the school principal or the district office.
2016-17 Student Enrollment by Grade Level
Grade Level Number of Students
Grade 9 573
Grade 10 504
Grade 11 483
Grade 12 485
Total Enrollment 2,045
2016-17 Student Enrollment by Group
Group Percent of Total Enrollment
Black or African American 4.4
American Indian or Alaska Native 0.6
Asian 1.4
Filipino 2.2
Hispanic or Latino 53.2
Native Hawaiian or Pacific Islander 0.3
White 31.2
Two or More Races 6.7
Socioeconomically Disadvantaged 63.2
English Learners 5.5
Students with Disabilities 14
Foster Youth 0.6
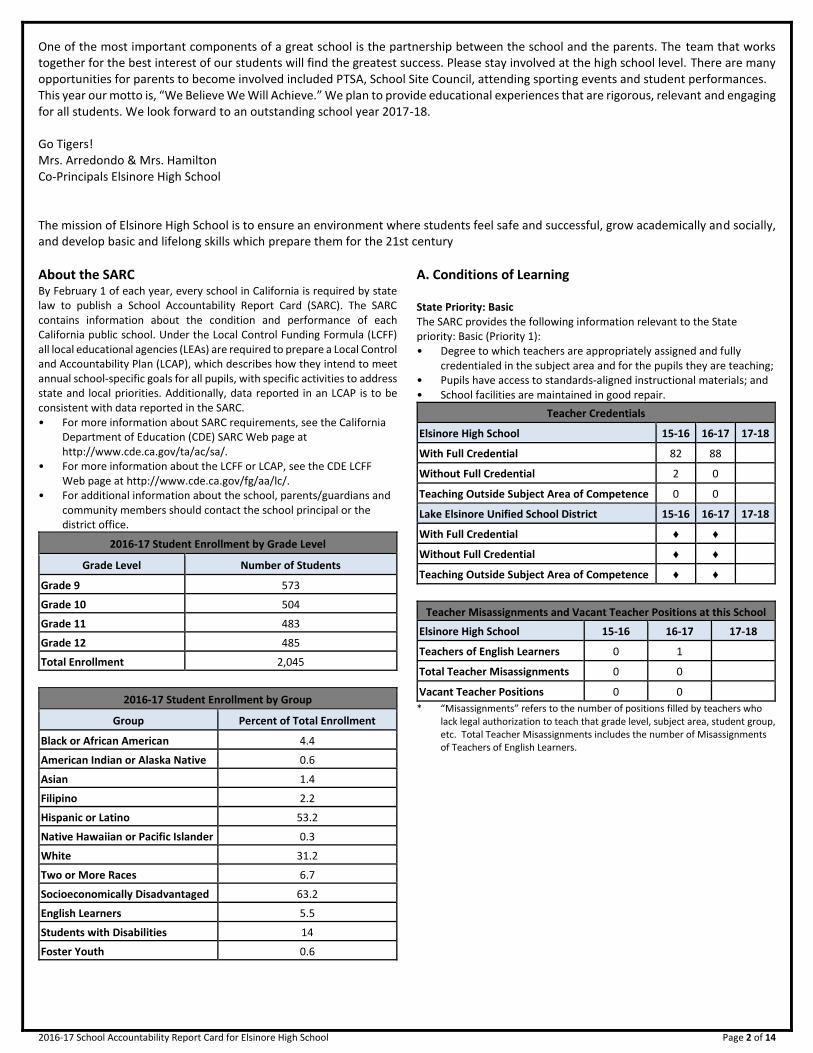
A. Conditions of Learning State Priority: Basic The SARC provides the following information relevant to the State priority: Basic (Priority 1): • Degree to which teachers are appropriately assigned and fully
credentialed in the subject area and for the pupils they are teaching; • Pupils have access to standards-aligned instructional materials; and • School facilities are maintained in good repair.
Teacher Credentials
Elsinore High School 15-16 16-17 17-18
With Full Credential 82 88
Without Full Credential 2 0
Teaching Outside Subject Area of Competence 0 0
Lake Elsinore Unified School District 15-16 16-17 17-18
With Full Credential ♦ ♦
Without Full Credential ♦ ♦
Teaching Outside Subject Area of Competence ♦ ♦
Teacher Misassignments and Vacant Teacher Positions at this School
Elsinore High School 15-16 16-17 17-18
Teachers of English Learners 0 1
Total Teacher Misassignments 0 0
Vacant Teacher Positions 0 0
* “Misassignments” refers to the number of positions filled by teachers who lack legal authorization to teach that grade level, subject area, student group, etc. Total Teacher Misassignments includes the number of Misassignments of Teachers of English Learners.

2016-17 School Accountability Report Card for Elsinore High School Page 3 of 14
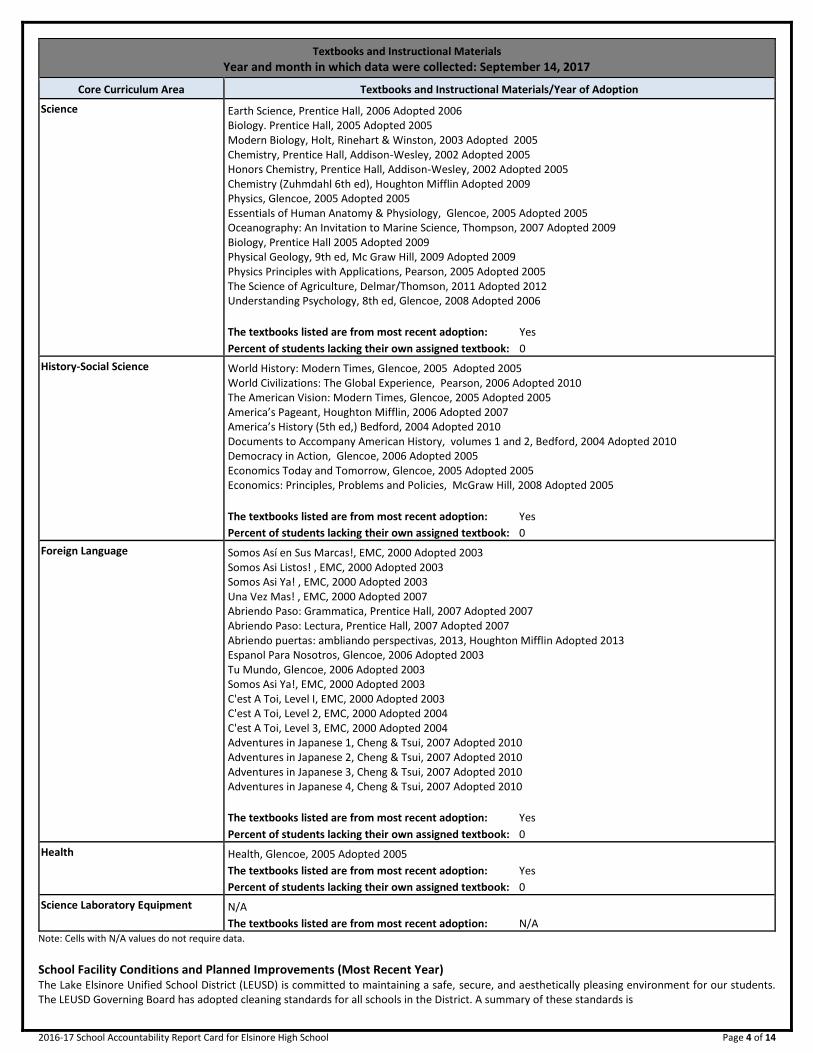
Quality, Currency, Availability of Textbooks and Instructional Materials (School Year 2017-18) Lake Elsinore Unified School District chooses instructional materials which are aligned to State content standards, present a broad spectrum of knowledge and viewpoints, reflect society’s diversity, and enhance the use of multiple teaching strategies and technologies. Materials for grades K-8 are chosen from the State-adopted list. Materials for grades 9-12 are evaluated and recommended by subject area teachers. Curriculum and textbook subcommittees are comprised of teachers (subject or grade level) and administrators. The subcommittee recommends instructional materials to the Curriculum Advisory Committee (CAC), which has representatives from every school. The CAC evaluates and recommends materials to the school board, which makes the final approval of all adopted instructional materials. Parents and community members may review adopted materials at the District office. Lake Elsinore Unified School District held a hearing for the sufficiency of textbooks September 22, 2016
Textbooks and Instructional Materials
Year and month in which data were collected: September 14, 2017
Core Curriculum Area Textbooks and Instructional Materials/Year of Adoption
Reading/Language Arts Language of Literature 9, McDougal Littell, 2002 Adopted 2004 Language of Literature 10, McDougal Littell, 2002 Adopted 2004 Language of Literature, American Literature, McDougal Littell, 2002 Adopted 2004 Language of Literature, British Literature, McDougal Littell, 2002 Adopted 2004 Language of Literature 10, McDougal Littell , 2002 Adopted 2004 Introduction to Literature, Bedford, 2008 Adopted 2009 The Language of Composition, 2nd ed, Bedford, 2013 Adopted 2013 Elements of Style, Prentice Hall, 2005 Adopted 2008 They Say, I Say, W. W. Norton, 2010 Adopted 2013 EDGE by National Geographic, 2008 Adopted 2012 Journeys, Hampton Brown, 2006 Adopted 2006 Everything’s an Argument, Bedford, 2010 Adopted 2012 Writing Matters, Mc Graw Hill, 2011 Adopted 2012 Beyond Feelings, Mc Graw Hill, 2012 Adopted 2012 Creating America, Houghton Mifflin, 2005 Adopted 2012. 1984 by George Orwell Brave New World by Aldous Huxley into the Wild by Jon Krakauer, various Publishers, Intervention, 9-12, Read 180 Next Generation Level C, Scholastic 2012, Measuring Up CAHSEE Prep, People's Education 2008, Kaplan CAHSEE, Kaplan 2008
The textbooks listed are from most recent adoption: Yes
Percent of students lacking their own assigned textbook: 0%
Mathematics Big Ideas Algebra 1, 2016 adopted Big Idea Algebra 2, Adopted 2016 Calculus Concepts, Brooks and Cole, 2001 Adopted 2005 Big Ideas Geometry Adopted 2016 California Integrated Mathematics, ABC 2007 Adopted 2008 Integrated Mathematics, McDougal Littell 2002 Adopted 2008 Pre-Calculus: Functions and Graphs 12th ed, Cengage, 2011 Adopted 2012 Elementary Statistics, Prentice Hall, 2005 Adopted 2006 Statistics, Modeling the World 3rd ed, Prentice Hall, 2010 Adopted 2012 Finite Mathematics, 6th ed, Thompson, 2005 Adopted 2006 Mathematics with Business Applications, 6th ed, McGraw Hill, 2007 Adopted 2009, Pre-calculus with functions & graphs 12gh Ed, Calculus AP Edition, Cengage 2012, Mathematics HL Course Companion, Oxford 2012, Mathematics for the International student HL, Haese 2009, Intermediate Algebra Pearson 2014
The textbooks listed are from most recent adoption: Yes
Percent of students lacking their own assigned textbook: 0
2016-17 School Accountability Report Card for Elsinore High School Page 4 of 14
Textbooks and Instructional Materials
Year and month in which data were collected: September 14, 2017
Core Curriculum Area Textbooks and Instructional Materials/Year of Adoption
Science Earth Science, Prentice Hall, 2006 Adopted 2006 Biology. Prentice Hall, 2005 Adopted 2005 Modern Biology, Holt, Rinehart & Winston, 2003 Adopted 2005 Chemistry, Prentice Hall, Addison-Wesley, 2002 Adopted 2005 Honors Chemistry, Prentice Hall, Addison-Wesley, 2002 Adopted 2005 Chemistry (Zuhmdahl 6th ed), Houghton Mifflin Adopted 2009 Physics, Glencoe, 2005 Adopted 2005 Essentials of Human Anatomy & Physiology, Glencoe, 2005 Adopted 2005 Oceanography: An Invitation to Marine Science, Thompson, 2007 Adopted 2009 Biology, Prentice Hall 2005 Adopted 2009 Physical Geology, 9th ed, Mc Graw Hill, 2009 Adopted 2009 Physics Principles with Applications, Pearson, 2005 Adopted 2005 The Science of Agriculture, Delmar/Thomson, 2011 Adopted 2012 Understanding Psychology, 8th ed, Glencoe, 2008 Adopted 2006
The textbooks listed are from most recent adoption: Yes
Percent of students lacking their own assigned textbook: 0
History-Social Science World History: Modern Times, Glencoe, 2005 Adopted 2005 World Civilizations: The Global Experience, Pearson, 2006 Adopted 2010 The American Vision: Modern Times, Glencoe, 2005 Adopted 2005 America’s Pageant, Houghton Mifflin, 2006 Adopted 2007 America’s History (5th ed,) Bedford, 2004 Adopted 2010 Documents to Accompany American History, volumes 1 and 2, Bedford, 2004 Adopted 2010 Democracy in Action, Glencoe, 2006 Adopted 2005 Economics Today and Tomorrow, Glencoe, 2005 Adopted 2005 Economics: Principles, Problems and Policies, McGraw Hill, 2008 Adopted 2005
The textbooks listed are from most recent adoption: Yes
Percent of students lacking their own assigned textbook: 0
Foreign Language Somos Así en Sus Marcas!, EMC, 2000 Adopted 2003 Somos Asi Listos! , EMC, 2000 Adopted 2003 Somos Asi Ya! , EMC, 2000 Adopted 2003 Una Vez Mas! , EMC, 2000 Adopted 2007 Abriendo Paso: Grammatica, Prentice Hall, 2007 Adopted 2007 Abriendo Paso: Lectura, Prentice Hall, 2007 Adopted 2007 Abriendo puertas: ambliando perspectivas, 2013, Houghton Mifflin Adopted 2013 Espanol Para Nosotros, Glencoe, 2006 Adopted 2003 Tu Mundo, Glencoe, 2006 Adopted 2003 Somos Asi Ya!, EMC, 2000 Adopted 2003 C'est A Toi, Level I, EMC, 2000 Adopted 2003 C'est A Toi, Level 2, EMC, 2000 Adopted 2004 C'est A Toi, Level 3, EMC, 2000 Adopted 2004 Adventures in Japanese 1, Cheng & Tsui, 2007 Adopted 2010 Adventures in Japanese 2, Cheng & Tsui, 2007 Adopted 2010 Adventures in Japanese 3, Cheng & Tsui, 2007 Adopted 2010 Adventures in Japanese 4, Cheng & Tsui, 2007 Adopted 2010
The textbooks listed are from most recent adoption: Yes
Percent of students lacking their own assigned textbook: 0
Health Health, Glencoe, 2005 Adopted 2005
The textbooks listed are from most recent adoption: Yes
Percent of students lacking their own assigned textbook: 0
Science Laboratory Equipment N/A
The textbooks listed are from most recent adoption: N/A
Note: Cells with N/A values do not require data.
School Facility Conditions and Planned Improvements (Most Recent Year) The Lake Elsinore Unified School District (LEUSD) is committed to maintaining a safe, secure, and aesthetically pleasing environment for our students. The LEUSD Governing Board has adopted cleaning standards for all schools in the District. A summary of these standards is
2016-17 School Accountability Report Card for Elsinore High School Page 5 of 14
available at the school office and at the District Office. The principal works daily with the custodial staff to develop cleaning schedules to ensure a clean and safe school. In addition to District-level support of routine and periodic maintenance needs, LEUSD holds high standards for cleanliness, appearance, and good repair of all campuses daily and maintains them through the efforts of the students, staff, day custodian, evening custodial crew, and District Maintenance Department. Our maintenance staff ensures the repairs necessary to keep the school in good repair and working order are completed in a timely manner. A work-order process is used to ensure efficient service and that emergency repairs are given the highest priority. LEUSD regularly assesses maintenance, modernization, and new construction needs. Any pesticide use at our school sites is in compliance with the Healthy Schools Act of 2000. Fire drill evacuations are conducted on a monthly basis at all elementary and middle schools, and twice a year at the high schools in the District. A fire safety inspection is conducted once each year by the Riverside County Fire Department, while site personnel conduct site inspections on a regular basis. The school’s Disaster Preparedness Plan is updated annually, and disaster drills are conducted four times per year at each elementary school and middle school, and once each semester at the high schools. Currently, the District provides storage areas for emergency supplies to be kept on campus in the event of a disaster. A radio communication system allows for continuous communication with the District office in the event of a disaster. A Crisis Intervention Team has been identified and trained to deal with stress experienced by students and staff as a result of a crisis situation. Team members are called upon to assist across the District as necessary. As part of the comprehensive School Safety Program, School Resource Officers provide prevention and intervention procedures on all LEUSD campuses at least part time. Elsinore high School is the oldest high school in Lake Elsinore Unified School District, opening in 1966 serving the southern portion of the district. It has 106 regular and specialty classrooms with a district design capacity of 3,425. The site includes a multiuse gymnasium, locker/shower facilities, computer and science labs, art, band, choral, wrestling, dance, weight room, administration support buildings, outdoor courts and fields, and a multi-media library. A progressive discipline plan is in place and multiple discipline and Character Counts assemblies are conducted throughout the year. Four campus supervisors and a part-time School Resource Officer also help maintain a safe environment. The WE TIP program is utilized so that students may report crime anonymously and all leads are followed up immediately.

2016-17 School Accountability Report Card for Elsinore High School Page 6 of 14
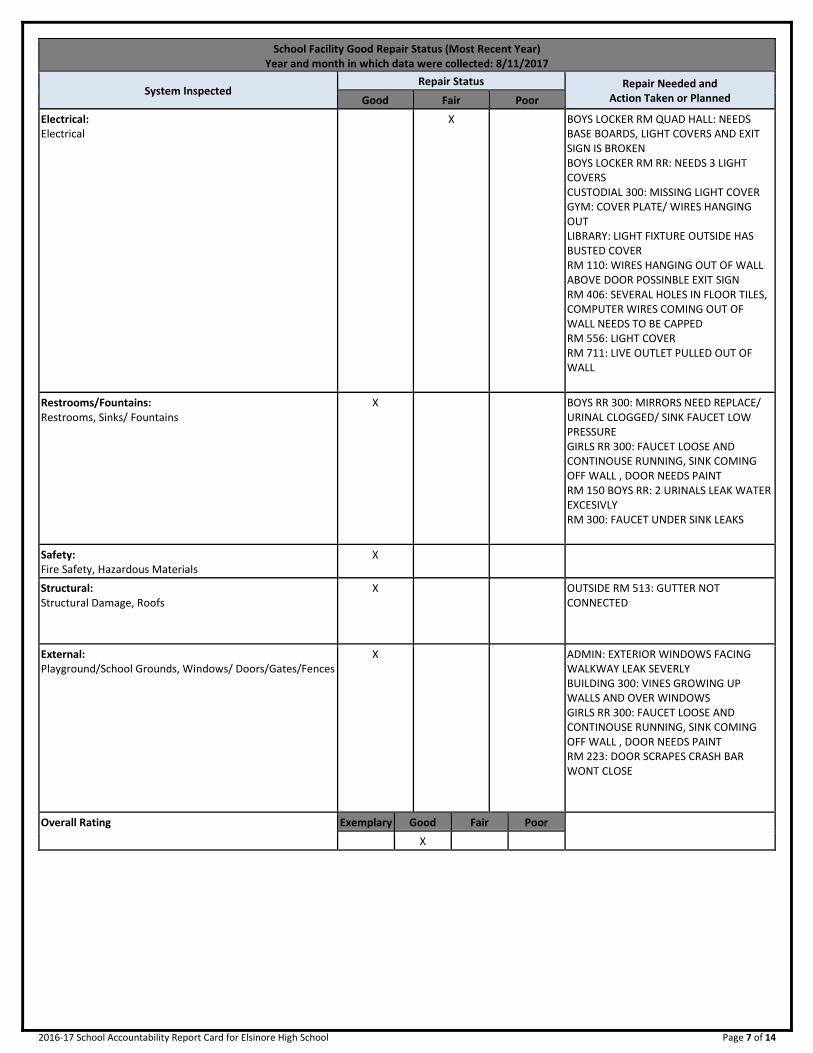
School Facility Good Repair Status (Most Recent Year) Year and month in which data were collected: 8/11/2017
System Inspected Repair Status Repair Needed and
Action Taken or Planned Good Fair Poor
Systems: Gas Leaks, Mechanical/HVAC, Sewer
X GIRLS LOCKER RM: THERMOSTAT BROKEN/ CHIPPED TOP OF LOCKERS RM 314: THERMOSTAT COVER BROKEN RM 502: THERMOSTAT BROKEN
Interior: Interior Surfaces
X BOYS LOCKER RM HALL: CEILING TILES/GRID/FLOOR TILES BROKEN, STALL DOOR BROKEN BOYS LOCKER RM QUAD HALL: NEEDS BASE BOARDS, LIGHT COVERS AND EXIT SIGN IS BROKEN BOYS LOCKER RM: LOCKER TOPS LOOSE, COUNTER NEEDS REPLACEMENT BOYS LOCKER SHOWERS: FLOOR CAN NOT BE CLEANED, HOLE IN SHOWER WALL BOYS VARSITY LOCKER RM: NEEDS BASE BOARDS CENTER RM 200: FLOOR TILES/ BASE BOARD DAMAGED GIRLS LOCKER RM: THERMOSTAT BROKEN/ CHIPPED TOP OF LOCKERS RM 103: FLOOR BUBBLING AND CRACKING RM 108 CLAY RM: CRACKS IN FLOOR NEED TO BE PATCHED RM 150 GIRLS RR: NEEDS PAINT RM 154: CABINET DOOR BROKEN OFF HINGE RM 212: HOLES IN FLOOR RM 311: WALL NEEDS PATCHES RM 325: 2-3" HOLES DRILLED IN WALL NEED TO BE PATCHED RM 401: WALLS FLOORS NEED PAINT RM 404: WALLPAPER TORN/RIPPED RM 406: SEVERAL HOLES IN FLOOR TILES, COMPUTER WIRES COMING OUT OF WALL NEEDS TO BE CAPPED RM 406: WALLPAPER TORN/RIPPED RM 751: WALLPAPER TORN/RIPPED
Cleanliness: Overall Cleanliness, Pest/ Vermin Infestation
X BOYS RR 300: MIRRORS NEED REPLACE/ URINAL CLOGGED/ SINK FAUCET LOW PRESSURE
2016-17 School Accountability Report Card for Elsinore High School Page 7 of 14
School Facility Good Repair Status (Most Recent Year) Year and month in which data were collected: 8/11/2017
System Inspected Repair Status Repair Needed and
Action Taken or Planned Good Fair Poor
Electrical: Electrical
X BOYS LOCKER RM QUAD HALL: NEEDS BASE BOARDS, LIGHT COVERS AND EXIT SIGN IS BROKEN BOYS LOCKER RM RR: NEEDS 3 LIGHT COVERS CUSTODIAL 300: MISSING LIGHT COVER GYM: COVER PLATE/ WIRES HANGING OUT LIBRARY: LIGHT FIXTURE OUTSIDE HAS BUSTED COVER RM 110: WIRES HANGING OUT OF WALL ABOVE DOOR POSSINBLE EXIT SIGN RM 406: SEVERAL HOLES IN FLOOR TILES, COMPUTER WIRES COMING OUT OF WALL NEEDS TO BE CAPPED RM 556: LIGHT COVER RM 711: LIVE OUTLET PULLED OUT OF WALL
Restrooms/Fountains: Restrooms, Sinks/ Fountains
X BOYS RR 300: MIRRORS NEED REPLACE/ URINAL CLOGGED/ SINK FAUCET LOW PRESSURE GIRLS RR 300: FAUCET LOOSE AND CONTINOUSE RUNNING, SINK COMING OFF WALL , DOOR NEEDS PAINT RM 150 BOYS RR: 2 URINALS LEAK WATER EXCESIVLY RM 300: FAUCET UNDER SINK LEAKS
Safety: Fire Safety, Hazardous Materials
X
Structural: Structural Damage, Roofs
X OUTSIDE RM 513: GUTTER NOT CONNECTED
External: Playground/School Grounds, Windows/ Doors/Gates/Fences
X ADMIN: EXTERIOR WINDOWS FACING WALKWAY LEAK SEVERLY BUILDING 300: VINES GROWING UP WALLS AND OVER WINDOWS GIRLS RR 300: FAUCET LOOSE AND CONTINOUSE RUNNING, SINK COMING OFF WALL , DOOR NEEDS PAINT RM 223: DOOR SCRAPES CRASH BAR WONT CLOSE
Overall Rating Exemplary Good Fair Poor
---------- X
2016-17 School Accountability Report Card for Elsinore High School Page 8 of 14
B. Pupil Outcomes
State Priority: Pupil Achievement The SARC provides the following information relevant to the State priority: Pupil Achievement (Priority 4): • Statewide assessments (i.e., California Assessment of Student
Performance and Progress [CAASPP] System, which includes the Smarter Balanced Summative Assessments for students in the general education population and the California Alternate Assessments [CAAs] for English language arts/literacy [ELA] and mathematics given in grades three through eight and grade eleven. The CAAs have replaced the California Alternate Performance Assessment [CAPA] for ELA and mathematics, which were eliminated in 2015. Only eligible students may participate in the administration of the CAAs. CAA items are aligned with alternate achievement standards, which are linked with the Common Core State Standards [CCSS] for students with significant cognitive disabilities); and
• The percentage of students who have successfully completed courses
that satisfy the requirements for entrance to the University of California and the California State University, or career technical education sequences or programs of study
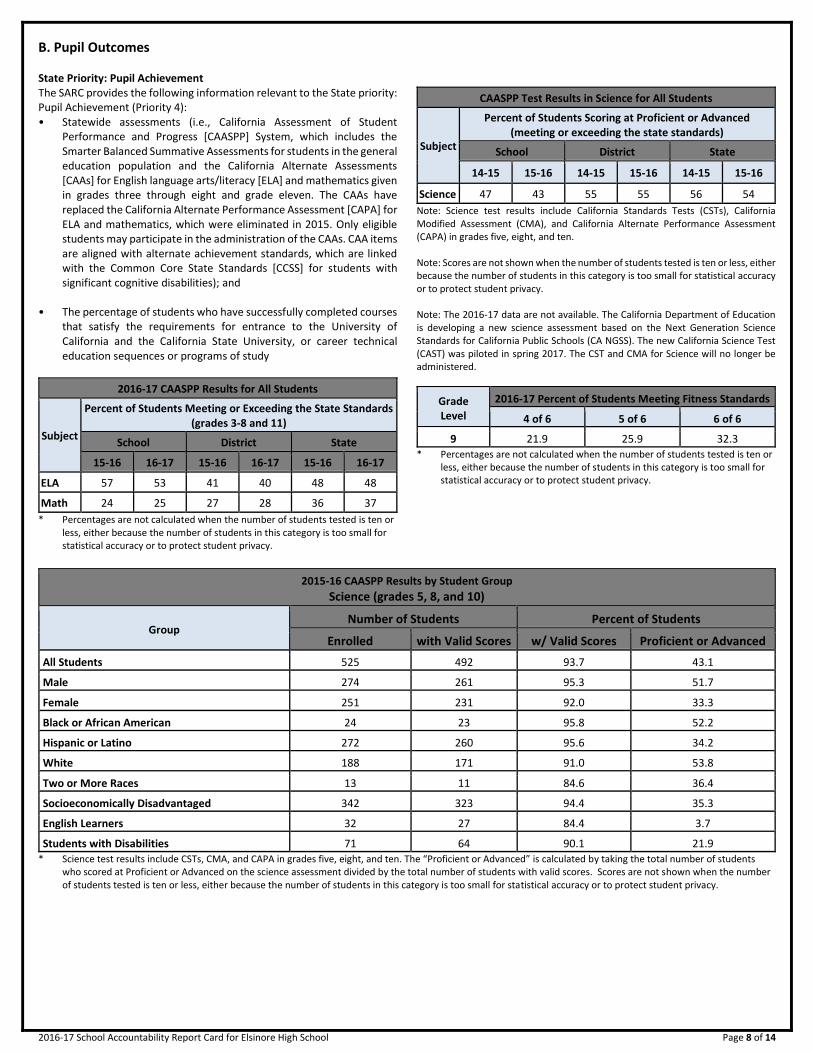
2016-17 CAASPP Results for All Students
Subject
Percent of Students Meeting or Exceeding the State Standards (grades 3-8 and 11)
School District State
15-16 16-17 15-16 16-17 15-16 16-17
ELA 57 53 41 40 48 48
Math 24 25 27 28 36 37
* Percentages are not calculated when the number of students tested is ten or less, either because the number of students in this category is too small for statistical accuracy or to protect student privacy.
CAASPP Test Results in Science for All Students
Subject
Percent of Students Scoring at Proficient or Advanced (meeting or exceeding the state standards)
School District State
14-15 15-16 14-15 15-16 14-15 15-16
Science 47 43 55 55 56 54
Note: Science test results include California Standards Tests (CSTs), California Modified Assessment (CMA), and California Alternate Performance Assessment (CAPA) in grades five, eight, and ten. Note: Scores are not shown when the number of students tested is ten or less, either because the number of students in this category is too small for statistical accuracy or to protect student privacy. Note: The 2016-17 data are not available. The California Department of Education is developing a new science assessment based on the Next Generation Science Standards for California Public Schools (CA NGSS). The new California Science Test (CAST) was piloted in spring 2017. The CST and CMA for Science will no longer be administered.
Grade Level
2016-17 Percent of Students Meeting Fitness Standards
4 of 6 5 of 6 6 of 6
---9--- 21.9 25.9 32.3
* Percentages are not calculated when the number of students tested is ten or less, either because the number of students in this category is too small for statistical accuracy or to protect student privacy.
2015-16 CAASPP Results by Student Group
Science (grades 5, 8, and 10)
Group Number of Students Percent of Students
Enrolled with Valid Scores w/ Valid Scores Proficient or Advanced
All Students 525 492 93.7 43.1
Male 274 261 95.3 51.7
Female 251 231 92.0 33.3
Black or African American 24 23 95.8 52.2
Hispanic or Latino 272 260 95.6 34.2
White 188 171 91.0 53.8
Two or More Races 13 11 84.6 36.4
Socioeconomically Disadvantaged 342 323 94.4 35.3
English Learners 32 27 84.4 3.7
Students with Disabilities 71 64 90.1 21.9
* Science test results include CSTs, CMA, and CAPA in grades five, eight, and ten. The “Proficient or Advanced” is calculated by taking the total number of students who scored at Proficient or Advanced on the science assessment divided by the total number of students with valid scores. Scores are not shown when the number of students tested is ten or less, either because the number of students in this category is too small for statistical accuracy or to protect student privacy.

2016-17 School Accountability Report Card for Elsinore High School Page 9 of 14
School Year 2016-17 CAASPP Assessment Results - English Language Arts (ELA) Disaggregated by Student Groups, Grades Three through Eight and Eleven
Student Group Total
Enrollment Number Tested
Percent Tested
Percent Met or Exceeded
All Students 467 458 98.07 53.28
Male 244 237 97.13 53.16
Female 223 221 99.1 53.39
Black or African American 19 18 94.74 55.56
American Indian or Alaska Native -- -- -- --
Asian -- -- -- --
Filipino -- -- -- --
Hispanic or Latino 251 248 98.8 47.18
Native Hawaiian or Pacific Islander -- -- -- --
White 147 143 97.28 60.14
Two or More Races 37 37 100 70.27
Socioeconomically Disadvantaged 286 282 98.6 49.29
English Learners 32 32 100 6.25
Students with Disabilities 67 62 92.54 3.23
Foster Youth -- -- -- --
Note: ELA test results include the Smarter Balanced Summative Assessment and the CAA. The “Percent Met or Exceeded” is calculated by taking the total number of students who met or exceeded the standard on the Smarter Balanced Summative Assessment plus the total number of students who met the standard (i.e., achieved Level 3–Alternate) on the CAAs divided by the total number of students who participated in both assessments. Note: Double dashes (--) appear in the table when the number of students is ten or less, either because the number of students in this category is too small for statistical accuracy or to protect student privacy. Note: The number of students tested includes all students who participated in the test whether they received a score or not; however, the number of students tested is not the number that was used to calculate the achievement level percentages. The achievement level percentages are calculated using only students who received scores.

2016-17 School Accountability Report Card for Elsinore High School Page 10 of 14
School Year 2016-17 CAASPP Assessment Results - Mathematics Disaggregated by Student Groups, Grades Three through Eight and Eleven
Student Group Total
Enrollment Number Tested
Percent Tested
Percent Met or Exceeded
All Students 468 451 96.37 24.61
Male 245 230 93.88 24.35
Female 223 221 99.1 24.89
Black or African American 19 18 94.74 33.33
American Indian or Alaska Native -- -- -- --
Asian -- -- -- --
Filipino -- -- -- --
Hispanic or Latino 252 244 96.83 19.67
Native Hawaiian or Pacific Islander -- -- -- --
White 147 140 95.24 31.43
Two or More Races 37 37 100 27.03
Socioeconomically Disadvantaged 286 278 97.2 21.94
English Learners 33 31 93.94 0
Students with Disabilities 67 61 91.04 1.64
Foster Youth -- -- -- --
Note: Mathematics test results include the Smarter Balanced Summative Assessment and the CAA. The “Percent Met or Exceeded” is calculated by taking the total number of students who met or exceeded the standard on the Smarter Balanced Summative Assessment plus the total number of students who met the standard (i.e., achieved Level 3–Alternate) on the CAAs divided by the total number of students who participated in both assessments. Note: Double dashes (--) appear in the table when the number of students is ten or less, either because the number of students in this category is too small for statistical accuracy or to protect student privacy. Note: The number of students tested includes all students who participated in the test whether they received a score or not; however, the number of students tested is not the number that was used to calculate the achievement level percentages. The achievement level percentages are calculated using only students who received scores.
C. Engagement
State Priority: Parental Involvement The SARC provides the following information relevant to the State priority: Parental Involvement (Priority 3): • Efforts the school district makes to seek parent input in making decisions for the school district and each schoolsite. Opportunities for Parental Involvement (School Year 2017-18) Elsinore High School encourages parents to be involved in their child’s education. We offer many opportunities for parent participation, including:
• Joining the PTSA • Volunteering for ad hoc committees • Tutoring students • Participating in School Site Council (SSC) • Participating in the English Learner Advisory Committee (ELAC) • Volunteering in the classroom • Volunteering for field trip supervision • Helping with athletic and music activities
For more information on how to become involved, please contact Co-Principal Sarah Arredondo or Robbin Hamilton at (951) 253-7201 or [email protected] or [email protected] State Priority: School Climate The SARC provides the following information relevant to the State priority: School Climate (Priority 6): • Pupil suspension rates; • Pupil expulsion rates; and • Other local measures on the sense of safety. School Safety Plan Our School Safety Plan was reviewed by our School Site Council January 2016, and updates were presented for review to our Governing Board in March 2016. The School Safety Plan was last reviewed and discussed with the school faculty August 2016.
2016-17 School Accountability Report Card for Elsinore High School Page 11 of 14
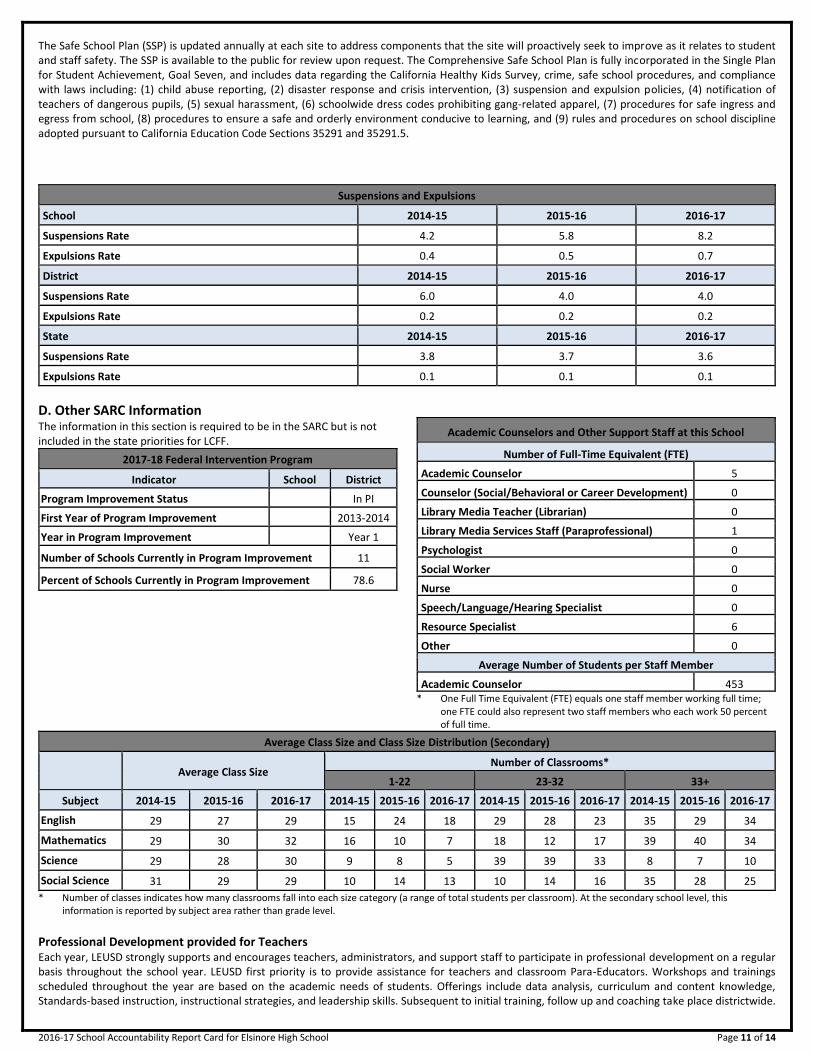
The Safe School Plan (SSP) is updated annually at each site to address components that the site will proactively seek to improve as it relates to student and staff safety. The SSP is available to the public for review upon request. The Comprehensive Safe School Plan is fully incorporated in the Single Plan for Student Achievement, Goal Seven, and includes data regarding the California Healthy Kids Survey, crime, safe school procedures, and compliance with laws including: (1) child abuse reporting, (2) disaster response and crisis intervention, (3) suspension and expulsion policies, (4) notification of teachers of dangerous pupils, (5) sexual harassment, (6) schoolwide dress codes prohibiting gang-related apparel, (7) procedures for safe ingress and egress from school, (8) procedures to ensure a safe and orderly environment conducive to learning, and (9) rules and procedures on school discipline adopted pursuant to California Education Code Sections 35291 and 35291.5.
Suspensions and Expulsions
School 2014-15 2015-16 2016-17
Suspensions Rate 4.2 5.8 8.2
Expulsions Rate 0.4 0.5 0.7
District 2014-15 2015-16 2016-17
Suspensions Rate 6.0 4.0 4.0
Expulsions Rate 0.2 0.2 0.2
State 2014-15 2015-16 2016-17
Suspensions Rate 3.8 3.7 3.6
Expulsions Rate 0.1 0.1 0.1
D. Other SARC Information
The information in this section is required to be in the SARC but is not included in the state priorities for LCFF.
2017-18 Federal Intervention Program
Indicator School District
Program Improvement Status In PI
First Year of Program Improvement 2013-2014
Year in Program Improvement Year 1
Number of Schools Currently in Program Improvement 11
Percent of Schools Currently in Program Improvement 78.6
Academic Counselors and Other Support Staff at this School
Number of Full-Time Equivalent (FTE)
Academic Counselor------- 5
Counselor (Social/Behavioral or Career Development) 0
Library Media Teacher (Librarian) 0
Library Media Services Staff (Paraprofessional) 1
Psychologist------- 0
Social Worker------- 0
Nurse------- 0
Speech/Language/Hearing Specialist 0
Resource Specialist------- 6
Other------- 0
Average Number of Students per Staff Member
Academic Counselor------- 453 * One Full Time Equivalent (FTE) equals one staff member working full time;
one FTE could also represent two staff members who each work 50 percent of full time.
Average Class Size and Class Size Distribution (Secondary)
Average Class Size Number of Classrooms*
1-22 23-32 33+
Subject 2014-15 2015-16 2016-17 2014-15 2015-16 2016-17 2014-15 2015-16 2016-17 2014-15 2015-16 2016-17
English------- ----------
29 27 29 15 24 18 29 28 23 35 29 34
Mathematics ----------
29 30 32 16 10 7 18 12 17 39 40 34
Science------- ----------
29 28 30 9 8 5 39 39 33 8 7 10
Social Science ----------
31 29 29 10 14 13 10 14 16 35 28 25
* Number of classes indicates how many classrooms fall into each size category (a range of total students per classroom). At the secondary school level, this information is reported by subject area rather than grade level.
Professional Development provided for Teachers Each year, LEUSD strongly supports and encourages teachers, administrators, and support staff to participate in professional development on a regular basis throughout the school year. LEUSD first priority is to provide assistance for teachers and classroom Para-Educators. Workshops and trainings scheduled throughout the year are based on the academic needs of students. Offerings include data analysis, curriculum and content knowledge, Standards-based instruction, instructional strategies, and leadership skills. Subsequent to initial training, follow up and coaching take place districtwide.
2016-17 School Accountability Report Card for Elsinore High School Page 12 of 14
The District’s goal is to provide opportunities for teachers, administrators, and staff in order to meet the learning needs of all students. An in-house professional growth program is provided for all staff.
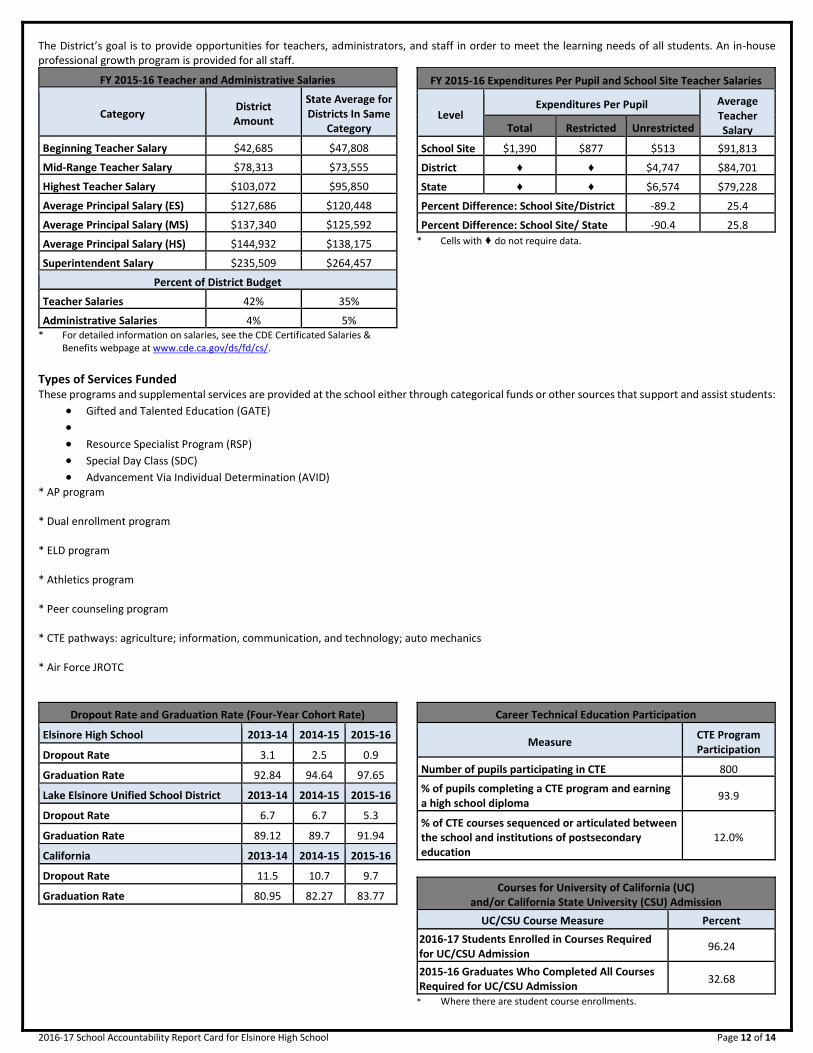
FY 2015-16 Teacher and Administrative Salaries
Category District Amount
State Average for Districts In Same
Category
Beginning Teacher Salary $42,685 $47,808
Mid-Range Teacher Salary $78,313 $73,555
Highest Teacher Salary $103,072 $95,850
Average Principal Salary (ES) $127,686 $120,448
Average Principal Salary (MS) $137,340 $125,592
Average Principal Salary (HS) $144,932 $138,175
Superintendent Salary $235,509 $264,457
Percent of District Budget
Teacher Salaries 42% 35%
Administrative Salaries 4% 5% * For detailed information on salaries, see the CDE Certificated Salaries &
Benefits webpage at www.cde.ca.gov/ds/fd/cs/.
FY 2015-16 Expenditures Per Pupil and School Site Teacher Salaries
Level Expenditures Per Pupil Average
Teacher Salary Total Restricted Unrestricted
School Site-------
$1,390 $877 $513 $91,813
District-------
♦ ♦ $4,747 $84,701
State------- ♦ ♦ $6,574 $79,228
Percent Difference: School Site/District -89.2 25.4
Percent Difference: School Site/ State -90.4 25.8
* Cells with ♦ do not require data.
Types of Services Funded These programs and supplemental services are provided at the school either through categorical funds or other sources that support and assist students:
• Gifted and Talented Education (GATE)
•
• Resource Specialist Program (RSP)
• Special Day Class (SDC)
• Advancement Via Individual Determination (AVID) * AP program * Dual enrollment program * ELD program * Athletics program * Peer counseling program * CTE pathways: agriculture; information, communication, and technology; auto mechanics * Air Force JROTC
Dropout Rate and Graduation Rate (Four-Year Cohort Rate)
Elsinore High School 2013-14 2014-15 2015-16
Dropout Rate 3.1 2.5 0.9
Graduation Rate 92.84 94.64 97.65
Lake Elsinore Unified School District 2013-14 2014-15 2015-16
Dropout Rate 6.7 6.7 5.3
Graduation Rate 89.12 89.7 91.94
California 2013-14 2014-15 2015-16
Dropout Rate 11.5 10.7 9.7
Graduation Rate 80.95 82.27 83.77
Career Technical Education Participation
Measure CTE Program Participation
Number of pupils participating in CTE 800
% of pupils completing a CTE program and earning a high school diploma
93.9
% of CTE courses sequenced or articulated between the school and institutions of postsecondary education
12.0%
Courses for University of California (UC) and/or California State University (CSU) Admission
UC/CSU Course Measure Percent
2016-17 Students Enrolled in Courses Required for UC/CSU Admission
96.24
2015-16 Graduates Who Completed All Courses Required for UC/CSU Admission
32.68
* Where there are student course enrollments.
2016-17 School Accountability Report Card for Elsinore High School Page 13 of 14
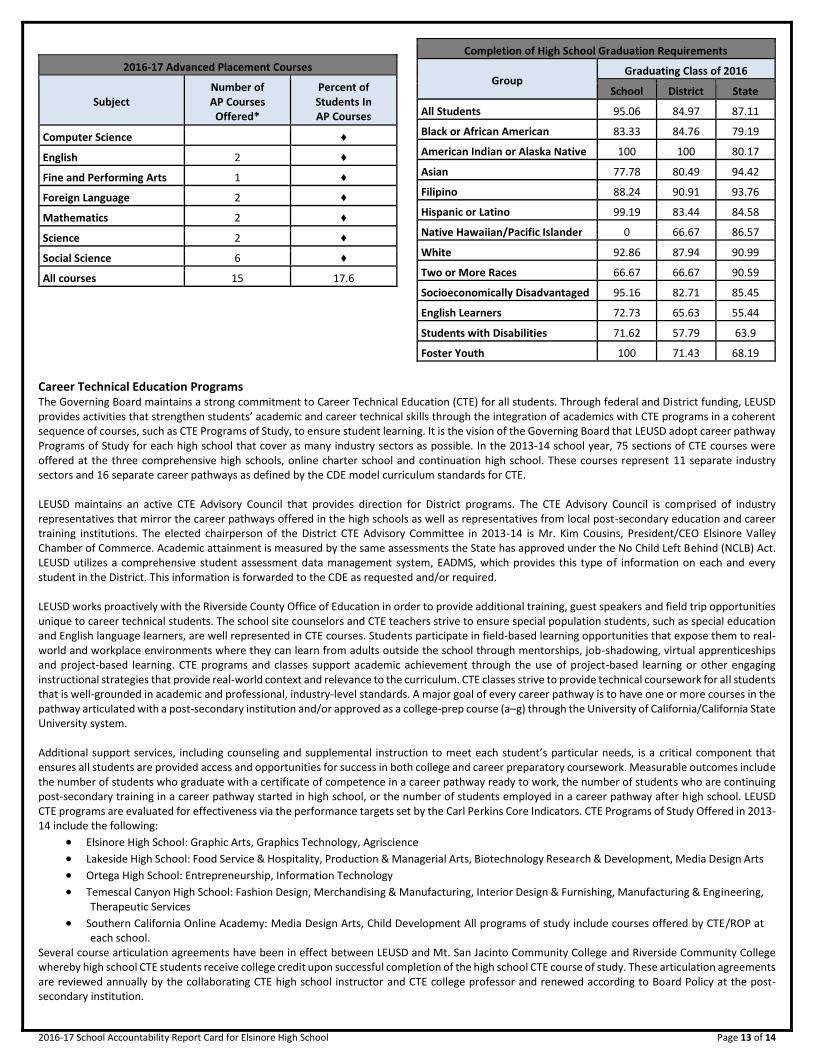
2016-17 Advanced Placement Courses
Subject Number of AP Courses
Offered*
Percent of Students In AP Courses
Computer Science ♦
English------- 2 ♦
Fine and Performing Arts 1 ♦
Foreign Language 2 ♦
Mathematics 2 ♦
Science------- 2 ♦
Social Science 6 ♦
All courses 15 17.6
Completion of High School Graduation Requirements
Group Graduating Class of 2016
School District State
All Students 95.06 84.97 87.11
Black or African American 83.33 84.76 79.19
American Indian or Alaska Native 100 100 80.17
Asian 77.78 80.49 94.42
Filipino 88.24 90.91 93.76
Hispanic or Latino 99.19 83.44 84.58
Native Hawaiian/Pacific Islander 0 66.67 86.57
White 92.86 87.94 90.99
Two or More Races 66.67 66.67 90.59
Socioeconomically Disadvantaged 95.16 82.71 85.45
English Learners 72.73 65.63 55.44
Students with Disabilities 71.62 57.79 63.9
Foster Youth 100 71.43 68.19
Career Technical Education Programs The Governing Board maintains a strong commitment to Career Technical Education (CTE) for all students. Through federal and District funding, LEUSD provides activities that strengthen students’ academic and career technical skills through the integration of academics with CTE programs in a coherent sequence of courses, such as CTE Programs of Study, to ensure student learning. It is the vision of the Governing Board that LEUSD adopt career pathway Programs of Study for each high school that cover as many industry sectors as possible. In the 2013-14 school year, 75 sections of CTE courses were offered at the three comprehensive high schools, online charter school and continuation high school. These courses represent 11 separate industry sectors and 16 separate career pathways as defined by the CDE model curriculum standards for CTE. LEUSD maintains an active CTE Advisory Council that provides direction for District programs. The CTE Advisory Council is comprised of industry representatives that mirror the career pathways offered in the high schools as well as representatives from local post-secondary education and career training institutions. The elected chairperson of the District CTE Advisory Committee in 2013-14 is Mr. Kim Cousins, President/CEO Elsinore Valley Chamber of Commerce. Academic attainment is measured by the same assessments the State has approved under the No Child Left Behind (NCLB) Act. LEUSD utilizes a comprehensive student assessment data management system, EADMS, which provides this type of information on each and every student in the District. This information is forwarded to the CDE as requested and/or required. LEUSD works proactively with the Riverside County Office of Education in order to provide additional training, guest speakers and field trip opportunities unique to career technical students. The school site counselors and CTE teachers strive to ensure special population students, such as special education and English language learners, are well represented in CTE courses. Students participate in field-based learning opportunities that expose them to real-world and workplace environments where they can learn from adults outside the school through mentorships, job-shadowing, virtual apprenticeships and project-based learning. CTE programs and classes support academic achievement through the use of project-based learning or other engaging instructional strategies that provide real-world context and relevance to the curriculum. CTE classes strive to provide technical coursework for all students that is well-grounded in academic and professional, industry-level standards. A major goal of every career pathway is to have one or more courses in the pathway articulated with a post-secondary institution and/or approved as a college-prep course (a–g) through the University of California/California State University system. Additional support services, including counseling and supplemental instruction to meet each student’s particular needs, is a critical component that ensures all students are provided access and opportunities for success in both college and career preparatory coursework. Measurable outcomes include the number of students who graduate with a certificate of competence in a career pathway ready to work, the number of students who are continuing post-secondary training in a career pathway started in high school, or the number of students employed in a career pathway after high school. LEUSD CTE programs are evaluated for effectiveness via the performance targets set by the Carl Perkins Core Indicators. CTE Programs of Study Offered in 2013-14 include the following:
• Elsinore High School: Graphic Arts, Graphics Technology, Agriscience
• Lakeside High School: Food Service & Hospitality, Production & Managerial Arts, Biotechnology Research & Development, Media Design Arts
• Ortega High School: Entrepreneurship, Information Technology
• Temescal Canyon High School: Fashion Design, Merchandising & Manufacturing, Interior Design & Furnishing, Manufacturing & Engineering, Therapeutic Services
• Southern California Online Academy: Media Design Arts, Child Development All programs of study include courses offered by CTE/ROP at each school.
Several course articulation agreements have been in effect between LEUSD and Mt. San Jacinto Community College and Riverside Community College whereby high school CTE students receive college credit upon successful completion of the high school CTE course of study. These articulation agreements are reviewed annually by the collaborating CTE high school instructor and CTE college professor and renewed according to Board Policy at the post-secondary institution.
2016-17 School Accountability Report Card for Elsinore High School Page 14 of 14
DataQuest DataQuest is an online data tool located on the CDE DataQuest Web page at http://dq.cde.ca.gov/dataquest/ that contains additional information about this school and comparisons of the school to the district and the county. Specifically, DataQuest is a dynamic system that provides reports for accountability (e.g., test data, enrollment, high school graduates, dropouts, course enrollments, staffing, and data regarding English learners).
Internet Access Internet access is available at public libraries and other locations that are publicly accessible (e.g., the California State Library). Access to the Internet at libraries and public locations is generally provided on a first-come, first-served basis. Other use restrictions may include the hours of operation, the length of time that a workstation may be used (depending on availability), the types of software programs available on a workstation, and the ability to print documents.